User login
Delivering on the promise of cancer biomarkers in the clinic
Click on the PDF icon at the top of this introduction to read the full article.
Click on the PDF icon at the top of this introduction to read the full article.
Click on the PDF icon at the top of this introduction to read the full article.
JCSO 2014;12:381-388
Novel anticoagulants increase GI bleeds in elderly
PHILADELPHIA – Dabigatran and rivaroxaban, which are rapidly replacing warfarin for anticoagulation in patients with atrial fibrillation, appear to be associated with a greater risk of GI bleeding than the long-time standard in patients over the age of 65 years, according to an analysis presented at the American College of Gastroenterology (ACG).
The pattern of an increased GI bleeding risk with the newer oral anticoagulants relative to warfarin was consistent in older patients whether used for AF or for out-of-labeling indications, which were assessed separately, reported Dr. Neena S. Abraham, professor of medicine at Mayo Clinic, Scottsdale, Ariz.

“In all four cases, once patients were over the age of 65, the risk of GI bleeding increased significantly on the novel agents when compared to warfarin,” Dr. Abraham reported.
The propensity matches, based on such characteristics as GI bleeding risk factors, age, race, and concomitant medications, were drawn from 92,816 patients in a large database starting a new prescription of dabigatran, rivaroxaban, or warfarin over a recent 3-year period. With this matching, 9,860 new users of dabigatran and 20,619 new users of rivaroxaban were compared with equal number of new users of warfarin.
In the full dataset, before age stratification, the risk of total GI bleeding, particularly lower GI bleeding, appeared to be nonsignificantly lower for both dabigatran and rivaroxaban, relative to warfarin in patients with AF. In patients without AF receiving these drugs, the risk remained slightly lower on rivaroxaban but appeared to be slightly increased on dabigatran.
However, the hypothesis that bleeding risk was greater for newer agents in older patients was substantiated when the data were stratified by age. In the analysis, risk of bleeding started climbing more steeply with the newer agents as patients aged than with warfarin, with differences observed at about age 65 years.
By age 75, the hazard ratio for a GI bleed in dabigatran patients relative to warfarin in AF patients was 2.4 (95% confidence interval 1.5-3.8). In the rivaroxaban group, the HR for this risk at age 75 in AF patients was 4.0 (95% CI 2.1-7.4). In non-AF patients, the rates of GI bleeding were also significantly increased at a similar magnitude.
These data were anticipated by the initial trials that found dabigatran and rivaroxaban noninferior to warfarin for the prevention of stroke and systemic embolism, according to Dr. Abraham. Although there was heterogeneity in reported risk differences, she reported that GI bleeding was as much as 25% higher on the newer anticoagulants when compared to warfarin in older patients. These new data substantiate those findings.
“Our study is the first to evaluate GI safety in novel oral anticoagulants compared to warfarin in a real-world, multiage setting,” Dr. Abraham noted. She said these data “facilitate risk-benefit considerations” of these drugs. She further noted that the data on non-AF patients may be particularly pertinent “because this is the fastest-growing emerging market” for agents in this class.
Asked for a comment, Dr. Brian E. Lacy, chief of gastroenterology and hepatology at Dartmouth-Hitchcock Medical Center, Lebanon, N.H., said that the information about relative risk is potentially important, but he was particularly impressed by the substantial use of novel anticoagulants in non-AF patients.
“This tells me that we as gastroenterologists need to be asking more questions about exposure to anticoagulants,” Dr. Lacy said in an interview. “These data suggest that these newer drugs are being used frequently outside of labeling. We need to be aware of these changing patterns of use when trying to assess the risk of our patients for GI bleeds.”
Dr. Abraham had no financial disclosures.
PHILADELPHIA – Dabigatran and rivaroxaban, which are rapidly replacing warfarin for anticoagulation in patients with atrial fibrillation, appear to be associated with a greater risk of GI bleeding than the long-time standard in patients over the age of 65 years, according to an analysis presented at the American College of Gastroenterology (ACG).
The pattern of an increased GI bleeding risk with the newer oral anticoagulants relative to warfarin was consistent in older patients whether used for AF or for out-of-labeling indications, which were assessed separately, reported Dr. Neena S. Abraham, professor of medicine at Mayo Clinic, Scottsdale, Ariz.
“In all four cases, once patients were over the age of 65, the risk of GI bleeding increased significantly on the novel agents when compared to warfarin,” Dr. Abraham reported.
The propensity matches, based on such characteristics as GI bleeding risk factors, age, race, and concomitant medications, were drawn from 92,816 patients in a large database starting a new prescription of dabigatran, rivaroxaban, or warfarin over a recent 3-year period. With this matching, 9,860 new users of dabigatran and 20,619 new users of rivaroxaban were compared with equal number of new users of warfarin.
In the full dataset, before age stratification, the risk of total GI bleeding, particularly lower GI bleeding, appeared to be nonsignificantly lower for both dabigatran and rivaroxaban, relative to warfarin in patients with AF. In patients without AF receiving these drugs, the risk remained slightly lower on rivaroxaban but appeared to be slightly increased on dabigatran.
However, the hypothesis that bleeding risk was greater for newer agents in older patients was substantiated when the data were stratified by age. In the analysis, risk of bleeding started climbing more steeply with the newer agents as patients aged than with warfarin, with differences observed at about age 65 years.
By age 75, the hazard ratio for a GI bleed in dabigatran patients relative to warfarin in AF patients was 2.4 (95% confidence interval 1.5-3.8). In the rivaroxaban group, the HR for this risk at age 75 in AF patients was 4.0 (95% CI 2.1-7.4). In non-AF patients, the rates of GI bleeding were also significantly increased at a similar magnitude.
These data were anticipated by the initial trials that found dabigatran and rivaroxaban noninferior to warfarin for the prevention of stroke and systemic embolism, according to Dr. Abraham. Although there was heterogeneity in reported risk differences, she reported that GI bleeding was as much as 25% higher on the newer anticoagulants when compared to warfarin in older patients. These new data substantiate those findings.
“Our study is the first to evaluate GI safety in novel oral anticoagulants compared to warfarin in a real-world, multiage setting,” Dr. Abraham noted. She said these data “facilitate risk-benefit considerations” of these drugs. She further noted that the data on non-AF patients may be particularly pertinent “because this is the fastest-growing emerging market” for agents in this class.
Asked for a comment, Dr. Brian E. Lacy, chief of gastroenterology and hepatology at Dartmouth-Hitchcock Medical Center, Lebanon, N.H., said that the information about relative risk is potentially important, but he was particularly impressed by the substantial use of novel anticoagulants in non-AF patients.
“This tells me that we as gastroenterologists need to be asking more questions about exposure to anticoagulants,” Dr. Lacy said in an interview. “These data suggest that these newer drugs are being used frequently outside of labeling. We need to be aware of these changing patterns of use when trying to assess the risk of our patients for GI bleeds.”
Dr. Abraham had no financial disclosures.
AT THE ANNUAL SCIENTIFIC MEETING AND POSTGRADUATE COURSE OF THE AMERICAN COLLEGE OF GASTROENTEROLOGY
Key clinical point: The novel oral anticoagulants dabigatran and rivaroxaban were associated with an increased risk of GI bleeding in elderly patients, compared with warfarin, in data drawn from a real-world setting.
Major finding: When compared with warfarin in atrial fibrillation, the risk of upper and lower GI bleeding is nearly 2.5 times greater on dabigatran and 3 times greater on rivaroxaban at age 75 years.
Data source: A retrospective, propensity-matched study.
Disclosures: Dr. Abraham had no financial disclosures.

Drugs, Pregnancy, and Lactation: Herbs
Herbs are commonly consumed by pregnant and breast-feeding women, possibly because they believe that “natural products” are safer than drugs. However, even though some have been available for hundreds or thousands of years, little is known about their effects on the embryo, fetus, newborn, or nursing infant. Moreover, as unregulated products, the concentration, contents, and presence of contaminants cannot be easily determined. Detailed reviews of the 22 most commonly used herbs discussed here can be found in “Drugs in Pregnancy and Lactation,” Briggs GG, Freeman RK, 10th ed., Philadelphia: Wolters Kluwer Health, 2014).
In the following discussions, dose, one of the two key factors that determine the risk of developmental toxicity (abnormal growth, structural anomalies, functional and/or neurobehavioral deficits, or death), is rarely reported. In addition, all herbs contain multiple chemical compounds, few of which have been studied during pregnancy or lactation. Thus, with few exceptions, a woman who takes an herb in pregnancy should be informed that the risk to her developing baby is unknown.
Six herbs are considered contraindicated in pregnancy: arnica, black seed /kalanji, blue cohosh, feverfew, salvia divinorum, and valerian.
• Arnica. The dried flowers, and sometimes the roots and rhizomes, are the parts of this perennial plant that are used topically for their anti-inflammatory and analgesic effects. There is no clinical evidence to support this use. Occasional topical use probably represents a low risk, but absorption may occur when it is applied to broken skin. The Food and Drug Administration has classified arnica as an unsafe herb and, when used orally, it is considered a poison. It is a uterine stimulant and an abortifacient. Nevertheless, in homeopathic formulations, it has been promoted for use before and during labor for internal and external bruising of the mother and newborn. In Italy, it is one of the top 10 herbs taken by women (Pharmacoepidemiol. Drug Saf. 2006;15:354-9).
• Black seed/kalanji. This herb has been used for thousands of year as a medicine, food, or spice. Because of this, it is unlikely that it causes teratogenesis. Nevertheless, its use to stimulate menstruation and its potential contraceptive properties suggest that it is contraindicated in pregnancy.

• Blue cohosh. Some of the components of this herb have been shown to be teratogenic and toxic in various animal species, so it should be avoided in the first trimester. The herb has uterine stimulant properties that are used by nurse-midwives to stimulate labor. Blue cohosh was the most frequently used herbal preparation for this purpose. However, some sources believe that the potential fetal and newborn toxicity may outweigh any medical benefit (“PDR for Herbal Medicine,” 2nd ed., Montvale, N.J.: Medical Economics, 2000:109-10; “The Review of Natural Products,” St. Louis, MO: Facts and Comparisons, 2000).
• Feverfew. This herb has been used for labor, menstrual disorders, potential miscarriage, and morning sickness; as an abortifacient; and for several other indications. Because of its antipyretic properties, it has been known as “medieval aspirin.” The doses used for these indications have not been quantified. Because of its emmenagogic (capable of provoking menstruation) activity, the herb should not be used in pregnancy.
• Salvia divinorum. This herb has hallucinogenic effects and is used in certain regions of Mexico for healing and divinatory rituals. It is also thought to have antidiarrheal properties. The herb is either smoked or chewed, or its juices are ingested. When taken orally, systemic effects are dependent upon absorption across the oral mucosa as the active ingredient is destroyed in the GI tract. Persistent psychosis has been observed in people who smoked the herb, so it is contraindicated in pregnancy.
• Valerian. A large number of preparations containing valerian are available. It has been used as a sedative and hypnotic for anxiety, restlessness, and sleep disturbances, as well as several other pharmacologic claims. Because of the risk of cytotoxicity in the fetus and hepatotoxicity in the mother, the herb should be avoided during gestation.

For the remaining 16 herbs, small, infrequent doses probably cause no harm to the mother, embryo, fetus, or newborn. Nevertheless, as noted below, some of these herbs are best avoided during pregnancy.
• Chamomile. Excessive use of this herb should be avoided because it is thought to have uterine stimulant, emmenagogic, and abortifacient properties. Although controversial, some nurse-midwives prescribe chamomile teas for the treatment of morning sickness. Because the plant sources of the herb contain coumarin compounds, ingesting chamomile by pregnant women with coagulation disorders is a concern. However, the herb has been used for thousands of years, so the risk of harm, at least from occasional use, must be very rare.
• Echinacea. This herb is used topically to enhance wound healing and systemically as an immunostimulant. An IV formulation is used in Germany but is not available in the United States. It also has been recommended to assist in the prevention or treatment of viral upper respiratory tract infections. Its use in pregnancy is limited to one small study.
• Evening primrose oil. The oil contains two essential fatty acids: cis-linoleic and gamma-linolenic acid. In a national survey of nurse-midwives, it was the most frequently used herbal preparation for the induction of labor. No adverse effects have been reported in the fetus or newborn from this use. The doses used varied widely and included both oral and vaginal routes of administration. In addition, the oil has been used for rheumatoid arthritis and diabetic neuropathy, but there are no reports of these uses in pregnancy.
• Garlic. Garlic has been used for food flavoring since ancient times and appears to be safe during pregnancy. Some components cross the placenta, as shown by garlic odor in the amniotic fluid and on the newborn’s breath. Very high doses have the potential to induce menstruation or uterine contractions, but apparently these effects have not been reported.
• Ginger. No reports of ginger-induced developmental toxicity have been located. Ginger has been used as antiemetic for nausea and vomiting of pregnancy.

• Ginseng. The root is the most important part of this plant that is found throughout the world and has been used in medicine for more than 2,000 years. The herb has been promoted for multiple pharmacologic effects, including adaptogenic, CNS, cardiovascular, endocrine, ergogenic, antineoplastic, and immunomodulatory effects.
Hypertension and hypoglycemia have been reported in nonpregnant patients, but not in the limited human pregnancy data. A brief 1991 study compared 88 women who took the herb during pregnancy with 88 controls. No differences between the groups were found with regard to the mode of delivery, birth weight, low birth weight (< 2,500 ), preterm delivery (< 37 weeks), low Apgar score (< 7), stillbirths, neonatal deaths, or maternal complications (Asia Oceania J. Obstet. Gynaecol. 1991;17:379-80).
• Ginkgo biloba. The limited animal reproduction data suggest low risk, but there is no reported human pregnancy experience. Nevertheless, it is an ancient herbal preparation that is commonly used for organic brain syndrome, circulatory disorders, asthma, vertigo, and tinnitus. Because of its widespread use, it is doubtful that a major teratogenic effect would have escaped notice, but more subtle or low-incidence toxic effects may not have been detected.
• Kudzu. No human or animal data regarding pregnancy have been located. The herb has been used for more than 2,500 years for the treatment of alcohol hangover, drunkenness, alcoholism, muscle pain, and measles. Many of its chemical constituents can be found in foods. Nevertheless, high, frequent doses should be avoided.
• Nutmeg. This is a commonly used spice but, as with any herb, high doses can produce toxicity. The toxicity is caused by a chemical in the seeds, myristicin, which has anticholinergic properties. A woman at 30 weeks’ gestation misread a recipe and used a whole grated nutmeg rather than 1/8 teaspoon when making cookies. When she ate a cookie, she experienced sinus tachycardia, hypertension, and a sensation of impending doom. The fetus had tachycardia, and atropine-like poisoning was diagnosed. After about 12 hours, both mother and fetus made an uneventful recovery and a healthy infant was born at term.

• Passion flower. The name of this herb may refer to about 400 species of the genus Passiflora. It is available in both oral and topical forms and is used for nervousness, neuralgia, insomnia, pain, asthma, seizures, burns, hemorrhoids, and menopausal complaints. As with many herbs, it contains a large number of chemicals, none of which have undergone reproductive testing. No reports describing the use of this herb in human pregnancy have been located. However, because it has uterine stimulant properties, the oral formulation is best avoided in pregnancy.
• Peppermint. This popular flavoring appears to be harmless for the mother and developing baby when low, recommended doses are ingested. Peppermint oil is available in numerous topical and oral formulations. High oral doses, however, can cause significant toxicity, including death. During pregnancy, ingestion of more than the recommended doses is unsafe because of possible emmenagogic and abortifacient properties.
• Pumpkin seed. This herb, when used as a food, appears to be harmless for the mother and embryo-fetus, but no reports describing its use in pregnancy have been located. High doses, such as those used in traditional medicine or in eating disorders, should be avoided because of the potential for toxic effects from the many chemicals these seeds contain.
• Raspberry leaf. Raspberry leaf tea is commonly used by pregnant women. Nurse-midwives often prescribe the tea to treat nausea and vomiting and as a uterine tonic to shorten labor. A double-blind, randomized, placebo-controlled study evaluated the effect of raspberry leaf tablets (2 tablets/day) on pregnancy outcomes. Compared with controls, no differences were found for length of labor or stages of labor, mode of delivery, admission to the neonatal intensive care unit, Apgar score, and birth weight (J. Midwifery Womens Health 2001;46:51-9).
• Safflower. Safflower oil is commonly used in cooking and has been given for its laxative action. There are no reports describing the use of the herb in pregnancy. It is doubtful if such use would have any adverse effect on a pregnancy. Although abortifacient and emmenagogic effects have been suggested, there is no evidence supporting these effects when used as a food.
• St. John’s wort. No toxicity in pregnant humans has been reported. The use of the herb is widespread and dates back thousands of years. Thus, it is doubtful that the herb is a major teratogen or causes other elements of developmental toxicity. The herb has been used for the management of anxiety, depression, insomnia, inflammation, and gastritis. It is also used as a diuretic and, topically, for the treatment of hemorrhoids and enhanced wound healing.

• Yohimbine. The use of this herb in human pregnancies has not been reported. It has been used as an aphrodisiac and for weight loss, sexual dysfunction, and the treatment of orthostatic hypotension. Although it has no Food and Drug Administration–sanctioned indications, it is also available by prescription for male erectile dysfunction. Due to the lack of data regarding pregnancy, the herb is best avoided during pregnancy.
There are few data regarding the effects of the above herbs on a breast-feeding infant. Depending upon the herb, nursing infants will be exposed to many chemical compounds. For those herbs used as food, nursing is probably safe. The safety of the other herbs during lactation is unknown. However, toxicity has been reported in a 9-day-old term infant whose mother was taking arnica (Clin. Toxicol. 2009;47:726, abstract 120). The infant presented with lethargy, decreased milk intake, anemia, and jaundice but recovered with treatment. After the mother stopped the herb and resumed nursing, no further problems were noted in the infant.
Mr. Briggs is a pharmacist clinical specialist at the outpatient clinics of Memorial Care Center for Women at Miller Children’s Hospital in Long Beach, Calif.; clinical professor of pharmacy at the University of California, San Francisco; and adjunct professor of pharmacy at the University of Southern California, Los Angeles, and Washington State University, Spokane. He also is coauthor of “Drugs in Pregnancy and Lactation,” and coeditor of “Diseases, Complications, and Drug Therapy in Obstetrics.” He had no relevant financial disclosures. Contact him at obnews@frontlinemedcom.com.
Herbs are commonly consumed by pregnant and breast-feeding women, possibly because they believe that “natural products” are safer than drugs. However, even though some have been available for hundreds or thousands of years, little is known about their effects on the embryo, fetus, newborn, or nursing infant. Moreover, as unregulated products, the concentration, contents, and presence of contaminants cannot be easily determined. Detailed reviews of the 22 most commonly used herbs discussed here can be found in “Drugs in Pregnancy and Lactation,” Briggs GG, Freeman RK, 10th ed., Philadelphia: Wolters Kluwer Health, 2014).
In the following discussions, dose, one of the two key factors that determine the risk of developmental toxicity (abnormal growth, structural anomalies, functional and/or neurobehavioral deficits, or death), is rarely reported. In addition, all herbs contain multiple chemical compounds, few of which have been studied during pregnancy or lactation. Thus, with few exceptions, a woman who takes an herb in pregnancy should be informed that the risk to her developing baby is unknown.
Six herbs are considered contraindicated in pregnancy: arnica, black seed /kalanji, blue cohosh, feverfew, salvia divinorum, and valerian.
• Arnica. The dried flowers, and sometimes the roots and rhizomes, are the parts of this perennial plant that are used topically for their anti-inflammatory and analgesic effects. There is no clinical evidence to support this use. Occasional topical use probably represents a low risk, but absorption may occur when it is applied to broken skin. The Food and Drug Administration has classified arnica as an unsafe herb and, when used orally, it is considered a poison. It is a uterine stimulant and an abortifacient. Nevertheless, in homeopathic formulations, it has been promoted for use before and during labor for internal and external bruising of the mother and newborn. In Italy, it is one of the top 10 herbs taken by women (Pharmacoepidemiol. Drug Saf. 2006;15:354-9).
• Black seed/kalanji. This herb has been used for thousands of year as a medicine, food, or spice. Because of this, it is unlikely that it causes teratogenesis. Nevertheless, its use to stimulate menstruation and its potential contraceptive properties suggest that it is contraindicated in pregnancy.
• Blue cohosh. Some of the components of this herb have been shown to be teratogenic and toxic in various animal species, so it should be avoided in the first trimester. The herb has uterine stimulant properties that are used by nurse-midwives to stimulate labor. Blue cohosh was the most frequently used herbal preparation for this purpose. However, some sources believe that the potential fetal and newborn toxicity may outweigh any medical benefit (“PDR for Herbal Medicine,” 2nd ed., Montvale, N.J.: Medical Economics, 2000:109-10; “The Review of Natural Products,” St. Louis, MO: Facts and Comparisons, 2000).
• Feverfew. This herb has been used for labor, menstrual disorders, potential miscarriage, and morning sickness; as an abortifacient; and for several other indications. Because of its antipyretic properties, it has been known as “medieval aspirin.” The doses used for these indications have not been quantified. Because of its emmenagogic (capable of provoking menstruation) activity, the herb should not be used in pregnancy.
• Salvia divinorum. This herb has hallucinogenic effects and is used in certain regions of Mexico for healing and divinatory rituals. It is also thought to have antidiarrheal properties. The herb is either smoked or chewed, or its juices are ingested. When taken orally, systemic effects are dependent upon absorption across the oral mucosa as the active ingredient is destroyed in the GI tract. Persistent psychosis has been observed in people who smoked the herb, so it is contraindicated in pregnancy.
• Valerian. A large number of preparations containing valerian are available. It has been used as a sedative and hypnotic for anxiety, restlessness, and sleep disturbances, as well as several other pharmacologic claims. Because of the risk of cytotoxicity in the fetus and hepatotoxicity in the mother, the herb should be avoided during gestation.
For the remaining 16 herbs, small, infrequent doses probably cause no harm to the mother, embryo, fetus, or newborn. Nevertheless, as noted below, some of these herbs are best avoided during pregnancy.
• Chamomile. Excessive use of this herb should be avoided because it is thought to have uterine stimulant, emmenagogic, and abortifacient properties. Although controversial, some nurse-midwives prescribe chamomile teas for the treatment of morning sickness. Because the plant sources of the herb contain coumarin compounds, ingesting chamomile by pregnant women with coagulation disorders is a concern. However, the herb has been used for thousands of years, so the risk of harm, at least from occasional use, must be very rare.
• Echinacea. This herb is used topically to enhance wound healing and systemically as an immunostimulant. An IV formulation is used in Germany but is not available in the United States. It also has been recommended to assist in the prevention or treatment of viral upper respiratory tract infections. Its use in pregnancy is limited to one small study.
• Evening primrose oil. The oil contains two essential fatty acids: cis-linoleic and gamma-linolenic acid. In a national survey of nurse-midwives, it was the most frequently used herbal preparation for the induction of labor. No adverse effects have been reported in the fetus or newborn from this use. The doses used varied widely and included both oral and vaginal routes of administration. In addition, the oil has been used for rheumatoid arthritis and diabetic neuropathy, but there are no reports of these uses in pregnancy.
• Garlic. Garlic has been used for food flavoring since ancient times and appears to be safe during pregnancy. Some components cross the placenta, as shown by garlic odor in the amniotic fluid and on the newborn’s breath. Very high doses have the potential to induce menstruation or uterine contractions, but apparently these effects have not been reported.
• Ginger. No reports of ginger-induced developmental toxicity have been located. Ginger has been used as antiemetic for nausea and vomiting of pregnancy.
• Ginseng. The root is the most important part of this plant that is found throughout the world and has been used in medicine for more than 2,000 years. The herb has been promoted for multiple pharmacologic effects, including adaptogenic, CNS, cardiovascular, endocrine, ergogenic, antineoplastic, and immunomodulatory effects.
Hypertension and hypoglycemia have been reported in nonpregnant patients, but not in the limited human pregnancy data. A brief 1991 study compared 88 women who took the herb during pregnancy with 88 controls. No differences between the groups were found with regard to the mode of delivery, birth weight, low birth weight (< 2,500 ), preterm delivery (< 37 weeks), low Apgar score (< 7), stillbirths, neonatal deaths, or maternal complications (Asia Oceania J. Obstet. Gynaecol. 1991;17:379-80).
• Ginkgo biloba. The limited animal reproduction data suggest low risk, but there is no reported human pregnancy experience. Nevertheless, it is an ancient herbal preparation that is commonly used for organic brain syndrome, circulatory disorders, asthma, vertigo, and tinnitus. Because of its widespread use, it is doubtful that a major teratogenic effect would have escaped notice, but more subtle or low-incidence toxic effects may not have been detected.
• Kudzu. No human or animal data regarding pregnancy have been located. The herb has been used for more than 2,500 years for the treatment of alcohol hangover, drunkenness, alcoholism, muscle pain, and measles. Many of its chemical constituents can be found in foods. Nevertheless, high, frequent doses should be avoided.
• Nutmeg. This is a commonly used spice but, as with any herb, high doses can produce toxicity. The toxicity is caused by a chemical in the seeds, myristicin, which has anticholinergic properties. A woman at 30 weeks’ gestation misread a recipe and used a whole grated nutmeg rather than 1/8 teaspoon when making cookies. When she ate a cookie, she experienced sinus tachycardia, hypertension, and a sensation of impending doom. The fetus had tachycardia, and atropine-like poisoning was diagnosed. After about 12 hours, both mother and fetus made an uneventful recovery and a healthy infant was born at term.
• Passion flower. The name of this herb may refer to about 400 species of the genus Passiflora. It is available in both oral and topical forms and is used for nervousness, neuralgia, insomnia, pain, asthma, seizures, burns, hemorrhoids, and menopausal complaints. As with many herbs, it contains a large number of chemicals, none of which have undergone reproductive testing. No reports describing the use of this herb in human pregnancy have been located. However, because it has uterine stimulant properties, the oral formulation is best avoided in pregnancy.
• Peppermint. This popular flavoring appears to be harmless for the mother and developing baby when low, recommended doses are ingested. Peppermint oil is available in numerous topical and oral formulations. High oral doses, however, can cause significant toxicity, including death. During pregnancy, ingestion of more than the recommended doses is unsafe because of possible emmenagogic and abortifacient properties.
• Pumpkin seed. This herb, when used as a food, appears to be harmless for the mother and embryo-fetus, but no reports describing its use in pregnancy have been located. High doses, such as those used in traditional medicine or in eating disorders, should be avoided because of the potential for toxic effects from the many chemicals these seeds contain.
• Raspberry leaf. Raspberry leaf tea is commonly used by pregnant women. Nurse-midwives often prescribe the tea to treat nausea and vomiting and as a uterine tonic to shorten labor. A double-blind, randomized, placebo-controlled study evaluated the effect of raspberry leaf tablets (2 tablets/day) on pregnancy outcomes. Compared with controls, no differences were found for length of labor or stages of labor, mode of delivery, admission to the neonatal intensive care unit, Apgar score, and birth weight (J. Midwifery Womens Health 2001;46:51-9).
• Safflower. Safflower oil is commonly used in cooking and has been given for its laxative action. There are no reports describing the use of the herb in pregnancy. It is doubtful if such use would have any adverse effect on a pregnancy. Although abortifacient and emmenagogic effects have been suggested, there is no evidence supporting these effects when used as a food.
• St. John’s wort. No toxicity in pregnant humans has been reported. The use of the herb is widespread and dates back thousands of years. Thus, it is doubtful that the herb is a major teratogen or causes other elements of developmental toxicity. The herb has been used for the management of anxiety, depression, insomnia, inflammation, and gastritis. It is also used as a diuretic and, topically, for the treatment of hemorrhoids and enhanced wound healing.
• Yohimbine. The use of this herb in human pregnancies has not been reported. It has been used as an aphrodisiac and for weight loss, sexual dysfunction, and the treatment of orthostatic hypotension. Although it has no Food and Drug Administration–sanctioned indications, it is also available by prescription for male erectile dysfunction. Due to the lack of data regarding pregnancy, the herb is best avoided during pregnancy.
There are few data regarding the effects of the above herbs on a breast-feeding infant. Depending upon the herb, nursing infants will be exposed to many chemical compounds. For those herbs used as food, nursing is probably safe. The safety of the other herbs during lactation is unknown. However, toxicity has been reported in a 9-day-old term infant whose mother was taking arnica (Clin. Toxicol. 2009;47:726, abstract 120). The infant presented with lethargy, decreased milk intake, anemia, and jaundice but recovered with treatment. After the mother stopped the herb and resumed nursing, no further problems were noted in the infant.
Mr. Briggs is a pharmacist clinical specialist at the outpatient clinics of Memorial Care Center for Women at Miller Children’s Hospital in Long Beach, Calif.; clinical professor of pharmacy at the University of California, San Francisco; and adjunct professor of pharmacy at the University of Southern California, Los Angeles, and Washington State University, Spokane. He also is coauthor of “Drugs in Pregnancy and Lactation,” and coeditor of “Diseases, Complications, and Drug Therapy in Obstetrics.” He had no relevant financial disclosures. Contact him at obnews@frontlinemedcom.com.

Extended telepsychiatry outperformed primary care follow-up for ADHD
SAN DIEGO– Six telepsychiatry sessions cut symptoms by at least half for 46% of children with attention-deficit/hyperactivity disorder, compared with 13.6% of those who received one telepsychiatry session plus follow-up care by primary care providers, according to a randomized clinical trial.
The extended telepsychiatry intervention consistently outperformed primary care for attention-deficit/hyperactivity disorder (ADHD), including in subgroups of children with ADHD alone, comorbid anxiety disorders, oppositional defiant disorder, or both, said Dr. Carol M. Rockhill of Seattle Children’s Hospital. “We do think the results of this study justify a more extended consultation model. A single visit is not enough for a child to be stabilized,” she said at the annual meeting of the American Academy of Child and Adolescent Psychiatry.
Attention-deficit hyperactivity is one of the most common disorders of childhood, and children in rural areas often lack access to appropriate care. The Children’s ADHD Telemental Health Treatment Study (CATTS) included 223 children with ADHD and their primary caregivers at seven underserved sites in Washington and Oregon. The primary outcome was a 50% reduction in ADHD symptoms, “an ambitious goal,” Dr. Rockhill said. Average age of the patients was 9 years, and they did not have serious comorbid diagnoses such as autism, bipolar disorder, or conduct disorder, she said. In all, 18% of children had a diagnosis of ADHD alone, while the rest also had at least one comorbid psychiatric disorder, she said.
For the study, the intervention arm received a total of six telepsychiatry sessions provided by interactive televideo with psychiatrists at Seattle Children’s Hospital. All sites had high bandwidth connectivity, and equipment that could pan, tilt, and zoom, Dr. Rockhill said. “It was nice to really be able to see the parents and caregivers well,” she added. Children received medication management, and caregivers were trained on managing behaviors of ADHD.
The control arm received a single telepsychiatry session and follow-up care by primary care providers. Parents in both groups used the Vanderbilt Assessment Scale to rate children’s behavior throughout the study, Dr. Rockhill said.
The researchers also compared telepsychiatry strategies to those from the Texas Children’s Medication Algorithm Project, which provides consensus guidelines for children with ADHD alone or with comorbid anxiety, depression, tics, or aggression, Dr. Rockhill said. Telepsychiatrists most often used the first algorithm, suggesting that they focused on ADHD symptoms even if children had comorbidities, she reported. In more than 98% of cases, telepsychiatrists chose the same initial algorithm as did study reviewers. Psychiatrists most commonly prescribed methylphenidate alone, followed by amphetamine alone. Among 574 telepsychiatry sessions, there were 29 protocol violations, which most often consisted of changing the algorithm order or combining medications, she added.
Children with comorbidities were more likely to have their medications changed, but this did not translate to greater clinical improvement, Dr. Rockhill said. “The kids who did achieve a 50% reduction in symptoms and had two comorbidities had an average of 2.4 medication changes, compared with 3.2 changes for children who did not meet the treatment target,” she said. “Comorbidity makes achievement of a 50% improvement in symptoms more challenging, and is associated with more complex medication strategies, including more changes in medication and more use of polypharmacy.”
In fact, the rate of polypharmacy more than tripled during the course of the study, Dr. Rockhill said. At the beginning of the trial, 13% of children had been prescribed more than one medication, compared with 41.5% at the end. In most cases, polypharmacy consisted of prescribing one stimulant and one nonstimulant.
The National Institute of Mental Health funded the study. Dr. Rockhill did not report financial conflicts of interest.
Key clinical point: Six telepsychiatry sessions are far superior to a single session plus primary care follow-up in children with attention-deficit/hyperactivity disorder.
Major finding: The six-session intervention led to at least a 50% symptom reduction in 46% of children, compared with 13.6% of the control group (P < .001).
Data source: Randomized controlled trial of 223 children with ADHD and their primary caregivers in rural Washington and Oregon.
Disclosures: The National Institute of Mental Health funded the trial. Dr. Rockhill reported no conflicts of interest.
Cancer survivors face financial, work-related issues

chemotherapy
Credit: Rhoda Baer
Many US cancer survivors may be experiencing financial or work-related hardship, a new survey suggests.
Twenty-seven percent of the nearly 1600 survivors surveyed reported at least one financial problem, such as debt or bankruptcy.
And 37% reported having to modify work plans, such as taking extended time off or delaying retirement.
Women, younger survivors, racial/ethnic minorities, and uninsured survivors were all disproportionally burdened by these challenges.
This research (abstract 238*) was presented in a presscast prior to the 2014 Palliative Care in Oncology Symposium, which is scheduled to take place October 24-25 at the Westin Boston Waterfront in Boston.
“We found that many cancer survivors, particularly those who are younger or from underserved populations, experience financial or work-related hardship—even when insured and years out from treatment,” said lead study author Robin Whitney, RN, a cancer survivor and PhD student at the Betty Irene Moore School of Nursing at the University of California, Davis.
“Addressing these challenges is an important aspect of providing quality cancer care, because they can substantially impact quality of life and health outcomes.”
Whitney and her colleagues focused this study on a subset of individuals surveyed in a larger study (2011 Medical Expenditures Panel Survey Experiences with Cancer Survivorship Supplement).
Among the 1592 survivors surveyed, 47% were younger than 65 years of age, 56% were female, 88% were white, and 4% were uninsured. Fourteen percent were in active treatment, 46% were less than 5 years post-treatment, and 39% were 5 years or more post-treatment.
Overall, 27% of those surveyed reported at least one financial difficulty, such as debt, bankruptcy, and worrying about medical bills. Patients in active treatment reported 120% more financial difficulties than survivors who were less than 5 years post-treatment.
Individuals younger than 65 reported 130% more financial difficulties than older survivors. Survivors without insurance had 67% more difficulties than those with insurance. And minorities had 42% more financial difficulties than whites.
In all, 37% of survivors reported making at least one work modification due to their cancer diagnosis, such as changing to a flexible schedule or less demanding job, early or delayed retirement, and extended or unpaid time off.
Women were significantly more likely than men to make at least one work modification. Patients in active treatment made 120% more work modifications than survivors who were less than 5 years post-treatment. And minorities made 57% more modifications than whites.
According to the researchers, these findings are generalizable to the US population and point to the urgent need for screening and support for financial and work challenges across the cancer survivorship trajectory, from diagnosis to long-term survivorship. ![]()
*Information presented differs from that in the abstract.
Healthcare pricing transparency may have pros and cons

Credit: Rhoda Baer
Searching a health service pricing website prior to receiving medical care can reduce patients’ payments, but it may have negative effects as well, researchers have reported in JAMA.
Their study showed that searching the website allowed patients to pay lower prices for clinical services such as advanced imaging and lab tests.
However, the researchers suggested that knowing the price of services ahead of time may prompt some patients to forgo care.
And although cost savings from price shopping might lead to improved treatment adherence, it might also lead to overuse of services.
Neeraj Sood, PhD, of the University of Southern California in Los Angeles, and his colleagues examined the association between price availability and the total claims payments (the total amount paid by patient and insurer) for lab tests, advanced imaging services, and clinician office visits.
The researchers compared payments made by patients who searched a pricing website before using a service to patients who had not researched pricing. The team analyzed medical claims data from 2010 to 2013. This included 502,949 patients who were insured in the US by 18 employers who provided a price transparency platform to their employees.
Patients with access to the pricing website 14 days before receiving care had lower claim payments than those who did not. Adjusted payments were approximately 14% lower for lab tests, 13% lower for advanced imaging, and 1% lower for clinician office visits.
The relative differences translated into lower absolute dollar payments of $3.45 for lab tests, $124.74 for advanced imaging, and $1.18 for clinician office visits.
In the period before either group had access to the pricing website, payments for searchers were about 4% higher for lab tests and 6% higher for advanced imaging but 0.26% lower for office visits than for nonsearchers.
The researchers said future studies should evaluate services beyond those examined in this study. They should also examine how the use of care is affected to better understand the broader effect of price transparency on healthcare spending and population health.
This study was published alongside a related editorial. ![]()
Supercomputers can predict drugs’ side effects

Credit: FDA
Scientists have found they can use supercomputers to identify proteins that cause adverse drug reactions.
The team noted that, during the drug development process, researchers often miss side effects that kill at least 100,000 patients a year.
In PLOS ONE, Montiago LaBute, PhD, of Lawrence Livermore National Laboratory in California, and his colleagues explained how we might use high-performance computers to solve this problem.
Side effects go undetected during drug development
A typical drug discovery process begins with identifying which proteins are associated with a specific disease. Candidate drug compounds are combined with target proteins to determine the drug’s efficacy and toxicity.
While this method allows researchers to identify side effects with many target proteins, there are myriad unknown, off-target proteins that may bind to the candidate drug and could cause unanticipated side effects.
Because it is cost-prohibitive to experimentally test a drug candidate against a potentially large set of proteins—and the list of possible off-targets is not known ahead of time—pharmaceutical companies usually only test a minimal set of off-target proteins during the early stages of drug discovery.
So certain adverse drug reactions remain undetected through the later stages of drug development, and the drugs may make it to the marketplace before these reactions are detected.
There have been several highly publicized medications with off-target protein side effects that have reached the marketplace. For example, Avandia, an anti-diabetic drug, caused heart attacks in some patients.
And Vioxx, an anti-inflammatory medication, caused heart attacks and strokes in certain patient populations. Both drugs were recalled because of their side effects.
“There were no indications of side effects of these medications in early testing or clinical trials,” Dr LaBute said. “We need a way to determine the safety of such therapeutics before they reach patients. Our work can help direct such drugs to patients who will benefit the most from them with the least amount of side effects.”
Supercomputers predict adverse drug reactions
Dr LaBute and colleagues tackled the problem by using supercomputers and information from public databases of drug compounds and proteins.
The databases included DrugBank, UniProt, and Protein Data Bank (PDB), as well as drug databases from the US Food and Drug Administration (FDA) and SIDER, which contain FDA-approved drugs with adverse drug reactions.
The team examined 4020 off-target proteins from DrugBank and UniProt. Those proteins were indexed against the PDB, which whittled the number down to 409 off-proteins that have high-quality 3D crystallographic X-ray diffraction structures essential for analysis in a computational setting.
The researchers fed the 409 off-target proteins into high-performance computer software known as VinaLC, along with 906 FDA-approved drug compounds. VinaLC used a molecular docking matrix that bound the drugs to the proteins. A score was given to each combination to assess whether effective binding occurred.
The team fed binding scores into another computer program and combined them with 560 FDA-approved drugs with known side effects. They used an algorithm to determine which proteins were associated with certain side effects.
In two categories of disorders—vascular disorders and neoplasms—the researchers’ computational model of predicting side effects was more predictive than current statistical methods that do not include binding scores.
In addition, the team’s calculations predicted new potential side effects. For example, they predicted a connection between a protein normally associated with cancer metastasis to vascular disorders like aneurysms.
“We have discovered a very viable way to find off-target proteins that are important for side effects,” Dr LaBute said. “This approach using [high-powered computers] and molecular docking to find [adverse drug reactions] never really existed before.”
The team’s findings provide drug companies with a cost-effective and reliable method to screen for side effects, according to Dr LaBute. Now, his group’s goal is to expand their computational pharmaceutical research to include more off-target proteins for testing and eventually screen every protein in the body.
“If we can do that, the drugs of tomorrow will have less side effects that can potentially lead to fatalities,” Dr Labute said. “Optimistically, we could be a decade away from our ultimate goal. However, we need help from pharmaceutical companies, healthcare providers, and the FDA to provide us with patient and therapeutic data.” ![]()
Collaborative cancer care cuts readmission rates

while another looks on
Credit: NCI
A “co-rounding” partnership between medical oncologists and palliative care specialists has shown improvements in health-system and patient-related outcomes.
The first year of the partnership, which was tested in Duke University Hospital’s solid tumor oncology unit, brought significant decreases in the average length of hospital stay and in readmission rates, compared to a previous year in which the partnership did not exist.
There was a decrease in intensive care unit transfers and a trend toward increased hospice referrals as well, although these differences were not significant.
“The integration of palliative care, as a necessary and essential component of cancer care, is one that has been increasingly endorsed," said Richard Riedel, MD, of Duke University Hospital in Durham, North Carolina.
“The benefits of palliative care have been shown in the outpatient and consultative settings, but we didn’t know its impact on daily inpatient care. Now, we have successfully partnered with our palliative care colleagues to bring their unique skill sets and expertise directly to our admitted patients, and have shown it to be beneficial.”
Dr Riedel described this research (abstract 3*) in a presscast prior to the 2014 Palliative Care in Oncology Symposium, which is scheduled to take place October 24-25 at the Westin Boston Waterfront in Boston.
The co-rounding partnership involves 3 formal meetings each day in which members of the team, including both the attending medical oncologist and the attending palliative care physician, discuss all patients in the solid tumor unit.
The team decides which attending physician oversees direct care for a patient depending on his or her needs. For example, patients with higher symptom burden are typically assigned to the palliative care specialists.
The hospital support staff (eg, internal medicine house staff, physician assistants, and pharmacists) round with both attending physicians, and this care model allows for both formal and informal consultation between specialties.
To evaluate the effects of this model, the researchers assessed outcomes among the 731 patients admitted before the intervention began and 783 admitted in the first year of the intervention. About three-quarters of patients in both groups had metastatic cancer.
The team found a significant decrease in the average length of hospital stay from the pre-intervention period to the post-intervention period—4.51 days and 4.16 days, respectively (P=0.02).
Likewise, there was a significant decrease in readmission rates. There was 23% relative reduction in 7-day readmission rates (P<0.0001) and a 12% relative reduction in 30-day readmission rates (P=0.048).
Patient transfers to the intensive care unit decreased by 15% post-intervention, and hospice referrals increased by 17%, but these effects were not statistically significant (P=0.64 and 0.09, respectively).
The researchers said these results emphasize the value of implementing palliative medicine soon after a cancer diagnosis, rather than waiting until later in the disease’s progression.
Due to positive results with the co-rounding partnership, Duke University Hospital has established new outpatient palliative care clinics in oncology and general medicine.
The researchers are planning future studies to assess longer-term effects of the intervention on both patient and health-system outcomes, evaluate patient satisfaction, and explore potential cost savings associated with this intervention. ![]()
*Data presented differ from data in the abstract.
Return Visits to Pediatric EDs
Returns to the hospital following recent encounters, such as an admission to the inpatient unit or evaluation in an emergency department (ED), may reflect the natural progression of a disease, the quality of care received during the initial admission or visit, or the quality of the underlying healthcare system.[1, 2, 3, 4, 5, 6, 7, 8, 9, 10] Although national attention has focused on hospital readmissions,[3, 4, 5, 6, 7, 11, 12] ED revisits are a source of concern to emergency physicians.[8, 9] Some ED revisits are medically necessary, but revisits that may be managed in the primary care setting contribute to ED crowding, can be stressful to patients and providers, and increase healthcare costs.[10, 11, 12] Approximately 27 million annual ED visits are made by children, accounting for over one‐quarter of all ED visits in the United States, with a reported ED revisit rate of 2.5% to 5.2%.[2, 13, 14, 15, 16, 17, 18, 19, 20] Improved understanding of the patient‐level or visit‐level factors associated with ED revisits may provide an opportunity to enhance disposition decision making at the index visit and optimize site of and communication around follow‐up care.
Previous studies on ED revisits have largely been conducted in single centers and have used variable visit intervals ranging between 48 hours and 30 days.[2, 13, 16, 18, 21, 22, 23, 24, 25] Two national studies used the National Hospital Ambulatory Medical Care Survey, which includes data from both general and pediatric EDs.[13, 14] Factors identified to be associated with increased odds of returning were: young age, higher acuity, chronic conditions, and public insurance. One national study identified some diagnoses associated with higher likelihood of returning,[13] whereas the other focused primarily on infectious diseaserelated diagnoses.[14]
The purpose of this study was to describe the prevalence of return visits specifically to pediatric EDs and to investigate patient‐level, visit‐level, and healthcare systemrelated factors that may be associated with return visits and hospitalization at return.
METHODS
Study Design and Data Source
This retrospective cohort study used data from the Pediatric Health Information System (PHIS), an administrative database with data from 44 tertiary care pediatric hospitals in 27 US states and the District of Columbia. This database contains patient demographics, diagnoses, and procedures as well as medications, diagnostic imaging, laboratory, and supply charges for each patient. Data are deidentified prior to inclusion; encrypted medical record numbers allow for the identification of individual patients across all ED visits and hospitalizations to the same hospital. The Children's Hospital Association (Overland Park, KS) and participating hospitals jointly assure the quality and integrity of the data. This study was approved by the institutional review board at Boston Children's Hospital with a waiver for informed consent granted.
Study Population and Protocol
To standardize comparisons across the hospitals, we included data from 23 of the 44 hospitals in PHIS; 7 were excluded for not including ED‐specific data. For institutions that collect information from multiple hospitals within their healthcare system, we included only records from the main campus or children's hospital when possible, leading to the exclusion of 9 hospitals where the data were not able to be segregated. As an additional level of data validation, we compared the hospital‐level ED volume and admission rates as reported in the PHIS to those reported to a separate database (the Pediatric Analysis and Comparison Tool). We further excluded 5 hospitals whose volume differed by >10% between these 2 data sources.
Patients <18 years of age who were discharged from these EDs following their index visit in 2012 formed the eligible cohort.
Key Outcome Measures
The primary outcomes were return visits within 72 hours of discharge from the ED, and return visits resulting in hospitalization, including observation status. We defined an ED revisit as a return within 72 hours of ED discharge regardless of whether the patient was subsequently discharged from the ED on the return visit or hospitalized. We assessed revisits within 72 hours of an index ED discharge, because return visits within this time frame are likely to be related to the index visit.[2, 13, 16, 21, 22, 24, 25, 26]
Factors Associated With ED Revisits
A priori, we chose to adjust for the following patient‐level factors: age (<30 days, 30 days<1 year, 14 years, 511 years, 1217 years), gender, and socioeconomic status (SES) measured as the zip codebased median household income, obtained from the 2010 US Census, with respect to the federal poverty level (FPL) (<1.5 FPL, 1.52 FPL, 23 FPL, and >3 FPL).[27] We also adjusted for insurance type (commercial, government, or other), proximity of patient's home zip code to hospital (modeled as the natural log of the geographical distance to patient's home address from the hospital), ED diagnosis‐based severity classification system score (1=low severity, 5=high severity),[28] presence of a complex chronic condition at the index or prior visits using a validated classification scheme,[15, 29, 30, 31] and primary care physician (PCP) density per 100,000 in the patient's residential area (modeled as quartiles: very low, <57.2; low, 57.267.9; medium, 68.078.7; high, >78.8). PCP density, defined by the Dartmouth Atlas of Health Care,[32, 33, 34] is the number of primary care physicians per 100,000 residents (PCP count) in federal health service areas (HSA). Patients were assigned to a corresponding HSA based on their home zip code.
Visit‐level factors included arrival time of index visit (8:01 am 4:00 pm, 4:01 pm12:00 am, 12:01 am8 am representing day, evening, and overnight arrival, respectively), day of the week, season, length of stay (LOS) in the ED during the index visit, and ED crowding (calculated as the average daily LOS/yearly average LOS for the individual ED).[35] We categorized the ED primary diagnosis for each visit using the major diagnosis groupings of a previously described pediatric ED‐specific classification scheme.[36] Using International Classification of Diseases, Ninth Revision (ICD‐9) codes, we identified the conditions with the highest ED revisit rates.
Statistical Analyses
Categorical variables describing the study cohort were summarized using frequencies and percentages. Continuous variables were summarized using mean, median, and interquartile range values, where appropriate. We used 2 different hierarchical logistic regression models to assess revisit rates by patient‐ and visit‐level characteristics. The initial model included all patients discharged from the ED following the index visit and assessed for the outcome of a revisit within 72 hours. The second model considered only patients who returned within 72 hours of an index visit and assessed for hospitalization on that return visit. We used generalized linear mixed effects models, with hospital as a random effect to account for the presence of correlated data (within hospitals), nonconstant variability (across hospitals), and binary responses. Adjusted odds ratios with 95% confidence intervals were used as summary measures of the effect of the individual adjusters. Adjusters were missing in fewer than 5% of patients across participating hospitals. Statistical analyses were performed using SAS version 9.3 (SAS Institute Inc., Cary, NC); 2‐sided P values <0.004 were considered statistically significant to account for multiple comparisons (Bonferroni‐adjusted level of significance=0.0038).
RESULTS
Patients
A total of 1,610,201 patients <18 years of age evaluated across the 23 PHIS EDs in 2012 were included in the study. Twenty‐one of the 23 EDs have academic affiliations; 10 are located in the South, 6 in the Midwest, 5 in the West, and 2 in the Northeast region of the United States. The annual ED volume for these EDs ranged from 25,090 to 136,160 (median, 65,075; interquartile range, 45,28085,206). Of the total patients, 1,415,721 (87.9%) were discharged following the index visit and comprised our study cohort. Of these patients, 47,294 (revisit rate: 3.3%) had an ED revisit within 72 hours. There were 4015 patients (0.3%) who returned more than once within 72 hours, and the largest proportion of these returned with infection‐related conditions. Of those returning, 37,999 (80.3%) were discharged again, whereas 9295 (19.7%) were admitted to the hospital (Figure 1). The demographic and clinical characteristics of study participants are displayed in Table 1.
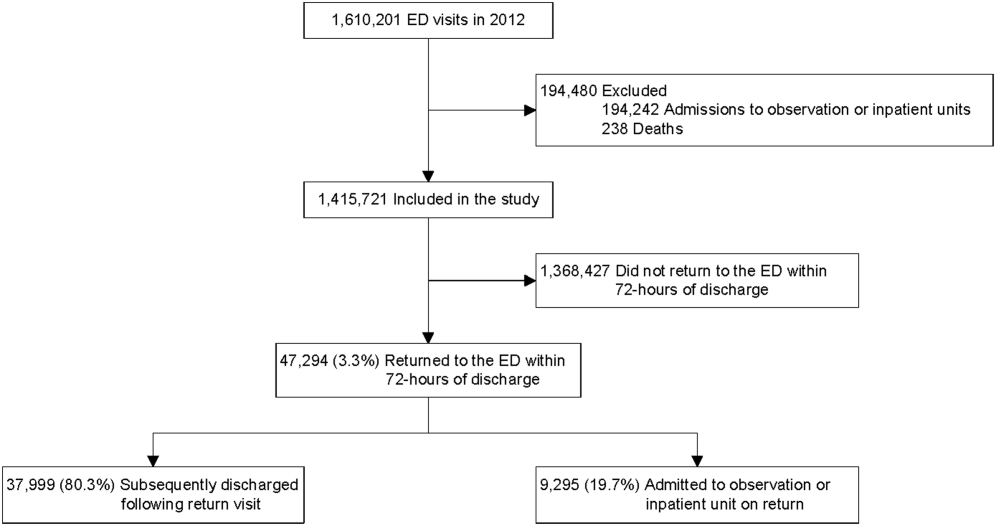
| Index Visit, n=1,415,721, n (%) | Return Visits Within 72 Hours of Discharge, n=47,294, 3.3% | ||
|---|---|---|---|
| Return to Discharge, n (%) | Return to Admission, n (%) | ||
| |||
| Gender, female | 659,417 (46.6) | 17,665 (46.5) | 4,304 (46.3) |
| Payor | |||
| Commercial | 379,403 (26.8) | 8,388 (22.1) | 3,214 (34.6) |
| Government | 925,147 (65.4) | 26,880 (70.7) | 5,786 (62.3) |
| Other | 111,171 (7.9) | 2,731 (7.2) | 295 (3.2) |
| Age | |||
| <30 days | 19,217 (1.4) | 488 (1.3) | 253 (2.7) |
| 30 days to <1 year | 216,967 (15.3) | 8,280 (21.8) | 2,372 (25.5) |
| 1 year to 4 years | 547,083 (38.6) | 15,542 (40.9) | 3,187 (34.3) |
| 5 years to 11 years | 409,463 (28.9) | 8,906 (23.4) | 1,964 (21.1) |
| 12 years to 17 years | 222,991 (15.8) | 4,783 (12.6) | 1,519 (16.3) |
| Socioeconomic statusa | |||
| <1.5 times FPL | 493,770 (34.9) | 13,851 (36.5) | 2,879 (31.0) |
| 1.5 to 2 times FPL | 455,490 (32.2) | 12,364 (32.5) | 2,904 (31.2) |
| 2 to 3 times FPL | 367,557 (26.0) | 9,560 (25.2) | 2,714 (29.2) |
| >3 times FPL | 98,904 (7.0) | 2,224 (5.9) | 798 (8.6) |
| Primary care physician density per 100,000 patients | |||
| Very low | 351,798 (24.9) | 8,727 (23.0) | 2,628 (28.3) |
| Low | 357,099 (25.2) | 9,810 (25.8) | 2,067 (22.2) |
| Medium | 347,995 (24.6) | 10,186 (26.8) | 2,035 (21.9) |
| High | 358,829 (25.4) | 9,276 (24.4) | 2,565 (27.6) |
| CCC present, yes | 125,774 (8.9) | 4,446 (11.7) | 2,825 (30.4) |
| Severity score | |||
| Low severity (0,1,2) | 721,061 (50.9) | 17,310 (45.6) | 2,955 (31.8) |
| High severity (3,4,5) | 694,660 (49.1) | 20,689 (54.5) | 6,340 (68.2) |
| Time of arrival | |||
| Day | 533,328 (37.7) | 13,449 (35.4) | 3,396 (36.5) |
| Evening | 684,873 (48.4) | 18,417 (48.5) | 4,378 (47.1) |
| Overnight | 197,520 (14.0) | 6,133 (16.1) | 1,521 (16.4) |
| Season | |||
| Winter | 384,957 (27.2) | 10,603 (27.9) | 2,844 (30.6) |
| Spring | 367,434 (26.0) | 9,923 (26.1) | 2,311 (24.9) |
| Summer | 303,872 (21.5) | 8,308 (21.9) | 1,875 (20.2) |
| Fall | 359,458 (25.4) | 9,165 (24.1) | 2,265 (24.4) |
| Weekday/weekend | |||
| Monday | 217,774 (15.4) | 5,646 (14.9) | 1,394 (15) |
| Tuesday | 198,220 (14.0) | 5,054 (13.3) | 1,316 (14.2) |
| Wednesday | 194,295 (13.7) | 4,985 (13.1) | 1,333 (14.3) |
| Thursday | 191,950 (13.6) | 5,123 (13.5) | 1,234 (13.3) |
| Friday | 190,022 (13.4) | 5,449 (14.3) | 1,228 (13.2) |
| Saturday | 202,247 (14.3) | 5,766 (15.2) | 1,364 (14.7) |
| Sunday | 221,213 (15.6) | 5,976 (15.7) | 1,426 (15.3) |
| Distance from hospital in miles, median (IQR) | 8.3 (4.614.9) | 9.2 (4.917.4) | 8.3 (4.614.9) |
| ED crowding score at index visit, median (IQR) | 1.0 (0.91.1) | 1.0 (0.91.1) | 1.0 (0.91.1) |
| ED LOS in hours at index visit, median (IQR) | 2.0 (1.03.0) | 3.0 (2.05.0) | 2.0 (1.03.0) |
ED Revisit Rates and Revisits Resulting in Admission
In multivariate analyses, compared to patients who did not return to the ED, patients who returned within 72 hours of discharge had higher odds of revisit if they had the following characteristics: a chronic condition, were <1 year old, a higher severity score, and public insurance. Visit‐level factors associated with higher odds of revisits included arrival for the index visit during the evening or overnight shift or on a Friday or Saturday, index visit during times of lower ED crowding, and living closer to the hospital. On return, patients were more likely to be hospitalized if they had a higher severity score, a chronic condition, private insurance, or were <30 days old. Visit‐level factors associated with higher odds of hospitalization at revisit included an index visit during the evening and overnight shift and living further from the hospital. Although the median SES and PCP density of a patient's area of residence were not associated with greater likelihood of returning, when they returned, patients residing in an area with a lower SES and higher PCP densities (>78.8 PCPs/100,000) had lower odds of being admitted to the hospital. Patients whose index visit was on a Sunday also had lower odds of being hospitalized upon return (Table 2).
| Characteristic | Adjusted OR of 72‐Hour Revisit (95% CI), n=1,380,723 | P Value | Adjusted OR of 72‐Hour Revisit Admissions (95% CI), n=46,364 | P Value |
|---|---|---|---|---|
| ||||
| Gender | ||||
| Male | 0.99 (0.971.01) | 0.2809 | 1.02 (0.971.07) | 0.5179 |
| Female | Reference | Reference | ||
| Payor | ||||
| Government | 1.14 (1.111.17) | <0.0001 | 0.68 (0.640.72) | <0.0001 |
| Other | 0.97 (0.921.01) | 0.1148 | 0.33 (0.280.39) | <0.0001 |
| Private | Reference | Reference | ||
| Age group | ||||
| 30 days to <1 year | 1.32 (1.221.42) | <0.0001 | 0.58 (0.490.69) | <0.0001 |
| 1 year to 5 years | 0.89 (0.830.96) | 0.003 | 0.41 (0.340.48) | <0.0001 |
| 5 years to 11 years | 0.69 (0.640.74) | <0.0001 | 0.40 (0.330.48) | <0.0001 |
| 12 years to 17 years | 0.72 (0.660.77) | <0.0001 | 0.50 (0.420.60) | <0.0001 |
| <30 days | Reference | Reference | ||
| Socioeconomic statusa | ||||
| % <1.5 times FPL | 0.96 (0.921.01) | 0.0992 | 0.82 (0.740.92) | 0.0005 |
| % 1.5 to 2 times FPL | 0.98 (0.941.02) | 0.2992 | 0.83 (0.750.92) | 0.0005 |
| % 2 to 3 times FPL | 1.02 (0.981.07) | 0.292 | 0.88 (0.790.97) | 0.01 |
| % >3 times FPL | Reference | Reference | ||
| Severity score | ||||
| High severity, 4, 5, 6 | 1.43 (1.401.45) | <0.0001 | 3.42 (3.233.62) | <0.0001 |
| Low severity, 1, 2, 3 | Reference | Reference | ||
| Presence of any CCC | ||||
| Yes | 1.90 (1.861.96) | <0.0001 | 2.92 (2.753.10) | <0.0001 |
| No | Reference | Reference | ||
| Time of arrival | ||||
| Evening | 1.05 (1.031.08) | <0.0001 | 1.37 (1.291.44) | <0.0001 |
| Overnight | 1.19 (1.151.22) | <0.0001 | 1.84 (1.711.97) | <0.0001 |
| Day | Reference | Reference | ||
| Season | ||||
| Winter | 1.09 (1.061.11) | <0.0001 | 1.06 (0.991.14) | 0.0722 |
| Spring | 1.07 (1.041.10) | <0.0001 | 0.98 (0.911.046) | 0.4763 |
| Summer | 1.05 (1.021.08) | 0.0011 | 0.93 (0.871.01) | 0.0729 |
| Fall | Reference | Reference | ||
| Weekday/weekend | ||||
| Thursday | 1.02 (0.9821.055) | 0.3297 | 0.983 (0.8971.078) | 0.7185 |
| Friday | 1.08 (1.041.11) | <0.0001 | 1.03 (0.941.13) | 0.5832 |
| Saturday | 1.08 (1.041.12) | <0.0001 | 0.89 (0.810.97) | 0.0112 |
| Sunday | 1.02 (0.991.06) | 0.2054 | 0.81 (0.740.89) | <0.0001 |
| Monday | 1.00 (0.961.03) | 0.8928 | 0.98 (0.901.07) | 0.6647 |
| Tuesday | 0.99 (0.951.03) | 0.5342 | 0.93 (0.851.02) | 0.1417 |
| Wednesday | Reference | Reference | ||
| PCP ratio per 100,000 patients | ||||
| 57.267.9 | 1.00 (0.961.04) | 0.8844 | 0.93 (0.841.03) | 0.1669 |
| 68.078.7 | 1.00 (0.951.04) | 0.8156 | 0.86 (0.770.96) | 0.0066 |
| >78.8 | 1.00 (0.951.04) | 0.6883 | 0.82 (0.730.92) | 0.001 |
| <57.2 | Reference | Reference | ||
| ED crowding score at index visitb | ||||
| 2 | 0.92 (0.900.95) | <0.0001 | 0.96 (0.881.05) | 0.3435 |
| 1 | Reference | Reference | ||
| Distance from hospitalc | ||||
| 3.168, 23.6 miles | 0.95 (0.940.96) | <0.0001 | 1.16 (1.121.19) | <0.0001 |
| 2.168, 8.7 miles | Reference | Reference | ||
| ED LOS at index visitb | ||||
| 3.7 hours | 1.003 (1.0011.005) | 0.0052 | NA | |
| 2.7 hours | Reference | |||
Diagnoses Associated With Return Visits
Patients with index visit diagnoses of sickle cell disease and leukemia had the highest proportion of return visits (10.7% and 7.3%, respectively). Other conditions with high revisit rates included infectious diseases such as cellulitis, bronchiolitis, and gastroenteritis. Patients with other chronic diseases such as diabetes and with devices, such as gastrostomy tubes, also had high rates of return visits. At return, the rate of hospitalization for these conditions ranged from a 1‐in‐6 chance of hospitalization for the diagnoses of a fever to a 1‐in‐2 chance of hospitalization for patients with sickle cell anemia (Table 3).
| Major Diagnostic Subgroup | No. of Index ED Visit Dischargesa | 72‐Hour Revisit, % (95% CI) | Admitted on Return, % (95% CI) |
|---|---|---|---|
| |||
| Sickle cell anemia | 2,531 | 10.7 (9.511.9) | 49.6 (43.755.6) |
| Neoplastic diseases, cancer | 536 | 7.3 (5.19.5) | 36 (2151) |
| Infectious gastrointestinal diseases | 802 | 7.2 (5.49.0) | 21 (1031) |
| Devices and complications of the circulatory systemb | 1,033 | 6.9 (5.38.4) | 45 (3457) |
| Other hematologic diseasesb | 1,538 | 6.1 (4.97.3) | 33 (2443) |
| Fever | 80,626 | 5.9 (5.76.0) | 16.3 (15.217.3) |
| Dehydration | 7,362 | 5.4 (5.25.5) | 34.6 (30.139) |
| Infectious respiratory diseases | 72,652 | 5.4 (5.25.5) | 28.6 (27.230) |
| Seizures | 17,637 | 5.3 (4.95.6) | 33.3 (30.336.4) |
| Other devices and complicationsb | 1,896 | 5.3 (4.36.3) | 39.0 (29.448.6) |
| Infectious skin, dermatologic and soft tissue diseases | 40,272 | 4.7 (4.55) | 20.0 (18.221.8) |
| Devices and complications of the gastrointestinal systemb | 4,692 | 4.6 (4.05.2) | 24.7 (18.930.4) |
| Vomiting | 44,730 | 4.4 (4.24.6) | 23.7 (21.825.6) |
| Infectious urinary tract diseases | 17,020 | 4.4 (4.14.7) | 25.9 (22.729) |
| Headache | 19,016 | 4.3 (4.14.6) | 28.2 (25.131.3) |
| Diabetes mellitus | 1,531 | 4.5 (3.35.3) | 29 (1840) |
| Abdominal pain | 39,594 | 4.2 (44.4) | 24.8 (22.726.8) |
| Other infectious diseasesb | 647 | 4.2 (2.65.7) | 33 (1651) |
| Gastroenteritis | 55,613 | 4.0 (3.84.1) | 20.6 (18.922.3) |
DISCUSSION
In this nationally representative sample of free‐standing children's hospitals, 3.3% of patients discharged from the ED returned to the same ED within 72 hours. This rate is similar to rates previously published in studies of general EDs.[11, 15] Of the returning children, over 80% were discharged again, and 19.7% were hospitalized, which is two‐thirds more than the admission rate at index visit (12%). In accordance with previous studies,[14, 16, 25] we found higher disease severity, presence of a chronic condition, and younger age were strongly associated with both the odds of patients returning to the ED and of being hospitalized at return. Patients who were hospitalized lived further away from the hospital and were of a higher SES. In this study, we show that visit‐level and access‐related factors are also associated with increased risk of return, although to a lesser degree. Patients seen on a weekend (Friday or Saturday) were found to have higher odds of returning, whereas those seen initially on a Sunday had lower odds of hospitalization at return. In this study, we also found that patients seen on the evening or night shifts at the index presentation had a significant association with return visits and hospitalization at return. Additionally, we found that although PCP density was not associated with the odds of returning to the ED, patients from areas with a higher PCP density were less likely to be admitted at return. In addition, by evaluating the diagnoses of patients who returned, we found that many infectious conditions commonly seen in the ED also had high return rates.
As previously shown,[23] we found that patients with complex and chronic diseases were at risk for ED revisits, especially patients with sickle cell anemia and cancer (mainly acute leukemia). In addition, patients with a chronic condition were 3 times more likely to be hospitalized when they returned. These findings may indicate an opportunity for improved discharge planning and coordination of care with subspecialty care providers for particularly at‐risk populations, or stronger consideration of admission at the index visit. However, admission for these patients at revisit may be unavoidable.
Excluding patients with chronic and complex conditions, the majority of conditions with high revisit rates were acute infectious conditions. One national study showed that >70% of ED revisits by patients with infectious conditions had planned ED follow‐up.[13] Although this study was unable to assess the reasons for return or admission at return, children with infectious diseases often worsen over time (eg, those with bronchiolitis). The relatively low admission rates at return for these conditions, despite evidence that providers may have a lower threshold for admission when a patient returns to the ED shortly after discharge,[24] may reflect the potential for improving follow‐up at the PCP office. However, although some revisits may be prevented,[37, 38] we recognize that an ED visit could be appropriate and necessary for some of these children, especially those without primary care.
Access to primary care and insurance status influence ED utilization.[14, 39, 40, 41] A fragmented healthcare system with poor access to primary care is strongly associated with utilization of the ED for nonurgent care. A high ED revisit rate might be indicative of poor coordination between ED and outpatient services.[9, 39, 42, 43, 44, 45, 46] Our study's finding of increased risk of return visit if the index visit occurred on a Friday or Saturday, and a decreased likelihood of subsequent admission when a patient returns on a Sunday, may suggest limited or perceived limited access to the PCP over a weekend. Although insured patients tend to use the ED less often for nonemergent cases, even when patients have PCPs, they might still choose to return to the ED out of convenience.[47, 48] This may be reflected in our finding that, when adjusted for insurance status and PCP density, patients who lived closer to the hospital were more likely to return, but less likely to be admitted, thereby suggesting proximity as a factor in the decision to return. It is also possible that patients residing further away returned to another institution. Although PCP density did not seem to be associated with revisits, patients who lived in areas with higher PCP density were less likely to be admitted when they returned. In this study, there was a stepwise gradient in the effect of PCP density on the odds of being hospitalized on return with those patients in areas with fewer PCPs being admitted at higher rates on return. Guttmann et al.,[40] in a recent study conducted in Canada where there is universal health insurance, showed that children residing in areas with higher PCP densities had higher rates of PCP visits but lower rates of ED visits compared to children residing in areas with lower PCP densities. It is possible that emergency physicians have more confidence that patients will have dedicated follow‐up when a PCP can be identified. These findings suggest that the development of PCP networks with expanded access, such as alignment of office hours with parent need and patient/parent education about PCP availability, may reduce ED revisits. Alternatively, creation of centralized hospital‐based urgent care centers for evening, night, and weekend visits may benefit both the patient and the PCP and avoid ED revisits and associated costs.
Targeting and eliminating disparities in care might also play a role in reducing ED revisits. Prior studies have shown that publicly insured individuals, in particular, frequently use the ED as their usual source of care and are more likely to return to the ED within 72 hours of an initial visit.[23, 39, 44, 49, 50] Likewise, we found that patients with public insurance were more likely to return but less likely to be admitted on revisit. After controlling for disease severity and other demographic variables, patients with public insurance and of lower socioeconomic status still had lower odds of being hospitalized following a revisit. This might also signify an increase of avoidable hospitalizations among patients of higher SES or with private insurance. Further investigation is needed to explore the reasons for these differences and to identify effective interventions to eliminate disparities.
Our findings have implications for emergency care, ambulatory care, and the larger healthcare system. First, ED revisits are costly and contribute to already overburdened EDs.[10, 11] The average ED visit incurs charges that are 2 to 5 times more than an outpatient office visit.[49, 50] Careful coordination of ambulatory and ED services could not only ensure optimal care for patients, but could save the US healthcare system billions of dollars in potentially avoidable healthcare expenditures.[49, 50] Second, prior studies have demonstrated a consistent relationship between poor access to primary care and increased use of the ED for nonurgent conditions.[42] Publicly insured patients have been shown to have disproportionately increased difficulty acquiring and accessing primary care.[41, 42, 47, 51] Furthermore, conditions with high ED revisit rates are similar to conditions reported by Berry et al.4 as having the highest hospital readmission rates such as cancer, sickle cell anemia, seizure, pneumonia, asthma, and gastroenteritis. This might suggest a close relationship between 72‐hour ED revisits and 30‐day hospital readmissions. In light of the recent expansion of health insurance coverage to an additional 30 million individuals, the need for better coordination of services throughout the entire continuum of care, including primary care, ED, and inpatient services, has never been more important.[52] Future improvements could explore condition‐specific revisit or readmission rates to identify the most effective interventions to reduce the possibly preventable returns.
This study has several limitations. First, as an administrative database, PHIS has limited clinical data, and reasons for return visits could not be assessed. Variations between hospitals in diagnostic coding might also lead to misclassification bias. Second, we were unable to assess return visits to a different ED. Thus, we may have underestimated revisit frequency. However, because children are generally more likely to seek repeat care in the same hospital,[3] we believe our estimate of return visit rate approximates the actual return visit rate; our findings are also similar to previously reported rates. Third, for the PCP density factor, we were unable to account for types of insurance each physician accepted and influence on return rates. Fourth, return visits in our sample could have been for conditions unrelated to the diagnosis at index visit, though the short timeframe considered for revisits makes this less likely. In addition, the crowding index does not include the proportion of occupied beds at the precise moment of the index visit. Finally, this cohort includes only children seen in the EDs of pediatric hospitals, and our findings may not be generalizable to all EDs who provide care for ill and injured children.
We have shown that, in addition to previously identified patient level factors, there are visit‐level and access‐related factors associated with pediatric ED return visits. Eighty percent are discharged again, and almost one‐fifth of returning patients are admitted to the hospital. Admitted patients tend to be younger, sicker, chronically ill, and live farther from the hospital. By being aware of patients' comorbidities, PCP access, as well as certain diagnoses associated with high rates of return, physicians may better target interventions to optimize care. This may include having a lower threshold for hospitalization at the initial visit for children at high risk of return, and communication with the PCP at the time of discharge to ensure close follow‐up. Our study helps to provide benchmarks around ED revisit rates, and may serve as a starting point to better understand variation in care. Future efforts should aim to find creative solutions at individual institutions, with the goal of disseminating and replicating successes more broadly. For example, investigators in Boston have shown that the use of a comprehensive home‐based asthma management program has been successful in decreasing emergency department visits and hospitalization rates.[53] It is possible that this approach could be spread to other institutions to decrease revisits for patients with asthma. As a next step, the authors have undertaken an investigation to identify hospital‐level characteristics that may be associated with rates of return visits.
Acknowledgements
The authors thank the following members of the PHIS ED Return Visits Research Group for their contributions to the data analysis plan and interpretation of results of this study: Rustin Morse, MD, Children's Medical Center of Dallas; Catherine Perron, MD, Boston Children's Hospital; John Cheng, MD, Children's Healthcare of Atlanta; Shabnam Jain, MD, MPH, Children's Healthcare of Atlanta; and Amanda Montalbano, MD, MPH, Children's Mercy Hospitals and Clinics. These contributors did not receive compensation for their help with this work.
Disclosures
A.T.A. and A.M.S. conceived the study and developed the initial study design. All authors were involved in the development of the final study design and data analysis plan. C.W.T. collected and analyzed the data. A.T.A. and C.W.T. had full access to all of the data and take responsibility for the integrity of the data and the accuracy of the data analysis. All authors were involved in the interpretation of the data. A.T.A. drafted the article, and all authors made critical revisions to the initial draft and subsequent versions. A.T.A. and A.M.S. take full responsibility for the article as a whole. The authors report no conflicts of interest.
- Joint policy statement—guidelines for care of children in the emergency department. Pediatrics. 2009;124:1233–1243.
- , , , , . Return visits to a pediatric emergency department. Pediatr Emerg Care. 2004;20:166–171.
- , . Hospital readmission as an accountability measure. JAMA. 2011;305:504–505.
- , , , et al. Hospital utilization and characteristics of patients experiencing recurrent readmissions within children's hospitals. JAMA. 2011;305:682–690.
- , , , et al. Pediatric readmission prevalence and variability across hospitals. JAMA. 2013;309:372–380.
- . Farewell, and don't come back. Health reform gives hospitals a big incentive to send patients home for good. US News World Rep. 2010;147:20, 22–23.
- . CMS' stealth health reform. Plan to reduce readmissions and boost the continuum of care. Hosp Health Netw. 2008;82:24.
- , . Return visits to the emergency department. J Emerg Med. 1987;5:359–362.
- , , , . Emergency department visits after hospital discharge: a missing part of the equation. Ann Emerg Med. 2013;62:145–150.
- , , , , . Quality indicators for high acuity pediatric conditions. Pediatrics. 2013;132:752–762.
- , . Revisiting hospital readmissions. JAMA. 2013;309:398–400.
- , , . Thirty‐day readmissions: the clock is ticking. JAMA. 2013;309:345–346.
- . Patients seen in emergency departments who had a prior visit within the previous 72 h‐National Hospital Ambulatory Medical Care Survey, 2002. Public Health. 2005;119:914–918.
- , , , , . A national depiction of children with return visits to the emergency department within 72 hours, 2001–2007. Pediatr Emerg Care. 2012;28:606–610.
- , , , et al. How well can hospital readmission be predicted in a cohort of hospitalized children? A retrospective, multicenter study. Pediatrics. 2009;123:286–293.
- , , . Unscheduled return visits to the pediatric emergency department‐one‐year experience. Pediatr Emerg Care. 2006;22:545–549.
- , . Return visits to the emergency department among febrile children 3 to 36 months of age. Pediatr Emerg Care. 2011;27:1126–1129.
- , , , . Pediatric emergency department recidivism: demographic characteristics and diagnostic predictors. J Emerg Nurs. 2006;32:131–138.
- Healthcare Cost and Utilization Project. Pediatric emergency department visits in community hospitals from selected states, 2005. Statistical brief #52. Available at: http://www.ncbi.nlm.nih.gov/books/NBK56039. Accessed October 3, 2013.
- , , , , , . Factors influencing infant visits to emergency departments. Pediatrics. 2000;106:1031–1039.
- , , , . Early pediatric emergency department return visits: a prospective patient‐centric assessment. Clin Pediatr (Phila). 2012;51:651–658.
- , , , , . Unscheduled return visits with and without admission post emergency department discharge. J Emerg Med. 2012;43:1110–1118.
- , , , . Unscheduled revisits to a pediatric emergency department: risk factors for children with fever or infection‐related complaints. Pediatr Emerg Care. 2005;21:816–821.
- , , , , . Unscheduled return visits to the emergency department: consequences for triage. Acad Emerg Med. 2013;20:33–39.
- , , , et al. Repeat pediatric visits to a general emergency department. Ann Emerg Med. 1996;28:467–473.
- , , , , . Emergency department revisits. Ann Emerg Med. 1989;18:964–968.
- US Department of Health 19:70–78.
- , , . Pediatric deaths attributable to complex chronic conditions: a population‐based study of Washington State, 1980–1997. Pediatrics. 2000;106:205–209.
- , , , , , . Deaths attributed to pediatric complex chronic conditions: national trends and implications for supportive care services. Pediatrics. 2001;107:E99.
- , , . Where do children with complex chronic conditions die? Patterns in Washington State, 1980–1998. Pediatrics. 2002;109:656–660.
- Dartmouth Atlas of Health Care. Hospital and physician capacity, 2006. Available at: http://www.dartmouthatlas.org/data/topic/topic.aspx?cat=24. Accessed October 7, 2013.
- Dartmouth Atlas of Health Care. Research methods. What is an HSA/HRR? Available at: http://www.dartmouthatlas.org/tools/faq/researchmethods.aspx. Accessed October 7, 2013,.
- Dartmouth Atlas of Health Care. Appendix on the geography of health care in the United States. Available at: http://www.dartmouthatlas.org/downloads/methods/geogappdx.pdf. Accessed October 7, 2013.
- , , . Emergency department crowding: prioritising quantified crowding measures using a Delphi study. Emerg Med J. 2012;29:868–871.
- , , , , . A new diagnosis grouping system for child emergency department visits. Acad Emerg Med. 2010;17:204–213.
- , , , et al. Effectiveness of emergency department asthma management strategies on return visits in children: a population‐based study. Pediatrics. 2007;120:e1402–e1410.
- , , , . Emergency department patients with diabetes have better glycemic control when they have identifiable primary care providers. Acad Emerg Med. 2012;19:650–655.
- , , , , , Newman L. Impact of socioeconomic status on hospital use in New York City. Health Aff (Millwood). 1993;12:162–173.
- , , , , . Primary care physician supply and children's health care use, access, and outcomes: findings from Canada. Pediatrics. 2010;125:1119–1126.
- , , , et al. Insurance status and access to urgent ambulatory care follow‐up appointments. JAMA. 2005;294:1248–1254.
- , . Emergency departments, Medicaid costs, and access to primary care—understanding the link. N Engl J Med. 2012;366:2141–2143.
- Committee on the Future of Emergency Care in the United States Health System. Emergency Care for Children: Growing Pains. Washington, DC: The National Academies Press; 2007.
- Committee on the Future of Emergency Care in the United States Health System. Hospital‐Based Emergency Care: At the Breaking Point. Washington, DC: The National Academies Press; 2007.
- , . Geographic variation in access to care—the relationship with quality. N Engl J Med. 2012;367:3–6.
- , , , , . Trends and characteristics of US emergency department visits, 1997–2007. JAMA. 2010;304:664–670.
- , , , , . Ambulatory visits to hospital emergency departments. Patterns and reasons for use. 24 Hours in the ED Study Group. JAMA. 1996;276:460–465.
- , , , , . Emergency department workload increase: dependence on primary care? J Emerg Med. 2010;38:279–285.
- Network for Excellence in Health Innovation. Leading healthcare research organizations to examine emergency department overuse. New England Research Institute, 2008. Available at: http://www.nehi.net/news/310‐leading‐health‐care‐research‐organizations‐to‐examine‐emergency‐department‐overuse/view. Accessed October 4, 2013.
- Robert Wood Johnson Foundation. Quality field notes: reducing inappropriate emergency department use. Available at: http://www.rwjf.org/en/research‐publications/find‐rwjf‐research/2013/09/quality‐field‐notes–reducing‐inappropriate‐emergency‐department.html.
- Access of Medicaid recipients to outpatient care. N Engl J Med. 1994;330:1426–1430.
- Medicaid policy statement. Pediatrics. 2013;131:e1697–e1706.
- , , , et al. Community asthma initiative: evaluation of a quality improvement program for comprehensive asthma care. Pediatrics. 2012;129:465–472.
Returns to the hospital following recent encounters, such as an admission to the inpatient unit or evaluation in an emergency department (ED), may reflect the natural progression of a disease, the quality of care received during the initial admission or visit, or the quality of the underlying healthcare system.[1, 2, 3, 4, 5, 6, 7, 8, 9, 10] Although national attention has focused on hospital readmissions,[3, 4, 5, 6, 7, 11, 12] ED revisits are a source of concern to emergency physicians.[8, 9] Some ED revisits are medically necessary, but revisits that may be managed in the primary care setting contribute to ED crowding, can be stressful to patients and providers, and increase healthcare costs.[10, 11, 12] Approximately 27 million annual ED visits are made by children, accounting for over one‐quarter of all ED visits in the United States, with a reported ED revisit rate of 2.5% to 5.2%.[2, 13, 14, 15, 16, 17, 18, 19, 20] Improved understanding of the patient‐level or visit‐level factors associated with ED revisits may provide an opportunity to enhance disposition decision making at the index visit and optimize site of and communication around follow‐up care.
Previous studies on ED revisits have largely been conducted in single centers and have used variable visit intervals ranging between 48 hours and 30 days.[2, 13, 16, 18, 21, 22, 23, 24, 25] Two national studies used the National Hospital Ambulatory Medical Care Survey, which includes data from both general and pediatric EDs.[13, 14] Factors identified to be associated with increased odds of returning were: young age, higher acuity, chronic conditions, and public insurance. One national study identified some diagnoses associated with higher likelihood of returning,[13] whereas the other focused primarily on infectious diseaserelated diagnoses.[14]
The purpose of this study was to describe the prevalence of return visits specifically to pediatric EDs and to investigate patient‐level, visit‐level, and healthcare systemrelated factors that may be associated with return visits and hospitalization at return.
METHODS
Study Design and Data Source
This retrospective cohort study used data from the Pediatric Health Information System (PHIS), an administrative database with data from 44 tertiary care pediatric hospitals in 27 US states and the District of Columbia. This database contains patient demographics, diagnoses, and procedures as well as medications, diagnostic imaging, laboratory, and supply charges for each patient. Data are deidentified prior to inclusion; encrypted medical record numbers allow for the identification of individual patients across all ED visits and hospitalizations to the same hospital. The Children's Hospital Association (Overland Park, KS) and participating hospitals jointly assure the quality and integrity of the data. This study was approved by the institutional review board at Boston Children's Hospital with a waiver for informed consent granted.
Study Population and Protocol
To standardize comparisons across the hospitals, we included data from 23 of the 44 hospitals in PHIS; 7 were excluded for not including ED‐specific data. For institutions that collect information from multiple hospitals within their healthcare system, we included only records from the main campus or children's hospital when possible, leading to the exclusion of 9 hospitals where the data were not able to be segregated. As an additional level of data validation, we compared the hospital‐level ED volume and admission rates as reported in the PHIS to those reported to a separate database (the Pediatric Analysis and Comparison Tool). We further excluded 5 hospitals whose volume differed by >10% between these 2 data sources.
Patients <18 years of age who were discharged from these EDs following their index visit in 2012 formed the eligible cohort.
Key Outcome Measures
The primary outcomes were return visits within 72 hours of discharge from the ED, and return visits resulting in hospitalization, including observation status. We defined an ED revisit as a return within 72 hours of ED discharge regardless of whether the patient was subsequently discharged from the ED on the return visit or hospitalized. We assessed revisits within 72 hours of an index ED discharge, because return visits within this time frame are likely to be related to the index visit.[2, 13, 16, 21, 22, 24, 25, 26]
Factors Associated With ED Revisits
A priori, we chose to adjust for the following patient‐level factors: age (<30 days, 30 days<1 year, 14 years, 511 years, 1217 years), gender, and socioeconomic status (SES) measured as the zip codebased median household income, obtained from the 2010 US Census, with respect to the federal poverty level (FPL) (<1.5 FPL, 1.52 FPL, 23 FPL, and >3 FPL).[27] We also adjusted for insurance type (commercial, government, or other), proximity of patient's home zip code to hospital (modeled as the natural log of the geographical distance to patient's home address from the hospital), ED diagnosis‐based severity classification system score (1=low severity, 5=high severity),[28] presence of a complex chronic condition at the index or prior visits using a validated classification scheme,[15, 29, 30, 31] and primary care physician (PCP) density per 100,000 in the patient's residential area (modeled as quartiles: very low, <57.2; low, 57.267.9; medium, 68.078.7; high, >78.8). PCP density, defined by the Dartmouth Atlas of Health Care,[32, 33, 34] is the number of primary care physicians per 100,000 residents (PCP count) in federal health service areas (HSA). Patients were assigned to a corresponding HSA based on their home zip code.
Visit‐level factors included arrival time of index visit (8:01 am 4:00 pm, 4:01 pm12:00 am, 12:01 am8 am representing day, evening, and overnight arrival, respectively), day of the week, season, length of stay (LOS) in the ED during the index visit, and ED crowding (calculated as the average daily LOS/yearly average LOS for the individual ED).[35] We categorized the ED primary diagnosis for each visit using the major diagnosis groupings of a previously described pediatric ED‐specific classification scheme.[36] Using International Classification of Diseases, Ninth Revision (ICD‐9) codes, we identified the conditions with the highest ED revisit rates.
Statistical Analyses
Categorical variables describing the study cohort were summarized using frequencies and percentages. Continuous variables were summarized using mean, median, and interquartile range values, where appropriate. We used 2 different hierarchical logistic regression models to assess revisit rates by patient‐ and visit‐level characteristics. The initial model included all patients discharged from the ED following the index visit and assessed for the outcome of a revisit within 72 hours. The second model considered only patients who returned within 72 hours of an index visit and assessed for hospitalization on that return visit. We used generalized linear mixed effects models, with hospital as a random effect to account for the presence of correlated data (within hospitals), nonconstant variability (across hospitals), and binary responses. Adjusted odds ratios with 95% confidence intervals were used as summary measures of the effect of the individual adjusters. Adjusters were missing in fewer than 5% of patients across participating hospitals. Statistical analyses were performed using SAS version 9.3 (SAS Institute Inc., Cary, NC); 2‐sided P values <0.004 were considered statistically significant to account for multiple comparisons (Bonferroni‐adjusted level of significance=0.0038).
RESULTS
Patients
A total of 1,610,201 patients <18 years of age evaluated across the 23 PHIS EDs in 2012 were included in the study. Twenty‐one of the 23 EDs have academic affiliations; 10 are located in the South, 6 in the Midwest, 5 in the West, and 2 in the Northeast region of the United States. The annual ED volume for these EDs ranged from 25,090 to 136,160 (median, 65,075; interquartile range, 45,28085,206). Of the total patients, 1,415,721 (87.9%) were discharged following the index visit and comprised our study cohort. Of these patients, 47,294 (revisit rate: 3.3%) had an ED revisit within 72 hours. There were 4015 patients (0.3%) who returned more than once within 72 hours, and the largest proportion of these returned with infection‐related conditions. Of those returning, 37,999 (80.3%) were discharged again, whereas 9295 (19.7%) were admitted to the hospital (Figure 1). The demographic and clinical characteristics of study participants are displayed in Table 1.
| Index Visit, n=1,415,721, n (%) | Return Visits Within 72 Hours of Discharge, n=47,294, 3.3% | ||
|---|---|---|---|
| Return to Discharge, n (%) | Return to Admission, n (%) | ||
| |||
| Gender, female | 659,417 (46.6) | 17,665 (46.5) | 4,304 (46.3) |
| Payor | |||
| Commercial | 379,403 (26.8) | 8,388 (22.1) | 3,214 (34.6) |
| Government | 925,147 (65.4) | 26,880 (70.7) | 5,786 (62.3) |
| Other | 111,171 (7.9) | 2,731 (7.2) | 295 (3.2) |
| Age | |||
| <30 days | 19,217 (1.4) | 488 (1.3) | 253 (2.7) |
| 30 days to <1 year | 216,967 (15.3) | 8,280 (21.8) | 2,372 (25.5) |
| 1 year to 4 years | 547,083 (38.6) | 15,542 (40.9) | 3,187 (34.3) |
| 5 years to 11 years | 409,463 (28.9) | 8,906 (23.4) | 1,964 (21.1) |
| 12 years to 17 years | 222,991 (15.8) | 4,783 (12.6) | 1,519 (16.3) |
| Socioeconomic statusa | |||
| <1.5 times FPL | 493,770 (34.9) | 13,851 (36.5) | 2,879 (31.0) |
| 1.5 to 2 times FPL | 455,490 (32.2) | 12,364 (32.5) | 2,904 (31.2) |
| 2 to 3 times FPL | 367,557 (26.0) | 9,560 (25.2) | 2,714 (29.2) |
| >3 times FPL | 98,904 (7.0) | 2,224 (5.9) | 798 (8.6) |
| Primary care physician density per 100,000 patients | |||
| Very low | 351,798 (24.9) | 8,727 (23.0) | 2,628 (28.3) |
| Low | 357,099 (25.2) | 9,810 (25.8) | 2,067 (22.2) |
| Medium | 347,995 (24.6) | 10,186 (26.8) | 2,035 (21.9) |
| High | 358,829 (25.4) | 9,276 (24.4) | 2,565 (27.6) |
| CCC present, yes | 125,774 (8.9) | 4,446 (11.7) | 2,825 (30.4) |
| Severity score | |||
| Low severity (0,1,2) | 721,061 (50.9) | 17,310 (45.6) | 2,955 (31.8) |
| High severity (3,4,5) | 694,660 (49.1) | 20,689 (54.5) | 6,340 (68.2) |
| Time of arrival | |||
| Day | 533,328 (37.7) | 13,449 (35.4) | 3,396 (36.5) |
| Evening | 684,873 (48.4) | 18,417 (48.5) | 4,378 (47.1) |
| Overnight | 197,520 (14.0) | 6,133 (16.1) | 1,521 (16.4) |
| Season | |||
| Winter | 384,957 (27.2) | 10,603 (27.9) | 2,844 (30.6) |
| Spring | 367,434 (26.0) | 9,923 (26.1) | 2,311 (24.9) |
| Summer | 303,872 (21.5) | 8,308 (21.9) | 1,875 (20.2) |
| Fall | 359,458 (25.4) | 9,165 (24.1) | 2,265 (24.4) |
| Weekday/weekend | |||
| Monday | 217,774 (15.4) | 5,646 (14.9) | 1,394 (15) |
| Tuesday | 198,220 (14.0) | 5,054 (13.3) | 1,316 (14.2) |
| Wednesday | 194,295 (13.7) | 4,985 (13.1) | 1,333 (14.3) |
| Thursday | 191,950 (13.6) | 5,123 (13.5) | 1,234 (13.3) |
| Friday | 190,022 (13.4) | 5,449 (14.3) | 1,228 (13.2) |
| Saturday | 202,247 (14.3) | 5,766 (15.2) | 1,364 (14.7) |
| Sunday | 221,213 (15.6) | 5,976 (15.7) | 1,426 (15.3) |
| Distance from hospital in miles, median (IQR) | 8.3 (4.614.9) | 9.2 (4.917.4) | 8.3 (4.614.9) |
| ED crowding score at index visit, median (IQR) | 1.0 (0.91.1) | 1.0 (0.91.1) | 1.0 (0.91.1) |
| ED LOS in hours at index visit, median (IQR) | 2.0 (1.03.0) | 3.0 (2.05.0) | 2.0 (1.03.0) |
ED Revisit Rates and Revisits Resulting in Admission
In multivariate analyses, compared to patients who did not return to the ED, patients who returned within 72 hours of discharge had higher odds of revisit if they had the following characteristics: a chronic condition, were <1 year old, a higher severity score, and public insurance. Visit‐level factors associated with higher odds of revisits included arrival for the index visit during the evening or overnight shift or on a Friday or Saturday, index visit during times of lower ED crowding, and living closer to the hospital. On return, patients were more likely to be hospitalized if they had a higher severity score, a chronic condition, private insurance, or were <30 days old. Visit‐level factors associated with higher odds of hospitalization at revisit included an index visit during the evening and overnight shift and living further from the hospital. Although the median SES and PCP density of a patient's area of residence were not associated with greater likelihood of returning, when they returned, patients residing in an area with a lower SES and higher PCP densities (>78.8 PCPs/100,000) had lower odds of being admitted to the hospital. Patients whose index visit was on a Sunday also had lower odds of being hospitalized upon return (Table 2).
| Characteristic | Adjusted OR of 72‐Hour Revisit (95% CI), n=1,380,723 | P Value | Adjusted OR of 72‐Hour Revisit Admissions (95% CI), n=46,364 | P Value |
|---|---|---|---|---|
| ||||
| Gender | ||||
| Male | 0.99 (0.971.01) | 0.2809 | 1.02 (0.971.07) | 0.5179 |
| Female | Reference | Reference | ||
| Payor | ||||
| Government | 1.14 (1.111.17) | <0.0001 | 0.68 (0.640.72) | <0.0001 |
| Other | 0.97 (0.921.01) | 0.1148 | 0.33 (0.280.39) | <0.0001 |
| Private | Reference | Reference | ||
| Age group | ||||
| 30 days to <1 year | 1.32 (1.221.42) | <0.0001 | 0.58 (0.490.69) | <0.0001 |
| 1 year to 5 years | 0.89 (0.830.96) | 0.003 | 0.41 (0.340.48) | <0.0001 |
| 5 years to 11 years | 0.69 (0.640.74) | <0.0001 | 0.40 (0.330.48) | <0.0001 |
| 12 years to 17 years | 0.72 (0.660.77) | <0.0001 | 0.50 (0.420.60) | <0.0001 |
| <30 days | Reference | Reference | ||
| Socioeconomic statusa | ||||
| % <1.5 times FPL | 0.96 (0.921.01) | 0.0992 | 0.82 (0.740.92) | 0.0005 |
| % 1.5 to 2 times FPL | 0.98 (0.941.02) | 0.2992 | 0.83 (0.750.92) | 0.0005 |
| % 2 to 3 times FPL | 1.02 (0.981.07) | 0.292 | 0.88 (0.790.97) | 0.01 |
| % >3 times FPL | Reference | Reference | ||
| Severity score | ||||
| High severity, 4, 5, 6 | 1.43 (1.401.45) | <0.0001 | 3.42 (3.233.62) | <0.0001 |
| Low severity, 1, 2, 3 | Reference | Reference | ||
| Presence of any CCC | ||||
| Yes | 1.90 (1.861.96) | <0.0001 | 2.92 (2.753.10) | <0.0001 |
| No | Reference | Reference | ||
| Time of arrival | ||||
| Evening | 1.05 (1.031.08) | <0.0001 | 1.37 (1.291.44) | <0.0001 |
| Overnight | 1.19 (1.151.22) | <0.0001 | 1.84 (1.711.97) | <0.0001 |
| Day | Reference | Reference | ||
| Season | ||||
| Winter | 1.09 (1.061.11) | <0.0001 | 1.06 (0.991.14) | 0.0722 |
| Spring | 1.07 (1.041.10) | <0.0001 | 0.98 (0.911.046) | 0.4763 |
| Summer | 1.05 (1.021.08) | 0.0011 | 0.93 (0.871.01) | 0.0729 |
| Fall | Reference | Reference | ||
| Weekday/weekend | ||||
| Thursday | 1.02 (0.9821.055) | 0.3297 | 0.983 (0.8971.078) | 0.7185 |
| Friday | 1.08 (1.041.11) | <0.0001 | 1.03 (0.941.13) | 0.5832 |
| Saturday | 1.08 (1.041.12) | <0.0001 | 0.89 (0.810.97) | 0.0112 |
| Sunday | 1.02 (0.991.06) | 0.2054 | 0.81 (0.740.89) | <0.0001 |
| Monday | 1.00 (0.961.03) | 0.8928 | 0.98 (0.901.07) | 0.6647 |
| Tuesday | 0.99 (0.951.03) | 0.5342 | 0.93 (0.851.02) | 0.1417 |
| Wednesday | Reference | Reference | ||
| PCP ratio per 100,000 patients | ||||
| 57.267.9 | 1.00 (0.961.04) | 0.8844 | 0.93 (0.841.03) | 0.1669 |
| 68.078.7 | 1.00 (0.951.04) | 0.8156 | 0.86 (0.770.96) | 0.0066 |
| >78.8 | 1.00 (0.951.04) | 0.6883 | 0.82 (0.730.92) | 0.001 |
| <57.2 | Reference | Reference | ||
| ED crowding score at index visitb | ||||
| 2 | 0.92 (0.900.95) | <0.0001 | 0.96 (0.881.05) | 0.3435 |
| 1 | Reference | Reference | ||
| Distance from hospitalc | ||||
| 3.168, 23.6 miles | 0.95 (0.940.96) | <0.0001 | 1.16 (1.121.19) | <0.0001 |
| 2.168, 8.7 miles | Reference | Reference | ||
| ED LOS at index visitb | ||||
| 3.7 hours | 1.003 (1.0011.005) | 0.0052 | NA | |
| 2.7 hours | Reference | |||
Diagnoses Associated With Return Visits
Patients with index visit diagnoses of sickle cell disease and leukemia had the highest proportion of return visits (10.7% and 7.3%, respectively). Other conditions with high revisit rates included infectious diseases such as cellulitis, bronchiolitis, and gastroenteritis. Patients with other chronic diseases such as diabetes and with devices, such as gastrostomy tubes, also had high rates of return visits. At return, the rate of hospitalization for these conditions ranged from a 1‐in‐6 chance of hospitalization for the diagnoses of a fever to a 1‐in‐2 chance of hospitalization for patients with sickle cell anemia (Table 3).
| Major Diagnostic Subgroup | No. of Index ED Visit Dischargesa | 72‐Hour Revisit, % (95% CI) | Admitted on Return, % (95% CI) |
|---|---|---|---|
| |||
| Sickle cell anemia | 2,531 | 10.7 (9.511.9) | 49.6 (43.755.6) |
| Neoplastic diseases, cancer | 536 | 7.3 (5.19.5) | 36 (2151) |
| Infectious gastrointestinal diseases | 802 | 7.2 (5.49.0) | 21 (1031) |
| Devices and complications of the circulatory systemb | 1,033 | 6.9 (5.38.4) | 45 (3457) |
| Other hematologic diseasesb | 1,538 | 6.1 (4.97.3) | 33 (2443) |
| Fever | 80,626 | 5.9 (5.76.0) | 16.3 (15.217.3) |
| Dehydration | 7,362 | 5.4 (5.25.5) | 34.6 (30.139) |
| Infectious respiratory diseases | 72,652 | 5.4 (5.25.5) | 28.6 (27.230) |
| Seizures | 17,637 | 5.3 (4.95.6) | 33.3 (30.336.4) |
| Other devices and complicationsb | 1,896 | 5.3 (4.36.3) | 39.0 (29.448.6) |
| Infectious skin, dermatologic and soft tissue diseases | 40,272 | 4.7 (4.55) | 20.0 (18.221.8) |
| Devices and complications of the gastrointestinal systemb | 4,692 | 4.6 (4.05.2) | 24.7 (18.930.4) |
| Vomiting | 44,730 | 4.4 (4.24.6) | 23.7 (21.825.6) |
| Infectious urinary tract diseases | 17,020 | 4.4 (4.14.7) | 25.9 (22.729) |
| Headache | 19,016 | 4.3 (4.14.6) | 28.2 (25.131.3) |
| Diabetes mellitus | 1,531 | 4.5 (3.35.3) | 29 (1840) |
| Abdominal pain | 39,594 | 4.2 (44.4) | 24.8 (22.726.8) |
| Other infectious diseasesb | 647 | 4.2 (2.65.7) | 33 (1651) |
| Gastroenteritis | 55,613 | 4.0 (3.84.1) | 20.6 (18.922.3) |
DISCUSSION
In this nationally representative sample of free‐standing children's hospitals, 3.3% of patients discharged from the ED returned to the same ED within 72 hours. This rate is similar to rates previously published in studies of general EDs.[11, 15] Of the returning children, over 80% were discharged again, and 19.7% were hospitalized, which is two‐thirds more than the admission rate at index visit (12%). In accordance with previous studies,[14, 16, 25] we found higher disease severity, presence of a chronic condition, and younger age were strongly associated with both the odds of patients returning to the ED and of being hospitalized at return. Patients who were hospitalized lived further away from the hospital and were of a higher SES. In this study, we show that visit‐level and access‐related factors are also associated with increased risk of return, although to a lesser degree. Patients seen on a weekend (Friday or Saturday) were found to have higher odds of returning, whereas those seen initially on a Sunday had lower odds of hospitalization at return. In this study, we also found that patients seen on the evening or night shifts at the index presentation had a significant association with return visits and hospitalization at return. Additionally, we found that although PCP density was not associated with the odds of returning to the ED, patients from areas with a higher PCP density were less likely to be admitted at return. In addition, by evaluating the diagnoses of patients who returned, we found that many infectious conditions commonly seen in the ED also had high return rates.
As previously shown,[23] we found that patients with complex and chronic diseases were at risk for ED revisits, especially patients with sickle cell anemia and cancer (mainly acute leukemia). In addition, patients with a chronic condition were 3 times more likely to be hospitalized when they returned. These findings may indicate an opportunity for improved discharge planning and coordination of care with subspecialty care providers for particularly at‐risk populations, or stronger consideration of admission at the index visit. However, admission for these patients at revisit may be unavoidable.
Excluding patients with chronic and complex conditions, the majority of conditions with high revisit rates were acute infectious conditions. One national study showed that >70% of ED revisits by patients with infectious conditions had planned ED follow‐up.[13] Although this study was unable to assess the reasons for return or admission at return, children with infectious diseases often worsen over time (eg, those with bronchiolitis). The relatively low admission rates at return for these conditions, despite evidence that providers may have a lower threshold for admission when a patient returns to the ED shortly after discharge,[24] may reflect the potential for improving follow‐up at the PCP office. However, although some revisits may be prevented,[37, 38] we recognize that an ED visit could be appropriate and necessary for some of these children, especially those without primary care.
Access to primary care and insurance status influence ED utilization.[14, 39, 40, 41] A fragmented healthcare system with poor access to primary care is strongly associated with utilization of the ED for nonurgent care. A high ED revisit rate might be indicative of poor coordination between ED and outpatient services.[9, 39, 42, 43, 44, 45, 46] Our study's finding of increased risk of return visit if the index visit occurred on a Friday or Saturday, and a decreased likelihood of subsequent admission when a patient returns on a Sunday, may suggest limited or perceived limited access to the PCP over a weekend. Although insured patients tend to use the ED less often for nonemergent cases, even when patients have PCPs, they might still choose to return to the ED out of convenience.[47, 48] This may be reflected in our finding that, when adjusted for insurance status and PCP density, patients who lived closer to the hospital were more likely to return, but less likely to be admitted, thereby suggesting proximity as a factor in the decision to return. It is also possible that patients residing further away returned to another institution. Although PCP density did not seem to be associated with revisits, patients who lived in areas with higher PCP density were less likely to be admitted when they returned. In this study, there was a stepwise gradient in the effect of PCP density on the odds of being hospitalized on return with those patients in areas with fewer PCPs being admitted at higher rates on return. Guttmann et al.,[40] in a recent study conducted in Canada where there is universal health insurance, showed that children residing in areas with higher PCP densities had higher rates of PCP visits but lower rates of ED visits compared to children residing in areas with lower PCP densities. It is possible that emergency physicians have more confidence that patients will have dedicated follow‐up when a PCP can be identified. These findings suggest that the development of PCP networks with expanded access, such as alignment of office hours with parent need and patient/parent education about PCP availability, may reduce ED revisits. Alternatively, creation of centralized hospital‐based urgent care centers for evening, night, and weekend visits may benefit both the patient and the PCP and avoid ED revisits and associated costs.
Targeting and eliminating disparities in care might also play a role in reducing ED revisits. Prior studies have shown that publicly insured individuals, in particular, frequently use the ED as their usual source of care and are more likely to return to the ED within 72 hours of an initial visit.[23, 39, 44, 49, 50] Likewise, we found that patients with public insurance were more likely to return but less likely to be admitted on revisit. After controlling for disease severity and other demographic variables, patients with public insurance and of lower socioeconomic status still had lower odds of being hospitalized following a revisit. This might also signify an increase of avoidable hospitalizations among patients of higher SES or with private insurance. Further investigation is needed to explore the reasons for these differences and to identify effective interventions to eliminate disparities.
Our findings have implications for emergency care, ambulatory care, and the larger healthcare system. First, ED revisits are costly and contribute to already overburdened EDs.[10, 11] The average ED visit incurs charges that are 2 to 5 times more than an outpatient office visit.[49, 50] Careful coordination of ambulatory and ED services could not only ensure optimal care for patients, but could save the US healthcare system billions of dollars in potentially avoidable healthcare expenditures.[49, 50] Second, prior studies have demonstrated a consistent relationship between poor access to primary care and increased use of the ED for nonurgent conditions.[42] Publicly insured patients have been shown to have disproportionately increased difficulty acquiring and accessing primary care.[41, 42, 47, 51] Furthermore, conditions with high ED revisit rates are similar to conditions reported by Berry et al.4 as having the highest hospital readmission rates such as cancer, sickle cell anemia, seizure, pneumonia, asthma, and gastroenteritis. This might suggest a close relationship between 72‐hour ED revisits and 30‐day hospital readmissions. In light of the recent expansion of health insurance coverage to an additional 30 million individuals, the need for better coordination of services throughout the entire continuum of care, including primary care, ED, and inpatient services, has never been more important.[52] Future improvements could explore condition‐specific revisit or readmission rates to identify the most effective interventions to reduce the possibly preventable returns.
This study has several limitations. First, as an administrative database, PHIS has limited clinical data, and reasons for return visits could not be assessed. Variations between hospitals in diagnostic coding might also lead to misclassification bias. Second, we were unable to assess return visits to a different ED. Thus, we may have underestimated revisit frequency. However, because children are generally more likely to seek repeat care in the same hospital,[3] we believe our estimate of return visit rate approximates the actual return visit rate; our findings are also similar to previously reported rates. Third, for the PCP density factor, we were unable to account for types of insurance each physician accepted and influence on return rates. Fourth, return visits in our sample could have been for conditions unrelated to the diagnosis at index visit, though the short timeframe considered for revisits makes this less likely. In addition, the crowding index does not include the proportion of occupied beds at the precise moment of the index visit. Finally, this cohort includes only children seen in the EDs of pediatric hospitals, and our findings may not be generalizable to all EDs who provide care for ill and injured children.
We have shown that, in addition to previously identified patient level factors, there are visit‐level and access‐related factors associated with pediatric ED return visits. Eighty percent are discharged again, and almost one‐fifth of returning patients are admitted to the hospital. Admitted patients tend to be younger, sicker, chronically ill, and live farther from the hospital. By being aware of patients' comorbidities, PCP access, as well as certain diagnoses associated with high rates of return, physicians may better target interventions to optimize care. This may include having a lower threshold for hospitalization at the initial visit for children at high risk of return, and communication with the PCP at the time of discharge to ensure close follow‐up. Our study helps to provide benchmarks around ED revisit rates, and may serve as a starting point to better understand variation in care. Future efforts should aim to find creative solutions at individual institutions, with the goal of disseminating and replicating successes more broadly. For example, investigators in Boston have shown that the use of a comprehensive home‐based asthma management program has been successful in decreasing emergency department visits and hospitalization rates.[53] It is possible that this approach could be spread to other institutions to decrease revisits for patients with asthma. As a next step, the authors have undertaken an investigation to identify hospital‐level characteristics that may be associated with rates of return visits.
Acknowledgements
The authors thank the following members of the PHIS ED Return Visits Research Group for their contributions to the data analysis plan and interpretation of results of this study: Rustin Morse, MD, Children's Medical Center of Dallas; Catherine Perron, MD, Boston Children's Hospital; John Cheng, MD, Children's Healthcare of Atlanta; Shabnam Jain, MD, MPH, Children's Healthcare of Atlanta; and Amanda Montalbano, MD, MPH, Children's Mercy Hospitals and Clinics. These contributors did not receive compensation for their help with this work.
Disclosures
A.T.A. and A.M.S. conceived the study and developed the initial study design. All authors were involved in the development of the final study design and data analysis plan. C.W.T. collected and analyzed the data. A.T.A. and C.W.T. had full access to all of the data and take responsibility for the integrity of the data and the accuracy of the data analysis. All authors were involved in the interpretation of the data. A.T.A. drafted the article, and all authors made critical revisions to the initial draft and subsequent versions. A.T.A. and A.M.S. take full responsibility for the article as a whole. The authors report no conflicts of interest.
- Joint policy statement—guidelines for care of children in the emergency department. Pediatrics. 2009;124:1233–1243.
- , , , , . Return visits to a pediatric emergency department. Pediatr Emerg Care. 2004;20:166–171.
- , . Hospital readmission as an accountability measure. JAMA. 2011;305:504–505.
- , , , et al. Hospital utilization and characteristics of patients experiencing recurrent readmissions within children's hospitals. JAMA. 2011;305:682–690.
- , , , et al. Pediatric readmission prevalence and variability across hospitals. JAMA. 2013;309:372–380.
- . Farewell, and don't come back. Health reform gives hospitals a big incentive to send patients home for good. US News World Rep. 2010;147:20, 22–23.
- . CMS' stealth health reform. Plan to reduce readmissions and boost the continuum of care. Hosp Health Netw. 2008;82:24.
- , . Return visits to the emergency department. J Emerg Med. 1987;5:359–362.
- , , , . Emergency department visits after hospital discharge: a missing part of the equation. Ann Emerg Med. 2013;62:145–150.
- , , , , . Quality indicators for high acuity pediatric conditions. Pediatrics. 2013;132:752–762.
- , . Revisiting hospital readmissions. JAMA. 2013;309:398–400.
- , , . Thirty‐day readmissions: the clock is ticking. JAMA. 2013;309:345–346.
- . Patients seen in emergency departments who had a prior visit within the previous 72 h‐National Hospital Ambulatory Medical Care Survey, 2002. Public Health. 2005;119:914–918.
- , , , , . A national depiction of children with return visits to the emergency department within 72 hours, 2001–2007. Pediatr Emerg Care. 2012;28:606–610.
- , , , et al. How well can hospital readmission be predicted in a cohort of hospitalized children? A retrospective, multicenter study. Pediatrics. 2009;123:286–293.
- , , . Unscheduled return visits to the pediatric emergency department‐one‐year experience. Pediatr Emerg Care. 2006;22:545–549.
- , . Return visits to the emergency department among febrile children 3 to 36 months of age. Pediatr Emerg Care. 2011;27:1126–1129.
- , , , . Pediatric emergency department recidivism: demographic characteristics and diagnostic predictors. J Emerg Nurs. 2006;32:131–138.
- Healthcare Cost and Utilization Project. Pediatric emergency department visits in community hospitals from selected states, 2005. Statistical brief #52. Available at: http://www.ncbi.nlm.nih.gov/books/NBK56039. Accessed October 3, 2013.
- , , , , , . Factors influencing infant visits to emergency departments. Pediatrics. 2000;106:1031–1039.
- , , , . Early pediatric emergency department return visits: a prospective patient‐centric assessment. Clin Pediatr (Phila). 2012;51:651–658.
- , , , , . Unscheduled return visits with and without admission post emergency department discharge. J Emerg Med. 2012;43:1110–1118.
- , , , . Unscheduled revisits to a pediatric emergency department: risk factors for children with fever or infection‐related complaints. Pediatr Emerg Care. 2005;21:816–821.
- , , , , . Unscheduled return visits to the emergency department: consequences for triage. Acad Emerg Med. 2013;20:33–39.
- , , , et al. Repeat pediatric visits to a general emergency department. Ann Emerg Med. 1996;28:467–473.
- , , , , . Emergency department revisits. Ann Emerg Med. 1989;18:964–968.
- US Department of Health 19:70–78.
- , , . Pediatric deaths attributable to complex chronic conditions: a population‐based study of Washington State, 1980–1997. Pediatrics. 2000;106:205–209.
- , , , , , . Deaths attributed to pediatric complex chronic conditions: national trends and implications for supportive care services. Pediatrics. 2001;107:E99.
- , , . Where do children with complex chronic conditions die? Patterns in Washington State, 1980–1998. Pediatrics. 2002;109:656–660.
- Dartmouth Atlas of Health Care. Hospital and physician capacity, 2006. Available at: http://www.dartmouthatlas.org/data/topic/topic.aspx?cat=24. Accessed October 7, 2013.
- Dartmouth Atlas of Health Care. Research methods. What is an HSA/HRR? Available at: http://www.dartmouthatlas.org/tools/faq/researchmethods.aspx. Accessed October 7, 2013,.
- Dartmouth Atlas of Health Care. Appendix on the geography of health care in the United States. Available at: http://www.dartmouthatlas.org/downloads/methods/geogappdx.pdf. Accessed October 7, 2013.
- , , . Emergency department crowding: prioritising quantified crowding measures using a Delphi study. Emerg Med J. 2012;29:868–871.
- , , , , . A new diagnosis grouping system for child emergency department visits. Acad Emerg Med. 2010;17:204–213.
- , , , et al. Effectiveness of emergency department asthma management strategies on return visits in children: a population‐based study. Pediatrics. 2007;120:e1402–e1410.
- , , , . Emergency department patients with diabetes have better glycemic control when they have identifiable primary care providers. Acad Emerg Med. 2012;19:650–655.
- , , , , , Newman L. Impact of socioeconomic status on hospital use in New York City. Health Aff (Millwood). 1993;12:162–173.
- , , , , . Primary care physician supply and children's health care use, access, and outcomes: findings from Canada. Pediatrics. 2010;125:1119–1126.
- , , , et al. Insurance status and access to urgent ambulatory care follow‐up appointments. JAMA. 2005;294:1248–1254.
- , . Emergency departments, Medicaid costs, and access to primary care—understanding the link. N Engl J Med. 2012;366:2141–2143.
- Committee on the Future of Emergency Care in the United States Health System. Emergency Care for Children: Growing Pains. Washington, DC: The National Academies Press; 2007.
- Committee on the Future of Emergency Care in the United States Health System. Hospital‐Based Emergency Care: At the Breaking Point. Washington, DC: The National Academies Press; 2007.
- , . Geographic variation in access to care—the relationship with quality. N Engl J Med. 2012;367:3–6.
- , , , , . Trends and characteristics of US emergency department visits, 1997–2007. JAMA. 2010;304:664–670.
- , , , , . Ambulatory visits to hospital emergency departments. Patterns and reasons for use. 24 Hours in the ED Study Group. JAMA. 1996;276:460–465.
- , , , , . Emergency department workload increase: dependence on primary care? J Emerg Med. 2010;38:279–285.
- Network for Excellence in Health Innovation. Leading healthcare research organizations to examine emergency department overuse. New England Research Institute, 2008. Available at: http://www.nehi.net/news/310‐leading‐health‐care‐research‐organizations‐to‐examine‐emergency‐department‐overuse/view. Accessed October 4, 2013.
- Robert Wood Johnson Foundation. Quality field notes: reducing inappropriate emergency department use. Available at: http://www.rwjf.org/en/research‐publications/find‐rwjf‐research/2013/09/quality‐field‐notes–reducing‐inappropriate‐emergency‐department.html.
- Access of Medicaid recipients to outpatient care. N Engl J Med. 1994;330:1426–1430.
- Medicaid policy statement. Pediatrics. 2013;131:e1697–e1706.
- , , , et al. Community asthma initiative: evaluation of a quality improvement program for comprehensive asthma care. Pediatrics. 2012;129:465–472.
© 2014 Society of Hospital Medicine

Shrink Rap News: Brandon Marshall, the NFL, and borderline personality disorder
I am what you’d call an unwilling sports fan – and then just barely – in that I reside in a family where everyone else is riveted by sports, and by football in particular. The National Football League is the backdrop to my home life on Sundays, Mondays, and Thursdays, with Saturday reserved for college football, all the more so since both of my children have attended Big 10 universities. With that as a background, I was delighted when the Sept. 19 episode of the NFL’s “A Football Life,” focused on Brandon Marshall, the Chicago Bears wide receiver who has talked publicly about his personal struggles with borderline personality disorder.
While many psychiatric disorders are stigmatized by people who are unfamiliar with them, borderline personality disorder is likely the illness that gets most stigmatized within our profession. “Borderline” or “Cluster B” are sometimes uttered as code, to mean that a patient is difficult to work with, unlikeable, or perhaps even manipulative. We often blame patients for their behaviors in ways that we don’t when a patient is ill with an Axis I disorder, and few psychiatrists relish the opportunity to work with patients who have borderline personality disorder.

The television episode focused on Marshall’s football career, his legal struggles, and his interpersonal relationships both on and off the playing field. There were spotlights on many of the people who were affected by his troubling behavior. Marshall described his relationship with his best friend and quarterback, Jay Cutler, as, “We’re the couple that really love each other but shouldn’t be together.”
Cutler was interviewed. He described Marshall as an emotional man who loved media attention and who would lose his temper and hang on to grudges. They first played together for the Denver Broncos, and now both men play for the Chicago Bears.
Marshall’s agent was interviewed and made the point that Marshall had “…personally destroyed maybe five of my vacations.” Marshall’s former coach; his wife; his mother; and his psychiatrist, Dr. John Gunderson of McLean Hospital in Belmont, Mass., were all interviewed on the show.
The narrator for “A Football Life” described Marshall’s behavior as erratic, both on and off the field. Film clips were shown of Marshall losing his temper, kicking the ball off the field during a penalty, and celebrating excessively. His mother referred to his outbursts as “hissy fits,” and she noted, “We were all under the impression Brandon could control this.”
Despite his talent as a wide receiver – while playing for the Broncos, Marshall caught more than 100 passes in each of three consecutive seasons – the Broncos traded him to the Miami Dolphins. His career with the Broncos had been marked by a brief suspension for charges of drunk driving and domestic violence, and Marshall had had numerous arrests over the years. He finally was required to have a psychiatric assessment, and Marshall flew to Massachusetts for a day-long evaluation with Dr. Gunderson. Dr. Gunderson described Marshall at that meeting as “hostile and nondisclosing.”
In Miami, Marshall’s behavior continued to be a source of contention. His girlfriend, Michi, described him as remote and withdrawn. After a domestic dispute in which she was charged with stabbing him – charges that both denied and were later dropped – Marshall returned to see Dr. Gunderson and dedicated 3 months of his off-season to getting treatment.
Dr. Gunderson noted that on his return visit, “He was troubled enough by his behaviors and the difficulties they were causing for him.”
With a diagnosis of borderline personality disorder, Marshall became invested in learning about the disorder and devoted his days to intensive treatment, which included group therapy. He discussed the difficulties he has regulating his emotions and noted that he now had strategies to help him maintain control. Cutler noted that Marshall still loses his cool, but he quickly regains his composure, while in the past he could stay angry for days.
The rest of the show went on to document Marshall’s successes. He gained better control of his temper and became less difficult to work with. Coach Tony Sparano was interviewed, and both he and Marshall talked of Sparano’s role in providing emotional support to the football player. He was offered a $30 million contract extension with the Bears. He and Michi married, started the Brandon Marshall Foundation to support mental health education and treatment, and the couple announced in September that they are expecting twins.
Dr. Gunderson noted that Brandon Marshall’s openness about his disorder does a great deal to alleviate the stigma associated with borderline personality disorder.
“He’s an articulate and charismatic male football player,” he said. “This takes it out of the realm of something that’s about weak people.”
The special did not talk about whether Marshall was taking medications – it was implied that he wasn’t – or if he has continued in treatment. We think of borderline personality disorder as being resistant to treatments, and certainly not as a disorder that can be fixed with 3 months of treatment. It was noted that Marshall has some unusual assets in addition to his charismatic personality: He has a vocation he loves and is good at, and he has supportive relationships. A clip was shown of an appearance he and Michi had made on “The View,” where he credited her support as being key to his success.
As psychiatrists, there is a delicate balance when treating patients with personality disorders. On the one hand, we want them to take ownership for their behaviors in the hopes that they will be able to gain some control over them. To balance this, however, personality disorders can be as crippling as any illness we treat in psychiatry, and the prognosis for some people is dismal. While it may be helpful to have a diagnosis and an explanation, it’s not beneficial if the patient sees himself as the victim of an untreatable condition. The television special on Brandon Marshall did a wonderful job of presenting this disorder with a balance – as a problem that happens to people, perhaps because of their difficult childhoods – but one that the individual can learn to take control of in an empowering way.
We might imagine this remains an ongoing struggle for Marshall, not one that was treated and fixed. I, however, enjoyed watching an NFL production with a positive spin on what we think of as being such a devastating psychiatric disorder.
Dr. Miller is a coauthor of “Shrink Rap: Three Psychiatrists Explain Their Work” (Baltimore: Johns Hopkins University Press, 2011).
I am what you’d call an unwilling sports fan – and then just barely – in that I reside in a family where everyone else is riveted by sports, and by football in particular. The National Football League is the backdrop to my home life on Sundays, Mondays, and Thursdays, with Saturday reserved for college football, all the more so since both of my children have attended Big 10 universities. With that as a background, I was delighted when the Sept. 19 episode of the NFL’s “A Football Life,” focused on Brandon Marshall, the Chicago Bears wide receiver who has talked publicly about his personal struggles with borderline personality disorder.
While many psychiatric disorders are stigmatized by people who are unfamiliar with them, borderline personality disorder is likely the illness that gets most stigmatized within our profession. “Borderline” or “Cluster B” are sometimes uttered as code, to mean that a patient is difficult to work with, unlikeable, or perhaps even manipulative. We often blame patients for their behaviors in ways that we don’t when a patient is ill with an Axis I disorder, and few psychiatrists relish the opportunity to work with patients who have borderline personality disorder.
The television episode focused on Marshall’s football career, his legal struggles, and his interpersonal relationships both on and off the playing field. There were spotlights on many of the people who were affected by his troubling behavior. Marshall described his relationship with his best friend and quarterback, Jay Cutler, as, “We’re the couple that really love each other but shouldn’t be together.”
Cutler was interviewed. He described Marshall as an emotional man who loved media attention and who would lose his temper and hang on to grudges. They first played together for the Denver Broncos, and now both men play for the Chicago Bears.
Marshall’s agent was interviewed and made the point that Marshall had “…personally destroyed maybe five of my vacations.” Marshall’s former coach; his wife; his mother; and his psychiatrist, Dr. John Gunderson of McLean Hospital in Belmont, Mass., were all interviewed on the show.
The narrator for “A Football Life” described Marshall’s behavior as erratic, both on and off the field. Film clips were shown of Marshall losing his temper, kicking the ball off the field during a penalty, and celebrating excessively. His mother referred to his outbursts as “hissy fits,” and she noted, “We were all under the impression Brandon could control this.”
Despite his talent as a wide receiver – while playing for the Broncos, Marshall caught more than 100 passes in each of three consecutive seasons – the Broncos traded him to the Miami Dolphins. His career with the Broncos had been marked by a brief suspension for charges of drunk driving and domestic violence, and Marshall had had numerous arrests over the years. He finally was required to have a psychiatric assessment, and Marshall flew to Massachusetts for a day-long evaluation with Dr. Gunderson. Dr. Gunderson described Marshall at that meeting as “hostile and nondisclosing.”
In Miami, Marshall’s behavior continued to be a source of contention. His girlfriend, Michi, described him as remote and withdrawn. After a domestic dispute in which she was charged with stabbing him – charges that both denied and were later dropped – Marshall returned to see Dr. Gunderson and dedicated 3 months of his off-season to getting treatment.
Dr. Gunderson noted that on his return visit, “He was troubled enough by his behaviors and the difficulties they were causing for him.”
With a diagnosis of borderline personality disorder, Marshall became invested in learning about the disorder and devoted his days to intensive treatment, which included group therapy. He discussed the difficulties he has regulating his emotions and noted that he now had strategies to help him maintain control. Cutler noted that Marshall still loses his cool, but he quickly regains his composure, while in the past he could stay angry for days.
The rest of the show went on to document Marshall’s successes. He gained better control of his temper and became less difficult to work with. Coach Tony Sparano was interviewed, and both he and Marshall talked of Sparano’s role in providing emotional support to the football player. He was offered a $30 million contract extension with the Bears. He and Michi married, started the Brandon Marshall Foundation to support mental health education and treatment, and the couple announced in September that they are expecting twins.
Dr. Gunderson noted that Brandon Marshall’s openness about his disorder does a great deal to alleviate the stigma associated with borderline personality disorder.
“He’s an articulate and charismatic male football player,” he said. “This takes it out of the realm of something that’s about weak people.”
The special did not talk about whether Marshall was taking medications – it was implied that he wasn’t – or if he has continued in treatment. We think of borderline personality disorder as being resistant to treatments, and certainly not as a disorder that can be fixed with 3 months of treatment. It was noted that Marshall has some unusual assets in addition to his charismatic personality: He has a vocation he loves and is good at, and he has supportive relationships. A clip was shown of an appearance he and Michi had made on “The View,” where he credited her support as being key to his success.
As psychiatrists, there is a delicate balance when treating patients with personality disorders. On the one hand, we want them to take ownership for their behaviors in the hopes that they will be able to gain some control over them. To balance this, however, personality disorders can be as crippling as any illness we treat in psychiatry, and the prognosis for some people is dismal. While it may be helpful to have a diagnosis and an explanation, it’s not beneficial if the patient sees himself as the victim of an untreatable condition. The television special on Brandon Marshall did a wonderful job of presenting this disorder with a balance – as a problem that happens to people, perhaps because of their difficult childhoods – but one that the individual can learn to take control of in an empowering way.
We might imagine this remains an ongoing struggle for Marshall, not one that was treated and fixed. I, however, enjoyed watching an NFL production with a positive spin on what we think of as being such a devastating psychiatric disorder.
Dr. Miller is a coauthor of “Shrink Rap: Three Psychiatrists Explain Their Work” (Baltimore: Johns Hopkins University Press, 2011).