User login
Managing intrahepatic cholestasis of pregnancy
CASE Pregnant woman with intense itching
A 28-year-old woman (G1P0) is seen for a routine prenatal visit at 32 3/7 weeks’ gestation. She reports having generalized intense itching, including on her palms and soles, that is most intense at night and has been present for approximately 1 week. Her pregnancy is otherwise uncomplicated to date. Physical exam is within normal limits, with no evidence of a skin rash. Cholestasis of pregnancy is suspected, and laboratory tests are ordered, including bile acids and liver transaminases. Test results show that her aspartate transaminase (AST) and alanine transaminase (ALT) levels are mildly elevated at 55 IU/L and 41 IU/L, respectively, and several days later her bile acid level result is 21 µmol/L.
How should this patient be managed?
Intrahepatic cholestasis of pregnancy (ICP) affects 0.5% to 0.7% of pregnant individuals and results in maternal pruritus and elevated serum bile acid levels.1-3 Pruritus in ICP typically is generalized, including occurrence on the palms of the hands and soles of the feet, and it often is reported to be worse at night.4 Up to 25% of pregnant women will develop pruritus during pregnancy but the majority will not have ICP.2,5 Patients with ICP have no associated rash, but clinicians may note excoriations on exam. ICP typically presents in the third trimester of pregnancy but has been reported to occur earlier in gestation.6
Making a diagnosis of ICP
The presence of maternal pruritus in the absence of a skin condition along with elevated levels of serum bile acids are required for the diagnosis of ICP.7 Thus, a thorough history and physical exam is recommended to rule out another skin condition that could potentially explain the patient’s pruritus.
Some controversy exists regarding the bile acid level cutoff that should be used to make a diagnosis of ICP.8 It has been noted that nonfasting serum bile acid levels in pregnancy are considerably higher than those in in the nonpregnant state, and an upper limit of 18 µmol/L has been proposed as a cutoff in pregnancy.9 However, nonfasting total serum bile acids also have been shown to vary considerably by race, with levels 25.8% higher in Black women compared with those in White women and 24.3% higher in Black women compared with those in south Asian women.9 This raises the question of whether we should be using race-specific bile acid values to make a diagnosis of ICP.
Bile acid levels also vary based on whether a patient is in a fasting or postprandial state.10 Despite this variation, most guidelines do not recommend testing fasting bile acid levels as the postprandial state effect overall is small.7,9,11 The Society for Maternal-Fetal Medicine (SMFM) recommends that if a pregnancy-specific bile acid range is available from the laboratory, then the upper limit of normal for pregnancy should be used when making a diagnosis of ICP.7 The SMFM guidelines also acknowledge, however, that pregnancy-specific values rarely are available, and in this case, levels above the upper limit of normal—often 10 µmol/L should be considered diagnostic for ICP until further evidence regarding optimal bile acid cutoff levels in pregnancy becomes available.7
For patients with suspected ICP, liver transaminase levels should be measured in addition to nonfasting serum bile acid levels.7 A thorough history should include assessment for additional symptoms of liver disease, such as changes in weight, appetite, jaundice, excessive fatigue, malaise, and abdominal pain.7 Elevated transaminases levels may be associated with ICP, but they are not necessary for diagnosis. In the absence of additional clinical symptoms that suggest underlying liver disease or severe early onset ICP, additional evaluation beyond nonfasting serum bile acids and liver transaminase levels, such as liver ultrasonography or evaluation for viral or autoimmune hepatitis, is not recommended.7 Obstetric care clinicians should be aware that there is an increased incidence of preeclampsia among patients with ICP, although no specific guidance regarding further recommendations for screening is provided.7

Continue to: Risks associated with ICP...
Risks associated with ICP
For both patients and clinicians, the greatest concern among patients with ICP is the increased risk of stillbirth. Stillbirth risk in ICP appears to be related to serum bile acid levels and has been reported to be highest in patients with bile acid levels greater than 100 µmol/L. A systematic review and meta-analysis of ICP studies demonstrated no increased risk of stillbirth among patients with bile acid levels less than 100 µmol/L.12 These results, however, must be interpreted with extreme caution as the majority of studies included patients with ICP who were actively managed with attempts to mitigate the risk of stillbirth.7
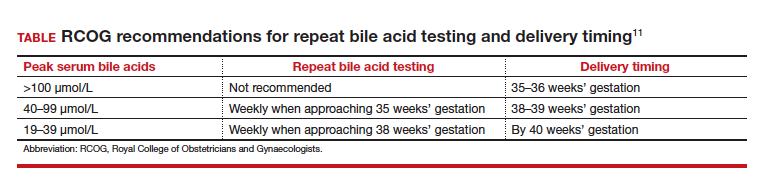
In the absence of additional pregnancy risk factors, the risk of stillbirth among patients with ICP and serum bile acid levels between 19 and 39 µmol/L does not appear to be elevated above their baseline risk.11 The same is true for pregnant individuals with ICP and no additional pregnancy risk factors with serum bile acid levels between 40 and 99 µmol/L until approximately 38 weeks’ gestation, when the risk of stillbirth is elevated.11 The risk of stillbirth is elevated in ICP with peak bile acid levels greater than 100 µmol/L, with an absolute risk of 3.44%.11
Management of patients with ICP
Laboratory evaluation
There is no consensus on the need for repeat testing of bile acid levels in patients with ICP. SMFM advises that follow-up testing of bile acid levels may help to guide delivery timing, especially in cases of severe ICP, but the society recommends against serial testing.7 By contrast, the Royal College of Obstetricians and Gynaecologists (RCOG) provides a detailed algorithm regarding time intervals between serum bile acid level testing to guide delivery timing.11 The TABLE lists the strategy for reassessment of serum bile acid levels in ICP as recommended by the RCOG.11
In the United States, bile acid testing traditionally takes several days as the testing is commonly performed at reference laboratories. We therefore suggest that clinicians consider repeating bile acid level testing in situations in which the timing of delivery may be altered if further elevations of bile acid levels were noted. This is particularly relevant for patients diagnosed with ICP early in the third trimester when repeat bile acid levels would still allow for an adjustment in delivery timing.
Antepartum fetal surveillance
Unfortunately, antepartum fetal testing for pregnant patients with ICP does not appear to reliably predict or prevent stillbirth as several studies have reported stillbirths within days of normal fetal testing.13-16 It is therefore important to counsel pregnant patients regarding monitoring of fetal movements and advise them to present for evaluation if concerns arise.
Currently, SMFM recommends that patients with ICP should begin antenatal fetal surveillance at a gestational age when abnormal fetal testing would result in delivery.7 Patients should be counseled, however, regarding the unpredictability of stillbirth with ICP in the setting of a low absolute risk of such.
Medications
While SMFM recommends a starting dose of ursodeoxycholic acid 10 to 15 mg/kg per day divided into 2 or 3 daily doses as first-line therapy for the treatment of maternal symptoms of ICP, it is important to acknowledge that the goal of treatment is to alleviate maternal symptoms as there is no evidence that ursodeoxycholic acid improves either maternal serum bile acid levels or perinatal outcomes.7,17,18 Since publication of the guidelines, ursodeoxycholic acid’s lack of benefit has been further confirmed in a meta-analysis, and thus discontinuation is not unreasonable in the absence of any improvement in maternal symptoms.18
Timing of delivery
The optimal management of ICP remains unknown. SMFM recommends delivery based on peak serum bile acid levels. Delivery is recommended at 36 weeks’ gestation with ICP and total bile acid levels greater than 100 µmol/L as these patients have the greatest risk of stillbirth.7 For patients with ICP and bile acid levels less than 100 µmol/L, delivery is recommended between 36 0/7 and 39 0/7 weeks’ gestation.7 This is a wide gestational age window for clinicians to consider timing of delivery, and certainly the risks of stillbirth should be carefully balanced with the morbidity associated with a preterm or early term delivery.
For patients with ICP who have bile acid levels greater than 40 µmol/L, it is reasonable to consider delivery earlier in the gestational age window, given an evidence of increased risk of stillbirth after 38 weeks.7,12 For patients with ICP who have bile acid levels less than 40 µmol/L, delivery closer to 39 weeks’ gestation is recommended, as the risk of stillbirth does not appear to be increased above the baseline risk.7,12 Clinicians should be aware that the presence of concomitant morbidities, such as preeclampsia and gestational diabetes, are associated with an increased risk of stillbirth and should be considered for delivery planning.19
Postpartum follow-up
Routine laboratory evaluation following delivery is not recommended.7 However, in the presence of persistent pruritus or other signs and symptoms of hepatobiliary disease, liver function tests should be repeated with referral to hepatology if results are persistently abnormal 4 to 6 weeks postpartum.7
CASE Patient follow-up and outcomes
- Abedin P, Weaver JB, Egginton E. Intrahepatic cholestasis of pregnancy: prevalence and ethnic distribution. Ethn Health. 1999;4:35-37.
- Kenyon AP, Tribe RM, Nelson-Piercy C, et al. Pruritus in pregnancy: a study of anatomical distribution and prevalence in relation to the development of obstetric cholestasis. Obstet Med. 2010;3:25-29.
- Wikstrom Shemer E, Marschall HU, Ludvigsson JF, et al. Intrahepatic cholestasis of pregnancy and associated adverse pregnancy and fetal outcomes: a 12-year population-based cohort study. BJOG. 2013;120:717-723.
- Ambros-Rudolph CM, Glatz M, Trauner M, et al. The importance of serum bile acid level analysis and treatment with ursodeoxycholic acid in intrahepatic cholestasis of pregnancy: a case series from central Europe. Arch Dermatol. 2007;143:757-762.
- Szczech J, Wiatrowski A, Hirnle L, et al. Prevalence and relevance of pruritus in pregnancy. Biomed Res Int. 2017;2017:4238139.
- Geenes V, Williamson C. Intrahepatic cholestasis of pregnancy. World J Gastroenterol. 2009;15:2049-2066.
- Society for Maternal-Fetal Medicine; Lee RH, Greenberg M, Metz TD, et al. Society for Maternal-Fetal Medicine Consult Series #53: intrahepatic cholestasis of pregnancy: replaces Consult #13, April 2011. Am J Obstet Gynecol. 2021;224:B2-B9.
- Horgan R, Bitas C, Abuhamad A. Intrahepatic cholestasis of pregnancy: a comparison of Society for Maternal-Fetal Medicine and the Royal College of Obstetricians and Gynaecologists’ guidelines. Am J Obstet Gynecol MFM. 2023;5:100838.
- Mitchell AL, Ovadia C, Syngelaki A, et al. Re-evaluating diagnostic thresholds for intrahepatic cholestasis of pregnancy: case-control and cohort study. BJOG. 2021;128:1635-1644.
- Adams A, Jacobs K, Vogel RI, et al. Bile acid determination after standardized glucose load in pregnant women. AJP Rep. 2015;5:e168-e171.
- Girling J, Knight CL, Chappell L; Royal College of Obstetricians and Gynaecologists. Intrahepatic cholestasis of pregnancy: Green-top guideline no. 43, June 2022. BJOG. 2022;129:e95-e114.
- Ovadia C, Seed PT, Sklavounos A, et al. Association of adverse perinatal outcomes of intrahepatic cholestasis of pregnancy with biochemical markers: results of aggregate and individual patient data meta-analyses. Lancet. 2019;393:899-909.
- Alsulyman OM, Ouzounian JG, Ames-Castro M, et al. Intrahepatic cholestasis of pregnancy: perinatal outcome associated with expectant management. Am J Obstet Gynecol. 1996;175:957-960.
- Herrera CA, Manuck TA, Stoddard GJ, et al. Perinatal outcomes associated with intrahepatic cholestasis of pregnancy. J Matern Fetal Neonatal Med. 2018;31:1913-1920.
- Lee RH, Incerpi MH, Miller DA, et al. Sudden fetal death in intrahepatic cholestasis of pregnancy. Obstet Gynecol. 2009;113:528-531.
- Sentilhes L, Verspyck E, Pia P, et al. Fetal death in a patient with intrahepatic cholestasis of pregnancy. Obstet Gynecol. 2006;107:458-460.
- Chappell LC, Bell JL, Smith A, et al; PITCHES Study Group. Ursodeoxycholic acid versus placebo in women with intrahepatic cholestasis of pregnancy (PITCHES): a randomised controlled trial. Lancet. 2019;394:849-860.
- Ovadia C, Sajous J, Seed PT, et al. Ursodeoxycholic acid in intrahepatic cholestasis of pregnancy: a systematic review and individual participant data meta-analysis. Lancet Gastroenterol Hepatol. 2021;6:547-558.
- Geenes V, Chappell LC, Seed PT, et al. Association of severe intrahepatic cholestasis of pregnancy with adverse pregnancy outcomes: a prospective population-based case-control study. Hepatology. 2014;59:1482-1491.

Dr. Horgan is a Maternal Fetal Medicine Fellow, Division of Maternal Fetal Medicine, Eastern Virginia Medical School, Norfolk.

Dr. Abuhamad is President, Provost and Dean, Eastern Virginia Medical School, Norfolk.
The authors report no financial relationships relevant to this article.
Dr. Horgan is a Maternal Fetal Medicine Fellow, Division of Maternal Fetal Medicine, Eastern Virginia Medical School, Norfolk.
Dr. Abuhamad is President, Provost and Dean, Eastern Virginia Medical School, Norfolk.
The authors report no financial relationships relevant to this article.
Dr. Horgan is a Maternal Fetal Medicine Fellow, Division of Maternal Fetal Medicine, Eastern Virginia Medical School, Norfolk.
Dr. Abuhamad is President, Provost and Dean, Eastern Virginia Medical School, Norfolk.
The authors report no financial relationships relevant to this article.
CASE Pregnant woman with intense itching
A 28-year-old woman (G1P0) is seen for a routine prenatal visit at 32 3/7 weeks’ gestation. She reports having generalized intense itching, including on her palms and soles, that is most intense at night and has been present for approximately 1 week. Her pregnancy is otherwise uncomplicated to date. Physical exam is within normal limits, with no evidence of a skin rash. Cholestasis of pregnancy is suspected, and laboratory tests are ordered, including bile acids and liver transaminases. Test results show that her aspartate transaminase (AST) and alanine transaminase (ALT) levels are mildly elevated at 55 IU/L and 41 IU/L, respectively, and several days later her bile acid level result is 21 µmol/L.
How should this patient be managed?
Intrahepatic cholestasis of pregnancy (ICP) affects 0.5% to 0.7% of pregnant individuals and results in maternal pruritus and elevated serum bile acid levels.1-3 Pruritus in ICP typically is generalized, including occurrence on the palms of the hands and soles of the feet, and it often is reported to be worse at night.4 Up to 25% of pregnant women will develop pruritus during pregnancy but the majority will not have ICP.2,5 Patients with ICP have no associated rash, but clinicians may note excoriations on exam. ICP typically presents in the third trimester of pregnancy but has been reported to occur earlier in gestation.6
Making a diagnosis of ICP
The presence of maternal pruritus in the absence of a skin condition along with elevated levels of serum bile acids are required for the diagnosis of ICP.7 Thus, a thorough history and physical exam is recommended to rule out another skin condition that could potentially explain the patient’s pruritus.
Some controversy exists regarding the bile acid level cutoff that should be used to make a diagnosis of ICP.8 It has been noted that nonfasting serum bile acid levels in pregnancy are considerably higher than those in in the nonpregnant state, and an upper limit of 18 µmol/L has been proposed as a cutoff in pregnancy.9 However, nonfasting total serum bile acids also have been shown to vary considerably by race, with levels 25.8% higher in Black women compared with those in White women and 24.3% higher in Black women compared with those in south Asian women.9 This raises the question of whether we should be using race-specific bile acid values to make a diagnosis of ICP.
Bile acid levels also vary based on whether a patient is in a fasting or postprandial state.10 Despite this variation, most guidelines do not recommend testing fasting bile acid levels as the postprandial state effect overall is small.7,9,11 The Society for Maternal-Fetal Medicine (SMFM) recommends that if a pregnancy-specific bile acid range is available from the laboratory, then the upper limit of normal for pregnancy should be used when making a diagnosis of ICP.7 The SMFM guidelines also acknowledge, however, that pregnancy-specific values rarely are available, and in this case, levels above the upper limit of normal—often 10 µmol/L should be considered diagnostic for ICP until further evidence regarding optimal bile acid cutoff levels in pregnancy becomes available.7
For patients with suspected ICP, liver transaminase levels should be measured in addition to nonfasting serum bile acid levels.7 A thorough history should include assessment for additional symptoms of liver disease, such as changes in weight, appetite, jaundice, excessive fatigue, malaise, and abdominal pain.7 Elevated transaminases levels may be associated with ICP, but they are not necessary for diagnosis. In the absence of additional clinical symptoms that suggest underlying liver disease or severe early onset ICP, additional evaluation beyond nonfasting serum bile acids and liver transaminase levels, such as liver ultrasonography or evaluation for viral or autoimmune hepatitis, is not recommended.7 Obstetric care clinicians should be aware that there is an increased incidence of preeclampsia among patients with ICP, although no specific guidance regarding further recommendations for screening is provided.7
Continue to: Risks associated with ICP...
Risks associated with ICP
For both patients and clinicians, the greatest concern among patients with ICP is the increased risk of stillbirth. Stillbirth risk in ICP appears to be related to serum bile acid levels and has been reported to be highest in patients with bile acid levels greater than 100 µmol/L. A systematic review and meta-analysis of ICP studies demonstrated no increased risk of stillbirth among patients with bile acid levels less than 100 µmol/L.12 These results, however, must be interpreted with extreme caution as the majority of studies included patients with ICP who were actively managed with attempts to mitigate the risk of stillbirth.7
In the absence of additional pregnancy risk factors, the risk of stillbirth among patients with ICP and serum bile acid levels between 19 and 39 µmol/L does not appear to be elevated above their baseline risk.11 The same is true for pregnant individuals with ICP and no additional pregnancy risk factors with serum bile acid levels between 40 and 99 µmol/L until approximately 38 weeks’ gestation, when the risk of stillbirth is elevated.11 The risk of stillbirth is elevated in ICP with peak bile acid levels greater than 100 µmol/L, with an absolute risk of 3.44%.11
Management of patients with ICP
Laboratory evaluation
There is no consensus on the need for repeat testing of bile acid levels in patients with ICP. SMFM advises that follow-up testing of bile acid levels may help to guide delivery timing, especially in cases of severe ICP, but the society recommends against serial testing.7 By contrast, the Royal College of Obstetricians and Gynaecologists (RCOG) provides a detailed algorithm regarding time intervals between serum bile acid level testing to guide delivery timing.11 The TABLE lists the strategy for reassessment of serum bile acid levels in ICP as recommended by the RCOG.11
In the United States, bile acid testing traditionally takes several days as the testing is commonly performed at reference laboratories. We therefore suggest that clinicians consider repeating bile acid level testing in situations in which the timing of delivery may be altered if further elevations of bile acid levels were noted. This is particularly relevant for patients diagnosed with ICP early in the third trimester when repeat bile acid levels would still allow for an adjustment in delivery timing.
Antepartum fetal surveillance
Unfortunately, antepartum fetal testing for pregnant patients with ICP does not appear to reliably predict or prevent stillbirth as several studies have reported stillbirths within days of normal fetal testing.13-16 It is therefore important to counsel pregnant patients regarding monitoring of fetal movements and advise them to present for evaluation if concerns arise.
Currently, SMFM recommends that patients with ICP should begin antenatal fetal surveillance at a gestational age when abnormal fetal testing would result in delivery.7 Patients should be counseled, however, regarding the unpredictability of stillbirth with ICP in the setting of a low absolute risk of such.
Medications
While SMFM recommends a starting dose of ursodeoxycholic acid 10 to 15 mg/kg per day divided into 2 or 3 daily doses as first-line therapy for the treatment of maternal symptoms of ICP, it is important to acknowledge that the goal of treatment is to alleviate maternal symptoms as there is no evidence that ursodeoxycholic acid improves either maternal serum bile acid levels or perinatal outcomes.7,17,18 Since publication of the guidelines, ursodeoxycholic acid’s lack of benefit has been further confirmed in a meta-analysis, and thus discontinuation is not unreasonable in the absence of any improvement in maternal symptoms.18
Timing of delivery
The optimal management of ICP remains unknown. SMFM recommends delivery based on peak serum bile acid levels. Delivery is recommended at 36 weeks’ gestation with ICP and total bile acid levels greater than 100 µmol/L as these patients have the greatest risk of stillbirth.7 For patients with ICP and bile acid levels less than 100 µmol/L, delivery is recommended between 36 0/7 and 39 0/7 weeks’ gestation.7 This is a wide gestational age window for clinicians to consider timing of delivery, and certainly the risks of stillbirth should be carefully balanced with the morbidity associated with a preterm or early term delivery.
For patients with ICP who have bile acid levels greater than 40 µmol/L, it is reasonable to consider delivery earlier in the gestational age window, given an evidence of increased risk of stillbirth after 38 weeks.7,12 For patients with ICP who have bile acid levels less than 40 µmol/L, delivery closer to 39 weeks’ gestation is recommended, as the risk of stillbirth does not appear to be increased above the baseline risk.7,12 Clinicians should be aware that the presence of concomitant morbidities, such as preeclampsia and gestational diabetes, are associated with an increased risk of stillbirth and should be considered for delivery planning.19
Postpartum follow-up
Routine laboratory evaluation following delivery is not recommended.7 However, in the presence of persistent pruritus or other signs and symptoms of hepatobiliary disease, liver function tests should be repeated with referral to hepatology if results are persistently abnormal 4 to 6 weeks postpartum.7
CASE Patient follow-up and outcomes
CASE Pregnant woman with intense itching
A 28-year-old woman (G1P0) is seen for a routine prenatal visit at 32 3/7 weeks’ gestation. She reports having generalized intense itching, including on her palms and soles, that is most intense at night and has been present for approximately 1 week. Her pregnancy is otherwise uncomplicated to date. Physical exam is within normal limits, with no evidence of a skin rash. Cholestasis of pregnancy is suspected, and laboratory tests are ordered, including bile acids and liver transaminases. Test results show that her aspartate transaminase (AST) and alanine transaminase (ALT) levels are mildly elevated at 55 IU/L and 41 IU/L, respectively, and several days later her bile acid level result is 21 µmol/L.
How should this patient be managed?
Intrahepatic cholestasis of pregnancy (ICP) affects 0.5% to 0.7% of pregnant individuals and results in maternal pruritus and elevated serum bile acid levels.1-3 Pruritus in ICP typically is generalized, including occurrence on the palms of the hands and soles of the feet, and it often is reported to be worse at night.4 Up to 25% of pregnant women will develop pruritus during pregnancy but the majority will not have ICP.2,5 Patients with ICP have no associated rash, but clinicians may note excoriations on exam. ICP typically presents in the third trimester of pregnancy but has been reported to occur earlier in gestation.6
Making a diagnosis of ICP
The presence of maternal pruritus in the absence of a skin condition along with elevated levels of serum bile acids are required for the diagnosis of ICP.7 Thus, a thorough history and physical exam is recommended to rule out another skin condition that could potentially explain the patient’s pruritus.
Some controversy exists regarding the bile acid level cutoff that should be used to make a diagnosis of ICP.8 It has been noted that nonfasting serum bile acid levels in pregnancy are considerably higher than those in in the nonpregnant state, and an upper limit of 18 µmol/L has been proposed as a cutoff in pregnancy.9 However, nonfasting total serum bile acids also have been shown to vary considerably by race, with levels 25.8% higher in Black women compared with those in White women and 24.3% higher in Black women compared with those in south Asian women.9 This raises the question of whether we should be using race-specific bile acid values to make a diagnosis of ICP.
Bile acid levels also vary based on whether a patient is in a fasting or postprandial state.10 Despite this variation, most guidelines do not recommend testing fasting bile acid levels as the postprandial state effect overall is small.7,9,11 The Society for Maternal-Fetal Medicine (SMFM) recommends that if a pregnancy-specific bile acid range is available from the laboratory, then the upper limit of normal for pregnancy should be used when making a diagnosis of ICP.7 The SMFM guidelines also acknowledge, however, that pregnancy-specific values rarely are available, and in this case, levels above the upper limit of normal—often 10 µmol/L should be considered diagnostic for ICP until further evidence regarding optimal bile acid cutoff levels in pregnancy becomes available.7
For patients with suspected ICP, liver transaminase levels should be measured in addition to nonfasting serum bile acid levels.7 A thorough history should include assessment for additional symptoms of liver disease, such as changes in weight, appetite, jaundice, excessive fatigue, malaise, and abdominal pain.7 Elevated transaminases levels may be associated with ICP, but they are not necessary for diagnosis. In the absence of additional clinical symptoms that suggest underlying liver disease or severe early onset ICP, additional evaluation beyond nonfasting serum bile acids and liver transaminase levels, such as liver ultrasonography or evaluation for viral or autoimmune hepatitis, is not recommended.7 Obstetric care clinicians should be aware that there is an increased incidence of preeclampsia among patients with ICP, although no specific guidance regarding further recommendations for screening is provided.7
Continue to: Risks associated with ICP...
Risks associated with ICP
For both patients and clinicians, the greatest concern among patients with ICP is the increased risk of stillbirth. Stillbirth risk in ICP appears to be related to serum bile acid levels and has been reported to be highest in patients with bile acid levels greater than 100 µmol/L. A systematic review and meta-analysis of ICP studies demonstrated no increased risk of stillbirth among patients with bile acid levels less than 100 µmol/L.12 These results, however, must be interpreted with extreme caution as the majority of studies included patients with ICP who were actively managed with attempts to mitigate the risk of stillbirth.7
In the absence of additional pregnancy risk factors, the risk of stillbirth among patients with ICP and serum bile acid levels between 19 and 39 µmol/L does not appear to be elevated above their baseline risk.11 The same is true for pregnant individuals with ICP and no additional pregnancy risk factors with serum bile acid levels between 40 and 99 µmol/L until approximately 38 weeks’ gestation, when the risk of stillbirth is elevated.11 The risk of stillbirth is elevated in ICP with peak bile acid levels greater than 100 µmol/L, with an absolute risk of 3.44%.11
Management of patients with ICP
Laboratory evaluation
There is no consensus on the need for repeat testing of bile acid levels in patients with ICP. SMFM advises that follow-up testing of bile acid levels may help to guide delivery timing, especially in cases of severe ICP, but the society recommends against serial testing.7 By contrast, the Royal College of Obstetricians and Gynaecologists (RCOG) provides a detailed algorithm regarding time intervals between serum bile acid level testing to guide delivery timing.11 The TABLE lists the strategy for reassessment of serum bile acid levels in ICP as recommended by the RCOG.11
In the United States, bile acid testing traditionally takes several days as the testing is commonly performed at reference laboratories. We therefore suggest that clinicians consider repeating bile acid level testing in situations in which the timing of delivery may be altered if further elevations of bile acid levels were noted. This is particularly relevant for patients diagnosed with ICP early in the third trimester when repeat bile acid levels would still allow for an adjustment in delivery timing.
Antepartum fetal surveillance
Unfortunately, antepartum fetal testing for pregnant patients with ICP does not appear to reliably predict or prevent stillbirth as several studies have reported stillbirths within days of normal fetal testing.13-16 It is therefore important to counsel pregnant patients regarding monitoring of fetal movements and advise them to present for evaluation if concerns arise.
Currently, SMFM recommends that patients with ICP should begin antenatal fetal surveillance at a gestational age when abnormal fetal testing would result in delivery.7 Patients should be counseled, however, regarding the unpredictability of stillbirth with ICP in the setting of a low absolute risk of such.
Medications
While SMFM recommends a starting dose of ursodeoxycholic acid 10 to 15 mg/kg per day divided into 2 or 3 daily doses as first-line therapy for the treatment of maternal symptoms of ICP, it is important to acknowledge that the goal of treatment is to alleviate maternal symptoms as there is no evidence that ursodeoxycholic acid improves either maternal serum bile acid levels or perinatal outcomes.7,17,18 Since publication of the guidelines, ursodeoxycholic acid’s lack of benefit has been further confirmed in a meta-analysis, and thus discontinuation is not unreasonable in the absence of any improvement in maternal symptoms.18
Timing of delivery
The optimal management of ICP remains unknown. SMFM recommends delivery based on peak serum bile acid levels. Delivery is recommended at 36 weeks’ gestation with ICP and total bile acid levels greater than 100 µmol/L as these patients have the greatest risk of stillbirth.7 For patients with ICP and bile acid levels less than 100 µmol/L, delivery is recommended between 36 0/7 and 39 0/7 weeks’ gestation.7 This is a wide gestational age window for clinicians to consider timing of delivery, and certainly the risks of stillbirth should be carefully balanced with the morbidity associated with a preterm or early term delivery.
For patients with ICP who have bile acid levels greater than 40 µmol/L, it is reasonable to consider delivery earlier in the gestational age window, given an evidence of increased risk of stillbirth after 38 weeks.7,12 For patients with ICP who have bile acid levels less than 40 µmol/L, delivery closer to 39 weeks’ gestation is recommended, as the risk of stillbirth does not appear to be increased above the baseline risk.7,12 Clinicians should be aware that the presence of concomitant morbidities, such as preeclampsia and gestational diabetes, are associated with an increased risk of stillbirth and should be considered for delivery planning.19
Postpartum follow-up
Routine laboratory evaluation following delivery is not recommended.7 However, in the presence of persistent pruritus or other signs and symptoms of hepatobiliary disease, liver function tests should be repeated with referral to hepatology if results are persistently abnormal 4 to 6 weeks postpartum.7
CASE Patient follow-up and outcomes
- Abedin P, Weaver JB, Egginton E. Intrahepatic cholestasis of pregnancy: prevalence and ethnic distribution. Ethn Health. 1999;4:35-37.
- Kenyon AP, Tribe RM, Nelson-Piercy C, et al. Pruritus in pregnancy: a study of anatomical distribution and prevalence in relation to the development of obstetric cholestasis. Obstet Med. 2010;3:25-29.
- Wikstrom Shemer E, Marschall HU, Ludvigsson JF, et al. Intrahepatic cholestasis of pregnancy and associated adverse pregnancy and fetal outcomes: a 12-year population-based cohort study. BJOG. 2013;120:717-723.
- Ambros-Rudolph CM, Glatz M, Trauner M, et al. The importance of serum bile acid level analysis and treatment with ursodeoxycholic acid in intrahepatic cholestasis of pregnancy: a case series from central Europe. Arch Dermatol. 2007;143:757-762.
- Szczech J, Wiatrowski A, Hirnle L, et al. Prevalence and relevance of pruritus in pregnancy. Biomed Res Int. 2017;2017:4238139.
- Geenes V, Williamson C. Intrahepatic cholestasis of pregnancy. World J Gastroenterol. 2009;15:2049-2066.
- Society for Maternal-Fetal Medicine; Lee RH, Greenberg M, Metz TD, et al. Society for Maternal-Fetal Medicine Consult Series #53: intrahepatic cholestasis of pregnancy: replaces Consult #13, April 2011. Am J Obstet Gynecol. 2021;224:B2-B9.
- Horgan R, Bitas C, Abuhamad A. Intrahepatic cholestasis of pregnancy: a comparison of Society for Maternal-Fetal Medicine and the Royal College of Obstetricians and Gynaecologists’ guidelines. Am J Obstet Gynecol MFM. 2023;5:100838.
- Mitchell AL, Ovadia C, Syngelaki A, et al. Re-evaluating diagnostic thresholds for intrahepatic cholestasis of pregnancy: case-control and cohort study. BJOG. 2021;128:1635-1644.
- Adams A, Jacobs K, Vogel RI, et al. Bile acid determination after standardized glucose load in pregnant women. AJP Rep. 2015;5:e168-e171.
- Girling J, Knight CL, Chappell L; Royal College of Obstetricians and Gynaecologists. Intrahepatic cholestasis of pregnancy: Green-top guideline no. 43, June 2022. BJOG. 2022;129:e95-e114.
- Ovadia C, Seed PT, Sklavounos A, et al. Association of adverse perinatal outcomes of intrahepatic cholestasis of pregnancy with biochemical markers: results of aggregate and individual patient data meta-analyses. Lancet. 2019;393:899-909.
- Alsulyman OM, Ouzounian JG, Ames-Castro M, et al. Intrahepatic cholestasis of pregnancy: perinatal outcome associated with expectant management. Am J Obstet Gynecol. 1996;175:957-960.
- Herrera CA, Manuck TA, Stoddard GJ, et al. Perinatal outcomes associated with intrahepatic cholestasis of pregnancy. J Matern Fetal Neonatal Med. 2018;31:1913-1920.
- Lee RH, Incerpi MH, Miller DA, et al. Sudden fetal death in intrahepatic cholestasis of pregnancy. Obstet Gynecol. 2009;113:528-531.
- Sentilhes L, Verspyck E, Pia P, et al. Fetal death in a patient with intrahepatic cholestasis of pregnancy. Obstet Gynecol. 2006;107:458-460.
- Chappell LC, Bell JL, Smith A, et al; PITCHES Study Group. Ursodeoxycholic acid versus placebo in women with intrahepatic cholestasis of pregnancy (PITCHES): a randomised controlled trial. Lancet. 2019;394:849-860.
- Ovadia C, Sajous J, Seed PT, et al. Ursodeoxycholic acid in intrahepatic cholestasis of pregnancy: a systematic review and individual participant data meta-analysis. Lancet Gastroenterol Hepatol. 2021;6:547-558.
- Geenes V, Chappell LC, Seed PT, et al. Association of severe intrahepatic cholestasis of pregnancy with adverse pregnancy outcomes: a prospective population-based case-control study. Hepatology. 2014;59:1482-1491.
- Abedin P, Weaver JB, Egginton E. Intrahepatic cholestasis of pregnancy: prevalence and ethnic distribution. Ethn Health. 1999;4:35-37.
- Kenyon AP, Tribe RM, Nelson-Piercy C, et al. Pruritus in pregnancy: a study of anatomical distribution and prevalence in relation to the development of obstetric cholestasis. Obstet Med. 2010;3:25-29.
- Wikstrom Shemer E, Marschall HU, Ludvigsson JF, et al. Intrahepatic cholestasis of pregnancy and associated adverse pregnancy and fetal outcomes: a 12-year population-based cohort study. BJOG. 2013;120:717-723.
- Ambros-Rudolph CM, Glatz M, Trauner M, et al. The importance of serum bile acid level analysis and treatment with ursodeoxycholic acid in intrahepatic cholestasis of pregnancy: a case series from central Europe. Arch Dermatol. 2007;143:757-762.
- Szczech J, Wiatrowski A, Hirnle L, et al. Prevalence and relevance of pruritus in pregnancy. Biomed Res Int. 2017;2017:4238139.
- Geenes V, Williamson C. Intrahepatic cholestasis of pregnancy. World J Gastroenterol. 2009;15:2049-2066.
- Society for Maternal-Fetal Medicine; Lee RH, Greenberg M, Metz TD, et al. Society for Maternal-Fetal Medicine Consult Series #53: intrahepatic cholestasis of pregnancy: replaces Consult #13, April 2011. Am J Obstet Gynecol. 2021;224:B2-B9.
- Horgan R, Bitas C, Abuhamad A. Intrahepatic cholestasis of pregnancy: a comparison of Society for Maternal-Fetal Medicine and the Royal College of Obstetricians and Gynaecologists’ guidelines. Am J Obstet Gynecol MFM. 2023;5:100838.
- Mitchell AL, Ovadia C, Syngelaki A, et al. Re-evaluating diagnostic thresholds for intrahepatic cholestasis of pregnancy: case-control and cohort study. BJOG. 2021;128:1635-1644.
- Adams A, Jacobs K, Vogel RI, et al. Bile acid determination after standardized glucose load in pregnant women. AJP Rep. 2015;5:e168-e171.
- Girling J, Knight CL, Chappell L; Royal College of Obstetricians and Gynaecologists. Intrahepatic cholestasis of pregnancy: Green-top guideline no. 43, June 2022. BJOG. 2022;129:e95-e114.
- Ovadia C, Seed PT, Sklavounos A, et al. Association of adverse perinatal outcomes of intrahepatic cholestasis of pregnancy with biochemical markers: results of aggregate and individual patient data meta-analyses. Lancet. 2019;393:899-909.
- Alsulyman OM, Ouzounian JG, Ames-Castro M, et al. Intrahepatic cholestasis of pregnancy: perinatal outcome associated with expectant management. Am J Obstet Gynecol. 1996;175:957-960.
- Herrera CA, Manuck TA, Stoddard GJ, et al. Perinatal outcomes associated with intrahepatic cholestasis of pregnancy. J Matern Fetal Neonatal Med. 2018;31:1913-1920.
- Lee RH, Incerpi MH, Miller DA, et al. Sudden fetal death in intrahepatic cholestasis of pregnancy. Obstet Gynecol. 2009;113:528-531.
- Sentilhes L, Verspyck E, Pia P, et al. Fetal death in a patient with intrahepatic cholestasis of pregnancy. Obstet Gynecol. 2006;107:458-460.
- Chappell LC, Bell JL, Smith A, et al; PITCHES Study Group. Ursodeoxycholic acid versus placebo in women with intrahepatic cholestasis of pregnancy (PITCHES): a randomised controlled trial. Lancet. 2019;394:849-860.
- Ovadia C, Sajous J, Seed PT, et al. Ursodeoxycholic acid in intrahepatic cholestasis of pregnancy: a systematic review and individual participant data meta-analysis. Lancet Gastroenterol Hepatol. 2021;6:547-558.
- Geenes V, Chappell LC, Seed PT, et al. Association of severe intrahepatic cholestasis of pregnancy with adverse pregnancy outcomes: a prospective population-based case-control study. Hepatology. 2014;59:1482-1491.

Research supports CRC screening at age 45
that average risk individuals be screened beginning at age 45.
The ACP, in a new guidance, says that “clinicians should consider not screening asymptomatic average-risk adults between the ages of 45 to 49 years. Clinicians should discuss the uncertainty around benefits and harms of screening in this population.”
The guidance is at odds with the recommendations from the task force, which represents the American College of Gastroenterology, the American Gastroenterological Association, and the American Society for Gastrointestinal Endoscopy. The consensus was that people ages 45 and up should receive CRC screening.
“We’re disappointed that the ACP has suggested to not screen average-risk individuals between the ages of 45 to 49,” said Swati Patel, MD, MS, a member of the USMSTF, the lead author on the recent USMSTF guidance, and associate professor of medicine-gastroenterology at the University of Colorado at Denver, Aurora. “This guidance essentially contradicts these other organizations, and I think from the patient perspective, likely raises a lot of confusion.”
Barbara Jung, MD, AGAF, president of the AGA said in a written statement: “Studies show that colorectal cancer is increasing in younger patients and we have data backing screening for average-risk patients at 45. Bottomline: it saves lives. To release contradictory guidance is reckless.”
Timothy Wilt, MD, MPH, professor of medicine at the University of Minnesota, Minneapolis, and past chair of the guidelines committee at the ACP, said that a key consideration for the ACP was what they considered an “incredibly small” increase in CRC incidence in people under 50 from 2000 to 2019 – from 6.0 per 100,000 to 8.7 per 100,000.
“If I would tell my patients, your chance of colorectal cancer is 6 per 100,000 and now it’s really 9 per 100,000, they would say, ‘No thanks,’ ” he said. “I have trouble getting my patients to take a statin for heart disease when their risk of heart disease in the future is 25%.”
Dr. Patel said that these incidence numbers don’t capture the magnitude of the CRC health burden, because screening historically hadn’t been performed on those under 50. A 2020 study that broke incidence down in single-year increments found a 46% jump from age 49 to age 50, she noted.
“We only diagnose a cancer once we check for it,” she said. The dramatic jump in CRC incidence at age 50 isn’t a sign of new cancer, she said. Rather, these cancers have “been there for years and are cancers that would have been detected between 45 and 49. We just didn’t know about them because patients didn’t get the colonoscopy.”
Data show that 16% of all rectal cancer now occur in patients under 50, she said.
“That is a substantial proportion of all rectal cancers,” she said. “If these trends continue without us doing something about it, that suggests that colon cancer and rectal cancer will be the leading cause of cancer-related death in individuals under the age of 50 by 2030. That’s not that far away.”
Moreover, she said, when the ACP says in its guidance that “the small estimated benefits and harms roughly balance each other out,” it overestimates the risk of CRC screening. The first step, which includes noninvasive options such as a stool-based screen, is no-risk and needs to be followed by a colonoscopy only in a small percentage of cases, she noted. And in recent randomized controlled trials, out of more than 28,000 colonoscopies, there were two perforations, 30 bleeding events, and no deaths.
“I think the ACP statement very much overinflates the risks of screening,” she said.
Dr. Wilt suggested that guidance that flatly recommends that screening should start at age 45 is an overly blunt strategy, not accounting for lower CRC rates among women and varying risk for different races and ethnicities – information that patients should be given in order to make decisions.
“What I would say is, talk to your physicians, ask about the information, make a clinical decision that’s right for you. ... It’s your health,” he said. “We believe our guidance statements are incredibly patient-centered.”
Dr. Patel said that such an approach is not necessarily what patients look for from their physicians.
“I think in theory it’s great to have quote-unquote shared decision-making, and empower the patient to make a decision,” she said. “But generally speaking, patients seek our advice and seek our expertise to synthesize all of this complex data, to provide a recommendation that is driven by those data points.”
The ACP guidance also suggests that “opportunity costs and resources need to be weighed” and that expanding the screening population will take resources away from other medical services.
“We are the front-line docs who have to engage in these conversations,” Dr. Wilt said. “We value our GI and specialty consultants (but) they are not the ones who are there at the front line having to have these discussions.”
Dr. Patel agreed that, with expanded screening, primary care physicians need more support and that “we have a long way to go in providing those support resources.” But she added, “my perspective is that we have to look agnostically at the data.” The data the AGA cites, she added, are peer-reviewed, epidemiological data, not society-generated data.
“I don’t agree with the approach of, even though it’s an additional burden, because we don’t have the resources and time now, to just not proceed,” she said.
“I think our hope would be that practicing physicians – either within the ACP or outside – just have a clear message to patients, that colon cancer is a big deal, it’s increasing in young patients, starting at age 45 you should be screened, and you should use the test that you’re most likely to get done.”
that average risk individuals be screened beginning at age 45.
The ACP, in a new guidance, says that “clinicians should consider not screening asymptomatic average-risk adults between the ages of 45 to 49 years. Clinicians should discuss the uncertainty around benefits and harms of screening in this population.”
The guidance is at odds with the recommendations from the task force, which represents the American College of Gastroenterology, the American Gastroenterological Association, and the American Society for Gastrointestinal Endoscopy. The consensus was that people ages 45 and up should receive CRC screening.
“We’re disappointed that the ACP has suggested to not screen average-risk individuals between the ages of 45 to 49,” said Swati Patel, MD, MS, a member of the USMSTF, the lead author on the recent USMSTF guidance, and associate professor of medicine-gastroenterology at the University of Colorado at Denver, Aurora. “This guidance essentially contradicts these other organizations, and I think from the patient perspective, likely raises a lot of confusion.”
Barbara Jung, MD, AGAF, president of the AGA said in a written statement: “Studies show that colorectal cancer is increasing in younger patients and we have data backing screening for average-risk patients at 45. Bottomline: it saves lives. To release contradictory guidance is reckless.”
Timothy Wilt, MD, MPH, professor of medicine at the University of Minnesota, Minneapolis, and past chair of the guidelines committee at the ACP, said that a key consideration for the ACP was what they considered an “incredibly small” increase in CRC incidence in people under 50 from 2000 to 2019 – from 6.0 per 100,000 to 8.7 per 100,000.
“If I would tell my patients, your chance of colorectal cancer is 6 per 100,000 and now it’s really 9 per 100,000, they would say, ‘No thanks,’ ” he said. “I have trouble getting my patients to take a statin for heart disease when their risk of heart disease in the future is 25%.”
Dr. Patel said that these incidence numbers don’t capture the magnitude of the CRC health burden, because screening historically hadn’t been performed on those under 50. A 2020 study that broke incidence down in single-year increments found a 46% jump from age 49 to age 50, she noted.
“We only diagnose a cancer once we check for it,” she said. The dramatic jump in CRC incidence at age 50 isn’t a sign of new cancer, she said. Rather, these cancers have “been there for years and are cancers that would have been detected between 45 and 49. We just didn’t know about them because patients didn’t get the colonoscopy.”
Data show that 16% of all rectal cancer now occur in patients under 50, she said.
“That is a substantial proportion of all rectal cancers,” she said. “If these trends continue without us doing something about it, that suggests that colon cancer and rectal cancer will be the leading cause of cancer-related death in individuals under the age of 50 by 2030. That’s not that far away.”
Moreover, she said, when the ACP says in its guidance that “the small estimated benefits and harms roughly balance each other out,” it overestimates the risk of CRC screening. The first step, which includes noninvasive options such as a stool-based screen, is no-risk and needs to be followed by a colonoscopy only in a small percentage of cases, she noted. And in recent randomized controlled trials, out of more than 28,000 colonoscopies, there were two perforations, 30 bleeding events, and no deaths.
“I think the ACP statement very much overinflates the risks of screening,” she said.
Dr. Wilt suggested that guidance that flatly recommends that screening should start at age 45 is an overly blunt strategy, not accounting for lower CRC rates among women and varying risk for different races and ethnicities – information that patients should be given in order to make decisions.
“What I would say is, talk to your physicians, ask about the information, make a clinical decision that’s right for you. ... It’s your health,” he said. “We believe our guidance statements are incredibly patient-centered.”
Dr. Patel said that such an approach is not necessarily what patients look for from their physicians.
“I think in theory it’s great to have quote-unquote shared decision-making, and empower the patient to make a decision,” she said. “But generally speaking, patients seek our advice and seek our expertise to synthesize all of this complex data, to provide a recommendation that is driven by those data points.”
The ACP guidance also suggests that “opportunity costs and resources need to be weighed” and that expanding the screening population will take resources away from other medical services.
“We are the front-line docs who have to engage in these conversations,” Dr. Wilt said. “We value our GI and specialty consultants (but) they are not the ones who are there at the front line having to have these discussions.”
Dr. Patel agreed that, with expanded screening, primary care physicians need more support and that “we have a long way to go in providing those support resources.” But she added, “my perspective is that we have to look agnostically at the data.” The data the AGA cites, she added, are peer-reviewed, epidemiological data, not society-generated data.
“I don’t agree with the approach of, even though it’s an additional burden, because we don’t have the resources and time now, to just not proceed,” she said.
“I think our hope would be that practicing physicians – either within the ACP or outside – just have a clear message to patients, that colon cancer is a big deal, it’s increasing in young patients, starting at age 45 you should be screened, and you should use the test that you’re most likely to get done.”
that average risk individuals be screened beginning at age 45.
The ACP, in a new guidance, says that “clinicians should consider not screening asymptomatic average-risk adults between the ages of 45 to 49 years. Clinicians should discuss the uncertainty around benefits and harms of screening in this population.”
The guidance is at odds with the recommendations from the task force, which represents the American College of Gastroenterology, the American Gastroenterological Association, and the American Society for Gastrointestinal Endoscopy. The consensus was that people ages 45 and up should receive CRC screening.
“We’re disappointed that the ACP has suggested to not screen average-risk individuals between the ages of 45 to 49,” said Swati Patel, MD, MS, a member of the USMSTF, the lead author on the recent USMSTF guidance, and associate professor of medicine-gastroenterology at the University of Colorado at Denver, Aurora. “This guidance essentially contradicts these other organizations, and I think from the patient perspective, likely raises a lot of confusion.”
Barbara Jung, MD, AGAF, president of the AGA said in a written statement: “Studies show that colorectal cancer is increasing in younger patients and we have data backing screening for average-risk patients at 45. Bottomline: it saves lives. To release contradictory guidance is reckless.”
Timothy Wilt, MD, MPH, professor of medicine at the University of Minnesota, Minneapolis, and past chair of the guidelines committee at the ACP, said that a key consideration for the ACP was what they considered an “incredibly small” increase in CRC incidence in people under 50 from 2000 to 2019 – from 6.0 per 100,000 to 8.7 per 100,000.
“If I would tell my patients, your chance of colorectal cancer is 6 per 100,000 and now it’s really 9 per 100,000, they would say, ‘No thanks,’ ” he said. “I have trouble getting my patients to take a statin for heart disease when their risk of heart disease in the future is 25%.”
Dr. Patel said that these incidence numbers don’t capture the magnitude of the CRC health burden, because screening historically hadn’t been performed on those under 50. A 2020 study that broke incidence down in single-year increments found a 46% jump from age 49 to age 50, she noted.
“We only diagnose a cancer once we check for it,” she said. The dramatic jump in CRC incidence at age 50 isn’t a sign of new cancer, she said. Rather, these cancers have “been there for years and are cancers that would have been detected between 45 and 49. We just didn’t know about them because patients didn’t get the colonoscopy.”
Data show that 16% of all rectal cancer now occur in patients under 50, she said.
“That is a substantial proportion of all rectal cancers,” she said. “If these trends continue without us doing something about it, that suggests that colon cancer and rectal cancer will be the leading cause of cancer-related death in individuals under the age of 50 by 2030. That’s not that far away.”
Moreover, she said, when the ACP says in its guidance that “the small estimated benefits and harms roughly balance each other out,” it overestimates the risk of CRC screening. The first step, which includes noninvasive options such as a stool-based screen, is no-risk and needs to be followed by a colonoscopy only in a small percentage of cases, she noted. And in recent randomized controlled trials, out of more than 28,000 colonoscopies, there were two perforations, 30 bleeding events, and no deaths.
“I think the ACP statement very much overinflates the risks of screening,” she said.
Dr. Wilt suggested that guidance that flatly recommends that screening should start at age 45 is an overly blunt strategy, not accounting for lower CRC rates among women and varying risk for different races and ethnicities – information that patients should be given in order to make decisions.
“What I would say is, talk to your physicians, ask about the information, make a clinical decision that’s right for you. ... It’s your health,” he said. “We believe our guidance statements are incredibly patient-centered.”
Dr. Patel said that such an approach is not necessarily what patients look for from their physicians.
“I think in theory it’s great to have quote-unquote shared decision-making, and empower the patient to make a decision,” she said. “But generally speaking, patients seek our advice and seek our expertise to synthesize all of this complex data, to provide a recommendation that is driven by those data points.”
The ACP guidance also suggests that “opportunity costs and resources need to be weighed” and that expanding the screening population will take resources away from other medical services.
“We are the front-line docs who have to engage in these conversations,” Dr. Wilt said. “We value our GI and specialty consultants (but) they are not the ones who are there at the front line having to have these discussions.”
Dr. Patel agreed that, with expanded screening, primary care physicians need more support and that “we have a long way to go in providing those support resources.” But she added, “my perspective is that we have to look agnostically at the data.” The data the AGA cites, she added, are peer-reviewed, epidemiological data, not society-generated data.
“I don’t agree with the approach of, even though it’s an additional burden, because we don’t have the resources and time now, to just not proceed,” she said.
“I think our hope would be that practicing physicians – either within the ACP or outside – just have a clear message to patients, that colon cancer is a big deal, it’s increasing in young patients, starting at age 45 you should be screened, and you should use the test that you’re most likely to get done.”
Simpler method of adenoma detection rate might be possible, study suggests
The findings, published earlier this year in Gastroenterology, point to a potentially simpler approach to the ADR, an established colonoscopy quality metric that measures the percentage of colonoscopies in which at least one adenoma was found, the researchers said, because of the complexities posed by separating out screening colonoscopies from those for other indications.
“Methods for ascertaining colonoscopy indication include manual review, electronic medical record queries, and text string searches of colonoscopy reports, which are resource-intensive and subject to misclassification,” said the researchers, led by Douglas Corley, MD, PhD, MPH, and Christopher Jensen, PhD, researchers at Kaiser Permanente Northern California. “These barriers have impeded the universal adoption of screening ADR reporting and suggest the need for a simpler, valid alternative to screening ADR.”
The analysis included Kaiser Permanente Northern California, Kaiser Permanente Southern California, Kaiser Permanente Washington, and the University of Texas Southwestern’s Parkland Memorial Hospital – large, demographically diverse, community-based health systems with 45 endoscopy centers and covering about 3% of the U.S. population. The data that were assessed covered 487 endoscopists who performed 1,046,916 cancer-negative colonoscopies from January 2011 to June 2019.
The median overall ADR was 36.3%; the median screening, ADR 29.7%; the diagnostic ADR, 37.1%; and the surveillance ADR, 48.6%.
No matter the colonoscopy indication, the researchers found, ADRs were similarly inversely related to the risk of post-colonoscopy colorectal cancer (PCCRC) rate. For patients of physicians with ADRs of 45% or more, using the group with a less than 25% ADR as the reference group, the risk hazard ratio for the overall ADRs was 0.44, and for the screening ADRs, it was 0.43.
Researchers also found that the quartile of overall ADR had a similar overall predictive ability for PCCRC to the quartile of screening ADR – both with a C-statistic of 0.71.
The overall ADR did just about as well as the screening ADR in identifying physician performance quartile groupings – especially in the case of the lowest quartile. Among the 293 endoscopists who performed colonoscopies in 2017-2018, for instance, 62 of the 73 providers who were in the lowest quartile for screening ADR were also in the lowest quartile for the overall ADR, the researchers found. And there were no providers who differed by more than one quartile.
When considering all quartiles, 69.6% of endoscopists had identical quartile rankings for overall ADR and screening ADR, 29.4% differed by one quartile, and only 1% differed by two quartiles.
The inclination to use screening colonoscopies to compute ADR metrics was intended to promote uniformity in the field, but this might not be the best practice, the researchers suggest.
“Given the large differences in screening ADRs between settings and the potential for indication misclassification, it is not clear that restricting ADR calculations to screening colonoscopies allows for a more ‘apples-to-apples’ comparison across settings than methods that include all colonoscopies,” they said. “The current study found that overall ADR as a quality metric performed similarly to screening ADR for predicting PCCRC and identifying the same providers in the lowest quartile. In addition, it is simpler to calculate, not susceptible to indication misclassification or potential provider-related biases, and more precise because it includes many more colonoscopies.”
In an editorial that was published in Gastroenterology, Jill Tinmouth, MD, PhD, University of Toronto, and Catherine Dubé, MD, University of Ottawa, noted that measuring ADR is valuable only if it improves the quality of colonoscopies.
“Ultimately, this new approach to measuring ADR and identifying underperformance is only valuable if it leads to improvement in colonoscopy quality. The approach proposed by Corley et al. should make it easier for facilities, screening programs, and jurisdictions to measure ADR, and this is an important first step. However, to move the dial on quality, reporting ADR needs to be accompanied by physician uptake of strategies to improve their colonoscopy performance, that is, split-dose bowel preparation, proper insertion and withdrawal techniques ([e.g.], careful cleaning and inspection and turning the patient, when possible), and improved polypectomy skills,” they wrote.
The authors disclosed no conflicts of interest.
The findings, published earlier this year in Gastroenterology, point to a potentially simpler approach to the ADR, an established colonoscopy quality metric that measures the percentage of colonoscopies in which at least one adenoma was found, the researchers said, because of the complexities posed by separating out screening colonoscopies from those for other indications.
“Methods for ascertaining colonoscopy indication include manual review, electronic medical record queries, and text string searches of colonoscopy reports, which are resource-intensive and subject to misclassification,” said the researchers, led by Douglas Corley, MD, PhD, MPH, and Christopher Jensen, PhD, researchers at Kaiser Permanente Northern California. “These barriers have impeded the universal adoption of screening ADR reporting and suggest the need for a simpler, valid alternative to screening ADR.”
The analysis included Kaiser Permanente Northern California, Kaiser Permanente Southern California, Kaiser Permanente Washington, and the University of Texas Southwestern’s Parkland Memorial Hospital – large, demographically diverse, community-based health systems with 45 endoscopy centers and covering about 3% of the U.S. population. The data that were assessed covered 487 endoscopists who performed 1,046,916 cancer-negative colonoscopies from January 2011 to June 2019.
The median overall ADR was 36.3%; the median screening, ADR 29.7%; the diagnostic ADR, 37.1%; and the surveillance ADR, 48.6%.
No matter the colonoscopy indication, the researchers found, ADRs were similarly inversely related to the risk of post-colonoscopy colorectal cancer (PCCRC) rate. For patients of physicians with ADRs of 45% or more, using the group with a less than 25% ADR as the reference group, the risk hazard ratio for the overall ADRs was 0.44, and for the screening ADRs, it was 0.43.
Researchers also found that the quartile of overall ADR had a similar overall predictive ability for PCCRC to the quartile of screening ADR – both with a C-statistic of 0.71.
The overall ADR did just about as well as the screening ADR in identifying physician performance quartile groupings – especially in the case of the lowest quartile. Among the 293 endoscopists who performed colonoscopies in 2017-2018, for instance, 62 of the 73 providers who were in the lowest quartile for screening ADR were also in the lowest quartile for the overall ADR, the researchers found. And there were no providers who differed by more than one quartile.
When considering all quartiles, 69.6% of endoscopists had identical quartile rankings for overall ADR and screening ADR, 29.4% differed by one quartile, and only 1% differed by two quartiles.
The inclination to use screening colonoscopies to compute ADR metrics was intended to promote uniformity in the field, but this might not be the best practice, the researchers suggest.
“Given the large differences in screening ADRs between settings and the potential for indication misclassification, it is not clear that restricting ADR calculations to screening colonoscopies allows for a more ‘apples-to-apples’ comparison across settings than methods that include all colonoscopies,” they said. “The current study found that overall ADR as a quality metric performed similarly to screening ADR for predicting PCCRC and identifying the same providers in the lowest quartile. In addition, it is simpler to calculate, not susceptible to indication misclassification or potential provider-related biases, and more precise because it includes many more colonoscopies.”
In an editorial that was published in Gastroenterology, Jill Tinmouth, MD, PhD, University of Toronto, and Catherine Dubé, MD, University of Ottawa, noted that measuring ADR is valuable only if it improves the quality of colonoscopies.
“Ultimately, this new approach to measuring ADR and identifying underperformance is only valuable if it leads to improvement in colonoscopy quality. The approach proposed by Corley et al. should make it easier for facilities, screening programs, and jurisdictions to measure ADR, and this is an important first step. However, to move the dial on quality, reporting ADR needs to be accompanied by physician uptake of strategies to improve their colonoscopy performance, that is, split-dose bowel preparation, proper insertion and withdrawal techniques ([e.g.], careful cleaning and inspection and turning the patient, when possible), and improved polypectomy skills,” they wrote.
The authors disclosed no conflicts of interest.
The findings, published earlier this year in Gastroenterology, point to a potentially simpler approach to the ADR, an established colonoscopy quality metric that measures the percentage of colonoscopies in which at least one adenoma was found, the researchers said, because of the complexities posed by separating out screening colonoscopies from those for other indications.
“Methods for ascertaining colonoscopy indication include manual review, electronic medical record queries, and text string searches of colonoscopy reports, which are resource-intensive and subject to misclassification,” said the researchers, led by Douglas Corley, MD, PhD, MPH, and Christopher Jensen, PhD, researchers at Kaiser Permanente Northern California. “These barriers have impeded the universal adoption of screening ADR reporting and suggest the need for a simpler, valid alternative to screening ADR.”
The analysis included Kaiser Permanente Northern California, Kaiser Permanente Southern California, Kaiser Permanente Washington, and the University of Texas Southwestern’s Parkland Memorial Hospital – large, demographically diverse, community-based health systems with 45 endoscopy centers and covering about 3% of the U.S. population. The data that were assessed covered 487 endoscopists who performed 1,046,916 cancer-negative colonoscopies from January 2011 to June 2019.
The median overall ADR was 36.3%; the median screening, ADR 29.7%; the diagnostic ADR, 37.1%; and the surveillance ADR, 48.6%.
No matter the colonoscopy indication, the researchers found, ADRs were similarly inversely related to the risk of post-colonoscopy colorectal cancer (PCCRC) rate. For patients of physicians with ADRs of 45% or more, using the group with a less than 25% ADR as the reference group, the risk hazard ratio for the overall ADRs was 0.44, and for the screening ADRs, it was 0.43.
Researchers also found that the quartile of overall ADR had a similar overall predictive ability for PCCRC to the quartile of screening ADR – both with a C-statistic of 0.71.
The overall ADR did just about as well as the screening ADR in identifying physician performance quartile groupings – especially in the case of the lowest quartile. Among the 293 endoscopists who performed colonoscopies in 2017-2018, for instance, 62 of the 73 providers who were in the lowest quartile for screening ADR were also in the lowest quartile for the overall ADR, the researchers found. And there were no providers who differed by more than one quartile.
When considering all quartiles, 69.6% of endoscopists had identical quartile rankings for overall ADR and screening ADR, 29.4% differed by one quartile, and only 1% differed by two quartiles.
The inclination to use screening colonoscopies to compute ADR metrics was intended to promote uniformity in the field, but this might not be the best practice, the researchers suggest.
“Given the large differences in screening ADRs between settings and the potential for indication misclassification, it is not clear that restricting ADR calculations to screening colonoscopies allows for a more ‘apples-to-apples’ comparison across settings than methods that include all colonoscopies,” they said. “The current study found that overall ADR as a quality metric performed similarly to screening ADR for predicting PCCRC and identifying the same providers in the lowest quartile. In addition, it is simpler to calculate, not susceptible to indication misclassification or potential provider-related biases, and more precise because it includes many more colonoscopies.”
In an editorial that was published in Gastroenterology, Jill Tinmouth, MD, PhD, University of Toronto, and Catherine Dubé, MD, University of Ottawa, noted that measuring ADR is valuable only if it improves the quality of colonoscopies.
“Ultimately, this new approach to measuring ADR and identifying underperformance is only valuable if it leads to improvement in colonoscopy quality. The approach proposed by Corley et al. should make it easier for facilities, screening programs, and jurisdictions to measure ADR, and this is an important first step. However, to move the dial on quality, reporting ADR needs to be accompanied by physician uptake of strategies to improve their colonoscopy performance, that is, split-dose bowel preparation, proper insertion and withdrawal techniques ([e.g.], careful cleaning and inspection and turning the patient, when possible), and improved polypectomy skills,” they wrote.
The authors disclosed no conflicts of interest.
FROM GASTROENTEROLOGY
Bulevirtide shows promise in chronic hepatitis D
shows an ongoing phase 3 study conducted in the United States and four other countries.
The findings were published in the New England Journal of Medicine.
Led by Heiner Wedemeyer, MD, of Hannover Medical School in Germany, the study included 150 patients with HDV, with and without compensated cirrhosis (mean age, 42 years; 57% male; 83% White). They were randomly assigned to receive 2 mg or 10 mg of bulevirtide subcutaneously daily for 144 weeks or, as a control group, receive no treatment for 48 weeks, followed by 10 mg of bulevirtide daily for 96 weeks. All patients were followed for 96 weeks after treatment ends.
For the primary endpoint, the combined viral and ALT response at week 48 was similar in the 2-mg (45%) and 10-mg (48%) groups, compared with 2% in the control group (one patient). Twelve percent of patients in the 2-mg group and 20% of patients in the 10-mg group had a clinical benefit, compared with none of the patients in the control group.
Among those with a combined response, normalization of the ALT level occurred in most patients by week 24, while the HDV RNA level continued to decline between week 24 and week 48, the authors wrote.
“This surrogate end point is considered to be a reasonably likely predictor of improved clinical outcomes in patients with HDV; however, longer-term data are needed to confirm the clinical benefit of bulevirtide,” the investigators wrote.
The results offer a glimmer of hope, Marc Ghany, MD, MHSc, of the National Institute of Diabetes and Digestive and Kidney Diseases wrote in an accompanying editorial. “The goal of HDV therapy is to improve patient survival by preventing progression to cirrhosis, liver failure, and liver cancer,” he wrote.
In safety results, headache, pruritus, fatigue, and eosinophilia were more common in the bulevirtide groups than in the control group. All adverse events were mild to moderate.
HDV infects about 5% of people with chronic HBV and relies on HBV surface antigen (HBsAg) for transmission and infectivity. Bulevirtide is derived from a region of the large envelope protein of HBsAg and irreversibly binds to the hepatocyte entry receptor for both HDV and HBV.
Bulevirtide has received conditional approval in the European Union. In 2022, the Food and Drug Administration declined to approve bulevirtide over concerns about production and delivery of the drug. There are no approved treatments for HDV in the United States.
The study was supported by Gilead Sciences. Dr. Wedemeyer disclosed research funding, acting as a consultant to, and giving paid lectures on behalf of Gilead Sciences. He and other coauthors disclosed financial relationships with Gilead and other pharmaceutical companies.
shows an ongoing phase 3 study conducted in the United States and four other countries.
The findings were published in the New England Journal of Medicine.
Led by Heiner Wedemeyer, MD, of Hannover Medical School in Germany, the study included 150 patients with HDV, with and without compensated cirrhosis (mean age, 42 years; 57% male; 83% White). They were randomly assigned to receive 2 mg or 10 mg of bulevirtide subcutaneously daily for 144 weeks or, as a control group, receive no treatment for 48 weeks, followed by 10 mg of bulevirtide daily for 96 weeks. All patients were followed for 96 weeks after treatment ends.
For the primary endpoint, the combined viral and ALT response at week 48 was similar in the 2-mg (45%) and 10-mg (48%) groups, compared with 2% in the control group (one patient). Twelve percent of patients in the 2-mg group and 20% of patients in the 10-mg group had a clinical benefit, compared with none of the patients in the control group.
Among those with a combined response, normalization of the ALT level occurred in most patients by week 24, while the HDV RNA level continued to decline between week 24 and week 48, the authors wrote.
“This surrogate end point is considered to be a reasonably likely predictor of improved clinical outcomes in patients with HDV; however, longer-term data are needed to confirm the clinical benefit of bulevirtide,” the investigators wrote.
The results offer a glimmer of hope, Marc Ghany, MD, MHSc, of the National Institute of Diabetes and Digestive and Kidney Diseases wrote in an accompanying editorial. “The goal of HDV therapy is to improve patient survival by preventing progression to cirrhosis, liver failure, and liver cancer,” he wrote.
In safety results, headache, pruritus, fatigue, and eosinophilia were more common in the bulevirtide groups than in the control group. All adverse events were mild to moderate.
HDV infects about 5% of people with chronic HBV and relies on HBV surface antigen (HBsAg) for transmission and infectivity. Bulevirtide is derived from a region of the large envelope protein of HBsAg and irreversibly binds to the hepatocyte entry receptor for both HDV and HBV.
Bulevirtide has received conditional approval in the European Union. In 2022, the Food and Drug Administration declined to approve bulevirtide over concerns about production and delivery of the drug. There are no approved treatments for HDV in the United States.
The study was supported by Gilead Sciences. Dr. Wedemeyer disclosed research funding, acting as a consultant to, and giving paid lectures on behalf of Gilead Sciences. He and other coauthors disclosed financial relationships with Gilead and other pharmaceutical companies.
shows an ongoing phase 3 study conducted in the United States and four other countries.
The findings were published in the New England Journal of Medicine.
Led by Heiner Wedemeyer, MD, of Hannover Medical School in Germany, the study included 150 patients with HDV, with and without compensated cirrhosis (mean age, 42 years; 57% male; 83% White). They were randomly assigned to receive 2 mg or 10 mg of bulevirtide subcutaneously daily for 144 weeks or, as a control group, receive no treatment for 48 weeks, followed by 10 mg of bulevirtide daily for 96 weeks. All patients were followed for 96 weeks after treatment ends.
For the primary endpoint, the combined viral and ALT response at week 48 was similar in the 2-mg (45%) and 10-mg (48%) groups, compared with 2% in the control group (one patient). Twelve percent of patients in the 2-mg group and 20% of patients in the 10-mg group had a clinical benefit, compared with none of the patients in the control group.
Among those with a combined response, normalization of the ALT level occurred in most patients by week 24, while the HDV RNA level continued to decline between week 24 and week 48, the authors wrote.
“This surrogate end point is considered to be a reasonably likely predictor of improved clinical outcomes in patients with HDV; however, longer-term data are needed to confirm the clinical benefit of bulevirtide,” the investigators wrote.
The results offer a glimmer of hope, Marc Ghany, MD, MHSc, of the National Institute of Diabetes and Digestive and Kidney Diseases wrote in an accompanying editorial. “The goal of HDV therapy is to improve patient survival by preventing progression to cirrhosis, liver failure, and liver cancer,” he wrote.
In safety results, headache, pruritus, fatigue, and eosinophilia were more common in the bulevirtide groups than in the control group. All adverse events were mild to moderate.
HDV infects about 5% of people with chronic HBV and relies on HBV surface antigen (HBsAg) for transmission and infectivity. Bulevirtide is derived from a region of the large envelope protein of HBsAg and irreversibly binds to the hepatocyte entry receptor for both HDV and HBV.
Bulevirtide has received conditional approval in the European Union. In 2022, the Food and Drug Administration declined to approve bulevirtide over concerns about production and delivery of the drug. There are no approved treatments for HDV in the United States.
The study was supported by Gilead Sciences. Dr. Wedemeyer disclosed research funding, acting as a consultant to, and giving paid lectures on behalf of Gilead Sciences. He and other coauthors disclosed financial relationships with Gilead and other pharmaceutical companies.
FROM NEW ENGLAND JOURNAL OF MEDICINE
Four factors complicate treating OUD in primary care
Four themes in responses to a survey describe the multilevel barriers that make it difficult for primary care teams to incorporate medication for opioid use disorder (MOUD) in their practices, according to research published in JAMA Network Open.
Elizabeth J. Austin, PhD, MPH, with the department of health systems and population health at the University of Washington, Seattle, and colleagues describe the four major themes in the answers:
- Structural barriers delay or limit primary care team responsiveness to patients needing opioid-related care.
- Patient engagement was more challenging than expected.
- Prescribing physicians needed tools and to be able to see the patients on an ongoing basis.
- Teams had conflicting views on expanding MOUD care.
The survey
The researchers used a cohort of 12 clinics diverse in geography and structure and explored the experiences multidisciplinary primary care teams had in expanding MOUD services, such as use of buprenorphine and naltrexone.
A sample of 62 team members completed the survey for a response rate of 77%. Two-thirds (66%) identified as female and 46 (74%) identified as White. Evaluation of responses occurred between 2020 and 2022 in a sample of primary care clinics that agreed to participate in the Collaborating to Heal Addiction and Mental Health in Primary Care (CHAMP) study. The trial is ongoing.
Rigid scheduling a barrier
Some respondents said inflexible scheduling tied their hands.
One clinician responded, “[M]y practice has been really busy right now ... it’s been tough to find openings for my current patients as it is.”
Others described closed or limited patient panels, often set by their health systems. Twenty clinicians (32%) said they were worried their clinic couldn’t accommodate the volume of patients seeking OUD treatment.
Some reported productivity pressure from their health systems to keep the schedule full, which doesn’t allow for walk-in patients needing MOUD.
Frustration with no-shows
Some responses indicated frustration in locating patients and with no-shows.
One responded, “[W]e can’t find these people for months and months. [...] I’m spending 3 weeks, 4 weeks, trying to get them in.” Another said, “[I]t’s frustrating when patients don’t show up when they have been referred.”
Margret Chang, MD, a primary care doctor at Tri-River Family Health Center of Worcester, Mass., who was not part of the study, said the four categories the authors describe ring true.
Stigma for providers and patients
Dr. Chang said the biggest overarching part of those barriers comes down to stigma, but she says it’s not just a problem for patients, but for providers as well.
In fact, a responder in the Austin et al. survey wrote, “Our faculty group as a whole has expressed that that’s not the direction they want for our clinic; we already provide more psychiatric care and addiction medicine than other clinics, but we can’t be like the addiction medicine clinic in town either.”
Dr. Chang’s clinic, on the other hand, recruits addicted patients to their primary care practice by making a local drug court, addiction-support services in the community, and their colleagues in the UMass Health System aware that their services are available. Patients also refer their friends to the clinic and the clinic has a steady influx.
“I honestly feel that primary care is the discipline that really should be involved in substance disorder treatment,” says Dr. Chang, who is an assistant professor of medicine and the addiction curriculum director for internal medicine at UMass Chan Medical School, Worcester. “In medicine there’s a huge stigma around even being able to help these patients even though we have medications that are pretty effective.”
She runs a medication-assisted treatment program and said her semirural clinic and one other are the only two primary care clinics in the Worcester area with such a program.
Patients also have “huge inertia around taking a medication to recover from addiction or substance abuse,” she says.
Confidence lacking in treating patients
Dr. Chang said primary care residents in recent years are coming out of medical school with knowledge about treating OUD, but they often run into more experienced physicians who didn’t get training in the treatment so they feel intimidated about initiating the treatment.
At their clinic, Dr. Chang says, they have a nurse dedicated to OUD, which helps alleviate some of the barriers described in the survey. Patients know they can contact a particular person at the clinic who is dedicated to their needs. The nurse can track down patients who may miss appointments or be hard to locate so physicians don’t have to add that to their workload. They can collect fluid samples and connect patients to services.
Dr. Chang says a nurse might say, “I see we had you on (buprenorphine-naloxone) for opioid use disorder but I see you also have cocaine in your urine. How can we keep you safe?”
Having a health team member, whether a nurse or medical assistant or social worker, designated to help with people who need OUD treatment really makes a difference, she says.
People living with addiction “have a lot of needs,” she says, “and they are hard to address in the typical template a primary care provider might have.”
Family medicine, she says, has been more open to adding support staff for this population than other specialties.
Coauthor Andrew J. Saxon, MD, reported grants from the National Institute of Mental Health (NIMH) during the conduct of the study as well as personal fees from Indivior and royalties from UpToDate outside the submitted work. Coauthor John C. Fortney, PhD, reported grants from the Patient-Centered Outcomes Research Institute during the conduct of the study. Coauthor Anna D. Ratzliff, MD, PhD, reported grants from the University of Washington during the conduct of the study and royalties from Wiley outside the submitted work. No other disclosures were reported.
This story was updated on 8/15/2023.
Four themes in responses to a survey describe the multilevel barriers that make it difficult for primary care teams to incorporate medication for opioid use disorder (MOUD) in their practices, according to research published in JAMA Network Open.
Elizabeth J. Austin, PhD, MPH, with the department of health systems and population health at the University of Washington, Seattle, and colleagues describe the four major themes in the answers:
- Structural barriers delay or limit primary care team responsiveness to patients needing opioid-related care.
- Patient engagement was more challenging than expected.
- Prescribing physicians needed tools and to be able to see the patients on an ongoing basis.
- Teams had conflicting views on expanding MOUD care.
The survey
The researchers used a cohort of 12 clinics diverse in geography and structure and explored the experiences multidisciplinary primary care teams had in expanding MOUD services, such as use of buprenorphine and naltrexone.
A sample of 62 team members completed the survey for a response rate of 77%. Two-thirds (66%) identified as female and 46 (74%) identified as White. Evaluation of responses occurred between 2020 and 2022 in a sample of primary care clinics that agreed to participate in the Collaborating to Heal Addiction and Mental Health in Primary Care (CHAMP) study. The trial is ongoing.
Rigid scheduling a barrier
Some respondents said inflexible scheduling tied their hands.
One clinician responded, “[M]y practice has been really busy right now ... it’s been tough to find openings for my current patients as it is.”
Others described closed or limited patient panels, often set by their health systems. Twenty clinicians (32%) said they were worried their clinic couldn’t accommodate the volume of patients seeking OUD treatment.
Some reported productivity pressure from their health systems to keep the schedule full, which doesn’t allow for walk-in patients needing MOUD.
Frustration with no-shows
Some responses indicated frustration in locating patients and with no-shows.
One responded, “[W]e can’t find these people for months and months. [...] I’m spending 3 weeks, 4 weeks, trying to get them in.” Another said, “[I]t’s frustrating when patients don’t show up when they have been referred.”
Margret Chang, MD, a primary care doctor at Tri-River Family Health Center of Worcester, Mass., who was not part of the study, said the four categories the authors describe ring true.
Stigma for providers and patients
Dr. Chang said the biggest overarching part of those barriers comes down to stigma, but she says it’s not just a problem for patients, but for providers as well.
In fact, a responder in the Austin et al. survey wrote, “Our faculty group as a whole has expressed that that’s not the direction they want for our clinic; we already provide more psychiatric care and addiction medicine than other clinics, but we can’t be like the addiction medicine clinic in town either.”
Dr. Chang’s clinic, on the other hand, recruits addicted patients to their primary care practice by making a local drug court, addiction-support services in the community, and their colleagues in the UMass Health System aware that their services are available. Patients also refer their friends to the clinic and the clinic has a steady influx.
“I honestly feel that primary care is the discipline that really should be involved in substance disorder treatment,” says Dr. Chang, who is an assistant professor of medicine and the addiction curriculum director for internal medicine at UMass Chan Medical School, Worcester. “In medicine there’s a huge stigma around even being able to help these patients even though we have medications that are pretty effective.”
She runs a medication-assisted treatment program and said her semirural clinic and one other are the only two primary care clinics in the Worcester area with such a program.
Patients also have “huge inertia around taking a medication to recover from addiction or substance abuse,” she says.
Confidence lacking in treating patients
Dr. Chang said primary care residents in recent years are coming out of medical school with knowledge about treating OUD, but they often run into more experienced physicians who didn’t get training in the treatment so they feel intimidated about initiating the treatment.
At their clinic, Dr. Chang says, they have a nurse dedicated to OUD, which helps alleviate some of the barriers described in the survey. Patients know they can contact a particular person at the clinic who is dedicated to their needs. The nurse can track down patients who may miss appointments or be hard to locate so physicians don’t have to add that to their workload. They can collect fluid samples and connect patients to services.
Dr. Chang says a nurse might say, “I see we had you on (buprenorphine-naloxone) for opioid use disorder but I see you also have cocaine in your urine. How can we keep you safe?”
Having a health team member, whether a nurse or medical assistant or social worker, designated to help with people who need OUD treatment really makes a difference, she says.
People living with addiction “have a lot of needs,” she says, “and they are hard to address in the typical template a primary care provider might have.”
Family medicine, she says, has been more open to adding support staff for this population than other specialties.
Coauthor Andrew J. Saxon, MD, reported grants from the National Institute of Mental Health (NIMH) during the conduct of the study as well as personal fees from Indivior and royalties from UpToDate outside the submitted work. Coauthor John C. Fortney, PhD, reported grants from the Patient-Centered Outcomes Research Institute during the conduct of the study. Coauthor Anna D. Ratzliff, MD, PhD, reported grants from the University of Washington during the conduct of the study and royalties from Wiley outside the submitted work. No other disclosures were reported.
This story was updated on 8/15/2023.
Four themes in responses to a survey describe the multilevel barriers that make it difficult for primary care teams to incorporate medication for opioid use disorder (MOUD) in their practices, according to research published in JAMA Network Open.
Elizabeth J. Austin, PhD, MPH, with the department of health systems and population health at the University of Washington, Seattle, and colleagues describe the four major themes in the answers:
- Structural barriers delay or limit primary care team responsiveness to patients needing opioid-related care.
- Patient engagement was more challenging than expected.
- Prescribing physicians needed tools and to be able to see the patients on an ongoing basis.
- Teams had conflicting views on expanding MOUD care.
The survey
The researchers used a cohort of 12 clinics diverse in geography and structure and explored the experiences multidisciplinary primary care teams had in expanding MOUD services, such as use of buprenorphine and naltrexone.
A sample of 62 team members completed the survey for a response rate of 77%. Two-thirds (66%) identified as female and 46 (74%) identified as White. Evaluation of responses occurred between 2020 and 2022 in a sample of primary care clinics that agreed to participate in the Collaborating to Heal Addiction and Mental Health in Primary Care (CHAMP) study. The trial is ongoing.
Rigid scheduling a barrier
Some respondents said inflexible scheduling tied their hands.
One clinician responded, “[M]y practice has been really busy right now ... it’s been tough to find openings for my current patients as it is.”
Others described closed or limited patient panels, often set by their health systems. Twenty clinicians (32%) said they were worried their clinic couldn’t accommodate the volume of patients seeking OUD treatment.
Some reported productivity pressure from their health systems to keep the schedule full, which doesn’t allow for walk-in patients needing MOUD.
Frustration with no-shows
Some responses indicated frustration in locating patients and with no-shows.
One responded, “[W]e can’t find these people for months and months. [...] I’m spending 3 weeks, 4 weeks, trying to get them in.” Another said, “[I]t’s frustrating when patients don’t show up when they have been referred.”
Margret Chang, MD, a primary care doctor at Tri-River Family Health Center of Worcester, Mass., who was not part of the study, said the four categories the authors describe ring true.
Stigma for providers and patients
Dr. Chang said the biggest overarching part of those barriers comes down to stigma, but she says it’s not just a problem for patients, but for providers as well.
In fact, a responder in the Austin et al. survey wrote, “Our faculty group as a whole has expressed that that’s not the direction they want for our clinic; we already provide more psychiatric care and addiction medicine than other clinics, but we can’t be like the addiction medicine clinic in town either.”
Dr. Chang’s clinic, on the other hand, recruits addicted patients to their primary care practice by making a local drug court, addiction-support services in the community, and their colleagues in the UMass Health System aware that their services are available. Patients also refer their friends to the clinic and the clinic has a steady influx.
“I honestly feel that primary care is the discipline that really should be involved in substance disorder treatment,” says Dr. Chang, who is an assistant professor of medicine and the addiction curriculum director for internal medicine at UMass Chan Medical School, Worcester. “In medicine there’s a huge stigma around even being able to help these patients even though we have medications that are pretty effective.”
She runs a medication-assisted treatment program and said her semirural clinic and one other are the only two primary care clinics in the Worcester area with such a program.
Patients also have “huge inertia around taking a medication to recover from addiction or substance abuse,” she says.
Confidence lacking in treating patients
Dr. Chang said primary care residents in recent years are coming out of medical school with knowledge about treating OUD, but they often run into more experienced physicians who didn’t get training in the treatment so they feel intimidated about initiating the treatment.
At their clinic, Dr. Chang says, they have a nurse dedicated to OUD, which helps alleviate some of the barriers described in the survey. Patients know they can contact a particular person at the clinic who is dedicated to their needs. The nurse can track down patients who may miss appointments or be hard to locate so physicians don’t have to add that to their workload. They can collect fluid samples and connect patients to services.
Dr. Chang says a nurse might say, “I see we had you on (buprenorphine-naloxone) for opioid use disorder but I see you also have cocaine in your urine. How can we keep you safe?”
Having a health team member, whether a nurse or medical assistant or social worker, designated to help with people who need OUD treatment really makes a difference, she says.
People living with addiction “have a lot of needs,” she says, “and they are hard to address in the typical template a primary care provider might have.”
Family medicine, she says, has been more open to adding support staff for this population than other specialties.
Coauthor Andrew J. Saxon, MD, reported grants from the National Institute of Mental Health (NIMH) during the conduct of the study as well as personal fees from Indivior and royalties from UpToDate outside the submitted work. Coauthor John C. Fortney, PhD, reported grants from the Patient-Centered Outcomes Research Institute during the conduct of the study. Coauthor Anna D. Ratzliff, MD, PhD, reported grants from the University of Washington during the conduct of the study and royalties from Wiley outside the submitted work. No other disclosures were reported.
This story was updated on 8/15/2023.
FROM JAMA NETWORK OPEN
FDA OKs combo therapy of niraparib, abiraterone acetate for prostate cancer
The Food and Drug Administration has approved niraparib and abiraterone acetate (Akeega, Janssen Pharmaceuticals) to treat BRCA-positive, metastatic castration-resistant prostate cancer in adult patients with deleterious or suspected deleterious disease, as determined by an FDA-approved test.

The FDA’s approval was based on findings from the phase 3 MAGNITUDE precision medicine study, a randomized, placebo-controlled trial with 423 patients, 225 (53%) of whom had BRCA gene mutations as determined using a tissue assay such as FoundationOne CDx.
Among the subgroup with a BRCA mutation, radiographic progression-free survival was a median of 16.6 months vs. 10.9 months (hazard ratio [HR], 0.53; 95% confidence interval [CI], 0.36-0.79; P = .0014). In this subgroup, an exploratory overall survival analysis demonstrated a median of 30.4 months vs. 28.6 months (HR, 0.79; 95% CI, 0.55-1.12), favoring the treatment arm.
Although the overall cohort (those with and without BRCA mutations) demonstrated a significant improvement in radiographic progression-free survival, the subgroup with non-BRCA homologous recombination repair mutations did not demonstrate a significant improvement in radiographic progression-free survival, which indicates that the benefit observed was “primarily attributed” to the results in the subgroup of patients with BRCA mutations, according to the FDA.
The safety profile of niraparib and abiraterone acetate plus prednisone was consistent with the known safety profile of each FDA-approved monotherapy. Serious adverse events occurred in 41% of patients in the treatment arm. These most often included musculoskeletal pain (44% vs. 42%), fatigue (43% vs. 30%), constipation (34% vs. 20%), hypertension (33% vs. 27%), and nausea (33% vs. 21%).
An adverse reaction led to permanent discontinuation of treatment in 15% of patients.
“As a physician, identifying patients with a worse prognosis is a priority, especially those whose cancers have a BRCA mutation,” principal investigator Kim Chi, MD, stated in the Janssen press release. “We prospectively designed the MAGNITUDE study to identify the subset of patients most likely to benefit from targeted treatment with AKEEGA and to help us understand how we can potentially achieve better health outcomes for patients.”
About 10%-15% of patients who develop metastatic castration-resistant prostate cancer have BRCA gene alterations, and those patients are more likely to have aggressive disease, poor outcomes, and shorter survival. Therefore, this new agent “brings an important treatment option to patients with prostate cancer as they consider their road ahead,” said Shelby Moneer, vice president of patient programs and education at ZERO Prostate Cancer.
The prescribing information lists the recommended dose at 200 mg niraparib and 1,000 mg abiraterone once daily in combination with 10 mg of prednisone daily until disease progression or unacceptable toxicity. Patients should also receive a gonadotropin-releasing hormone analog concurrently or should have had bilateral orchiectomy.
Health care professionals should report all serious adverse events suspected to be associated with the use of any medicine and device by using the FDA’s MedWatch Reporting System or by calling 1-800-FDA-1088.
A version of this article appeared on Medscape.com.
The Food and Drug Administration has approved niraparib and abiraterone acetate (Akeega, Janssen Pharmaceuticals) to treat BRCA-positive, metastatic castration-resistant prostate cancer in adult patients with deleterious or suspected deleterious disease, as determined by an FDA-approved test.
The FDA’s approval was based on findings from the phase 3 MAGNITUDE precision medicine study, a randomized, placebo-controlled trial with 423 patients, 225 (53%) of whom had BRCA gene mutations as determined using a tissue assay such as FoundationOne CDx.
Among the subgroup with a BRCA mutation, radiographic progression-free survival was a median of 16.6 months vs. 10.9 months (hazard ratio [HR], 0.53; 95% confidence interval [CI], 0.36-0.79; P = .0014). In this subgroup, an exploratory overall survival analysis demonstrated a median of 30.4 months vs. 28.6 months (HR, 0.79; 95% CI, 0.55-1.12), favoring the treatment arm.
Although the overall cohort (those with and without BRCA mutations) demonstrated a significant improvement in radiographic progression-free survival, the subgroup with non-BRCA homologous recombination repair mutations did not demonstrate a significant improvement in radiographic progression-free survival, which indicates that the benefit observed was “primarily attributed” to the results in the subgroup of patients with BRCA mutations, according to the FDA.
The safety profile of niraparib and abiraterone acetate plus prednisone was consistent with the known safety profile of each FDA-approved monotherapy. Serious adverse events occurred in 41% of patients in the treatment arm. These most often included musculoskeletal pain (44% vs. 42%), fatigue (43% vs. 30%), constipation (34% vs. 20%), hypertension (33% vs. 27%), and nausea (33% vs. 21%).
An adverse reaction led to permanent discontinuation of treatment in 15% of patients.
“As a physician, identifying patients with a worse prognosis is a priority, especially those whose cancers have a BRCA mutation,” principal investigator Kim Chi, MD, stated in the Janssen press release. “We prospectively designed the MAGNITUDE study to identify the subset of patients most likely to benefit from targeted treatment with AKEEGA and to help us understand how we can potentially achieve better health outcomes for patients.”
About 10%-15% of patients who develop metastatic castration-resistant prostate cancer have BRCA gene alterations, and those patients are more likely to have aggressive disease, poor outcomes, and shorter survival. Therefore, this new agent “brings an important treatment option to patients with prostate cancer as they consider their road ahead,” said Shelby Moneer, vice president of patient programs and education at ZERO Prostate Cancer.
The prescribing information lists the recommended dose at 200 mg niraparib and 1,000 mg abiraterone once daily in combination with 10 mg of prednisone daily until disease progression or unacceptable toxicity. Patients should also receive a gonadotropin-releasing hormone analog concurrently or should have had bilateral orchiectomy.
Health care professionals should report all serious adverse events suspected to be associated with the use of any medicine and device by using the FDA’s MedWatch Reporting System or by calling 1-800-FDA-1088.
A version of this article appeared on Medscape.com.
The Food and Drug Administration has approved niraparib and abiraterone acetate (Akeega, Janssen Pharmaceuticals) to treat BRCA-positive, metastatic castration-resistant prostate cancer in adult patients with deleterious or suspected deleterious disease, as determined by an FDA-approved test.
The FDA’s approval was based on findings from the phase 3 MAGNITUDE precision medicine study, a randomized, placebo-controlled trial with 423 patients, 225 (53%) of whom had BRCA gene mutations as determined using a tissue assay such as FoundationOne CDx.
Among the subgroup with a BRCA mutation, radiographic progression-free survival was a median of 16.6 months vs. 10.9 months (hazard ratio [HR], 0.53; 95% confidence interval [CI], 0.36-0.79; P = .0014). In this subgroup, an exploratory overall survival analysis demonstrated a median of 30.4 months vs. 28.6 months (HR, 0.79; 95% CI, 0.55-1.12), favoring the treatment arm.
Although the overall cohort (those with and without BRCA mutations) demonstrated a significant improvement in radiographic progression-free survival, the subgroup with non-BRCA homologous recombination repair mutations did not demonstrate a significant improvement in radiographic progression-free survival, which indicates that the benefit observed was “primarily attributed” to the results in the subgroup of patients with BRCA mutations, according to the FDA.
The safety profile of niraparib and abiraterone acetate plus prednisone was consistent with the known safety profile of each FDA-approved monotherapy. Serious adverse events occurred in 41% of patients in the treatment arm. These most often included musculoskeletal pain (44% vs. 42%), fatigue (43% vs. 30%), constipation (34% vs. 20%), hypertension (33% vs. 27%), and nausea (33% vs. 21%).
An adverse reaction led to permanent discontinuation of treatment in 15% of patients.
“As a physician, identifying patients with a worse prognosis is a priority, especially those whose cancers have a BRCA mutation,” principal investigator Kim Chi, MD, stated in the Janssen press release. “We prospectively designed the MAGNITUDE study to identify the subset of patients most likely to benefit from targeted treatment with AKEEGA and to help us understand how we can potentially achieve better health outcomes for patients.”
About 10%-15% of patients who develop metastatic castration-resistant prostate cancer have BRCA gene alterations, and those patients are more likely to have aggressive disease, poor outcomes, and shorter survival. Therefore, this new agent “brings an important treatment option to patients with prostate cancer as they consider their road ahead,” said Shelby Moneer, vice president of patient programs and education at ZERO Prostate Cancer.
The prescribing information lists the recommended dose at 200 mg niraparib and 1,000 mg abiraterone once daily in combination with 10 mg of prednisone daily until disease progression or unacceptable toxicity. Patients should also receive a gonadotropin-releasing hormone analog concurrently or should have had bilateral orchiectomy.
Health care professionals should report all serious adverse events suspected to be associated with the use of any medicine and device by using the FDA’s MedWatch Reporting System or by calling 1-800-FDA-1088.
A version of this article appeared on Medscape.com.

A better way to measure antidepressant response?
Investigators assessed more than 800 patients with major depressive disorder (MDD) attending a partial hospital program. The patients completed questionnaires about depressive symptoms as well as functioning and broader measures of quality of life (QoL).

Although fewer than 40% were classified as treatment responders on the basis of depressive symptoms, as measured by the Remission from Depression Questionnaire (RDQ), two-thirds met criteria as responders on the Patient Global Rating of Improvement (PGI) scale, which takes into consideration broader domains of life satisfaction.
“The treatments we’re offering patients may be doing a better job than we think in treating depression, because many patients say they feel significantly better, even if their depression symptoms haven’t been diminished by the arbitrary threshold of 50% or greater improvement,” study investigator Mark Zimmerman, MD, professor of psychiatry and human behavior, Brown University, Providence, R.I., told this news organization.
“Many of these patients – even if they have ongoing depressive symptoms – nevertheless say treatment has been very or extremely helpful, which is picked by other emphasizes in outcome, such as functioning, quality of life, coping abilities, and positive mental health,” added Dr. Zimmerman, director of the outpatient division at the Partial Hospital Program, Rhode Island Hospital.
The study was published online in the Annals of Clinical Psychiatry.
What’s the best tool?
“Almost all studies of depression treatment rely on measures of symptom severity to evaluate outcome – which is understandable, because a diagnosis of MDD requires a minimum number of symptoms for a sustained period of time,” said Dr. Zimmerman.
However, while important, symptom reduction is only one component of depression treatment. Improving overall function, QoL, and ability to deal with life’s stressors are equally important, he said.
Dr. Zimmerman emphasized he’s an “advocate, supporter, and practitioner of measurement-based care.” This approach, he said, “increases efficiency of the visit and directs me to the areas I should be inquiring about and the areas that need less time for inquiry.”
Measurement tools also enable numerical documentation of how a patient is doing and helps them understand and recognize their improvement.
The question is which tool captures improvements most effectively. Several surveys show that patients value improved functioning and QoL as primary treatment goals, which “is different from the emphasis of symptom improvement found in research,” said Dr. Zimmerman.
A multidimensional questionnaire that assesses functioning, QoL, and coping ability as well as symptoms is more likely to reflect patients’ treatment goals than simply measuring symptoms, he said.
Dr. Zimmerman and his coauthor reported on findings from the Rhode Island Methods to Improve Diagnostic Assessment and Services (MIDAS) Project, which “examined the concordance between patients’ global rating of improvement from treatment and responder status, based on a depression symptoms severity scale.”
Doing better than we think
The study was conducted in Rhode Island Hospital’s department of psychiatry partial hospital program, where 844 patients with MDD (65.2% women; mean [SD] age, 36.8 [13.9] years) completed the RDQ – a self-report measure that “assesses constructs that patients consider to be relevant for assessing treatment outcome.” This questionnaire assesses symptom and nonsymptom domains that people consider important when evaluating treatment effectiveness.
To the original 41-item questionnaire, the researchers added 19 items. The final 60-item questionnaire included the following:
- 14 depressive symptoms.
- 11 nondepressive symptoms.
- 5 coping ability/stress tolerance items (for instance, “I had trouble handling pressure”).
- 12 positive mental health items (for instance, “I saw myself as a person of value”).
- 10 functioning items (for instance, “I was socially withdrawn”).
- 8 general well-being/life satisfaction items (for instance, “I was engaging in life rather than hiding from it”).
Patients were divided into three groups:
- Symptom responders (whose scores on the RDQ depressive symptom subscale improved by ≥ 50% from admission to discharge).
- PGI responders, who weren’t symptom responders – that is, who reported global improvement but didn’t improve ≥ 50% on the depression symptom subscale.
- Nonresponders (that is, patients who didn’t respond on the PGI and the depressive symptom subscale).
The researchers compared the three groups on the four symptom domains of the RDQ. Patients also completed the PGI on discharge, and the researchers compared these responses to responses to the RDQ.
Only 38.7% were responders on the depressive symptoms subscale, while 67.4% were PGI responders.
Most patients (91.4%) who were responders on the depressive symptom subscale were also PGI responders, while 32% were PGI responders but not responders on the depressive symptom subscale.
Although 29.2% were nonresponders on both measures, 70.8% were responders on one scale or the other.
As far as the nonsymptom domains, response rates varied between 30% (life satisfaction) to 33.1% (positive mental health).
“If you’re using a measurement tool in practice, I’d recommend one that goes beyond symptom improvement and also captures broader domains,” Dr. Zimmerman said.
‘Better enough’
Commenting on the study, Philip Muskin, MD, professor of psychiatry, Columbia University Medical Center, New York, said the use of symptom-driven rating scales to measure depression response originated in mandates of the U.S. Food and Drug Administration to determine whether a drug being tested in a clinical trial is superior to placebo.

“But there has been, for a long time, the question of whether these people are really better,” said Dr. Muskin, who was not involved with the current study. “Symptomatically, they may show improvement, but do they actually perceive themselves as better?”
Some patients might report, “I’m about 75% myself, but not back to 100%.” Dr. Muskin doesn’t “take these to be hard-and-fast numbers, but patients can tell you how they perceive themselves. This study suggests that if you’re wedded to [symptom measurement] scales, you may not realize that patients are actually getting better. And who decides if a patient is better, or better enough? The patient decides that.”
He added that some patients won’t achieve complete remission. “Even if I can’t get the person to be 100% better, I’m glad if I can help them become ‘better enough’ to function in life, do things, go to work, and improve in quality-of-life domains.”
The study received no outside funding. Dr. Zimmerman and his coauthor and Dr. Muskin report no relevant financial relationships.
A version of this article first appeared on Medscape.com.
Investigators assessed more than 800 patients with major depressive disorder (MDD) attending a partial hospital program. The patients completed questionnaires about depressive symptoms as well as functioning and broader measures of quality of life (QoL).
Although fewer than 40% were classified as treatment responders on the basis of depressive symptoms, as measured by the Remission from Depression Questionnaire (RDQ), two-thirds met criteria as responders on the Patient Global Rating of Improvement (PGI) scale, which takes into consideration broader domains of life satisfaction.
“The treatments we’re offering patients may be doing a better job than we think in treating depression, because many patients say they feel significantly better, even if their depression symptoms haven’t been diminished by the arbitrary threshold of 50% or greater improvement,” study investigator Mark Zimmerman, MD, professor of psychiatry and human behavior, Brown University, Providence, R.I., told this news organization.
“Many of these patients – even if they have ongoing depressive symptoms – nevertheless say treatment has been very or extremely helpful, which is picked by other emphasizes in outcome, such as functioning, quality of life, coping abilities, and positive mental health,” added Dr. Zimmerman, director of the outpatient division at the Partial Hospital Program, Rhode Island Hospital.
The study was published online in the Annals of Clinical Psychiatry.
What’s the best tool?
“Almost all studies of depression treatment rely on measures of symptom severity to evaluate outcome – which is understandable, because a diagnosis of MDD requires a minimum number of symptoms for a sustained period of time,” said Dr. Zimmerman.
However, while important, symptom reduction is only one component of depression treatment. Improving overall function, QoL, and ability to deal with life’s stressors are equally important, he said.
Dr. Zimmerman emphasized he’s an “advocate, supporter, and practitioner of measurement-based care.” This approach, he said, “increases efficiency of the visit and directs me to the areas I should be inquiring about and the areas that need less time for inquiry.”
Measurement tools also enable numerical documentation of how a patient is doing and helps them understand and recognize their improvement.
The question is which tool captures improvements most effectively. Several surveys show that patients value improved functioning and QoL as primary treatment goals, which “is different from the emphasis of symptom improvement found in research,” said Dr. Zimmerman.
A multidimensional questionnaire that assesses functioning, QoL, and coping ability as well as symptoms is more likely to reflect patients’ treatment goals than simply measuring symptoms, he said.
Dr. Zimmerman and his coauthor reported on findings from the Rhode Island Methods to Improve Diagnostic Assessment and Services (MIDAS) Project, which “examined the concordance between patients’ global rating of improvement from treatment and responder status, based on a depression symptoms severity scale.”
Doing better than we think
The study was conducted in Rhode Island Hospital’s department of psychiatry partial hospital program, where 844 patients with MDD (65.2% women; mean [SD] age, 36.8 [13.9] years) completed the RDQ – a self-report measure that “assesses constructs that patients consider to be relevant for assessing treatment outcome.” This questionnaire assesses symptom and nonsymptom domains that people consider important when evaluating treatment effectiveness.
To the original 41-item questionnaire, the researchers added 19 items. The final 60-item questionnaire included the following:
- 14 depressive symptoms.
- 11 nondepressive symptoms.
- 5 coping ability/stress tolerance items (for instance, “I had trouble handling pressure”).
- 12 positive mental health items (for instance, “I saw myself as a person of value”).
- 10 functioning items (for instance, “I was socially withdrawn”).
- 8 general well-being/life satisfaction items (for instance, “I was engaging in life rather than hiding from it”).
Patients were divided into three groups:
- Symptom responders (whose scores on the RDQ depressive symptom subscale improved by ≥ 50% from admission to discharge).
- PGI responders, who weren’t symptom responders – that is, who reported global improvement but didn’t improve ≥ 50% on the depression symptom subscale.
- Nonresponders (that is, patients who didn’t respond on the PGI and the depressive symptom subscale).
The researchers compared the three groups on the four symptom domains of the RDQ. Patients also completed the PGI on discharge, and the researchers compared these responses to responses to the RDQ.
Only 38.7% were responders on the depressive symptoms subscale, while 67.4% were PGI responders.
Most patients (91.4%) who were responders on the depressive symptom subscale were also PGI responders, while 32% were PGI responders but not responders on the depressive symptom subscale.
Although 29.2% were nonresponders on both measures, 70.8% were responders on one scale or the other.
As far as the nonsymptom domains, response rates varied between 30% (life satisfaction) to 33.1% (positive mental health).
“If you’re using a measurement tool in practice, I’d recommend one that goes beyond symptom improvement and also captures broader domains,” Dr. Zimmerman said.
‘Better enough’
Commenting on the study, Philip Muskin, MD, professor of psychiatry, Columbia University Medical Center, New York, said the use of symptom-driven rating scales to measure depression response originated in mandates of the U.S. Food and Drug Administration to determine whether a drug being tested in a clinical trial is superior to placebo.
“But there has been, for a long time, the question of whether these people are really better,” said Dr. Muskin, who was not involved with the current study. “Symptomatically, they may show improvement, but do they actually perceive themselves as better?”
Some patients might report, “I’m about 75% myself, but not back to 100%.” Dr. Muskin doesn’t “take these to be hard-and-fast numbers, but patients can tell you how they perceive themselves. This study suggests that if you’re wedded to [symptom measurement] scales, you may not realize that patients are actually getting better. And who decides if a patient is better, or better enough? The patient decides that.”
He added that some patients won’t achieve complete remission. “Even if I can’t get the person to be 100% better, I’m glad if I can help them become ‘better enough’ to function in life, do things, go to work, and improve in quality-of-life domains.”
The study received no outside funding. Dr. Zimmerman and his coauthor and Dr. Muskin report no relevant financial relationships.
A version of this article first appeared on Medscape.com.
Investigators assessed more than 800 patients with major depressive disorder (MDD) attending a partial hospital program. The patients completed questionnaires about depressive symptoms as well as functioning and broader measures of quality of life (QoL).
Although fewer than 40% were classified as treatment responders on the basis of depressive symptoms, as measured by the Remission from Depression Questionnaire (RDQ), two-thirds met criteria as responders on the Patient Global Rating of Improvement (PGI) scale, which takes into consideration broader domains of life satisfaction.
“The treatments we’re offering patients may be doing a better job than we think in treating depression, because many patients say they feel significantly better, even if their depression symptoms haven’t been diminished by the arbitrary threshold of 50% or greater improvement,” study investigator Mark Zimmerman, MD, professor of psychiatry and human behavior, Brown University, Providence, R.I., told this news organization.
“Many of these patients – even if they have ongoing depressive symptoms – nevertheless say treatment has been very or extremely helpful, which is picked by other emphasizes in outcome, such as functioning, quality of life, coping abilities, and positive mental health,” added Dr. Zimmerman, director of the outpatient division at the Partial Hospital Program, Rhode Island Hospital.
The study was published online in the Annals of Clinical Psychiatry.
What’s the best tool?
“Almost all studies of depression treatment rely on measures of symptom severity to evaluate outcome – which is understandable, because a diagnosis of MDD requires a minimum number of symptoms for a sustained period of time,” said Dr. Zimmerman.
However, while important, symptom reduction is only one component of depression treatment. Improving overall function, QoL, and ability to deal with life’s stressors are equally important, he said.
Dr. Zimmerman emphasized he’s an “advocate, supporter, and practitioner of measurement-based care.” This approach, he said, “increases efficiency of the visit and directs me to the areas I should be inquiring about and the areas that need less time for inquiry.”
Measurement tools also enable numerical documentation of how a patient is doing and helps them understand and recognize their improvement.
The question is which tool captures improvements most effectively. Several surveys show that patients value improved functioning and QoL as primary treatment goals, which “is different from the emphasis of symptom improvement found in research,” said Dr. Zimmerman.
A multidimensional questionnaire that assesses functioning, QoL, and coping ability as well as symptoms is more likely to reflect patients’ treatment goals than simply measuring symptoms, he said.
Dr. Zimmerman and his coauthor reported on findings from the Rhode Island Methods to Improve Diagnostic Assessment and Services (MIDAS) Project, which “examined the concordance between patients’ global rating of improvement from treatment and responder status, based on a depression symptoms severity scale.”
Doing better than we think
The study was conducted in Rhode Island Hospital’s department of psychiatry partial hospital program, where 844 patients with MDD (65.2% women; mean [SD] age, 36.8 [13.9] years) completed the RDQ – a self-report measure that “assesses constructs that patients consider to be relevant for assessing treatment outcome.” This questionnaire assesses symptom and nonsymptom domains that people consider important when evaluating treatment effectiveness.
To the original 41-item questionnaire, the researchers added 19 items. The final 60-item questionnaire included the following:
- 14 depressive symptoms.
- 11 nondepressive symptoms.
- 5 coping ability/stress tolerance items (for instance, “I had trouble handling pressure”).
- 12 positive mental health items (for instance, “I saw myself as a person of value”).
- 10 functioning items (for instance, “I was socially withdrawn”).
- 8 general well-being/life satisfaction items (for instance, “I was engaging in life rather than hiding from it”).
Patients were divided into three groups:
- Symptom responders (whose scores on the RDQ depressive symptom subscale improved by ≥ 50% from admission to discharge).
- PGI responders, who weren’t symptom responders – that is, who reported global improvement but didn’t improve ≥ 50% on the depression symptom subscale.
- Nonresponders (that is, patients who didn’t respond on the PGI and the depressive symptom subscale).
The researchers compared the three groups on the four symptom domains of the RDQ. Patients also completed the PGI on discharge, and the researchers compared these responses to responses to the RDQ.
Only 38.7% were responders on the depressive symptoms subscale, while 67.4% were PGI responders.
Most patients (91.4%) who were responders on the depressive symptom subscale were also PGI responders, while 32% were PGI responders but not responders on the depressive symptom subscale.
Although 29.2% were nonresponders on both measures, 70.8% were responders on one scale or the other.
As far as the nonsymptom domains, response rates varied between 30% (life satisfaction) to 33.1% (positive mental health).
“If you’re using a measurement tool in practice, I’d recommend one that goes beyond symptom improvement and also captures broader domains,” Dr. Zimmerman said.
‘Better enough’
Commenting on the study, Philip Muskin, MD, professor of psychiatry, Columbia University Medical Center, New York, said the use of symptom-driven rating scales to measure depression response originated in mandates of the U.S. Food and Drug Administration to determine whether a drug being tested in a clinical trial is superior to placebo.
“But there has been, for a long time, the question of whether these people are really better,” said Dr. Muskin, who was not involved with the current study. “Symptomatically, they may show improvement, but do they actually perceive themselves as better?”
Some patients might report, “I’m about 75% myself, but not back to 100%.” Dr. Muskin doesn’t “take these to be hard-and-fast numbers, but patients can tell you how they perceive themselves. This study suggests that if you’re wedded to [symptom measurement] scales, you may not realize that patients are actually getting better. And who decides if a patient is better, or better enough? The patient decides that.”
He added that some patients won’t achieve complete remission. “Even if I can’t get the person to be 100% better, I’m glad if I can help them become ‘better enough’ to function in life, do things, go to work, and improve in quality-of-life domains.”
The study received no outside funding. Dr. Zimmerman and his coauthor and Dr. Muskin report no relevant financial relationships.
A version of this article first appeared on Medscape.com.
FROM ANNALS OF CLINICAL PSYCHIATRY

Defining difficult-to-treat inflammatory bowel disease
Up until now, one major obstacle has impeded our interpretation of studies focusing on patients suffering from this chronic condition: the lack of standard criteria and terminology among authors.
Under the guidance of the endpoints cluster of the International Organization for the Study of Inflammatory Bowel Disease (IOIBD), a group of experts held a consensus meeting to propose a common operative definition for “difficult-to-treat IBD.” It’s the first step to better understanding this condition and designing targeted studies and interventions.
The definition
After the meeting, the experts agreed that “difficult-to-treat IBD” is defined by these characteristics:
- The failure of biologics and advanced small molecules with at least two different mechanisms of action.
- Postoperative recurrence of Crohn’s disease after two surgical resections in adults or one in children.
- Chronic antibiotic-refractory pouchitis (inflammation of the ileal pouch-anal anastomosis [J-pouch] created in patients with ulcerative colitis who have had total colectomy surgery).
- Complex perianal disease (difficult-to-treat Crohn’s disease).
- Comorbid psychosocial complications that impair disease management (for example, comorbid disorders that obstruct treatment compliance, participation in follow-up visits, or objective assessment of symptoms by clinicians).
The path here
The starting point was the IOIBD-sponsored 2022 global survey in which doctors treating patients with IBD were asked what they thought contributed to difficult-to-treat IBD. Using the responses from that survey, a series of statements were drawn up covering these three main areas: failure of medical and surgical treatments, disease phenotypes, and specific complaints from patients (not limited to bowel disease).
The statements were scrutinized by a 16-person task force made up of experts from eight European countries, Canada, Japan, Israel, and the United States. The project and its findings were published in the journal The Lancet Gastroenterology & Hepatology.
Using the modified Delphi technique, the experts argued for or against the 20 statements proposed. Consensus was achieved for five of these statements (meaning that at least 75% of voters were in agreement).
What does it mean?
“The scope of this consensus initiative was twofold,” explain the authors. “First, we wanted to help standardize study reporting and promote clinical study designs that include patients with difficult-to-treat IBD by proposing common terminology. Second, we hoped to identify, within clinical practice, a group of patients requiring specific treatment or referral to a specialist unit. For patients with conditions resistant to two or more advanced drug types (what is referred to as difficult-to-treat IBD), more aggressive treatment strategies, such as combined therapies or multidisciplinary approaches, should be taken into consideration.
“In the field of rheumatology, the creation of common criteria for difficult-to-treat rheumatoid arthritis has allowed researchers to concentrate their efforts on identifying progressive disease markers, assessing drug efficacy, mechanisms of inefficacy, personalized management strategies, and analyzing the use of health care resources and costs. Similar advances could be achieved in the area of inflammatory bowel disease.”
This article was translated from Univadis Italy. A version appeared on Medscape.com.
Up until now, one major obstacle has impeded our interpretation of studies focusing on patients suffering from this chronic condition: the lack of standard criteria and terminology among authors.
Under the guidance of the endpoints cluster of the International Organization for the Study of Inflammatory Bowel Disease (IOIBD), a group of experts held a consensus meeting to propose a common operative definition for “difficult-to-treat IBD.” It’s the first step to better understanding this condition and designing targeted studies and interventions.
The definition
After the meeting, the experts agreed that “difficult-to-treat IBD” is defined by these characteristics:
- The failure of biologics and advanced small molecules with at least two different mechanisms of action.
- Postoperative recurrence of Crohn’s disease after two surgical resections in adults or one in children.
- Chronic antibiotic-refractory pouchitis (inflammation of the ileal pouch-anal anastomosis [J-pouch] created in patients with ulcerative colitis who have had total colectomy surgery).
- Complex perianal disease (difficult-to-treat Crohn’s disease).
- Comorbid psychosocial complications that impair disease management (for example, comorbid disorders that obstruct treatment compliance, participation in follow-up visits, or objective assessment of symptoms by clinicians).
The path here
The starting point was the IOIBD-sponsored 2022 global survey in which doctors treating patients with IBD were asked what they thought contributed to difficult-to-treat IBD. Using the responses from that survey, a series of statements were drawn up covering these three main areas: failure of medical and surgical treatments, disease phenotypes, and specific complaints from patients (not limited to bowel disease).
The statements were scrutinized by a 16-person task force made up of experts from eight European countries, Canada, Japan, Israel, and the United States. The project and its findings were published in the journal The Lancet Gastroenterology & Hepatology.
Using the modified Delphi technique, the experts argued for or against the 20 statements proposed. Consensus was achieved for five of these statements (meaning that at least 75% of voters were in agreement).
What does it mean?
“The scope of this consensus initiative was twofold,” explain the authors. “First, we wanted to help standardize study reporting and promote clinical study designs that include patients with difficult-to-treat IBD by proposing common terminology. Second, we hoped to identify, within clinical practice, a group of patients requiring specific treatment or referral to a specialist unit. For patients with conditions resistant to two or more advanced drug types (what is referred to as difficult-to-treat IBD), more aggressive treatment strategies, such as combined therapies or multidisciplinary approaches, should be taken into consideration.
“In the field of rheumatology, the creation of common criteria for difficult-to-treat rheumatoid arthritis has allowed researchers to concentrate their efforts on identifying progressive disease markers, assessing drug efficacy, mechanisms of inefficacy, personalized management strategies, and analyzing the use of health care resources and costs. Similar advances could be achieved in the area of inflammatory bowel disease.”
This article was translated from Univadis Italy. A version appeared on Medscape.com.
Up until now, one major obstacle has impeded our interpretation of studies focusing on patients suffering from this chronic condition: the lack of standard criteria and terminology among authors.
Under the guidance of the endpoints cluster of the International Organization for the Study of Inflammatory Bowel Disease (IOIBD), a group of experts held a consensus meeting to propose a common operative definition for “difficult-to-treat IBD.” It’s the first step to better understanding this condition and designing targeted studies and interventions.
The definition
After the meeting, the experts agreed that “difficult-to-treat IBD” is defined by these characteristics:
- The failure of biologics and advanced small molecules with at least two different mechanisms of action.
- Postoperative recurrence of Crohn’s disease after two surgical resections in adults or one in children.
- Chronic antibiotic-refractory pouchitis (inflammation of the ileal pouch-anal anastomosis [J-pouch] created in patients with ulcerative colitis who have had total colectomy surgery).
- Complex perianal disease (difficult-to-treat Crohn’s disease).
- Comorbid psychosocial complications that impair disease management (for example, comorbid disorders that obstruct treatment compliance, participation in follow-up visits, or objective assessment of symptoms by clinicians).
The path here
The starting point was the IOIBD-sponsored 2022 global survey in which doctors treating patients with IBD were asked what they thought contributed to difficult-to-treat IBD. Using the responses from that survey, a series of statements were drawn up covering these three main areas: failure of medical and surgical treatments, disease phenotypes, and specific complaints from patients (not limited to bowel disease).
The statements were scrutinized by a 16-person task force made up of experts from eight European countries, Canada, Japan, Israel, and the United States. The project and its findings were published in the journal The Lancet Gastroenterology & Hepatology.
Using the modified Delphi technique, the experts argued for or against the 20 statements proposed. Consensus was achieved for five of these statements (meaning that at least 75% of voters were in agreement).
What does it mean?
“The scope of this consensus initiative was twofold,” explain the authors. “First, we wanted to help standardize study reporting and promote clinical study designs that include patients with difficult-to-treat IBD by proposing common terminology. Second, we hoped to identify, within clinical practice, a group of patients requiring specific treatment or referral to a specialist unit. For patients with conditions resistant to two or more advanced drug types (what is referred to as difficult-to-treat IBD), more aggressive treatment strategies, such as combined therapies or multidisciplinary approaches, should be taken into consideration.
“In the field of rheumatology, the creation of common criteria for difficult-to-treat rheumatoid arthritis has allowed researchers to concentrate their efforts on identifying progressive disease markers, assessing drug efficacy, mechanisms of inefficacy, personalized management strategies, and analyzing the use of health care resources and costs. Similar advances could be achieved in the area of inflammatory bowel disease.”
This article was translated from Univadis Italy. A version appeared on Medscape.com.
Autism tied to higher rates of self-harm, suicide
TOPLINE:
Even after accounting for sociodemographic factors, intellectual disabilities, and psychiatric diagnoses,
METHODOLOGY:
Evidence shows those with autism have over threefold greater odds than their counterparts without the disorder of self-injurious behavior, suicidal ideation, suicide attempt, or suicide death, but reasons for these elevated risks are unclear.
Using various linked databases in the province of Ontario, researchers identified all individuals with an autism diagnosis from April 1, 1988, to March 31, 2018, and matched each on age and sex to four nonautistic individuals for the comparison group.
Investigators created two cohorts to separately evaluate outcomes of self-harm events leading to emergency health care and suicide death with the accrual period for both cohorts beginning at a person’s 10th birthday.
The self-harm cohort included 379,630 individuals while the suicide cohort included 334,690 individuals.
TAKEAWAY:
Over 15 years, autistic females showed the highest cumulative self-harm events, followed by autistic males, nonautistic females, and nonautistic males; over 25 years, autistic males had the highest cumulative incidence of suicide death, followed by autistic females, nonautistic males, and nonautistic females.
Autism had independent associations with self-harm events (females: relative rate, 1.83 [95% confidence interval, 1.61-2.08]; males: RR, 1.47 [95% CI, 1.28-1.69]) even after accounting for sociodemographic factors (varied directions of associations), intellectual disabilities (associated with increased risks), and psychiatric diagnoses including mood and anxiety, psychotic, addiction, and personality disorders (associated with increased risks).
For both females and males, final models showed autism per se was not significantly associated with suicide death, but certain correlates were linked to risk. Among both sexes, intellectual disabilities were associated with reduced risks and psychiatric diagnoses were associated with increased risks.
As a substantial proportion (28.4%) of the suicide cohort did not have data on self-harm, researchers were unable to examine the association of self-harm with suicide death.
IN PRACTICE:
That psychiatric diagnoses increased suicide risks among people with autism suggests supports to reduce such risks “should consider multifactorial mechanisms, with a particular focus on the prevention and timely treatment of psychiatric illnesses,” write the authors.
SOURCE:
The study was conducted by Meng-Chuan Lai, MD, PhD, Centre for Addiction and Mental Health, Toronto, and colleagues. It was published online in JAMA Network Open.
LIMITATIONS:
The autism cohort didn’t capture those diagnosed in private practices or with subtle presentations not yet diagnosed. Misclassification of autistic people in the nonautistic cohort may have resulted in underestimation of suicide-related outcomes. The administrative data don’t reliably identify diagnoses associated with suicide risks such as attention-deficit/hyperactivity disorder or subcategories of mood disorders, and don’t contain information about risk and protective mechanisms of suicide behaviors such as family history.
DISCLOSURES:
The study received support from ICES, an independent nonprofit research institute; the Innovation Fund of the Alternative Funding Plan for the Academic Health Sciences Centres of Ontario; the Academic Scholars Award from the Department of Psychiatry, University of Toronto; and the Canadian Institutes of Health Research Sex and Gender Science Chair. Dr. Lai reported receiving personal fees from SAGE Publications as an editorial honorarium outside the submitted work. One coauthor reported receiving honoraria from the BMJ Group, Archives of Diseases in Childhood.
A version of this article first appeared on Medscape.com.
TOPLINE:
Even after accounting for sociodemographic factors, intellectual disabilities, and psychiatric diagnoses,
METHODOLOGY:
Evidence shows those with autism have over threefold greater odds than their counterparts without the disorder of self-injurious behavior, suicidal ideation, suicide attempt, or suicide death, but reasons for these elevated risks are unclear.
Using various linked databases in the province of Ontario, researchers identified all individuals with an autism diagnosis from April 1, 1988, to March 31, 2018, and matched each on age and sex to four nonautistic individuals for the comparison group.
Investigators created two cohorts to separately evaluate outcomes of self-harm events leading to emergency health care and suicide death with the accrual period for both cohorts beginning at a person’s 10th birthday.
The self-harm cohort included 379,630 individuals while the suicide cohort included 334,690 individuals.
TAKEAWAY:
Over 15 years, autistic females showed the highest cumulative self-harm events, followed by autistic males, nonautistic females, and nonautistic males; over 25 years, autistic males had the highest cumulative incidence of suicide death, followed by autistic females, nonautistic males, and nonautistic females.
Autism had independent associations with self-harm events (females: relative rate, 1.83 [95% confidence interval, 1.61-2.08]; males: RR, 1.47 [95% CI, 1.28-1.69]) even after accounting for sociodemographic factors (varied directions of associations), intellectual disabilities (associated with increased risks), and psychiatric diagnoses including mood and anxiety, psychotic, addiction, and personality disorders (associated with increased risks).
For both females and males, final models showed autism per se was not significantly associated with suicide death, but certain correlates were linked to risk. Among both sexes, intellectual disabilities were associated with reduced risks and psychiatric diagnoses were associated with increased risks.
As a substantial proportion (28.4%) of the suicide cohort did not have data on self-harm, researchers were unable to examine the association of self-harm with suicide death.
IN PRACTICE:
That psychiatric diagnoses increased suicide risks among people with autism suggests supports to reduce such risks “should consider multifactorial mechanisms, with a particular focus on the prevention and timely treatment of psychiatric illnesses,” write the authors.
SOURCE:
The study was conducted by Meng-Chuan Lai, MD, PhD, Centre for Addiction and Mental Health, Toronto, and colleagues. It was published online in JAMA Network Open.
LIMITATIONS:
The autism cohort didn’t capture those diagnosed in private practices or with subtle presentations not yet diagnosed. Misclassification of autistic people in the nonautistic cohort may have resulted in underestimation of suicide-related outcomes. The administrative data don’t reliably identify diagnoses associated with suicide risks such as attention-deficit/hyperactivity disorder or subcategories of mood disorders, and don’t contain information about risk and protective mechanisms of suicide behaviors such as family history.
DISCLOSURES:
The study received support from ICES, an independent nonprofit research institute; the Innovation Fund of the Alternative Funding Plan for the Academic Health Sciences Centres of Ontario; the Academic Scholars Award from the Department of Psychiatry, University of Toronto; and the Canadian Institutes of Health Research Sex and Gender Science Chair. Dr. Lai reported receiving personal fees from SAGE Publications as an editorial honorarium outside the submitted work. One coauthor reported receiving honoraria from the BMJ Group, Archives of Diseases in Childhood.
A version of this article first appeared on Medscape.com.
TOPLINE:
Even after accounting for sociodemographic factors, intellectual disabilities, and psychiatric diagnoses,
METHODOLOGY:
Evidence shows those with autism have over threefold greater odds than their counterparts without the disorder of self-injurious behavior, suicidal ideation, suicide attempt, or suicide death, but reasons for these elevated risks are unclear.
Using various linked databases in the province of Ontario, researchers identified all individuals with an autism diagnosis from April 1, 1988, to March 31, 2018, and matched each on age and sex to four nonautistic individuals for the comparison group.
Investigators created two cohorts to separately evaluate outcomes of self-harm events leading to emergency health care and suicide death with the accrual period for both cohorts beginning at a person’s 10th birthday.
The self-harm cohort included 379,630 individuals while the suicide cohort included 334,690 individuals.
TAKEAWAY:
Over 15 years, autistic females showed the highest cumulative self-harm events, followed by autistic males, nonautistic females, and nonautistic males; over 25 years, autistic males had the highest cumulative incidence of suicide death, followed by autistic females, nonautistic males, and nonautistic females.
Autism had independent associations with self-harm events (females: relative rate, 1.83 [95% confidence interval, 1.61-2.08]; males: RR, 1.47 [95% CI, 1.28-1.69]) even after accounting for sociodemographic factors (varied directions of associations), intellectual disabilities (associated with increased risks), and psychiatric diagnoses including mood and anxiety, psychotic, addiction, and personality disorders (associated with increased risks).
For both females and males, final models showed autism per se was not significantly associated with suicide death, but certain correlates were linked to risk. Among both sexes, intellectual disabilities were associated with reduced risks and psychiatric diagnoses were associated with increased risks.
As a substantial proportion (28.4%) of the suicide cohort did not have data on self-harm, researchers were unable to examine the association of self-harm with suicide death.
IN PRACTICE:
That psychiatric diagnoses increased suicide risks among people with autism suggests supports to reduce such risks “should consider multifactorial mechanisms, with a particular focus on the prevention and timely treatment of psychiatric illnesses,” write the authors.
SOURCE:
The study was conducted by Meng-Chuan Lai, MD, PhD, Centre for Addiction and Mental Health, Toronto, and colleagues. It was published online in JAMA Network Open.
LIMITATIONS:
The autism cohort didn’t capture those diagnosed in private practices or with subtle presentations not yet diagnosed. Misclassification of autistic people in the nonautistic cohort may have resulted in underestimation of suicide-related outcomes. The administrative data don’t reliably identify diagnoses associated with suicide risks such as attention-deficit/hyperactivity disorder or subcategories of mood disorders, and don’t contain information about risk and protective mechanisms of suicide behaviors such as family history.
DISCLOSURES:
The study received support from ICES, an independent nonprofit research institute; the Innovation Fund of the Alternative Funding Plan for the Academic Health Sciences Centres of Ontario; the Academic Scholars Award from the Department of Psychiatry, University of Toronto; and the Canadian Institutes of Health Research Sex and Gender Science Chair. Dr. Lai reported receiving personal fees from SAGE Publications as an editorial honorarium outside the submitted work. One coauthor reported receiving honoraria from the BMJ Group, Archives of Diseases in Childhood.
A version of this article first appeared on Medscape.com.
FROM JAMA NETWORK OPEN
PsA biomarkers move researchers closer to predictive test
In a new study, researchers report that they have found epigenetic methylation markers on 15 genes that appear to foreshadow psoriatic arthritis (PsA), a development that could bring scientists closer to developing a DNA test to predict which patients with psoriasis will develop the condition.

While no predictive test is in sight yet, the findings published in Arthritis & Rheumatology mark an important step, study lead author Omar F. Cruz-Correa, PhD, of the Psoriatic Arthritis Research Program in the University Health Network, Toronto, said in an interview. “In the future, markers like these could be measured by dermatologists and even general practitioners to help identify new psoriasis patients at a high risk of developing PsA,” he said. “Then both the health care team and the patients themselves could be more aware of their increased risk and the pressing need of closer monitoring for musculoskeletal symptoms. Once the first symptoms appear, treatment can be initiated early on, helping to prevent permanent joint damage.”
An estimated 30% of patients with psoriasis will develop PsA, too, putting them at higher risk of disability and death. According to Dr. Cruz-Correa, “one of the more pressing matters in PsA is the lack of means of predicting which psoriasis patients will develop PsA.”
DNA methylation, the topic of the new study, has already been linked to psoriasis and PsA. It’s “relatively easy to measure and helps regulate gene expression in response to environmental effects,” Dr. Cruz-Correa said. “DNA methylation is also appealing because it serves as an intermediary between environment and genetic factors as it’s transmitted between generations of cells and influenced by external factors.”
For the new study, researchers examined the DNA of 117 patients with psoriasis – 58 who went on to develop PsA (“converters”) and another 59 who were matched to converters but did not develop PsA (“nonconverters”). The patients were in a larger group of 700 patients with psoriasis who had the disease for a mean of about 17 years at the time of blood sampling.
Samples from converters were taken an average of 5.16 years (± 12.77 years) before PsA set in.
The researchers report that they found “36 highly relevant methylation markers … across 15 genes and several intergenic regions. A classification model relying on these markers identified converters and nonconverters with an area under the ROC curve of 0.9644.”
Statistically, this number is high and means that “the DNA methylation markers are really good at identifying psoriasis patients who will develop PsA and those that will not,” at least in this specific patient group, Dr. Cruz-Correa said.
At this point, the number of markers is a bit too high to develop a feasible DNA test to predict PsA, he said. “However, the results from our study have also pointed us toward some interesting metabolic pathways that may warrant further study.”
What’s next?
The first step forward “is the validation of these predictive DNA methylation markers in a wider population of patients with varied clinical and demographic characteristics. This would help assess the potential for generalization of such a test,” Dr. Cruz-Correa said. “A second step is to assess the potential impact of these methylation markers on disease activity and treatment response, which are clinical outcomes of great importance to patients.”
Meanwhile, he said, “there are ongoing efforts to shed light into how DNA methylation integrates with other epigenetic mechanisms like micro-RNAs to regulate gene expression in concert with one another. An integrative look into these mechanisms may be able to give insight into the pathogenesis of psoriatic disease in a way that has not been possible before.”
In an interview, Johann E. Gudjonsson, MD, PhD, professor of skin molecular immunology at the University of Michigan, Ann Arbor, said the study “is interesting and important as it indicates that there are changes in the blood that occur before the development of psoriatic arthritis. However, it does not provide much in terms of novel insights into the mechanisms involved and is still a long way away from being useful as a clinical predictor or biomarker.”
The National Psoriasis Foundation, Krembil Foundation, and Canadian Institutes of Health Research provided support for the study. Dr. Cruz-Correa reports support from the National Psoriasis Foundation and the Arthritis Society. Dr. Gudjonsson has no relevant financial relationships.
In a new study, researchers report that they have found epigenetic methylation markers on 15 genes that appear to foreshadow psoriatic arthritis (PsA), a development that could bring scientists closer to developing a DNA test to predict which patients with psoriasis will develop the condition.
While no predictive test is in sight yet, the findings published in Arthritis & Rheumatology mark an important step, study lead author Omar F. Cruz-Correa, PhD, of the Psoriatic Arthritis Research Program in the University Health Network, Toronto, said in an interview. “In the future, markers like these could be measured by dermatologists and even general practitioners to help identify new psoriasis patients at a high risk of developing PsA,” he said. “Then both the health care team and the patients themselves could be more aware of their increased risk and the pressing need of closer monitoring for musculoskeletal symptoms. Once the first symptoms appear, treatment can be initiated early on, helping to prevent permanent joint damage.”
An estimated 30% of patients with psoriasis will develop PsA, too, putting them at higher risk of disability and death. According to Dr. Cruz-Correa, “one of the more pressing matters in PsA is the lack of means of predicting which psoriasis patients will develop PsA.”
DNA methylation, the topic of the new study, has already been linked to psoriasis and PsA. It’s “relatively easy to measure and helps regulate gene expression in response to environmental effects,” Dr. Cruz-Correa said. “DNA methylation is also appealing because it serves as an intermediary between environment and genetic factors as it’s transmitted between generations of cells and influenced by external factors.”
For the new study, researchers examined the DNA of 117 patients with psoriasis – 58 who went on to develop PsA (“converters”) and another 59 who were matched to converters but did not develop PsA (“nonconverters”). The patients were in a larger group of 700 patients with psoriasis who had the disease for a mean of about 17 years at the time of blood sampling.
Samples from converters were taken an average of 5.16 years (± 12.77 years) before PsA set in.
The researchers report that they found “36 highly relevant methylation markers … across 15 genes and several intergenic regions. A classification model relying on these markers identified converters and nonconverters with an area under the ROC curve of 0.9644.”
Statistically, this number is high and means that “the DNA methylation markers are really good at identifying psoriasis patients who will develop PsA and those that will not,” at least in this specific patient group, Dr. Cruz-Correa said.
At this point, the number of markers is a bit too high to develop a feasible DNA test to predict PsA, he said. “However, the results from our study have also pointed us toward some interesting metabolic pathways that may warrant further study.”
What’s next?
The first step forward “is the validation of these predictive DNA methylation markers in a wider population of patients with varied clinical and demographic characteristics. This would help assess the potential for generalization of such a test,” Dr. Cruz-Correa said. “A second step is to assess the potential impact of these methylation markers on disease activity and treatment response, which are clinical outcomes of great importance to patients.”
Meanwhile, he said, “there are ongoing efforts to shed light into how DNA methylation integrates with other epigenetic mechanisms like micro-RNAs to regulate gene expression in concert with one another. An integrative look into these mechanisms may be able to give insight into the pathogenesis of psoriatic disease in a way that has not been possible before.”
In an interview, Johann E. Gudjonsson, MD, PhD, professor of skin molecular immunology at the University of Michigan, Ann Arbor, said the study “is interesting and important as it indicates that there are changes in the blood that occur before the development of psoriatic arthritis. However, it does not provide much in terms of novel insights into the mechanisms involved and is still a long way away from being useful as a clinical predictor or biomarker.”
The National Psoriasis Foundation, Krembil Foundation, and Canadian Institutes of Health Research provided support for the study. Dr. Cruz-Correa reports support from the National Psoriasis Foundation and the Arthritis Society. Dr. Gudjonsson has no relevant financial relationships.
In a new study, researchers report that they have found epigenetic methylation markers on 15 genes that appear to foreshadow psoriatic arthritis (PsA), a development that could bring scientists closer to developing a DNA test to predict which patients with psoriasis will develop the condition.
While no predictive test is in sight yet, the findings published in Arthritis & Rheumatology mark an important step, study lead author Omar F. Cruz-Correa, PhD, of the Psoriatic Arthritis Research Program in the University Health Network, Toronto, said in an interview. “In the future, markers like these could be measured by dermatologists and even general practitioners to help identify new psoriasis patients at a high risk of developing PsA,” he said. “Then both the health care team and the patients themselves could be more aware of their increased risk and the pressing need of closer monitoring for musculoskeletal symptoms. Once the first symptoms appear, treatment can be initiated early on, helping to prevent permanent joint damage.”
An estimated 30% of patients with psoriasis will develop PsA, too, putting them at higher risk of disability and death. According to Dr. Cruz-Correa, “one of the more pressing matters in PsA is the lack of means of predicting which psoriasis patients will develop PsA.”
DNA methylation, the topic of the new study, has already been linked to psoriasis and PsA. It’s “relatively easy to measure and helps regulate gene expression in response to environmental effects,” Dr. Cruz-Correa said. “DNA methylation is also appealing because it serves as an intermediary between environment and genetic factors as it’s transmitted between generations of cells and influenced by external factors.”
For the new study, researchers examined the DNA of 117 patients with psoriasis – 58 who went on to develop PsA (“converters”) and another 59 who were matched to converters but did not develop PsA (“nonconverters”). The patients were in a larger group of 700 patients with psoriasis who had the disease for a mean of about 17 years at the time of blood sampling.
Samples from converters were taken an average of 5.16 years (± 12.77 years) before PsA set in.
The researchers report that they found “36 highly relevant methylation markers … across 15 genes and several intergenic regions. A classification model relying on these markers identified converters and nonconverters with an area under the ROC curve of 0.9644.”
Statistically, this number is high and means that “the DNA methylation markers are really good at identifying psoriasis patients who will develop PsA and those that will not,” at least in this specific patient group, Dr. Cruz-Correa said.
At this point, the number of markers is a bit too high to develop a feasible DNA test to predict PsA, he said. “However, the results from our study have also pointed us toward some interesting metabolic pathways that may warrant further study.”
What’s next?
The first step forward “is the validation of these predictive DNA methylation markers in a wider population of patients with varied clinical and demographic characteristics. This would help assess the potential for generalization of such a test,” Dr. Cruz-Correa said. “A second step is to assess the potential impact of these methylation markers on disease activity and treatment response, which are clinical outcomes of great importance to patients.”
Meanwhile, he said, “there are ongoing efforts to shed light into how DNA methylation integrates with other epigenetic mechanisms like micro-RNAs to regulate gene expression in concert with one another. An integrative look into these mechanisms may be able to give insight into the pathogenesis of psoriatic disease in a way that has not been possible before.”
In an interview, Johann E. Gudjonsson, MD, PhD, professor of skin molecular immunology at the University of Michigan, Ann Arbor, said the study “is interesting and important as it indicates that there are changes in the blood that occur before the development of psoriatic arthritis. However, it does not provide much in terms of novel insights into the mechanisms involved and is still a long way away from being useful as a clinical predictor or biomarker.”
The National Psoriasis Foundation, Krembil Foundation, and Canadian Institutes of Health Research provided support for the study. Dr. Cruz-Correa reports support from the National Psoriasis Foundation and the Arthritis Society. Dr. Gudjonsson has no relevant financial relationships.
FROM ARTHRITIS & RHEUMATOLOGY
