User login
New assay detects persistent CML better, team says

A new assay is more accurate than the current gold standard for detecting residual disease in patients with chronic myeloid leukemia (CML), according to a study published in The Journal of Molecular Diagnostics.
Investigators found this test, a DNA-based digital PCR (dPCR) assay, could detect persistent disease in 81% of samples taken from CML patients who were in remission according to reverse transcriptase-quantitative PCR (RT-qPCR).
RT-qPCR is currently the most widely used method for monitoring residual disease in CML patients.
“If validated in clinical trials of stopping TKIs [tyrosine kinase inhibitors], this technique [the dPCR assay] will permit a more personalized approach to recommendations for dose reduction or drug cessation in individual patients, ensuring that therapy is withdrawn only from patients with the highest chance of long-term remission,” said investigator Jane F. Apperley, MD, PhD, of Imperial College London in the UK.
For this study, Dr Apperley and her colleagues compared the sensitivity of the dPCR assay to 3 other quantitative PCR methods currently used to measure residual CML—RT-qPCR, quantitative PCR (qPCR), and reverse transcriptase-digital PCR (RT-dPCR).
Thirty-six samples were taken from 6 patients with early CML who were thought to be in deep molecular remission, as indicated by RT-qPCR results.
Repeat analysis using dPCR with preamplification detected persistent disease in 81% of the samples. In comparison, the detection rate was 25% using RT-dPCR and 19% for qPCR.
“We conclude that dPCR for BCR-ABL1 DNA is the most sensitive available method of residual disease detection in CML and may prove useful in the management of TKI withdrawal,” Dr Apperley said.
She and her colleagues believe the new assay has the potential to dramatically impact CML management. They foresee that, immediately after CML diagnosis, the patient’s genomic breakpoints would be identified, enabling the design of a patient-specific assay.
The patient’s response to therapy would be monitored using standard RT-qPCR until reaching molecular remission. At that point, routine monitoring would be augmented with dPCR, allowing better-informed treatment decisions and improved patient management.
According to Dr Apperley, the new method improves on previous methodologies in 2 key areas. First, the dPCR platform provides greater sensitivity.
And second, dPCR is a DNA-based method that allows identification of BCR-ABL1 fusion junctions by targeted next-generation sequencing. This enables the rapid generation of high-performing DNA-based hydrolysis probe assays that are specific to the individual molecular footprint of each patient’s CML clone, although the number and location of fusion junctions may vary among patients.
“The technique we describe, with which we successfully mapped a disease-specific junction in all patients tested, is relatively simple, cost-effective, and suited to a high-throughput laboratory,” Dr Apperley concluded. ![]()
20-Year Rate for Kidney Stones Increased in Children, Adolescents, Females, Blacks
NEW YORK (Reuters Health) - Rates of kidney stones have increased substantially over the past 20 years, particularly among children, adolescents, females, and blacks, according to a population-based study in South Carolina.
Historically, the highest rates of kidney stone disease have been in middle-aged white men, but the new findings underscore emerging changes in this pattern. Prior studies have found that prevalent kidney stone disease has nearly doubled in the United States over the past two decades. The extent to which specific groups of patients have been affected has been less clear, although there have been reports of increasing frequency of kidney stones among youth.
"My colleagues and I wondered if kidney stones were increasing preferentially among adolescents more than in other age groups," lead researcher Dr. Gregory Tasian, of the University of Pennsylvania Perelman School of Medicine in Philadelphia, told Reuters Health by email.
To estimate the annual kidney stone incidence in South Carolina in their repeated cross-sectional study, the researchers used U.S. Census data and data from the South Carolina Medical Encounter Data and Financial Reports, which includes information on all surgeries, emergency department visits, and inpatient hospitalizations in the state from 1997 to 2012. Using linear mixed models, they also sought to identify the patient groups in whom the rate of stones has increased the most.
Nearly 153,000 adult and pediatric patients among a state population of about 4.6 million received care for kidney stones from 1997 to 2012, the researchers reported online January 14 in the Clinical Journal of the American Society of Nephrology.
The annual incidence increased 16% during that time, with the largest increases occurring in teens, blacks, and women. Teens 15 to 19 years comprised the age group with the largest increase in incidence of kidney stones from 1997 (an age-specific rate of nearly 80 per 100,000) to 2012 (about 155 per 100,000).
Overall, teens 15 to 19 experienced a 26% increase per five years (incidence rate ratio, 1.26), after adjusting for sex and race. The increase was substantially greater among teen girls,
with an annual incidence 52% higher than for teen boys.
Increases in cumulative risk of kidney stones during childhood were similar for girls (87%) and boys (90%), although the risks in 2012 were "modest," at 0.9% (for girls) and 0.6% (for boys), the researchers say. They note that the "emergence of nephrolithiasis as a disease that begins in childhood is worrisome because there is limited evidence about how to best treat children" with the condition.
After adjusting for age and race, incidence of kidney stones increased an estimated 15% per five years (IRR, 1.15) among females of all ages during the study period, but was stable among males (IRR, 0.99). The estimated lifetime risk for women increased from 10.5% in 1997 to 15.2% in 2012, but remained unchanged for men at about 23%. Incidence of kidney stones among blacks rose an estimated 15% per five years (IRR, 1.15) during the study period, compared with an estimated 3% among whites (IRR, 1.03).
"We were not surprised by the high occurrence of kidney stones among adolescents and females (5% and 3% per year), which is consistent with other studies reported to date," Dr. Tasian
said. "We were, however, surprised by how much kidney stones were increasing in African-Americans, as previous studies have not really studied differences in kidney stone occurrence among different racial groups."
Although the study focused on kidney stone disease in South Carolina, it's likely that similar patterns exist across the nation, he said.
"Kidney stones have increased 70% over the last 30 years in adults in the U.S., and we are also seeing higher rates of kidney stones in children across the U.S.," Dr. Tasian said.
However, even though kidney stones are also increasing in many areas in the world, for many reasons, the results should not be generalized beyond the United States, he noted.
"This study is an important step forward in understanding the changing epidemiology of kidney stone disease," Dr. Charles D. Scales, of Duke University Medical Center in Durham, North Carolina, told Reuters Health by email. The underlying causes of the increase are unclear. "In adults, it may be related to the tidal wave of obesity and diabetes in the United States," said Dr. Scales, an expert in kidney stones who was not involved with the study.
These epidemiologic trends provide more support for the concept that "chronic and poorly understood metabolic derangements are likely causing all of these new stones in previously low-risk individuals," he said.
Increased consumption of high-sodium processed food and dehydration also may be contributing factors, he added. "Emerging evidence suggests that a kidney stone may foreshadow future medical problems, such as heart disease, bone density loss, and chronic kidney disease," Dr. Scales said. "So from the public-health perspective, the worst may be yet to come as these teenagers with stones become adults."
The study had no commercial funding and the authors reported no disclosures.
FDA approves drug for patients receiving MEC

Photo by Rhoda Baer
The US Food and Drug Administration (FDA) has approved a supplemental new drug application for single-dose fosaprepitant dimeglumine (Emend) for injection.
The agency approved the substance P/neurokinin-1 (NK1) receptor antagonist for use in combination with other anti-emetic medicines to prevent delayed nausea and vomiting in adults receiving initial and repeat courses of moderately emetogenic chemotherapy (MEC).
This makes fosaprepitant dimeglumine the first intravenous NK1 receptor antagonist approved in the US for patients receiving either highly emetogenic chemotherapy or MEC.
Fosaprepitant dimeglumine has not been studied for the treatment of established nausea and vomiting.
The FDA’s latest approval of fosaprepitant dimeglumine is supported by data from a phase 3 study published in the Annals of Oncology.
Patients receiving MEC were given ondansetron and dexamethasone (n=498) or ondansetron and dexamethasone plus a single intravenous infusion of fosaprepitant dimeglumine (n=502).
The primary endpoint was complete response (CR)—defined as no vomiting and no use of rescue therapy—in the delayed phase of chemotherapy-induced nausea and vomiting, which is 25 to 120 hours after the initiation of chemotherapy.
Secondary endpoints included CR in the overall and acute phases—0 to 120 and 0 to 24 hours after MEC initiation, respectively—and no vomiting in the overall phase.
The fosaprepitant regimen improved CR significantly in the delayed and overall phases but not in the acute phase.
In the delayed phase, the CR rate was 78.9% with the fosaprepitant regimen and 68.5% with the control regimen (P<0.001). In the acute phase, the CR rate was 93.2% and 91.0%, respectively (P=0.184). Overall, the CR rate was 77.1% and 66.9%, respectively (P<0.001).
In the overall phase, the proportion of subjects with no vomiting was 82.7% with the fosaprepitant regimen and 72.9% with the control regimen (P<0.001). The proportion of patients with no significant nausea was 83.2% and 77.9%, respectively (P=0.030).
The most common adverse events reported in the fosaprepitant and control arms, respectively, were fatigue (15% vs 13%), diarrhea (13% vs 11%), neutropenia (8% vs 7%), asthenia (4% vs 3%), anemia (3% vs 2%), peripheral neuropathy (3% vs 2%), leukopenia (2% vs 1%), dyspepsia (2% vs 1%), urinary tract infection (2% vs 1%), and pain in extremity (2% vs 1%).
Fosaprepitant dimeglumine is a product of Merck. For more details on the drug, see the prescribing information. ![]()
Brazil reports Zika transmission via transfusion
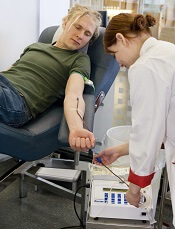
Photo by Marja Helander
Health officials in Campinas, Brazil, have reported 2 cases of the Zika virus that were likely transmitted through blood transfusions.
The officials said both transfusions occurred last year, but transmission of the virus wasn’t confirmed until recently.
A liver transplant recipient appeared to have contracted Zika through a transfusion in March 2015, and a gunshot victim appeared to have contracted the virus after multiple transfusions in April 2015.
Doctors originally thought the gunshot victim had dengue fever, so his blood was not tested for the Zika virus until January 28. The man later died of his wounds.
The liver transplant recipient did not show any symptoms of Zika infection, but testing confirmed that both he and his blood donor had the virus.
Protecting the world’s blood supply
Even before these cases of Zika transmission were reported, countries around the world were implementing blood donor deferral policies in attempts to protect the blood supply.
The US Food and Drug Administration is still reviewing its blood donation policy with regard to the virus, but the American Red Cross and AABB have recommended donor self-deferral.
Both organizations said people should refrain from donating blood for 28 days if they have visited Mexico, the Caribbean, Central America, or South America in the past 4 weeks.
NHS Blood and Transplant has also implemented a 28-day deferral period for potential blood donors in England and North Wales who have travelled to countries where the Zika virus is endemic.
A spokesperson for NHS Blood and Transplant said travel to most Zika-endemic countries already brings a blood donation deferral period of at least 28 days. So the agency doesn’t expect the new deferral policy to have a significant impact on the number of people who can donate following travel abroad.
Canadian Blood Services has said that anyone who has travelled outside of Canada, the continental US, and Europe will be temporarily ineligible to give blood for 3 weeks (21 days). This policy has been implemented across the country.
The 21-day waiting period also applies to cord blood and stem cell donors who have travelled to affected areas. Héma-Québec (Quebec’s blood operator) is implementing the same change.
Canadian Blood Services said the new deferral policy will reduce the number of people available to donate in the coming months and therefore urged Canadians to donate before they travel. The agency also urged new and current donors who have not recently travelled outside of Canada, the continental US, and Europe to book an appointment to donate.
Hong Kong’s Red Cross Blood Transfusion Service has begun screening potential blood donors. Anyone who has resided in or visited any countries affected by the Zika virus is screened and deferred for blood donation for at least 28 days from the date he or she departed from the affected country.
South Korea’s health authorities have implemented a 30-day deferral period for potential donors who have visited Zika-endemic areas.
The Australian Red Cross Blood Service said it already defers potential blood donors who have travelled to countries with mosquito-borne viruses that are a transfusion-transmission risk, such as dengue and malaria. So all countries affected by Zika outbreaks are already covered by temporary travel deferrals in Australia.
However, the organization said it will continue to monitor the countries impacted by the virus and will make any adjustments to deferrals as required. ![]()
A Perfect Storm: Tumor biology and genomics
This is the second installment of a five-part monthly series that will discuss the pathologic, genomic, and clinical factors that contribute to the racial survival disparity in breast cancer. The series, which is adapted from an article that originally appeared in CA: A Cancer Journal for Clinicians1, a journal of the American Cancer Society, will also review exciting and innovative interventions to close this survival gap. This month’s column reviews tumor biology and genomics—the first element in the perfect storm.
Hormone receptor status and human epidermal growth factor receptor 2 (HER2)/neu
Breast cancer is not a single disease, and breast cancer subtype classifications are used in the clinical setting to determine prognosis and guide management. These different molecular subtypes are based on tumor markers, which include the presence or absence of three proteins: estrogen receptor (ER), progesterone receptor (PR), and HER2/neu. Hormone receptor status is a main factor in planning breast cancer treatment. Hormone receptor–positive breast tumors benefit from hormone therapies, such as selective ER modulators (for example, tamoxifen) and aromatase inhibitors (for example, anastrozole). Thus, these tumors have a more favorable disease-specific survival than do hormone receptor–negative tumors.2
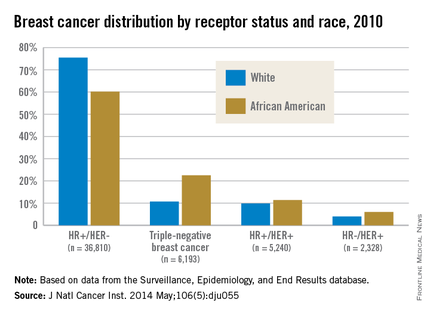
African American women are more likely to present with hormone receptor-negative tumors. In an analysis of the California Cancer Registry, which has collected patient ER and PR status since 1990, whites had a higher proportion of tumors that were ER positive or PR positive (or both) and HER2 negative (72% vs. 53%).3 DeSantis et al.4 reported similar results for this tumor type, with 76% of non-Hispanic whites having hormone receptor–positive, HER2-negative tumors vs. 62% of non-Hispanic blacks. Even with stratification by tumor stage, African Americans continue to have a significantly higher proportion of hormone receptor–negative tumors than do whites for localized and advanced disease.5
Although hormone receptor status varies significantly by race, HER2 status does not show the same divergence. HER2 overexpression is present in approximately 20% of invasive breast cancers. HER2-positive, hormone receptor–negative tumors demonstrate more-aggressive features and worse breast cancer–specific survival than do hormone receptor–positive and HER2-negative tumors,2 although survival has vastly improved with new HER2-targeted therapies such as trastuzumab and pertuzumab. Unlike hormone receptor status, there was no association between race and HER2-positive/ER-negative tumors in the Carolina Breast Cancer Study.2
Triple-negative breast cancer (TNBC)
TNBC is the subtype of breast cancer with the worst prognosis. TNBC gets its name because its tumor cells lack the markers for ER, PR, and HER2 overexpression. Thus, TNBC tumors are estrogen receptor negative (ER), progesterone receptor negative (PR), and HER2/neu negative (HER2). While other subtypes of breast cancer have benefited from drug development regarding hormonal therapies and HER2-targeted treatments, TNBC has not experienced the same pharmacologic breakthroughs.
As such, even after analyses control for the stage at diagnosis, women with this subtype have poorer survival than those with other breast cancers.6 African American women have a higher incidence of TNBC than white women.7 DeSantis et al.4 reported that 22% of breast cancers were triple negative in non-Hispanic black patients vs. only 11% in non-Hispanic white patients. The Carolina Breast Cancer Study found that 26% of African American women had TNBC, whereas 16% of non-African American women did.2 This subtype was most common among younger, premenopausal African American women (39% of diagnosed cancer subtypes). When TNBC patients were excluded from analysis in the Carolina Breast Cancer Study, breast cancer–specific survival remained significantly worse among premenopausal African American women, suggesting that although tumor biology in part explains the poor outcomes, the survival disparity story is more complex.
Germline mutations: BRCA1 and BRCA2 Mutations
In addition to tumor biology, cancer genomics has become increasingly important in determining cancer prognosis and guiding treatment. Approximately 5%-10% of breast cancer cases present in individuals with inherited mutations in autosomal dominant, highly penetrant breast cancer susceptibility genes.8 Accounting for 80%-90% of families containing multiple cases of breast and ovarian cancer, BRCA1 and BRCA2 germline mutations are the most common of the breast cancer susceptibility genes.9 These patients often are younger and have a higher-grade tumor that is hormone receptor negative, which also often matches the profile of the African American breast cancer patient.10
Despite similarities between BRCA1-associated breast cancers and breast cancer in African Americans, genetic abnormalities in African American breast cancer patients remain underresearched. Nanda et al.11 found that BRCA1 and BRCA2 mutations occur with appreciable frequency in high-risk families of African ancestry, with 28% testing positive for a deleterious mutation in one of these genes. This frequency was at a lower rate than that found in non-Hispanic, non-Jewish whites, who had a rate of 46%, because African Americans had a higher rate of polymorphisms or variants of unknown significance (44% vs. 12%). This large percentage of variants of unknown significance indicates that more analysis is needed to understand the clinical implications of these genetic variations. In another study from the Northern California site of the Breast Cancer Family Registry, the BRCA1 mutation prevalence was 16.7% in African American cases diagnosed under the age of 35 years vs. 7.2% in non-Hispanic, non-Ashkenazi Jewish whites in the same age category.12 High frequencies of mutations in BRCA1 and BRCA2 have also been reported in breast cancer patients of African ancestry from Nigeria and the Bahamas.13, 14
These results in African American patients highlight the need for further study of breast cancer genomics in minority populations. However, Armstrong et al.15 illuminated the existence of racial/ethnic disparities in patterns of referral to cancer risk clinics. In their study, African American women with a family history of breast or ovarian cancer were significantly less likely to undergo genetic counseling for BRCA1/2 testing than were white women with this family history. The results of this study were noteworthy for the magnitude of the disparity, with white women having almost five times greater odds of undergoing this clinically important evaluation. More than two decades after BRCA1 and BRCA2 genes were identified, larger studies are still needed in diverse populations to derive true estimates of the burden of mutations in both genes in underserved and understudied populations.
Although these differences in tumor biology and genomics tell part of the mortality disparity story, there is more to be told. In a study of African American and white patients in South Carolina, Adams et al.16 determined survival rates by ethnicity that were adjusted for disease stage and other prognostic characteristics. After they controlled for age, stage, ER, and HER2 expression as well as insurance status, African American women still had a twofold excess risk of death from breast cancer. Thus, in addition to differences in the innate characteristics of the breast tumors, racial differences in patterns of care for women with breast cancer must be considered in unraveling the observed disparity in mortality. The third installment of this series will discuss the second element of the perfect storm – patterns of care.
Other installments of this column can be found in the Related Content box.
1. Daly B, Olopade OI. A perfect storm: How tumor biology, genomics, and health care delivery patterns collide to create a racial survival disparity in breast cancer and proposed interventions for change. CA Cancer J Clin. 2015;65(3):221-238.
2. Carey LA, Perou CM, Livasy CA, et al. Race, breast cancer subtypes, and survival in the Carolina Breast Cancer Study. JAMA. 2006;295(21):2492-502.
3. Kurian AW, Fish K, Shema SJ, Clarke CA. Lifetime risks of specific breast cancer subtypes among women in four racial/ethnic groups. Breast Cancer Res. 2010;12(6):R99.
4. DeSantis CE, Fedewa SA, Goding Sauer A, Kramer JL, Smith RA, Jemal A. Breast cancer statistics, 2015: Convergence of incidence rates between black and white women. CA Cancer J Clin. 2015 Oct 29. doi: 10.3322/caac.21320. [Epub ahead of print]
5. Setiawan VW, Monroe KR, Wilkens LR, Kolonel LN, Pike MC, Henderson BE. Breast cancer risk factors defined by estrogen and progesterone receptor status: the multiethnic cohort study. Am J Epidemiol. 2009;169(10):1251-9.
6. Bauer KR, Brown M, Cress RD, Parise CA, Caggiano V. Descriptive analysis of estrogen receptor (ER)-negative, progesterone receptor (PR)-negative, and HER2-negative invasive breast cancer, the so-called triple-negative phenotype: a population-based study from the California cancer Registry. Cancer. 2007;109(9):1721-8.
7. Ray M, Polite BN. Triple-negative breast cancers: a view from 10,000 feet. Cancer J. 2010;16(1):17-22.
8. Claus EB, Schildkraut JM, Thompson WD, Risch NJ. The genetic attributable risk of breast and ovarian cancer. Cancer. 1996;77(11):2318-24.
9. Easton DF, Bishop DT, Ford D, Crockford GP. Genetic linkage analysis in familial breast and ovarian cancer: results from 214 families. The Breast Cancer Linkage Consortium. Am J Hum Genet. 1993;52(4):678-701.
10. Polite BN, Olopade OI. Breast cancer and race: a rising tide does not lift all boats equally. Perspect Biol Med. 2005;48(1 Suppl):S166-75.
11. Nanda R, Schumm LP, Cummings S, et al. Genetic testing in an ethnically diverse cohort of high-risk women: a comparative analysis of BRCA1 and BRCA2 mutations in American families of European and African ancestry. JAMA. 2005;294(15):1925-33.
12. John EM, Miron A, Gong G, et al. Prevalence of pathogenic BRCA1 mutation carriers in 5 US racial/ethnic groups. JAMA. 2007;298(24):2869-76.
13. Fackenthal JD, Zhang J, Zhang B, et al. High prevalence of BRCA1 and BRCA2 mutations in unselected Nigerian breast cancer patients. Int J Cancer. 2012;131(5):1114-23.
14. Donenberg T, Lunn J, Curling D, et al. A high prevalence of BRCA1 mutations among breast cancer patients from the Bahamas. Breast Cancer Res Treat. 2011;125(2):591-6.
15. Armstrong K, Micco E, Carney A, Stopfer J, Putt M. Racial differences in the use of BRCA1/2 testing among women with a family history of breast or ovarian cancer. JAMA. 2005;293(14):1729-36.
16. Adams SA, Butler WM, Fulton J, et al. Racial disparities in breast cancer mortality in a multi-ethnic cohort in the Southeast. Cancer. 2012;118(10):2693-9.

Bobby Daly, MD, MBA, is the chief fellow in the section of hematology/oncology at the University of Chicago Medicine. His clinical focus is breast and thoracic oncology, and his research focus is health services. Specifically, Dr. Daly researches disparities in oncology care delivery, oncology health care utilization, aggressive end-of-life oncology care, and oncology payment models. He received his MD and MBA from Harvard Medical School and Harvard Business School, both in Boston, and a BA in Economics and History from Stanford (Calif.) University. He was the recipient of the Dean’s Award at Harvard Medical and Business Schools.

Olufunmilayo Olopade, MD, FACP, OON, is the Walter L. Palmer Distinguished Service Professor of Medicine and Human Genetics, and director, Center for Global Health at the University of Chicago. She is adopting emerging high throughput genomic and informatics strategies to identify genetic and nongenetic risk factors for breast cancer in order to implement precision health care in diverse populations. This innovative approach has the potential to improve the quality of care and reduce costs while saving more lives.
Disclosures: Dr. Olopade serves on the Medical Advisory Board for CancerIQ. Dr. Daly serves as a director of Quadrant Holdings Corporation and receives compensation from this entity. Frontline Medical Communications is a subsidiary of Quadrant Holdings Corporation.
Published in conjunction with Susan G. Komen®.
This is the second installment of a five-part monthly series that will discuss the pathologic, genomic, and clinical factors that contribute to the racial survival disparity in breast cancer. The series, which is adapted from an article that originally appeared in CA: A Cancer Journal for Clinicians1, a journal of the American Cancer Society, will also review exciting and innovative interventions to close this survival gap. This month’s column reviews tumor biology and genomics—the first element in the perfect storm.
Hormone receptor status and human epidermal growth factor receptor 2 (HER2)/neu
Breast cancer is not a single disease, and breast cancer subtype classifications are used in the clinical setting to determine prognosis and guide management. These different molecular subtypes are based on tumor markers, which include the presence or absence of three proteins: estrogen receptor (ER), progesterone receptor (PR), and HER2/neu. Hormone receptor status is a main factor in planning breast cancer treatment. Hormone receptor–positive breast tumors benefit from hormone therapies, such as selective ER modulators (for example, tamoxifen) and aromatase inhibitors (for example, anastrozole). Thus, these tumors have a more favorable disease-specific survival than do hormone receptor–negative tumors.2
African American women are more likely to present with hormone receptor-negative tumors. In an analysis of the California Cancer Registry, which has collected patient ER and PR status since 1990, whites had a higher proportion of tumors that were ER positive or PR positive (or both) and HER2 negative (72% vs. 53%).3 DeSantis et al.4 reported similar results for this tumor type, with 76% of non-Hispanic whites having hormone receptor–positive, HER2-negative tumors vs. 62% of non-Hispanic blacks. Even with stratification by tumor stage, African Americans continue to have a significantly higher proportion of hormone receptor–negative tumors than do whites for localized and advanced disease.5
Although hormone receptor status varies significantly by race, HER2 status does not show the same divergence. HER2 overexpression is present in approximately 20% of invasive breast cancers. HER2-positive, hormone receptor–negative tumors demonstrate more-aggressive features and worse breast cancer–specific survival than do hormone receptor–positive and HER2-negative tumors,2 although survival has vastly improved with new HER2-targeted therapies such as trastuzumab and pertuzumab. Unlike hormone receptor status, there was no association between race and HER2-positive/ER-negative tumors in the Carolina Breast Cancer Study.2
Triple-negative breast cancer (TNBC)
TNBC is the subtype of breast cancer with the worst prognosis. TNBC gets its name because its tumor cells lack the markers for ER, PR, and HER2 overexpression. Thus, TNBC tumors are estrogen receptor negative (ER), progesterone receptor negative (PR), and HER2/neu negative (HER2). While other subtypes of breast cancer have benefited from drug development regarding hormonal therapies and HER2-targeted treatments, TNBC has not experienced the same pharmacologic breakthroughs.
As such, even after analyses control for the stage at diagnosis, women with this subtype have poorer survival than those with other breast cancers.6 African American women have a higher incidence of TNBC than white women.7 DeSantis et al.4 reported that 22% of breast cancers were triple negative in non-Hispanic black patients vs. only 11% in non-Hispanic white patients. The Carolina Breast Cancer Study found that 26% of African American women had TNBC, whereas 16% of non-African American women did.2 This subtype was most common among younger, premenopausal African American women (39% of diagnosed cancer subtypes). When TNBC patients were excluded from analysis in the Carolina Breast Cancer Study, breast cancer–specific survival remained significantly worse among premenopausal African American women, suggesting that although tumor biology in part explains the poor outcomes, the survival disparity story is more complex.
Germline mutations: BRCA1 and BRCA2 Mutations
In addition to tumor biology, cancer genomics has become increasingly important in determining cancer prognosis and guiding treatment. Approximately 5%-10% of breast cancer cases present in individuals with inherited mutations in autosomal dominant, highly penetrant breast cancer susceptibility genes.8 Accounting for 80%-90% of families containing multiple cases of breast and ovarian cancer, BRCA1 and BRCA2 germline mutations are the most common of the breast cancer susceptibility genes.9 These patients often are younger and have a higher-grade tumor that is hormone receptor negative, which also often matches the profile of the African American breast cancer patient.10
Despite similarities between BRCA1-associated breast cancers and breast cancer in African Americans, genetic abnormalities in African American breast cancer patients remain underresearched. Nanda et al.11 found that BRCA1 and BRCA2 mutations occur with appreciable frequency in high-risk families of African ancestry, with 28% testing positive for a deleterious mutation in one of these genes. This frequency was at a lower rate than that found in non-Hispanic, non-Jewish whites, who had a rate of 46%, because African Americans had a higher rate of polymorphisms or variants of unknown significance (44% vs. 12%). This large percentage of variants of unknown significance indicates that more analysis is needed to understand the clinical implications of these genetic variations. In another study from the Northern California site of the Breast Cancer Family Registry, the BRCA1 mutation prevalence was 16.7% in African American cases diagnosed under the age of 35 years vs. 7.2% in non-Hispanic, non-Ashkenazi Jewish whites in the same age category.12 High frequencies of mutations in BRCA1 and BRCA2 have also been reported in breast cancer patients of African ancestry from Nigeria and the Bahamas.13, 14
These results in African American patients highlight the need for further study of breast cancer genomics in minority populations. However, Armstrong et al.15 illuminated the existence of racial/ethnic disparities in patterns of referral to cancer risk clinics. In their study, African American women with a family history of breast or ovarian cancer were significantly less likely to undergo genetic counseling for BRCA1/2 testing than were white women with this family history. The results of this study were noteworthy for the magnitude of the disparity, with white women having almost five times greater odds of undergoing this clinically important evaluation. More than two decades after BRCA1 and BRCA2 genes were identified, larger studies are still needed in diverse populations to derive true estimates of the burden of mutations in both genes in underserved and understudied populations.
Although these differences in tumor biology and genomics tell part of the mortality disparity story, there is more to be told. In a study of African American and white patients in South Carolina, Adams et al.16 determined survival rates by ethnicity that were adjusted for disease stage and other prognostic characteristics. After they controlled for age, stage, ER, and HER2 expression as well as insurance status, African American women still had a twofold excess risk of death from breast cancer. Thus, in addition to differences in the innate characteristics of the breast tumors, racial differences in patterns of care for women with breast cancer must be considered in unraveling the observed disparity in mortality. The third installment of this series will discuss the second element of the perfect storm – patterns of care.
Other installments of this column can be found in the Related Content box.
1. Daly B, Olopade OI. A perfect storm: How tumor biology, genomics, and health care delivery patterns collide to create a racial survival disparity in breast cancer and proposed interventions for change. CA Cancer J Clin. 2015;65(3):221-238.
2. Carey LA, Perou CM, Livasy CA, et al. Race, breast cancer subtypes, and survival in the Carolina Breast Cancer Study. JAMA. 2006;295(21):2492-502.
3. Kurian AW, Fish K, Shema SJ, Clarke CA. Lifetime risks of specific breast cancer subtypes among women in four racial/ethnic groups. Breast Cancer Res. 2010;12(6):R99.
4. DeSantis CE, Fedewa SA, Goding Sauer A, Kramer JL, Smith RA, Jemal A. Breast cancer statistics, 2015: Convergence of incidence rates between black and white women. CA Cancer J Clin. 2015 Oct 29. doi: 10.3322/caac.21320. [Epub ahead of print]
5. Setiawan VW, Monroe KR, Wilkens LR, Kolonel LN, Pike MC, Henderson BE. Breast cancer risk factors defined by estrogen and progesterone receptor status: the multiethnic cohort study. Am J Epidemiol. 2009;169(10):1251-9.
6. Bauer KR, Brown M, Cress RD, Parise CA, Caggiano V. Descriptive analysis of estrogen receptor (ER)-negative, progesterone receptor (PR)-negative, and HER2-negative invasive breast cancer, the so-called triple-negative phenotype: a population-based study from the California cancer Registry. Cancer. 2007;109(9):1721-8.
7. Ray M, Polite BN. Triple-negative breast cancers: a view from 10,000 feet. Cancer J. 2010;16(1):17-22.
8. Claus EB, Schildkraut JM, Thompson WD, Risch NJ. The genetic attributable risk of breast and ovarian cancer. Cancer. 1996;77(11):2318-24.
9. Easton DF, Bishop DT, Ford D, Crockford GP. Genetic linkage analysis in familial breast and ovarian cancer: results from 214 families. The Breast Cancer Linkage Consortium. Am J Hum Genet. 1993;52(4):678-701.
10. Polite BN, Olopade OI. Breast cancer and race: a rising tide does not lift all boats equally. Perspect Biol Med. 2005;48(1 Suppl):S166-75.
11. Nanda R, Schumm LP, Cummings S, et al. Genetic testing in an ethnically diverse cohort of high-risk women: a comparative analysis of BRCA1 and BRCA2 mutations in American families of European and African ancestry. JAMA. 2005;294(15):1925-33.
12. John EM, Miron A, Gong G, et al. Prevalence of pathogenic BRCA1 mutation carriers in 5 US racial/ethnic groups. JAMA. 2007;298(24):2869-76.
13. Fackenthal JD, Zhang J, Zhang B, et al. High prevalence of BRCA1 and BRCA2 mutations in unselected Nigerian breast cancer patients. Int J Cancer. 2012;131(5):1114-23.
14. Donenberg T, Lunn J, Curling D, et al. A high prevalence of BRCA1 mutations among breast cancer patients from the Bahamas. Breast Cancer Res Treat. 2011;125(2):591-6.
15. Armstrong K, Micco E, Carney A, Stopfer J, Putt M. Racial differences in the use of BRCA1/2 testing among women with a family history of breast or ovarian cancer. JAMA. 2005;293(14):1729-36.
16. Adams SA, Butler WM, Fulton J, et al. Racial disparities in breast cancer mortality in a multi-ethnic cohort in the Southeast. Cancer. 2012;118(10):2693-9.
Bobby Daly, MD, MBA, is the chief fellow in the section of hematology/oncology at the University of Chicago Medicine. His clinical focus is breast and thoracic oncology, and his research focus is health services. Specifically, Dr. Daly researches disparities in oncology care delivery, oncology health care utilization, aggressive end-of-life oncology care, and oncology payment models. He received his MD and MBA from Harvard Medical School and Harvard Business School, both in Boston, and a BA in Economics and History from Stanford (Calif.) University. He was the recipient of the Dean’s Award at Harvard Medical and Business Schools.
Olufunmilayo Olopade, MD, FACP, OON, is the Walter L. Palmer Distinguished Service Professor of Medicine and Human Genetics, and director, Center for Global Health at the University of Chicago. She is adopting emerging high throughput genomic and informatics strategies to identify genetic and nongenetic risk factors for breast cancer in order to implement precision health care in diverse populations. This innovative approach has the potential to improve the quality of care and reduce costs while saving more lives.
Disclosures: Dr. Olopade serves on the Medical Advisory Board for CancerIQ. Dr. Daly serves as a director of Quadrant Holdings Corporation and receives compensation from this entity. Frontline Medical Communications is a subsidiary of Quadrant Holdings Corporation.
Published in conjunction with Susan G. Komen®.
Promoting Mobility and Reducing LOS
Annually, more than 35 million patients are hospitalized in the United States, with many experiencing hospital‐acquired impairments in physical functioning during their in‐patient stay.[1, 2, 3, 4] Such impairments include difficulties performing basic activities of daily living, such as rising from a chair, toileting, or ambulating. This functional decline may result in increased length of stay (LOS), nursing home placement, and decreased mobility and participation in community activities even years after hospitalization.[1, 2, 3, 5, 6, 7] Ameliorating this hospital‐acquired functional impairment is important to improving patient outcomes and reducing healthcare utilization. Even the sickest hospitalized patients (eg, those in the intensive care unit [ICU]), can safely and feasibly benefit from early mobilization.[6, 8, 9, 10, 11] In the non‐ICU setting there is also evidence that patient mobilization reduces LOS and hospital costs, while improving patient satisfaction and physical and psychological outcomes.[12, 13, 14, 15, 16] These studies are, however, difficult to replicate as part of routine clinical care, because they often do not present the details of how early mobility was incorporated into daily practice, require additional hospital resources (eg, specially trained providers or additional staff), or are focused only on a select patient population.
The Johns Hopkins medical ICU started early rehabilitation quality‐improvement (QI) work in 2007, which has demonstrated ongoing reductions in LOS and been transformative in terms of helping to foster a culture of mobility at our institution. Previous research suggests that ICU‐based rehabilitation interventions are often not carried over to the ward setting, even in post‐ICU patients.[17] Moreover, trends for sicker patients being admitted in our general medicine units,[18] growing reports of patients spending most of their time in bed,[2, 19, 20] and healthcare policies emphasizing the importance of improving inpatient outcomes motivated the need for QI to improve patient mobility in this setting. Experience from the medical ICU‐based early rehabilitation program helped drive multidisciplinary collaboration of stakeholders to develop this nurse‐driven, mobility promotion QI project on 2 general medicine hospital units. The main goals of the project were to see whether a QI framework can be used in a general medicine setting to increase patient mobility and reduce LOS.[21, 22]
METHODS
Overview of Project
Mobility, for this project, was defined as a patient getting out of bed (eg, sitting out of bed, toileting at bedside commode or bathroom, standing, and ambulating). We aimed to increase patient mobility using preexisting unit staffing ratios of clinicians and support staff. This project was reported in accordance with the SQUIRE (Standards for QUality Improvement Reporting Excellence) guidelines and used a structured QI model that had been used to successfully promote early mobility in the intensive care unit.[21, 23, 24, 25] The planning phase of the QI project began in spring 2012, with initiation of the 12‐month project on March 1, 2013. During the 12‐month QI period, prospective collection of mobility status occurred for all patients, with no exclusions based on patient characteristics.
Setting
The QI project setting was 2, 24‐bed, general medicine units at the Johns Hopkins Hospital, a large academic medical center located in Baltimore, Maryland.
QI Process
The primary goals of the QI project were to mobilize patients 3 times daily, quantify and document the mobility of the patients, set daily goals to increase mobility (eg, move up 1 step on the scale today), and standardize the description of patient mobility across all hospital staff. We used a structured QI model that that has been used to implement an early mobility program in a medical ICU at our institution[21, 22, 24] (see Supporting Information, Appendix, in the online version of this article). At a programmatic level, we involved key stakeholders (nurses, physicians, rehabilitation therapists, administrators) in the QI project team, we identified local barriers to implementation through team meetings as well as a survey tool to identify perceived barriers,[26] and we developed a scale (the Johns Hopkins Highest Level of Mobility [JH‐HLM]) to document mobility. The JH‐HLM is an 8‐point ordinal scale that captures mobility milestones, where 1 = only lying, 2 = bed activities, 3 = sit at edge of bed, 4 = transfer to chair/commode, 5 = standing for 1 minute, 6 = walking 10+ steps, 7 = walking 25+ feet, and 8 = walking 250+ feet (see Supporting Information, Appendix and Supporting Figure 1, in the online version of this article for additional information on the JH‐HLM scale).
The 12‐month QI project was characterized by several phases and milestones and involved a number of intervention components. During the first 4 months (ramp‐up phase), nurses received education in the form of unit‐based presentations, hands‐on‐training, and online education modules. On a 5‐times weekly basis, nurses met with rehabilitation therapists for unit‐based huddles to discuss baseline patient mobility, current patient mobility levels, barriers to mobilizing patients, and daily goals to progress mobility. Mobility levels were included on daily nursing report sheets to facilitate communication with subsequent shifts. Discussion of JH‐HLM scores also occurred during daily unit‐based care‐coordination meetings of the nurses, physicians, and social‐workers to address barriers to mobilizing patients, such as optimizing pain control, facilitating discharge location planning, and expediting physician consultation with physical and occupational therapy for appropriate patients. Audit and feedback from huddles and care‐coordination rounds resulted in improved nurse attendance and engagement during these meetings. Nurses were expected to document patient mobility scores using the JH‐HLM 3 times daily in the patient medical record. On the fourth month, reports on JH‐HLM scores and documentation compliance were available to nurse managers, champions, and unit staff. Via twice‐monthly meetings with the units and quarterly meetings with hospital leadership and administration, problems arising during the QI intervention were evaluated and resolved on a timely basis. Seven months after project execution started, educational sessions were repeated to all staff, and feedback was provided based on the data collected, such as documentation compliance rates and patient mobility levels, and nurse champions presented the project during an American Nurses Credentialing Center magnet recognition program visit. Lastly, mobility scores and documentation compliance were continually assessed for 4 months after the project completion to determine sustainability of the intervention. Additional details of the QI project implementation are provided in the Supporting Information, Appendix, in the online version of this article.
Data Sources and Covariates for Project Evaluation
The Sunrise Clinical Manager system (Allscripts Healthcare Solutions Inc., Chicago, IL) was used to document and extract nursing‐documented JH‐HLM scores. The Johns Hopkins Hospital Datamart financial database, used for mandatory reporting to the State of Maryland, provided data on LOS, age, sex, race (white, black, other), payer (Medicare, Medicaid, other), primary admission diagnosis, and comorbidity index using Agency for Healthcare Research and Quality (AHRQ) methodology.[27] Expected LOS was calculated using the risk adjustment method developed by the University Health System Consortium (UHC).[28] This calculation uses a combination of the Diagnostic‐Related Group grouper and the Sachs Complication Profiler[29] in conjunction with data on specific patient characteristics (age, sex, urgency of admission, payer category) to construct risk‐adjustment regression models that assign expected values for LOS, and is not based on actual LOS.[28] The databases were linked at the patient level using the patient's medical record and unique admission record number.
Outcome Measures
Two functional outcome measures were based on daily JH‐HLM scores, which frequently occurred several times on each patient‐day: (1) the maximum daily JH‐HLM scores for each patient‐day during hospitalization, and (2) the intrapatient change in JH‐HLM scores between the maximum JH‐HLM score within 24 hours of hospital admission and 24 hours before discharge for all patients who were on the unit >48 hours. We also compared the mean LOS during the 12‐month QI project versus the 12‐months prior so we could more accurately address seasonal differences.[30, 31, 32, 33, 34, 35] Lastly, because the perception of increased falls was an important barrier to address in the QI process, we compared the rate of injurious falls between the QI period and 12‐months prior.
Statistical Analysis
To evaluate changes in the percent of ambulatory patients (JH‐HLM 6), we compared the initial 4 months of the QI project (ramp‐up phase) with the same 4‐month period occurring immediately after project completion (post‐QI phase) using generalized estimating equations to account for clustering at the patient‐level. This test was also used to evaluate changes in documentation compliance rates between the 2 phases, with compliance defined as at least 1 instance of JH‐HLM documentation per day, excluding the day of admission and discharge. To evaluate if improved JH‐HLM results were driven by improved documentation compliance rates over time, we performed a sensitivity analysis by imputing a JH‐HLM score of 6 (ambulate 10+ steps) for any missing daily maximum JH‐HLM scores.
To assess unadjusted changes in LOS during the 12‐month QI project versus the same period 1 year earlier, we compared mean and median LOS using a t test and Wilcoxon rank sum test, respectively. We used a multivariable linear regression model to estimate the change (expressed in days) in adjusted median LOS comparing the project months (March 2013March 2014) with 12 months prior (March 2012March 2013). The model adjusted for age, gender, race, payer, admission diagnostic category, UHC expected LOS, and AHRQ comorbidity index. We confirmed a lack of multicollinearity in the multivariable regression model using variance inflation factors. We evaluated residual versus predicted value plots and residual versus fitted value plots with a locally weighted scatterplot smoothing line to confirm model fit. P values are reported from the test of the null hypothesis that the change in adjusted median LOS is the same comparing the QI project months versus 12 months prior. Separate models estimated and tested the change in adjusted median LOS by tertiles of expected LOS (<4, 47, and >7 days). Lastly, we compared the rate of injurious falls (the number of injurious falls by total patient‐days) between the QI period and 12 months prior using an exact Poisson method.[36] Statistical significance was defined as a 2‐sided P < 0.05. Statistical analyses were conducted using R (version 3.1.0; The R Foundation for Statistical Computing, Vienna, Austria;
RESULTS
During the QI project period, 3352 patients were admitted to the 2 general medicine units. Twelve (0.4%) patients expired on the units, but their data were retained in the analysis. Mean (standard deviation [SD]) age of the patients was 54.4 (18.3) years, with 47% male, and 54% African American. A total of 1896 of 6654 (28%) patients on the QI units were 65 years old. Patient characteristics were similar during the QI period versus 12 months prior (Table 1).
| Characteristics | Comparison Period, March 2012March 2013, N = 3,302 | QI Period, March 2013March 2014, N = 3,352 |
|---|---|---|
| ||
| Age, y | 53.3 (17.8) | 54.4 (18.3) |
| Male | 1467 (44%) | 1569 (47%) |
| Race | ||
| African American | 1883 (57%) | 1809 (54%) |
| Caucasian | 1269 (38%) | 1348 (40%) |
| Other | 150 (5%) | 195 (6%) |
| Payer | ||
| Medicare | 1310 (40%) | 1470 (44%) |
| Medicaid | 1015 (31%) | 925 (28%) |
| Other | 977 (30%) | 957 (29%) |
| Admission diagnostic category | ||
| Infectious disease | 579 (18%) | 629 (19%) |
| Pulmonary | 519 (16%) | 559 (17%) |
| Gastrointestinal | 535 (16%) | 494 (15%) |
| Cardiovascular | 410 (12%) | 405 (12%) |
| Hematologic | 199 (6%) | 195 (6%) |
| Renal | 220 (7%) | 205 (6%) |
| Other | 840 (25%) | 865 (26%) |
| UHC expected length of stay, d | 5.5 (3.3) | 5.3 (3.2) |
| AHRQ comorbidity index | 3.3 (1.7) | 3.5 (1.8) |
During the 12‐month QI project, there were a total of 13,815 patient‐days of documented mobility data and the median (interquartile range [IQR]) number of days of documentation for each hospital admission was 3 (25) days. Compliance with daily documentation of JH‐HLM was 85.0% over the entire 12‐month QI project. Documentation compliance started at 83% during the ramp‐up phase and increased to 89% during the last 4 months of the project (late‐QI phase, P < 0.001).
Comparing the ramp‐up phase versus post‐QI phase, the percentage of patient‐days in which patients ambulated (JH‐HLM 6) increased from 43% to 70% (P < 0.001), and the percentage of patients who experienced an improvement in their mobility scores between admission and discharge increased from 32% to 45% (P < 0.001), as shown in Table 2. In the sensitivity analysis imputing missing daily JH‐HLM scores and comparing the ramp‐up versus post‐QI phases, the results were similar to the primary analysis; the percent of patient‐days where patients ambulated increased from 60% to 78% (P < 0.001), and the percent of patients who experienced an improvement in their mobility scores increased from 26% to 48% (P < 0.001).
| JH‐HLM Category | Ramp‐up Phase, March 1, 2013 June 30, 2013, n = 4,649 | Late‐QI Phase, November 1, 2013February 28, 2013, n = 4,515 | Post‐QI Phase, March 1, 2014 June 30, 2014, n = 4,298 |
|---|---|---|---|
| Change in Mobility (Admission Versus Discharge) | Ramp‐up Phase, March 1, 2013June 30, 2013, n = 968 | Late‐QI Phase, November 1, 2013February 28, 2013, n = 893 | Post‐QI Phase, March 1, 2014 June 30, 2014, n = 834 |
| |||
| Walk (JH‐HLM = 6, 7, or 8) | 1,994 (43) | 3,430 (76) | 2,986 (70) |
| Stand/chair (JH‐HLM = 4 or 5) | 1,772 (38) | 488 (10) | 511 (12) |
| Bed (JH‐HLM = 1, 2, or 3) | 883 (19) | 597 (13) | 801 (19) |
| Improved | 305 (32) | 392 (44) | 379 (45) |
| No change | 512 (53) | 428 (48) | 386 (46) |
| Declined | 151 (16) | 73 (8) | 69 (8) |
LOS during the 12‐month QI project versus the 12‐months immediately prior was shorter (Table 3), with an unadjusted median (IQR) LOS of 3 (26) versus 4 (27) days (P < 0.001) and an unadjusted mean (SD) LOS of 5.1 (5.6) versus 6.0 (7.6) (P < 0.001).
Adjusted Median LOS, d | Absolute Change in Adjusted Median LOS (95% CI), d | P Value | ||
|---|---|---|---|---|
| 12 Months Prior | QI Project Months | |||
| ||||
| All patients | 6.01 | 5.61 | 0.40 (0.57 to 0.21), N = 4,411 | <0.001 |
| Subgroups by ELOS | ||||
| ELOS <4 days | 4.68 | 4.77 | 0.09 (0.13 to 0.32), N = 1,357 | 0.42 |
| ELOS 47 days | 5.68 | 5.38 | 0.30 (0.57 to 0.01), N = 1,509 | 0.04 |
| ELOS >7 days | 8.07 | 6.96 | 1.11 (1.53 to 0.65), N = 1,545 | <0.001 |
Table 3 displays the change in adjusted median LOS for the project months versus the 12 months prior among the QI units. We found that for all patients, there was an overall reduction in adjusted median LOS of 0.40 (95% confidence interval [CI]: 0.57 to 0.21, P<0.001) days. When we divided patients into tertiles based on their UHC expected LOS (ELOS), we observed that patients with longer ELOS had greater reductions in adjusted median LOS. Patients on the QI units with ELOS <4 days (lowest tertile) did not show a significant reduction in adjusted median LOS (0.09 days, 95% CI: 0.13 to 0.32, P = 0.42); however, patients with UHC ELOS 4 to 7 days (middle tertile) and ELOS >7 days (highest tertile) had a significant reduction in adjusted median LOS by 0.30 (95% CI: 0.57 to 0.01, P = 0.04) and 1.11 (95% CI: 1.53 to 0.65, P < 0.001) days during the QI project versus 12 months prior, respectively.
Lastly, we found that there was no difference in the rate of injurious falls on the QI units during QI period compared to 12 months prior (QI: 0.34 per 1000 patient‐days versus 12 months prior: 0.48 per 1000 patient‐days, P = 0.73).
DISCUSSION
We conducted a nurse‐driven, multidisciplinary mobility promotion QI project on 2 general medicine units at a large teaching hospital. The 12‐month QI project, conducted between March 1, 2013 and February 28, 2014, was associated with patients ambulating more frequently, with improved mobility status between hospital admission and discharge. These improvements in mobility were not associated with increased rates of injurious falls, and were sustained for at least 4 months after project completion. The QI project was associated with overall significant reduction in LOS for more complex patients with longer expected LOS (4 days or longer). Hence, such QI efforts may be important for maintaining or improving patients' functional status during hospitalization in a safe and cost‐effective manner.
Our findings are consistent with previous studies showing that mobility promotion in the acute hospital setting is feasible, can reduce length of stay, and can be applied to a diverse population including vulnerable medical patients with multiple comorbidities and the elderly.[12, 16, 37, 38, 39, 40, 41, 42] These studies provide valuable evidence of the benefits of mobility promotion; however, it is difficult to translate these prior results into routine clinical practice because they used specially trained staff to mobilize patients, focused on a select patient population, or did not specify how the mobility intervention was delivered within daily clinical workflows. Research in the medical ICU at our institution has previously described the use of a structured QI model to successfully implement an early rehabilitation program.[22, 24] Here, we successfully adapted the same QI framework to a general medicine setting. Hence, our study contributes to the literature with respect to (1) use of a structured QI framework to develop a successful patient mobility program in a general medicine patient population, and (2) sharing best practices from 1 clinical setting, such as the ICU, as a source of learning and knowledge translation for other care settings, with the addition of novel tools, such as the JH‐HLM scale.
There may have been several factors that contributed to shorter stays in the hospital we observed during the QI project. First, we increased the number of ambulatory patient‐days, which may have helped prevent physiological complications of bed rest, such as muscle weakness, atelectasis, insulin resistance, vascular dysfunction, contractures, and pressure ulcers.[43] As such, mobility promotion has been associated with reduced rates of other hospital‐acquired complications, such as deep venous thrombosis, pneumonia, and delirium.[44, 45, 46] In our study, we saw the greatest LOS reduction in more complex patients who were expected to spend a longer time in the hospital and are at greater risk of developing complications from bed rest. Second, our early mobility project may have had a direct impact on care‐coordination processes as reported in prior studies.[47, 48, 49] An important component of our intervention was incorporating functional status into multidisciplinary discussions, either through nurse‐to‐therapist huddles or care‐coordination rounds between nurses, therapists, physicians, social workers, and case managers. During care‐coordination rounds, JH‐HLM scores were reported to expedite appropriate physical and occupational therapy consultations and assist in determining appropriate discharge location. During the QI project, we transitioned from a unit‐based daily huddle between nursing and rehabilitation therapists to a system where mobility status was discussed primarily during care coordination rounds 5 times per week. We saw that mobility scores were maintained after QI project completion, suggesting that reporting on patient function in a multidisciplinary setting is a potentially sustainable mechanism to improve care‐coordination processes that are affected by functional status.
Our study has several potential limitations. First, this is a single‐site study in 2 general medicine units of a large academic hospital. Further research is needed to determine if this structured QI intervention and its benefits can be generalized to different settings and different patient populations. Second, because the documentation was initially an optional element in the electronic medical record system, we observed higher rates of missing documentation during the first 4 months of the project versus the comparison period at 4 months after project completion. However, a sensitivity analysis conducted of these missing data demonstrated similar results to our primary analysis. Third, our nonrandomized pre‐post study design does not allow us to conclude a direct cause‐and‐effect relationship between our intervention and increased mobility and reduced LOS. Although patient characteristics were similar between the 2 periods and adjusted for in our multivariable regression analysis, we cannot rule out the possibility of secular trends in LOS on the project units and that broader QI efforts at our institution also contributed to reduction in LOS. Fourth, we do not have data on 30‐day readmissions and discharge location. Future studies should explore the impact of hospital‐based mobility interventions on these outcomes.[50] Fifth, although nurses consistently documented the highest level of mobility on a daily basis, these data did not capture other potentially important information about patient mobility such as the daily frequency that patients were mobilized, the length of time a patient was engaged in a mobility event (ie, number of hours sitting in a chair), or the mobility that occurred during physical therapy or occupational therapy sessions. Hence, although we used JH‐HLM as a marker of improved mobility during our QI project it is likely that our data cannot fully describe the total mobility and activity that patients experienced during hospitalization. Lastly, although the front‐line staff and QI team found the JH‐HLM scale to be a useful tool to measure and advance patient mobility, further studies are needed to evaluate the reliability and validity of this scale.
CONCLUSION
A structured QI process can improve patient mobility and may contribute to reduction in LOS, particularly for more complex patients in this setting. Active prevention of decline in physical function that commonly occurs during hospitalization may prove valuable for improving patient outcomes and reducing healthcare resource utilization.
Disclosures
The authors certify that no party having a direct interest in the results of the research supporting this article has or will confer a benefit on us or on any organization with which we are associated. The authors report no conflicts of interest.
- , , , et al. Loss of independence in activities of daily living in older adults hospitalized with medical illnesses: increased vulnerability with age. J Am Geriatr Soc. 2003;51(4):451–458.
- , , . Prevalence and outcomes of low mobility in hospitalized older patients. J Am Geriatr Soc. 2004;52(8):1263–1270.
- , , , , , . Trajectories of life‐space mobility after hospitalization. Ann Intern Med. 2009;150(6):372–378.
- , , . Hospitalization‐associated disability: “She was probably able to ambulate, but I'm not sure”. JAMA. 2011;306(16):1782–1793.
- , , , , , . Physical fitness and all‐cause mortality. A prospective study of healthy men and women. JAMA. 1989;262(17):2395–2401.
- . Mobilizing patients in the intensive care unit: improving neuromuscular weakness and physical function. JAMA. 2008;300(14):1685–1690.
- , . Mobility limitation in the older patient: a clinical review. JAMA. 2013;310(11):1168–1177.
- , , , et al. Early physical and occupational therapy in mechanically ventilated, critically ill patients: a randomised controlled trial. Lancet. 2009;373(9678):1874–1882.
- , , . Technology to enhance physical rehabilitation of critically ill patients. Crit Care Med. 2009;37(10 suppl):S436–S441.
- , , , et al. Receiving early mobility during an intensive care unit admission is a predictor of improved outcomes in acute respiratory failure. Am J Med Sci. 2011;341(5):373–377.
- . Physiotherapy in intensive care: an updated systematic review. Chest. 2013;144(3):825–847.
- , , . Exercise for acutely hospitalised older medical patients. Cochrane Database Syst Rev. 2007;(1):CD005955.
- , , . Extra physical therapy reduces patient length of stay and improves functional outcomes and quality of life in people with acute or subacute conditions: a systematic review. Arch Phys Med Rehabil. 2011;92(9):1490–1500.
- , . Impact of early mobilization protocol on the medical‐surgical inpatient population: an integrated review of literature. Clin Nurse Spec. 2012;26(2):87–94.
- , , . Outcomes of inpatient mobilization: a literature review. J Clin Nurs. 2014;23(11–12):1486–1501.
- , , , et al. The early mobility bundle: a simple enhancement of therapy which may reduce incidence of hospital‐acquired pneumonia and length of hospital stay. J Hosp Infect. 2014;88(1):34–39.
- , , , , . Physical therapy on the wards after early physical activity and mobility in the intensive care unit. Phys Ther. 2012;92(12):1518–1523.
- , , , . Impact of hospital variables on case mix index as a marker of disease severity. Popul Health Manag. 2014;17(1):28–34.
- , , , , . Frequency of hallway ambulation by hospitalized older adults on medical units of an academic hospital. Geriatr Nurs. 2004;25(4):212–217.
- , , . Activity level of hospital medical inpatients: an observational study. Arch Gerontol Geriatr. 2012;55(2):417–421.
- , , . Translating evidence into practice: a model for large scale knowledge translation. BMJ. 2008;337:a1714.
- , , , et al. Early physical medicine and rehabilitation for patients with acute respiratory failure: a quality improvement project. Arch Phys Med Rehabil. 2010;91(4):536–542.
- , , , , ; SQUIRE development group. Publication guidelines for quality improvement studies in health care: evolution of the SQUIRE project. BMJ. 2009;338:a3152.
- , . Rehabilitation quality improvement in an intensive care unit setting: implementation of a quality improvement model. Top Stroke Rehabil. 2010;17(4):271–281.
- , , , . ICU early mobilization: from recommendation to implementation at three medical centers. Crit Care Med. 2013;41(9 suppl 1):S69–S80.
- , , , . Barriers to early mobility of hospitalized general medicine patients: survey development and results. Am J Phys Med Rehabil. 2015;94(4):304–312.
- , , , . Comorbidity measures for use with administrative data. Med Care. 1998;36(1):8–27.
- UHC Clinical Information Management Risk Adjustment of the UHC Clinical Data Base. Chicago, IL: University HealthSystem Consortium; 1998.
- Sachs Complications Profiler, Version 1.0, User's Guide. Evanston, IL: Sachs Group; 1995.
- , , . Assessing hospital‐associated deaths from discharge data. The role of length of stay and comorbidities. JAMA. 1988;260(15):2240–2246.
- , , , et al. Annual rates of admission and seasonal variations in hospitalizations for heart failure. Eur J Heart Fail. 2002;4(6):779–786.
- , , , . Regional and seasonal variation in the length of hospital stay for chronic obstructive pulmonary disease in Finland. Int J Circumpolar Health. 2002;61(2):131–135.
- , , , , , ; Canadian CABG Surgery Quality Indicator Consensus Panel. The identification and development of canadian coronary artery bypass graft surgery quality indicators. J Thorac Cardiovasc Surg. 2005;130(5):1257.
- , , , . Quality of care and length of hospital stay among patients with stroke. Med Care. 2009;47(5):575–582.
- . A systematic review of outcomes and quality measures in adult patients cared for by hospitalists vs nonhospitalists. Mayo Clin Proc. 2009;84(3):248–254.
- . Confidence intervals that match Fisher's exact or Blaker's exact tests. Biostatistics. 2010;11(2):373–374.
- , , , et al. A multicomponent intervention to prevent delirium in hospitalized older patients. N Engl J Med. 1999;340(9):669–676.
- , , , , . Early mobilization of patients hospitalized with community‐acquired pneumonia. Chest. 2003;124(3):883–889.
- , , , et al. Effects of a walking intervention on fatigue‐related experiences of hospitalized acute myelogenous leukemia patients undergoing chemotherapy: a randomized controlled trial. J Pain Symptom Manage. 2008;35(5):524–534.
- , , , , . Early ambulation and length of stay in older adults hospitalized for acute illness. Arch Intern Med. 2010;170(21):1942–1943.
- , , . Impact of a nurse‐driven mobility protocol on functional decline in hospitalized older adults. J Nurs Care Qual. 2009;24(4):325–331.
- , , . Exercising body and mind: an integrated approach to functional independence in hospitalized older people. J Am Geriatr Soc. 2008;56(4):630–635.
- . Consequences of bed rest. Crit Care Med. 2009;37(10 suppl):S422–S428.
- , , , , . Time to ambulation after hip fracture surgery: relation to hospitalization outcomes. J Gerontol A Biol Sci Med Sci. 2003;58(11):M1042–M1045.
- , , , . Early mobilization after total knee replacement reduces the incidence of deep venous thrombosis. ANZ J Surg. 2009;79(7–8):526–529.
- , , , . Efficacy and safety of postoperative early mobilization for chronic subdural hematoma in elderly patients. Acta Neurochir (Wien). 2010;152(7):1171–1174.
- , , , et al. Impact of relational coordination on quality of care, postoperative pain and functioning, and length of stay: a nine‐hospital study of surgical patients. Med Care. 2000;38(8):807–819.
- Care coordination cuts admissions, ED visits, LOS. Hosp Case Manag. 2013;21(5):67–68.
- , . A heart failure initiative to reduce the length of stay and readmission rates. Prof Case Manag. 2014;19(6):276–284.
- , , , , , . Association of impaired functional status at hospital discharge and subsequent rehospitalization. J Hosp Med. 2014;9(5):277–282.
Annually, more than 35 million patients are hospitalized in the United States, with many experiencing hospital‐acquired impairments in physical functioning during their in‐patient stay.[1, 2, 3, 4] Such impairments include difficulties performing basic activities of daily living, such as rising from a chair, toileting, or ambulating. This functional decline may result in increased length of stay (LOS), nursing home placement, and decreased mobility and participation in community activities even years after hospitalization.[1, 2, 3, 5, 6, 7] Ameliorating this hospital‐acquired functional impairment is important to improving patient outcomes and reducing healthcare utilization. Even the sickest hospitalized patients (eg, those in the intensive care unit [ICU]), can safely and feasibly benefit from early mobilization.[6, 8, 9, 10, 11] In the non‐ICU setting there is also evidence that patient mobilization reduces LOS and hospital costs, while improving patient satisfaction and physical and psychological outcomes.[12, 13, 14, 15, 16] These studies are, however, difficult to replicate as part of routine clinical care, because they often do not present the details of how early mobility was incorporated into daily practice, require additional hospital resources (eg, specially trained providers or additional staff), or are focused only on a select patient population.
The Johns Hopkins medical ICU started early rehabilitation quality‐improvement (QI) work in 2007, which has demonstrated ongoing reductions in LOS and been transformative in terms of helping to foster a culture of mobility at our institution. Previous research suggests that ICU‐based rehabilitation interventions are often not carried over to the ward setting, even in post‐ICU patients.[17] Moreover, trends for sicker patients being admitted in our general medicine units,[18] growing reports of patients spending most of their time in bed,[2, 19, 20] and healthcare policies emphasizing the importance of improving inpatient outcomes motivated the need for QI to improve patient mobility in this setting. Experience from the medical ICU‐based early rehabilitation program helped drive multidisciplinary collaboration of stakeholders to develop this nurse‐driven, mobility promotion QI project on 2 general medicine hospital units. The main goals of the project were to see whether a QI framework can be used in a general medicine setting to increase patient mobility and reduce LOS.[21, 22]
METHODS
Overview of Project
Mobility, for this project, was defined as a patient getting out of bed (eg, sitting out of bed, toileting at bedside commode or bathroom, standing, and ambulating). We aimed to increase patient mobility using preexisting unit staffing ratios of clinicians and support staff. This project was reported in accordance with the SQUIRE (Standards for QUality Improvement Reporting Excellence) guidelines and used a structured QI model that had been used to successfully promote early mobility in the intensive care unit.[21, 23, 24, 25] The planning phase of the QI project began in spring 2012, with initiation of the 12‐month project on March 1, 2013. During the 12‐month QI period, prospective collection of mobility status occurred for all patients, with no exclusions based on patient characteristics.
Setting
The QI project setting was 2, 24‐bed, general medicine units at the Johns Hopkins Hospital, a large academic medical center located in Baltimore, Maryland.
QI Process
The primary goals of the QI project were to mobilize patients 3 times daily, quantify and document the mobility of the patients, set daily goals to increase mobility (eg, move up 1 step on the scale today), and standardize the description of patient mobility across all hospital staff. We used a structured QI model that that has been used to implement an early mobility program in a medical ICU at our institution[21, 22, 24] (see Supporting Information, Appendix, in the online version of this article). At a programmatic level, we involved key stakeholders (nurses, physicians, rehabilitation therapists, administrators) in the QI project team, we identified local barriers to implementation through team meetings as well as a survey tool to identify perceived barriers,[26] and we developed a scale (the Johns Hopkins Highest Level of Mobility [JH‐HLM]) to document mobility. The JH‐HLM is an 8‐point ordinal scale that captures mobility milestones, where 1 = only lying, 2 = bed activities, 3 = sit at edge of bed, 4 = transfer to chair/commode, 5 = standing for 1 minute, 6 = walking 10+ steps, 7 = walking 25+ feet, and 8 = walking 250+ feet (see Supporting Information, Appendix and Supporting Figure 1, in the online version of this article for additional information on the JH‐HLM scale).
The 12‐month QI project was characterized by several phases and milestones and involved a number of intervention components. During the first 4 months (ramp‐up phase), nurses received education in the form of unit‐based presentations, hands‐on‐training, and online education modules. On a 5‐times weekly basis, nurses met with rehabilitation therapists for unit‐based huddles to discuss baseline patient mobility, current patient mobility levels, barriers to mobilizing patients, and daily goals to progress mobility. Mobility levels were included on daily nursing report sheets to facilitate communication with subsequent shifts. Discussion of JH‐HLM scores also occurred during daily unit‐based care‐coordination meetings of the nurses, physicians, and social‐workers to address barriers to mobilizing patients, such as optimizing pain control, facilitating discharge location planning, and expediting physician consultation with physical and occupational therapy for appropriate patients. Audit and feedback from huddles and care‐coordination rounds resulted in improved nurse attendance and engagement during these meetings. Nurses were expected to document patient mobility scores using the JH‐HLM 3 times daily in the patient medical record. On the fourth month, reports on JH‐HLM scores and documentation compliance were available to nurse managers, champions, and unit staff. Via twice‐monthly meetings with the units and quarterly meetings with hospital leadership and administration, problems arising during the QI intervention were evaluated and resolved on a timely basis. Seven months after project execution started, educational sessions were repeated to all staff, and feedback was provided based on the data collected, such as documentation compliance rates and patient mobility levels, and nurse champions presented the project during an American Nurses Credentialing Center magnet recognition program visit. Lastly, mobility scores and documentation compliance were continually assessed for 4 months after the project completion to determine sustainability of the intervention. Additional details of the QI project implementation are provided in the Supporting Information, Appendix, in the online version of this article.
Data Sources and Covariates for Project Evaluation
The Sunrise Clinical Manager system (Allscripts Healthcare Solutions Inc., Chicago, IL) was used to document and extract nursing‐documented JH‐HLM scores. The Johns Hopkins Hospital Datamart financial database, used for mandatory reporting to the State of Maryland, provided data on LOS, age, sex, race (white, black, other), payer (Medicare, Medicaid, other), primary admission diagnosis, and comorbidity index using Agency for Healthcare Research and Quality (AHRQ) methodology.[27] Expected LOS was calculated using the risk adjustment method developed by the University Health System Consortium (UHC).[28] This calculation uses a combination of the Diagnostic‐Related Group grouper and the Sachs Complication Profiler[29] in conjunction with data on specific patient characteristics (age, sex, urgency of admission, payer category) to construct risk‐adjustment regression models that assign expected values for LOS, and is not based on actual LOS.[28] The databases were linked at the patient level using the patient's medical record and unique admission record number.
Outcome Measures
Two functional outcome measures were based on daily JH‐HLM scores, which frequently occurred several times on each patient‐day: (1) the maximum daily JH‐HLM scores for each patient‐day during hospitalization, and (2) the intrapatient change in JH‐HLM scores between the maximum JH‐HLM score within 24 hours of hospital admission and 24 hours before discharge for all patients who were on the unit >48 hours. We also compared the mean LOS during the 12‐month QI project versus the 12‐months prior so we could more accurately address seasonal differences.[30, 31, 32, 33, 34, 35] Lastly, because the perception of increased falls was an important barrier to address in the QI process, we compared the rate of injurious falls between the QI period and 12‐months prior.
Statistical Analysis
To evaluate changes in the percent of ambulatory patients (JH‐HLM 6), we compared the initial 4 months of the QI project (ramp‐up phase) with the same 4‐month period occurring immediately after project completion (post‐QI phase) using generalized estimating equations to account for clustering at the patient‐level. This test was also used to evaluate changes in documentation compliance rates between the 2 phases, with compliance defined as at least 1 instance of JH‐HLM documentation per day, excluding the day of admission and discharge. To evaluate if improved JH‐HLM results were driven by improved documentation compliance rates over time, we performed a sensitivity analysis by imputing a JH‐HLM score of 6 (ambulate 10+ steps) for any missing daily maximum JH‐HLM scores.
To assess unadjusted changes in LOS during the 12‐month QI project versus the same period 1 year earlier, we compared mean and median LOS using a t test and Wilcoxon rank sum test, respectively. We used a multivariable linear regression model to estimate the change (expressed in days) in adjusted median LOS comparing the project months (March 2013March 2014) with 12 months prior (March 2012March 2013). The model adjusted for age, gender, race, payer, admission diagnostic category, UHC expected LOS, and AHRQ comorbidity index. We confirmed a lack of multicollinearity in the multivariable regression model using variance inflation factors. We evaluated residual versus predicted value plots and residual versus fitted value plots with a locally weighted scatterplot smoothing line to confirm model fit. P values are reported from the test of the null hypothesis that the change in adjusted median LOS is the same comparing the QI project months versus 12 months prior. Separate models estimated and tested the change in adjusted median LOS by tertiles of expected LOS (<4, 47, and >7 days). Lastly, we compared the rate of injurious falls (the number of injurious falls by total patient‐days) between the QI period and 12 months prior using an exact Poisson method.[36] Statistical significance was defined as a 2‐sided P < 0.05. Statistical analyses were conducted using R (version 3.1.0; The R Foundation for Statistical Computing, Vienna, Austria;
RESULTS
During the QI project period, 3352 patients were admitted to the 2 general medicine units. Twelve (0.4%) patients expired on the units, but their data were retained in the analysis. Mean (standard deviation [SD]) age of the patients was 54.4 (18.3) years, with 47% male, and 54% African American. A total of 1896 of 6654 (28%) patients on the QI units were 65 years old. Patient characteristics were similar during the QI period versus 12 months prior (Table 1).
| Characteristics | Comparison Period, March 2012March 2013, N = 3,302 | QI Period, March 2013March 2014, N = 3,352 |
|---|---|---|
| ||
| Age, y | 53.3 (17.8) | 54.4 (18.3) |
| Male | 1467 (44%) | 1569 (47%) |
| Race | ||
| African American | 1883 (57%) | 1809 (54%) |
| Caucasian | 1269 (38%) | 1348 (40%) |
| Other | 150 (5%) | 195 (6%) |
| Payer | ||
| Medicare | 1310 (40%) | 1470 (44%) |
| Medicaid | 1015 (31%) | 925 (28%) |
| Other | 977 (30%) | 957 (29%) |
| Admission diagnostic category | ||
| Infectious disease | 579 (18%) | 629 (19%) |
| Pulmonary | 519 (16%) | 559 (17%) |
| Gastrointestinal | 535 (16%) | 494 (15%) |
| Cardiovascular | 410 (12%) | 405 (12%) |
| Hematologic | 199 (6%) | 195 (6%) |
| Renal | 220 (7%) | 205 (6%) |
| Other | 840 (25%) | 865 (26%) |
| UHC expected length of stay, d | 5.5 (3.3) | 5.3 (3.2) |
| AHRQ comorbidity index | 3.3 (1.7) | 3.5 (1.8) |
During the 12‐month QI project, there were a total of 13,815 patient‐days of documented mobility data and the median (interquartile range [IQR]) number of days of documentation for each hospital admission was 3 (25) days. Compliance with daily documentation of JH‐HLM was 85.0% over the entire 12‐month QI project. Documentation compliance started at 83% during the ramp‐up phase and increased to 89% during the last 4 months of the project (late‐QI phase, P < 0.001).
Comparing the ramp‐up phase versus post‐QI phase, the percentage of patient‐days in which patients ambulated (JH‐HLM 6) increased from 43% to 70% (P < 0.001), and the percentage of patients who experienced an improvement in their mobility scores between admission and discharge increased from 32% to 45% (P < 0.001), as shown in Table 2. In the sensitivity analysis imputing missing daily JH‐HLM scores and comparing the ramp‐up versus post‐QI phases, the results were similar to the primary analysis; the percent of patient‐days where patients ambulated increased from 60% to 78% (P < 0.001), and the percent of patients who experienced an improvement in their mobility scores increased from 26% to 48% (P < 0.001).
| JH‐HLM Category | Ramp‐up Phase, March 1, 2013 June 30, 2013, n = 4,649 | Late‐QI Phase, November 1, 2013February 28, 2013, n = 4,515 | Post‐QI Phase, March 1, 2014 June 30, 2014, n = 4,298 |
|---|---|---|---|
| Change in Mobility (Admission Versus Discharge) | Ramp‐up Phase, March 1, 2013June 30, 2013, n = 968 | Late‐QI Phase, November 1, 2013February 28, 2013, n = 893 | Post‐QI Phase, March 1, 2014 June 30, 2014, n = 834 |
| |||
| Walk (JH‐HLM = 6, 7, or 8) | 1,994 (43) | 3,430 (76) | 2,986 (70) |
| Stand/chair (JH‐HLM = 4 or 5) | 1,772 (38) | 488 (10) | 511 (12) |
| Bed (JH‐HLM = 1, 2, or 3) | 883 (19) | 597 (13) | 801 (19) |
| Improved | 305 (32) | 392 (44) | 379 (45) |
| No change | 512 (53) | 428 (48) | 386 (46) |
| Declined | 151 (16) | 73 (8) | 69 (8) |
LOS during the 12‐month QI project versus the 12‐months immediately prior was shorter (Table 3), with an unadjusted median (IQR) LOS of 3 (26) versus 4 (27) days (P < 0.001) and an unadjusted mean (SD) LOS of 5.1 (5.6) versus 6.0 (7.6) (P < 0.001).
Adjusted Median LOS, d | Absolute Change in Adjusted Median LOS (95% CI), d | P Value | ||
|---|---|---|---|---|
| 12 Months Prior | QI Project Months | |||
| ||||
| All patients | 6.01 | 5.61 | 0.40 (0.57 to 0.21), N = 4,411 | <0.001 |
| Subgroups by ELOS | ||||
| ELOS <4 days | 4.68 | 4.77 | 0.09 (0.13 to 0.32), N = 1,357 | 0.42 |
| ELOS 47 days | 5.68 | 5.38 | 0.30 (0.57 to 0.01), N = 1,509 | 0.04 |
| ELOS >7 days | 8.07 | 6.96 | 1.11 (1.53 to 0.65), N = 1,545 | <0.001 |
Table 3 displays the change in adjusted median LOS for the project months versus the 12 months prior among the QI units. We found that for all patients, there was an overall reduction in adjusted median LOS of 0.40 (95% confidence interval [CI]: 0.57 to 0.21, P<0.001) days. When we divided patients into tertiles based on their UHC expected LOS (ELOS), we observed that patients with longer ELOS had greater reductions in adjusted median LOS. Patients on the QI units with ELOS <4 days (lowest tertile) did not show a significant reduction in adjusted median LOS (0.09 days, 95% CI: 0.13 to 0.32, P = 0.42); however, patients with UHC ELOS 4 to 7 days (middle tertile) and ELOS >7 days (highest tertile) had a significant reduction in adjusted median LOS by 0.30 (95% CI: 0.57 to 0.01, P = 0.04) and 1.11 (95% CI: 1.53 to 0.65, P < 0.001) days during the QI project versus 12 months prior, respectively.
Lastly, we found that there was no difference in the rate of injurious falls on the QI units during QI period compared to 12 months prior (QI: 0.34 per 1000 patient‐days versus 12 months prior: 0.48 per 1000 patient‐days, P = 0.73).
DISCUSSION
We conducted a nurse‐driven, multidisciplinary mobility promotion QI project on 2 general medicine units at a large teaching hospital. The 12‐month QI project, conducted between March 1, 2013 and February 28, 2014, was associated with patients ambulating more frequently, with improved mobility status between hospital admission and discharge. These improvements in mobility were not associated with increased rates of injurious falls, and were sustained for at least 4 months after project completion. The QI project was associated with overall significant reduction in LOS for more complex patients with longer expected LOS (4 days or longer). Hence, such QI efforts may be important for maintaining or improving patients' functional status during hospitalization in a safe and cost‐effective manner.
Our findings are consistent with previous studies showing that mobility promotion in the acute hospital setting is feasible, can reduce length of stay, and can be applied to a diverse population including vulnerable medical patients with multiple comorbidities and the elderly.[12, 16, 37, 38, 39, 40, 41, 42] These studies provide valuable evidence of the benefits of mobility promotion; however, it is difficult to translate these prior results into routine clinical practice because they used specially trained staff to mobilize patients, focused on a select patient population, or did not specify how the mobility intervention was delivered within daily clinical workflows. Research in the medical ICU at our institution has previously described the use of a structured QI model to successfully implement an early rehabilitation program.[22, 24] Here, we successfully adapted the same QI framework to a general medicine setting. Hence, our study contributes to the literature with respect to (1) use of a structured QI framework to develop a successful patient mobility program in a general medicine patient population, and (2) sharing best practices from 1 clinical setting, such as the ICU, as a source of learning and knowledge translation for other care settings, with the addition of novel tools, such as the JH‐HLM scale.
There may have been several factors that contributed to shorter stays in the hospital we observed during the QI project. First, we increased the number of ambulatory patient‐days, which may have helped prevent physiological complications of bed rest, such as muscle weakness, atelectasis, insulin resistance, vascular dysfunction, contractures, and pressure ulcers.[43] As such, mobility promotion has been associated with reduced rates of other hospital‐acquired complications, such as deep venous thrombosis, pneumonia, and delirium.[44, 45, 46] In our study, we saw the greatest LOS reduction in more complex patients who were expected to spend a longer time in the hospital and are at greater risk of developing complications from bed rest. Second, our early mobility project may have had a direct impact on care‐coordination processes as reported in prior studies.[47, 48, 49] An important component of our intervention was incorporating functional status into multidisciplinary discussions, either through nurse‐to‐therapist huddles or care‐coordination rounds between nurses, therapists, physicians, social workers, and case managers. During care‐coordination rounds, JH‐HLM scores were reported to expedite appropriate physical and occupational therapy consultations and assist in determining appropriate discharge location. During the QI project, we transitioned from a unit‐based daily huddle between nursing and rehabilitation therapists to a system where mobility status was discussed primarily during care coordination rounds 5 times per week. We saw that mobility scores were maintained after QI project completion, suggesting that reporting on patient function in a multidisciplinary setting is a potentially sustainable mechanism to improve care‐coordination processes that are affected by functional status.
Our study has several potential limitations. First, this is a single‐site study in 2 general medicine units of a large academic hospital. Further research is needed to determine if this structured QI intervention and its benefits can be generalized to different settings and different patient populations. Second, because the documentation was initially an optional element in the electronic medical record system, we observed higher rates of missing documentation during the first 4 months of the project versus the comparison period at 4 months after project completion. However, a sensitivity analysis conducted of these missing data demonstrated similar results to our primary analysis. Third, our nonrandomized pre‐post study design does not allow us to conclude a direct cause‐and‐effect relationship between our intervention and increased mobility and reduced LOS. Although patient characteristics were similar between the 2 periods and adjusted for in our multivariable regression analysis, we cannot rule out the possibility of secular trends in LOS on the project units and that broader QI efforts at our institution also contributed to reduction in LOS. Fourth, we do not have data on 30‐day readmissions and discharge location. Future studies should explore the impact of hospital‐based mobility interventions on these outcomes.[50] Fifth, although nurses consistently documented the highest level of mobility on a daily basis, these data did not capture other potentially important information about patient mobility such as the daily frequency that patients were mobilized, the length of time a patient was engaged in a mobility event (ie, number of hours sitting in a chair), or the mobility that occurred during physical therapy or occupational therapy sessions. Hence, although we used JH‐HLM as a marker of improved mobility during our QI project it is likely that our data cannot fully describe the total mobility and activity that patients experienced during hospitalization. Lastly, although the front‐line staff and QI team found the JH‐HLM scale to be a useful tool to measure and advance patient mobility, further studies are needed to evaluate the reliability and validity of this scale.
CONCLUSION
A structured QI process can improve patient mobility and may contribute to reduction in LOS, particularly for more complex patients in this setting. Active prevention of decline in physical function that commonly occurs during hospitalization may prove valuable for improving patient outcomes and reducing healthcare resource utilization.
Disclosures
The authors certify that no party having a direct interest in the results of the research supporting this article has or will confer a benefit on us or on any organization with which we are associated. The authors report no conflicts of interest.
- , , , et al. Loss of independence in activities of daily living in older adults hospitalized with medical illnesses: increased vulnerability with age. J Am Geriatr Soc. 2003;51(4):451–458.
- , , . Prevalence and outcomes of low mobility in hospitalized older patients. J Am Geriatr Soc. 2004;52(8):1263–1270.
- , , , , , . Trajectories of life‐space mobility after hospitalization. Ann Intern Med. 2009;150(6):372–378.
- , , . Hospitalization‐associated disability: “She was probably able to ambulate, but I'm not sure”. JAMA. 2011;306(16):1782–1793.
- , , , , , . Physical fitness and all‐cause mortality. A prospective study of healthy men and women. JAMA. 1989;262(17):2395–2401.
- . Mobilizing patients in the intensive care unit: improving neuromuscular weakness and physical function. JAMA. 2008;300(14):1685–1690.
- , . Mobility limitation in the older patient: a clinical review. JAMA. 2013;310(11):1168–1177.
- , , , et al. Early physical and occupational therapy in mechanically ventilated, critically ill patients: a randomised controlled trial. Lancet. 2009;373(9678):1874–1882.
- , , . Technology to enhance physical rehabilitation of critically ill patients. Crit Care Med. 2009;37(10 suppl):S436–S441.
- , , , et al. Receiving early mobility during an intensive care unit admission is a predictor of improved outcomes in acute respiratory failure. Am J Med Sci. 2011;341(5):373–377.
- . Physiotherapy in intensive care: an updated systematic review. Chest. 2013;144(3):825–847.
- , , . Exercise for acutely hospitalised older medical patients. Cochrane Database Syst Rev. 2007;(1):CD005955.
- , , . Extra physical therapy reduces patient length of stay and improves functional outcomes and quality of life in people with acute or subacute conditions: a systematic review. Arch Phys Med Rehabil. 2011;92(9):1490–1500.
- , . Impact of early mobilization protocol on the medical‐surgical inpatient population: an integrated review of literature. Clin Nurse Spec. 2012;26(2):87–94.
- , , . Outcomes of inpatient mobilization: a literature review. J Clin Nurs. 2014;23(11–12):1486–1501.
- , , , et al. The early mobility bundle: a simple enhancement of therapy which may reduce incidence of hospital‐acquired pneumonia and length of hospital stay. J Hosp Infect. 2014;88(1):34–39.
- , , , , . Physical therapy on the wards after early physical activity and mobility in the intensive care unit. Phys Ther. 2012;92(12):1518–1523.
- , , , . Impact of hospital variables on case mix index as a marker of disease severity. Popul Health Manag. 2014;17(1):28–34.
- , , , , . Frequency of hallway ambulation by hospitalized older adults on medical units of an academic hospital. Geriatr Nurs. 2004;25(4):212–217.
- , , . Activity level of hospital medical inpatients: an observational study. Arch Gerontol Geriatr. 2012;55(2):417–421.
- , , . Translating evidence into practice: a model for large scale knowledge translation. BMJ. 2008;337:a1714.
- , , , et al. Early physical medicine and rehabilitation for patients with acute respiratory failure: a quality improvement project. Arch Phys Med Rehabil. 2010;91(4):536–542.
- , , , , ; SQUIRE development group. Publication guidelines for quality improvement studies in health care: evolution of the SQUIRE project. BMJ. 2009;338:a3152.
- , . Rehabilitation quality improvement in an intensive care unit setting: implementation of a quality improvement model. Top Stroke Rehabil. 2010;17(4):271–281.
- , , , . ICU early mobilization: from recommendation to implementation at three medical centers. Crit Care Med. 2013;41(9 suppl 1):S69–S80.
- , , , . Barriers to early mobility of hospitalized general medicine patients: survey development and results. Am J Phys Med Rehabil. 2015;94(4):304–312.
- , , , . Comorbidity measures for use with administrative data. Med Care. 1998;36(1):8–27.
- UHC Clinical Information Management Risk Adjustment of the UHC Clinical Data Base. Chicago, IL: University HealthSystem Consortium; 1998.
- Sachs Complications Profiler, Version 1.0, User's Guide. Evanston, IL: Sachs Group; 1995.
- , , . Assessing hospital‐associated deaths from discharge data. The role of length of stay and comorbidities. JAMA. 1988;260(15):2240–2246.
- , , , et al. Annual rates of admission and seasonal variations in hospitalizations for heart failure. Eur J Heart Fail. 2002;4(6):779–786.
- , , , . Regional and seasonal variation in the length of hospital stay for chronic obstructive pulmonary disease in Finland. Int J Circumpolar Health. 2002;61(2):131–135.
- , , , , , ; Canadian CABG Surgery Quality Indicator Consensus Panel. The identification and development of canadian coronary artery bypass graft surgery quality indicators. J Thorac Cardiovasc Surg. 2005;130(5):1257.
- , , , . Quality of care and length of hospital stay among patients with stroke. Med Care. 2009;47(5):575–582.
- . A systematic review of outcomes and quality measures in adult patients cared for by hospitalists vs nonhospitalists. Mayo Clin Proc. 2009;84(3):248–254.
- . Confidence intervals that match Fisher's exact or Blaker's exact tests. Biostatistics. 2010;11(2):373–374.
- , , , et al. A multicomponent intervention to prevent delirium in hospitalized older patients. N Engl J Med. 1999;340(9):669–676.
- , , , , . Early mobilization of patients hospitalized with community‐acquired pneumonia. Chest. 2003;124(3):883–889.
- , , , et al. Effects of a walking intervention on fatigue‐related experiences of hospitalized acute myelogenous leukemia patients undergoing chemotherapy: a randomized controlled trial. J Pain Symptom Manage. 2008;35(5):524–534.
- , , , , . Early ambulation and length of stay in older adults hospitalized for acute illness. Arch Intern Med. 2010;170(21):1942–1943.
- , , . Impact of a nurse‐driven mobility protocol on functional decline in hospitalized older adults. J Nurs Care Qual. 2009;24(4):325–331.
- , , . Exercising body and mind: an integrated approach to functional independence in hospitalized older people. J Am Geriatr Soc. 2008;56(4):630–635.
- . Consequences of bed rest. Crit Care Med. 2009;37(10 suppl):S422–S428.
- , , , , . Time to ambulation after hip fracture surgery: relation to hospitalization outcomes. J Gerontol A Biol Sci Med Sci. 2003;58(11):M1042–M1045.
- , , , . Early mobilization after total knee replacement reduces the incidence of deep venous thrombosis. ANZ J Surg. 2009;79(7–8):526–529.
- , , , . Efficacy and safety of postoperative early mobilization for chronic subdural hematoma in elderly patients. Acta Neurochir (Wien). 2010;152(7):1171–1174.
- , , , et al. Impact of relational coordination on quality of care, postoperative pain and functioning, and length of stay: a nine‐hospital study of surgical patients. Med Care. 2000;38(8):807–819.
- Care coordination cuts admissions, ED visits, LOS. Hosp Case Manag. 2013;21(5):67–68.
- , . A heart failure initiative to reduce the length of stay and readmission rates. Prof Case Manag. 2014;19(6):276–284.
- , , , , , . Association of impaired functional status at hospital discharge and subsequent rehospitalization. J Hosp Med. 2014;9(5):277–282.
© 2016 Society of Hospital Medicine
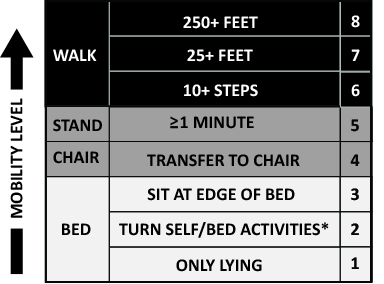
Bowel-Associated Dermatosis-Arthritis Syndrome in a Patient With Crohn Disease
To the Editor:
A 42-year-old woman with Crohn disease of 10 years’ duration presented to the clinic with a chief concern of nonpruritic pustular lesions on the bilateral arms. Physical examination revealed several pustules on the arms with secondary excoriation. She also had a warm tender nodule on the left upper shin and subungual hemorrhages under the fingernails (Figure 1). The patient had previously undergone infliximab therapy, which was discontinued 10 months prior to presentation in anticipation of a partial colectomy and temporary ileostomy that was performed 8 months prior to presentation. She recently had developed bilateral, radiating, sharp lower extremity pain extending from the feet to the hips over the last 2 weeks and swelling of the bilateral legs that impaired her ability to ambulate. Additionally, she had recently traveled to Colorado and a Lyme disease workup was initiated at an outside hospital in Colorado; however, the results were pending. The outside hospital also performed a spinal tap that was negative. At our clinic, biopsies were performed on the shin nodule and a right palmar pustule (Figure 2). There was clinical suspicion of erythema nodosum and subcorneal pustular dermatosis or a vesiculopustular skin manifestation of the patient’s Crohn disease. The patient was switched from generic doxycycline to a brand name variant 150 mg every night at bedtime for 2 weeks. She subsequently was admitted to the inpatient rheumatology service for a complete systemic workup.
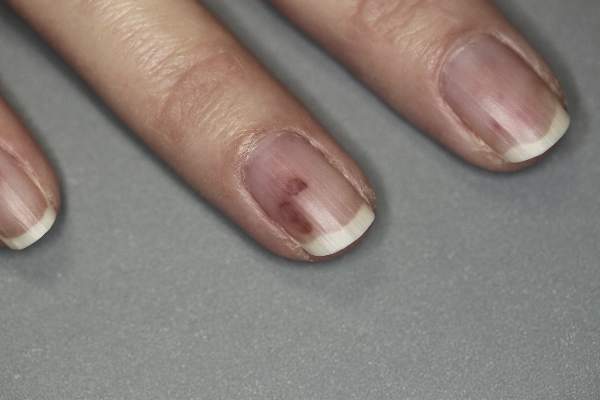
The punch biopsy of the left upper shin demonstrated operative hemorrhage and periadnexal lymphocytic inflammation without evidence of fungal or bacterial elements by Gram or Gomori methenamine-silver stain. Clinically, the diagnosis was most likely erythema nodosum, though insufficient hypodermis was present to make the diagnosis with pathology. The shave biopsy of the right medial palm was nondiagnostic but showed a transected pustule with no bacterial or fungal elements by Gram or Gomori methenamine-silver stain (Figure 3). Given the clinical context, the likely pathologic diagnosis was vesiculopustular Crohn disease.

Our patient was started on an empiric steroid trial with rapid improvement of the arthralgia and rash. The presumed diagnosis was a Crohn disease flare and the patient was discharged on an 8-week steroid taper. Three weeks later at a follow-up appointment, the patient’s skin lesions had nearly resolved. The swelling of the legs and feet had substantially decreased, but the joint pain, primarily in the ankles, persisted.
Routine laboratory studies showed a hemoglobin level of 11.6 g/dL (reference range, 12–15 g/dL), white blood cell count of 9.1 K/μL (reference range, 4.5–11.0 K/μL), C-reactive protein level of 20.15 mg/dL (reference range, <1.0 mg/dL), and an antinuclear antibody titer of 160 (<80). Serology for Lyme disease was negative. Serum chemistries were all within reference range and an echocardiogram was normal.
Up to one-third of patients with inflammatory bowel disease (IBD) experience extraintestinal manifestations of their condition. Of these patients, nearly one-third will develop cutaneous manifestations.1 The most common skin diseases associated with IBD are pyoderma gangrenosum and erythema nodosum.2 The differential diagnoses considered in this unique case included early pyoderma gangrenosum, subcorneal pustular dermatosis (Sneddon-Wilkinson disease), and vesiculopustular Crohn disease. Vesiculopustular Crohn disease is a rare component of IBD and also can be present in bowel-associated dermatosis-arthritis syndrome (BADAS). In BADAS, symptoms often include arthritis and systemic symptoms such as fever and malaise. The skin manifestations typically involve the arms and trunk. It often is seen after intestinal bypass surgery but also can be present in patients with gastrointestinal diseases such as IBD.3 Due to its early association with bypass surgery, BADAS previously was referred to as bowel bypass syndrome but has since been seen in relation to other intestinal surgeries and IBD.4 Patients with BADAS often present with episodes of fever, fatigue, and malaise, in addition to arthralgia and cutaneous eruptions. Cases of BADAS related to IBD instead of bypass surgery often can be less severe in nature. Unlike many of these previously reported cases, our patient’s joint pain primarily was in the knees and ankles, whereas typical cases of BADAS cause upper extremity (ie, shoulder, elbow) arthralgia. Our patient occasionally experienced upper extremity pain, but it was less frequent and less severe than the knee and ankle pain. The vesiculopustular lesions in BADAS usually begin as 3- to 10-mm painful macules that then develop into aseptic pustular lesions. These manifestations arise on the upper arms and chest or trunk and can be accompanied by erythema nodosum on the legs.4
It has been hypothesized that BADAS occurs as an immune reaction to bacterial overgrowth in the bowel from IBD, infection, or surgery. The reaction is in response to a bacterial antigen and manifests cutaneously.5 This same pathogenesis is thought to cause various other manifestations of Crohn disease such as erythema nodosum. Bacteria that incite this immune response include Bacteroides fragilis, Escherichia coli, and Streptococcus.
Resolution of both vesiculopustular Crohn disease and of BADAS often occurs with treatment of the underlying IBD but also can be improved with steroids and antibiotics. However, response to antibiotics often is variable.5,6 The mainstay for treatment remains steroids and management of underlying bowel disease.
Bowel-associated dermatosis-arthritis syndrome often is overlooked when compiling differential diagnoses for neutrophilic dermatoses but should be considered in patients with bowel disease or recent surgery. Because the syndrome can be recurrent, early diagnosis can help to prevent and treat relapsing courses of BADAS.
- Trost LB, McDonnell JK. Important cutaneous manifestations of inflammatory bowel disease. Postgrad Med J. 2005;81:580-585.
- Havemann BD. A pustular skin rash in a woman with 2 weeks of diarrhea. MedGenMed. 2005;7:11.
- Bolognia JL, Jorizzo J, Rapini RP. Dermatology. 3rd ed. Philadelphia, PA: Elsevier Limited; 2008.
- Huang B, Chandra S, Shih DQ. Skin manifestations of inflammatory bowel disease. Front Physiol. 2012;3:13.
- Truchuelo MT, Alcántara J, Vano-Galván S, et al. Bowel associated dermatosis-arthritis syndrome: another cutaneous manifestation of inflammatory intestinal disease. Int J Dermatol. 2013;52:1596-1598.
- Ashok D, Kiely P. Bowel associated dermatosis-arthritis syndrome: a case report. J Med Case Rep. 2007;1:81.
To the Editor:
A 42-year-old woman with Crohn disease of 10 years’ duration presented to the clinic with a chief concern of nonpruritic pustular lesions on the bilateral arms. Physical examination revealed several pustules on the arms with secondary excoriation. She also had a warm tender nodule on the left upper shin and subungual hemorrhages under the fingernails (Figure 1). The patient had previously undergone infliximab therapy, which was discontinued 10 months prior to presentation in anticipation of a partial colectomy and temporary ileostomy that was performed 8 months prior to presentation. She recently had developed bilateral, radiating, sharp lower extremity pain extending from the feet to the hips over the last 2 weeks and swelling of the bilateral legs that impaired her ability to ambulate. Additionally, she had recently traveled to Colorado and a Lyme disease workup was initiated at an outside hospital in Colorado; however, the results were pending. The outside hospital also performed a spinal tap that was negative. At our clinic, biopsies were performed on the shin nodule and a right palmar pustule (Figure 2). There was clinical suspicion of erythema nodosum and subcorneal pustular dermatosis or a vesiculopustular skin manifestation of the patient’s Crohn disease. The patient was switched from generic doxycycline to a brand name variant 150 mg every night at bedtime for 2 weeks. She subsequently was admitted to the inpatient rheumatology service for a complete systemic workup.
The punch biopsy of the left upper shin demonstrated operative hemorrhage and periadnexal lymphocytic inflammation without evidence of fungal or bacterial elements by Gram or Gomori methenamine-silver stain. Clinically, the diagnosis was most likely erythema nodosum, though insufficient hypodermis was present to make the diagnosis with pathology. The shave biopsy of the right medial palm was nondiagnostic but showed a transected pustule with no bacterial or fungal elements by Gram or Gomori methenamine-silver stain (Figure 3). Given the clinical context, the likely pathologic diagnosis was vesiculopustular Crohn disease.
Our patient was started on an empiric steroid trial with rapid improvement of the arthralgia and rash. The presumed diagnosis was a Crohn disease flare and the patient was discharged on an 8-week steroid taper. Three weeks later at a follow-up appointment, the patient’s skin lesions had nearly resolved. The swelling of the legs and feet had substantially decreased, but the joint pain, primarily in the ankles, persisted.
Routine laboratory studies showed a hemoglobin level of 11.6 g/dL (reference range, 12–15 g/dL), white blood cell count of 9.1 K/μL (reference range, 4.5–11.0 K/μL), C-reactive protein level of 20.15 mg/dL (reference range, <1.0 mg/dL), and an antinuclear antibody titer of 160 (<80). Serology for Lyme disease was negative. Serum chemistries were all within reference range and an echocardiogram was normal.
Up to one-third of patients with inflammatory bowel disease (IBD) experience extraintestinal manifestations of their condition. Of these patients, nearly one-third will develop cutaneous manifestations.1 The most common skin diseases associated with IBD are pyoderma gangrenosum and erythema nodosum.2 The differential diagnoses considered in this unique case included early pyoderma gangrenosum, subcorneal pustular dermatosis (Sneddon-Wilkinson disease), and vesiculopustular Crohn disease. Vesiculopustular Crohn disease is a rare component of IBD and also can be present in bowel-associated dermatosis-arthritis syndrome (BADAS). In BADAS, symptoms often include arthritis and systemic symptoms such as fever and malaise. The skin manifestations typically involve the arms and trunk. It often is seen after intestinal bypass surgery but also can be present in patients with gastrointestinal diseases such as IBD.3 Due to its early association with bypass surgery, BADAS previously was referred to as bowel bypass syndrome but has since been seen in relation to other intestinal surgeries and IBD.4 Patients with BADAS often present with episodes of fever, fatigue, and malaise, in addition to arthralgia and cutaneous eruptions. Cases of BADAS related to IBD instead of bypass surgery often can be less severe in nature. Unlike many of these previously reported cases, our patient’s joint pain primarily was in the knees and ankles, whereas typical cases of BADAS cause upper extremity (ie, shoulder, elbow) arthralgia. Our patient occasionally experienced upper extremity pain, but it was less frequent and less severe than the knee and ankle pain. The vesiculopustular lesions in BADAS usually begin as 3- to 10-mm painful macules that then develop into aseptic pustular lesions. These manifestations arise on the upper arms and chest or trunk and can be accompanied by erythema nodosum on the legs.4
It has been hypothesized that BADAS occurs as an immune reaction to bacterial overgrowth in the bowel from IBD, infection, or surgery. The reaction is in response to a bacterial antigen and manifests cutaneously.5 This same pathogenesis is thought to cause various other manifestations of Crohn disease such as erythema nodosum. Bacteria that incite this immune response include Bacteroides fragilis, Escherichia coli, and Streptococcus.
Resolution of both vesiculopustular Crohn disease and of BADAS often occurs with treatment of the underlying IBD but also can be improved with steroids and antibiotics. However, response to antibiotics often is variable.5,6 The mainstay for treatment remains steroids and management of underlying bowel disease.
Bowel-associated dermatosis-arthritis syndrome often is overlooked when compiling differential diagnoses for neutrophilic dermatoses but should be considered in patients with bowel disease or recent surgery. Because the syndrome can be recurrent, early diagnosis can help to prevent and treat relapsing courses of BADAS.
- Trost LB, McDonnell JK. Important cutaneous manifestations of inflammatory bowel disease. Postgrad Med J. 2005;81:580-585.
- Havemann BD. A pustular skin rash in a woman with 2 weeks of diarrhea. MedGenMed. 2005;7:11.
- Bolognia JL, Jorizzo J, Rapini RP. Dermatology. 3rd ed. Philadelphia, PA: Elsevier Limited; 2008.
- Huang B, Chandra S, Shih DQ. Skin manifestations of inflammatory bowel disease. Front Physiol. 2012;3:13.
- Truchuelo MT, Alcántara J, Vano-Galván S, et al. Bowel associated dermatosis-arthritis syndrome: another cutaneous manifestation of inflammatory intestinal disease. Int J Dermatol. 2013;52:1596-1598.
- Ashok D, Kiely P. Bowel associated dermatosis-arthritis syndrome: a case report. J Med Case Rep. 2007;1:81.

New ROCKET-AF review claims faulty INR monitoring device didn’t affect results
ROCKET-AF investigators are standing by the results of the pivotal trial of rivaroxaban in patients with nonvalvular atrial fibrillation, even though the anticoagulation monitoring device used in the control group was later found to be defective.
Results of a new analysis “are consistent with the overall trial findings and indicate that possible malfunction of the point-of-care device used for INR [international normalized ratio] measurement in the ROCKET AF trial that potentially led to lower INR values than would be obtained by laboratory testing did not have any significant clinical effect on the primary efficacy and safety outcomes in the trial,” the study investigators concluded in a letter to the editor of the New England Journal of Medicine published online on Feb. 3 that included the new analysis (2016 Feb 3;doi: 10.1056/NEJMc1515842).

On the same day, the BMJ published a feature on that very topic, saying that “doctors and scientists are calling for an independent investigation” and questioning the validity of the ROCKET-AF (Rivaroxaban Once Daily Oral Direct Factor Xa Inhibition Compared With Vitamin K Antagonism for Prevention of Stroke and Embolism Trial in Atrial Fibrillation) results until such an analysis is completed.
“A falsely low reading could mean that patients had their warfarin dose unnecessarily increased, leading to a greater risk of bleeding. In terms of the trial results, it could make rivaroxaban [Xarelto] seem safer than it was in terms of the risk of bleeding and throws doubt on outcomes used to support the use of the world’s best-selling new oral anticoagulant,” Dr. Deborah Cohen, associate editor of BMJ, wrote (2016;352:i575 doi: 10.1136/bmj.i575).
At the center of this controversy is the Alere INRatio Monitor System, which was used in ROCKET-AF, the pivotal trial comparing the safety and efficacy of rivaroxaban with warfarin for stroke prevention in patients with nonvalvular atrial fibrillation, to measure the INR in the patients receiving warfarin (N Engl J Med. 2011;365:883-91). That device was recalled by the Food and Drug Administration and European regulators in 2014, 4 years after ROCKET-AF’s completion, because “it may provide an INR result that is lower than expected [compared with the] result obtained using a laboratory INR method,” particularly in patients with medical conditions such as “anemia, conditions associated with elevated fibrinogen levels, or unusual bleeding or bruising.”
In the new analysis, Dr. Manesh R. Patel of the Duke Clinical Research Institute in Durham, N.C., and his coinvestigators reviewed the medical records and any on-trial adverse events of the participants, looking for conditions that were identified in the recall of the INRatio device. They compared major efficacy and safety outcomes in the patients in the overall population (14,236 patients) first with those without any recall conditions (8,942, 63%), and second with those who had recall conditions (5,294, 37%).
Neither analysis revealed any significant differences in safety and efficacy outcomes from the overall population, with all groups showing the noninferiority of rivaroxaban to warfarin in preventing strokes, similar rates of overall bleeding, lower rates of fatal and intracranial bleeding, and higher rates of gastrointestinal bleeding. However, in the patients with any recall conditions, all measures of bleeding were higher in both the warfarin- and rivaroxaban-treated groups. Furthermore, the risk of major bleeding was higher in the rivaroxaban patients than in the warfarin patients, with a hazard ratio of 1.18 (P = .04).
“This finding does not support the hypothesis that device malfunction led to an increased risk of bleeding in the warfarin group of the trial,” Dr. Patel and his colleagues said.

But this conclusion is not shared by all. In the BMJ investigative article, former team leader in the FDA’s Cardiovascular & Renal Drug Products Division, Dr. Thomas Marciniak is quoted as saying that he would not rely on any reanalyses done by Duke, Johnson & Johnson, or the FDA, and that releasing the full datasets would be “the only solution that would lead to unbiased analyses.”
Furthermore, Dr. Harlan Krumholz, professor of medicine (cardiology) and director of the Center for Outcomes Research and Evaluation at Yale University, New Haven, Conn., told the BMJ that ROCKET-AF “should be considered of uncertain validity until a more-thorough review can be done,” and that there should be “an investigation by an independent group of experts to quickly determine if there are grounds for retraction.”
In the middle ground is Dr. Sanjay Kaul, who served on the FDA advisory panel that evaluated rivaroxaban for its atrial fibrillation indication in 2010. He was reassured by the investigators’ analysis, while still calling for an independent review. “It was claimed [by the BMJ] that underestimation of INR by the recalled device could have resulted in erroneously increasing warfarin dose and associated bleeding, thereby making rivaroxaban appear safer relative to warfarin, he said. But in the analysis, “although bleeding was increased nearly twofold in both treatment groups in the subset with recalled conditions, the HR of 1.18 for rivaroxaban contradicts this claim.”

Because a legitimate question regarding reliability of INR measurements has been raised, it would seem prudent to reassess safety and efficacy data, said Dr. Kaul, professor of medicine at the University of California, Los Angeles, in an interview. “Ideally, this should be done by an independent party as was done for the RECORD trial of rosiglitazone by Duke investigators who were not involved in the clinical trial. Personally, I am not sure if the benefit-risk balance will be materially altered. Potential overestimation of safety of rivaroxaban related to spuriously low INR with warfarin will likely be counterbalanced by underestimation of efficacy.” If there are data from INR assessments performed centrally in a core lab, independent investigators could use those to reassess efficacy and safety, he continued. “At least the investigators should use the core lab INR to verify their assumptions in the research letter published in NEJM that conditions of recall were truly associated with low INR values. Otherwise, their results are open to question.”
Of note, Dr. Robert M. Califf, who was a ROCKET-AF study cochair and is now FDA Deputy Commissioner for Medical Products and Tobacco, was not involved in the analysis. Dr. Califf is awaiting confirmation from Congress on his nomination to head the FDA.
Dr. Patel received support from Johnson & Johnson, Bayer, and Janssen in relation to ROCKET-AF, and from eight other drug and device companies, as well as the National Heart, Lung, and Blood Institute. Disclosures for all the investigators are at nejm.org. Dr. Kaul has stock interest in J&J, which sponsored ROCKET-AF, and serves as a consultant to Boehringer Ingelheim and Bristol-Myers Squibb.
ROCKET-AF investigators are standing by the results of the pivotal trial of rivaroxaban in patients with nonvalvular atrial fibrillation, even though the anticoagulation monitoring device used in the control group was later found to be defective.
Results of a new analysis “are consistent with the overall trial findings and indicate that possible malfunction of the point-of-care device used for INR [international normalized ratio] measurement in the ROCKET AF trial that potentially led to lower INR values than would be obtained by laboratory testing did not have any significant clinical effect on the primary efficacy and safety outcomes in the trial,” the study investigators concluded in a letter to the editor of the New England Journal of Medicine published online on Feb. 3 that included the new analysis (2016 Feb 3;doi: 10.1056/NEJMc1515842).
On the same day, the BMJ published a feature on that very topic, saying that “doctors and scientists are calling for an independent investigation” and questioning the validity of the ROCKET-AF (Rivaroxaban Once Daily Oral Direct Factor Xa Inhibition Compared With Vitamin K Antagonism for Prevention of Stroke and Embolism Trial in Atrial Fibrillation) results until such an analysis is completed.
“A falsely low reading could mean that patients had their warfarin dose unnecessarily increased, leading to a greater risk of bleeding. In terms of the trial results, it could make rivaroxaban [Xarelto] seem safer than it was in terms of the risk of bleeding and throws doubt on outcomes used to support the use of the world’s best-selling new oral anticoagulant,” Dr. Deborah Cohen, associate editor of BMJ, wrote (2016;352:i575 doi: 10.1136/bmj.i575).
At the center of this controversy is the Alere INRatio Monitor System, which was used in ROCKET-AF, the pivotal trial comparing the safety and efficacy of rivaroxaban with warfarin for stroke prevention in patients with nonvalvular atrial fibrillation, to measure the INR in the patients receiving warfarin (N Engl J Med. 2011;365:883-91). That device was recalled by the Food and Drug Administration and European regulators in 2014, 4 years after ROCKET-AF’s completion, because “it may provide an INR result that is lower than expected [compared with the] result obtained using a laboratory INR method,” particularly in patients with medical conditions such as “anemia, conditions associated with elevated fibrinogen levels, or unusual bleeding or bruising.”
In the new analysis, Dr. Manesh R. Patel of the Duke Clinical Research Institute in Durham, N.C., and his coinvestigators reviewed the medical records and any on-trial adverse events of the participants, looking for conditions that were identified in the recall of the INRatio device. They compared major efficacy and safety outcomes in the patients in the overall population (14,236 patients) first with those without any recall conditions (8,942, 63%), and second with those who had recall conditions (5,294, 37%).
Neither analysis revealed any significant differences in safety and efficacy outcomes from the overall population, with all groups showing the noninferiority of rivaroxaban to warfarin in preventing strokes, similar rates of overall bleeding, lower rates of fatal and intracranial bleeding, and higher rates of gastrointestinal bleeding. However, in the patients with any recall conditions, all measures of bleeding were higher in both the warfarin- and rivaroxaban-treated groups. Furthermore, the risk of major bleeding was higher in the rivaroxaban patients than in the warfarin patients, with a hazard ratio of 1.18 (P = .04).
“This finding does not support the hypothesis that device malfunction led to an increased risk of bleeding in the warfarin group of the trial,” Dr. Patel and his colleagues said.
But this conclusion is not shared by all. In the BMJ investigative article, former team leader in the FDA’s Cardiovascular & Renal Drug Products Division, Dr. Thomas Marciniak is quoted as saying that he would not rely on any reanalyses done by Duke, Johnson & Johnson, or the FDA, and that releasing the full datasets would be “the only solution that would lead to unbiased analyses.”
Furthermore, Dr. Harlan Krumholz, professor of medicine (cardiology) and director of the Center for Outcomes Research and Evaluation at Yale University, New Haven, Conn., told the BMJ that ROCKET-AF “should be considered of uncertain validity until a more-thorough review can be done,” and that there should be “an investigation by an independent group of experts to quickly determine if there are grounds for retraction.”
In the middle ground is Dr. Sanjay Kaul, who served on the FDA advisory panel that evaluated rivaroxaban for its atrial fibrillation indication in 2010. He was reassured by the investigators’ analysis, while still calling for an independent review. “It was claimed [by the BMJ] that underestimation of INR by the recalled device could have resulted in erroneously increasing warfarin dose and associated bleeding, thereby making rivaroxaban appear safer relative to warfarin, he said. But in the analysis, “although bleeding was increased nearly twofold in both treatment groups in the subset with recalled conditions, the HR of 1.18 for rivaroxaban contradicts this claim.”
Because a legitimate question regarding reliability of INR measurements has been raised, it would seem prudent to reassess safety and efficacy data, said Dr. Kaul, professor of medicine at the University of California, Los Angeles, in an interview. “Ideally, this should be done by an independent party as was done for the RECORD trial of rosiglitazone by Duke investigators who were not involved in the clinical trial. Personally, I am not sure if the benefit-risk balance will be materially altered. Potential overestimation of safety of rivaroxaban related to spuriously low INR with warfarin will likely be counterbalanced by underestimation of efficacy.” If there are data from INR assessments performed centrally in a core lab, independent investigators could use those to reassess efficacy and safety, he continued. “At least the investigators should use the core lab INR to verify their assumptions in the research letter published in NEJM that conditions of recall were truly associated with low INR values. Otherwise, their results are open to question.”
Of note, Dr. Robert M. Califf, who was a ROCKET-AF study cochair and is now FDA Deputy Commissioner for Medical Products and Tobacco, was not involved in the analysis. Dr. Califf is awaiting confirmation from Congress on his nomination to head the FDA.
Dr. Patel received support from Johnson & Johnson, Bayer, and Janssen in relation to ROCKET-AF, and from eight other drug and device companies, as well as the National Heart, Lung, and Blood Institute. Disclosures for all the investigators are at nejm.org. Dr. Kaul has stock interest in J&J, which sponsored ROCKET-AF, and serves as a consultant to Boehringer Ingelheim and Bristol-Myers Squibb.

Phenytoin trial in optic neuritis hints at neuroprotection
Patients with acute demyelinating optic neuritis who received the anticonvulsant drug phenytoin lost 30% less of their retinal nerve fiber layer than did placebo-treated patients in a randomized, phase II study.
“The results of this clinical trial support the concept of neuroprotection using phenytoin to inhibit voltage-gated sodium channels in patients with acute optic neuritis,” wrote Dr. Rhian Raftopoulos of the National Hospital for Neurology and Neurosurgery, London, and coauthors (Lancet Neurol. 2016 Jan 25. doi: 10.1016/S1474-4422(16)00004-1).

The study in 86 individuals with acute optic neuritis randomized 29 participants to receive 4 mg/kg per day of oral phenytoin, 13 to 6 mg/kg per day of oral phenytoin, and 44 to placebo for 3 months; all were randomized within 14 days of vision loss. One-third of the patients had previously been diagnosed with multiple sclerosis or were diagnosed at presentation, and 74% had at least one brain lesion on MRI.
Treatment with phenytoin resulted in a decline of mean retinal nerve fiber layer thickness in the affected eye from 130.62 mcm at baseline to 81.46 mcm at 6 months, compared with a decline from 125.20 mcm to 74.29 mcm in the placebo group, representing an adjusted mean difference of 7.15 mcm that reached statistical significance.
The researchers also noted a significant 34% reduction in macular volume loss in the treatment arm, compared with placebo, representing an adjusted mean difference of 0.20 mm3. However, the treatment had no significant effect on low-contrast visual acuity and visual evoked potentials.
The most common adverse event in the treatment arm was maculopapular rash, which was judged as severe in one patient treated with phenytoin.
The study was supported by the U.S. National Multiple Sclerosis Society, the Multiple Sclerosis Society of Great Britain and Northern Ireland, Novartis, the U.K. National Institute for Health Research, and the NIHR UCLH/UCL Biomedical Research Centre. Several authors declared personal fees, trial funding, grants, and consultancies for pharmaceutical companies, including Novartis.
The absence of regular, early outcome assessments around 1-2 months after initiation of treatment makes it hard to interpret the results because they would have helped to rule out a primarily anti-inflammatory effect of the treatment by tracking retinal nerve fiber layer (RNFL) swelling and possible optic nerve inflammation, especially given that there was higher baseline RNFL thickness and worse low-contrast visual acuity in the patients who received phenytoin. If the true RNFL thickness at baseline in the affected eye of patients in the phenytoin group was higher than those in the placebo group, it could have accounted for the findings even though the investigators made a prespecified adjustment for it.
Although the results of this study are a major advancement and undeniably encouraging, future studies need to include more frequent OCT sampling, as well as more detailed OCT-segmentation-derived retinal measures such as ganglion cell plus inner plexiform layer thickness, which do not swell during acute optic neuritis, mitigating the need for statistical corrections involving the unaffected eye.
Dr. Shiv Saidha and Dr. Peter A. Calabresi are from the division of neuroimmunology and neurological infections at Johns Hopkins University, Baltimore. These comments were taken from an accompanying editorial (Lancet Neurol. 2016 Jan 25. doi: 10.1016/S1474-4422(16)00024-7). Dr. Saidha declared receiving funding support, consulting fees, grant support, speaking honoraria, and advisory board positions with the pharmaceutical industry, including companies that market MS drugs. Dr. Calabresi declared consultancies, research funding, and advisory board positions with the pharmaceutical industry, including companies that market MS drugs.
Patients with acute demyelinating optic neuritis who received the anticonvulsant drug phenytoin lost 30% less of their retinal nerve fiber layer than did placebo-treated patients in a randomized, phase II study.
“The results of this clinical trial support the concept of neuroprotection using phenytoin to inhibit voltage-gated sodium channels in patients with acute optic neuritis,” wrote Dr. Rhian Raftopoulos of the National Hospital for Neurology and Neurosurgery, London, and coauthors (Lancet Neurol. 2016 Jan 25. doi: 10.1016/S1474-4422(16)00004-1).
The study in 86 individuals with acute optic neuritis randomized 29 participants to receive 4 mg/kg per day of oral phenytoin, 13 to 6 mg/kg per day of oral phenytoin, and 44 to placebo for 3 months; all were randomized within 14 days of vision loss. One-third of the patients had previously been diagnosed with multiple sclerosis or were diagnosed at presentation, and 74% had at least one brain lesion on MRI.
Treatment with phenytoin resulted in a decline of mean retinal nerve fiber layer thickness in the affected eye from 130.62 mcm at baseline to 81.46 mcm at 6 months, compared with a decline from 125.20 mcm to 74.29 mcm in the placebo group, representing an adjusted mean difference of 7.15 mcm that reached statistical significance.
The researchers also noted a significant 34% reduction in macular volume loss in the treatment arm, compared with placebo, representing an adjusted mean difference of 0.20 mm3. However, the treatment had no significant effect on low-contrast visual acuity and visual evoked potentials.
The most common adverse event in the treatment arm was maculopapular rash, which was judged as severe in one patient treated with phenytoin.
The study was supported by the U.S. National Multiple Sclerosis Society, the Multiple Sclerosis Society of Great Britain and Northern Ireland, Novartis, the U.K. National Institute for Health Research, and the NIHR UCLH/UCL Biomedical Research Centre. Several authors declared personal fees, trial funding, grants, and consultancies for pharmaceutical companies, including Novartis.
FROM LANCET NEUROLOGY
Key clinical point: Phenytoin treatment is associated with a reduction in retinal nerve fiber layer loss in individuals with demyelinating optic neuritis.
Major finding: Treatment with phenytoin was associated with a 30% reduction in the extent of retinal nerve fiber layer loss, compared with placebo.
Data source: Randomized, placebo-controlled phase II trial in 86 individuals with acute demyelinating optic neuritis.
Disclosures: The study was supported by the U.S. National Multiple Sclerosis Society, the Multiple Sclerosis Society of Great Britain and Northern Ireland, Novartis, the U.K. National Institute for Health Research, and the NIHR UCLH/UCL Biomedical Research Centre. Several authors declared personal fees, trial funding, grants, and consultancies for pharmaceutical companies, including Novartis.
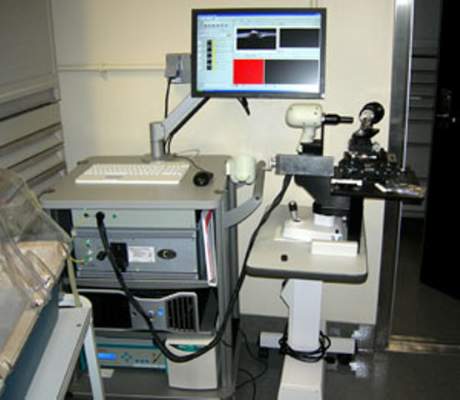
Flibanserin for hypoactive sexual desire disorder in premenopausal women
Flibanserin, FDA-approved in August 2015, is the first medication approved to treat acquired, generalized hypoactive sexual desire disorder (HSDD) in premenopausal women (Table 1). In clinical trials,1-4 the drug has shown modest efficacy in improving symptoms of low sexual desire (number of satisfying sexual events [SSEs], sexual desire, and overall sexual function). Flibanserin is not indicated to enhance sexual performance, for HSDD in postmenopausal women, or in men.

Clinical implications
Flibanserin could help premenopausal women who have distressing low sexual desire, which must be acquired and generalized:
- “Acquired low sexual desire” means that a patient had an adequate sexual desire that decreased or ceased for an unknown reason.
- “Generalized low sexual desire” means that lack of sexual desire occurs all the time and in all situations, not only with a certain partner or in some situations.
Women taking flibanserin could experience gradually increased sexual desire, increase in SSEs, and decrease of sexual distress. Flibanserin is indicated for long-term use; however, it should be discontinued after 8 weeks if the patient does not report any improvement in symptoms.
The number needed to treat with flibanserin likely would be rather large, but it is not available because of complex outcome measures in clinical trials. Flibanserin was not approved at 2 previous FDA committee hearings—mainly because of safety issues but also because of concerns about efficacy. For example, during the 2013 FDA hearing, the results presented showed statistically significant, but numerically small, treatment differences at 24 weeks compared with placebo. In an FDA responder analysis of the Phase-III trials, after accounting for the placebo effect, approximately 8% to 13% women were at least “much improved” on at least 1 of the primary outcomes.5
Flibanserin is not indicated for women whose sexual desire is due to (1) coexisting medical or psychiatric condition, (2) effects of medication or substance abuse, or (3) a relationship problem. It is unknown whether supplemental treatment would help these patients; however, it seems reasonable that combining flibanserin with psychosocial treatment, such as sex therapy or individual therapy, could be beneficial because it may be difficult to disentangle sexual dysfunction and relationship issues—2 problems that often are interwoven.
How it works
Flibanserin is a serotonin 1A receptor agonist and serotonin 2A receptor antagonist. In vitro, flibanserin demonstrated high affinity for the following 5-HT receptors:
- agonist activity at 5-HT1A
- antagonist activity at 5-HT2A, mostly in the prefrontal cortex.
Flibanserin also has moderate antagonist activities at the 5-HT2B, 5-HT2C, and dopamine D4 receptors. Flibanserin presumably acts centrally in the CNS; it has been suggested that flibanserin could rebalance neural circuitry involved in processing sexual desire by reducing serotonin activity and enhancing dopamine and epinephrine activity. The exact mechanism of how flibanserin improves sexual desire in women is unknown.
Pharmacokinetics
Flibanserin has a mean termination half-life of approximately 11 hours. It is administered once a day (50 to 100 mg) at bedtime. Steady state in healthy women was achieved after 3 days. Based on clinical observations, onset of action seems to be gradual and reaches maximum efficacy in approximately 8 weeks. Patients should discontinue the drug if no improvement is reported after 8 weeks. Flibanserin is readily absorbed from the gastrointestinal tract; however, food slows its absorption. The drug is 98% protein (mostly albumin)-bound.
Flibanserin is primarily metabolized in the liver by cytochrome P450 (CYP) 3A4 and to a lesser extent by CYP2C19. Co-administration of moderate (diltiazem, erythromycin, fluconazole, fosamprenavir, verapamil) or strong (eg, ketoconazole, clarithromycin, nefazodone, ritonavir) CYP3A4 inhibitors increases the concentration of flibanserin. This could lead to severe hypotension and syncope; therefore, co-administering flibanserin with a strong CYP3A4 inhibitor is contraindicated. Grapefruit juice is a moderate inhibitor of CYP3A4, and in a study of 26 healthy females, 240 mL of grapefruit juice increased flibanserin concentration 1.4-fold. Flibanserin is excreted though urine and feces. Flibanserin should be taken once a day at bedtime because of sedation, somnolence, and possible syncope.
Efficacy
The efficacy of flibanserin for treating HSDD was established in three 24-week, randomized, double-blind, placebo-controlled studies (Table 2). The target population in these studies was premenopausal women (mean age 36, range 19 to 55) with acquired HSDD lasting at least 6 months (mean duration, approximately 5 years). The 3 studies included 1,187 women who received flibanserin, 100 mg at bedtime, and 1,188 women who received placebo. Participants were mostly white (88.6%), and included black (9.6%) and Asian (1.5%) women. The completion rates were 69% for flibanserin and 78% for placebo. Some of the trials included arms with a lower dosage of flibanserin (25 mg and 50 mg), which are not included in this analysis.
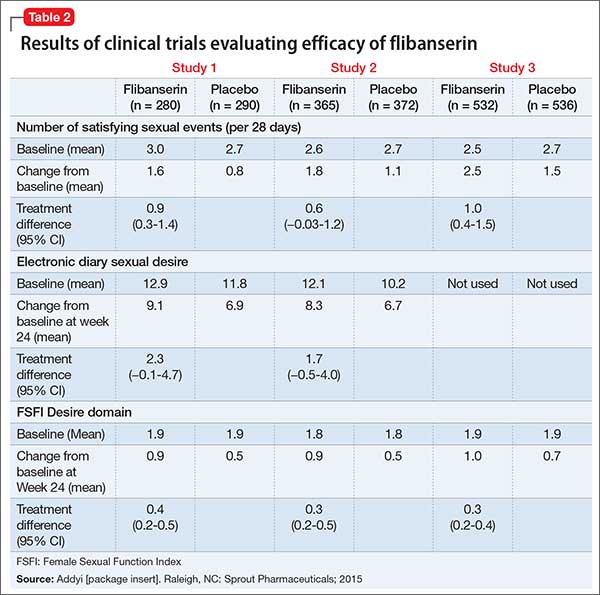
As noted in the package insert, these trials each had 2 co-primary efficacy endpoints, SSEs and sexual desire:
- change from baseline to Week 24 in the number of monthly SSEs (ie, sexual intercourse, oral sex, masturbation, or genital stimulation by the partner)
- change in sexual desire from baseline to 24-week endpoint.
In Study 1 and 2, change in sexual desire from baseline to Week 24 was measured daily by using an electronic diary. Every day, patients rated their sexual desire level by answering the question, “Indicate your most intense level of sexual desire” from 0 (no desire) to 3 (strong desire). These responses were totaled over a 28-day period to yield the monthly sexual desire score, which ranged from 0 to 84. These 2 studies also used the Female Sexual Function Index (FSFI) Desire domain as a secondary endpoint.
Study 3 used the FSFI Desire domain, comprising 2 questions, as the sexual desire co-primary endpoint:
- “Over the past 4 weeks, how often did you feel sexual desire or interest?” Responses ranged from 1 (almost never or never) to 5 (almost always or always).
- “Over the past 4 weeks, how would you rate your level (degree) of sexual desire or interest?” Responses ranged from 1 (very low or none at all) to 5 (very high).
In all 3 trials, flibanserin was associated with a small, yet statistically significant, improvement in change in monthly SSEs from baseline to Week 24 compared with placebo. In Study 1 and 2, there were no statistically significant differences between flibanserin and placebo for the electronic diary sexual desire endpoint. In the third study, there was statistically significant improvement in the change in sexual desire using the FSFI Desire domain with flibanserin compared with placebo. The FSFI Desire domain findings were consistent across all 3 trials. Flibanserin was associated with a decrease in sexual distress compared with placebo in all 3 studies.
Tolerability
Flibanserin was well tolerated in the 3 clinical trials. As the FDA noted, clinical trials are conducted under widely varying conditions and therefore adverse reaction rates observed in trials of flibanserin cannot be directly compared with those reported in clinical trials of another drug and might not reflect rates observed in clinical practice.
The discontinuation rate due to adverse reactions was 13% among patients treated with flibanserin, 100 mg at bedtime, and 6% among those taking placebo. The most common side effects were somnolence, dizziness, fatigue, nausea, insomnia, and dry mouth, which appear dose-dependent. Onset of most of these adverse events was within 14 days after the start of treatment.
Although hypotension and syncope rarely were seen with flibanserin alone in clinical trials, these adverse events occurred more frequently in the morning and when taken with alcohol and with some drugs (moderate or strong CYP3A4 inhibitors), and in patients with hepatic impairment. Therefore, women who drink alcohol or take a moderate or strong inhibitor of CYP3A4—both of which are contraindicated—and those with hepatic impairment should not take flibanserin.
Flibanserin should be taken at bedtime, because the risk of hypotension and syncope is higher when flibanserin is taken in the morning and because of associated sedation and somnolence.
Unique clinical issues
Flibanserin is the first FDA-approved medication for treating HSDD. It is important to note that the drug originally was developed as an antidepressant, but failed to show efficacy. Researchers noted that the drug was more effective than placebo when patients were asked, “How strong is your sexual desire?” The focus of development then shifted to a potential treatment of HSDD.
Flibanserin was not approved at 2 previous FDA hearings, mainly because of safety concerns. For the second hearing, the manufacturer, Boehringer Ingelheim, which sold the rights to the drug to Sprout Pharmaceuticals in 2011,6 did not present any new efficacy data, but provided additional safety data, such as research suggesting the absence of next-day driving impairment and data related to alcohol use (the study confirming hypotension associated with alcohol abuse used a small sample, and only 2 of 25 participants were women).
Contraindications
Flibanserin is contraindicated in patients using alcohol because of an increased risk of hypotension and syncope. A patient’s alcohol use should be evaluated before administering flibanserin, and patients should be counseled about the importance of abstaining from alcohol.
Similarly, concomitant use of flibanserin with a moderate or strong inhibitor of CYP3A4 increases the concentration of flibanserin and raises the risk of hypotension and syncope. Therefore, the use of a moderate or strong inhibitor of CYP3A4 in patients taking flibanserin is contraindicated. Similarly, patients with liver impairment should not take this drug.
Strong CYP2C19 inhibitors (proton-pump inhibitors, selective serotonin reuptake inhibitors, benzodiazepines, antifungals) could increase flibanserin exposure, which may increase risk of hypotension, syncope, and CNS depression. Discuss these risks with your patients; doing so is particularly important when treating women of Chinese heritage, and some other Asian women, because 20% of these populations are genotypic CYP2C19 poor metabolizers.
Because of the increased risk of hypotension and syncope with alcohol use, flibanserin is available only through a restricted program under a Risk Evaluation and Mitigation Strategy (REMS) called the Addyi REMS Program. Flibanserin can be prescribed or dispensed only by physicians and pharmacists who watch this program’s online slide presentation and passed a comprehension test.a
Pregnant women should not take flibanserin because the effect on the fetus is unknown. Also, because the interaction with some oral contraceptives is unknown, patients should be cautioned about unwanted pregnancy. Women who are breastfeeding also should avoid using flibanserin because it is not known whether the drug is excreted in breast milk.
Women taking flibanserin also should avoid grapefruit juice, which increases flibanserin levels, and avoid using herbal products, resveratrol, and some over-the-counter drugs such as cimetidine. Women who have a depressive disorder also should avoid using flibanserin because their low sexual desire is more likely due to depression, which is not a therapeutic target for the drug.
Dosing
Flibanserin is provided in 100-mg film-coated tablets. It should be taken once a day at bedtime; titration is unnecessary. Length of treatment has not been determined, but it is recommended that patients stop flibanserin if they do not experience any benefit after 8 weeks. Although there is no guidance in the prescribing information, the medication probably could be stopped without tapering because withdrawal effects have not been observed.
Bottom Line
Flibanserin is FDA-approved for treating generalized, acquired hypoactive sexual desire disorder in premenopausal women. In clinical trials, the drug increased the number of satisfying sexual events and sexual desire, as measured by a diary and rating scales. Alcohol use and use of any moderate or strong inhibitor of cytochrome P450 3A4 are contraindicated in patients taking flibanserin because of an increased risk of hypotension and syncope.
1. Goldfisher ER, Breaux J, Katz M, et al. Continued efficacy and safety of flibanserin in premenopausal women with Hypoactive Sexual desire Disorder (HSDD): results from a randomized withdrawal trial. J Sex Med. 2011;8(11):3160- 3172.
2. Thorp J, Simon J, Dattani D, et al; DAISY trial investigators. Treatment of hypoactive sexual desire disorder in premenopausal women: efficacy of flibanserin in the DAISY study. J Sex Med. 2012;9(3):793-804.
3. Derogatis LR, Komer L, Katz M, et al; VIOLET Trial Investigators. Treatment of hypoactive sexual desire disorder in premenopausal women: efficacy of flibanserin in the VIOLET study. J Sex Med. 2012;9(4):1074-1085.
4. Katz M, DeRogatis LR, Ackerman R, et al; BEGONIA trial investigators. Efficacy of flibanserin in women with hypoactive sexual desire disorder: results from the BEGONIA trial. J Sex Med. 2013;10(7):1807-1815.
5. Gellad WF, Flynn KE, Alexander GC. Evaluation of flibanserin: science and advocacy at the FDA. JAMA. 2015;314(9):869-870
6. Joffe HV, Chang C, Sewell C, et al. FDA approval of flibanserin—treating hypoactive sexual desire disorder. N Engl J Med. 2016;374(2):101-104.
Flibanserin, FDA-approved in August 2015, is the first medication approved to treat acquired, generalized hypoactive sexual desire disorder (HSDD) in premenopausal women (Table 1). In clinical trials,1-4 the drug has shown modest efficacy in improving symptoms of low sexual desire (number of satisfying sexual events [SSEs], sexual desire, and overall sexual function). Flibanserin is not indicated to enhance sexual performance, for HSDD in postmenopausal women, or in men.
Clinical implications
Flibanserin could help premenopausal women who have distressing low sexual desire, which must be acquired and generalized:
- “Acquired low sexual desire” means that a patient had an adequate sexual desire that decreased or ceased for an unknown reason.
- “Generalized low sexual desire” means that lack of sexual desire occurs all the time and in all situations, not only with a certain partner or in some situations.
Women taking flibanserin could experience gradually increased sexual desire, increase in SSEs, and decrease of sexual distress. Flibanserin is indicated for long-term use; however, it should be discontinued after 8 weeks if the patient does not report any improvement in symptoms.
The number needed to treat with flibanserin likely would be rather large, but it is not available because of complex outcome measures in clinical trials. Flibanserin was not approved at 2 previous FDA committee hearings—mainly because of safety issues but also because of concerns about efficacy. For example, during the 2013 FDA hearing, the results presented showed statistically significant, but numerically small, treatment differences at 24 weeks compared with placebo. In an FDA responder analysis of the Phase-III trials, after accounting for the placebo effect, approximately 8% to 13% women were at least “much improved” on at least 1 of the primary outcomes.5
Flibanserin is not indicated for women whose sexual desire is due to (1) coexisting medical or psychiatric condition, (2) effects of medication or substance abuse, or (3) a relationship problem. It is unknown whether supplemental treatment would help these patients; however, it seems reasonable that combining flibanserin with psychosocial treatment, such as sex therapy or individual therapy, could be beneficial because it may be difficult to disentangle sexual dysfunction and relationship issues—2 problems that often are interwoven.
How it works
Flibanserin is a serotonin 1A receptor agonist and serotonin 2A receptor antagonist. In vitro, flibanserin demonstrated high affinity for the following 5-HT receptors:
- agonist activity at 5-HT1A
- antagonist activity at 5-HT2A, mostly in the prefrontal cortex.
Flibanserin also has moderate antagonist activities at the 5-HT2B, 5-HT2C, and dopamine D4 receptors. Flibanserin presumably acts centrally in the CNS; it has been suggested that flibanserin could rebalance neural circuitry involved in processing sexual desire by reducing serotonin activity and enhancing dopamine and epinephrine activity. The exact mechanism of how flibanserin improves sexual desire in women is unknown.
Pharmacokinetics
Flibanserin has a mean termination half-life of approximately 11 hours. It is administered once a day (50 to 100 mg) at bedtime. Steady state in healthy women was achieved after 3 days. Based on clinical observations, onset of action seems to be gradual and reaches maximum efficacy in approximately 8 weeks. Patients should discontinue the drug if no improvement is reported after 8 weeks. Flibanserin is readily absorbed from the gastrointestinal tract; however, food slows its absorption. The drug is 98% protein (mostly albumin)-bound.
Flibanserin is primarily metabolized in the liver by cytochrome P450 (CYP) 3A4 and to a lesser extent by CYP2C19. Co-administration of moderate (diltiazem, erythromycin, fluconazole, fosamprenavir, verapamil) or strong (eg, ketoconazole, clarithromycin, nefazodone, ritonavir) CYP3A4 inhibitors increases the concentration of flibanserin. This could lead to severe hypotension and syncope; therefore, co-administering flibanserin with a strong CYP3A4 inhibitor is contraindicated. Grapefruit juice is a moderate inhibitor of CYP3A4, and in a study of 26 healthy females, 240 mL of grapefruit juice increased flibanserin concentration 1.4-fold. Flibanserin is excreted though urine and feces. Flibanserin should be taken once a day at bedtime because of sedation, somnolence, and possible syncope.
Efficacy
The efficacy of flibanserin for treating HSDD was established in three 24-week, randomized, double-blind, placebo-controlled studies (Table 2). The target population in these studies was premenopausal women (mean age 36, range 19 to 55) with acquired HSDD lasting at least 6 months (mean duration, approximately 5 years). The 3 studies included 1,187 women who received flibanserin, 100 mg at bedtime, and 1,188 women who received placebo. Participants were mostly white (88.6%), and included black (9.6%) and Asian (1.5%) women. The completion rates were 69% for flibanserin and 78% for placebo. Some of the trials included arms with a lower dosage of flibanserin (25 mg and 50 mg), which are not included in this analysis.
As noted in the package insert, these trials each had 2 co-primary efficacy endpoints, SSEs and sexual desire:
- change from baseline to Week 24 in the number of monthly SSEs (ie, sexual intercourse, oral sex, masturbation, or genital stimulation by the partner)
- change in sexual desire from baseline to 24-week endpoint.
In Study 1 and 2, change in sexual desire from baseline to Week 24 was measured daily by using an electronic diary. Every day, patients rated their sexual desire level by answering the question, “Indicate your most intense level of sexual desire” from 0 (no desire) to 3 (strong desire). These responses were totaled over a 28-day period to yield the monthly sexual desire score, which ranged from 0 to 84. These 2 studies also used the Female Sexual Function Index (FSFI) Desire domain as a secondary endpoint.
Study 3 used the FSFI Desire domain, comprising 2 questions, as the sexual desire co-primary endpoint:
- “Over the past 4 weeks, how often did you feel sexual desire or interest?” Responses ranged from 1 (almost never or never) to 5 (almost always or always).
- “Over the past 4 weeks, how would you rate your level (degree) of sexual desire or interest?” Responses ranged from 1 (very low or none at all) to 5 (very high).
In all 3 trials, flibanserin was associated with a small, yet statistically significant, improvement in change in monthly SSEs from baseline to Week 24 compared with placebo. In Study 1 and 2, there were no statistically significant differences between flibanserin and placebo for the electronic diary sexual desire endpoint. In the third study, there was statistically significant improvement in the change in sexual desire using the FSFI Desire domain with flibanserin compared with placebo. The FSFI Desire domain findings were consistent across all 3 trials. Flibanserin was associated with a decrease in sexual distress compared with placebo in all 3 studies.
Tolerability
Flibanserin was well tolerated in the 3 clinical trials. As the FDA noted, clinical trials are conducted under widely varying conditions and therefore adverse reaction rates observed in trials of flibanserin cannot be directly compared with those reported in clinical trials of another drug and might not reflect rates observed in clinical practice.
The discontinuation rate due to adverse reactions was 13% among patients treated with flibanserin, 100 mg at bedtime, and 6% among those taking placebo. The most common side effects were somnolence, dizziness, fatigue, nausea, insomnia, and dry mouth, which appear dose-dependent. Onset of most of these adverse events was within 14 days after the start of treatment.
Although hypotension and syncope rarely were seen with flibanserin alone in clinical trials, these adverse events occurred more frequently in the morning and when taken with alcohol and with some drugs (moderate or strong CYP3A4 inhibitors), and in patients with hepatic impairment. Therefore, women who drink alcohol or take a moderate or strong inhibitor of CYP3A4—both of which are contraindicated—and those with hepatic impairment should not take flibanserin.
Flibanserin should be taken at bedtime, because the risk of hypotension and syncope is higher when flibanserin is taken in the morning and because of associated sedation and somnolence.
Unique clinical issues
Flibanserin is the first FDA-approved medication for treating HSDD. It is important to note that the drug originally was developed as an antidepressant, but failed to show efficacy. Researchers noted that the drug was more effective than placebo when patients were asked, “How strong is your sexual desire?” The focus of development then shifted to a potential treatment of HSDD.
Flibanserin was not approved at 2 previous FDA hearings, mainly because of safety concerns. For the second hearing, the manufacturer, Boehringer Ingelheim, which sold the rights to the drug to Sprout Pharmaceuticals in 2011,6 did not present any new efficacy data, but provided additional safety data, such as research suggesting the absence of next-day driving impairment and data related to alcohol use (the study confirming hypotension associated with alcohol abuse used a small sample, and only 2 of 25 participants were women).
Contraindications
Flibanserin is contraindicated in patients using alcohol because of an increased risk of hypotension and syncope. A patient’s alcohol use should be evaluated before administering flibanserin, and patients should be counseled about the importance of abstaining from alcohol.
Similarly, concomitant use of flibanserin with a moderate or strong inhibitor of CYP3A4 increases the concentration of flibanserin and raises the risk of hypotension and syncope. Therefore, the use of a moderate or strong inhibitor of CYP3A4 in patients taking flibanserin is contraindicated. Similarly, patients with liver impairment should not take this drug.
Strong CYP2C19 inhibitors (proton-pump inhibitors, selective serotonin reuptake inhibitors, benzodiazepines, antifungals) could increase flibanserin exposure, which may increase risk of hypotension, syncope, and CNS depression. Discuss these risks with your patients; doing so is particularly important when treating women of Chinese heritage, and some other Asian women, because 20% of these populations are genotypic CYP2C19 poor metabolizers.
Because of the increased risk of hypotension and syncope with alcohol use, flibanserin is available only through a restricted program under a Risk Evaluation and Mitigation Strategy (REMS) called the Addyi REMS Program. Flibanserin can be prescribed or dispensed only by physicians and pharmacists who watch this program’s online slide presentation and passed a comprehension test.a
Pregnant women should not take flibanserin because the effect on the fetus is unknown. Also, because the interaction with some oral contraceptives is unknown, patients should be cautioned about unwanted pregnancy. Women who are breastfeeding also should avoid using flibanserin because it is not known whether the drug is excreted in breast milk.
Women taking flibanserin also should avoid grapefruit juice, which increases flibanserin levels, and avoid using herbal products, resveratrol, and some over-the-counter drugs such as cimetidine. Women who have a depressive disorder also should avoid using flibanserin because their low sexual desire is more likely due to depression, which is not a therapeutic target for the drug.
Dosing
Flibanserin is provided in 100-mg film-coated tablets. It should be taken once a day at bedtime; titration is unnecessary. Length of treatment has not been determined, but it is recommended that patients stop flibanserin if they do not experience any benefit after 8 weeks. Although there is no guidance in the prescribing information, the medication probably could be stopped without tapering because withdrawal effects have not been observed.
Bottom Line
Flibanserin is FDA-approved for treating generalized, acquired hypoactive sexual desire disorder in premenopausal women. In clinical trials, the drug increased the number of satisfying sexual events and sexual desire, as measured by a diary and rating scales. Alcohol use and use of any moderate or strong inhibitor of cytochrome P450 3A4 are contraindicated in patients taking flibanserin because of an increased risk of hypotension and syncope.
1. Goldfisher ER, Breaux J, Katz M, et al. Continued efficacy and safety of flibanserin in premenopausal women with Hypoactive Sexual desire Disorder (HSDD): results from a randomized withdrawal trial. J Sex Med. 2011;8(11):3160- 3172.
2. Thorp J, Simon J, Dattani D, et al; DAISY trial investigators. Treatment of hypoactive sexual desire disorder in premenopausal women: efficacy of flibanserin in the DAISY study. J Sex Med. 2012;9(3):793-804.
3. Derogatis LR, Komer L, Katz M, et al; VIOLET Trial Investigators. Treatment of hypoactive sexual desire disorder in premenopausal women: efficacy of flibanserin in the VIOLET study. J Sex Med. 2012;9(4):1074-1085.
4. Katz M, DeRogatis LR, Ackerman R, et al; BEGONIA trial investigators. Efficacy of flibanserin in women with hypoactive sexual desire disorder: results from the BEGONIA trial. J Sex Med. 2013;10(7):1807-1815.
5. Gellad WF, Flynn KE, Alexander GC. Evaluation of flibanserin: science and advocacy at the FDA. JAMA. 2015;314(9):869-870
6. Joffe HV, Chang C, Sewell C, et al. FDA approval of flibanserin—treating hypoactive sexual desire disorder. N Engl J Med. 2016;374(2):101-104.