User login
Study provides new insight into malaria transmission
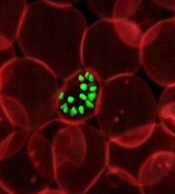
infecting a red blood cell
Image courtesy of St. Jude
Children’s Research Hospital
Research published in PNAS helps explain how the malaria parasite Plasmodium falciparum undergoes the changes that enable transmission of the parasite from humans to mosquitoes.
Investigators determined how the parasite transforms its own structure and the structure of a host red blood cell so the parasite can hide from the body’s normal defenses and later re-enter the bloodstream for transmission via mosquito bite.
The team believes that, by understanding this process, it may be possible to inhibit the blood cell’s transformation.
“Once you understand the molecular mechanisms, it becomes easier to find drugs to target them,” said Sulin Zhang, PhD, of Pennsylvania State University in University Park.
Dr Zhang developed the computational methods used to understand the physical transformations in the infected red blood cells that allow them to avoid removal in the spleen and prepare for transmission to a mosquito host.
He and his colleagues knew that healthy red blood cells are able to squeeze through small slits in the spleen, but damaged and aging red blood cells cannot and are filtered out and removed from the circulation.
To avoid this fate, the sexual stage malaria parasite first makes the red blood cell rigid and hides out in deep tissue. Then, when the parasite is mature, the infected red blood cells become flexible and elastic, ready to be picked up by a mosquito for disease transmission.
To understand these changes, the investigators prepared samples of parasites at each stage and studied the changing microstructure using atomic force microscopy.
This revealed changes in the organization of a meshwork of tiny spring-like proteins in the blood cell membrane. When the parasite is ready for transmission, it reverses the structural changes.
The team then turned to Dr Zhang, who developed a model to explain how subtle changes to the molecular structure of the spring-like proteins were sufficient to make the red blood cell either rigid or flexible.
The investigators are continuing to use Dr Zhang’s model to simulate the overall shapes and the flow dynamics of infected red blood cells in the bloodstream, providing information that could aid researchers looking to inhibit the malaria parasite’s spread. ![]()
Resident‐Created Hospitalist Curriculum
Hospital medicine has grown tremendously since its inception in the 1990s.[1, 2] This expansion has led to the firm establishment of hospitalists in medical education, quality improvement (QI), research, subspecialty comanagement, and administration.[3, 4, 5]
This growth has also created new challenges. The training needs for the next generation of hospitalists are changing given the expanded clinical duties expected of hospitalists.[6, 7, 8] Prior surveys have suggested that some graduates employed as hospitalists have reported feeling underprepared in the areas of surgical comanagement, neurology, geriatrics, palliative care, and navigating the interdisciplinary care system.[9, 10]
In keeping with national trends, the number of residents interested in hospital medicine at our institution has dramatically increased. As internal medicine residents interested in careers in hospitalist medicine, we felt that improving hospitalist training at our institution was imperative given the increasing scope of practice and job competitiveness.[11, 12] We therefore sought to design and implement a hospitalist curriculum within our residency. In this article, we describe the genesis of our program, our final product, and the challenges of creating a curriculum while being internal medicine residents.
METHODS
Needs Assessment
To improve hospitalist training at our institution, we first performed a needs assessment. We contacted recent hospitalist graduates and current faculty to identify aspects of their clinical duties that may have been underemphasized during their training. Next, we performed a literature search in PubMed using the combined terms of hospitalist, hospital medicine, residency, education, training gaps, or curriculum. Based on these efforts, we developed a resident survey that assessed their attitudes toward various components of a potential curriculum. The survey was sent to all categorical internal medicine residents at our institution in December 2014. The survey specified that the respondents only include those who were interested in careers in hospital medicine. Responses were measured using a 5‐point Likert scale (1 = least important to 5 = most important).
Curriculum Development
Our intention was to develop a well‐rounded program that utilized mentorship, research, and clinical experience to augment our learner's knowledge and skills for a successful, long‐term career in the increasingly competitive field of hospital medicine. When designing our curriculum, we accounted for our program's current rotational requirements and local culture. Several previously identified underemphasized areas within hospital medicine, such as palliative care and neurology, were already required rotations at our program.[3, 4, 5] Therefore, any proposed curricular changes would need to mold into program requirements while still providing a preparatory experience in hospital medicine beyond what our current rotations offered. We felt this could be accomplished by including rotations that could provide specific skills pertinent to hospital medicine, such as ultrasound diagnostics or QI.
| Rotation | Non‐SHAPE | SHAPE |
|---|---|---|
| ||
| ICU | At least 12 weeks | At least 16 weeks |
| Medical wards | At least 16 weeks | At least 16 weeks |
| Ultrasound diagnostics | Elective | Required |
| Quality improvement | Elective | Required |
| Surgical comanagement | Elective | Required |
| Medicine consult | Elective | Required |
| Neurology | Required | Required |
| Palliative care | Required | Required |
Meeting With Stakeholders
We presented our curriculum proposal to the chief of the Stanford Hospital Medicine Program. We identified her early in the process to be our primary mentor, and she proved instrumental in being an advocate. After several meetings with the hospitalist group to further develop our program, we presented it to the residency program leadership who helped us to finalize our program.
RESULTS
Needs Assessment
Twenty‐two out of 111 categorical residents in our program (19.8%) identified themselves as interested in hospital medicine and responded to the survey. There were several areas of a potential hospitalist curriculum that the residents identified as important (defined as 4 or 5 on a 5‐point Likert scale). These areas included mentorship (90.9% of residents; mean 4.6, standard deviation [SD] 0.7), opportunities to teach (86.3%; mean 4.4, SD 0.9), and the establishment of a formal hospitalist curriculum (85.7%; mean 4.2, SD 0.8). The residents also identified several rotations that would be beneficial (defined as a 4 or 5 on a 5‐point Likert scale). These included medicine consult/procedures team (95.5% of residents; mean 4.7, SD 0.6), point‐of‐care ultrasound diagnostics (90.8%; mean 4.7, SD 0.8), and a community hospitalist preceptorship (86.4%; mean 4.4, SD 1.0). The residents also identified several rotations deemed to be of lesser benefit. These rotations included inpatient neurology (only 27.3% of residents; mean 3.2, SD 0.8) and palliative care (50.0%; mean 3.5, SD 1.0).
The Final Product: A Hospitalist Training Curriculum
Based on the needs assessment and meetings with program leadership, we designed a hospitalist program and named it the Stanford Hospitalist Advanced Practice and Education (SHAPE) program. The program was based on 3 core principles: (1) clinical excellence: by training in hospitalist‐relevant clinical areas, (2) academic development: with required research, QI, and teaching, and (3) career mentorship.
Clinical Excellence By Training in Hospitalist‐Relevant Clinical Areas
The SHAPE curriculum builds off of our institution's current curriculum with additional required rotations to improve the resident's skillsets. These included ultrasound diagnostics, surgical comanagement, and QI (Box 1). Given that some hospitalists work in an open intensive care unit (ICU), we increased the amount of required ICU time to provide expanded procedural and critical care experiences. The residents also receive 10 seminars focused on hospital medicine, including patient safety, QI, and career development (Box 1).
Box
The Stanford Hospitalist Advanced Practice and Education (SHAPE) program curriculum. Members of the program are required to complete the requirements listed before the end of their third year. Note that the clinical rotations are spread over the 3 years of residency.
Stanford Hospitalist Advanced Practice and Education Required Clinical Rotations
- Medicine Consult (24 weeks)
- Critical Care (16 weeks)
- Ultrasound Diagnostics (2 weeks)
- Quality Improvement (4 weeks)
- Inpatient Neurology (2 weeks)
- Palliative Care (2 weeks)
- Surgical Comanagement (2 weeks)
Required Nonclinical Work
- Quality improvement, clinical or educational project with a presentation at an academic conference or manuscript submission in a peer‐reviewed journal
- Enrollment in the Stanford Faculty Development Center workshop on effective clinical teaching
- Attendance at the hospitalist lecture series (10 lectures): patient safety, hospital efficiency, fundamentals of perioperative medicine, healthcare structure and changing reimbursement patterns, patient handoff, career development, prevention of burnout, inpatient nutrition, hospitalist research, and lean modeling in the hospital setting
Mentorship
- Each participant is matched with 3 hospitalist mentors in order to provide comprehensive career and personal mentorship
Academic Development With Required Research and Teaching
SHAPE program residents are required to develop a QI, education, or clinical research project before graduation. They are required to present their work at a hospitalist conference or submit to a peer‐reviewed journal. They are also encouraged to attend the Society of Hospital Medicine annual meeting for their own career development.
SHAPE program residents also have increased opportunities to improve their teaching skills. The residents are enrolled in a clinical teaching workshop. Furthermore, the residents are responsible for leading regular lectures regarding common inpatient conditions for first‐ and second‐year medical students enrolled in a transitions‐of‐care elective.
Career Mentorship
Each resident is paired with 3 faculty hospitalists who have different areas of expertise (ie, clinical teaching, surgical comanagement, QI). They individually meet on a quarterly basis to discuss their career development and research projects. The SHAPE program will also host an annual resume‐development and career workshop.
SHAPE Resident Characteristics
In its first year, 13 of 25 residents (52%) interested in hospital medicine enrolled in the program. The SHAPE residents were predominantly second‐year residents (11 residents, 84.6%).
Among the 12 residents who did not enroll, there were 7 seniors (58.3%) who would soon be graduating and would not be eligible.
DISCUSSION
The training needs of aspiring hospitalists are changing as the scope of hospital medicine has expanded.[6] Residency programs can facilitate this by implementing a hospitalist curriculum that augments training and provides focused mentorship.[13, 14] An emphasis on resident leadership within these programs ensures positive housestaff buy‐in and satisfaction.
There were several key lessons we learned while designing our curriculum because of our unique role as residents and curriculum founders. This included the early engagement of departmental leadership as mentors. They assisted us in integrating our program within the existing internal medicine residency and the selection of electives. It was also imperative to secure adequate buy‐in from the academic hospitalists at our institution, as they would be our primary source of faculty mentors and lecturers.
A second challenge was balancing curriculum requirements and ensuring adequate buy‐in from our residents. The residents had fewer electives over their second and third years. However, this was balanced by the fact that the residents were given first preference on historically desirable rotations at our institution (including ultrasound, medicine consult, and QI). Furthermore, we purposefully included current resident opinions when performing our needs assessment to ensure adequate buy‐in. Surprisingly, the residents found several key rotations to be of low importance in our needs assessment, such as palliative care and inpatient neurology. Although this may seem confounding, several of these rotations (ie, neurology and palliative care) are already required of all residents at our program. It may be that some residents feel comfortable in these areas based on their previous experiences. Alternatively, this result may represent a lack of knowledge on the residents' part of what skill sets are imperative for career hospitalists. [4, 6]
Finally, we recognize that our program was based on our local needs assessment. Other residency programs may already have similar curricula built into their rotation schedule. In those instances, a hospitalist curriculum that emphasizes scholarly advancement and mentorship may be more appropriate.
CONCLUSIONS AND FUTURE DIRECTIONS
At out institution, we have created a hospitalist program designed to train the next generation of hospitalists with improved clinical, research, and teaching skills. Our cohort of residents will be observed over the next year, and we will administer a follow‐up study to assess the effectiveness of the program.
Acknowledgements
The authors acknowledge Karina Delgado, program manager at Stanford's internal medicine residency, for providing data on recent graduate plans.
Disclosures: Andre Kumar, MD, and Andrea Smeraglio, MD, are cofirst authors. The authors report no conflicts of interest.
- . The hospitalist field turns 15: new opportunities and challenges. J Hosp Med. 2011;6(4):10–13.
- , , , , . The spectrum of community based hospitalist practice: A call to tailor internal medicine residency training. Arch Intern Med. 2007;167:727–729.
- , , , . Health care market trends and the evolution of hospitalist use and roles. J Gen Intern Med. 2005;20(2):101–107.
- , , , . Survey of the National Association of Inpatient Physicians. Ann Intern Med. 1999:343–349.
- , . Hospitalist educators: future of inpatient internal medicine training. Mt Sinai J Med. 2008;75(5):430–435.
- , , , , . Fulfilling the promise of hospital medicine: tailoring internal medicine training to address hospitalists' needs. J Gen Intern Med. 2008;23(7):1110–1115.
- , , , , . Closing the gap between internal medicine training and practice: recommendations from recent graduates. Am J Med. 2005;118(6):680–685
- , , , et al. Curricular content of internal medicine residency programs: a nationwide report. Am J Med. 2014;127(12):1247–1254.
- , , , . Hospitalists' perceptions of their residency training needs: results of a national survey. Am J Med. 2001;111(3):247–254.
- , , , et al. Reforming internal medicine residency training: a report from the Society of General Internal Medicine's Task Force for Residency Reform. J Gen Intern Med. 2005;20(12):1165–1172.
- , . Clinical hospital medicine fellowships: perspectives of employers, hospitalists, and medicine residents. J Hosp Med. 2008;3(1):28–34.
- , , , , , . Challenges and opportunities in academic hospital medicine: report from the Academic hospital medicine Summit. J Hosp Med. 2009;4(4):240–246.
- , , . Achieving hospital medicine's promise through internal medicine residency redesign. Mt Sinai J Med. 2008;75(5):436–441.
- , , , , . Training Future Hospitalists. Cult Med. 1999;171(12):367–370.
Hospital medicine has grown tremendously since its inception in the 1990s.[1, 2] This expansion has led to the firm establishment of hospitalists in medical education, quality improvement (QI), research, subspecialty comanagement, and administration.[3, 4, 5]
This growth has also created new challenges. The training needs for the next generation of hospitalists are changing given the expanded clinical duties expected of hospitalists.[6, 7, 8] Prior surveys have suggested that some graduates employed as hospitalists have reported feeling underprepared in the areas of surgical comanagement, neurology, geriatrics, palliative care, and navigating the interdisciplinary care system.[9, 10]
In keeping with national trends, the number of residents interested in hospital medicine at our institution has dramatically increased. As internal medicine residents interested in careers in hospitalist medicine, we felt that improving hospitalist training at our institution was imperative given the increasing scope of practice and job competitiveness.[11, 12] We therefore sought to design and implement a hospitalist curriculum within our residency. In this article, we describe the genesis of our program, our final product, and the challenges of creating a curriculum while being internal medicine residents.
METHODS
Needs Assessment
To improve hospitalist training at our institution, we first performed a needs assessment. We contacted recent hospitalist graduates and current faculty to identify aspects of their clinical duties that may have been underemphasized during their training. Next, we performed a literature search in PubMed using the combined terms of hospitalist, hospital medicine, residency, education, training gaps, or curriculum. Based on these efforts, we developed a resident survey that assessed their attitudes toward various components of a potential curriculum. The survey was sent to all categorical internal medicine residents at our institution in December 2014. The survey specified that the respondents only include those who were interested in careers in hospital medicine. Responses were measured using a 5‐point Likert scale (1 = least important to 5 = most important).
Curriculum Development
Our intention was to develop a well‐rounded program that utilized mentorship, research, and clinical experience to augment our learner's knowledge and skills for a successful, long‐term career in the increasingly competitive field of hospital medicine. When designing our curriculum, we accounted for our program's current rotational requirements and local culture. Several previously identified underemphasized areas within hospital medicine, such as palliative care and neurology, were already required rotations at our program.[3, 4, 5] Therefore, any proposed curricular changes would need to mold into program requirements while still providing a preparatory experience in hospital medicine beyond what our current rotations offered. We felt this could be accomplished by including rotations that could provide specific skills pertinent to hospital medicine, such as ultrasound diagnostics or QI.
| Rotation | Non‐SHAPE | SHAPE |
|---|---|---|
| ||
| ICU | At least 12 weeks | At least 16 weeks |
| Medical wards | At least 16 weeks | At least 16 weeks |
| Ultrasound diagnostics | Elective | Required |
| Quality improvement | Elective | Required |
| Surgical comanagement | Elective | Required |
| Medicine consult | Elective | Required |
| Neurology | Required | Required |
| Palliative care | Required | Required |
Meeting With Stakeholders
We presented our curriculum proposal to the chief of the Stanford Hospital Medicine Program. We identified her early in the process to be our primary mentor, and she proved instrumental in being an advocate. After several meetings with the hospitalist group to further develop our program, we presented it to the residency program leadership who helped us to finalize our program.
RESULTS
Needs Assessment
Twenty‐two out of 111 categorical residents in our program (19.8%) identified themselves as interested in hospital medicine and responded to the survey. There were several areas of a potential hospitalist curriculum that the residents identified as important (defined as 4 or 5 on a 5‐point Likert scale). These areas included mentorship (90.9% of residents; mean 4.6, standard deviation [SD] 0.7), opportunities to teach (86.3%; mean 4.4, SD 0.9), and the establishment of a formal hospitalist curriculum (85.7%; mean 4.2, SD 0.8). The residents also identified several rotations that would be beneficial (defined as a 4 or 5 on a 5‐point Likert scale). These included medicine consult/procedures team (95.5% of residents; mean 4.7, SD 0.6), point‐of‐care ultrasound diagnostics (90.8%; mean 4.7, SD 0.8), and a community hospitalist preceptorship (86.4%; mean 4.4, SD 1.0). The residents also identified several rotations deemed to be of lesser benefit. These rotations included inpatient neurology (only 27.3% of residents; mean 3.2, SD 0.8) and palliative care (50.0%; mean 3.5, SD 1.0).
The Final Product: A Hospitalist Training Curriculum
Based on the needs assessment and meetings with program leadership, we designed a hospitalist program and named it the Stanford Hospitalist Advanced Practice and Education (SHAPE) program. The program was based on 3 core principles: (1) clinical excellence: by training in hospitalist‐relevant clinical areas, (2) academic development: with required research, QI, and teaching, and (3) career mentorship.
Clinical Excellence By Training in Hospitalist‐Relevant Clinical Areas
The SHAPE curriculum builds off of our institution's current curriculum with additional required rotations to improve the resident's skillsets. These included ultrasound diagnostics, surgical comanagement, and QI (Box 1). Given that some hospitalists work in an open intensive care unit (ICU), we increased the amount of required ICU time to provide expanded procedural and critical care experiences. The residents also receive 10 seminars focused on hospital medicine, including patient safety, QI, and career development (Box 1).
Box
The Stanford Hospitalist Advanced Practice and Education (SHAPE) program curriculum. Members of the program are required to complete the requirements listed before the end of their third year. Note that the clinical rotations are spread over the 3 years of residency.
Stanford Hospitalist Advanced Practice and Education Required Clinical Rotations
- Medicine Consult (24 weeks)
- Critical Care (16 weeks)
- Ultrasound Diagnostics (2 weeks)
- Quality Improvement (4 weeks)
- Inpatient Neurology (2 weeks)
- Palliative Care (2 weeks)
- Surgical Comanagement (2 weeks)
Required Nonclinical Work
- Quality improvement, clinical or educational project with a presentation at an academic conference or manuscript submission in a peer‐reviewed journal
- Enrollment in the Stanford Faculty Development Center workshop on effective clinical teaching
- Attendance at the hospitalist lecture series (10 lectures): patient safety, hospital efficiency, fundamentals of perioperative medicine, healthcare structure and changing reimbursement patterns, patient handoff, career development, prevention of burnout, inpatient nutrition, hospitalist research, and lean modeling in the hospital setting
Mentorship
- Each participant is matched with 3 hospitalist mentors in order to provide comprehensive career and personal mentorship
Academic Development With Required Research and Teaching
SHAPE program residents are required to develop a QI, education, or clinical research project before graduation. They are required to present their work at a hospitalist conference or submit to a peer‐reviewed journal. They are also encouraged to attend the Society of Hospital Medicine annual meeting for their own career development.
SHAPE program residents also have increased opportunities to improve their teaching skills. The residents are enrolled in a clinical teaching workshop. Furthermore, the residents are responsible for leading regular lectures regarding common inpatient conditions for first‐ and second‐year medical students enrolled in a transitions‐of‐care elective.
Career Mentorship
Each resident is paired with 3 faculty hospitalists who have different areas of expertise (ie, clinical teaching, surgical comanagement, QI). They individually meet on a quarterly basis to discuss their career development and research projects. The SHAPE program will also host an annual resume‐development and career workshop.
SHAPE Resident Characteristics
In its first year, 13 of 25 residents (52%) interested in hospital medicine enrolled in the program. The SHAPE residents were predominantly second‐year residents (11 residents, 84.6%).
Among the 12 residents who did not enroll, there were 7 seniors (58.3%) who would soon be graduating and would not be eligible.
DISCUSSION
The training needs of aspiring hospitalists are changing as the scope of hospital medicine has expanded.[6] Residency programs can facilitate this by implementing a hospitalist curriculum that augments training and provides focused mentorship.[13, 14] An emphasis on resident leadership within these programs ensures positive housestaff buy‐in and satisfaction.
There were several key lessons we learned while designing our curriculum because of our unique role as residents and curriculum founders. This included the early engagement of departmental leadership as mentors. They assisted us in integrating our program within the existing internal medicine residency and the selection of electives. It was also imperative to secure adequate buy‐in from the academic hospitalists at our institution, as they would be our primary source of faculty mentors and lecturers.
A second challenge was balancing curriculum requirements and ensuring adequate buy‐in from our residents. The residents had fewer electives over their second and third years. However, this was balanced by the fact that the residents were given first preference on historically desirable rotations at our institution (including ultrasound, medicine consult, and QI). Furthermore, we purposefully included current resident opinions when performing our needs assessment to ensure adequate buy‐in. Surprisingly, the residents found several key rotations to be of low importance in our needs assessment, such as palliative care and inpatient neurology. Although this may seem confounding, several of these rotations (ie, neurology and palliative care) are already required of all residents at our program. It may be that some residents feel comfortable in these areas based on their previous experiences. Alternatively, this result may represent a lack of knowledge on the residents' part of what skill sets are imperative for career hospitalists. [4, 6]
Finally, we recognize that our program was based on our local needs assessment. Other residency programs may already have similar curricula built into their rotation schedule. In those instances, a hospitalist curriculum that emphasizes scholarly advancement and mentorship may be more appropriate.
CONCLUSIONS AND FUTURE DIRECTIONS
At out institution, we have created a hospitalist program designed to train the next generation of hospitalists with improved clinical, research, and teaching skills. Our cohort of residents will be observed over the next year, and we will administer a follow‐up study to assess the effectiveness of the program.
Acknowledgements
The authors acknowledge Karina Delgado, program manager at Stanford's internal medicine residency, for providing data on recent graduate plans.
Disclosures: Andre Kumar, MD, and Andrea Smeraglio, MD, are cofirst authors. The authors report no conflicts of interest.
- . The hospitalist field turns 15: new opportunities and challenges. J Hosp Med. 2011;6(4):10–13.
- , , , , . The spectrum of community based hospitalist practice: A call to tailor internal medicine residency training. Arch Intern Med. 2007;167:727–729.
- , , , . Health care market trends and the evolution of hospitalist use and roles. J Gen Intern Med. 2005;20(2):101–107.
- , , , . Survey of the National Association of Inpatient Physicians. Ann Intern Med. 1999:343–349.
- , . Hospitalist educators: future of inpatient internal medicine training. Mt Sinai J Med. 2008;75(5):430–435.
- , , , , . Fulfilling the promise of hospital medicine: tailoring internal medicine training to address hospitalists' needs. J Gen Intern Med. 2008;23(7):1110–1115.
- , , , , . Closing the gap between internal medicine training and practice: recommendations from recent graduates. Am J Med. 2005;118(6):680–685
- , , , et al. Curricular content of internal medicine residency programs: a nationwide report. Am J Med. 2014;127(12):1247–1254.
- , , , . Hospitalists' perceptions of their residency training needs: results of a national survey. Am J Med. 2001;111(3):247–254.
- , , , et al. Reforming internal medicine residency training: a report from the Society of General Internal Medicine's Task Force for Residency Reform. J Gen Intern Med. 2005;20(12):1165–1172.
- , . Clinical hospital medicine fellowships: perspectives of employers, hospitalists, and medicine residents. J Hosp Med. 2008;3(1):28–34.
- , , , , , . Challenges and opportunities in academic hospital medicine: report from the Academic hospital medicine Summit. J Hosp Med. 2009;4(4):240–246.
- , , . Achieving hospital medicine's promise through internal medicine residency redesign. Mt Sinai J Med. 2008;75(5):436–441.
- , , , , . Training Future Hospitalists. Cult Med. 1999;171(12):367–370.
Patient‐Reported Barriers to Discharge
Thirty‐six million adults were discharged from US hospitals in 2012, with approximately 45% from medicine service lines.[1, 2] Discharge planning, a key aspect of care for hospitalized patients,[3] should involve the development of a plan to enable the patient to be discharged at the appropriate time and with provision of sufficient postdischarge support and services.[4]
Central to the discharge planning process is an assessment of a patient's readiness for discharge. Readiness is often a provider‐driven process, based on specific clinical and health system benchmarks.[5] However, providers' perception of readiness for discharge does not always correlate with patients' self‐assessments or objective measures of understanding.[6] For example, nurses overestimate patients' readiness for discharge compared to patients' own self‐report.[7] As a result, the need to include the patient perspective is increasingly recognized as an important contributing factor in the discharge planning process.[8, 9]
Current approaches to assessing discharge readiness are typically single assessments. However, these assessments do not take into account the complexity of discharge planning or patients' understanding, or their ability to carry out postacute care tasks.[8] In addition, few models have included assessments of physical stability and functional ability along with measures such as ability to manage self‐care activities at home, coping and social support, or access to health system and community resources.[10, 11]
To address these gaps in the existing literature, we carried out a prospective observational study of daily, patient‐reported, assessments of discharge readiness to better understand patients' perspectives on issues that could impede the transition to home. Using these data, we then sought to determine the prevalence of patient‐reported discharge barriers and the frequency with which they were resolved prior to the day of discharge. We also explored whether problems identified at discharge were associated with 30‐day readmission.
METHODS
Study Design, Setting, and Participants
We carried out a prospective observational study at the University of California San Francisco (UCSF) Medical Center, a 600‐bed tertiary care academic hospital in San Francisco, California. The UCSF Committee on Human Research approved this study. We recruited patients between November 2013 and April 2014. Patients were eligible to participate if they were admitted to the General Medicine Service; over 18 years old; English speaking; cognitively able to provide informed consent; and not under contact, droplet, airborne, or radiation isolation. Patients were eligible to participate regardless of where they were admitted from or expected to be discharged (eg, home, skilled nursing facility). Patients were excluded if they were acutely unwell or symptomatic resulting in them being unable to complete the surveys. Caregivers were not able to participate in the study on behalf of patients. We screened daily admission charts for eligibility and approached consecutive patients to consent them into the study on their first or second day of hospitalization. An enrollment tracker was used to documented reasons for patients' exclusion or refusal.
Survey Development
We adapted an existing and validated Readiness for Hospital Discharge Survey (RHDS) previously used in obstetric, surgical, and medicine patients for our study.[10, 11, 12] This initial list was culled from 23 to 12 items, based on input from patients and physicians. This feedback step also prompted a change in the response scale from a 0 to 10 scale to a simpler yes, no, or I would like to talk with someone about this scale intended to encourage discussion between patients and providers. After this revision step, we further pretested the survey among physicians and a small set of general medical patients to assess comprehension. Thus, our final question set included 12 items in 4 domains; personal status (ie, pain, mobility), knowledge (ie, medications, problems to watch for, recovery plan), coping ability (ie, emotional support, who to call with problems), and expected support (ie, related to activities and instrumental activities of daily living).
Data Collection
We collected data from interviews of patients as well as chart abstraction. Trained research assistants approached patients to complete our revised RHDS at admission, which was either on their first or second day of hospitalization. We collected data via an intake admission survey, which asked patients about their readiness for discharge, followed by a daily readiness for discharge survey until the day of discharge. A research assistant read the survey items to patients and recorded responses on a paper version of the survey. We abstracted demographic, clinical, and 30‐day readmission information from each participant's electronic medical record.
Analytic Approach
A barrier to discharge readiness was confirmed when a patient responded no' to an item (except for presence of catheter and pain or discomfort where yes was used) and/or they stated they wanted to talk to someone about the issue. We then used descriptive statistics to summarize patients' responses by survey administration number. Multilevel mixed effect regression was used to investigate any patterns in barriers to discharge over the course of hospitalization. We described the frequency of identified barriers to discharge on the intake admission and final (48 hours of discharge) surveys. McNemar's tests compared the proportion of patients reporting each barrier, and paired t tests the mean number of barriers at these 2 survey time points. We also assessed whether persistent barriers to discharge readiness on the final survey were associated with readmission to our hospital within 30‐days using t tests, 2, or Fisher exact test. Analysis was conducted in SPSS 22.0 (IBM Corp., Armonk, NY) and Stata (StataCorp, College Station, TX).
RESULTS
Patients
There were 2045 patients admitted to the general medicine service during the study period. Medical record screening resulted in 1350 exclusions. Of the remaining 695 patients, 113 refused and 419 were further found to be unable to participate. After all exclusions were applied and following direct screening, 163 patients agreed to participate in our study (Table 1). Mean length of stay among our cohort was 5.42 days (standard deviation [SD], 11.49) and the majority of patients were admitted from and discharged to home (Table 1).
| |
| Mean age, y (SD) | 56.4 (17) |
| Female gender, no. (%) | 86 (53) |
| Race, no. (%) | |
| Asian | 13 (8) |
| African American | 27 (16) |
| White | 96 (59) |
| Other | 24 (25) |
| Declined to say | 3 (1) |
| Married, no. (%) | 78 (48) |
| Insurance, no. (%) | |
| Medicare | 59 (36) |
| Medicaid | 22 (14) |
| Private | 73 (45) |
| Self‐pay | 2 (1) |
| Other | 7 (4) |
| Patient admitted from, no. (%) | |
| Home | 118 (72) |
| Outpatient clinic | 17 (10) |
| Procedural area | 6 (4) |
| Another facility | 12 (7) |
| Other | 9 (6) |
| Patient discharged to, no. (%) | |
| Home without services | 107 (66) |
| Home with services | 40 (25) |
| Home hospice | 2 (1) |
| Skilled nursing facility | 8 (5) |
| Patient deceased | 3 (2) |
| Other | 3 (2) |
Barriers to Discharge Readiness
Patients completed on average 1.82 surveys (SD 1.10; range, 18), and in total 296 surveys were administered. Only 5% of patients were captured on their admission day, whereas 77% of patients were surveyed on their second hospital day (Table 2). Between the first and second survey administration, 51% of patients were lost to follow‐up, and then by the third survey administration a further 37% were lost to follow‐up (Table 3). Patients were unable to be reinterviewed most often because they had been (1) discharged, (2) were unavailable or having a procedure at time of recruitment, or (3) became too sick and symptomatic.
| Hospital Day | ||||||||||
|---|---|---|---|---|---|---|---|---|---|---|
| 1 | 2 | 3 | 4 | 5 | 6 | 7 | 8 | 9 | 10 | |
| No. of eligible patients hospitalized | 163 | 161 | 138 | 102 | 70 | 50 | 35 | 24 | 19 | 17 |
| No. of patients surveyed | 8 | 124 | 70 | 30 | 22 | 13 | 7 | 6 | 2 | 0 |
| % of eligible patients surveyed | 4.9 | 77.0 | 50.7 | 29.4 | 31.4 | 26.0 | 20.0 | 25.0 | 10.5 | 0 |
| Survey No. | ||||||
|---|---|---|---|---|---|---|
| 1 | 2 | 3 | 4 | 5 | 6+ | |
| ||||||
| No. of patients surveyed | 163 | 83 | 31 | 11 | 3 | 5 |
| Total barriers (all patients) | 533 | 235 | 84 | 22 | 7 | 8 |
| No. of barriers per patient, mean (SD) | 3.27(2.35) | 2.83 (2.11) | 2.71 (2.49) | 2.00 (1.73) | 2.33 (2.51) | 1.60 (2.30) |
| Median no. of barriers per patient | 3.0 | 3.0 | 2.0 | 1.0 | 2.0 | 0 |
| Median hospital day of survey administration | 2.0 | 3.0 | 5.0 | 6.0 | 8.0 | 13.0 |
| Initial admission survey, no. (%) | 163 (100.0) | 0 | 0 | 0 | 0 | 0 |
| Follow‐up survey, no. (%) | 0 | 38 (45.8) | 16 (51.6) | 4 (36.4) | 0 | 1 (20.0) |
| Survey 48 hours before discharge, no. (%) | 59 (36.2) | 45 (54.2) | 15 (48.4) | 7 (63.6) | 3 (100.0) | 4 (80.0) |
In total, over 889 individual barriers to discharge readiness were reported across all surveys. The total and mean numbers of barriers were highest on the admission intake survey, and numbers continued to decrease until the fourth survey. On average, the total number of barriers to discharge patients reported decreased by 0.15 (95% confidence interval: 0.01‐0.30) per day (P = 0.047).
Change in Barriers to Discharge
Sixty‐eight patients (42%) completed an admission intake survey as well as final survey 48 hours before discharge (Table 4). We observed a significant reduction in mean number of barriers reported between admission and discharge surveys (3.19 vs 2.53, P = 0.01). Sixty‐one patients (90%) left the hospital with 1 or more persistent barrier to a safe discharge. However, the 3 most common barriers to discharge readiness on the admission and final survey remained the same: unresolved pain, lack of understanding of plan for recovery, and daily living activities (eg, cooking, cleaning, and shopping). The number of patients with unresolved pain appeared to increase slightly, though this rise was not statistically significant. In contrast, there were significant reductions in patients reporting they were unaware of problems to watch out for postdischarge (28% vs 16%; P = 0.04) or did not understand their recovery plan (52% vs 40%; P = 0.03).
| Barrier to Discharge | Survey | |
|---|---|---|
| Admission, No. (%) | Final Survey, No. (%) | |
| ||
| Catheter is present? | 6 (7.2) | 6 (7.2) |
| Not out of bed, sitting in a chair, or walking? | 17 (20.5) | 13 (15.7) |
| Pain or discomfort? | 50 (60.2) | 52 (62.7) |
| Unable to get to the bathroom for toilet or to shower? | 15 (18.1) | 12 (14.5) |
| Unable to self‐care without help from others? | 27 (32.5) | 23 (27.7) |
| Unable to get your own medications? | 11 (13.3) | 14 (16.9) |
| Know what problems to watch for?* | 23 (27.7) | 13 (15.7) |
| Know where to call if you had problems? | 10 (12.0) | 8 (9.6) |
| Inability for personal care such as bathing, toileting, and eating? | 8 (9.6) | 11 (13.3) |
| Lack of support for emotional needs? | 16 (19.3) | 9 (10.8) |
| Unable to cook, clean, or do shopping? | 33 (39.8) | 25 (30.1) |
| Do not understand the overall plan for your recovery?* | 43 (51.8) | 33 (39.8) |
DISCUSSION
Assessing discharge readiness highlights an opportunity to engage patients directly in their discharge planning process. However, our prospective study of 163 hospitalized adults revealed that unresolved discharge barriers were common; 90% of patients were discharged with at least 1 issue that might inhibit an effective transition home. The majority of these patients were also discharged home without any support services. In addition, many of the major barriers patients reportedpain, lack of understanding around plans, and ability to provide self‐carewere consistent from admission to discharge, suggesting a missed opportunity to address problems present early in a patient's stay.
Some of the issues our patients described, such as pain; lack of understanding of a recovery plan; and functional, social, and environmental vulnerabilities that impede recovery, have been described in studies using data collected in the postacute time period.[13, 14, 15] Focus on postacute barriers is likely to be of limited clinical utility to assist in any real‐time discharge planning, particularly planning that assesses individual patients' needs and tailors programs and education appropriately. Having said this, consistency between our results and data collected from postdischarge patients again supports broad areas of improvement for health systems.
Persistent gaps in care at discharge may be a result of limited standardization of discharge processes and a lack of engagement in obtaining patient‐reported concerns. Lack of a framework for preparing individual patients for discharge has been recognized as a significant obstacle to effective discharge planning. For example, Hesselink et al.'s qualitative study with almost 200 patients and providers across multiple institutions described how lack of a standard approach to providing discharge planning resulted in gaps in information provision.[16] Similarly, Horwitz et al. described wide variation in discharge practices at a US academic medical center, suggesting lack of a standard approach to identifying patient needs.[14]
Although many transitions of care programs have supported implementation of specific care interventions at a hospital or health system level, there have been surprisingly few studies describing efforts to standardize the assessment of discharge barriers and prospectively engage individual patients.[17] One emblematic study used stakeholder interviews and process mapping to develop a readiness report within their electronic medical record (EMR).[17] Aggregate data from the EMR including orders and discharge plans were coded, extracted, and summarized into a report. The overall goal of the report was to identify progress toward completion of discharge tasks; however, a limitation was that it did not explicitly include patient self‐assessments. Another study by Grimmer et al. describes the development of a patient‐centered discharge checklist that incorporated patients and care concerns.[18] The themes incorporated into this checklist cover many transitional issues; however, outside of the checklist's development, few publications or Web resources describe it in actual use.
Our approach may represent an advance in approaches to engaging patients in discharge planning and preparing patients for leaving the hospital. Although our data do not support efficacy of our daily surveys in terms of improving discharge planning, this initial evaluation provides the framework upon which providers can develop discharge plans that are both standardized in terms of using a structured multidomain communication tool to elicit barriers, as well as patient‐centered and patient‐directed, by using the information collected in the survey tool to initiate tailored discharge planning earlier in the hospital stay. However, our program points out an important limitation of an entirely patient‐initiated program, which is difficulty obtaining truly daily assessments. During this study, we had a single research assistant visit patients as frequently as possible during hospitalization, but even daily visits did not yield complete information on all patients. Although this limitation may in part be due to the fact that our study was a focused pilot of an approach we hope to expand, it also represents the complexity of patient experience in the hospital, where patients are often out of their room for tests, are unable to complete a survey because of problematic symptoms, or simply are unwilling or unable to participate in regular surveys.
Our study has a number of limitations. First, the number of patients in our study overall, and the number who completed at least 2 surveys, was relatively small, limiting the generalizability of the study and our ability to determine the true prevalence of unresolved barriers at discharge. In addition, our selection criteria and response rates have limited our sample in that our final group may not be representative of all patients admitted to our medicine service. The broad exclusion of patients who had physical or psychosocial barriers, and those who were acutely unwell and symptomatic, has the potential to introduce selection bias given the excluded populations are those most at risk of readmission. We also acknowledge that some of the issues that patients' are reporting may be chronic ones. However, given the fact that patients feel these issues, even if chronic, are unaddressed or that they want to talk with their doctor about them, is still a very large potential gap in care and patient engagement.
However, despite these limitations, which seem most likely to produce a cohort that is more likely to be able to participate in our survey, and in turn more likely to participate in their care more broadly, we still observed disappointing resolution of discharge barriers. In addition, our adapted survey instrument, though based on well‐supported conceptual frameworks,[19] has not been extensively tested outside of our hospital setting. Finally, as a single‐center study, our results cannot be generalized to other settings.
Assessing discharge readiness highlights an opportunity to obtain patient self‐reported barriers to discharge. This can facilitate discharge planning that targets individual patient needs. This information also emphasizes potentially fruitful opportunities for improved communication and education activities, potentially if these data are fed back to providers in real time, potentially as part of team‐based dashboards or the context of interdisciplinary team models.
Acknowledgements
The authors thank all of the patients who participated in this project, and Yimdriuska Magan Gigi for her assistance with chart abstractions. The authors also acknowledge and thank John Boscardin for his statistical and analytic support.
Disclosures: James D. Harrison, and Drs. Ryan S. Greysen and Andrew D. Auerbach contributed to the concept, design, analysis, interpretation of data, drafting of the manuscript, critical revisions to the manuscript, and final approval of manuscript. Ronald Jacolbia and Alice Nguyen contributed to the acquisition of data, drafting and final approval of manuscript and project, and administrative and technical support. Dr. Auerbach was supported by National Heart, Lung, and Blood Institute grant K24 K24HL098372. Dr. Greysen is supported by the National Institutes of Health (NIH), National Institute of Aging (NIA) through the Claude D. Pepper Older Americans Independence Center (P30AG021342 NIH/NIA and K23AG045338‐01). The authors have no financial or other conflicts of interest to declare.
- , , . Trends and projections in inpatient hospital costs and utilization 2003–2013. HCUP statistical brief #175. July 2014. Rockville, MD: Agency for Healthcare Research and Quality; 2014.
- , . Overview of hospital stays in the United States 2012. HCUP statistical brief #180. October 2014. Rockville, MD: Agency for Healthcare Research and Quality; 2014.
- Joint Commision. The Joint Commission Comprehensive Accreditation Manual for Hospitals. Oak Brook, IL: The Joint Commission; 2015.
- , , . Hospital discharge and readmission. In: Post TW, ed. UpToDate website: Available at: http://www.uptodate.com/contents/hospital‐discharge‐and‐readmission. Accessed August 14, 2015.
- , . A patient centered model of care for hospital discharge. Clin Nurse Res. 2004;13:117–136.
- , , , , , . Which reasons do doctors, nurses and patients have for hospital discharge? A mixed methods study. PLoS One. 2014;9:e91333.
- , , . Nurse and patient perceptions of discharge readiness in relation to postdischarge utilization. Med Care. 2010;48:482–486.
- , . Older people's perception of their readiness for discharge and postdischarge use of community support and services. Int J Older People Nurs. 2013;8:104–115.
- , , , . The care transitions intervention: Results of a randomized controlled trial. Arch Intern Med. 2006;166:1822–1828.
- , . Psychometric properties of the Readiness for Hospital Discharge Scale. J Nurs Meas. 2006;14:163–180.
- , , , et al. Perceived readiness for hospital discharge in adult medical‐surgical patients. Clin Nurse Spec. 2007;21:31–42.
- , , , . Validation of patient and nurse short forms of the Readiness for Hospital Discharge Scale and their relationship to return to the hospital. Health Serv Res. 2014;49:304–317.
- , , , et al. “Missing Pieces”—functional, social and environmental barriers to recovery for vulnerable older adults transitioning from hospital to home. J Am Geriatr Soc. 2014;62:1556–1561.
- , , , et al. Quality of discharge practices and patient understanding at an academic medical center. JAMA Intern Med. 2013;173:1715–1722.
- , , . Brief scale measuring patient prepardeness for hospital discharge to home: Psychometric properties. J Hosp Med. 2008;3:446–454.
- , , , et al. Improving patient discharge and reducing hospital readmission by using intervention mapping. BMC Health Serv Res. 2014;14:389.
- , , , , , . Development of a discharge readiness report within the electronic health record: a discharge planning tool. J Hosp Med. 2014;9:533–539.
- , , , . Incorporating Patient and Carer Concerns in Discharge Plans: The Development of a Practical Patient‐Centred Checklist. The Internet Journal of Allied Health Sciences and Practice. 2006;4: Article 5.
- , , , . Identifying keys to success in reducing readmissions using the ideal transitions in care framework. BMC Health Serv Res. 2014;14:423.
Thirty‐six million adults were discharged from US hospitals in 2012, with approximately 45% from medicine service lines.[1, 2] Discharge planning, a key aspect of care for hospitalized patients,[3] should involve the development of a plan to enable the patient to be discharged at the appropriate time and with provision of sufficient postdischarge support and services.[4]
Central to the discharge planning process is an assessment of a patient's readiness for discharge. Readiness is often a provider‐driven process, based on specific clinical and health system benchmarks.[5] However, providers' perception of readiness for discharge does not always correlate with patients' self‐assessments or objective measures of understanding.[6] For example, nurses overestimate patients' readiness for discharge compared to patients' own self‐report.[7] As a result, the need to include the patient perspective is increasingly recognized as an important contributing factor in the discharge planning process.[8, 9]
Current approaches to assessing discharge readiness are typically single assessments. However, these assessments do not take into account the complexity of discharge planning or patients' understanding, or their ability to carry out postacute care tasks.[8] In addition, few models have included assessments of physical stability and functional ability along with measures such as ability to manage self‐care activities at home, coping and social support, or access to health system and community resources.[10, 11]
To address these gaps in the existing literature, we carried out a prospective observational study of daily, patient‐reported, assessments of discharge readiness to better understand patients' perspectives on issues that could impede the transition to home. Using these data, we then sought to determine the prevalence of patient‐reported discharge barriers and the frequency with which they were resolved prior to the day of discharge. We also explored whether problems identified at discharge were associated with 30‐day readmission.
METHODS
Study Design, Setting, and Participants
We carried out a prospective observational study at the University of California San Francisco (UCSF) Medical Center, a 600‐bed tertiary care academic hospital in San Francisco, California. The UCSF Committee on Human Research approved this study. We recruited patients between November 2013 and April 2014. Patients were eligible to participate if they were admitted to the General Medicine Service; over 18 years old; English speaking; cognitively able to provide informed consent; and not under contact, droplet, airborne, or radiation isolation. Patients were eligible to participate regardless of where they were admitted from or expected to be discharged (eg, home, skilled nursing facility). Patients were excluded if they were acutely unwell or symptomatic resulting in them being unable to complete the surveys. Caregivers were not able to participate in the study on behalf of patients. We screened daily admission charts for eligibility and approached consecutive patients to consent them into the study on their first or second day of hospitalization. An enrollment tracker was used to documented reasons for patients' exclusion or refusal.
Survey Development
We adapted an existing and validated Readiness for Hospital Discharge Survey (RHDS) previously used in obstetric, surgical, and medicine patients for our study.[10, 11, 12] This initial list was culled from 23 to 12 items, based on input from patients and physicians. This feedback step also prompted a change in the response scale from a 0 to 10 scale to a simpler yes, no, or I would like to talk with someone about this scale intended to encourage discussion between patients and providers. After this revision step, we further pretested the survey among physicians and a small set of general medical patients to assess comprehension. Thus, our final question set included 12 items in 4 domains; personal status (ie, pain, mobility), knowledge (ie, medications, problems to watch for, recovery plan), coping ability (ie, emotional support, who to call with problems), and expected support (ie, related to activities and instrumental activities of daily living).
Data Collection
We collected data from interviews of patients as well as chart abstraction. Trained research assistants approached patients to complete our revised RHDS at admission, which was either on their first or second day of hospitalization. We collected data via an intake admission survey, which asked patients about their readiness for discharge, followed by a daily readiness for discharge survey until the day of discharge. A research assistant read the survey items to patients and recorded responses on a paper version of the survey. We abstracted demographic, clinical, and 30‐day readmission information from each participant's electronic medical record.
Analytic Approach
A barrier to discharge readiness was confirmed when a patient responded no' to an item (except for presence of catheter and pain or discomfort where yes was used) and/or they stated they wanted to talk to someone about the issue. We then used descriptive statistics to summarize patients' responses by survey administration number. Multilevel mixed effect regression was used to investigate any patterns in barriers to discharge over the course of hospitalization. We described the frequency of identified barriers to discharge on the intake admission and final (48 hours of discharge) surveys. McNemar's tests compared the proportion of patients reporting each barrier, and paired t tests the mean number of barriers at these 2 survey time points. We also assessed whether persistent barriers to discharge readiness on the final survey were associated with readmission to our hospital within 30‐days using t tests, 2, or Fisher exact test. Analysis was conducted in SPSS 22.0 (IBM Corp., Armonk, NY) and Stata (StataCorp, College Station, TX).
RESULTS
Patients
There were 2045 patients admitted to the general medicine service during the study period. Medical record screening resulted in 1350 exclusions. Of the remaining 695 patients, 113 refused and 419 were further found to be unable to participate. After all exclusions were applied and following direct screening, 163 patients agreed to participate in our study (Table 1). Mean length of stay among our cohort was 5.42 days (standard deviation [SD], 11.49) and the majority of patients were admitted from and discharged to home (Table 1).
| |
| Mean age, y (SD) | 56.4 (17) |
| Female gender, no. (%) | 86 (53) |
| Race, no. (%) | |
| Asian | 13 (8) |
| African American | 27 (16) |
| White | 96 (59) |
| Other | 24 (25) |
| Declined to say | 3 (1) |
| Married, no. (%) | 78 (48) |
| Insurance, no. (%) | |
| Medicare | 59 (36) |
| Medicaid | 22 (14) |
| Private | 73 (45) |
| Self‐pay | 2 (1) |
| Other | 7 (4) |
| Patient admitted from, no. (%) | |
| Home | 118 (72) |
| Outpatient clinic | 17 (10) |
| Procedural area | 6 (4) |
| Another facility | 12 (7) |
| Other | 9 (6) |
| Patient discharged to, no. (%) | |
| Home without services | 107 (66) |
| Home with services | 40 (25) |
| Home hospice | 2 (1) |
| Skilled nursing facility | 8 (5) |
| Patient deceased | 3 (2) |
| Other | 3 (2) |
Barriers to Discharge Readiness
Patients completed on average 1.82 surveys (SD 1.10; range, 18), and in total 296 surveys were administered. Only 5% of patients were captured on their admission day, whereas 77% of patients were surveyed on their second hospital day (Table 2). Between the first and second survey administration, 51% of patients were lost to follow‐up, and then by the third survey administration a further 37% were lost to follow‐up (Table 3). Patients were unable to be reinterviewed most often because they had been (1) discharged, (2) were unavailable or having a procedure at time of recruitment, or (3) became too sick and symptomatic.
| Hospital Day | ||||||||||
|---|---|---|---|---|---|---|---|---|---|---|
| 1 | 2 | 3 | 4 | 5 | 6 | 7 | 8 | 9 | 10 | |
| No. of eligible patients hospitalized | 163 | 161 | 138 | 102 | 70 | 50 | 35 | 24 | 19 | 17 |
| No. of patients surveyed | 8 | 124 | 70 | 30 | 22 | 13 | 7 | 6 | 2 | 0 |
| % of eligible patients surveyed | 4.9 | 77.0 | 50.7 | 29.4 | 31.4 | 26.0 | 20.0 | 25.0 | 10.5 | 0 |
| Survey No. | ||||||
|---|---|---|---|---|---|---|
| 1 | 2 | 3 | 4 | 5 | 6+ | |
| ||||||
| No. of patients surveyed | 163 | 83 | 31 | 11 | 3 | 5 |
| Total barriers (all patients) | 533 | 235 | 84 | 22 | 7 | 8 |
| No. of barriers per patient, mean (SD) | 3.27(2.35) | 2.83 (2.11) | 2.71 (2.49) | 2.00 (1.73) | 2.33 (2.51) | 1.60 (2.30) |
| Median no. of barriers per patient | 3.0 | 3.0 | 2.0 | 1.0 | 2.0 | 0 |
| Median hospital day of survey administration | 2.0 | 3.0 | 5.0 | 6.0 | 8.0 | 13.0 |
| Initial admission survey, no. (%) | 163 (100.0) | 0 | 0 | 0 | 0 | 0 |
| Follow‐up survey, no. (%) | 0 | 38 (45.8) | 16 (51.6) | 4 (36.4) | 0 | 1 (20.0) |
| Survey 48 hours before discharge, no. (%) | 59 (36.2) | 45 (54.2) | 15 (48.4) | 7 (63.6) | 3 (100.0) | 4 (80.0) |
In total, over 889 individual barriers to discharge readiness were reported across all surveys. The total and mean numbers of barriers were highest on the admission intake survey, and numbers continued to decrease until the fourth survey. On average, the total number of barriers to discharge patients reported decreased by 0.15 (95% confidence interval: 0.01‐0.30) per day (P = 0.047).
Change in Barriers to Discharge
Sixty‐eight patients (42%) completed an admission intake survey as well as final survey 48 hours before discharge (Table 4). We observed a significant reduction in mean number of barriers reported between admission and discharge surveys (3.19 vs 2.53, P = 0.01). Sixty‐one patients (90%) left the hospital with 1 or more persistent barrier to a safe discharge. However, the 3 most common barriers to discharge readiness on the admission and final survey remained the same: unresolved pain, lack of understanding of plan for recovery, and daily living activities (eg, cooking, cleaning, and shopping). The number of patients with unresolved pain appeared to increase slightly, though this rise was not statistically significant. In contrast, there were significant reductions in patients reporting they were unaware of problems to watch out for postdischarge (28% vs 16%; P = 0.04) or did not understand their recovery plan (52% vs 40%; P = 0.03).
| Barrier to Discharge | Survey | |
|---|---|---|
| Admission, No. (%) | Final Survey, No. (%) | |
| ||
| Catheter is present? | 6 (7.2) | 6 (7.2) |
| Not out of bed, sitting in a chair, or walking? | 17 (20.5) | 13 (15.7) |
| Pain or discomfort? | 50 (60.2) | 52 (62.7) |
| Unable to get to the bathroom for toilet or to shower? | 15 (18.1) | 12 (14.5) |
| Unable to self‐care without help from others? | 27 (32.5) | 23 (27.7) |
| Unable to get your own medications? | 11 (13.3) | 14 (16.9) |
| Know what problems to watch for?* | 23 (27.7) | 13 (15.7) |
| Know where to call if you had problems? | 10 (12.0) | 8 (9.6) |
| Inability for personal care such as bathing, toileting, and eating? | 8 (9.6) | 11 (13.3) |
| Lack of support for emotional needs? | 16 (19.3) | 9 (10.8) |
| Unable to cook, clean, or do shopping? | 33 (39.8) | 25 (30.1) |
| Do not understand the overall plan for your recovery?* | 43 (51.8) | 33 (39.8) |
DISCUSSION
Assessing discharge readiness highlights an opportunity to engage patients directly in their discharge planning process. However, our prospective study of 163 hospitalized adults revealed that unresolved discharge barriers were common; 90% of patients were discharged with at least 1 issue that might inhibit an effective transition home. The majority of these patients were also discharged home without any support services. In addition, many of the major barriers patients reportedpain, lack of understanding around plans, and ability to provide self‐carewere consistent from admission to discharge, suggesting a missed opportunity to address problems present early in a patient's stay.
Some of the issues our patients described, such as pain; lack of understanding of a recovery plan; and functional, social, and environmental vulnerabilities that impede recovery, have been described in studies using data collected in the postacute time period.[13, 14, 15] Focus on postacute barriers is likely to be of limited clinical utility to assist in any real‐time discharge planning, particularly planning that assesses individual patients' needs and tailors programs and education appropriately. Having said this, consistency between our results and data collected from postdischarge patients again supports broad areas of improvement for health systems.
Persistent gaps in care at discharge may be a result of limited standardization of discharge processes and a lack of engagement in obtaining patient‐reported concerns. Lack of a framework for preparing individual patients for discharge has been recognized as a significant obstacle to effective discharge planning. For example, Hesselink et al.'s qualitative study with almost 200 patients and providers across multiple institutions described how lack of a standard approach to providing discharge planning resulted in gaps in information provision.[16] Similarly, Horwitz et al. described wide variation in discharge practices at a US academic medical center, suggesting lack of a standard approach to identifying patient needs.[14]
Although many transitions of care programs have supported implementation of specific care interventions at a hospital or health system level, there have been surprisingly few studies describing efforts to standardize the assessment of discharge barriers and prospectively engage individual patients.[17] One emblematic study used stakeholder interviews and process mapping to develop a readiness report within their electronic medical record (EMR).[17] Aggregate data from the EMR including orders and discharge plans were coded, extracted, and summarized into a report. The overall goal of the report was to identify progress toward completion of discharge tasks; however, a limitation was that it did not explicitly include patient self‐assessments. Another study by Grimmer et al. describes the development of a patient‐centered discharge checklist that incorporated patients and care concerns.[18] The themes incorporated into this checklist cover many transitional issues; however, outside of the checklist's development, few publications or Web resources describe it in actual use.
Our approach may represent an advance in approaches to engaging patients in discharge planning and preparing patients for leaving the hospital. Although our data do not support efficacy of our daily surveys in terms of improving discharge planning, this initial evaluation provides the framework upon which providers can develop discharge plans that are both standardized in terms of using a structured multidomain communication tool to elicit barriers, as well as patient‐centered and patient‐directed, by using the information collected in the survey tool to initiate tailored discharge planning earlier in the hospital stay. However, our program points out an important limitation of an entirely patient‐initiated program, which is difficulty obtaining truly daily assessments. During this study, we had a single research assistant visit patients as frequently as possible during hospitalization, but even daily visits did not yield complete information on all patients. Although this limitation may in part be due to the fact that our study was a focused pilot of an approach we hope to expand, it also represents the complexity of patient experience in the hospital, where patients are often out of their room for tests, are unable to complete a survey because of problematic symptoms, or simply are unwilling or unable to participate in regular surveys.
Our study has a number of limitations. First, the number of patients in our study overall, and the number who completed at least 2 surveys, was relatively small, limiting the generalizability of the study and our ability to determine the true prevalence of unresolved barriers at discharge. In addition, our selection criteria and response rates have limited our sample in that our final group may not be representative of all patients admitted to our medicine service. The broad exclusion of patients who had physical or psychosocial barriers, and those who were acutely unwell and symptomatic, has the potential to introduce selection bias given the excluded populations are those most at risk of readmission. We also acknowledge that some of the issues that patients' are reporting may be chronic ones. However, given the fact that patients feel these issues, even if chronic, are unaddressed or that they want to talk with their doctor about them, is still a very large potential gap in care and patient engagement.
However, despite these limitations, which seem most likely to produce a cohort that is more likely to be able to participate in our survey, and in turn more likely to participate in their care more broadly, we still observed disappointing resolution of discharge barriers. In addition, our adapted survey instrument, though based on well‐supported conceptual frameworks,[19] has not been extensively tested outside of our hospital setting. Finally, as a single‐center study, our results cannot be generalized to other settings.
Assessing discharge readiness highlights an opportunity to obtain patient self‐reported barriers to discharge. This can facilitate discharge planning that targets individual patient needs. This information also emphasizes potentially fruitful opportunities for improved communication and education activities, potentially if these data are fed back to providers in real time, potentially as part of team‐based dashboards or the context of interdisciplinary team models.
Acknowledgements
The authors thank all of the patients who participated in this project, and Yimdriuska Magan Gigi for her assistance with chart abstractions. The authors also acknowledge and thank John Boscardin for his statistical and analytic support.
Disclosures: James D. Harrison, and Drs. Ryan S. Greysen and Andrew D. Auerbach contributed to the concept, design, analysis, interpretation of data, drafting of the manuscript, critical revisions to the manuscript, and final approval of manuscript. Ronald Jacolbia and Alice Nguyen contributed to the acquisition of data, drafting and final approval of manuscript and project, and administrative and technical support. Dr. Auerbach was supported by National Heart, Lung, and Blood Institute grant K24 K24HL098372. Dr. Greysen is supported by the National Institutes of Health (NIH), National Institute of Aging (NIA) through the Claude D. Pepper Older Americans Independence Center (P30AG021342 NIH/NIA and K23AG045338‐01). The authors have no financial or other conflicts of interest to declare.
- , , . Trends and projections in inpatient hospital costs and utilization 2003–2013. HCUP statistical brief #175. July 2014. Rockville, MD: Agency for Healthcare Research and Quality; 2014.
- , . Overview of hospital stays in the United States 2012. HCUP statistical brief #180. October 2014. Rockville, MD: Agency for Healthcare Research and Quality; 2014.
- Joint Commision. The Joint Commission Comprehensive Accreditation Manual for Hospitals. Oak Brook, IL: The Joint Commission; 2015.
- , , . Hospital discharge and readmission. In: Post TW, ed. UpToDate website: Available at: http://www.uptodate.com/contents/hospital‐discharge‐and‐readmission. Accessed August 14, 2015.
- , . A patient centered model of care for hospital discharge. Clin Nurse Res. 2004;13:117–136.
- , , , , , . Which reasons do doctors, nurses and patients have for hospital discharge? A mixed methods study. PLoS One. 2014;9:e91333.
- , , . Nurse and patient perceptions of discharge readiness in relation to postdischarge utilization. Med Care. 2010;48:482–486.
- , . Older people's perception of their readiness for discharge and postdischarge use of community support and services. Int J Older People Nurs. 2013;8:104–115.
- , , , . The care transitions intervention: Results of a randomized controlled trial. Arch Intern Med. 2006;166:1822–1828.
- , . Psychometric properties of the Readiness for Hospital Discharge Scale. J Nurs Meas. 2006;14:163–180.
- , , , et al. Perceived readiness for hospital discharge in adult medical‐surgical patients. Clin Nurse Spec. 2007;21:31–42.
- , , , . Validation of patient and nurse short forms of the Readiness for Hospital Discharge Scale and their relationship to return to the hospital. Health Serv Res. 2014;49:304–317.
- , , , et al. “Missing Pieces”—functional, social and environmental barriers to recovery for vulnerable older adults transitioning from hospital to home. J Am Geriatr Soc. 2014;62:1556–1561.
- , , , et al. Quality of discharge practices and patient understanding at an academic medical center. JAMA Intern Med. 2013;173:1715–1722.
- , , . Brief scale measuring patient prepardeness for hospital discharge to home: Psychometric properties. J Hosp Med. 2008;3:446–454.
- , , , et al. Improving patient discharge and reducing hospital readmission by using intervention mapping. BMC Health Serv Res. 2014;14:389.
- , , , , , . Development of a discharge readiness report within the electronic health record: a discharge planning tool. J Hosp Med. 2014;9:533–539.
- , , , . Incorporating Patient and Carer Concerns in Discharge Plans: The Development of a Practical Patient‐Centred Checklist. The Internet Journal of Allied Health Sciences and Practice. 2006;4: Article 5.
- , , , . Identifying keys to success in reducing readmissions using the ideal transitions in care framework. BMC Health Serv Res. 2014;14:423.
Guideline change advocated on using acetaminophen for OA
AMSTERDAM – Further evidence that acetaminophen has limited benefits in patients with osteoarthritis was presented at the World Congress on Osteoarthritis, with authors of a systematic review calling for reconsideration of guidelines recommending the common analgesic as a first-line option.
“[Acetaminophen] provides minimal short-term benefits for people with hip or knee OA,” said presenting author and rheumatologist Dr. David J. Hunter of the University of Sydney. The treatment effects for both pain relief and for improving physical function were smallest in people with knee OA, he said. “In general, the small effect sizes are unlikely to be clinically relevant,” Dr. Hunter observed.

“These are mean differences across large populations in the clinical trials, and there may be certain individuals with knee or hip osteoarthritis that this may not necessarily apply to,” he conceded during a discussion following his presentation, “but I think from the perspective of the recommendations that come from guidelines, we have got to think about what would be do-able in the general population.”
The findings come shortly after the publication of a large meta-analysis of 74 trials evaluating pain-relieving medications that highlighted the ineffectiveness of acetaminophen for OA pain, particularly when compared against diclofenac and other nonsteroidal anti-inflammatory drugs (Lancet. 2016 Mar 17. doi: 10.1016/S0140-6736(16)30002-2).
Dr. Hunter and coworkers searched clinical trial and medical databases from inception to September 2015 for records relating to acetaminophen use in patients with hip or knee OA. Only placebo-controlled, randomized trials were included, and nine records were found that reported 10 trials involving 3,541 patients. Part of the analysis was published in the BMJ last year (BMJ. 2015;350:h1225. doi: 10.1136/bmj.h1225). The last prior systematic review on the topic was published in 2004 (Ann Rheum Dis. 2004;Aug;63[8]:901–7).
Pain scores were converted to a common 0-100 scale with 0 signifying no pain or disability and 100 the worst possible pain or disability and then expressed as a mean difference between the acetaminophen and placebo groups. Physical function scores were pooled to give a standardized mean difference.
There was high-quality evidence that acetaminophen given at a dose of 3-4 g per day had a significant effect on pain and physical function during a short period of more than 2 weeks to less than 3 months and a more immediate time frame of 2 weeks or less, but it was unlikely to be clinically significant, with a mean difference of just –3.14 for pain and a standardized mean difference of –0.12 to –0.15 for physical function. Differences would need to be at least 9 points for pain and greater than 0.2 for physical function to be clinically significant, Dr. Hunter explained.
Four of the trials considered knee OA only. The mean and standardized mean differences between the acetaminophen and placebo groups in those trials was just –1.09 for pain and –0.06 for physical function.
Similar numbers of patients reported being adherent to their assigned treatment group, with less rescue analgesic use in the acetaminophen-treated patients. Although no differences in adverse events, serious adverse events, or withdrawals because of adverse events were seen, there was a higher risk of liver function test (LFT) abnormalities in the acetaminophen-treated patients. The relative risk for abnormal LFTs was 3.79, but the clinical significance of this is uncertain according to the review’s authors.
“Current guidelines consistently recommend [acetaminophen] as the first line of analgesic medication for this condition,” Dr. Hunter said at the meeting, sponsored by the Osteoarthritis Research Society International. “But these results call for reconsideration of these recommendations.”
The results highlight the importance of using other, nonpharmacologic means to manage pain and physical function, the authors conclude, such as lifestyle changes, weight control, and regular physical exercise.
Dr. Hunter had no disclosures relevant to his comments.
AMSTERDAM – Further evidence that acetaminophen has limited benefits in patients with osteoarthritis was presented at the World Congress on Osteoarthritis, with authors of a systematic review calling for reconsideration of guidelines recommending the common analgesic as a first-line option.
“[Acetaminophen] provides minimal short-term benefits for people with hip or knee OA,” said presenting author and rheumatologist Dr. David J. Hunter of the University of Sydney. The treatment effects for both pain relief and for improving physical function were smallest in people with knee OA, he said. “In general, the small effect sizes are unlikely to be clinically relevant,” Dr. Hunter observed.
“These are mean differences across large populations in the clinical trials, and there may be certain individuals with knee or hip osteoarthritis that this may not necessarily apply to,” he conceded during a discussion following his presentation, “but I think from the perspective of the recommendations that come from guidelines, we have got to think about what would be do-able in the general population.”
The findings come shortly after the publication of a large meta-analysis of 74 trials evaluating pain-relieving medications that highlighted the ineffectiveness of acetaminophen for OA pain, particularly when compared against diclofenac and other nonsteroidal anti-inflammatory drugs (Lancet. 2016 Mar 17. doi: 10.1016/S0140-6736(16)30002-2).
Dr. Hunter and coworkers searched clinical trial and medical databases from inception to September 2015 for records relating to acetaminophen use in patients with hip or knee OA. Only placebo-controlled, randomized trials were included, and nine records were found that reported 10 trials involving 3,541 patients. Part of the analysis was published in the BMJ last year (BMJ. 2015;350:h1225. doi: 10.1136/bmj.h1225). The last prior systematic review on the topic was published in 2004 (Ann Rheum Dis. 2004;Aug;63[8]:901–7).
Pain scores were converted to a common 0-100 scale with 0 signifying no pain or disability and 100 the worst possible pain or disability and then expressed as a mean difference between the acetaminophen and placebo groups. Physical function scores were pooled to give a standardized mean difference.
There was high-quality evidence that acetaminophen given at a dose of 3-4 g per day had a significant effect on pain and physical function during a short period of more than 2 weeks to less than 3 months and a more immediate time frame of 2 weeks or less, but it was unlikely to be clinically significant, with a mean difference of just –3.14 for pain and a standardized mean difference of –0.12 to –0.15 for physical function. Differences would need to be at least 9 points for pain and greater than 0.2 for physical function to be clinically significant, Dr. Hunter explained.
Four of the trials considered knee OA only. The mean and standardized mean differences between the acetaminophen and placebo groups in those trials was just –1.09 for pain and –0.06 for physical function.
Similar numbers of patients reported being adherent to their assigned treatment group, with less rescue analgesic use in the acetaminophen-treated patients. Although no differences in adverse events, serious adverse events, or withdrawals because of adverse events were seen, there was a higher risk of liver function test (LFT) abnormalities in the acetaminophen-treated patients. The relative risk for abnormal LFTs was 3.79, but the clinical significance of this is uncertain according to the review’s authors.
“Current guidelines consistently recommend [acetaminophen] as the first line of analgesic medication for this condition,” Dr. Hunter said at the meeting, sponsored by the Osteoarthritis Research Society International. “But these results call for reconsideration of these recommendations.”
The results highlight the importance of using other, nonpharmacologic means to manage pain and physical function, the authors conclude, such as lifestyle changes, weight control, and regular physical exercise.
Dr. Hunter had no disclosures relevant to his comments.
AT OARSI 2016
Key clinical point: Acetaminophen has minimal effects on pain and physical function in patients with hip and knee osteoarthritis.
Major finding: Doses of 3-4 g of acetaminophen resulted in a mean difference of just –3.14 for pain and a standardized mean difference of –0.12 to –0.15 for physical function versus placebo.
Data source: Cochrane systematic review of 10 trials involving 3,541 patients with hip or knee OA.
Disclosures: Dr. Hunter had no disclosures relevant to his comments.

Coding Changes for 2016
New Codes for 2016
In 2016, noninvasive imaging in dermatology finally received recognition at the Current Procedural Terminology (CPT) level with the publication of 6 new Category I codes for reflectance confocal microscopy.1 These new codes are classified under the “Special Dermatological Procedures” section of CPT where codes do not have technical and professional payment splits, unlike pathology codes (Table). Currently, the new codes for reflectance confocal microscopy can only be implemented when using the VivaScope 1500 (Caliber I.D.) reflectance confocal imaging system and not with any other devices. At present, these codes are priced by each insurer and should be payable, as they are Category I codes that meet all criteria for widely used procedures that are well supported by strong evidence.
Additionally, MelaFind (MELA Sciences) has received 2 Category III CPT codes in 2016: 0400T, multispectral digital skin lesion analysis of clinically atypical cutaneous pigmented lesions for detection of melanomas and high-risk melanocytic atypia [1–5 lesions]; 0401T, multispectral digital skin lesion analysis of clinically atypical cutaneous pigmented lesions for detection of melanomas and high-risk melanocytic atypia [≥6 lesions]).
The CPT Professional Edition notes that Category III codes are a set of temporary codes for emerging technology, services, and procedures that allow data collection for these services and procedures.1 Inclusion implies nothing about safety, efficacy, frequency of use, or payment. These codes are used to differentiate emerging technology from the widely accepted Category I codes and use of alphanumeric characters instead of 5-digit codes. If reading this paragraph makes you giddy all over, pay a visit to the American Medical Association website to learn more about the process by which CPT codes come to life.2
Policy and Coding Changes
Last year saw much sturm and drang with the passage of the Medicare Access and CHIP Reauthorization Act of 2015 (MACRA).3 The MACRA repealed the Sustainable Growth Rate formula and established annual positive or flat-fee updates for 10 years. A 2-tracked fee update was instituted afterward. It also established the Merit-Based Incentive Payment System, which consolidates existing Medicare fee-for-service physician incentive programs, establishes a pathway for physicians to participate in alternative payment models including the patient-centered medical home, and makes a bunch of other changes to existing Medicare physician payment statutes. It is too early to say if and how it will work and if it will change dermatology. It could fail miserably or it could be a brave new world; stay tuned.3
On the coding front, MACRA prohibits across-the-board elimination of global periods that the Centers for Medicare & Medicaid Services (CMS) had previously announced.4 Instead, the CMS must develop and implement a process to gather data on services furnished during global periods based on a representative sample of physician data. The CMS can delay up to 5% of payments if it does not get the data it asks for and must work through the rulemaking process, which will impact medicine in 2019. Among our codes with nonzero global periods, the premalignant destruction codes 17000 and 17004, each of which contains the value of a 99212 established patient visit, are at the very apex of the hit list. It is not clear if the CMS will retrospectively pull medical records to evaluate the occurrence of the global visit or will prospectively have us use 99024, the code for a “[p]ostoperative follow-up visit, normally included in the surgical package, to indicate that an evaluation and management service was performed during a postoperative period for a reason(s) related to the original procedure.”1 This code is not used unless your practice needs a “filler” code for nonreportable visits but that may change. Is this another unfunded mandate? Yes.
Clarifications also have been made for reporting superficial radiation therapy.1 Treatment delivery using energies below 1 MV are to be reported with CPT code 77401 and cannot be combined with radiation treatment delivery codes (77402, 77407, 77412), clinical treatment planning codes (77261–77263), treatment device development codes (77332–77334), isodose planning codes (77306, 77307, 77316–77318), radiation treatment management codes (77427, 77431, 77432, 77435, 77469, 77470, 77499), continuing medical physics consultation code (77336), and special physics consultation code (77370). Evaluation and management services may still be reported separately, when appropriate, in cases in which only superficial radiation therapy services (ie, 77401) are provided.1
Electronic brachytherapy for skin cancer has a new Category III tracking code (0394T [high-dose-rate electronic brachytherapy, skin surface application, per fraction, includes basic dosimetry, when performed]) that is priced by the insurer. Noridian Healthcare Solutions pulled the plug on what many perceived as astronomical payments, but changes may be afoot, as its URL for their new policy was down at the time of publication, and there is still great variability in how payment is being made for these codes. For those interested in learning about perception, a visit to http://forums.studentdoctor.net/threads/electronic-brachy.1132531/ is in order, as the economic drivers to the utilization of this therapy are discussed in detail from the perspective of students and young physicians.
Although there are new telehealth codes for inpatient services and end-stage renal disease management, there are still none that are relevant to dermatology.
Place of service codes have been updated. Place of service code 19 refers to “off campus outpatient hospital” settings while place of service code 22 has been revised to “on campus outpatient hospital.” If your practice is a facility, consult the Medicare Claims Processing Manual (20.4.2) on the site of service payment differential for further enlightenment.5 Do note that CMS is increasingly interested in physicians who use wrong place of service codes.
Incident to billing rules are somewhat clearer. The physician or other practitioner who bills must be the supervising physician or practitioner. Services cannot be provided by individuals who have been excluded from Medicare, Medicaid, or other federal programs, nor can they be provided by an individual who has had Medicare enrollment revoked. State laws that are more restrictive take precedence.
Of course, the Relative Value Scale Update Committee (RUC) process moves on as always and you likely will receive 1 or more surveys in the near future. If you get one of these surveys, do not delete it. The surveys are the currency of the RUC, and if you give your RUC team bad or no data, the specialty will suffer cuts in valuation of what we do. If you have questions about the survey, contact the American Academy of Dermatology staff as listed in the survey. If you want to learn more about RUC, visit the American Medical Association website.6 To see the current relative value units for what dermatologists do and the typical time for these procedures, visit the CMS website, which provides resources that supply tremendous amounts of data on code valuation including documents detailing relative value units for every CPT code.7 You also can access current time values for preservice work, intraservice work, and postservice work times for all CPT codes in the entire CPT Professional Edition. They are based on typical times and are the major determinants of what you get paid. Happy reading.
1. Current Procedural Terminology 2016, Professional Edition. Chicago, IL: American Medical Association; 2015.
2. CPT–Current Procedural Terminology. American Medical Association website. http://www.ama-assn.org/ama/pub/physician-resources/solutions-managing-your-practice/coding-billing-insurance/cpt/cpt-editorial-panel.page. Accessed March 23, 2016.
3. The Merit-Based Incentive Payment System (MIPS) & Alternative Payment Models (APMs). Centers for Medicare & Medicaid Services website. https://www.cms.gov/Medicare/Quality-Initiatives-Patient-Assessment-Instruments/Value-Based-Programs/MACRA-MIPS-and-APMs/MACRA-MIPS-and-APMs.html. Accessed March 23, 2016.
4. Text of the Medicare Access and CHIP Reauthorization Act of 2015. GovTrack website. https://www.govtrack.us/congress/bills/114/hr2/text. Accessed March 23, 2016.
5. Physicians/Nonphysician Practitioners. Medicare Claims Processing Manual. https://www.cms.gov/Regulations-and-Guidance/Guidance/Manuals/downloads/clm104c12.pdf. Accessed March 23, 2016.
6. American Medical Association. The RVS update committee. http://www.ama-assn.org/ama/pub/physician-resources/solutions-managing-your-practice/coding-billing-insurance/medicare/the-resource-based-relative-value-scale/the-rvs-update-committee.page?. Accessed March 23, 2016.
7. Details for title: CMS-1631-FC. Centers for Medicare & Medicaid Services website. https://www.cms.gov/Medicare/Medicare-Fee-for-Service-Payment/Physician FeeSched/PFS-Federal-Regulation-Notices-Items/CMS-1631-FC.html. Published November 16, 2015. Accessed March 23, 2016.
New Codes for 2016
In 2016, noninvasive imaging in dermatology finally received recognition at the Current Procedural Terminology (CPT) level with the publication of 6 new Category I codes for reflectance confocal microscopy.1 These new codes are classified under the “Special Dermatological Procedures” section of CPT where codes do not have technical and professional payment splits, unlike pathology codes (Table). Currently, the new codes for reflectance confocal microscopy can only be implemented when using the VivaScope 1500 (Caliber I.D.) reflectance confocal imaging system and not with any other devices. At present, these codes are priced by each insurer and should be payable, as they are Category I codes that meet all criteria for widely used procedures that are well supported by strong evidence.
Additionally, MelaFind (MELA Sciences) has received 2 Category III CPT codes in 2016: 0400T, multispectral digital skin lesion analysis of clinically atypical cutaneous pigmented lesions for detection of melanomas and high-risk melanocytic atypia [1–5 lesions]; 0401T, multispectral digital skin lesion analysis of clinically atypical cutaneous pigmented lesions for detection of melanomas and high-risk melanocytic atypia [≥6 lesions]).
The CPT Professional Edition notes that Category III codes are a set of temporary codes for emerging technology, services, and procedures that allow data collection for these services and procedures.1 Inclusion implies nothing about safety, efficacy, frequency of use, or payment. These codes are used to differentiate emerging technology from the widely accepted Category I codes and use of alphanumeric characters instead of 5-digit codes. If reading this paragraph makes you giddy all over, pay a visit to the American Medical Association website to learn more about the process by which CPT codes come to life.2
Policy and Coding Changes
Last year saw much sturm and drang with the passage of the Medicare Access and CHIP Reauthorization Act of 2015 (MACRA).3 The MACRA repealed the Sustainable Growth Rate formula and established annual positive or flat-fee updates for 10 years. A 2-tracked fee update was instituted afterward. It also established the Merit-Based Incentive Payment System, which consolidates existing Medicare fee-for-service physician incentive programs, establishes a pathway for physicians to participate in alternative payment models including the patient-centered medical home, and makes a bunch of other changes to existing Medicare physician payment statutes. It is too early to say if and how it will work and if it will change dermatology. It could fail miserably or it could be a brave new world; stay tuned.3
On the coding front, MACRA prohibits across-the-board elimination of global periods that the Centers for Medicare & Medicaid Services (CMS) had previously announced.4 Instead, the CMS must develop and implement a process to gather data on services furnished during global periods based on a representative sample of physician data. The CMS can delay up to 5% of payments if it does not get the data it asks for and must work through the rulemaking process, which will impact medicine in 2019. Among our codes with nonzero global periods, the premalignant destruction codes 17000 and 17004, each of which contains the value of a 99212 established patient visit, are at the very apex of the hit list. It is not clear if the CMS will retrospectively pull medical records to evaluate the occurrence of the global visit or will prospectively have us use 99024, the code for a “[p]ostoperative follow-up visit, normally included in the surgical package, to indicate that an evaluation and management service was performed during a postoperative period for a reason(s) related to the original procedure.”1 This code is not used unless your practice needs a “filler” code for nonreportable visits but that may change. Is this another unfunded mandate? Yes.
Clarifications also have been made for reporting superficial radiation therapy.1 Treatment delivery using energies below 1 MV are to be reported with CPT code 77401 and cannot be combined with radiation treatment delivery codes (77402, 77407, 77412), clinical treatment planning codes (77261–77263), treatment device development codes (77332–77334), isodose planning codes (77306, 77307, 77316–77318), radiation treatment management codes (77427, 77431, 77432, 77435, 77469, 77470, 77499), continuing medical physics consultation code (77336), and special physics consultation code (77370). Evaluation and management services may still be reported separately, when appropriate, in cases in which only superficial radiation therapy services (ie, 77401) are provided.1
Electronic brachytherapy for skin cancer has a new Category III tracking code (0394T [high-dose-rate electronic brachytherapy, skin surface application, per fraction, includes basic dosimetry, when performed]) that is priced by the insurer. Noridian Healthcare Solutions pulled the plug on what many perceived as astronomical payments, but changes may be afoot, as its URL for their new policy was down at the time of publication, and there is still great variability in how payment is being made for these codes. For those interested in learning about perception, a visit to http://forums.studentdoctor.net/threads/electronic-brachy.1132531/ is in order, as the economic drivers to the utilization of this therapy are discussed in detail from the perspective of students and young physicians.
Although there are new telehealth codes for inpatient services and end-stage renal disease management, there are still none that are relevant to dermatology.
Place of service codes have been updated. Place of service code 19 refers to “off campus outpatient hospital” settings while place of service code 22 has been revised to “on campus outpatient hospital.” If your practice is a facility, consult the Medicare Claims Processing Manual (20.4.2) on the site of service payment differential for further enlightenment.5 Do note that CMS is increasingly interested in physicians who use wrong place of service codes.
Incident to billing rules are somewhat clearer. The physician or other practitioner who bills must be the supervising physician or practitioner. Services cannot be provided by individuals who have been excluded from Medicare, Medicaid, or other federal programs, nor can they be provided by an individual who has had Medicare enrollment revoked. State laws that are more restrictive take precedence.
Of course, the Relative Value Scale Update Committee (RUC) process moves on as always and you likely will receive 1 or more surveys in the near future. If you get one of these surveys, do not delete it. The surveys are the currency of the RUC, and if you give your RUC team bad or no data, the specialty will suffer cuts in valuation of what we do. If you have questions about the survey, contact the American Academy of Dermatology staff as listed in the survey. If you want to learn more about RUC, visit the American Medical Association website.6 To see the current relative value units for what dermatologists do and the typical time for these procedures, visit the CMS website, which provides resources that supply tremendous amounts of data on code valuation including documents detailing relative value units for every CPT code.7 You also can access current time values for preservice work, intraservice work, and postservice work times for all CPT codes in the entire CPT Professional Edition. They are based on typical times and are the major determinants of what you get paid. Happy reading.
1. Current Procedural Terminology 2016, Professional Edition. Chicago, IL: American Medical Association; 2015.
2. CPT–Current Procedural Terminology. American Medical Association website. http://www.ama-assn.org/ama/pub/physician-resources/solutions-managing-your-practice/coding-billing-insurance/cpt/cpt-editorial-panel.page. Accessed March 23, 2016.
3. The Merit-Based Incentive Payment System (MIPS) & Alternative Payment Models (APMs). Centers for Medicare & Medicaid Services website. https://www.cms.gov/Medicare/Quality-Initiatives-Patient-Assessment-Instruments/Value-Based-Programs/MACRA-MIPS-and-APMs/MACRA-MIPS-and-APMs.html. Accessed March 23, 2016.
4. Text of the Medicare Access and CHIP Reauthorization Act of 2015. GovTrack website. https://www.govtrack.us/congress/bills/114/hr2/text. Accessed March 23, 2016.
5. Physicians/Nonphysician Practitioners. Medicare Claims Processing Manual. https://www.cms.gov/Regulations-and-Guidance/Guidance/Manuals/downloads/clm104c12.pdf. Accessed March 23, 2016.
6. American Medical Association. The RVS update committee. http://www.ama-assn.org/ama/pub/physician-resources/solutions-managing-your-practice/coding-billing-insurance/medicare/the-resource-based-relative-value-scale/the-rvs-update-committee.page?. Accessed March 23, 2016.
7. Details for title: CMS-1631-FC. Centers for Medicare & Medicaid Services website. https://www.cms.gov/Medicare/Medicare-Fee-for-Service-Payment/Physician FeeSched/PFS-Federal-Regulation-Notices-Items/CMS-1631-FC.html. Published November 16, 2015. Accessed March 23, 2016.
Practice Points
- Many dermatology codes are in the “Special Dermatological Procedures” section of the Current Procedural Terminology (CPT) manual.
- Physicians should purchase a new CPT manual every year, as accurate coding is critical for accurate reimbursement.

IDSA, SHEA release inpatient antibiotic stewardship guidelines
The Infectious Diseases Society of America (IDSA) and the Society for Healthcare Epidemiology of America (SHEA) have jointly released evidence-based guidelines for implementing an inpatient antibiotic stewardship program.
The guidelines, published April 13 online in Clinical Infectious Diseases, address the optimal use of antibiotics in inpatient populations, and were prepared by a multidisciplinary expert panel of the IDSA and the SHEA, which included representation from the specialties of internal medicine, emergency medicine, microbiology, critical care, surgery, epidemiology, pharmacy, and adult and pediatric infectious diseases.

Antibiotic stewardship has been defined by IDSA, SHEA, and the Pediatric Infectious Diseases Society as “coordinated interventions designed to improve and measure the appropriate use of [antibiotic] agents by promoting the selection of the optimal [antibiotic] drug regimen including dosing, duration of therapy, and route of administration.” The new guidelines discuss a broad range of possible interventions, but the authors emphasize the need “for each site to assess its clinical needs and available resources and individualize its [antibiotic stewardship program] with that assessment in mind.”
The process used in the development of the guidelines included a systematic weighting of the strength of recommendation and quality of evidence using the GRADE (Grading of Recommendations, Assessment, Development, and Evaluation) system, according to Dr. Tamar F. Barlam of the section of infectious diseases at Boston University, and her colleagues.
“The benefits of antibiotic stewardship include improved patient outcomes, reduced adverse events including Clostridium difficile infection, improvement in rates of antibiotic susceptibilities to targeted antibiotics, and optimization of resource utilization across the continuum of care,” Dr. Barlam and her coauthors wrote.
A complete list of any potential conflicts of interest for the multiple coauthors is provided with the full stewardship guidelines, which can be reviewed in Clinical Infectious Diseases (doi: 10.1093/cid/ciw118).
On Twitter @richpizzi
The Infectious Diseases Society of America (IDSA) and the Society for Healthcare Epidemiology of America (SHEA) have jointly released evidence-based guidelines for implementing an inpatient antibiotic stewardship program.
The guidelines, published April 13 online in Clinical Infectious Diseases, address the optimal use of antibiotics in inpatient populations, and were prepared by a multidisciplinary expert panel of the IDSA and the SHEA, which included representation from the specialties of internal medicine, emergency medicine, microbiology, critical care, surgery, epidemiology, pharmacy, and adult and pediatric infectious diseases.
Antibiotic stewardship has been defined by IDSA, SHEA, and the Pediatric Infectious Diseases Society as “coordinated interventions designed to improve and measure the appropriate use of [antibiotic] agents by promoting the selection of the optimal [antibiotic] drug regimen including dosing, duration of therapy, and route of administration.” The new guidelines discuss a broad range of possible interventions, but the authors emphasize the need “for each site to assess its clinical needs and available resources and individualize its [antibiotic stewardship program] with that assessment in mind.”
The process used in the development of the guidelines included a systematic weighting of the strength of recommendation and quality of evidence using the GRADE (Grading of Recommendations, Assessment, Development, and Evaluation) system, according to Dr. Tamar F. Barlam of the section of infectious diseases at Boston University, and her colleagues.
“The benefits of antibiotic stewardship include improved patient outcomes, reduced adverse events including Clostridium difficile infection, improvement in rates of antibiotic susceptibilities to targeted antibiotics, and optimization of resource utilization across the continuum of care,” Dr. Barlam and her coauthors wrote.
A complete list of any potential conflicts of interest for the multiple coauthors is provided with the full stewardship guidelines, which can be reviewed in Clinical Infectious Diseases (doi: 10.1093/cid/ciw118).
On Twitter @richpizzi
FROM CLINICAL INFECTIOUS DISEASES

Psoriasis tied to abdominal aortic aneurysm in nationwide study
Patients with severe psoriasis were nearly 70% more likely to develop abdominal aortic aneurysms compared with the general population, according to a Danish population-based cohort study.
The findings augment existing evidence linking psoriasis and cardiovascular diseases, wrote Dr. Usman Khalid of Copenhagen University Herlev and Gentofte Hospital, Denmark. The report was published online April 14 in Arteriosclerosis, Thrombosis, and Vascular Biology.
While the mechanisms for the link are unclear, “emerging evidence suggests that AAA is a focal representation of a systemic disease with a distinct inflammatory component, rather than a mere consequence of atherosclerosis,” wrote Dr. Khalid and his associates.

Several case series have linked AAA with other autoimmune disorders, including systemic lupus erythematosus and rheumatoid arthritis, they noted. Their study comprised nearly 5.5 million adults in Denmark between 1997 and 2011. The researchers identified 59,423 patients with mild psoriasis and 11,566 patients with severe psoriasis (Arterioscler Thromb Vasc Biol. 2016 April 14. doi: 10.1161/ATVBAHA.116.307449).
The incidence of AAA in the reference population was 3.72 cases per 10,000 person-years, with an average follow-up period of 14.4 years. In contrast, the incidence of AAA in patients with mild psoriasis was 7.30 cases per 10,000 person-years, and the rate in patients with severe psoriasis was 9.87 cases of per 10,000 person-years, with average follow-up periods of 5.7 years. Both mild and severe psoriasis were significantly associated with AAA after the researchers accounted for age, sex, comorbidities, medications, socioeconomic status, and smoking, with adjusted incidence rate ratios of 1.20 (95% confidence interval, 1.03-1.39) and 1.67 (95% CI, 1.21-2.32), respectively.
The historical view that AAA is caused mainly by atherosclerosis has largely been upended, the researchers noted. Instead, AAA appears to be a multifactorial process involving inflammation, matrix degradation, thrombosis, and aortic wall stress. Furthermore, inflammation in both AAA and psoriasis is centrally mediated by T-helper-17 cells and interleukin-17. Together, the data suggest that shared inflammatory mechanisms link psoriasis and AAA, especially because the association correlates with psoriatic disease activity, they said. “This finding clearly requires independent replication, and the clinical consequences are unclear at present.”
The LEO Foundation and the Novo Nordisk Foundation funded the study. Dr. Khalid had no disclosures. Four coinvestigators reported financial ties with Abbott, Pfizer, AstraZeneca, Bayer, and several other pharmaceutical companies.
Patients with severe psoriasis were nearly 70% more likely to develop abdominal aortic aneurysms compared with the general population, according to a Danish population-based cohort study.
The findings augment existing evidence linking psoriasis and cardiovascular diseases, wrote Dr. Usman Khalid of Copenhagen University Herlev and Gentofte Hospital, Denmark. The report was published online April 14 in Arteriosclerosis, Thrombosis, and Vascular Biology.
While the mechanisms for the link are unclear, “emerging evidence suggests that AAA is a focal representation of a systemic disease with a distinct inflammatory component, rather than a mere consequence of atherosclerosis,” wrote Dr. Khalid and his associates.
Several case series have linked AAA with other autoimmune disorders, including systemic lupus erythematosus and rheumatoid arthritis, they noted. Their study comprised nearly 5.5 million adults in Denmark between 1997 and 2011. The researchers identified 59,423 patients with mild psoriasis and 11,566 patients with severe psoriasis (Arterioscler Thromb Vasc Biol. 2016 April 14. doi: 10.1161/ATVBAHA.116.307449).
The incidence of AAA in the reference population was 3.72 cases per 10,000 person-years, with an average follow-up period of 14.4 years. In contrast, the incidence of AAA in patients with mild psoriasis was 7.30 cases per 10,000 person-years, and the rate in patients with severe psoriasis was 9.87 cases of per 10,000 person-years, with average follow-up periods of 5.7 years. Both mild and severe psoriasis were significantly associated with AAA after the researchers accounted for age, sex, comorbidities, medications, socioeconomic status, and smoking, with adjusted incidence rate ratios of 1.20 (95% confidence interval, 1.03-1.39) and 1.67 (95% CI, 1.21-2.32), respectively.
The historical view that AAA is caused mainly by atherosclerosis has largely been upended, the researchers noted. Instead, AAA appears to be a multifactorial process involving inflammation, matrix degradation, thrombosis, and aortic wall stress. Furthermore, inflammation in both AAA and psoriasis is centrally mediated by T-helper-17 cells and interleukin-17. Together, the data suggest that shared inflammatory mechanisms link psoriasis and AAA, especially because the association correlates with psoriatic disease activity, they said. “This finding clearly requires independent replication, and the clinical consequences are unclear at present.”
The LEO Foundation and the Novo Nordisk Foundation funded the study. Dr. Khalid had no disclosures. Four coinvestigators reported financial ties with Abbott, Pfizer, AstraZeneca, Bayer, and several other pharmaceutical companies.
FROM ARTERIOSCLEROSIS, THROMBOSIS, AND VASCULAR BIOLOGY
Key clinical point: Psoriasis predicted abdominal aortic aneurysm in a large, population-based study.
Major finding: The adjusted risk of abdominal aortic aneurysm was 1.67 times greater among patients with severe psoriasis than in the reference population.
Data source: A retrospective cohort study of 5.5 million Danish adults, including 59,423 patients with mild psoriasis and 11,566 patients with severe psoriasis.
Disclosures: The LEO Foundation and the Novo Nordisk Foundation funded the study. Dr. Khalid had no disclosures. Four coinvestigators reported financial ties with Abbott, Pfizer, AstraZeneca, Bayer, and several other pharmaceutical companies.

Cyst on the Eyebrow
The best diagnosis is:
a. bronchogenic cyst
b. dermoid cyst
c. epidermal inclusion cyst
d. hidrocystoma
e. steatocystoma
|
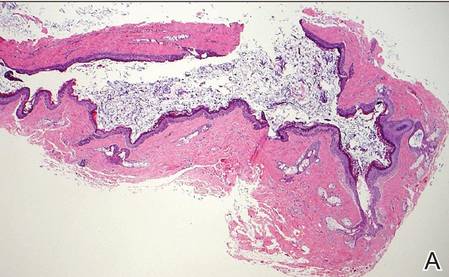
|
| H&E, original magnification ×40. |
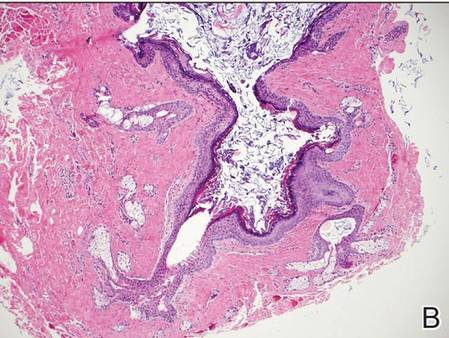
|
| H&E, original magnification ×100. |
Continue to the next page for the diagnosis >>
Dermoid Cyst
Dermoid cysts often present clinically as firm subcutaneous nodules on the head or neck in young children. They tend to arise along the lateral aspect of the eyebrow but also can occur on the nose, forehead, neck, chest, or scalp.1 Dermoid cysts are thought to arise from the sequestration of ectodermal tissues along the embryonic fusion planes during development.2 As such, they represent congenital defects and often are identified at birth; however, some are not noticed until much later when they enlarge or become inflamed or infected. Midline dermoid cysts may be associated with underlying dysraphism or intracranial extension.3,4 Thus, any midline lesion warrants evaluation that incorporates imaging with computed tomography or magnetic resonance imaging.4,5 Histologically, dermoid cysts are lined by a keratinizing stratified squamous epithelium (quiz image A), but the lining may be brightly eosinophilic and wavy resembling shark teeth.1,3 The wall of a dermoid cyst commonly contains mature adnexal structures such as terminal hair follicles, sebaceous glands, apocrine glands, and/or eccrine glands (quiz image B).1 Smooth muscle also may be seen within the lining; however, bone and cartilage are not commonly reported in dermoid cysts.2 Lamellar keratin is typical of the cyst contents, and terminal hair shafts also are sometimes noted within the cystic space (quiz image B).1,2 Treatment options include excision at the time of diagnosis or close clinical monitoring with subsequent excision if the lesion grows or becomes symptomatic.4,5 Many practitioners opt to excise these cysts at diagnosis, as untreated lesions are at risk for infection and/or inflammation or may be cosmetically deforming.6,7 Surgical resection, including removal of the wall of the cyst, is curative and reoccurrence is rare.5
| |
Figure 1. Bronchogenic cyst demonstrating a ciliated pseudostratified epithelial lining encircled by smooth muscle (H&E, original magnification ×200). | |
| |
| Figure 2. Epidermal inclusion cyst containing loose lamellar keratin and a lining that closely resembles the surface epidermis (H&E, original magnification ×40). |
|
Bronchogenic cysts demonstrate an epithelial lining that often is pseudostratified cuboidal or columnar as well as ciliated (Figure 1). Goblet cells are present in the lining in approximately 50% of cases. Smooth muscle may be seen circumferentially surrounding the cyst lining, and rare cases also contain cartilage.1 In contrast to dermoid cysts, other types of adnexal structures are not found within the lining. Bronchogenic cysts that arise in the skin are extremely rare.2 These cysts are thought to arise from respiratory epithelium that has been sequestered during embryologic formation of the tracheobronchial tree. They often are seen overlying the suprasternal notch and occasionally are found on the anterior aspect of the neck or chin. These cysts also are present at birth, similar to dermoid cysts.3
Epidermal inclusion cysts have a lining that histologically bears close resemblance to the surface epidermis. These cysts contain loose lamellar keratin, similar to a dermoid cyst. In contrast, the lining of an epidermal inclusion cyst will lack adnexal structures (Figure 2).1 Clinically, epidermal inclusion cysts often present as smooth, dome-shaped papules and nodules with a central punctum. They are classically found on the face, neck, and trunk. These cysts are thought to arise after a traumatic insult to the pilosebaceous unit.2
Hidrocystomas can be apocrine or eccrine.3 Eccrine hidrocystomas are unilocular cysts that are lined by 2 layers of flattened to cuboidal epithelial cells (Figure 3). The cysts are filled with clear fluid and often are found adjacent to normal eccrine glands.1 Apocrine hidrocystomas are unilocular or multilocular cysts that are lined by 1 to several layers of epithelial cells. The lining of an apocrine hidrocystoma will often exhibit luminal decapitation secretion.3 Apocrine and eccrine hidrocystomas are clinically identical and appear as blue translucent papules on the cheeks or eyelids of adults.1-3 They usually occur periorbitally but also can be seen on the trunk, popliteal fossa, external ears, or vulva. Eccrine hidrocystomas can wax and wane in accordance with the amount of sweat produced; thus, they often expand in size during the summer months.2
Steatocystomas, or simple sebaceous duct cysts, histologically demonstrate a characteristically wavy and eosinophilic cuticle resembling shark teeth (Figure 4) similar to the lining of the sebaceous duct where it enters the follicle.1 Sebaceous glands are an almost invariable feature, either present within the lining of the cyst (Figure 4) or in the adjacent tissue.2 In comparison, dermoid cysts may have a red wavy cuticle but also will usually have terminal hair follicles or eccrine or apocrine glands within the wall of the cyst. Steatocystomas typically are collapsed and empty or only contain sebaceous debris (Figure 4) rather than the lamellar keratin seen in dermoid and epidermoid inclusion cysts. Steatocystomas can occur as solitary (steatocystoma simplex) or multiple (steatocystoma multiplex) lesions.1,3 They are clinically comprised of small dome-shaped papules that often are translucent and yellow. These cysts are commonly found on the sternum of males and the axillae or groin of females.2
| 
| |
Figure 3. Eccrine hidrocystoma with clear contents and lined by 2 layers of cuboidal epithelial cells (H&E, original magnification ×100). | Figure 4. Steatocystoma with a red wavy cuticle, sparse sebaceous contents, and sebaceous glands within the lining (H&E, original magnification ×100). |
|
1. Elston DM, Ferringer TC, Ko C, et al. Dermatopathology: Requisites in Dermatology. 2nd ed. Philadelphia, PA: Saunders Elsevier; 2014.
2. Calonje JE, Brenn T, Lazar AJ, et al. McKee’s Pathology of the Skin. 4th ed. St Louis, MO: Elsevier/Saunders; 2012.
3. Bolognia JL, Jorizzo JL, Shaffer JV. Dermatology. 3rd ed. Philadelphia, PA: Elsevier/Saunders; 2012.
4. Orozco-Covarrubias L, Lara-Carpio R, Saez-De-Ocariz M, et al. Dermoid cysts: a report of 75 pediatric patients. Pediatr Dermatol. 2013;30:706-711.
5. Sorenson EP, Powel JE, Rozzelle CJ, et al. Scalp dermoids: a review of their anatomy, diagnosis, and treatment. Childs Nerv Syst. 2013;29:375-380.
6. Pryor SG, Lewis JE, Weaver AL, et al. Pediatric dermoid cysts of the head and neck. Otolarynol Head Neck Surg. 2005;132:938-942.
7. Abou-Rayyah Y, Rose GE, Konrad H, et al. Clinical, radiological and pathological examination of periocular dermoid cysts: evidence of inflammation from an early age. Eye (Lond). 2002;16:507-512.
The best diagnosis is:
a. bronchogenic cyst
b. dermoid cyst
c. epidermal inclusion cyst
d. hidrocystoma
e. steatocystoma
|
|
|
| H&E, original magnification ×40. |
|
|
| H&E, original magnification ×100. |
Continue to the next page for the diagnosis >>
Dermoid Cyst
Dermoid cysts often present clinically as firm subcutaneous nodules on the head or neck in young children. They tend to arise along the lateral aspect of the eyebrow but also can occur on the nose, forehead, neck, chest, or scalp.1 Dermoid cysts are thought to arise from the sequestration of ectodermal tissues along the embryonic fusion planes during development.2 As such, they represent congenital defects and often are identified at birth; however, some are not noticed until much later when they enlarge or become inflamed or infected. Midline dermoid cysts may be associated with underlying dysraphism or intracranial extension.3,4 Thus, any midline lesion warrants evaluation that incorporates imaging with computed tomography or magnetic resonance imaging.4,5 Histologically, dermoid cysts are lined by a keratinizing stratified squamous epithelium (quiz image A), but the lining may be brightly eosinophilic and wavy resembling shark teeth.1,3 The wall of a dermoid cyst commonly contains mature adnexal structures such as terminal hair follicles, sebaceous glands, apocrine glands, and/or eccrine glands (quiz image B).1 Smooth muscle also may be seen within the lining; however, bone and cartilage are not commonly reported in dermoid cysts.2 Lamellar keratin is typical of the cyst contents, and terminal hair shafts also are sometimes noted within the cystic space (quiz image B).1,2 Treatment options include excision at the time of diagnosis or close clinical monitoring with subsequent excision if the lesion grows or becomes symptomatic.4,5 Many practitioners opt to excise these cysts at diagnosis, as untreated lesions are at risk for infection and/or inflammation or may be cosmetically deforming.6,7 Surgical resection, including removal of the wall of the cyst, is curative and reoccurrence is rare.5
|
| |
Figure 1. Bronchogenic cyst demonstrating a ciliated pseudostratified epithelial lining encircled by smooth muscle (H&E, original magnification ×200). | |
|
| |
| Figure 2. Epidermal inclusion cyst containing loose lamellar keratin and a lining that closely resembles the surface epidermis (H&E, original magnification ×40). |
|
Bronchogenic cysts demonstrate an epithelial lining that often is pseudostratified cuboidal or columnar as well as ciliated (Figure 1). Goblet cells are present in the lining in approximately 50% of cases. Smooth muscle may be seen circumferentially surrounding the cyst lining, and rare cases also contain cartilage.1 In contrast to dermoid cysts, other types of adnexal structures are not found within the lining. Bronchogenic cysts that arise in the skin are extremely rare.2 These cysts are thought to arise from respiratory epithelium that has been sequestered during embryologic formation of the tracheobronchial tree. They often are seen overlying the suprasternal notch and occasionally are found on the anterior aspect of the neck or chin. These cysts also are present at birth, similar to dermoid cysts.3
Epidermal inclusion cysts have a lining that histologically bears close resemblance to the surface epidermis. These cysts contain loose lamellar keratin, similar to a dermoid cyst. In contrast, the lining of an epidermal inclusion cyst will lack adnexal structures (Figure 2).1 Clinically, epidermal inclusion cysts often present as smooth, dome-shaped papules and nodules with a central punctum. They are classically found on the face, neck, and trunk. These cysts are thought to arise after a traumatic insult to the pilosebaceous unit.2
Hidrocystomas can be apocrine or eccrine.3 Eccrine hidrocystomas are unilocular cysts that are lined by 2 layers of flattened to cuboidal epithelial cells (Figure 3). The cysts are filled with clear fluid and often are found adjacent to normal eccrine glands.1 Apocrine hidrocystomas are unilocular or multilocular cysts that are lined by 1 to several layers of epithelial cells. The lining of an apocrine hidrocystoma will often exhibit luminal decapitation secretion.3 Apocrine and eccrine hidrocystomas are clinically identical and appear as blue translucent papules on the cheeks or eyelids of adults.1-3 They usually occur periorbitally but also can be seen on the trunk, popliteal fossa, external ears, or vulva. Eccrine hidrocystomas can wax and wane in accordance with the amount of sweat produced; thus, they often expand in size during the summer months.2
Steatocystomas, or simple sebaceous duct cysts, histologically demonstrate a characteristically wavy and eosinophilic cuticle resembling shark teeth (Figure 4) similar to the lining of the sebaceous duct where it enters the follicle.1 Sebaceous glands are an almost invariable feature, either present within the lining of the cyst (Figure 4) or in the adjacent tissue.2 In comparison, dermoid cysts may have a red wavy cuticle but also will usually have terminal hair follicles or eccrine or apocrine glands within the wall of the cyst. Steatocystomas typically are collapsed and empty or only contain sebaceous debris (Figure 4) rather than the lamellar keratin seen in dermoid and epidermoid inclusion cysts. Steatocystomas can occur as solitary (steatocystoma simplex) or multiple (steatocystoma multiplex) lesions.1,3 They are clinically comprised of small dome-shaped papules that often are translucent and yellow. These cysts are commonly found on the sternum of males and the axillae or groin of females.2
|
|
| |
Figure 3. Eccrine hidrocystoma with clear contents and lined by 2 layers of cuboidal epithelial cells (H&E, original magnification ×100). | Figure 4. Steatocystoma with a red wavy cuticle, sparse sebaceous contents, and sebaceous glands within the lining (H&E, original magnification ×100). |
|
1. Elston DM, Ferringer TC, Ko C, et al. Dermatopathology: Requisites in Dermatology. 2nd ed. Philadelphia, PA: Saunders Elsevier; 2014.
2. Calonje JE, Brenn T, Lazar AJ, et al. McKee’s Pathology of the Skin. 4th ed. St Louis, MO: Elsevier/Saunders; 2012.
3. Bolognia JL, Jorizzo JL, Shaffer JV. Dermatology. 3rd ed. Philadelphia, PA: Elsevier/Saunders; 2012.
4. Orozco-Covarrubias L, Lara-Carpio R, Saez-De-Ocariz M, et al. Dermoid cysts: a report of 75 pediatric patients. Pediatr Dermatol. 2013;30:706-711.
5. Sorenson EP, Powel JE, Rozzelle CJ, et al. Scalp dermoids: a review of their anatomy, diagnosis, and treatment. Childs Nerv Syst. 2013;29:375-380.
6. Pryor SG, Lewis JE, Weaver AL, et al. Pediatric dermoid cysts of the head and neck. Otolarynol Head Neck Surg. 2005;132:938-942.
7. Abou-Rayyah Y, Rose GE, Konrad H, et al. Clinical, radiological and pathological examination of periocular dermoid cysts: evidence of inflammation from an early age. Eye (Lond). 2002;16:507-512.

Breastfeeding reduces infants’ respiratory symptoms early on
Breastfeeding during the first 27 weeks of life had a risk-specific effect on reducing respiratory symptoms in healthy term infants, based on data from a prospective cohort study of 436 children in Switzerland.
“Breastfeeding is generally accepted to be protective against respiratory symptoms in early life,” but most published studies on this topic are cross-sectional and more likely biased, wrote Dr. Olga Gorlanova of the University of Basel (Switzerland) and her colleagues.

The researchers studied infants enrolled in the Bern-Basel Infant Lung Development cohort via weekly telephone interviews during the first year of life. In addition, weekly measurements of environmental particulate matter were collected from local monitoring stations. Risk factors included maternal history of atopy, vaginal vs. cesarean delivery, parents’ level of education, smoking during and after pregnancy, number of older siblings, child care attendance, and housing conditions.
Overall, infants breastfed during the first 27 weeks of life had significantly reduced respiratory symptoms, compared with nonbreastfed infants (risk ratio, .70)
The study “suggests that breastfeeding attenuates the effects of risk factors such as sex, age, gestational age, cesarean delivery, and prenatal maternal tobacco smoking in healthy term infants,” Dr. Gorlanova and her associates wrote. No significant interaction was noted between breastfeeding and child care attendance, number of older siblings, maternal atopy, or environmental particulate matter.
Read the full study here (J Pediatr. 2016. doi: 10.1016/j.jpeds.2016.03.041).
Breastfeeding during the first 27 weeks of life had a risk-specific effect on reducing respiratory symptoms in healthy term infants, based on data from a prospective cohort study of 436 children in Switzerland.
“Breastfeeding is generally accepted to be protective against respiratory symptoms in early life,” but most published studies on this topic are cross-sectional and more likely biased, wrote Dr. Olga Gorlanova of the University of Basel (Switzerland) and her colleagues.
The researchers studied infants enrolled in the Bern-Basel Infant Lung Development cohort via weekly telephone interviews during the first year of life. In addition, weekly measurements of environmental particulate matter were collected from local monitoring stations. Risk factors included maternal history of atopy, vaginal vs. cesarean delivery, parents’ level of education, smoking during and after pregnancy, number of older siblings, child care attendance, and housing conditions.
Overall, infants breastfed during the first 27 weeks of life had significantly reduced respiratory symptoms, compared with nonbreastfed infants (risk ratio, .70)
The study “suggests that breastfeeding attenuates the effects of risk factors such as sex, age, gestational age, cesarean delivery, and prenatal maternal tobacco smoking in healthy term infants,” Dr. Gorlanova and her associates wrote. No significant interaction was noted between breastfeeding and child care attendance, number of older siblings, maternal atopy, or environmental particulate matter.
Read the full study here (J Pediatr. 2016. doi: 10.1016/j.jpeds.2016.03.041).
FROM THE JOURNAL OF PEDIATRICS

PPI cuts GI events from low- and high-dose aspirin
CHICAGO – Six months of treatment with a proton pump inhibitor (PPI) is a safe way to cut the incidence of major gastrointestinal events in cardiovascular disease patients on dual-antiplatelet therapy regardless of whether they receive low-dose or high-dose aspirin, according to a post-hoc analysis of data from more than 3,700 patients enrolled in the multicenter, randomized COGENT trial.
“Short-term, prophylactic PPI therapy consistently reduced rates of adjudicated upper-gastrointestinal events without increasing cardiovascular events, regardless of the aspirin dose,” Dr. Muthiah Vaduganathan said while presenting his study at the annual meeting of the American College of Cardiology. “Gastroprotection with PPI therapy should be used in appropriately selected patients with coronary artery disease who require dual-antiplatelet therapy even if they are on low-dose aspirin.”

In addition to documenting the safety and efficacy of 6 months of PPI treatment for patients at high risk for cardiovascular events and low or moderate risk for a GI event, the results from the analysis also documented how common GI events are in this population, even when patients receive low-dose aspirin. Nearly two-thirds of the 3,752 patients included in the analysis took low-dose aspirin, either 75 mg or 81 mg per day. Their incidence of an adjudicated upper GI bleed, the study’s primary GI endpoint, occurred in 3.1% of patients on placebo, and in 1.2% of patients taking a prophylactic PPI. Among the other 34% of patients on high-dose aspirin – a daily dosage of at least 150 mg – the rate of adjudicated upper-GI bleeds was 2.6% without a PPI and 0.9% in those on a PPI.
In other words, even among patients deemed to have a relatively low risk for upper GI complications from aspirin (because their entry into this study required no history of major GI bleeds or recent treatment with a gastroprotection agent), treatment with low-dose aspirin resulted in upper-GI bleeds at the same rate, about 3%, as high-dose aspirin. And in both of these aspirin subgroups 6 months of concurrent treatment with a PPI cut the incidence of major GI bleeds by more than half.
The findings are especially notable because the enrollment criteria stacked the deck toward patients with high cardiovascular disease risk and relatively low GI risk. The study enrolled “a unique population at high risk for cardiovascular disease – 71% had previously undergone a percutaneous coronary intervention, and 42% had a history of an acute coronary syndrome – and low GI risk, but even in this population enriched for cardiovascular disease risk, there was no increased rate of cardiovascular disease events” during a median follow-up while on PPI treatment of 110 days, Dr. Vaduganathan said.
Among patients on low-dose aspirin, the rate of cardiovascular death, MI, stroke, or coronary revascularization was 5.6% with PPI treatment and 5.5% without, and in the high-dose aspirin patients the rates were 4.2% with PPI treatment and 5.5% without. Neither of these differences between the subgroups taking or not taking a PPI were statistically significant.
Concurrent with Dr. Vaduganathan’s report at the meeting the results also appeared online (J Am Coll Cardiol. 2016 April 12;67[14]:661-71).
“There appeared to be no adverse clinical effect from PPI treatment. When used short-term, for up to 6 months, PPI treatment appears to be safe in patients with cardiovascular disease,” Dr. Vaduganathan concluded.
The analysis used data collected in COGENT (Clopidogrel and the Optimization of Gastrointestinal Events Trial), a phase 3 study designed to compare a single-pill formulation of 20 mg omeprazole and 75 mg clopidogrel taken orally once daily with 75 mg clopidogrel against a background of all patients taking aspirin. COGENT stopped prematurely in late 2008 as the company developing this formulation and sponsoring the trial, Cogentus Pharmaceuticals, filed for bankruptcy. Despite its abrupt conclusion, the trial had enrolled and followed enough patients to show that treatment with omeprazole plus clopidogrel and aspirin led to a significant reduction in upper GI bleeding without increasing the rate of cardiovascular disease events, compared with clopidogrel plus aspirin (N Engl J Med. 2010 Nov 11;363[20]:1909-17).
The new analysis focused on the greater than 99% of patients in the total COGENT cohort for whom information was available on whether they received high- or low-dose aspirin.
Although the primary findings from COGENT, reported in 2010, documented the safety and efficacy of concomitant PPI treatment during dual-antiplatelet therapy, and despite guidelines revised in 2010 that called for PPI treatment when appropriate, this strategy for preventing GI complications remains underused, Dr. Vaduganathan said. The most recent U.S. recommendations that address this issue called for assessing the potential risk and benefit from PPI treatment in patients receiving dual-antiplatelet therapy: “The risk reduction with PPIs is substantial in patients with risk factors for GI bleeding and may outweigh any potential reduction in the CV efficacy of antiplatelet treatment because of a drug-drug interaction (J Am Coll Cardiol. 2010 Dec;56[24]:2051-66).”
The only caveat Dr. Vaduganathan placed on PPI use was that the COGENT data addressed only 6 months of PPI use; the safety of longer-term use has not been studied. But “the trend is to use PPIs for as short a period as possible,” and the risk for adverse effects from PPI treatment on cardiovascular disease events is likely greatest during the first 6 months of PPI treatment, he noted. If PPI treatment needs to continue beyond 6 months, he suggested systematically reassessing the risk-benefit balance for individual patients from continued PPI treatment every 3 months.*
*Changes were made to this story on 4/20/2016.
On Twitter @mitchelzoler
The new analysis of COGENT provides important insights into patients treated with clopidogrel and aspirin. The data show that patients on low-dose aspirin do not have an increased risk of cardiovascular events, and that patients who take low-dose aspirin still face a significant risk for upper-gastrointestinal events. Patients taking low-dose aspirin have about the same rate of upper-GI events as patients on high-dose aspirin.
The issue of GI safety for patients on low-dose aspirin as part of dual-antiplatelet therapy has been long overshadowed by concern over a hypothetical interaction between clopidogrel and proton pump inhibitors. The issue has also been distorted by a false sense of security that when patients receive low-dose aspirin they do not require protection against GI events.
Treatment of patients taking low-dose aspirin with a PPI is underutilized. The confirmation this analysis provides, that PPI treatment gives GI protection without causing an excess of cardiovascular events, calls for a change in current practice when clinicians prescribe low-dose aspirin. I’m concerned by the apparent lack of enthusiasm by clinicians to prescribe PPIs to their patients on low-dose aspirin despite their significant risk for GI events. The real question is whether all patients on low-dose aspirin should receive a PPI long term or only the subgroup of patients with high risk for an upper-GI bleed.
Dr. Michael E. Farkouh is a cardiologist at Mount Sinai Hospital in Toronto. He has no disclosures. He made these comments in an editorial that accompanied the published report (J Am Coll Cardiol. 2016 April 12;67[14]:1672-3).
CHICAGO – Six months of treatment with a proton pump inhibitor (PPI) is a safe way to cut the incidence of major gastrointestinal events in cardiovascular disease patients on dual-antiplatelet therapy regardless of whether they receive low-dose or high-dose aspirin, according to a post-hoc analysis of data from more than 3,700 patients enrolled in the multicenter, randomized COGENT trial.
“Short-term, prophylactic PPI therapy consistently reduced rates of adjudicated upper-gastrointestinal events without increasing cardiovascular events, regardless of the aspirin dose,” Dr. Muthiah Vaduganathan said while presenting his study at the annual meeting of the American College of Cardiology. “Gastroprotection with PPI therapy should be used in appropriately selected patients with coronary artery disease who require dual-antiplatelet therapy even if they are on low-dose aspirin.”
In addition to documenting the safety and efficacy of 6 months of PPI treatment for patients at high risk for cardiovascular events and low or moderate risk for a GI event, the results from the analysis also documented how common GI events are in this population, even when patients receive low-dose aspirin. Nearly two-thirds of the 3,752 patients included in the analysis took low-dose aspirin, either 75 mg or 81 mg per day. Their incidence of an adjudicated upper GI bleed, the study’s primary GI endpoint, occurred in 3.1% of patients on placebo, and in 1.2% of patients taking a prophylactic PPI. Among the other 34% of patients on high-dose aspirin – a daily dosage of at least 150 mg – the rate of adjudicated upper-GI bleeds was 2.6% without a PPI and 0.9% in those on a PPI.
In other words, even among patients deemed to have a relatively low risk for upper GI complications from aspirin (because their entry into this study required no history of major GI bleeds or recent treatment with a gastroprotection agent), treatment with low-dose aspirin resulted in upper-GI bleeds at the same rate, about 3%, as high-dose aspirin. And in both of these aspirin subgroups 6 months of concurrent treatment with a PPI cut the incidence of major GI bleeds by more than half.
The findings are especially notable because the enrollment criteria stacked the deck toward patients with high cardiovascular disease risk and relatively low GI risk. The study enrolled “a unique population at high risk for cardiovascular disease – 71% had previously undergone a percutaneous coronary intervention, and 42% had a history of an acute coronary syndrome – and low GI risk, but even in this population enriched for cardiovascular disease risk, there was no increased rate of cardiovascular disease events” during a median follow-up while on PPI treatment of 110 days, Dr. Vaduganathan said.
Among patients on low-dose aspirin, the rate of cardiovascular death, MI, stroke, or coronary revascularization was 5.6% with PPI treatment and 5.5% without, and in the high-dose aspirin patients the rates were 4.2% with PPI treatment and 5.5% without. Neither of these differences between the subgroups taking or not taking a PPI were statistically significant.
Concurrent with Dr. Vaduganathan’s report at the meeting the results also appeared online (J Am Coll Cardiol. 2016 April 12;67[14]:661-71).
“There appeared to be no adverse clinical effect from PPI treatment. When used short-term, for up to 6 months, PPI treatment appears to be safe in patients with cardiovascular disease,” Dr. Vaduganathan concluded.
The analysis used data collected in COGENT (Clopidogrel and the Optimization of Gastrointestinal Events Trial), a phase 3 study designed to compare a single-pill formulation of 20 mg omeprazole and 75 mg clopidogrel taken orally once daily with 75 mg clopidogrel against a background of all patients taking aspirin. COGENT stopped prematurely in late 2008 as the company developing this formulation and sponsoring the trial, Cogentus Pharmaceuticals, filed for bankruptcy. Despite its abrupt conclusion, the trial had enrolled and followed enough patients to show that treatment with omeprazole plus clopidogrel and aspirin led to a significant reduction in upper GI bleeding without increasing the rate of cardiovascular disease events, compared with clopidogrel plus aspirin (N Engl J Med. 2010 Nov 11;363[20]:1909-17).
The new analysis focused on the greater than 99% of patients in the total COGENT cohort for whom information was available on whether they received high- or low-dose aspirin.
Although the primary findings from COGENT, reported in 2010, documented the safety and efficacy of concomitant PPI treatment during dual-antiplatelet therapy, and despite guidelines revised in 2010 that called for PPI treatment when appropriate, this strategy for preventing GI complications remains underused, Dr. Vaduganathan said. The most recent U.S. recommendations that address this issue called for assessing the potential risk and benefit from PPI treatment in patients receiving dual-antiplatelet therapy: “The risk reduction with PPIs is substantial in patients with risk factors for GI bleeding and may outweigh any potential reduction in the CV efficacy of antiplatelet treatment because of a drug-drug interaction (J Am Coll Cardiol. 2010 Dec;56[24]:2051-66).”
The only caveat Dr. Vaduganathan placed on PPI use was that the COGENT data addressed only 6 months of PPI use; the safety of longer-term use has not been studied. But “the trend is to use PPIs for as short a period as possible,” and the risk for adverse effects from PPI treatment on cardiovascular disease events is likely greatest during the first 6 months of PPI treatment, he noted. If PPI treatment needs to continue beyond 6 months, he suggested systematically reassessing the risk-benefit balance for individual patients from continued PPI treatment every 3 months.*
*Changes were made to this story on 4/20/2016.
On Twitter @mitchelzoler
AT ACC 2016
Key clinical point: In patients at high risk of cardiovascular disease on dual-antiplatelet therapy, concurrent proton pump inhibitor treatment cut gastrointestinal events, regardless of whether patients received a low or high aspirin dosage.
Major finding: Omeprazole cut the rate of upper-GI bleeds by more than half in patients taking low- or high-dose aspirin.
Data source: Post-hoc analysis of data in COGENT, a multicenter, randomized trial with 3,762 patients.
Disclosures: Cogent was sponsored by Cogentus Pharmaceuticals; however, the company went bankrupt and provided no support for the current analysis. Dr. Vaduganathan had no disclosures.
