User login
Alternative options for visualizing ureteral patency during intraoperative cystoscopy
For more videos from the Society of Gynecologic Surgeons, click here
Visit the Society of Gynecologic Surgeons online: sgsonline.org
Related Articles:
- Use of suprapubic Carter-Thomason needle to assist in cystoscopic excision of an intravesical foreign object
- Uterine artery ligation: Advanced techniques and considerations for the difficult laparoscopic hysterectomy
- Cervical injection of methylene blue for identification of sentinel lymph nodes in cervical cancer
- Misplaced hysteroscopic sterilization micro-insert in the peritoneal cavity: A corpus alienum
- Laparoscopic cystectomy for large, bilateral ovarian dermoids
This video brought to you by ![]()

Meta-analysis suggests earlier twin delivery to prevent stillbirth
Delivery for uncomplicated dichorionic twin pregnancies should be considered at 37 weeks’ gestation, a week earlier than is generally recommended in the United States, according to a systematic review and meta-analysis of studies that reported rates of stillbirth and neonatal mortality at various gestational ages.
The researchers assessed the competing risks in twin pregnancies of stillbirth from expectant management versus neonatal death from early delivery, looking for an optimal gestational age at which these risks were balanced.

In dichorionic pregnancies continuing beyond 34 weeks, these perinatal risks were balanced at 37 weeks. Beyond that, “the risks of stillbirth significantly outweighed the risk of neonatal death from delivery,” with a 1-week delay in delivery (to 38 weeks’ gestation) leading to an additional 8.8 perinatal deaths per 1,000 pregnancies due to an increase in stillbirth, Fiona Cheong-See, MD, of the Queen Mary University of London and her colleagues reported (BMJ 2016;354:i4353. doi: 10.1136/bmj.i4353).
The review included 32 studies published in the past 10 years (observational cohort studies and cohorts nested in randomized studies) that reported rates of stillbirth and/or neonatal outcomes, including neonatal mortality, in monochorionic and/or dichorionic twins. Neonatal death was defined as death up to 28 days after delivery.
The study authors shared unpublished aggregate and individual patient data with the meta-analysis researchers, which enabled an analysis at weekly intervals. The data included in the review covered 35,171 women with twin gestations (29,685 dichorionic and 5,486 monochorionic pregnancies).
Pregnancies with unclear chorionicity, monoamnionity, and twin-to-twin transfusion syndrome were excluded from the analysis.
In monochorionic pregnancies continuing beyond 34 weeks (2,149 pregnancies), there was a trend after 36 weeks toward stillbirth risk being higher than the risk of neonatal death, but the risk difference was not significant.
More data are needed, the researchers said, but “based on our findings, there is no clear evidence to recommend early preterm delivery routinely before 36 weeks in monochorionic pregnancies.”
A committee opinion published by the American College of Obstetricians and Gynecologists and the Society for Maternal-Fetal Medicine (ACOG-SMFM) on medically indicated late-preterm and early-term deliveries states that decisions regarding the timing of delivery should be individualized and should take into account relative maternal and newborn risks, practice environment, and patient preferences (Obstet Gynecol. 2013;121:908-10).
Still, the ACOG-SMFM document offers delivery recommendations: 38 0/7-38 6/7 weeks of gestation for dichorionic-diamniotic pregnancies, and 34 0/7-36 6/7 weeks of gestation for monochorionic-diamniotic pregnancies.
The opinion was published in 2013 and reflects recommendations made 2 years earlier by the National Institute of Child Health and Human Development and SMFM after a workshop on indicated preterm birth (Obstet Gynecol 2011;118:323-33). ACOG and SMFM reaffirmed their document in 2015.

Brigid McCue, MD, chief of ob.gyn. at Beth Israel Deaconess Hospital–Plymouth (Mass.) and a member of ACOG’s Committee on Obstetric Practice, said the meta-analysis is of “high quality,” with “helpful and valid” findings for dichorionic twins.
The risk of stillbirth was 1.2/1,000 pregnancies at 34 weeks’ gestation, while the risk of neonatal death from delivery was 6.7/1,000 pregnancies. The risk of stillbirth remained significantly lower than the risk of neonatal death from delivery at 35 weeks, and was lower at 36 weeks as well. At 37 weeks, the two categories of perinatal death risk were basically balanced, with the risk of stillbirth at 3.4/1,000 pregnancies.
Beyond that, at 38 weeks’ gestation, the risk of stillbirth (10.6/1,000) significantly outweighed the risk of neonatal death from delivery (1.5/1,000) for a pooled risk difference of 8.8.
“The finding that stillbirth risk is higher when you allow someone to go from 37 to 38 weeks – I think this is true,” Dr. McCue said in an interview.
Further research needs to account, however, for the risks of neonatal morbidity at 37 and 38 weeks. “The next question in coming up with a point of inflection is to ask, What are other contributors to the balance of timing of the delivery?” Dr. McCue said. “There’s a bigger picture that needs more analysis.”
“We don’t induce singletons prior to 39 weeks because they can have more respiratory distress, more hypoglycemia, more temperature instability, and less success breastfeeding, for example,” she added. “These complications pale in comparison to a stillbirth, but the numbers of stillbirth are so low and the numbers for [these other morbidities] are much higher.”
The authors of the meta-analysis noted that their findings were limited by the common policy of planned delivery beyond 37 and 38 weeks’ gestation. “This reduced the sample size near term, particularly in monochorionic pregnancies, and could have led to underestimation of risk of stillbirth in the last weeks of pregnancy,” they wrote.
The rates of assisted ventilation, respiratory distress syndrome, admission to the neonatal intensive care unit, and septicemia showed a consistent reduction with increasing gestational age in babies of both monochorionic and dichorionic pregnancies, the researchers noted.
The researchers reported that they received no funding support from any organization and had no relevant financial disclosures.
Delivery for uncomplicated dichorionic twin pregnancies should be considered at 37 weeks’ gestation, a week earlier than is generally recommended in the United States, according to a systematic review and meta-analysis of studies that reported rates of stillbirth and neonatal mortality at various gestational ages.
The researchers assessed the competing risks in twin pregnancies of stillbirth from expectant management versus neonatal death from early delivery, looking for an optimal gestational age at which these risks were balanced.
In dichorionic pregnancies continuing beyond 34 weeks, these perinatal risks were balanced at 37 weeks. Beyond that, “the risks of stillbirth significantly outweighed the risk of neonatal death from delivery,” with a 1-week delay in delivery (to 38 weeks’ gestation) leading to an additional 8.8 perinatal deaths per 1,000 pregnancies due to an increase in stillbirth, Fiona Cheong-See, MD, of the Queen Mary University of London and her colleagues reported (BMJ 2016;354:i4353. doi: 10.1136/bmj.i4353).
The review included 32 studies published in the past 10 years (observational cohort studies and cohorts nested in randomized studies) that reported rates of stillbirth and/or neonatal outcomes, including neonatal mortality, in monochorionic and/or dichorionic twins. Neonatal death was defined as death up to 28 days after delivery.
The study authors shared unpublished aggregate and individual patient data with the meta-analysis researchers, which enabled an analysis at weekly intervals. The data included in the review covered 35,171 women with twin gestations (29,685 dichorionic and 5,486 monochorionic pregnancies).
Pregnancies with unclear chorionicity, monoamnionity, and twin-to-twin transfusion syndrome were excluded from the analysis.
In monochorionic pregnancies continuing beyond 34 weeks (2,149 pregnancies), there was a trend after 36 weeks toward stillbirth risk being higher than the risk of neonatal death, but the risk difference was not significant.
More data are needed, the researchers said, but “based on our findings, there is no clear evidence to recommend early preterm delivery routinely before 36 weeks in monochorionic pregnancies.”
A committee opinion published by the American College of Obstetricians and Gynecologists and the Society for Maternal-Fetal Medicine (ACOG-SMFM) on medically indicated late-preterm and early-term deliveries states that decisions regarding the timing of delivery should be individualized and should take into account relative maternal and newborn risks, practice environment, and patient preferences (Obstet Gynecol. 2013;121:908-10).
Still, the ACOG-SMFM document offers delivery recommendations: 38 0/7-38 6/7 weeks of gestation for dichorionic-diamniotic pregnancies, and 34 0/7-36 6/7 weeks of gestation for monochorionic-diamniotic pregnancies.
The opinion was published in 2013 and reflects recommendations made 2 years earlier by the National Institute of Child Health and Human Development and SMFM after a workshop on indicated preterm birth (Obstet Gynecol 2011;118:323-33). ACOG and SMFM reaffirmed their document in 2015.
Brigid McCue, MD, chief of ob.gyn. at Beth Israel Deaconess Hospital–Plymouth (Mass.) and a member of ACOG’s Committee on Obstetric Practice, said the meta-analysis is of “high quality,” with “helpful and valid” findings for dichorionic twins.
The risk of stillbirth was 1.2/1,000 pregnancies at 34 weeks’ gestation, while the risk of neonatal death from delivery was 6.7/1,000 pregnancies. The risk of stillbirth remained significantly lower than the risk of neonatal death from delivery at 35 weeks, and was lower at 36 weeks as well. At 37 weeks, the two categories of perinatal death risk were basically balanced, with the risk of stillbirth at 3.4/1,000 pregnancies.
Beyond that, at 38 weeks’ gestation, the risk of stillbirth (10.6/1,000) significantly outweighed the risk of neonatal death from delivery (1.5/1,000) for a pooled risk difference of 8.8.
“The finding that stillbirth risk is higher when you allow someone to go from 37 to 38 weeks – I think this is true,” Dr. McCue said in an interview.
Further research needs to account, however, for the risks of neonatal morbidity at 37 and 38 weeks. “The next question in coming up with a point of inflection is to ask, What are other contributors to the balance of timing of the delivery?” Dr. McCue said. “There’s a bigger picture that needs more analysis.”
“We don’t induce singletons prior to 39 weeks because they can have more respiratory distress, more hypoglycemia, more temperature instability, and less success breastfeeding, for example,” she added. “These complications pale in comparison to a stillbirth, but the numbers of stillbirth are so low and the numbers for [these other morbidities] are much higher.”
The authors of the meta-analysis noted that their findings were limited by the common policy of planned delivery beyond 37 and 38 weeks’ gestation. “This reduced the sample size near term, particularly in monochorionic pregnancies, and could have led to underestimation of risk of stillbirth in the last weeks of pregnancy,” they wrote.
The rates of assisted ventilation, respiratory distress syndrome, admission to the neonatal intensive care unit, and septicemia showed a consistent reduction with increasing gestational age in babies of both monochorionic and dichorionic pregnancies, the researchers noted.
The researchers reported that they received no funding support from any organization and had no relevant financial disclosures.
FROM BMJ
Key clinical point: Delivery of uncomplicated dichorionic twin pregnancies at 37 weeks’ gestation could minimize perinatal deaths.
Major finding: A delay in delivery to 38 weeks’ gestation led to an additional 8.8 perinatal deaths per 1,000 pregnancies because of an increase in stillbirth.
Data source: A systematic review and meta-analysis of 32 studies.
Disclosures: The researchers reported that they received no funding support from any organization and had no relevant financial disclosures.

Four-step screen IDs silent heart attack in type 2 diabetes
MUNICH – A four-component imaging/biomarker screen was highly accurate for identifying silent myocardial infarction among asymptomatic patients with type 2 diabetes.
The screen is far more accurate than the current standards of invasive imaging or only looking for pathologic Q waves, Peter Swoboda, MD, said at the annual meeting of the European Association for the Study of Diabetes.

“By combining these four factors we came up with a tool that has a diagnostic area under the curve [AUC] of 0.85,” said Dr. Swoboda of Leeds (England) University. “This is far better than the 0.58 AUC that we have with Q waves only – a sensitivity of just 25%.”
The study was published online in June in the Journal of Clinical Endocrinology and Metabolism (JCEM 2016. doi: 10.1210/jc.2016-1318).
The screen employs noninvasive imaging and biomarkers to tap multiple clinical hallmarks of silent MI. The components are:
• electrocardiogram.
• echocardiography.
• biomarker assessment.
• cardiac magnetic resonance imaging, focusing on left ventricular ejection fraction and late gadolinium enhancement.
The study cohort comprised 100 patients with type 2 diabetes without known heart disease and with no new cardiac symptoms. They underwent cardiac MRI, a 12-lead electrocardiogram, echocardiography, and serum biomarker assessment. Late gadolinium enhancement identified evidence of silent MI in 17 patients (17%).
There were few differences in the clinical characteristics of those who had experienced MI and those who had not, Dr. Swoboda noted. There were no differences at all in diabetes-related measures, including disease duration or hemoglobin A1c levels. Blood pressures were similar. Patients with MI were significantly older (65 vs. 60 years).
In cardiac-specific measures, left ventricular ejection fraction was similar, as was left ventricular mass, end diastolic volume, and left atrial volume. There were however, other very important differences, Dr. Swoboda noted.
Imaging included a measure called “feature tracking analysis,” which measured the peak global longitudinal strain, systolic strain rate, and early and late diastolic strain rates during contraction. This analysis noted a significant difference in global longitudinal strain between the MI and non-MI groups.
Ventricular filling velocities as measured by the E/A ratio on ECG were also significantly different between the MI and non-MI groups (0.75 vs. 0.89, respectively). ECG also found pathologic Q waves in significantly more MI patients (24% vs. 7%).
Finally, the serum biomarker panel showed a very strong increase in B-type natriuretic peptide (NT-proBNP) among MI patients, compared with non-MI patients (105 vs. 52 ng/L). There were no significant differences in the other biomarkers, including C-reactive protein and high-sensitive cardiac troponin.
Dr. Swoboda and his team then compiled these findings into a composite measure, assigning them optimum cutoff measures:
• Age older than 62 years.
• E/A ratio 0.72 or lower.
• Global longitudinal strain of at least 18.4%.
• NT-proBNP more than 29 ng/L.
The system resulted in a diagnostic accuracy AUC of 0.85 – significantly better than any of the AUCs generated by the individual components. All patients who scored 0 or 1 were free of MI. Among the 28 with a score of 2, only three had experienced a silent MI. Among the 21 with a score of 3, seven had experienced a silent MI and 14 had not. Among the 16 with a score of 4, seven had experienced a silent MI and nine had not.
While Dr. Swoboda called the screening method “simple” during discussion, a colleague in the audience disagreed with that.
“A simple test is something like a blood test only, not an MRI. Not imaging. That is expensive and takes time,” said Naveed Sattar, MD, of the University of Glasgow, Scotland. “However, I do think your data add more to the evidence that BNP can be a really valuable marker of cardiovascular risk in patients with diabetes.”
Dr. Sattar recently examined the value of cardiac serum biomarkers in predicting cardiovascular disease and mortality in nearly 100,000 people without a history of heart disease. In these subjects, he wrote, “NT-proBNP assessment strongly predicted first-onset heart failure and augmented coronary heart disease and stroke prediction, suggesting that NT-proBNP concentration assessment could be used to integrate heart failure into cardiovascular disease primary prevention.”
The paper appeared online in Lancet Diabetes in September (Lancet Diab. 2016. doi: 10.1016/S2213-8587[16]30196-6).
Dr. Swoboda agreed that data continue to support the increased use of NT-proBNP as a marker of heart disease.
“I think that in the future, diabetes medicine is moving toward individualized patient care, based on individualized risk factors. The future of assessing asymptomatic cardiac patients might be a combination of BNP and MRI.”
Dr. Swoboda had no financial disclosures. Some of Dr. Sattar’s coauthors reported relationships with pharmaceutical companies.
MUNICH – A four-component imaging/biomarker screen was highly accurate for identifying silent myocardial infarction among asymptomatic patients with type 2 diabetes.
The screen is far more accurate than the current standards of invasive imaging or only looking for pathologic Q waves, Peter Swoboda, MD, said at the annual meeting of the European Association for the Study of Diabetes.
“By combining these four factors we came up with a tool that has a diagnostic area under the curve [AUC] of 0.85,” said Dr. Swoboda of Leeds (England) University. “This is far better than the 0.58 AUC that we have with Q waves only – a sensitivity of just 25%.”
The study was published online in June in the Journal of Clinical Endocrinology and Metabolism (JCEM 2016. doi: 10.1210/jc.2016-1318).
The screen employs noninvasive imaging and biomarkers to tap multiple clinical hallmarks of silent MI. The components are:
• electrocardiogram.
• echocardiography.
• biomarker assessment.
• cardiac magnetic resonance imaging, focusing on left ventricular ejection fraction and late gadolinium enhancement.
The study cohort comprised 100 patients with type 2 diabetes without known heart disease and with no new cardiac symptoms. They underwent cardiac MRI, a 12-lead electrocardiogram, echocardiography, and serum biomarker assessment. Late gadolinium enhancement identified evidence of silent MI in 17 patients (17%).
There were few differences in the clinical characteristics of those who had experienced MI and those who had not, Dr. Swoboda noted. There were no differences at all in diabetes-related measures, including disease duration or hemoglobin A1c levels. Blood pressures were similar. Patients with MI were significantly older (65 vs. 60 years).
In cardiac-specific measures, left ventricular ejection fraction was similar, as was left ventricular mass, end diastolic volume, and left atrial volume. There were however, other very important differences, Dr. Swoboda noted.
Imaging included a measure called “feature tracking analysis,” which measured the peak global longitudinal strain, systolic strain rate, and early and late diastolic strain rates during contraction. This analysis noted a significant difference in global longitudinal strain between the MI and non-MI groups.
Ventricular filling velocities as measured by the E/A ratio on ECG were also significantly different between the MI and non-MI groups (0.75 vs. 0.89, respectively). ECG also found pathologic Q waves in significantly more MI patients (24% vs. 7%).
Finally, the serum biomarker panel showed a very strong increase in B-type natriuretic peptide (NT-proBNP) among MI patients, compared with non-MI patients (105 vs. 52 ng/L). There were no significant differences in the other biomarkers, including C-reactive protein and high-sensitive cardiac troponin.
Dr. Swoboda and his team then compiled these findings into a composite measure, assigning them optimum cutoff measures:
• Age older than 62 years.
• E/A ratio 0.72 or lower.
• Global longitudinal strain of at least 18.4%.
• NT-proBNP more than 29 ng/L.
The system resulted in a diagnostic accuracy AUC of 0.85 – significantly better than any of the AUCs generated by the individual components. All patients who scored 0 or 1 were free of MI. Among the 28 with a score of 2, only three had experienced a silent MI. Among the 21 with a score of 3, seven had experienced a silent MI and 14 had not. Among the 16 with a score of 4, seven had experienced a silent MI and nine had not.
While Dr. Swoboda called the screening method “simple” during discussion, a colleague in the audience disagreed with that.
“A simple test is something like a blood test only, not an MRI. Not imaging. That is expensive and takes time,” said Naveed Sattar, MD, of the University of Glasgow, Scotland. “However, I do think your data add more to the evidence that BNP can be a really valuable marker of cardiovascular risk in patients with diabetes.”
Dr. Sattar recently examined the value of cardiac serum biomarkers in predicting cardiovascular disease and mortality in nearly 100,000 people without a history of heart disease. In these subjects, he wrote, “NT-proBNP assessment strongly predicted first-onset heart failure and augmented coronary heart disease and stroke prediction, suggesting that NT-proBNP concentration assessment could be used to integrate heart failure into cardiovascular disease primary prevention.”
The paper appeared online in Lancet Diabetes in September (Lancet Diab. 2016. doi: 10.1016/S2213-8587[16]30196-6).
Dr. Swoboda agreed that data continue to support the increased use of NT-proBNP as a marker of heart disease.
“I think that in the future, diabetes medicine is moving toward individualized patient care, based on individualized risk factors. The future of assessing asymptomatic cardiac patients might be a combination of BNP and MRI.”
Dr. Swoboda had no financial disclosures. Some of Dr. Sattar’s coauthors reported relationships with pharmaceutical companies.
AT EASD 2016
Key clinical point: A four-component screen accurately identified silent myocardial infarction in asymptomatic patients with type 2 diabetes
Major finding: The tool had an 82% sensitivity and 72% specificity for silent MI.
Data source: It was created in a cohort of 100 patients with type 2 diabetes and no history of heart disease.
Disclosures: Dr. Swoboda had no financial disclosures.

Study: Health spending related to opioid treatment rose more than 1,300%
The nation’s ongoing opioid problem comes with staggering physical and emotional costs to patients and families. But the dollar cost to the health system has been harder to peg. Now a new report shows a more than 1,300 percent rise in spending by health insurers in a four-year period on patients with a diagnosis of opioid dependence or abuse.
From 2011 to 2015, insurers’ payments to hospitals, laboratories, treatment centers and other medical providers for these patients grew from $32 million to $446 million – a 1,375 percent increase.
While that’s a small portion of the overall spending on medical care in the United States, the rapid rise is cause for concern, says Robin Gelburd, president of Fair Health, a nonprofit databank that provides cost information to the health industry and consumers.
“That really shows the stress on the health system and the impact on the individuals,” said Gelburd.
The Fair Health study found a sharp difference in how much insurers spend on individual patients with such a diagnosis.
On average, insurers spend $3,435 a year on an individual patient, but for those with an opioid dependence or abuse diagnosis, that amount jumps to $19,333. Those numbers reflect what insurers actually paid. The report also includes data on what providers charged, amounts that are lowered by their contracts with insurers.
The study, set to be released Tuesday, builds on one Fair Health released in early August that found a 3,000 percent increase in the volume of insurance claims related to opioid dependence diagnoses between 2007 and 2014.
The latest study – part of a series – offers amounts associated with claims billed by providers and paid by insurers for the types of medical services used.
Both studies use de-identified claims data from insurers representing more than 150 million insured Americans who either have insurance through work or buy coverage on their own.
There have been other efforts by several researchers to quantify the cost of the opioid problem on the overall economy, estimated in the tens of billions of dollars.
The new report adds to the available data “that it’s not just the human cost associated with the opioid crisis that is enormous, but also that the economic costs are staggering,” said Dr. Andrew Kolodny, senior scientist at Brandeis University. He did not work on the study.
The surge in spending on patients with opioid diagnoses is likely a combination of factors, the report notes. As media attention focuses on drug dependency, more people may be seeking treatment. At the same time, prescription and illegal use of narcotics may also be increasing.
The study found that emergency room visits and laboratory tests accounted for much of the spending.
Based on claims volume, the fastest-growing set of services in terms of utilization were for alcohol or drug therapy. Lab tests, including checks for barbiturate or opioid use, were not far behind.
Researchers did not use 2015 data for lab test costs, noting that a change in billing codes was made that increased the number of categories – and, in some cases, appear to generate higher payments by insurers. It is too early to estimate the long-term effects of the change, Gelburd said.
The report gives some examples of the changes, however. For example, one billing code for a test on opiate use commonly brought in a $31 payment from insurers prior to the change. The two billing codes that replaced it now are commonly paid at $78 and $156.
The new billing codes may reflect new technology in testing, said Gelburd. She said some observers speculate that the rapid increase in lab spending might reflect that, with more patients in therapy, the tests are being used to ensure they are taking their proper medications and not abusing narcotics.
But the spending might also reflect a growing use of very expensive urine and blood tests when less expensive ones would be sufficient, said Kolodny.
“I worry about profiteering,” said Kolodny. “We do need tests, but not the expensive ones. A lot of clinics are making extra money off these lab tests.”
The overall increase in spending across all types of medical services “is a societal issue,” said Gelburd, who says policymakers need to ensure that changes are made to address the problem.
“Are medical school curricula adjusting to recognize the growing need for these services? Are insurers increasing the number of providers in their networks to ensure sufficient access? Are consumers being educated? It’s an issue that has to be dealt with in all quadrants.”
Kaiser Health News is a national health policy news service that is part of the nonpartisan Henry J. Kaiser Family Foundation.
First-generation DES looking good at 10 years
ROME – There’s good news for the millions of patients living with a first-generation metallic drug-eluting stent for coronary revascularization implanted in years past: The devices perform reassuringly well a full decade after implantation, Lorenz Räber, MD, reported at the annual congress of the European Society of Cardiology.
That’s the key message of the SIRTAX VERY LATE study, the only randomized trial of first-generation drug-eluting stents (DES) that didn’t turn out the lights at a maximum of 5 years of follow-up. In fact, at the 10-year mark, SIRTAX VERY LATE shows that regardless of whether the first-generation DES was paclitaxel- or sirolimus-eluting, the risk of major adverse cardiac events due to device failure was substantially lower in the second half-decade than in the first 5 years after deployment, according to Dr. Räber of Bern (Switzerland) University Hospital.

More specifically, the cumulative risk of ischemia-driven target lesion revascularization was 14.6% at 5 years and 17.7% at 10 years, while the 5- and 10-year cumulative risks of definite stent thrombosis were 4.5% and 5.6%, respectively.
The annual risk of ischemia-driven target lesion revascularization dropped by 64%, from 1.8%/year during years 1-5 to 0.7% during years 6-10. Similarly, the annual risk of definite stent thrombosis fell from 0.67%/year to 0.23%/year after year 5, a 69% relative risk reduction. And importantly, these attenuations in risk occurred independent of age.
“The lower risk of late clinical events suggests stabilization of delayed arterial healing over time after first-generation DES implantation, with reduced chronic inflammation and neoatherosclerosis,” he said.
This is reassuring in light of the stormy history of the first-generation DES. Three years after the devices came on the U.S. market, the so-called ESC firestorm erupted. At the 2006 ESC congress, investigators presented meta-analyses suggesting the devices carried a possible late increased thrombotic risk beyond the then-recommended 3-6 months of prescribed dual-antiplatelet therapy. The use of these devices declined sharply in response, even though a Food and Drug Administration advisory panel charged with looking at the totality of evidence concluded that concerns about thrombosis didn’t outweigh the benefits of the first-generation DES over bare-metal stents.
The reductions in very late stent thrombosis and ischemia-driven target lesion revascularization beyond 5 years seen in the SIRTAX VERY LATE trial occurred despite the fact that only 15% of patients were on dual-antiplatelet therapy throughout the first 5 years and 11% were on dual-antiplatelet therapy afterwards, Dr. Räber noted.
“Our findings may have implications for secondary prevention after PCI with a first-generation DES, including the need for long-term antiplatelet therapy,” the cardiologist added.
The previously reported 5-year results of SIRTAX (the Sirolimus-Eluting Versus Paclitaxel-Eluting Stents for Coronary Revascularization trial) showed a steady increase over time in late lumen loss and an ongoing risk of very late stent thrombosis (Circulation. 2011 Jun 21;123(24):2819-28). Much the same was seen at the 5-year mark in the other major trials of first-generation DES, including RAVEL, SIRIUS, and TAXUS.
However, all those studies ended at 5 years, leaving unanswered the key question of what happens later. Cardiologists have wondered if the first-generation DES they put in their patients years ago were associated with a continued steady climb in the risk of device-related adverse events, or if the risk plateaued or even dropped off. The SIRTAX VERY LATE study was conducted in order to provide answers.
SIRTAX included 1,012 Swiss patients randomized to coronary revascularization using a first-generation sirolimus- or paclitaxel-eluting stent in 2003-2004. Roughly half had stable coronary artery disease and half presented with acute coronary syndromes. The 10-year follow-up conducted in the SIRTAX VERY LATE study captured 895 (88%) of the original 1,012 subjects.
The cumulative incidence of major cardiac adverse events – a composite of cardiac death, MI, and ischemia-driven target lesion revascularization – was 20.8% at 5 years and 33.8% at 10 years. The rate was similar between years 1-5 and 6-10.
The cumulative all-cause mortality rate was 10.4% at 5 years and 24.2% at 10 years. The rate was 2.0%/year during years 1-5 and accelerated significantly to 3.1%/year in years 6-10. However, this increase appears to be largely due to the background impact of advancing age rather than to any effect of having a first-generation DES. The 5- and 10-year all-cause mortality rates in the age- and sex-matched general Swiss population are similar to those seen in SIRTAX VERY LATE, at 9.6% and 22.1%, respectively, the cardiologist observed.
The cumulative incidence of MI in the study population was 7% at 5 years and 9.7% at 10 years. Between years 1-5 the rate was 0.9%/year, dropping to 0.6%/year during years 6-10.
One of the useful potential purposes for the new SIRTAX VERY LATE follow-up data beyond 5 years is that the results could serve as a benchmark in evaluating the long-term safety and efficacy of the much newer drug-eluting fully bioresorbable vascular scaffolds, since the potential benefits of these new devices may not appear until relatively late, after the devices themselves have disappeared. SIRTAX VERY LATE sets the bar for stent-related adverse events 5 years or more after device implantation at an annual risk of less than 0.3%/year for stent thrombosis and less than 1%/year for ischemia-driven target lesion revascularization.
Session co-chair Hector Bueno, MD, drew attention to the fact that no significant differences in clinical outcomes were seen at either 5 or 10 years between the sirolimus- and paclitaxel-eluting stent recipients. That’s noteworthy because more than a decade ago when the primary endpoint of SIRTAX was reported, much was made of the finding that the 9-month rate of major adverse cardiac events was significantly lower in the sirolimus-eluting stent group (N Engl J Med. 2005 Aug 18;353[7]:653-62). Over time, any outcome differences between the two devices were erased, observed Dr. Bueno of Complutense University of Madrid.
The SIRTAX VERY LATE study was funded by grants from Bern University Hospital. Dr. Räber reported having no relevant financial interests.
Simultaneously with his presentation in Rome at ESC 2016, the study results were published online (Eur Heart J. 2016 Aug 30. doi: 10.1093/eurheartj/ehw343).
ROME – There’s good news for the millions of patients living with a first-generation metallic drug-eluting stent for coronary revascularization implanted in years past: The devices perform reassuringly well a full decade after implantation, Lorenz Räber, MD, reported at the annual congress of the European Society of Cardiology.
That’s the key message of the SIRTAX VERY LATE study, the only randomized trial of first-generation drug-eluting stents (DES) that didn’t turn out the lights at a maximum of 5 years of follow-up. In fact, at the 10-year mark, SIRTAX VERY LATE shows that regardless of whether the first-generation DES was paclitaxel- or sirolimus-eluting, the risk of major adverse cardiac events due to device failure was substantially lower in the second half-decade than in the first 5 years after deployment, according to Dr. Räber of Bern (Switzerland) University Hospital.
More specifically, the cumulative risk of ischemia-driven target lesion revascularization was 14.6% at 5 years and 17.7% at 10 years, while the 5- and 10-year cumulative risks of definite stent thrombosis were 4.5% and 5.6%, respectively.
The annual risk of ischemia-driven target lesion revascularization dropped by 64%, from 1.8%/year during years 1-5 to 0.7% during years 6-10. Similarly, the annual risk of definite stent thrombosis fell from 0.67%/year to 0.23%/year after year 5, a 69% relative risk reduction. And importantly, these attenuations in risk occurred independent of age.
“The lower risk of late clinical events suggests stabilization of delayed arterial healing over time after first-generation DES implantation, with reduced chronic inflammation and neoatherosclerosis,” he said.
This is reassuring in light of the stormy history of the first-generation DES. Three years after the devices came on the U.S. market, the so-called ESC firestorm erupted. At the 2006 ESC congress, investigators presented meta-analyses suggesting the devices carried a possible late increased thrombotic risk beyond the then-recommended 3-6 months of prescribed dual-antiplatelet therapy. The use of these devices declined sharply in response, even though a Food and Drug Administration advisory panel charged with looking at the totality of evidence concluded that concerns about thrombosis didn’t outweigh the benefits of the first-generation DES over bare-metal stents.
The reductions in very late stent thrombosis and ischemia-driven target lesion revascularization beyond 5 years seen in the SIRTAX VERY LATE trial occurred despite the fact that only 15% of patients were on dual-antiplatelet therapy throughout the first 5 years and 11% were on dual-antiplatelet therapy afterwards, Dr. Räber noted.
“Our findings may have implications for secondary prevention after PCI with a first-generation DES, including the need for long-term antiplatelet therapy,” the cardiologist added.
The previously reported 5-year results of SIRTAX (the Sirolimus-Eluting Versus Paclitaxel-Eluting Stents for Coronary Revascularization trial) showed a steady increase over time in late lumen loss and an ongoing risk of very late stent thrombosis (Circulation. 2011 Jun 21;123(24):2819-28). Much the same was seen at the 5-year mark in the other major trials of first-generation DES, including RAVEL, SIRIUS, and TAXUS.
However, all those studies ended at 5 years, leaving unanswered the key question of what happens later. Cardiologists have wondered if the first-generation DES they put in their patients years ago were associated with a continued steady climb in the risk of device-related adverse events, or if the risk plateaued or even dropped off. The SIRTAX VERY LATE study was conducted in order to provide answers.
SIRTAX included 1,012 Swiss patients randomized to coronary revascularization using a first-generation sirolimus- or paclitaxel-eluting stent in 2003-2004. Roughly half had stable coronary artery disease and half presented with acute coronary syndromes. The 10-year follow-up conducted in the SIRTAX VERY LATE study captured 895 (88%) of the original 1,012 subjects.
The cumulative incidence of major cardiac adverse events – a composite of cardiac death, MI, and ischemia-driven target lesion revascularization – was 20.8% at 5 years and 33.8% at 10 years. The rate was similar between years 1-5 and 6-10.
The cumulative all-cause mortality rate was 10.4% at 5 years and 24.2% at 10 years. The rate was 2.0%/year during years 1-5 and accelerated significantly to 3.1%/year in years 6-10. However, this increase appears to be largely due to the background impact of advancing age rather than to any effect of having a first-generation DES. The 5- and 10-year all-cause mortality rates in the age- and sex-matched general Swiss population are similar to those seen in SIRTAX VERY LATE, at 9.6% and 22.1%, respectively, the cardiologist observed.
The cumulative incidence of MI in the study population was 7% at 5 years and 9.7% at 10 years. Between years 1-5 the rate was 0.9%/year, dropping to 0.6%/year during years 6-10.
One of the useful potential purposes for the new SIRTAX VERY LATE follow-up data beyond 5 years is that the results could serve as a benchmark in evaluating the long-term safety and efficacy of the much newer drug-eluting fully bioresorbable vascular scaffolds, since the potential benefits of these new devices may not appear until relatively late, after the devices themselves have disappeared. SIRTAX VERY LATE sets the bar for stent-related adverse events 5 years or more after device implantation at an annual risk of less than 0.3%/year for stent thrombosis and less than 1%/year for ischemia-driven target lesion revascularization.
Session co-chair Hector Bueno, MD, drew attention to the fact that no significant differences in clinical outcomes were seen at either 5 or 10 years between the sirolimus- and paclitaxel-eluting stent recipients. That’s noteworthy because more than a decade ago when the primary endpoint of SIRTAX was reported, much was made of the finding that the 9-month rate of major adverse cardiac events was significantly lower in the sirolimus-eluting stent group (N Engl J Med. 2005 Aug 18;353[7]:653-62). Over time, any outcome differences between the two devices were erased, observed Dr. Bueno of Complutense University of Madrid.
The SIRTAX VERY LATE study was funded by grants from Bern University Hospital. Dr. Räber reported having no relevant financial interests.
Simultaneously with his presentation in Rome at ESC 2016, the study results were published online (Eur Heart J. 2016 Aug 30. doi: 10.1093/eurheartj/ehw343).
AT THE ESC CONGRESS 2016
Key clinical point: The annual risks of ischemia-driven target lesion revascularization and stent thrombosis significantly decreased starting 5 years after implantation of a first-generation sirolimus- or paclitaxel-eluting stent.
Major finding: The annual risk of ischemia-driven target lesion revascularization was 1.8%/year between 1 and 5 years after implantation of a first-generation drug-eluting stent, but only 0.7%/year during years 6-10.
Data source: This was a unique extended 10-year follow-up of 88% of the original 1,012 participants in a randomized, assessor-blinded Swiss trial of coronary revascularization using a first-generation sirolimus- or paclitaxel-eluting stent.
Disclosures: The SIRTAX VERY LATE study was funded by grants from Bern University Hospital. The presenter reported having no relevant financial interests.

Lowering LDL-C yields usual benefits in rheumatoid arthritis
Lowering LDL cholesterol level using statins appears to yield the same cardiovascular benefits in rheumatoid arthritis patients as in the general population, a study showed.
Cardiovascular (CV) disease is a common comorbidity in rheumatoid arthritis (RA) patients, who carry an estimated 50% increased risk of CV events or early mortality, compared with the general population. Yet epidemiologic studies have reported that RA patients generally have lower lipid levels than members of the general population, and studies assessing statin therapy in this patient population have yielded mixed results, said JaeJin An, PhD, of the department of pharmacy practice and administration, Western University of Health Sciences, Pomona, Calif., and her associates.

This may be because RA alters lipid metabolism in a complex manner, due to its associated systemic inflammation, the effects of RA drug therapy, and several genetic factors that characterize RA, they noted.
To assess the benefit of statin therapy for primary prevention in RA, the investigators performed a retrospective cohort study using the electronic medical records of adults enrolled in a single large California health care system. They focused on RA patients taking at least one disease-modifying antirheumatic drug who also had hyperlipidemia. In one cohort, 1,522 RA patients were matched for age and sex with 6,511 control subjects who were also in the health care system, and in a second cohort 1,746 RA patients were matched with 2,554 patients who had osteoarthritis (OA).
These study participants were followed for a median of 3-4 years for the development of MI, angina, stroke, transient ischemic attack, intermittent claudication, heart failure, or CV death. Lipid-lowering medications they were taking included atorvastatin, simvastatin, fluvastatin, lovastatin, rosuvastatin, and pravastatin. The study was supported by Bristol-Myers Squibb, maker of pravastatin.
Similar proportions of patients in the three study groups lowered their LDL-C level to clinically recommended levels based on their baseline CV risk: 79% of the RA group, 79% of the general control group, and 80% of the OA control group.
There were no differences in the link between lowering LDL-C level and improved CV outcomes among the three study groups. A reduction in LDL-C was associated with a 29% reduction in the risk of CV events in the RA group plus the general control group, and it was associated with a 50% reduction in the risk of CV events in the RA group plus the OA control group, the investigators reported (J Rheumatol. 2016 Sep 1. doi: 10.3899/jrheum.160110). In a further analysis of the data that adjusted for multiple CV risk factors, lowering LDL-C levels was associated with a similar degree of reduction in CV events in RA patients in the first cohort (hazard ratio, 0.68) and the second cohort (HR, 0.67).
“Our analyses further verified that having RA itself increased CV risk by 76% [compared with general control patients], even after adjusting for traditional risk factors such as age, sex, smoking, hypertension, and diabetes. These findings are consistent with previous findings, which suggest about a 50% higher risk of CV events and mortality among patients with RA relative to the general population,” Dr. An and her associates wrote.
Their results also are consistent with those of the recently reported TRACE-RA (Trial of Atorvastatin for the Primary Prevention of Cardiovascular Events in Rheumatoid Arthritis) study, which found that lipid-lowering therapy with atorvastatin was associated with a 34% reduction in the primary composite CV endpoint in RA patients.
Bristol-Myers Squibb supported the study, and several coauthors are employees of the company.
Lowering LDL cholesterol level using statins appears to yield the same cardiovascular benefits in rheumatoid arthritis patients as in the general population, a study showed.
Cardiovascular (CV) disease is a common comorbidity in rheumatoid arthritis (RA) patients, who carry an estimated 50% increased risk of CV events or early mortality, compared with the general population. Yet epidemiologic studies have reported that RA patients generally have lower lipid levels than members of the general population, and studies assessing statin therapy in this patient population have yielded mixed results, said JaeJin An, PhD, of the department of pharmacy practice and administration, Western University of Health Sciences, Pomona, Calif., and her associates.
This may be because RA alters lipid metabolism in a complex manner, due to its associated systemic inflammation, the effects of RA drug therapy, and several genetic factors that characterize RA, they noted.
To assess the benefit of statin therapy for primary prevention in RA, the investigators performed a retrospective cohort study using the electronic medical records of adults enrolled in a single large California health care system. They focused on RA patients taking at least one disease-modifying antirheumatic drug who also had hyperlipidemia. In one cohort, 1,522 RA patients were matched for age and sex with 6,511 control subjects who were also in the health care system, and in a second cohort 1,746 RA patients were matched with 2,554 patients who had osteoarthritis (OA).
These study participants were followed for a median of 3-4 years for the development of MI, angina, stroke, transient ischemic attack, intermittent claudication, heart failure, or CV death. Lipid-lowering medications they were taking included atorvastatin, simvastatin, fluvastatin, lovastatin, rosuvastatin, and pravastatin. The study was supported by Bristol-Myers Squibb, maker of pravastatin.
Similar proportions of patients in the three study groups lowered their LDL-C level to clinically recommended levels based on their baseline CV risk: 79% of the RA group, 79% of the general control group, and 80% of the OA control group.
There were no differences in the link between lowering LDL-C level and improved CV outcomes among the three study groups. A reduction in LDL-C was associated with a 29% reduction in the risk of CV events in the RA group plus the general control group, and it was associated with a 50% reduction in the risk of CV events in the RA group plus the OA control group, the investigators reported (J Rheumatol. 2016 Sep 1. doi: 10.3899/jrheum.160110). In a further analysis of the data that adjusted for multiple CV risk factors, lowering LDL-C levels was associated with a similar degree of reduction in CV events in RA patients in the first cohort (hazard ratio, 0.68) and the second cohort (HR, 0.67).
“Our analyses further verified that having RA itself increased CV risk by 76% [compared with general control patients], even after adjusting for traditional risk factors such as age, sex, smoking, hypertension, and diabetes. These findings are consistent with previous findings, which suggest about a 50% higher risk of CV events and mortality among patients with RA relative to the general population,” Dr. An and her associates wrote.
Their results also are consistent with those of the recently reported TRACE-RA (Trial of Atorvastatin for the Primary Prevention of Cardiovascular Events in Rheumatoid Arthritis) study, which found that lipid-lowering therapy with atorvastatin was associated with a 34% reduction in the primary composite CV endpoint in RA patients.
Bristol-Myers Squibb supported the study, and several coauthors are employees of the company.
FROM JOURNAL OF RHEUMATOLOGY
Key clinical point: Lowering LDL cholesterol yields the same cardiovascular benefits in rheumatoid arthritis patients as in the general population.
Major finding: A reduction in LDL-C was associated with a 29% reduction in the risk of cardiovascular events in the RA group plus the general control group, and with a 50% reduction in the risk of CV events in the RA group plus the osteoarthritis control group.
Data source: An industry-sponsored retrospective cohort study involving 3,268 RA patients, 6,511 general controls, and 2,554 controls with osteoarthritis.
Disclosures: Bristol-Myers Squibb supported the study, and several coauthors are employees of the company.

Low caregiver self-care linked with depression, anxiety
There is increased anxiety and depression among family caregivers who do not take care of themselves, according to a study to be presented at the 2016 ASCO Palliative Care in Oncology Symposium.
Nearly a quarter of 294 caregivers of Medicare patients with advanced cancer reported high depression scores (23%) and 34% reported borderline or high anxiety scores. Worse caregiver anxiety, depression, and mental health–related quality of life scores were significantly associated with lower scores in every self-care measure (P less than .05 for all). Lower self-care behavior scores were associated with longer durations, higher hours, and more days/week of caregiving and with fair or poor patient health.
The cross-sectional survey was conducted in community settings of eight cancer centers in Alabama, Florida, and Tennessee. The family caregivers of Medicare beneficiaries diagnosed with pancreatic, lung, brain, ovarian, head & neck, hematologic, or stage IV cancer completed measures of self-care behaviors, including health responsibility, physical activity, nutrition, spiritual growth, interpersonal relations, stress management, and sleep. Caregivers averaged 66 years and were mostly female (72.8%), white (91.2%), Protestant (76.2%), retired (54.4%), and patients’ spouse/partner (60.2%). Approximately half were rural dwellers (46.9%) and had incomes less than $50,000 (53.8%). The majority provided support 6-7 days per week (71%) for greater than 1 year (68%).
“This research serves as an important call to action for the oncology community to implement support networks and services that care for the caregiver,” ASCO representative Andrew Epstein, MD, of Memorial Sloan Kettering Cancer Center, New York, said in a written statement ahead of the symposium.
“We hope our research rallies the oncology palliative care communities to develop assessment tools and services that support caregivers,” lead author James Nicholas Dionne-Odom, PhD, RN, of the University of Alabama at Birmingham, said in the statement.
On Twitter @jessnicolecraig
FROM THE 2016 ASCO PALLIATIVE CARE IN ONCOLOGY SYMPOSIUM
Key clinical point: There is increased anxiety and depression among family caregivers who do not take care of themselves.
Major finding: Worse caregiver anxiety, depression, and mental health–related quality of life scores were significantly associated with lower scores in every self-care measure (P less than .05 for all).
Data source: A multistate and cross-sectional survey of 294 family caregivers.
Disclosures: The University of Alabama at Birmingham funded the study. One investigator reported receiving financial compensation and honoraria from Medscape, Carevive Systems, and PackHealth.
Doctors urge Congress to pass Zika funding
Federal health officials, pediatricians, and ob.gyns. are imploring Congress to pass an appropriations bill with sufficient money to fight the growing threat of the Zika virus.
“Funding for Zika research, for prevention, and for control efforts – including mosquito surveillance and control – is essentially all spent,” Beth P. Bell, MD, director of the CDC’s National Center for Emerging and Zoonotic Infectious Diseases, said during a press conference. The Obama administration “has already transferred millions of dollars from other important programs to help with the Zika response, [but] without additional resources from Congress, critical public health work may not be accomplished.”

President Obama asked Congress in February to appropriate $1.9 billion to address all aspects of the Zika virus situation in the United States; partisan politics surrounding funding for Planned Parenthood have derailed passage of the legislation to date.
Without additional, specific funding, development of a Zika vaccine would be severely limited, and virtually no funds would be available to conduct multitiered studies that are critical for protecting both women and children from the virus’ devastating effects, Dr. Bell said. Additionally, money allocated to state health departments for the management of patients with Zika virus would no longer be available. Development of tests for early diagnosis would be slowed or halted altogether.
“Allowing this to happen needlessly puts the American people at risk, and will result in more Zika infections and potentially more babies being born with microcephaly and other birth defects,” Dr. Bell added. “Congress has come back from their recess, and we hope that they will do the right thing.”
The American Congress of Obstetricians and Gynecologists “continues to develop, update, and issue guidance on the risks, prevention, assessment, and treatment of the Zika virus,” primarily through its practice advisories and resources available jointly through the CDC, ACOG president Thomas Gellhaus, MD, said.
“The biggest impact Zika has is on babies, and they are our future,” said Karen Remley, MD, executive director and CEO of the American Academy of Pediatricians, adding that funding is crucial to continue monitoring children who have been born with birth defects, as the long-term development of these and other issues is new territory for doctors across the United States and its territories.
As Congress prepared to adjourn in advance of the primary elections, Senate Majority Leader Mitch McConnell noted that some progress is being made on Zika funding.
“We’ve made a lot of important progress already,” Sen. McConnell said Sept. 12 on the Senate floor. “I expect to move forward this week on a continuing resolution through Dec. 9 at last year’s enacted levels and include funds for Zika control and our veterans. Talks are continuing, and leaders from both parties will meet later this afternoon at the White House to discuss the progress and path forward.”
Federal health officials, pediatricians, and ob.gyns. are imploring Congress to pass an appropriations bill with sufficient money to fight the growing threat of the Zika virus.
“Funding for Zika research, for prevention, and for control efforts – including mosquito surveillance and control – is essentially all spent,” Beth P. Bell, MD, director of the CDC’s National Center for Emerging and Zoonotic Infectious Diseases, said during a press conference. The Obama administration “has already transferred millions of dollars from other important programs to help with the Zika response, [but] without additional resources from Congress, critical public health work may not be accomplished.”
President Obama asked Congress in February to appropriate $1.9 billion to address all aspects of the Zika virus situation in the United States; partisan politics surrounding funding for Planned Parenthood have derailed passage of the legislation to date.
Without additional, specific funding, development of a Zika vaccine would be severely limited, and virtually no funds would be available to conduct multitiered studies that are critical for protecting both women and children from the virus’ devastating effects, Dr. Bell said. Additionally, money allocated to state health departments for the management of patients with Zika virus would no longer be available. Development of tests for early diagnosis would be slowed or halted altogether.
“Allowing this to happen needlessly puts the American people at risk, and will result in more Zika infections and potentially more babies being born with microcephaly and other birth defects,” Dr. Bell added. “Congress has come back from their recess, and we hope that they will do the right thing.”
The American Congress of Obstetricians and Gynecologists “continues to develop, update, and issue guidance on the risks, prevention, assessment, and treatment of the Zika virus,” primarily through its practice advisories and resources available jointly through the CDC, ACOG president Thomas Gellhaus, MD, said.
“The biggest impact Zika has is on babies, and they are our future,” said Karen Remley, MD, executive director and CEO of the American Academy of Pediatricians, adding that funding is crucial to continue monitoring children who have been born with birth defects, as the long-term development of these and other issues is new territory for doctors across the United States and its territories.
As Congress prepared to adjourn in advance of the primary elections, Senate Majority Leader Mitch McConnell noted that some progress is being made on Zika funding.
“We’ve made a lot of important progress already,” Sen. McConnell said Sept. 12 on the Senate floor. “I expect to move forward this week on a continuing resolution through Dec. 9 at last year’s enacted levels and include funds for Zika control and our veterans. Talks are continuing, and leaders from both parties will meet later this afternoon at the White House to discuss the progress and path forward.”

Health sector claims 4 spots among top 10 lobbyers in 2016
Four of the 10 highest-spending lobbyers for the first half of 2016 were in the health sector, with Blue Cross/Blue Shield occupying the sector’s top spot by a relatively small margin, according to the Center for Responsive Politics.
The four health-sectors concerns filled spots 3-6 in the overall top 10. Blue Cross/Blue Shield spent almost $12.1 million on lobbying in the first half of the year, putting it just ahead of the Pharmaceutical Research and Manufacturers of America (PhRMA), which spent $11.8 million. The American Medical Association was next at $11.3 million, followed by the American Hospital Association at $10.9 million, the center reported on OpenSecrets.org.

After those four, the next-highest health-sector spender was Pfizer, which put up almost $6.2 million in lobbying – good for 18th place for the first half of 2016. The health sector itself was the highest spending of the 121 ranked, taking a $266 million bite out of the total $1.6 billion lobbying pie for the year so far, according to the center’s analysis of data downloaded from the Senate Office of Public Records on Aug. 9.
The perennial leading spender on lobbying, the U.S. Chamber of Commerce, was well ahead of second place, with its $52.3 million more than doubling the $21.4 million spent by the National Association of Realtors. The two groups have finished 1-2 in lobbying spending every year since 2012, and the Chamber of Commerce has been the leading spender since 2001, data on OpenSecrets show.
Four of the 10 highest-spending lobbyers for the first half of 2016 were in the health sector, with Blue Cross/Blue Shield occupying the sector’s top spot by a relatively small margin, according to the Center for Responsive Politics.
The four health-sectors concerns filled spots 3-6 in the overall top 10. Blue Cross/Blue Shield spent almost $12.1 million on lobbying in the first half of the year, putting it just ahead of the Pharmaceutical Research and Manufacturers of America (PhRMA), which spent $11.8 million. The American Medical Association was next at $11.3 million, followed by the American Hospital Association at $10.9 million, the center reported on OpenSecrets.org.
After those four, the next-highest health-sector spender was Pfizer, which put up almost $6.2 million in lobbying – good for 18th place for the first half of 2016. The health sector itself was the highest spending of the 121 ranked, taking a $266 million bite out of the total $1.6 billion lobbying pie for the year so far, according to the center’s analysis of data downloaded from the Senate Office of Public Records on Aug. 9.
The perennial leading spender on lobbying, the U.S. Chamber of Commerce, was well ahead of second place, with its $52.3 million more than doubling the $21.4 million spent by the National Association of Realtors. The two groups have finished 1-2 in lobbying spending every year since 2012, and the Chamber of Commerce has been the leading spender since 2001, data on OpenSecrets show.
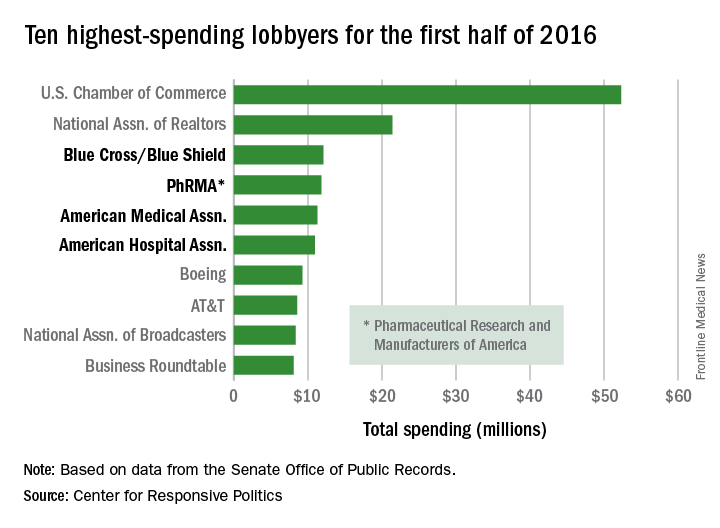
Fact or Fiction: Is Orthopedic Follow-Up Worse for Patients Who Sustain Penetrating Trauma?
There is a paucity of literature on how mechanism of injury may be associated with patient retention. Failure to attend outpatient clinics is a form of noncompliance and a major obstacle to safe, effective, and efficient healthcare delivery. Noncompliance may lead to increased patient morbidity and carries substantial financial implications for the healthcare system.1,2 In addition to these direct patient and healthcare issues, loss of patient follow-up or the belief of potential loss of follow-up of penetrating trauma patients may also significantly affect research studies. These patients often may be excluded from studies, even if they might otherwise meet inclusion criteria, because of concerns that they are unlikely to follow-up after leaving hospital. Is this myth or fact? To validate or to disprove this selection bias, we conducted a study in which we retrospectively evaluated long bone fractures caused by either penetrating or blunt trauma.
Methods
After obtaining Institutional Review Board approval for this study, we used the trauma database of an American College of Surgeons–verified level I trauma center in a major Midwest metropolitan area to compile a list of all cases of long bone fractures caused by penetrating trauma between 2006 and 2009 (N = 132). Gunshot wounds were the mechanism of injury for the penetrating trauma. We also compiled a list of control cases—long bone fractures caused by blunt trauma in patients demographically matched to the penetrating group patients on sex, race, and age (N = 104) (Table). 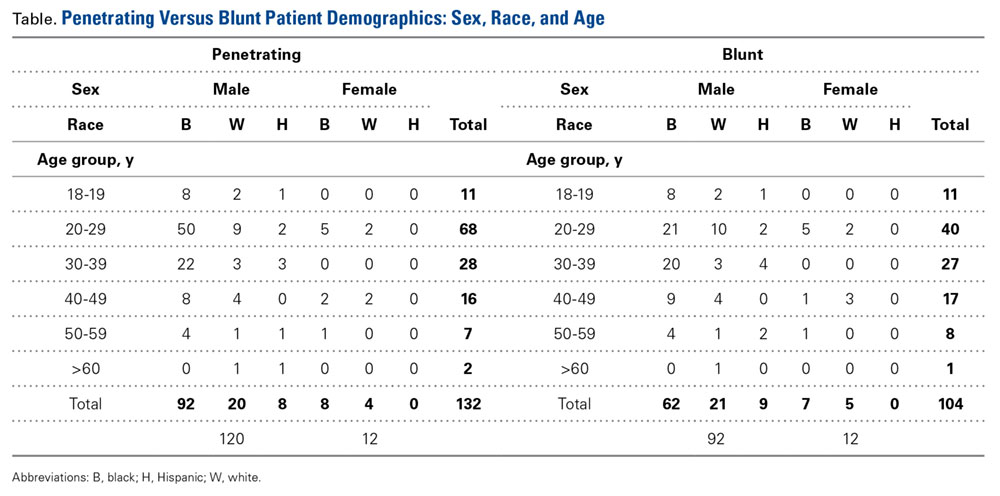
We retrospectively performed chart reviews to obtain patient follow-up data 3, 6, 9, and 12 months after injury from penetrating or blunt trauma. Patients scheduled to return on an as-needed basis were considered to have completed follow-up. The 2 groups were also statistically compared with respect to sex, race, age, surgical fixation, and history of tobacco, alcohol, or drug use.
SAS/STAT Version 8 (SAS Institute) was used to test the equality of survival functions (patient retention) for the penetrating and blunt trauma patient groups. A similar comparison was made for the categories of sex, race, and age. Pearson χ2 test was used to compare the 12-month survival rates of the 2 treatment groups across sex and race. Binary logistic regression was used to compare the 12-month survival rates of the 2 treatment groups removing the effect of age. A comparison of the frequency distributions of the 2 treatment groups with respect to alcohol use, tobacco use, drug use, and surgical intervention was also performed. Power analysis showed power of more than 90% in detecting at least a 20% difference in the follow-up rates between the penetrating and blunt trauma groups based on our sample size.
Results
There was no statistically significant difference (P = .736) between the penetrating and blunt trauma patients in terms of follow-up within 1 year after injury. At 1 year, 103 (78%) of the 132 penetrating trauma patients and 83 (80%) of the 104 blunt trauma patients were lost to follow-up (Figure). 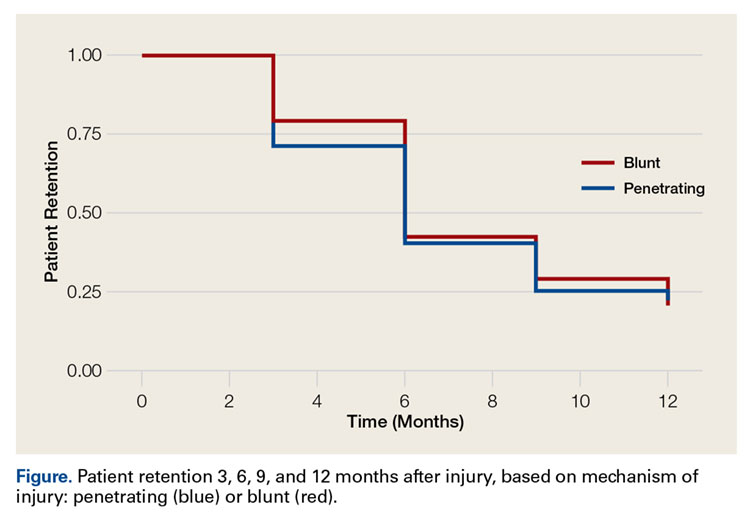
Discussion
Trauma outcomes historically have been difficult to determine because of lack of patient follow-up. In a simulation series, Zelle and colleagues3 found that the turning point from significant to nonsignificant varied from 15% to 75% loss of follow-up, thus compromising the validity of a study. They and others have emphasized the importance of establishing research protocols to minimize follow-up loss and eliminate reporting bias, ensure randomization, and report accurate outcomes.3-7
Very few have tried to investigate factors associated with failure to follow up after trauma.1,2,4 Leukhardt and colleagues4 evaluated the medical services that trauma patients follow up with most often. Orthopedic surgery had the largest portion of follow-up visits (37%), followed by the trauma surgery clinic and the emergency department (19% each). The authors also found that penetrating trauma patients were more likely to follow up, though more than 90% of the authors’ patients had blunt trauma. Although our study did not support their finding, it does call into question the commonly held belief that penetrating trauma patients are less likely to follow up, as our study found no difference in follow-up between penetrating and blunt trauma patients.
One of the most interesting findings in this retrospective study is that almost 80% of patients were lost to follow-up regardless of mechanism of injury. Most prospective studies try to reduce loss to follow-up to below 10%. This difference may be attributable to having a dedicated research team and the resources required to ensure follow-up of research patients to improve follow-up beyond baseline values. At our institution, 13 prospective studies (most multicenter) are currently enrolling patients, and the worst loss to follow-up has been 30%. The majority of the studies have loss to follow-up of 15% or less. This low rate represents a significant difference from the 80% “baseline” clinical loss to follow-up for the blunt and penetrating trauma patients treated at our institution, based on the findings of this study. We have been improving follow-up by having dedicated research coordinators call patients to remind them of their appointments (all clinic patients who are not research patients receive a recorded reminder); by having the hospital agree that research patients can be seen without charge (by the facility or the physician), which helps defray costs to the patient; and by excluding patients the principal investigator thinks are unlikely to follow up. Patients unlikely to follow up are routinely excluded by all centers that enroll in prospective studies. Although it is difficult to quantitate, this factor may play a large role in reducing loss to follow-up. Penetrating trauma patients historically routinely biased investigators to exclude them from studies, regardless of whether being considered unlikely to follow-up was an exclusion criterion. Our study results suggest this bias may not be valid.
Our study evaluated the role of mechanism of injury, penetrating or blunt trauma, and the respective orthopedic follow-up. There was no statistically significant difference in the 1-year follow-up rate based on the mechanism of injury. Our study was conducted with a well-matched control group that eliminated potential confounding variables, such as sex, race, age, tobacco use, and alcohol use. Although the prevalence of drug use was higher in the penetrating trauma group, patient retention seemed not to be affected by it. Surprisingly, patient loss to follow-up was extremely high (almost 80%) for both the penetrating and blunt trauma patient groups at the 1-year mark. Our findings call into question the commonly accepted theory that patients with penetrating injuries are less likely to follow up, at least in an academic level I trauma center population. We suggest that the commonly held belief that penetrating trauma patients are less likely to follow up may not be valid and that, when prospective studies are designed, it may not be appropriate to exclude penetrating trauma patients on this basis alone.
The primary limitation of this study is that it was performed at a single institution. Eighty-five percent of blunt trauma patients and 93% of penetrating trauma patients live in the county that is predominantly served by our institution, and electronic medical records from all major hospitals in the metropolitan area are linked, suggesting that the large majority of patients lost to follow-up do not seek further medical care, at least not from local facilities in our metropolitan area. A prospective multicenter study is being designed to help us gain a better understanding of the variables that affect musculoskeletal trauma patient follow-up and learn interventional strategies that can be used to improve patient retention.
Dr. Turner is an Orthopedic Surgeon, Rockwood Clinic, Spokane, Washington. Dr. Turner was a resident at the time the article was written. Dr. Hiatt is an Anesthesia Resident, University of Louisville Department of Anesthesiology and Perioperative Medicine, Louisville, Kentucky. Dr. Mullis is Chief of the Orthopaedic Trauma Service, Eskenazi Health, and Professor & Program Director, Indiana University School of Medicine Department of Orthopaedics, Indianapolis, Indiana.
Acknowledgments: This study was first reported in a poster presentation at the annual meeting of the Orthopaedic Trauma Association, October 2013, Phoenix, Arizona.
The authors gratefully acknowledge and thank Jyoti Sarkar, PhD, for his assistance with statistical analysis and manuscript preparation.
Am J Orthop. 2016;45(6):E331-E334. Copyright Frontline Medical Communications Inc. 2016. All rights reserved.
1. Sciberras N, Gregori A, Holt G. The ethical and practical challenges of patient noncompliance in orthopaedic surgery. J Bone Joint Surg Am. 2013;95(9):e61.
2. Sharma H, Crane E, Syme B, Foxworthy M. Non-compliance in orthopaedic surgery and its ethical challenges. Orthop Trauma. 2007;21(4):310-313.
3. Zelle BA, Bhandari M, Sanchez AI, Probst C, Pape HC. Loss of follow-up in orthopaedic trauma: is 80% follow-up still acceptable? J Orthop Trauma. 2013;27(3):177-181.
4. Leukhardt WH, Golob JF, McCoy AM, Fadlalla AM, Malangoni MA, Claridge JA. Follow-up disparities after trauma: a real problem for outcomes research. Am J Surg. 2010;199(3):348-352.
5. Shumaker SA, Dugan E, Bowen DJ. Enhancing adherence in randomized controlled clinical trials. Control Clin Trials. 2000;21(5 suppl):226S-232S.
6. Smith JS, Watts HG. Methods for locating missing patients for the purpose of long-term clinical studies. J Bone Joint Surg Am. 1998;80(3):431-438.
7. Sprague S, Leece P, Bhandari M, Tornetta P 3rd, Schemitsch E, Swiontkowski MF; S.P.R.I.N.T. Investigators. Limiting loss to follow-up in a multicenter randomized trial in orthopedic surgery. Control Clin Trials. 2003;24(6):719-725.
There is a paucity of literature on how mechanism of injury may be associated with patient retention. Failure to attend outpatient clinics is a form of noncompliance and a major obstacle to safe, effective, and efficient healthcare delivery. Noncompliance may lead to increased patient morbidity and carries substantial financial implications for the healthcare system.1,2 In addition to these direct patient and healthcare issues, loss of patient follow-up or the belief of potential loss of follow-up of penetrating trauma patients may also significantly affect research studies. These patients often may be excluded from studies, even if they might otherwise meet inclusion criteria, because of concerns that they are unlikely to follow-up after leaving hospital. Is this myth or fact? To validate or to disprove this selection bias, we conducted a study in which we retrospectively evaluated long bone fractures caused by either penetrating or blunt trauma.
Methods
After obtaining Institutional Review Board approval for this study, we used the trauma database of an American College of Surgeons–verified level I trauma center in a major Midwest metropolitan area to compile a list of all cases of long bone fractures caused by penetrating trauma between 2006 and 2009 (N = 132). Gunshot wounds were the mechanism of injury for the penetrating trauma. We also compiled a list of control cases—long bone fractures caused by blunt trauma in patients demographically matched to the penetrating group patients on sex, race, and age (N = 104) (Table).
We retrospectively performed chart reviews to obtain patient follow-up data 3, 6, 9, and 12 months after injury from penetrating or blunt trauma. Patients scheduled to return on an as-needed basis were considered to have completed follow-up. The 2 groups were also statistically compared with respect to sex, race, age, surgical fixation, and history of tobacco, alcohol, or drug use.
SAS/STAT Version 8 (SAS Institute) was used to test the equality of survival functions (patient retention) for the penetrating and blunt trauma patient groups. A similar comparison was made for the categories of sex, race, and age. Pearson χ2 test was used to compare the 12-month survival rates of the 2 treatment groups across sex and race. Binary logistic regression was used to compare the 12-month survival rates of the 2 treatment groups removing the effect of age. A comparison of the frequency distributions of the 2 treatment groups with respect to alcohol use, tobacco use, drug use, and surgical intervention was also performed. Power analysis showed power of more than 90% in detecting at least a 20% difference in the follow-up rates between the penetrating and blunt trauma groups based on our sample size.
Results
There was no statistically significant difference (P = .736) between the penetrating and blunt trauma patients in terms of follow-up within 1 year after injury. At 1 year, 103 (78%) of the 132 penetrating trauma patients and 83 (80%) of the 104 blunt trauma patients were lost to follow-up (Figure).
Discussion
Trauma outcomes historically have been difficult to determine because of lack of patient follow-up. In a simulation series, Zelle and colleagues3 found that the turning point from significant to nonsignificant varied from 15% to 75% loss of follow-up, thus compromising the validity of a study. They and others have emphasized the importance of establishing research protocols to minimize follow-up loss and eliminate reporting bias, ensure randomization, and report accurate outcomes.3-7
Very few have tried to investigate factors associated with failure to follow up after trauma.1,2,4 Leukhardt and colleagues4 evaluated the medical services that trauma patients follow up with most often. Orthopedic surgery had the largest portion of follow-up visits (37%), followed by the trauma surgery clinic and the emergency department (19% each). The authors also found that penetrating trauma patients were more likely to follow up, though more than 90% of the authors’ patients had blunt trauma. Although our study did not support their finding, it does call into question the commonly held belief that penetrating trauma patients are less likely to follow up, as our study found no difference in follow-up between penetrating and blunt trauma patients.
One of the most interesting findings in this retrospective study is that almost 80% of patients were lost to follow-up regardless of mechanism of injury. Most prospective studies try to reduce loss to follow-up to below 10%. This difference may be attributable to having a dedicated research team and the resources required to ensure follow-up of research patients to improve follow-up beyond baseline values. At our institution, 13 prospective studies (most multicenter) are currently enrolling patients, and the worst loss to follow-up has been 30%. The majority of the studies have loss to follow-up of 15% or less. This low rate represents a significant difference from the 80% “baseline” clinical loss to follow-up for the blunt and penetrating trauma patients treated at our institution, based on the findings of this study. We have been improving follow-up by having dedicated research coordinators call patients to remind them of their appointments (all clinic patients who are not research patients receive a recorded reminder); by having the hospital agree that research patients can be seen without charge (by the facility or the physician), which helps defray costs to the patient; and by excluding patients the principal investigator thinks are unlikely to follow up. Patients unlikely to follow up are routinely excluded by all centers that enroll in prospective studies. Although it is difficult to quantitate, this factor may play a large role in reducing loss to follow-up. Penetrating trauma patients historically routinely biased investigators to exclude them from studies, regardless of whether being considered unlikely to follow-up was an exclusion criterion. Our study results suggest this bias may not be valid.
Our study evaluated the role of mechanism of injury, penetrating or blunt trauma, and the respective orthopedic follow-up. There was no statistically significant difference in the 1-year follow-up rate based on the mechanism of injury. Our study was conducted with a well-matched control group that eliminated potential confounding variables, such as sex, race, age, tobacco use, and alcohol use. Although the prevalence of drug use was higher in the penetrating trauma group, patient retention seemed not to be affected by it. Surprisingly, patient loss to follow-up was extremely high (almost 80%) for both the penetrating and blunt trauma patient groups at the 1-year mark. Our findings call into question the commonly accepted theory that patients with penetrating injuries are less likely to follow up, at least in an academic level I trauma center population. We suggest that the commonly held belief that penetrating trauma patients are less likely to follow up may not be valid and that, when prospective studies are designed, it may not be appropriate to exclude penetrating trauma patients on this basis alone.
The primary limitation of this study is that it was performed at a single institution. Eighty-five percent of blunt trauma patients and 93% of penetrating trauma patients live in the county that is predominantly served by our institution, and electronic medical records from all major hospitals in the metropolitan area are linked, suggesting that the large majority of patients lost to follow-up do not seek further medical care, at least not from local facilities in our metropolitan area. A prospective multicenter study is being designed to help us gain a better understanding of the variables that affect musculoskeletal trauma patient follow-up and learn interventional strategies that can be used to improve patient retention.
Dr. Turner is an Orthopedic Surgeon, Rockwood Clinic, Spokane, Washington. Dr. Turner was a resident at the time the article was written. Dr. Hiatt is an Anesthesia Resident, University of Louisville Department of Anesthesiology and Perioperative Medicine, Louisville, Kentucky. Dr. Mullis is Chief of the Orthopaedic Trauma Service, Eskenazi Health, and Professor & Program Director, Indiana University School of Medicine Department of Orthopaedics, Indianapolis, Indiana.
Acknowledgments: This study was first reported in a poster presentation at the annual meeting of the Orthopaedic Trauma Association, October 2013, Phoenix, Arizona.
The authors gratefully acknowledge and thank Jyoti Sarkar, PhD, for his assistance with statistical analysis and manuscript preparation.
Am J Orthop. 2016;45(6):E331-E334. Copyright Frontline Medical Communications Inc. 2016. All rights reserved.
1. Sciberras N, Gregori A, Holt G. The ethical and practical challenges of patient noncompliance in orthopaedic surgery. J Bone Joint Surg Am. 2013;95(9):e61.
2. Sharma H, Crane E, Syme B, Foxworthy M. Non-compliance in orthopaedic surgery and its ethical challenges. Orthop Trauma. 2007;21(4):310-313.
3. Zelle BA, Bhandari M, Sanchez AI, Probst C, Pape HC. Loss of follow-up in orthopaedic trauma: is 80% follow-up still acceptable? J Orthop Trauma. 2013;27(3):177-181.
4. Leukhardt WH, Golob JF, McCoy AM, Fadlalla AM, Malangoni MA, Claridge JA. Follow-up disparities after trauma: a real problem for outcomes research. Am J Surg. 2010;199(3):348-352.
5. Shumaker SA, Dugan E, Bowen DJ. Enhancing adherence in randomized controlled clinical trials. Control Clin Trials. 2000;21(5 suppl):226S-232S.
6. Smith JS, Watts HG. Methods for locating missing patients for the purpose of long-term clinical studies. J Bone Joint Surg Am. 1998;80(3):431-438.
7. Sprague S, Leece P, Bhandari M, Tornetta P 3rd, Schemitsch E, Swiontkowski MF; S.P.R.I.N.T. Investigators. Limiting loss to follow-up in a multicenter randomized trial in orthopedic surgery. Control Clin Trials. 2003;24(6):719-725.