User login
Targeting Paget’s bone symptoms supported in long-term trial
Long-term intensive bisphosphonate treatment of patients with Paget’s disease of bone continued to show no benefit over symptomatic treatment in a 3-year extension trial of the PRISM study, leading investigators in the trial to recommend that treatment guidelines focus more on managing the condition’s symptoms rather than normalizing bone turnover biomarkers in hope of reducing disease complications.
“The Paget’s Disease Randomized Trial of Intensive versus Symptomatic Management (PRISM) study showed that intensive bisphosphonate therapy and symptomatic treatment had similar effects on clinical outcome of PDB [Paget’s disease of bone] with respect to the occurrence of fractures, orthopedic procedures, hearing loss, bone pain, quality of life, and adverse events,” wrote the principal investigator of the PRISM-EZ (extension with zoledronic acid) phase of the trial, Stuart H. Ralston, MD, of the University of Edinburgh (Scotland), and his colleagues.

Enrollment in the extension trial, which occurred during January 2007-January 2012, meant that patients kept to the same treatment strategies except for those in the intensive arm, who switched to zoledronic acid as the treatment of first choice. Both groups received analgesics and nonsteroidal anti-inflammatory drugs as needed. Patients in the symptomatic arm received bisphosphonate treatment only if they had bone pain thought to be caused by the increased metabolic activity of PDB, whereas those in the intensive arm were prescribed “bisphosphonates as required to suppress and maintain ALP [alkaline phosphatase] concentrations within the normal range,” according to the investigators. Clinical fracture rate was the primary outcome, but Dr. Ralston and his colleagues also compared orthopedic procedures, serum total ALP concentrations, bone pain, and quality of life in both cohorts.
A higher proportion of patients in the intensive group received zoledronic acid than in the symptomatic group (28.1% vs. 10.3%; P less than .001), whereas fewer patients in the intensive group received pamidronate (4.8% vs. 15.5%; P less than .001).
Of 270 in the intensive cohort, 22 (8.1%) experienced fractures, versus 12 (5.2%) of the 232 in the symptomatic cohort, yielding a hazard ratio of 1.90 (95% confidence interval, 0.91-3.98; P = .087). Of those, fractures in the pagetic bone numbered five and two, respectively. A total of 15 (5.6%) intensive treatment subjects and 7 (3.0%) symptomatic treatment subjects required orthopedic surgery, with a hazard ratio of 1.81 (95% CI, 0.71-4.61; P = .214).

There were no differences in bodily pain, bone pain, or quality of life at year 3 as reported by patients in both cohorts. While there was a statistically significant difference between intensive and symptomatic treatment in bodily pain, physical component summary score, and arthritis-specific health index scores at year 1 of the trial, the investigators noted that the findings were below the clinically significant five-point threshold and did not persist beyond 1 year.
“The results reported here do not support the recommendations made by the Endocrine Society guideline group, which suggested that most patients with PDB should be treated with potent bisphosphonates with the aim of restoring ALP values to within the lower part of the reference range,” the authors concluded. “On the contrary, the PRISM-EZ study demonstrates that this strategy is not associated with clinical benefit and might be harmful, [so] a more appropriate indication for bisphosphonate treatment in PDB is to control bone pain thought to be due to disease activity.”
The study was funded by grants from Arthritis Research UK and the Paget’s Association. Dr. Ralston reported receiving consultancy fees on behalf of his institution from Novartis and Merck and grant support on behalf of his institution from Amgen, Eli Lilly, and UCB. One coauthor reported receiving consultancy fees from Siemens, Becton Dickinson, and Roche, and another disclosed receiving such fees from Internis.
The PRISM-EZ study is the largest and longest study of PDB and provides important information on its long-term management. The results need to be kept in perspective. All patients were treated; hence, there is no untreated group and the results apply to follow-up therapy only. In this group, repeat therapy for active PDB as measured from serum total alkaline phosphatase (ALP) versus therapy for symptoms did not make a difference in a 3-year follow-up, and the authors recommend treating only when symptoms warrant it. Longer follow-ups would be needed to definitively show a difference in a condition that is present for many years.
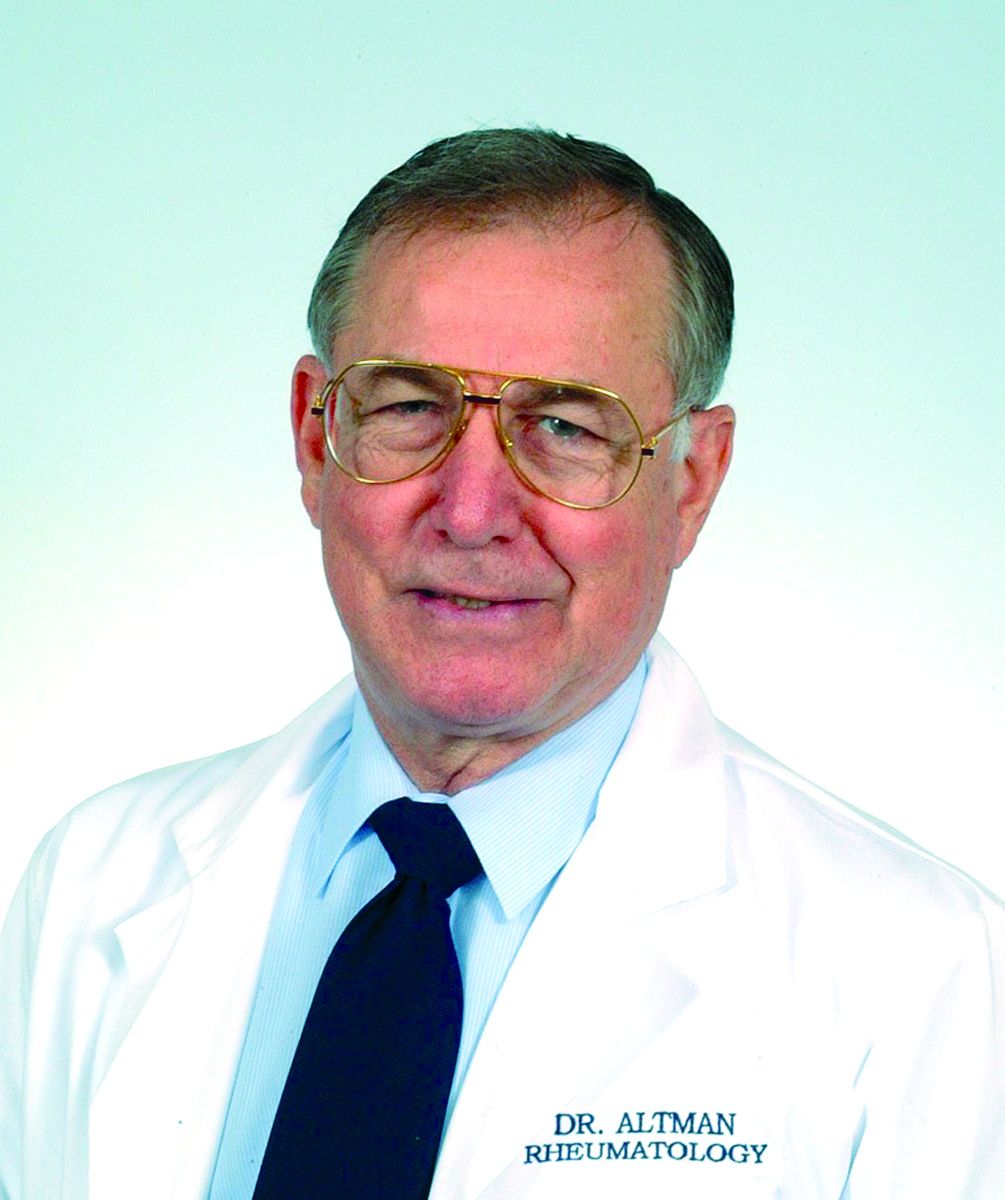
Roy D. Altman, MD , is professor emeritus of medicine in the division of rheumatology and immunology at the University of California, Los Angeles. He has no relevant disclosures.
The PRISM-EZ study is the largest and longest study of PDB and provides important information on its long-term management. The results need to be kept in perspective. All patients were treated; hence, there is no untreated group and the results apply to follow-up therapy only. In this group, repeat therapy for active PDB as measured from serum total alkaline phosphatase (ALP) versus therapy for symptoms did not make a difference in a 3-year follow-up, and the authors recommend treating only when symptoms warrant it. Longer follow-ups would be needed to definitively show a difference in a condition that is present for many years.
Roy D. Altman, MD , is professor emeritus of medicine in the division of rheumatology and immunology at the University of California, Los Angeles. He has no relevant disclosures.
The PRISM-EZ study is the largest and longest study of PDB and provides important information on its long-term management. The results need to be kept in perspective. All patients were treated; hence, there is no untreated group and the results apply to follow-up therapy only. In this group, repeat therapy for active PDB as measured from serum total alkaline phosphatase (ALP) versus therapy for symptoms did not make a difference in a 3-year follow-up, and the authors recommend treating only when symptoms warrant it. Longer follow-ups would be needed to definitively show a difference in a condition that is present for many years.
Roy D. Altman, MD , is professor emeritus of medicine in the division of rheumatology and immunology at the University of California, Los Angeles. He has no relevant disclosures.
Long-term intensive bisphosphonate treatment of patients with Paget’s disease of bone continued to show no benefit over symptomatic treatment in a 3-year extension trial of the PRISM study, leading investigators in the trial to recommend that treatment guidelines focus more on managing the condition’s symptoms rather than normalizing bone turnover biomarkers in hope of reducing disease complications.
“The Paget’s Disease Randomized Trial of Intensive versus Symptomatic Management (PRISM) study showed that intensive bisphosphonate therapy and symptomatic treatment had similar effects on clinical outcome of PDB [Paget’s disease of bone] with respect to the occurrence of fractures, orthopedic procedures, hearing loss, bone pain, quality of life, and adverse events,” wrote the principal investigator of the PRISM-EZ (extension with zoledronic acid) phase of the trial, Stuart H. Ralston, MD, of the University of Edinburgh (Scotland), and his colleagues.
Enrollment in the extension trial, which occurred during January 2007-January 2012, meant that patients kept to the same treatment strategies except for those in the intensive arm, who switched to zoledronic acid as the treatment of first choice. Both groups received analgesics and nonsteroidal anti-inflammatory drugs as needed. Patients in the symptomatic arm received bisphosphonate treatment only if they had bone pain thought to be caused by the increased metabolic activity of PDB, whereas those in the intensive arm were prescribed “bisphosphonates as required to suppress and maintain ALP [alkaline phosphatase] concentrations within the normal range,” according to the investigators. Clinical fracture rate was the primary outcome, but Dr. Ralston and his colleagues also compared orthopedic procedures, serum total ALP concentrations, bone pain, and quality of life in both cohorts.
A higher proportion of patients in the intensive group received zoledronic acid than in the symptomatic group (28.1% vs. 10.3%; P less than .001), whereas fewer patients in the intensive group received pamidronate (4.8% vs. 15.5%; P less than .001).
Of 270 in the intensive cohort, 22 (8.1%) experienced fractures, versus 12 (5.2%) of the 232 in the symptomatic cohort, yielding a hazard ratio of 1.90 (95% confidence interval, 0.91-3.98; P = .087). Of those, fractures in the pagetic bone numbered five and two, respectively. A total of 15 (5.6%) intensive treatment subjects and 7 (3.0%) symptomatic treatment subjects required orthopedic surgery, with a hazard ratio of 1.81 (95% CI, 0.71-4.61; P = .214).
There were no differences in bodily pain, bone pain, or quality of life at year 3 as reported by patients in both cohorts. While there was a statistically significant difference between intensive and symptomatic treatment in bodily pain, physical component summary score, and arthritis-specific health index scores at year 1 of the trial, the investigators noted that the findings were below the clinically significant five-point threshold and did not persist beyond 1 year.
“The results reported here do not support the recommendations made by the Endocrine Society guideline group, which suggested that most patients with PDB should be treated with potent bisphosphonates with the aim of restoring ALP values to within the lower part of the reference range,” the authors concluded. “On the contrary, the PRISM-EZ study demonstrates that this strategy is not associated with clinical benefit and might be harmful, [so] a more appropriate indication for bisphosphonate treatment in PDB is to control bone pain thought to be due to disease activity.”
The study was funded by grants from Arthritis Research UK and the Paget’s Association. Dr. Ralston reported receiving consultancy fees on behalf of his institution from Novartis and Merck and grant support on behalf of his institution from Amgen, Eli Lilly, and UCB. One coauthor reported receiving consultancy fees from Siemens, Becton Dickinson, and Roche, and another disclosed receiving such fees from Internis.
Long-term intensive bisphosphonate treatment of patients with Paget’s disease of bone continued to show no benefit over symptomatic treatment in a 3-year extension trial of the PRISM study, leading investigators in the trial to recommend that treatment guidelines focus more on managing the condition’s symptoms rather than normalizing bone turnover biomarkers in hope of reducing disease complications.
“The Paget’s Disease Randomized Trial of Intensive versus Symptomatic Management (PRISM) study showed that intensive bisphosphonate therapy and symptomatic treatment had similar effects on clinical outcome of PDB [Paget’s disease of bone] with respect to the occurrence of fractures, orthopedic procedures, hearing loss, bone pain, quality of life, and adverse events,” wrote the principal investigator of the PRISM-EZ (extension with zoledronic acid) phase of the trial, Stuart H. Ralston, MD, of the University of Edinburgh (Scotland), and his colleagues.
Enrollment in the extension trial, which occurred during January 2007-January 2012, meant that patients kept to the same treatment strategies except for those in the intensive arm, who switched to zoledronic acid as the treatment of first choice. Both groups received analgesics and nonsteroidal anti-inflammatory drugs as needed. Patients in the symptomatic arm received bisphosphonate treatment only if they had bone pain thought to be caused by the increased metabolic activity of PDB, whereas those in the intensive arm were prescribed “bisphosphonates as required to suppress and maintain ALP [alkaline phosphatase] concentrations within the normal range,” according to the investigators. Clinical fracture rate was the primary outcome, but Dr. Ralston and his colleagues also compared orthopedic procedures, serum total ALP concentrations, bone pain, and quality of life in both cohorts.
A higher proportion of patients in the intensive group received zoledronic acid than in the symptomatic group (28.1% vs. 10.3%; P less than .001), whereas fewer patients in the intensive group received pamidronate (4.8% vs. 15.5%; P less than .001).
Of 270 in the intensive cohort, 22 (8.1%) experienced fractures, versus 12 (5.2%) of the 232 in the symptomatic cohort, yielding a hazard ratio of 1.90 (95% confidence interval, 0.91-3.98; P = .087). Of those, fractures in the pagetic bone numbered five and two, respectively. A total of 15 (5.6%) intensive treatment subjects and 7 (3.0%) symptomatic treatment subjects required orthopedic surgery, with a hazard ratio of 1.81 (95% CI, 0.71-4.61; P = .214).
There were no differences in bodily pain, bone pain, or quality of life at year 3 as reported by patients in both cohorts. While there was a statistically significant difference between intensive and symptomatic treatment in bodily pain, physical component summary score, and arthritis-specific health index scores at year 1 of the trial, the investigators noted that the findings were below the clinically significant five-point threshold and did not persist beyond 1 year.
“The results reported here do not support the recommendations made by the Endocrine Society guideline group, which suggested that most patients with PDB should be treated with potent bisphosphonates with the aim of restoring ALP values to within the lower part of the reference range,” the authors concluded. “On the contrary, the PRISM-EZ study demonstrates that this strategy is not associated with clinical benefit and might be harmful, [so] a more appropriate indication for bisphosphonate treatment in PDB is to control bone pain thought to be due to disease activity.”
The study was funded by grants from Arthritis Research UK and the Paget’s Association. Dr. Ralston reported receiving consultancy fees on behalf of his institution from Novartis and Merck and grant support on behalf of his institution from Amgen, Eli Lilly, and UCB. One coauthor reported receiving consultancy fees from Siemens, Becton Dickinson, and Roche, and another disclosed receiving such fees from Internis.
FROM JOURNAL OF BONE AND MINERAL RESEARCH
Key clinical point:
Major finding: Intensive bisphosphonate therapy did not yield significant differences in rates of fractures (P = .087), orthopedic procedures (P = .214), and serious adverse events (RR = 1.28).
Data source: An extension study of a randomized trial involving 502 PDB patients during January 2007-January 2012.
Disclosures: The study was funded by grants from Arthritis Research UK and the Paget’s Association. Dr. Ralston reported receiving consultancy fees on behalf of his institution from Novartis and Merck and grant support on behalf of his institution from Amgen, Eli Lilly, and UCB. One coauthor reported receiving consultancy fees from Siemens, Becton Dickinson, and Roche, and another disclosed receiving such fees from Internis.

Bury My Heart at Wounded Knee
ANSWER
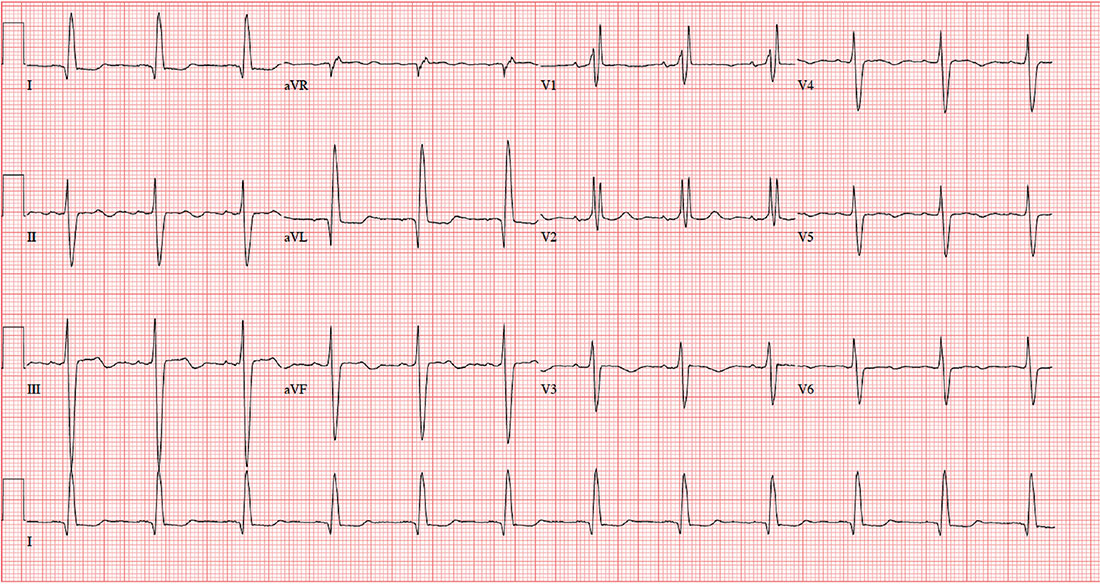
The correct diagnosis includes normal sinus rhythm with a left-axis deviation, right bundle branch block, and left anterior fascicular block, consistent with bifascicular block.
Left-axis deviation is evidenced by an axis beyond –30°. A right bundle branch block is marked by a QRS duration > 120 ms, an RSR’ pattern in lead V1 and often V2 and V3, and wide S waves in lateral leads V5 and V6.
A left anterior fascicular block is identified by a left-axis deviation beyond –45°, a QR complex in lead I, and an RS complex in leads II and III.
The combination of a right bundle and left anterior fascicular block constitute bifascicular block. In this case, only the left fascicle conducts normally, putting this patient at risk for trifascicular block (ie, third-degree or complete heart block).
ANSWER
The correct diagnosis includes normal sinus rhythm with a left-axis deviation, right bundle branch block, and left anterior fascicular block, consistent with bifascicular block.
Left-axis deviation is evidenced by an axis beyond –30°. A right bundle branch block is marked by a QRS duration > 120 ms, an RSR’ pattern in lead V1 and often V2 and V3, and wide S waves in lateral leads V5 and V6.
A left anterior fascicular block is identified by a left-axis deviation beyond –45°, a QR complex in lead I, and an RS complex in leads II and III.
The combination of a right bundle and left anterior fascicular block constitute bifascicular block. In this case, only the left fascicle conducts normally, putting this patient at risk for trifascicular block (ie, third-degree or complete heart block).
ANSWER
The correct diagnosis includes normal sinus rhythm with a left-axis deviation, right bundle branch block, and left anterior fascicular block, consistent with bifascicular block.
Left-axis deviation is evidenced by an axis beyond –30°. A right bundle branch block is marked by a QRS duration > 120 ms, an RSR’ pattern in lead V1 and often V2 and V3, and wide S waves in lateral leads V5 and V6.
A left anterior fascicular block is identified by a left-axis deviation beyond –45°, a QR complex in lead I, and an RS complex in leads II and III.
The combination of a right bundle and left anterior fascicular block constitute bifascicular block. In this case, only the left fascicle conducts normally, putting this patient at risk for trifascicular block (ie, third-degree or complete heart block).
A 72-year-old man with chronic osteoarthritis is scheduled for left knee replacement and sent for preoperative assessment. He has been physically active his entire life, but in the past five years, both knees have developed osteoarthritis that prevents him from walking more than 20 feet without stopping. He is obese and has hyperlipidemia and type 2 diabetes. He has never had angina, shortness of breath, paroxysmal dyspnea, or hypertension.
The patient is retired after 27 years’ service in the Air Force followed by an 18-year career with a major airline. He is married, with three adult children who are all in good health. He quit smoking at age 35 but states half-seriously that he “gave up cigarettes for candy bars and ice cream.” He says he drank heavily during his early years of service but rarely has more than one or two beers per week now.
Medical and surgical histories are remarkable for multiple arthroscopic procedures involving the medial meniscus and anterior collateral ligament of both knees. He has also had xanthelasmas removed from both eyelids, surgical repair of a compound fracture of the left humerus, and shrapnel removed from the subcutaneous tissue on the left upper back.
His medication list includes atorvastatin and metformin. He is allergic to sulfa, which has induced anaphylaxis in the past.
The review of systems reveals he is hard of hearing; he has hearing aids but refuses to wear them. He wears trifocal glasses and a partial upper bridge. He denies any cardiac, pulmonary, neurologic, or gastrointestinal problems. He does report difficulty starting and stopping a stream of urine, as well as occasional accidents. He also admits to having erectile dysfunction but does not think it is a problem he needs to address.
Vital signs include a blood pressure of 124/74 mm Hg; pulse, 70 beats/min; respiratory rate, 14 breaths/min-1; and temperature, 98.4°F. His weight is 264 lb and his height, 69 in. He is pleasant, cooperative, alert, and oriented.
Physical exam reveals normal heart sounds without murmurs, clicks, or rubs. The lungs are clear in all fields. The abdomen is large but soft, and the liver edge is palpable 3 cm below the costal margin. Peripheral pulses are 2+ bilaterally in all extremities. Surgical scars are present on the left humerus, left scapula, and both knees. Neurologically, the patient is intact, and there is no evidence of microvascular disease secondary to his diabetes.
An ECG is performed. It reveals a ventricular rate of 71 beats/min; PR interval, 152 ms; QRS duration, 142 ms; QT/QTc interval, 476/517 ms; P axis, 76°; R axis, –48°; and T axis, 161°. What is your interpretation of this ECG?
Rosacea research reveals advances, promising therapies
MIAMI – Management of rosacea continues to challenge dermatologists and patients alike, although new advances and recent studies shine a light on promising new therapies to target this inflammatory skin condition.
Linda Stein Gold, MD, who directs dermatology clinical trials at the Henry Ford Hospital in Detroit, shared new information about the pathophysiology of rosacea and the controversial associations with cardiovascular disease and addressed the rosacea “genes versus environment” etiology question at the Orlando Dermatology Aesthetic and Clinical Conference.
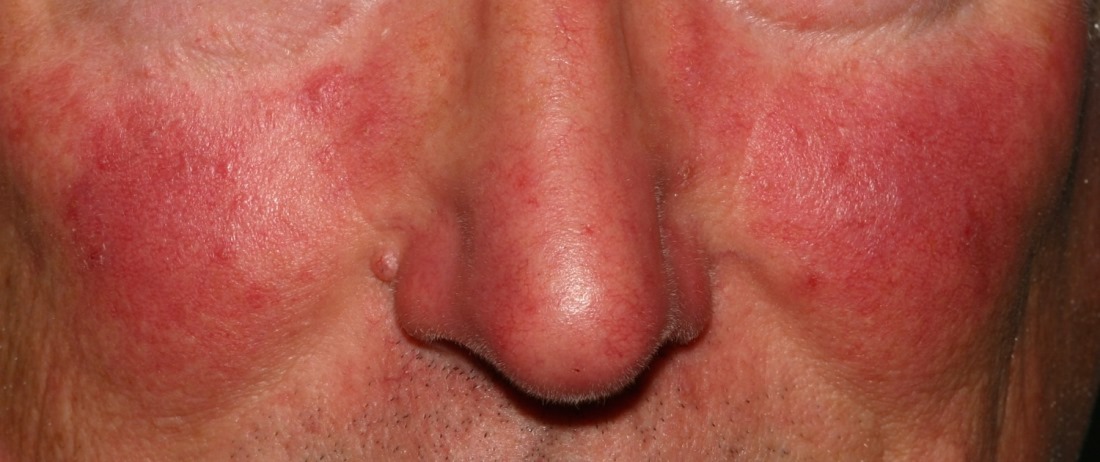
The topical vasoconstrictor of cutaneous vasculature, oxymetazoline hydrochloride cream 1%, showed a statistically significant improvement in erythema, compared with vehicle only in people with rosacea in a phase III study, Dr. Stein Gold said. The outcome was strict, requiring both physician and patient assessment of at least a two-point improvement on the Erythema Assessment Scale. Investigators observed responses over 12 hours on the same day. “It’s actually kind of fun to do these studies,” she added. “You get to see what happens with patients across a whole day.”
A long-term analysis showed the efficacy of oxymetazoline “actually increased over the course of 52 weeks,” Dr. Stein Gold said. A total of 43% of participants experienced a two-grade improvement in erythema during this time. The agent was generally well tolerated, with dermatitis, pruritus, and headaches the most common treatment-related adverse events reported. (In January, the Food and Drug Administration approved oxymetazoline cream for the treatment of “persistent facial erythema associated with rosacea in adults.”)
Sometimes, a new formulation can make a difference in terms of treatment tolerability, a major consideration for patients with rosacea, Dr. Stein Gold said. Recent evidence suggests azelaic acid foam, 15% (Finacea), approved by the FDA in 2015, provides a well-tolerated option with only 6.2% of patients experiencing any application site pain, compared with 1.5% on vehicle alone, she added.
Cardiovascular comorbidities
“We’ve heard a lot about psoriasis and cardiovascular comorbidities, and we worry that other skin diseases may have similar associations,” Dr. Stein Gold said. New revelations in the pathogenesis of rosacea suggest a comparable association, she added, including findings related to matrix metalloproteinases (MMPs). MMPs have a key role in rosacea, for example, and are also important in the pathogenesis of cardiovascular disease, she noted. Several studies have confirmed this association as well as other links, including to Parkinson’s disease.
Although these studies support associations, more evidence is needed to prove any causal relationship between rosacea and other conditions where inflammation plays a prominent role, she added.
Translating findings into action
Given this emerging evidence, “what are we going to do about it?” Dr. Stein Gold asked attendees at the meeting. Research suggests tetracycline might be protective, she said, because this antibiotic can inhibit MMP activity. In a retrospective cohort study, investigators discovered rosacea patients on tetracycline therapy were at lower risk for developing vascular disease (J Invest Dermatol. 2014 Aug;134[8]:2267-9).
Nature or nurture?
Researchers and clinicians frequently debate the precise etiology of rosacea and whether the underlying causes are primarily genetic versus environmental. Investigators conducted a twin cohort study to find a more concrete answer, specifically looking at identical and fraternal twin pairs to determine how much genetics or environment likely contributes to factors on the National Rosacea Society grading system (JAMA Dermatol. 2015 Nov;151[11]:1213-9).
“The bottom line is it’s really about half and half – about half were associated with genetics, the other half with environment,” Dr. Stein Gold said.
No matter what the etiology, it’s important to diagnose and treat rosacea, Dr. Stein Gold said. Although patients tend to be middle-aged white women, the condition is not limited to this patient population, and “you have to think about it to diagnose it in skin of color,” she added.
Rosacea, which has a high emotional impact, presents an opportunity for dermatologists to improve quality of life, Dr. Stein Gold said. “When people walk around with papules and pustules, [other] people think there is something wrong with them.”
Dr. Stein Gold disclosed that she is a consultant, member of the advisory boards and speaker’s bureaus for, and receives research grants from Galderma, Leo, Novan, Valeant, Novartis, Celgene and Allergan. She is also a consultant, advisory board member, and receives research grants from Dermira and Foamix. She is a consultant to Sol-Gel, Promis, Anacor, and Medimetriks. She is on the advisory board for Promis.
MIAMI – Management of rosacea continues to challenge dermatologists and patients alike, although new advances and recent studies shine a light on promising new therapies to target this inflammatory skin condition.
Linda Stein Gold, MD, who directs dermatology clinical trials at the Henry Ford Hospital in Detroit, shared new information about the pathophysiology of rosacea and the controversial associations with cardiovascular disease and addressed the rosacea “genes versus environment” etiology question at the Orlando Dermatology Aesthetic and Clinical Conference.
The topical vasoconstrictor of cutaneous vasculature, oxymetazoline hydrochloride cream 1%, showed a statistically significant improvement in erythema, compared with vehicle only in people with rosacea in a phase III study, Dr. Stein Gold said. The outcome was strict, requiring both physician and patient assessment of at least a two-point improvement on the Erythema Assessment Scale. Investigators observed responses over 12 hours on the same day. “It’s actually kind of fun to do these studies,” she added. “You get to see what happens with patients across a whole day.”
A long-term analysis showed the efficacy of oxymetazoline “actually increased over the course of 52 weeks,” Dr. Stein Gold said. A total of 43% of participants experienced a two-grade improvement in erythema during this time. The agent was generally well tolerated, with dermatitis, pruritus, and headaches the most common treatment-related adverse events reported. (In January, the Food and Drug Administration approved oxymetazoline cream for the treatment of “persistent facial erythema associated with rosacea in adults.”)
Sometimes, a new formulation can make a difference in terms of treatment tolerability, a major consideration for patients with rosacea, Dr. Stein Gold said. Recent evidence suggests azelaic acid foam, 15% (Finacea), approved by the FDA in 2015, provides a well-tolerated option with only 6.2% of patients experiencing any application site pain, compared with 1.5% on vehicle alone, she added.
Cardiovascular comorbidities
“We’ve heard a lot about psoriasis and cardiovascular comorbidities, and we worry that other skin diseases may have similar associations,” Dr. Stein Gold said. New revelations in the pathogenesis of rosacea suggest a comparable association, she added, including findings related to matrix metalloproteinases (MMPs). MMPs have a key role in rosacea, for example, and are also important in the pathogenesis of cardiovascular disease, she noted. Several studies have confirmed this association as well as other links, including to Parkinson’s disease.
Although these studies support associations, more evidence is needed to prove any causal relationship between rosacea and other conditions where inflammation plays a prominent role, she added.
Translating findings into action
Given this emerging evidence, “what are we going to do about it?” Dr. Stein Gold asked attendees at the meeting. Research suggests tetracycline might be protective, she said, because this antibiotic can inhibit MMP activity. In a retrospective cohort study, investigators discovered rosacea patients on tetracycline therapy were at lower risk for developing vascular disease (J Invest Dermatol. 2014 Aug;134[8]:2267-9).
Nature or nurture?
Researchers and clinicians frequently debate the precise etiology of rosacea and whether the underlying causes are primarily genetic versus environmental. Investigators conducted a twin cohort study to find a more concrete answer, specifically looking at identical and fraternal twin pairs to determine how much genetics or environment likely contributes to factors on the National Rosacea Society grading system (JAMA Dermatol. 2015 Nov;151[11]:1213-9).
“The bottom line is it’s really about half and half – about half were associated with genetics, the other half with environment,” Dr. Stein Gold said.
No matter what the etiology, it’s important to diagnose and treat rosacea, Dr. Stein Gold said. Although patients tend to be middle-aged white women, the condition is not limited to this patient population, and “you have to think about it to diagnose it in skin of color,” she added.
Rosacea, which has a high emotional impact, presents an opportunity for dermatologists to improve quality of life, Dr. Stein Gold said. “When people walk around with papules and pustules, [other] people think there is something wrong with them.”
Dr. Stein Gold disclosed that she is a consultant, member of the advisory boards and speaker’s bureaus for, and receives research grants from Galderma, Leo, Novan, Valeant, Novartis, Celgene and Allergan. She is also a consultant, advisory board member, and receives research grants from Dermira and Foamix. She is a consultant to Sol-Gel, Promis, Anacor, and Medimetriks. She is on the advisory board for Promis.
MIAMI – Management of rosacea continues to challenge dermatologists and patients alike, although new advances and recent studies shine a light on promising new therapies to target this inflammatory skin condition.
Linda Stein Gold, MD, who directs dermatology clinical trials at the Henry Ford Hospital in Detroit, shared new information about the pathophysiology of rosacea and the controversial associations with cardiovascular disease and addressed the rosacea “genes versus environment” etiology question at the Orlando Dermatology Aesthetic and Clinical Conference.
The topical vasoconstrictor of cutaneous vasculature, oxymetazoline hydrochloride cream 1%, showed a statistically significant improvement in erythema, compared with vehicle only in people with rosacea in a phase III study, Dr. Stein Gold said. The outcome was strict, requiring both physician and patient assessment of at least a two-point improvement on the Erythema Assessment Scale. Investigators observed responses over 12 hours on the same day. “It’s actually kind of fun to do these studies,” she added. “You get to see what happens with patients across a whole day.”
A long-term analysis showed the efficacy of oxymetazoline “actually increased over the course of 52 weeks,” Dr. Stein Gold said. A total of 43% of participants experienced a two-grade improvement in erythema during this time. The agent was generally well tolerated, with dermatitis, pruritus, and headaches the most common treatment-related adverse events reported. (In January, the Food and Drug Administration approved oxymetazoline cream for the treatment of “persistent facial erythema associated with rosacea in adults.”)
Sometimes, a new formulation can make a difference in terms of treatment tolerability, a major consideration for patients with rosacea, Dr. Stein Gold said. Recent evidence suggests azelaic acid foam, 15% (Finacea), approved by the FDA in 2015, provides a well-tolerated option with only 6.2% of patients experiencing any application site pain, compared with 1.5% on vehicle alone, she added.
Cardiovascular comorbidities
“We’ve heard a lot about psoriasis and cardiovascular comorbidities, and we worry that other skin diseases may have similar associations,” Dr. Stein Gold said. New revelations in the pathogenesis of rosacea suggest a comparable association, she added, including findings related to matrix metalloproteinases (MMPs). MMPs have a key role in rosacea, for example, and are also important in the pathogenesis of cardiovascular disease, she noted. Several studies have confirmed this association as well as other links, including to Parkinson’s disease.
Although these studies support associations, more evidence is needed to prove any causal relationship between rosacea and other conditions where inflammation plays a prominent role, she added.
Translating findings into action
Given this emerging evidence, “what are we going to do about it?” Dr. Stein Gold asked attendees at the meeting. Research suggests tetracycline might be protective, she said, because this antibiotic can inhibit MMP activity. In a retrospective cohort study, investigators discovered rosacea patients on tetracycline therapy were at lower risk for developing vascular disease (J Invest Dermatol. 2014 Aug;134[8]:2267-9).
Nature or nurture?
Researchers and clinicians frequently debate the precise etiology of rosacea and whether the underlying causes are primarily genetic versus environmental. Investigators conducted a twin cohort study to find a more concrete answer, specifically looking at identical and fraternal twin pairs to determine how much genetics or environment likely contributes to factors on the National Rosacea Society grading system (JAMA Dermatol. 2015 Nov;151[11]:1213-9).
“The bottom line is it’s really about half and half – about half were associated with genetics, the other half with environment,” Dr. Stein Gold said.
No matter what the etiology, it’s important to diagnose and treat rosacea, Dr. Stein Gold said. Although patients tend to be middle-aged white women, the condition is not limited to this patient population, and “you have to think about it to diagnose it in skin of color,” she added.
Rosacea, which has a high emotional impact, presents an opportunity for dermatologists to improve quality of life, Dr. Stein Gold said. “When people walk around with papules and pustules, [other] people think there is something wrong with them.”
Dr. Stein Gold disclosed that she is a consultant, member of the advisory boards and speaker’s bureaus for, and receives research grants from Galderma, Leo, Novan, Valeant, Novartis, Celgene and Allergan. She is also a consultant, advisory board member, and receives research grants from Dermira and Foamix. She is a consultant to Sol-Gel, Promis, Anacor, and Medimetriks. She is on the advisory board for Promis.
EXPERT ANALYSIS FROM ODAC 2017
History of child abuse worsens depression course in elderly adults
Older adults with depression who reported experiencing child abuse were more likely to have persistent disease at follow-up than those who did not, according to a study carried out by Ilse Wielaard and associates at the VU University Medical Centre, Amsterdam, the Netherlands.
The mean age of the 282 study participants included in the 2-year study was 70.6 years, and of this group, 152 patients reported a history of child abuse. Patients with a history of child abuse were significantly more likely to be depressed at the end of the 2-year follow-up period.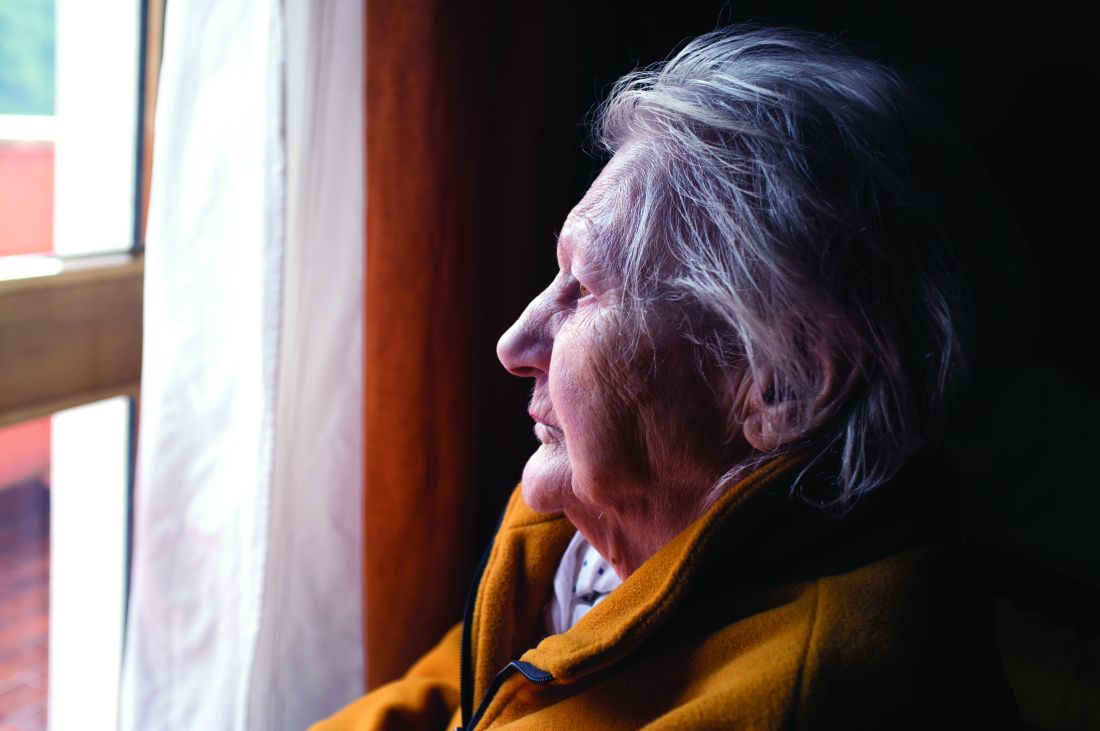
“In the treatment of late-life depression it is important to detect childhood abuse and to consider mediating characteristics that influence its course negatively,” the investigators concluded.
Find the full study in the American Journal of Geriatric Psychiatry (doi: 10.1016/j.jagp.2017.01.014).
Older adults with depression who reported experiencing child abuse were more likely to have persistent disease at follow-up than those who did not, according to a study carried out by Ilse Wielaard and associates at the VU University Medical Centre, Amsterdam, the Netherlands.
The mean age of the 282 study participants included in the 2-year study was 70.6 years, and of this group, 152 patients reported a history of child abuse. Patients with a history of child abuse were significantly more likely to be depressed at the end of the 2-year follow-up period.
“In the treatment of late-life depression it is important to detect childhood abuse and to consider mediating characteristics that influence its course negatively,” the investigators concluded.
Find the full study in the American Journal of Geriatric Psychiatry (doi: 10.1016/j.jagp.2017.01.014).
Older adults with depression who reported experiencing child abuse were more likely to have persistent disease at follow-up than those who did not, according to a study carried out by Ilse Wielaard and associates at the VU University Medical Centre, Amsterdam, the Netherlands.
The mean age of the 282 study participants included in the 2-year study was 70.6 years, and of this group, 152 patients reported a history of child abuse. Patients with a history of child abuse were significantly more likely to be depressed at the end of the 2-year follow-up period.
“In the treatment of late-life depression it is important to detect childhood abuse and to consider mediating characteristics that influence its course negatively,” the investigators concluded.
Find the full study in the American Journal of Geriatric Psychiatry (doi: 10.1016/j.jagp.2017.01.014).
FROM THE AMERICAN JOURNAL OF GERIATRIC PSYCHIATRY
Don't rule out liver transplant grafts from octogenarians
Donors aged 80 years or older are not necessarily inferior for a liver transplantation (LT) graft, compared with young ideal donors (aged 18-39 years), according to an analysis of the perioperative LT period.
While “the potential risks and benefits associated with the use of livers from octogenarian donors must be closely weighed, with careful donor evaluation, selective donor-to-recipient matching and skilled perioperative care, octogenarian grafts do not affect the short-term course of patients undergoing LT,” concluded Gianni Biancofiore, MD, of Azienda Ospedaliera-Universitaria Pisana, Pisa, Italy, and his coauthors (Dig Liver Dis. 2017. doi: 10.1016/j.dld.2017.01.149).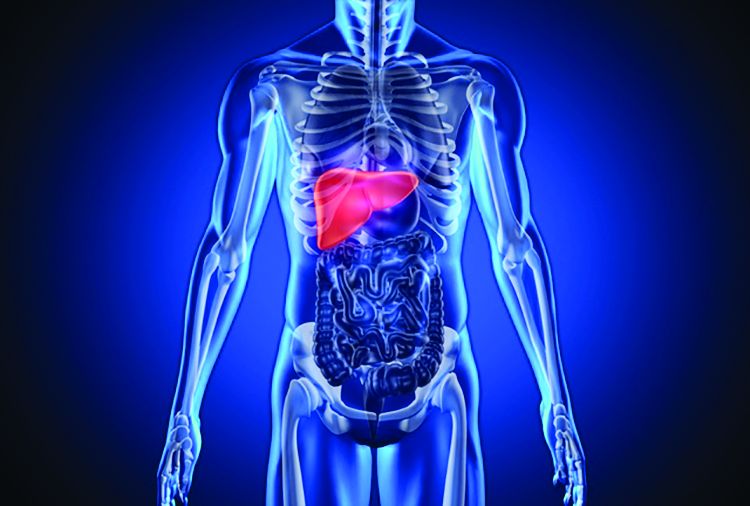
Perioperative differences were insubstantial in terms of cardiovascular complications (P = .2), respiratory complications (P = 1.0), coagulopathy (P = .5), and incidence of perfusion syndrome (P = .3). Median ICU length of stay of the two groups was identical (P = .4). No differences in terms of death or retransplant were observed during the ICU stay.
“Accordingly, anesthesiologists and intensivists should not label liver allografts from donors aged 80 years [or older] as ‘unusable’ or ‘high risk’ ” based on age alone, the authors concluded.
The authors declared no sources of funding and no conflicts of interest.
Donors aged 80 years or older are not necessarily inferior for a liver transplantation (LT) graft, compared with young ideal donors (aged 18-39 years), according to an analysis of the perioperative LT period.
While “the potential risks and benefits associated with the use of livers from octogenarian donors must be closely weighed, with careful donor evaluation, selective donor-to-recipient matching and skilled perioperative care, octogenarian grafts do not affect the short-term course of patients undergoing LT,” concluded Gianni Biancofiore, MD, of Azienda Ospedaliera-Universitaria Pisana, Pisa, Italy, and his coauthors (Dig Liver Dis. 2017. doi: 10.1016/j.dld.2017.01.149).
Perioperative differences were insubstantial in terms of cardiovascular complications (P = .2), respiratory complications (P = 1.0), coagulopathy (P = .5), and incidence of perfusion syndrome (P = .3). Median ICU length of stay of the two groups was identical (P = .4). No differences in terms of death or retransplant were observed during the ICU stay.
“Accordingly, anesthesiologists and intensivists should not label liver allografts from donors aged 80 years [or older] as ‘unusable’ or ‘high risk’ ” based on age alone, the authors concluded.
The authors declared no sources of funding and no conflicts of interest.
Donors aged 80 years or older are not necessarily inferior for a liver transplantation (LT) graft, compared with young ideal donors (aged 18-39 years), according to an analysis of the perioperative LT period.
While “the potential risks and benefits associated with the use of livers from octogenarian donors must be closely weighed, with careful donor evaluation, selective donor-to-recipient matching and skilled perioperative care, octogenarian grafts do not affect the short-term course of patients undergoing LT,” concluded Gianni Biancofiore, MD, of Azienda Ospedaliera-Universitaria Pisana, Pisa, Italy, and his coauthors (Dig Liver Dis. 2017. doi: 10.1016/j.dld.2017.01.149).
Perioperative differences were insubstantial in terms of cardiovascular complications (P = .2), respiratory complications (P = 1.0), coagulopathy (P = .5), and incidence of perfusion syndrome (P = .3). Median ICU length of stay of the two groups was identical (P = .4). No differences in terms of death or retransplant were observed during the ICU stay.
“Accordingly, anesthesiologists and intensivists should not label liver allografts from donors aged 80 years [or older] as ‘unusable’ or ‘high risk’ ” based on age alone, the authors concluded.
The authors declared no sources of funding and no conflicts of interest.
FROM DIGESTIVE AND LIVER DISEASE
PD-1, PD-L1 expression in sarcomas is subtype dependent
AMSTERDAM – Immune checkpoint inhibitors targeted against programmed death–1 (PD-1) and its ligand (PD-L1) show strong activity against several different tumor types, but unfortunately may have only limited efficacy against soft tissue and bone sarcomas, investigators reported.
“We found that the clinical expression of PD-1, PD-L1, and CD8 is sarcoma subtype dependent,” said Anke van Erp, a PhD candidate in oncology at Radboud University Medical Center in Nijmegen, the Netherlands.
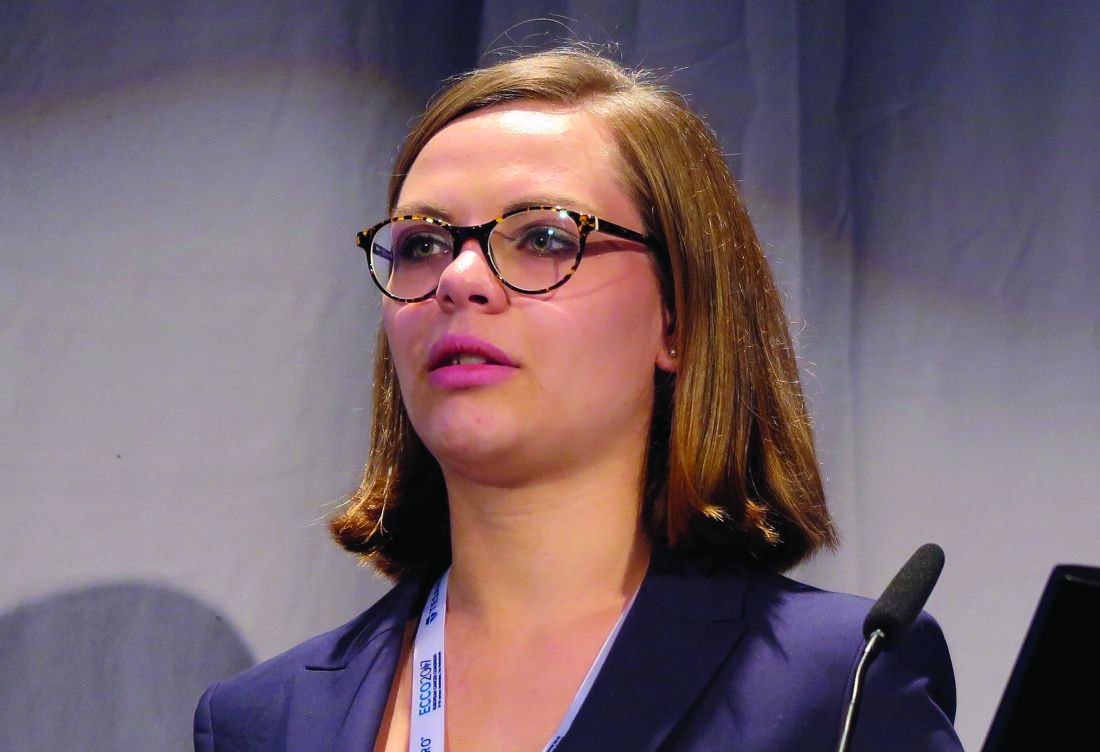
“The introduction of PD-1 antibodies has led to increased interest in the expression of PD-1, PD-L1, and CD8 in a large variety of tumor types, and has shown in several of these tumor types that PD-L1 could be associated with a worse prognosis. In addition, treatment with PD-1 antibodies has shown impressive effects in an increasing number of adult tumors. This makes the exploration of PD-1 blockade in sarcoma of interest,” she said.
Additionally, CD8-positive T cells are of interest because they are critical mediators of adaptive immunity, she noted.
Ms. van Erp and colleagues looked at expression of PD-1, PD-L1, and the presence of CD8-positive cells in formalin-fixed, paraffin-embedded tumor samples from patients with one of six sarcoma subtypes: primary osteosarcoma (48 samples), Ewing sarcoma (32), alveolar rhabdomyosarcoma (28), embryonal rhabdomyosarcoma (78), synovial sarcoma (23), and desmoplastic small round cell tumors (8).
The samples were analyzed by immunohistochemistry for the expression of PD-1, PD-L1, and CD8-positive cells, and expression levels were then correlated with clinical outcomes.
The investigators classified expression of markers on less than 10% of cells in a sample as negative, 10%-50% as positive, and more than 50% as highly positive.
PD-1 was expressed in lymphocytes in 6% of all samples, and in 19% of all tumors. PD-L1 was expressed in 10%, and CD8-positive cells in 46%.
Only 2% of samples expressed both PD-1 and PD-L1, 11% expressed both PD-1 and CD8-positive T cells, 7% had PD-L1 and CD8, and 2% expressed all three markers.
The highest percentages of PD-1 expression were in lymphocytes from synovial sarcoma samples (17%), and the highest levels of PD-1 were seen in alveolar rhabdomyosarcoma samples. However, neither PD-1 nor PD-L1 were detected at significant levels in synovial sarcoma tumor cells, and PD-1 was not detected in tumor cells from alveolar rhabdomyosarcoma.
“These data show that there is a high difference between the different subtypes, and they highlight the need to really look at PD-1 blockade per individual subtype,” Ms. van Erp said.
For all subtypes combined, the OS was significantly better for patients with PD-L1 positive vs. PD-L1–negative tumors out to 25 years of follow-up (P = .028). Similarly OS was better for patients with PD-L1–positive, CD8-positive tumors, compared with tumors negative for both markers (P = .020).
When they looked at individual sarcoma subtypes, however, they saw significant results only for alveolar rhabdomyosarcoma, with PD-L1 positivity vs. negativity associated with better OS and EFS out to more than 10.5 years (P = .007 for both). There was also a trend toward better EFS for tumors positive for both PD-L1 and CD8, but this was not significant.
For Ewing sarcoma, PD-1 was found to be expressed on tumor rather than on lymphocytes in 19% of all samples, and PD-1 expression was found to be associated with worse EFS. PD-1 was also found in tumors of all desmoplastic small round cell tumor samples, but this group was too small to determine significance, Ms. van Erp said.
She acknowledged that the study was limited by the use of tissue microarray sampling rather than examination of the whole tumor and its microenvironment. In addition, no functional assays have been performed to determine the clinical relevance of PD-1 expression for either Ewing sarcoma or desmoplastic small round cell tumor cells.
“In this study, we looked at the primary tumors for these subtypes, and as we know that there can be a difference in the pattern of expression between primary tumors and metastatic tumors in sarcoma subtypes, and as sarcoma patients are in great need for new therapeutic options, it would be very interesting to look at the expression of PD-1. PD-L1, and CD8 in these tumor types in metastatic disease,’ she said.
The study was supported by Radboud University; the Princess Maxima Center for Pediatric Oncology in Utrecht, the Netherlands; and the Institute of Cancer Research and Royal Marsden NHS Foundation Trust in London. The authors reported no conflicts of interest.
AMSTERDAM – Immune checkpoint inhibitors targeted against programmed death–1 (PD-1) and its ligand (PD-L1) show strong activity against several different tumor types, but unfortunately may have only limited efficacy against soft tissue and bone sarcomas, investigators reported.
“We found that the clinical expression of PD-1, PD-L1, and CD8 is sarcoma subtype dependent,” said Anke van Erp, a PhD candidate in oncology at Radboud University Medical Center in Nijmegen, the Netherlands.
“The introduction of PD-1 antibodies has led to increased interest in the expression of PD-1, PD-L1, and CD8 in a large variety of tumor types, and has shown in several of these tumor types that PD-L1 could be associated with a worse prognosis. In addition, treatment with PD-1 antibodies has shown impressive effects in an increasing number of adult tumors. This makes the exploration of PD-1 blockade in sarcoma of interest,” she said.
Additionally, CD8-positive T cells are of interest because they are critical mediators of adaptive immunity, she noted.
Ms. van Erp and colleagues looked at expression of PD-1, PD-L1, and the presence of CD8-positive cells in formalin-fixed, paraffin-embedded tumor samples from patients with one of six sarcoma subtypes: primary osteosarcoma (48 samples), Ewing sarcoma (32), alveolar rhabdomyosarcoma (28), embryonal rhabdomyosarcoma (78), synovial sarcoma (23), and desmoplastic small round cell tumors (8).
The samples were analyzed by immunohistochemistry for the expression of PD-1, PD-L1, and CD8-positive cells, and expression levels were then correlated with clinical outcomes.
The investigators classified expression of markers on less than 10% of cells in a sample as negative, 10%-50% as positive, and more than 50% as highly positive.
PD-1 was expressed in lymphocytes in 6% of all samples, and in 19% of all tumors. PD-L1 was expressed in 10%, and CD8-positive cells in 46%.
Only 2% of samples expressed both PD-1 and PD-L1, 11% expressed both PD-1 and CD8-positive T cells, 7% had PD-L1 and CD8, and 2% expressed all three markers.
The highest percentages of PD-1 expression were in lymphocytes from synovial sarcoma samples (17%), and the highest levels of PD-1 were seen in alveolar rhabdomyosarcoma samples. However, neither PD-1 nor PD-L1 were detected at significant levels in synovial sarcoma tumor cells, and PD-1 was not detected in tumor cells from alveolar rhabdomyosarcoma.
“These data show that there is a high difference between the different subtypes, and they highlight the need to really look at PD-1 blockade per individual subtype,” Ms. van Erp said.
For all subtypes combined, the OS was significantly better for patients with PD-L1 positive vs. PD-L1–negative tumors out to 25 years of follow-up (P = .028). Similarly OS was better for patients with PD-L1–positive, CD8-positive tumors, compared with tumors negative for both markers (P = .020).
When they looked at individual sarcoma subtypes, however, they saw significant results only for alveolar rhabdomyosarcoma, with PD-L1 positivity vs. negativity associated with better OS and EFS out to more than 10.5 years (P = .007 for both). There was also a trend toward better EFS for tumors positive for both PD-L1 and CD8, but this was not significant.
For Ewing sarcoma, PD-1 was found to be expressed on tumor rather than on lymphocytes in 19% of all samples, and PD-1 expression was found to be associated with worse EFS. PD-1 was also found in tumors of all desmoplastic small round cell tumor samples, but this group was too small to determine significance, Ms. van Erp said.
She acknowledged that the study was limited by the use of tissue microarray sampling rather than examination of the whole tumor and its microenvironment. In addition, no functional assays have been performed to determine the clinical relevance of PD-1 expression for either Ewing sarcoma or desmoplastic small round cell tumor cells.
“In this study, we looked at the primary tumors for these subtypes, and as we know that there can be a difference in the pattern of expression between primary tumors and metastatic tumors in sarcoma subtypes, and as sarcoma patients are in great need for new therapeutic options, it would be very interesting to look at the expression of PD-1. PD-L1, and CD8 in these tumor types in metastatic disease,’ she said.
The study was supported by Radboud University; the Princess Maxima Center for Pediatric Oncology in Utrecht, the Netherlands; and the Institute of Cancer Research and Royal Marsden NHS Foundation Trust in London. The authors reported no conflicts of interest.
AMSTERDAM – Immune checkpoint inhibitors targeted against programmed death–1 (PD-1) and its ligand (PD-L1) show strong activity against several different tumor types, but unfortunately may have only limited efficacy against soft tissue and bone sarcomas, investigators reported.
“We found that the clinical expression of PD-1, PD-L1, and CD8 is sarcoma subtype dependent,” said Anke van Erp, a PhD candidate in oncology at Radboud University Medical Center in Nijmegen, the Netherlands.
“The introduction of PD-1 antibodies has led to increased interest in the expression of PD-1, PD-L1, and CD8 in a large variety of tumor types, and has shown in several of these tumor types that PD-L1 could be associated with a worse prognosis. In addition, treatment with PD-1 antibodies has shown impressive effects in an increasing number of adult tumors. This makes the exploration of PD-1 blockade in sarcoma of interest,” she said.
Additionally, CD8-positive T cells are of interest because they are critical mediators of adaptive immunity, she noted.
Ms. van Erp and colleagues looked at expression of PD-1, PD-L1, and the presence of CD8-positive cells in formalin-fixed, paraffin-embedded tumor samples from patients with one of six sarcoma subtypes: primary osteosarcoma (48 samples), Ewing sarcoma (32), alveolar rhabdomyosarcoma (28), embryonal rhabdomyosarcoma (78), synovial sarcoma (23), and desmoplastic small round cell tumors (8).
The samples were analyzed by immunohistochemistry for the expression of PD-1, PD-L1, and CD8-positive cells, and expression levels were then correlated with clinical outcomes.
The investigators classified expression of markers on less than 10% of cells in a sample as negative, 10%-50% as positive, and more than 50% as highly positive.
PD-1 was expressed in lymphocytes in 6% of all samples, and in 19% of all tumors. PD-L1 was expressed in 10%, and CD8-positive cells in 46%.
Only 2% of samples expressed both PD-1 and PD-L1, 11% expressed both PD-1 and CD8-positive T cells, 7% had PD-L1 and CD8, and 2% expressed all three markers.
The highest percentages of PD-1 expression were in lymphocytes from synovial sarcoma samples (17%), and the highest levels of PD-1 were seen in alveolar rhabdomyosarcoma samples. However, neither PD-1 nor PD-L1 were detected at significant levels in synovial sarcoma tumor cells, and PD-1 was not detected in tumor cells from alveolar rhabdomyosarcoma.
“These data show that there is a high difference between the different subtypes, and they highlight the need to really look at PD-1 blockade per individual subtype,” Ms. van Erp said.
For all subtypes combined, the OS was significantly better for patients with PD-L1 positive vs. PD-L1–negative tumors out to 25 years of follow-up (P = .028). Similarly OS was better for patients with PD-L1–positive, CD8-positive tumors, compared with tumors negative for both markers (P = .020).
When they looked at individual sarcoma subtypes, however, they saw significant results only for alveolar rhabdomyosarcoma, with PD-L1 positivity vs. negativity associated with better OS and EFS out to more than 10.5 years (P = .007 for both). There was also a trend toward better EFS for tumors positive for both PD-L1 and CD8, but this was not significant.
For Ewing sarcoma, PD-1 was found to be expressed on tumor rather than on lymphocytes in 19% of all samples, and PD-1 expression was found to be associated with worse EFS. PD-1 was also found in tumors of all desmoplastic small round cell tumor samples, but this group was too small to determine significance, Ms. van Erp said.
She acknowledged that the study was limited by the use of tissue microarray sampling rather than examination of the whole tumor and its microenvironment. In addition, no functional assays have been performed to determine the clinical relevance of PD-1 expression for either Ewing sarcoma or desmoplastic small round cell tumor cells.
“In this study, we looked at the primary tumors for these subtypes, and as we know that there can be a difference in the pattern of expression between primary tumors and metastatic tumors in sarcoma subtypes, and as sarcoma patients are in great need for new therapeutic options, it would be very interesting to look at the expression of PD-1. PD-L1, and CD8 in these tumor types in metastatic disease,’ she said.
The study was supported by Radboud University; the Princess Maxima Center for Pediatric Oncology in Utrecht, the Netherlands; and the Institute of Cancer Research and Royal Marsden NHS Foundation Trust in London. The authors reported no conflicts of interest.
AT ECCO2017
Key clinical point: PD-1, PD-L1, and CD8 expression in tumors varies by sarcoma subtype, suggesting that success of PD-1 blockade may be subtype dependent.
Major finding: PD-L1 positivity was associated with better overall and event-free survival only in alveolar rhabdomyosarcoma.
Data source: Retrospective review of tumor samples from patients with one of six sarcoma subtypes.
Disclosures: The study was supported by Radboud University; the Princess Maxima Center for Pediatric Oncology in Utrecht, the Netherlands; and the Institute of Cancer Research and Royal Marsden NHS Foundation Trust in London. The authors reported no conflicts of interest.
GU Cancers Symposium to feature latest on immune checkpoint inhibitors, circulating tumor cells
Oncology Practice will be on site this coming week at the 2017 Genitourinary Cancers Symposium in Orlando with the latest on treatment of prostate, kidney, testicular, and urothelial cancers. Look for coverage of the best clinical presentations at the conference, hosted by the American Society of Clinical Oncology, ASTRO, and the Society of Urologic Oncology, including the following and more, beginning Thursday, Feb. 16:
- Outcomes of PD-1/PD-L1 responders who discontinued therapy for immune-related adverse events: Results of a cohort of patients with metastatic renal cell carcinoma. First author: Rana McKay, MD.
- Impact of antibiotics on outcome in patients with metastatic renal cell carcinoma treated with immune checkpoint inhibitors. First author: Lisa Derosa, MD.
- Circulating tumor (ct)-DNA alterations in metastatic castration-resistant prostate cancer (mCRPC): Association with outcomes and evolution with therapy. First author: Guru Sonpavde, MD.
- Evolution of circulating tumor DNA profile from first-line to second-line therapy in metastatic renal cell carcinoma.
- First author: Sumanta Pal, MD.
- Clinical significance of AR mRNA quantification from circulating tumor cells in men with metastatic castration-resistant prostate cancer treated with abiraterone (Abi) or enzalutamide (Enza). First author: John Silberstein, MD.
- Adjuvant androgen deprivation versus mitoxantrone plus prednisone plus ADT in high-risk prostate cancer patients following radical prostatectomy: A phase III intergroup trial (SWOG S9921) NCT00004124. First author: L. Glode, MD.
Oncology Practice will be on site this coming week at the 2017 Genitourinary Cancers Symposium in Orlando with the latest on treatment of prostate, kidney, testicular, and urothelial cancers. Look for coverage of the best clinical presentations at the conference, hosted by the American Society of Clinical Oncology, ASTRO, and the Society of Urologic Oncology, including the following and more, beginning Thursday, Feb. 16:
- Outcomes of PD-1/PD-L1 responders who discontinued therapy for immune-related adverse events: Results of a cohort of patients with metastatic renal cell carcinoma. First author: Rana McKay, MD.
- Impact of antibiotics on outcome in patients with metastatic renal cell carcinoma treated with immune checkpoint inhibitors. First author: Lisa Derosa, MD.
- Circulating tumor (ct)-DNA alterations in metastatic castration-resistant prostate cancer (mCRPC): Association with outcomes and evolution with therapy. First author: Guru Sonpavde, MD.
- Evolution of circulating tumor DNA profile from first-line to second-line therapy in metastatic renal cell carcinoma.
- First author: Sumanta Pal, MD.
- Clinical significance of AR mRNA quantification from circulating tumor cells in men with metastatic castration-resistant prostate cancer treated with abiraterone (Abi) or enzalutamide (Enza). First author: John Silberstein, MD.
- Adjuvant androgen deprivation versus mitoxantrone plus prednisone plus ADT in high-risk prostate cancer patients following radical prostatectomy: A phase III intergroup trial (SWOG S9921) NCT00004124. First author: L. Glode, MD.
Oncology Practice will be on site this coming week at the 2017 Genitourinary Cancers Symposium in Orlando with the latest on treatment of prostate, kidney, testicular, and urothelial cancers. Look for coverage of the best clinical presentations at the conference, hosted by the American Society of Clinical Oncology, ASTRO, and the Society of Urologic Oncology, including the following and more, beginning Thursday, Feb. 16:
- Outcomes of PD-1/PD-L1 responders who discontinued therapy for immune-related adverse events: Results of a cohort of patients with metastatic renal cell carcinoma. First author: Rana McKay, MD.
- Impact of antibiotics on outcome in patients with metastatic renal cell carcinoma treated with immune checkpoint inhibitors. First author: Lisa Derosa, MD.
- Circulating tumor (ct)-DNA alterations in metastatic castration-resistant prostate cancer (mCRPC): Association with outcomes and evolution with therapy. First author: Guru Sonpavde, MD.
- Evolution of circulating tumor DNA profile from first-line to second-line therapy in metastatic renal cell carcinoma.
- First author: Sumanta Pal, MD.
- Clinical significance of AR mRNA quantification from circulating tumor cells in men with metastatic castration-resistant prostate cancer treated with abiraterone (Abi) or enzalutamide (Enza). First author: John Silberstein, MD.
- Adjuvant androgen deprivation versus mitoxantrone plus prednisone plus ADT in high-risk prostate cancer patients following radical prostatectomy: A phase III intergroup trial (SWOG S9921) NCT00004124. First author: L. Glode, MD.
FROM THE GENITOURINARY CANCERS SYMPOSIUM
Conference News Roundup—Association of Academic Physiatrists
Controlling a Prosthesis With a Brain-Computer Interface
A brain-computer interface (BCI) that uses surface scalp electrodes can help a patient control a lower-extremity prosthesis and thus improve his or her daily life, researchers reported.
A BCI allows a person to control a computer using his or her thoughts. The person is trained to use a specific thought such as flexing a knee for control. The thought generates electrical activity in the nerve cells and brainwaves. A chip can be implanted in the brain to monitor electrical activity, or electrodes can be placed on the scalp to monitor brainwaves. In people with paralysis or amputation, a BCI can help control the movement of muscles, limbs, and prosthetics.
"In general, using a prosthesis is an unnatural act that requires training [and] extra effort and can have a certain amount of awkwardness to it," said Douglas P. Murphy, MD, Associate Professor of Physical Medicine and Rehabilitation at Virginia Commonwealth University in Richmond. Dr. Murphy and colleagues sought to establish the feasibility of manipulating a prosthetic knee with a BCI. The use of a prosthesis can be difficult when climbing stairs or ramps, for example. The goal of all prosthetic research is to establish the same ease, comfort, and ability that the patient had with his or her natural leg, and controlling a prosthesis with thought is a big step in that direction, said Dr. Murphy.
Dr. Murphy's team worked with a person whose leg had been amputated above the knee (ie, a transfemoral amputee). Using surface scalp electrodes to transmit brainwave data to a computer software program, the participant learned how to activate a knee-unlocking switch through mental imaging. Surface scalp electrodes transmitted brainwave data to a software program that was keyed to activate the switch when the event-related desynchronization (ERD) in the EEG recording reached a certain threshold.
"In our first attempt at using BCI with a lower extremity prosthesis, we wanted to test a simple system before moving on to more complicated ones to test the feasibility of the concept," said Dr. Murphy. "Thus, we chose control of the simplest prosthetic knee, which is the manual locking knee. When locked, the knee is rigid and straight, and when unlocked, the knee swings freely. Someone with an above-knee amputation would have to physically unlock the knee to sit and could lock or unlock in standing or walking, depending on his or her needs. We were interested to see if our participant could literally think his way to unlocking his prosthetic."
The participant learned to activate the knee-unlocking switch on his prosthesis that turned on a motor and unlocked his prosthetic knee. He walked up and down parallel bars while demonstrating his ability to unlock the knee to swing his leg and to sit down. Throughout the study, the participant was able to successfully unlock his knee between 50% and 100% of the time, and he responded to a questionnaire about his reactions to using the BCI with his prosthesis.
"The ultimate goal of this research is to provide the individual with a prosthesis that more easily and more successfully meets his or her needs for movement and walking," said Dr. Murphy. "The system should be comfortable [and] easy to use and serve useful purposes. The patient's subjective experience should reflect these goals. Our subject gave a good example of how this system could help him. He likes to hike with his children. Sometimes he is carrying his daughter and coming down a hill. With BCI control, he could adjust his prosthesis for descending the hill easily. This is the type of daily life activity we believe can be improved with BCI."
Based on this study, the BCI-controlled prosthesis would give patients a hands-free system of control, as well as a prosthesis that is responsive to more of their needs and takes less energy to use in complex environments. This system is in the early stages of development, and research is continuing.
College Students Take Longer to Recover From a Concussion
College students take significantly more time to recover from a concussion than the general national average of seven to 14 days, investigators reported.
The Centers for Disease Control and Prevention estimates that between 1.6 million and 3.8 million concussions occur in the United States each year. On average, a person takes seven to 14 days to recover from a concussion. "This duration is in the pediatric and sports-specific populations, however. No prior study has evaluated the outcome of concussions in a collegiate student population," said Prakash Jayabalan, MD, PhD, Assistant Professor of Physical Medicine and Rehabilitation at Northwestern University Feinberg School of Medicine in Chicago. "This population is unique in that it is heterogeneous in individual sporting activity (varsity vs club sports vs recreational activity), and students can have relatively high academic demands placed on them.
"The pivotal consensus statement on concussion in sport from the Fourth International Conference on Concussions advocates for cognitive rest. Yet maintaining a period of cognitive rest in collegiate students is particularly challenging due to the academic rigors of their schooling. Therefore, our research team wanted to determine if recovery time for patients in a college setting is different from those people outside of that setting," said Dr. Jayabalan.
To answer this question, Dr. Jayabalan and colleagues reviewed the medical charts of 128 students who were seen for concussion during the 2014-2015 academic year. They included subjects aged 18 or older at evaluation and enrolled as full-time students. Subjects were diagnosed with a concussion using the consensus statement on Concussion in Sport from the Zurich Guidelines. The investigators excluded subjects not examined within the first seven days after injury, those who did not complain of concussion-related symptoms on initial examination, those who did not complete the Standardized Concussion Assessment Tool, and those who did not provide a specific date of injury or date of symptom resolution.
On average, the students were age 20, and the population was 53.1% female. Forty-four students were varsity athletes, 33 played club sports, 34 played recreational sports, and 17 did not engage in regular physical activity or did not report their activity level.
The average duration of concussion symptoms for all subjects was 17.89 days. Dr. Jayabalan's team found that varsity athletes experienced a shorter duration of concussion symptoms (mean, 11.5 days), compared with club athletes (mean, 18.61 days) and recreational athletes (mean, 22.59 days). This difference could result from the higher amount of medical support student athletes receive, said Dr. Jayabalan. Concussions that were related to sports were shorter in duration (mean, 14.96 days), compared with those that were sustained during nonsporting activity (mean, 21.75 days).
Female students took longer to recover, compared with men (20.79 days vs 14.60 days). People with seizure disorders or prior concussions were more likely to have symptoms that lasted longer than 28 days. Finally, graduate students took two weeks longer to recover, compared with undergraduates (31 days vs 16 days), although the number of graduate students with concussion was relatively small in this study.
"This is the first cross-sectional study reporting the outcome of concussions at a collegiate institution," said Dr. Jayabalan. University students who sustain a concussion need improved resources, he added. "The findings in our study highlight the difficulty in treating collegiate students with concussions, due to both the academic rigors of institutions and the differing needs of student populations. The study also provides insight into at-risk subsets of the student population. Factors such as level of sport, year in school, athlete versus nonathlete, premorbid conditions, and gender may affect outcome, and this needs to be an important consideration for the physician managing concussed college students."
As a next step, the research team plans to implement resources for students with concussion and assess their effect on recovery.
Day of Hospital Admission May Affect Outcome of Head Trauma
Older adults who are admitted to the hospital with head trauma during the weekend have a 14% increased risk of dying, compared with those admitted on a weekday, according to researchers.
Weekend hospital admission is associated with higher instances of death in cardiovascular emergencies and stroke, but the effect of weekend admissions on patients with head trauma is not well defined. Researchers from the University of Texas Southwestern Medical School, Johns Hopkins University School of Medicine, and the Johns Hopkins Bloomberg School of Public Health used data from the 2006, 2007, and 2008 Nationwide Inpatient Sample—a large, publicly available dataset that contains a sampling of data for seven million hospital stays each year—to determine whether older adults admitted to the hospital for head trauma during the weekend were at a higher mortality risk than those admitted during the week.
"Older adults are some of the most vulnerable members of our society, and multiple studies point to differences in outcomes for older adult patients. After seeing the weekend trend in other areas, we wanted to see if a similar pattern existed for older adult patients suffering traumatic head injuries," said Salman Hirani, MD, a second-year resident in the department of rehabilitation medicine at Icahn School of Medicine at Mount Sinai in New York City.
The team identified 38,675 patients with head injury in the sample who met their criteria, which included serious and severe head injuries, based on the Abbreviated Injury Scale (AIS). Individuals between ages 65 and 89 with head AIS equal to 3 or 4 and no other region score less than 3 were included. The researchers calculated Individual Charlson comorbidity scores and excluded individuals with missing mortality, sex, or insurance data. Dr. Hirani and colleagues used Wilcoxon rank sum and Student t-tests to compare demographics, length of stay, and total charges for weekday versus weekend admissions. The χ2 tests compared sex and head injury severity. The investigators used logistic regression to model mortality, adjusting for age, sex, injury severity, comorbidity, and insurance status.
From the initial group, the researchers identified 9,937 patients (25.6%) who were admitted during the weekend. The average age of patients admitted during the weekend and those admitted on weekdays was 78. Weekend patients had fewer additional injuries and coexisting diseases outside of head trauma, compared with those admitted during the week (mean Charlson, 1.07 vs 1.14). Weekend patients also had lower head injury severity (58.3% vs 60.8% of weekday patients had an AIS of 4). Weekend patients were also predominantly female, when compared with weekday patients (52% vs 50%).
The median length of stay in the hospital was one day shorter for weekend patients (four days vs five days), said Dr. Hirani. In addition, the investigators found no significant differences in the charges incurred during each patient's stay. The average charge for weekend patients was $27,128 per patient per stay, compared with $27,703 per patient per stay for weekday patients.
Where the groups differed was in the percentage of patients who did not survive their injuries. Proportional mortality was higher among weekend patients (9.3% vs 8.4%). After the researchers adjusted the data, weekend patients had a 14% increased risk of death, compared with weekday patients. For patients that survive their hospital stay, long term morbidity and functional capacity is not noted in the literature, said Dr. Hirani. Early rehabilitation intervention has been shown to reduce morbidity in such patients and could be critical for patients' long-term survival, he added.
"Overall, weekend patients were less severely injured, had fewer coexisting diseases and conditions, and generated the same amount of charges for their care as weekday patients, yet they experienced a greater likelihood of death," says Dr. Hirani. "While we are not sure of the exact reason for this [result], we can continue to investigate and encourage hospitals to take a look at their own outcomes in order to put into place policies that would improve survival for older adults with traumatic brain injuries. Ultimately, we know that Level I trauma centers do not exhibit this weekend effect. It may then be important for an older adult with a traumatic brain injury, especially those occurring over the weekend, to be admitted to or transferred to a Level I trauma center or a facility with full-time staffing around the clock, as these patients may require closer observation."
What Are the Long-Term Effects of Traumatic Brain Injury?
Many parents whose children have had a traumatic brain injury (TBI) want to know what their children will be like 10 years after the injury. Research is beginning to indicate answers to this question.
Investigators from Cincinnati Children's Hospital have conducted research on the long-term effects of TBI. They currently have data for an average of seven years after injury. Patients with mild to moderate brain injuries are two times more likely to have developed attention problems, and those with severe injuries are five times more likely to develop secondary ADHD. These researchers are also finding that the family environment influences the development of these attention problems.
Parenting and the home environment exert a powerful influence on recovery. Children with severe TBI in optimal environments may show few effects of their injuries, while children with milder injuries from disadvantaged or chaotic homes often demonstrate persistent problems, according to the data.
Early family response may be particularly important for long-term outcomes, suggesting that working to promote effective parenting may be an important early intervention. Certain skills that can affect social functioning, such as speed of information processing, inhibition, and reasoning, show greater long-term effects. Many children do well in the long term after brain injury, and most do not have across-the-board deficits.
More than 630,000 children and teenagers in the United States are treated in emergency rooms for TBI each year. But predictors of recovery following TBI are unclear. These environmental factors include family functioning, parenting practices, home environment, and socioeconomic status. Researchers at Cincinnati Children's hospital are working to identify genes that affect recovery after TBI and to understand how these genes may interact with environmental factors to influence recovery.
The investigators will be collecting salivary DNA samples from more than 330 children participating in the Approaches and Decisions in Acute Pediatric TBI Trial. The primary outcome will be global functioning at 3, 6, and 12 months post injury, and secondary outcomes will include a comprehensive assessment of cognitive and behavioral functioning at 12 months post injury. This project will provide information to inform individualized prognosis and treatment plans.
Controlling a Prosthesis With a Brain-Computer Interface
A brain-computer interface (BCI) that uses surface scalp electrodes can help a patient control a lower-extremity prosthesis and thus improve his or her daily life, researchers reported.
A BCI allows a person to control a computer using his or her thoughts. The person is trained to use a specific thought such as flexing a knee for control. The thought generates electrical activity in the nerve cells and brainwaves. A chip can be implanted in the brain to monitor electrical activity, or electrodes can be placed on the scalp to monitor brainwaves. In people with paralysis or amputation, a BCI can help control the movement of muscles, limbs, and prosthetics.
"In general, using a prosthesis is an unnatural act that requires training [and] extra effort and can have a certain amount of awkwardness to it," said Douglas P. Murphy, MD, Associate Professor of Physical Medicine and Rehabilitation at Virginia Commonwealth University in Richmond. Dr. Murphy and colleagues sought to establish the feasibility of manipulating a prosthetic knee with a BCI. The use of a prosthesis can be difficult when climbing stairs or ramps, for example. The goal of all prosthetic research is to establish the same ease, comfort, and ability that the patient had with his or her natural leg, and controlling a prosthesis with thought is a big step in that direction, said Dr. Murphy.
Dr. Murphy's team worked with a person whose leg had been amputated above the knee (ie, a transfemoral amputee). Using surface scalp electrodes to transmit brainwave data to a computer software program, the participant learned how to activate a knee-unlocking switch through mental imaging. Surface scalp electrodes transmitted brainwave data to a software program that was keyed to activate the switch when the event-related desynchronization (ERD) in the EEG recording reached a certain threshold.
"In our first attempt at using BCI with a lower extremity prosthesis, we wanted to test a simple system before moving on to more complicated ones to test the feasibility of the concept," said Dr. Murphy. "Thus, we chose control of the simplest prosthetic knee, which is the manual locking knee. When locked, the knee is rigid and straight, and when unlocked, the knee swings freely. Someone with an above-knee amputation would have to physically unlock the knee to sit and could lock or unlock in standing or walking, depending on his or her needs. We were interested to see if our participant could literally think his way to unlocking his prosthetic."
The participant learned to activate the knee-unlocking switch on his prosthesis that turned on a motor and unlocked his prosthetic knee. He walked up and down parallel bars while demonstrating his ability to unlock the knee to swing his leg and to sit down. Throughout the study, the participant was able to successfully unlock his knee between 50% and 100% of the time, and he responded to a questionnaire about his reactions to using the BCI with his prosthesis.
"The ultimate goal of this research is to provide the individual with a prosthesis that more easily and more successfully meets his or her needs for movement and walking," said Dr. Murphy. "The system should be comfortable [and] easy to use and serve useful purposes. The patient's subjective experience should reflect these goals. Our subject gave a good example of how this system could help him. He likes to hike with his children. Sometimes he is carrying his daughter and coming down a hill. With BCI control, he could adjust his prosthesis for descending the hill easily. This is the type of daily life activity we believe can be improved with BCI."
Based on this study, the BCI-controlled prosthesis would give patients a hands-free system of control, as well as a prosthesis that is responsive to more of their needs and takes less energy to use in complex environments. This system is in the early stages of development, and research is continuing.
College Students Take Longer to Recover From a Concussion
College students take significantly more time to recover from a concussion than the general national average of seven to 14 days, investigators reported.
The Centers for Disease Control and Prevention estimates that between 1.6 million and 3.8 million concussions occur in the United States each year. On average, a person takes seven to 14 days to recover from a concussion. "This duration is in the pediatric and sports-specific populations, however. No prior study has evaluated the outcome of concussions in a collegiate student population," said Prakash Jayabalan, MD, PhD, Assistant Professor of Physical Medicine and Rehabilitation at Northwestern University Feinberg School of Medicine in Chicago. "This population is unique in that it is heterogeneous in individual sporting activity (varsity vs club sports vs recreational activity), and students can have relatively high academic demands placed on them.
"The pivotal consensus statement on concussion in sport from the Fourth International Conference on Concussions advocates for cognitive rest. Yet maintaining a period of cognitive rest in collegiate students is particularly challenging due to the academic rigors of their schooling. Therefore, our research team wanted to determine if recovery time for patients in a college setting is different from those people outside of that setting," said Dr. Jayabalan.
To answer this question, Dr. Jayabalan and colleagues reviewed the medical charts of 128 students who were seen for concussion during the 2014-2015 academic year. They included subjects aged 18 or older at evaluation and enrolled as full-time students. Subjects were diagnosed with a concussion using the consensus statement on Concussion in Sport from the Zurich Guidelines. The investigators excluded subjects not examined within the first seven days after injury, those who did not complain of concussion-related symptoms on initial examination, those who did not complete the Standardized Concussion Assessment Tool, and those who did not provide a specific date of injury or date of symptom resolution.
On average, the students were age 20, and the population was 53.1% female. Forty-four students were varsity athletes, 33 played club sports, 34 played recreational sports, and 17 did not engage in regular physical activity or did not report their activity level.
The average duration of concussion symptoms for all subjects was 17.89 days. Dr. Jayabalan's team found that varsity athletes experienced a shorter duration of concussion symptoms (mean, 11.5 days), compared with club athletes (mean, 18.61 days) and recreational athletes (mean, 22.59 days). This difference could result from the higher amount of medical support student athletes receive, said Dr. Jayabalan. Concussions that were related to sports were shorter in duration (mean, 14.96 days), compared with those that were sustained during nonsporting activity (mean, 21.75 days).
Female students took longer to recover, compared with men (20.79 days vs 14.60 days). People with seizure disorders or prior concussions were more likely to have symptoms that lasted longer than 28 days. Finally, graduate students took two weeks longer to recover, compared with undergraduates (31 days vs 16 days), although the number of graduate students with concussion was relatively small in this study.
"This is the first cross-sectional study reporting the outcome of concussions at a collegiate institution," said Dr. Jayabalan. University students who sustain a concussion need improved resources, he added. "The findings in our study highlight the difficulty in treating collegiate students with concussions, due to both the academic rigors of institutions and the differing needs of student populations. The study also provides insight into at-risk subsets of the student population. Factors such as level of sport, year in school, athlete versus nonathlete, premorbid conditions, and gender may affect outcome, and this needs to be an important consideration for the physician managing concussed college students."
As a next step, the research team plans to implement resources for students with concussion and assess their effect on recovery.
Day of Hospital Admission May Affect Outcome of Head Trauma
Older adults who are admitted to the hospital with head trauma during the weekend have a 14% increased risk of dying, compared with those admitted on a weekday, according to researchers.
Weekend hospital admission is associated with higher instances of death in cardiovascular emergencies and stroke, but the effect of weekend admissions on patients with head trauma is not well defined. Researchers from the University of Texas Southwestern Medical School, Johns Hopkins University School of Medicine, and the Johns Hopkins Bloomberg School of Public Health used data from the 2006, 2007, and 2008 Nationwide Inpatient Sample—a large, publicly available dataset that contains a sampling of data for seven million hospital stays each year—to determine whether older adults admitted to the hospital for head trauma during the weekend were at a higher mortality risk than those admitted during the week.
"Older adults are some of the most vulnerable members of our society, and multiple studies point to differences in outcomes for older adult patients. After seeing the weekend trend in other areas, we wanted to see if a similar pattern existed for older adult patients suffering traumatic head injuries," said Salman Hirani, MD, a second-year resident in the department of rehabilitation medicine at Icahn School of Medicine at Mount Sinai in New York City.
The team identified 38,675 patients with head injury in the sample who met their criteria, which included serious and severe head injuries, based on the Abbreviated Injury Scale (AIS). Individuals between ages 65 and 89 with head AIS equal to 3 or 4 and no other region score less than 3 were included. The researchers calculated Individual Charlson comorbidity scores and excluded individuals with missing mortality, sex, or insurance data. Dr. Hirani and colleagues used Wilcoxon rank sum and Student t-tests to compare demographics, length of stay, and total charges for weekday versus weekend admissions. The χ2 tests compared sex and head injury severity. The investigators used logistic regression to model mortality, adjusting for age, sex, injury severity, comorbidity, and insurance status.
From the initial group, the researchers identified 9,937 patients (25.6%) who were admitted during the weekend. The average age of patients admitted during the weekend and those admitted on weekdays was 78. Weekend patients had fewer additional injuries and coexisting diseases outside of head trauma, compared with those admitted during the week (mean Charlson, 1.07 vs 1.14). Weekend patients also had lower head injury severity (58.3% vs 60.8% of weekday patients had an AIS of 4). Weekend patients were also predominantly female, when compared with weekday patients (52% vs 50%).
The median length of stay in the hospital was one day shorter for weekend patients (four days vs five days), said Dr. Hirani. In addition, the investigators found no significant differences in the charges incurred during each patient's stay. The average charge for weekend patients was $27,128 per patient per stay, compared with $27,703 per patient per stay for weekday patients.
Where the groups differed was in the percentage of patients who did not survive their injuries. Proportional mortality was higher among weekend patients (9.3% vs 8.4%). After the researchers adjusted the data, weekend patients had a 14% increased risk of death, compared with weekday patients. For patients that survive their hospital stay, long term morbidity and functional capacity is not noted in the literature, said Dr. Hirani. Early rehabilitation intervention has been shown to reduce morbidity in such patients and could be critical for patients' long-term survival, he added.
"Overall, weekend patients were less severely injured, had fewer coexisting diseases and conditions, and generated the same amount of charges for their care as weekday patients, yet they experienced a greater likelihood of death," says Dr. Hirani. "While we are not sure of the exact reason for this [result], we can continue to investigate and encourage hospitals to take a look at their own outcomes in order to put into place policies that would improve survival for older adults with traumatic brain injuries. Ultimately, we know that Level I trauma centers do not exhibit this weekend effect. It may then be important for an older adult with a traumatic brain injury, especially those occurring over the weekend, to be admitted to or transferred to a Level I trauma center or a facility with full-time staffing around the clock, as these patients may require closer observation."
What Are the Long-Term Effects of Traumatic Brain Injury?
Many parents whose children have had a traumatic brain injury (TBI) want to know what their children will be like 10 years after the injury. Research is beginning to indicate answers to this question.
Investigators from Cincinnati Children's Hospital have conducted research on the long-term effects of TBI. They currently have data for an average of seven years after injury. Patients with mild to moderate brain injuries are two times more likely to have developed attention problems, and those with severe injuries are five times more likely to develop secondary ADHD. These researchers are also finding that the family environment influences the development of these attention problems.
Parenting and the home environment exert a powerful influence on recovery. Children with severe TBI in optimal environments may show few effects of their injuries, while children with milder injuries from disadvantaged or chaotic homes often demonstrate persistent problems, according to the data.
Early family response may be particularly important for long-term outcomes, suggesting that working to promote effective parenting may be an important early intervention. Certain skills that can affect social functioning, such as speed of information processing, inhibition, and reasoning, show greater long-term effects. Many children do well in the long term after brain injury, and most do not have across-the-board deficits.
More than 630,000 children and teenagers in the United States are treated in emergency rooms for TBI each year. But predictors of recovery following TBI are unclear. These environmental factors include family functioning, parenting practices, home environment, and socioeconomic status. Researchers at Cincinnati Children's hospital are working to identify genes that affect recovery after TBI and to understand how these genes may interact with environmental factors to influence recovery.
The investigators will be collecting salivary DNA samples from more than 330 children participating in the Approaches and Decisions in Acute Pediatric TBI Trial. The primary outcome will be global functioning at 3, 6, and 12 months post injury, and secondary outcomes will include a comprehensive assessment of cognitive and behavioral functioning at 12 months post injury. This project will provide information to inform individualized prognosis and treatment plans.
Controlling a Prosthesis With a Brain-Computer Interface
A brain-computer interface (BCI) that uses surface scalp electrodes can help a patient control a lower-extremity prosthesis and thus improve his or her daily life, researchers reported.
A BCI allows a person to control a computer using his or her thoughts. The person is trained to use a specific thought such as flexing a knee for control. The thought generates electrical activity in the nerve cells and brainwaves. A chip can be implanted in the brain to monitor electrical activity, or electrodes can be placed on the scalp to monitor brainwaves. In people with paralysis or amputation, a BCI can help control the movement of muscles, limbs, and prosthetics.
"In general, using a prosthesis is an unnatural act that requires training [and] extra effort and can have a certain amount of awkwardness to it," said Douglas P. Murphy, MD, Associate Professor of Physical Medicine and Rehabilitation at Virginia Commonwealth University in Richmond. Dr. Murphy and colleagues sought to establish the feasibility of manipulating a prosthetic knee with a BCI. The use of a prosthesis can be difficult when climbing stairs or ramps, for example. The goal of all prosthetic research is to establish the same ease, comfort, and ability that the patient had with his or her natural leg, and controlling a prosthesis with thought is a big step in that direction, said Dr. Murphy.
Dr. Murphy's team worked with a person whose leg had been amputated above the knee (ie, a transfemoral amputee). Using surface scalp electrodes to transmit brainwave data to a computer software program, the participant learned how to activate a knee-unlocking switch through mental imaging. Surface scalp electrodes transmitted brainwave data to a software program that was keyed to activate the switch when the event-related desynchronization (ERD) in the EEG recording reached a certain threshold.
"In our first attempt at using BCI with a lower extremity prosthesis, we wanted to test a simple system before moving on to more complicated ones to test the feasibility of the concept," said Dr. Murphy. "Thus, we chose control of the simplest prosthetic knee, which is the manual locking knee. When locked, the knee is rigid and straight, and when unlocked, the knee swings freely. Someone with an above-knee amputation would have to physically unlock the knee to sit and could lock or unlock in standing or walking, depending on his or her needs. We were interested to see if our participant could literally think his way to unlocking his prosthetic."
The participant learned to activate the knee-unlocking switch on his prosthesis that turned on a motor and unlocked his prosthetic knee. He walked up and down parallel bars while demonstrating his ability to unlock the knee to swing his leg and to sit down. Throughout the study, the participant was able to successfully unlock his knee between 50% and 100% of the time, and he responded to a questionnaire about his reactions to using the BCI with his prosthesis.
"The ultimate goal of this research is to provide the individual with a prosthesis that more easily and more successfully meets his or her needs for movement and walking," said Dr. Murphy. "The system should be comfortable [and] easy to use and serve useful purposes. The patient's subjective experience should reflect these goals. Our subject gave a good example of how this system could help him. He likes to hike with his children. Sometimes he is carrying his daughter and coming down a hill. With BCI control, he could adjust his prosthesis for descending the hill easily. This is the type of daily life activity we believe can be improved with BCI."
Based on this study, the BCI-controlled prosthesis would give patients a hands-free system of control, as well as a prosthesis that is responsive to more of their needs and takes less energy to use in complex environments. This system is in the early stages of development, and research is continuing.
College Students Take Longer to Recover From a Concussion
College students take significantly more time to recover from a concussion than the general national average of seven to 14 days, investigators reported.
The Centers for Disease Control and Prevention estimates that between 1.6 million and 3.8 million concussions occur in the United States each year. On average, a person takes seven to 14 days to recover from a concussion. "This duration is in the pediatric and sports-specific populations, however. No prior study has evaluated the outcome of concussions in a collegiate student population," said Prakash Jayabalan, MD, PhD, Assistant Professor of Physical Medicine and Rehabilitation at Northwestern University Feinberg School of Medicine in Chicago. "This population is unique in that it is heterogeneous in individual sporting activity (varsity vs club sports vs recreational activity), and students can have relatively high academic demands placed on them.
"The pivotal consensus statement on concussion in sport from the Fourth International Conference on Concussions advocates for cognitive rest. Yet maintaining a period of cognitive rest in collegiate students is particularly challenging due to the academic rigors of their schooling. Therefore, our research team wanted to determine if recovery time for patients in a college setting is different from those people outside of that setting," said Dr. Jayabalan.
To answer this question, Dr. Jayabalan and colleagues reviewed the medical charts of 128 students who were seen for concussion during the 2014-2015 academic year. They included subjects aged 18 or older at evaluation and enrolled as full-time students. Subjects were diagnosed with a concussion using the consensus statement on Concussion in Sport from the Zurich Guidelines. The investigators excluded subjects not examined within the first seven days after injury, those who did not complain of concussion-related symptoms on initial examination, those who did not complete the Standardized Concussion Assessment Tool, and those who did not provide a specific date of injury or date of symptom resolution.
On average, the students were age 20, and the population was 53.1% female. Forty-four students were varsity athletes, 33 played club sports, 34 played recreational sports, and 17 did not engage in regular physical activity or did not report their activity level.
The average duration of concussion symptoms for all subjects was 17.89 days. Dr. Jayabalan's team found that varsity athletes experienced a shorter duration of concussion symptoms (mean, 11.5 days), compared with club athletes (mean, 18.61 days) and recreational athletes (mean, 22.59 days). This difference could result from the higher amount of medical support student athletes receive, said Dr. Jayabalan. Concussions that were related to sports were shorter in duration (mean, 14.96 days), compared with those that were sustained during nonsporting activity (mean, 21.75 days).
Female students took longer to recover, compared with men (20.79 days vs 14.60 days). People with seizure disorders or prior concussions were more likely to have symptoms that lasted longer than 28 days. Finally, graduate students took two weeks longer to recover, compared with undergraduates (31 days vs 16 days), although the number of graduate students with concussion was relatively small in this study.
"This is the first cross-sectional study reporting the outcome of concussions at a collegiate institution," said Dr. Jayabalan. University students who sustain a concussion need improved resources, he added. "The findings in our study highlight the difficulty in treating collegiate students with concussions, due to both the academic rigors of institutions and the differing needs of student populations. The study also provides insight into at-risk subsets of the student population. Factors such as level of sport, year in school, athlete versus nonathlete, premorbid conditions, and gender may affect outcome, and this needs to be an important consideration for the physician managing concussed college students."
As a next step, the research team plans to implement resources for students with concussion and assess their effect on recovery.
Day of Hospital Admission May Affect Outcome of Head Trauma
Older adults who are admitted to the hospital with head trauma during the weekend have a 14% increased risk of dying, compared with those admitted on a weekday, according to researchers.
Weekend hospital admission is associated with higher instances of death in cardiovascular emergencies and stroke, but the effect of weekend admissions on patients with head trauma is not well defined. Researchers from the University of Texas Southwestern Medical School, Johns Hopkins University School of Medicine, and the Johns Hopkins Bloomberg School of Public Health used data from the 2006, 2007, and 2008 Nationwide Inpatient Sample—a large, publicly available dataset that contains a sampling of data for seven million hospital stays each year—to determine whether older adults admitted to the hospital for head trauma during the weekend were at a higher mortality risk than those admitted during the week.
"Older adults are some of the most vulnerable members of our society, and multiple studies point to differences in outcomes for older adult patients. After seeing the weekend trend in other areas, we wanted to see if a similar pattern existed for older adult patients suffering traumatic head injuries," said Salman Hirani, MD, a second-year resident in the department of rehabilitation medicine at Icahn School of Medicine at Mount Sinai in New York City.
The team identified 38,675 patients with head injury in the sample who met their criteria, which included serious and severe head injuries, based on the Abbreviated Injury Scale (AIS). Individuals between ages 65 and 89 with head AIS equal to 3 or 4 and no other region score less than 3 were included. The researchers calculated Individual Charlson comorbidity scores and excluded individuals with missing mortality, sex, or insurance data. Dr. Hirani and colleagues used Wilcoxon rank sum and Student t-tests to compare demographics, length of stay, and total charges for weekday versus weekend admissions. The χ2 tests compared sex and head injury severity. The investigators used logistic regression to model mortality, adjusting for age, sex, injury severity, comorbidity, and insurance status.
From the initial group, the researchers identified 9,937 patients (25.6%) who were admitted during the weekend. The average age of patients admitted during the weekend and those admitted on weekdays was 78. Weekend patients had fewer additional injuries and coexisting diseases outside of head trauma, compared with those admitted during the week (mean Charlson, 1.07 vs 1.14). Weekend patients also had lower head injury severity (58.3% vs 60.8% of weekday patients had an AIS of 4). Weekend patients were also predominantly female, when compared with weekday patients (52% vs 50%).
The median length of stay in the hospital was one day shorter for weekend patients (four days vs five days), said Dr. Hirani. In addition, the investigators found no significant differences in the charges incurred during each patient's stay. The average charge for weekend patients was $27,128 per patient per stay, compared with $27,703 per patient per stay for weekday patients.
Where the groups differed was in the percentage of patients who did not survive their injuries. Proportional mortality was higher among weekend patients (9.3% vs 8.4%). After the researchers adjusted the data, weekend patients had a 14% increased risk of death, compared with weekday patients. For patients that survive their hospital stay, long term morbidity and functional capacity is not noted in the literature, said Dr. Hirani. Early rehabilitation intervention has been shown to reduce morbidity in such patients and could be critical for patients' long-term survival, he added.
"Overall, weekend patients were less severely injured, had fewer coexisting diseases and conditions, and generated the same amount of charges for their care as weekday patients, yet they experienced a greater likelihood of death," says Dr. Hirani. "While we are not sure of the exact reason for this [result], we can continue to investigate and encourage hospitals to take a look at their own outcomes in order to put into place policies that would improve survival for older adults with traumatic brain injuries. Ultimately, we know that Level I trauma centers do not exhibit this weekend effect. It may then be important for an older adult with a traumatic brain injury, especially those occurring over the weekend, to be admitted to or transferred to a Level I trauma center or a facility with full-time staffing around the clock, as these patients may require closer observation."
What Are the Long-Term Effects of Traumatic Brain Injury?
Many parents whose children have had a traumatic brain injury (TBI) want to know what their children will be like 10 years after the injury. Research is beginning to indicate answers to this question.
Investigators from Cincinnati Children's Hospital have conducted research on the long-term effects of TBI. They currently have data for an average of seven years after injury. Patients with mild to moderate brain injuries are two times more likely to have developed attention problems, and those with severe injuries are five times more likely to develop secondary ADHD. These researchers are also finding that the family environment influences the development of these attention problems.
Parenting and the home environment exert a powerful influence on recovery. Children with severe TBI in optimal environments may show few effects of their injuries, while children with milder injuries from disadvantaged or chaotic homes often demonstrate persistent problems, according to the data.
Early family response may be particularly important for long-term outcomes, suggesting that working to promote effective parenting may be an important early intervention. Certain skills that can affect social functioning, such as speed of information processing, inhibition, and reasoning, show greater long-term effects. Many children do well in the long term after brain injury, and most do not have across-the-board deficits.
More than 630,000 children and teenagers in the United States are treated in emergency rooms for TBI each year. But predictors of recovery following TBI are unclear. These environmental factors include family functioning, parenting practices, home environment, and socioeconomic status. Researchers at Cincinnati Children's hospital are working to identify genes that affect recovery after TBI and to understand how these genes may interact with environmental factors to influence recovery.
The investigators will be collecting salivary DNA samples from more than 330 children participating in the Approaches and Decisions in Acute Pediatric TBI Trial. The primary outcome will be global functioning at 3, 6, and 12 months post injury, and secondary outcomes will include a comprehensive assessment of cognitive and behavioral functioning at 12 months post injury. This project will provide information to inform individualized prognosis and treatment plans.
New and Noteworthy Information—March 2017
Serum levels of ubiquitin C-terminal hydrolase-L1 (UCH-L1) and glial fibrillary acidic protein (GFAP) were unable to distinguish between patients with mild traumatic brain injury (mTBI) and patients with orthopedic trauma, according to a study published online ahead of print January 27 in the Journal of Neurotrauma. The results cast doubt on the value of these proposed biomarkers in diagnosing mTBI, the researchers said. Serum UCH-L1 and GFAP were longitudinally measured in 73 patients with acute orthopedic injury and in 93 patients with CT-negative mTBI when they arrived at the hospital and one, two, three, and seven days after admission, as well as at a follow-up visit between three and 10 months after injury. Levels of GFAP were higher in patients with orthopedic trauma than in patients with mTBI on arrival, but subsequent levels did not differ between groups. Levels of UCH-L1 did not significantly differ between the groups.
High-dose immunosuppressive therapy and autologous hematopoietic cell transplantation without maintenance therapy is effective for inducing long-term sustained remission of active relapsing-remitting multiple sclerosis at five years, according to a study published online ahead of print February 1 in Neurology. Twenty-five participants were evaluated for transplant, and 24 participants underwent high-dose immunosuppressive therapy and hematopoietic cell transplantation. Median follow-up was 62 months. Event-free survival (ie, survival without disability progression, relapse, or new lesions on MRI) was 69.2%. Progression-free survival, clinical relapse-free survival, and MRI activity-free survival were 91.3%, 86.9%, and 86.3%, respectively. Adverse events were consistent with toxic effects associated with high-dose immunosuppressive therapy and hematopoietic cell transplantation, including cytopenia and infection. Neurologic disability improved among participants who survived and completed the study, with a median change in Expanded Disability Status Scale score of -0.5.
Estimated glomerular filtration rate on admission is an important predictor of poststroke short-term outcomes, according to a cohort study published in the February issue of Stroke. Investigators analyzed data from 232,236 patients with ischemic stroke in Get With The Guidelines-Stroke. Patients were age 65 or older. In all, 11.8% of patients died during hospitalization or were discharged to hospice, and 38.6% were discharged home. Renal dysfunction was independently associated with an increased risk of in-hospital mortality that was highest among those with an estimated glomerular filtration rate of less than 15 mL/min/1.73 m2 without dialysis (odds ratio, 2.52). In addition, receiving dialysis and having an estimated glomerular filtration rate of less than 29 mL/min/1.73 m2 were associated with lower odds of being discharged home.
Habitual sleep duration in monozygotic twins may be associated with distinct patterns of differential gene expression and pathway enrichment that affect immune response, according to a study published in the January issue of Sleep. Investigators selected 11 healthy monozygotic twin pairs (82% female; mean age, 42.7) based on subjective sleep duration discordance and then monitored participants' habitual sleep duration with two weeks of wrist actigraphy. Peripheral blood leukocyte RNA from fasting blood samples was obtained on the final day of actigraphic measurement and hybridized to Illumina humanHT-12 microarrays. The mean 24-hour sleep duration of the total sample was 439.2 minutes. Mean within-pair sleep duration difference per 24 hours was 64.4 minutes. The researchers observed distinctive pathway enrichment based on sleep duration differences. Habitual short sleep was associated with upregulation of genes involved in transcription, ribosome, translation, and oxidative phosphorylation. Genes that were downregulated with short sleep were highly enriched in immunoinfammatory pathways, as well as developmental programs, coagulation cascade, and cell adhesion.
A brain-computer interface that can decipher the thoughts of people who are unable to communicate may help people with completely locked-in syndrome, according to a study published January 31 in PLOS Biology. Researchers studied a brain-computer interface in four patients with advanced amyotrophic lateral sclerosis and completely locked-in syndrome. Patients responded to "yes" or "no" questions by thinking their answers. The noninvasive brain-computer interface assessed changes in frontocentral cortical oxygenation, measured using functional near-infrared spectroscopy, to determine patients' answers. Patients communicated with an above-chance-level correct response rate over 70%. EEG oscillations and electrooculographic signals did not exceed the chance-level threshold for correct communication.
Using a new noninvasive fMRI method, physicians may be able to predict who is more likely to continue experiencing symptoms months or years after concussion, according to a study published online ahead of print January 13 in the Journal of Neurotrauma. Investigators recruited 75 patients with mild traumatic brain injury (mTBI) and 47 healthy subjects as part of the prospective, multicenter Transforming Research and Clinical Knowledge in TBI pilot study. Researchers compared the functional connectivity of the resting-state networks between patients and controls, and group differences in the interactions between resting-state networks. They assessed patients' cognitive and behavioral performance at six months post injury. Spatial maps of resting-state networks involved in behavioral and cognitive processes differed between patients with mTBI and healthy controls, and these differences were predictive of patients' outcomes at six months post injury.
Among patients with Alzheimer's disease, lifelong bilingualism correlates with functional modulations in crucial neural networks, suggesting neural reserve and compensatory mechanisms, according to a study published online ahead of print January 30 in the Proceedings of the National Academy of Sciences. Eighty-five patients with Alzheimer's disease (45 German-Italian bilingual speakers and 40 monolingual speakers) matched for disease duration were included in this study. Bilingual individuals were on average five years older than people who did not speak another language. Consistent with models of cognitive reserve, cerebral hypometabolism was more severe in the group of bilingual individuals with Alzheimer's disease. Metabolic connectivity analyses supported a neuroprotective effect of bilingualism by showing increased connectivity in the executive control and the default mode networks in bilingual patients, compared with monolingual patients.
The Huntington's Disease Society of America (HDSA), in conjunction with the FDA, conducted two surveys to gather the perspectives of patients with Huntington's disease and juvenile Huntington's disease and their caregivers. Findings from the surveys were published online ahead of print January 24 in the Journal of Huntington's Disease. One survey covered disease symptoms that matter most to people with Huntington's disease, and the other covered current approaches to treatment. The surveys received a total of 3,631 responses. "The frequency and impact of symptoms appear to be felt more by caregivers than individuals with Huntington's Disease, especially when it comes to loss of abilities," said lead investigator George J. Yohrling, PhD, Senior Director of Mission and Scientific Affairs for the HDSA. "There was also a large difference in the perception of symptom frequency between caregivers and individuals with Huntington's disease."
Intentional and unintentional head impacts are independently associated with moderate to severe CNS symptoms in adult amateur soccer players, according to a study published online ahead of print February 1 in Neurology. Soccer players completed an online questionnaire about how often they played soccer during the previous two weeks, how many times they had unintentional head impacts, how many times they headed the ball, and the frequency and severity of CNS symptoms. A total of 222 players completed 470 questionnaires. Heading-related symptoms were reported in 20% of the questionnaires. Heading in the highest quartile was significantly associated with CNS symptoms when controlling for unintentional head impacts. People with unintentional head impacts were at increased risk for CNS symptoms when controlling for heading.
Meditation or music listening may significantly enhance subjective memory function and objective cognitive performance in adults with subjective cognitive decline, according to a study published February 3 in the Journal of Alzheimer's Disease. A total of 60 participants with subjective cognitive decline were randomized to a Kirtan Kriya meditation program or a music listening program. The researchers asked participants to practice 12 minutes each day for three months, then at their discretion for the ensuing three months. At baseline, three months, and six months, researchers measured memory and cognitive functioning. Fifty-three participants completed the study. Both groups showed marked and significant improvements at three months in memory and cognitive performance. At six months, overall gains were maintained or improved, with effect sizes ranging from medium to large.
Yoga and aerobic exercise interventions do not significantly reduce objectively measured sleep disturbances among midlife women who are experiencing hot flashes, according to a study published January 15 in the Journal of Clinical Sleep Medicine. Researchers conducted secondary analyses of a randomized controlled trial in the Menopause Strategies: Finding Lasting Answers for Symptoms and Health network. In the trial, 186 late transition and postmenopausal women ages 40 to 62 with hot flashes were randomized to 12 weeks of yoga, supervised aerobic exercise, or usual activity. Changes in the actigraphic sleep outcomes from baseline to weeks 11 to 12 were small and did not differ between groups. An exploratory analysis suggested that women with poor self-reported sleep quality at baseline potentially had improved sleep stability following yoga.
Longitudinal data provide strong evidence of cognitive aging in midlife women, with substantial within-woman declines in processing speed and memory, according to a study published January 3 in PLoS One. Researchers used data from 2,124 participants from the Study of Women's Health Across the Nation. Participants completed annual tests of processing speed, verbal episodic memory, and working memory. Average age at baseline was 54. There were 7,185 cognitive assessments with a median follow-up time of 6.5 years. In mixed effects regression, adjusted for practice effects, retention, menopause symptoms, and covariates, scores on two of four cognition tests declined. Mean decline in cognitive speed was 0.28 per year or 4.9% in 10 years, and mean decline in verbal episodic memory (delayed testing) was 0.02 per year or 2% in 10 years.
The FDA has approved Emflaza (deflazacort) for the treatment of Duchenne muscular dystrophy in patients age 5 and older. The corticosteroid is available in an immediate-release tablet formulation (6 mg, 18 mg, 30 mg, and 36 mg) as well as an oral suspension formulation (22.75 mg/mL). In a multicenter, randomized, double-blind, placebo-controlled study of 196 male pediatric patients, patients who received deflazacort had improved muscle strength at 12 weeks, compared with patients who received placebo. Through the 52-week study, an overall stability in average muscle strength was maintained in patients who received deflazacort. Results on several timed measures of patient function (eg, time to stand from supine, time to climb four stairs, and time to walk or run 30 feet) also numerically favored deflazacort 0.9 mg/kg/day at week 12. Marathon Pharmaceuticals, headquartered in Northbrook, Illinois, markets Emflaza.
—Kimberly Williams
Serum levels of ubiquitin C-terminal hydrolase-L1 (UCH-L1) and glial fibrillary acidic protein (GFAP) were unable to distinguish between patients with mild traumatic brain injury (mTBI) and patients with orthopedic trauma, according to a study published online ahead of print January 27 in the Journal of Neurotrauma. The results cast doubt on the value of these proposed biomarkers in diagnosing mTBI, the researchers said. Serum UCH-L1 and GFAP were longitudinally measured in 73 patients with acute orthopedic injury and in 93 patients with CT-negative mTBI when they arrived at the hospital and one, two, three, and seven days after admission, as well as at a follow-up visit between three and 10 months after injury. Levels of GFAP were higher in patients with orthopedic trauma than in patients with mTBI on arrival, but subsequent levels did not differ between groups. Levels of UCH-L1 did not significantly differ between the groups.
High-dose immunosuppressive therapy and autologous hematopoietic cell transplantation without maintenance therapy is effective for inducing long-term sustained remission of active relapsing-remitting multiple sclerosis at five years, according to a study published online ahead of print February 1 in Neurology. Twenty-five participants were evaluated for transplant, and 24 participants underwent high-dose immunosuppressive therapy and hematopoietic cell transplantation. Median follow-up was 62 months. Event-free survival (ie, survival without disability progression, relapse, or new lesions on MRI) was 69.2%. Progression-free survival, clinical relapse-free survival, and MRI activity-free survival were 91.3%, 86.9%, and 86.3%, respectively. Adverse events were consistent with toxic effects associated with high-dose immunosuppressive therapy and hematopoietic cell transplantation, including cytopenia and infection. Neurologic disability improved among participants who survived and completed the study, with a median change in Expanded Disability Status Scale score of -0.5.
Estimated glomerular filtration rate on admission is an important predictor of poststroke short-term outcomes, according to a cohort study published in the February issue of Stroke. Investigators analyzed data from 232,236 patients with ischemic stroke in Get With The Guidelines-Stroke. Patients were age 65 or older. In all, 11.8% of patients died during hospitalization or were discharged to hospice, and 38.6% were discharged home. Renal dysfunction was independently associated with an increased risk of in-hospital mortality that was highest among those with an estimated glomerular filtration rate of less than 15 mL/min/1.73 m2 without dialysis (odds ratio, 2.52). In addition, receiving dialysis and having an estimated glomerular filtration rate of less than 29 mL/min/1.73 m2 were associated with lower odds of being discharged home.
Habitual sleep duration in monozygotic twins may be associated with distinct patterns of differential gene expression and pathway enrichment that affect immune response, according to a study published in the January issue of Sleep. Investigators selected 11 healthy monozygotic twin pairs (82% female; mean age, 42.7) based on subjective sleep duration discordance and then monitored participants' habitual sleep duration with two weeks of wrist actigraphy. Peripheral blood leukocyte RNA from fasting blood samples was obtained on the final day of actigraphic measurement and hybridized to Illumina humanHT-12 microarrays. The mean 24-hour sleep duration of the total sample was 439.2 minutes. Mean within-pair sleep duration difference per 24 hours was 64.4 minutes. The researchers observed distinctive pathway enrichment based on sleep duration differences. Habitual short sleep was associated with upregulation of genes involved in transcription, ribosome, translation, and oxidative phosphorylation. Genes that were downregulated with short sleep were highly enriched in immunoinfammatory pathways, as well as developmental programs, coagulation cascade, and cell adhesion.
A brain-computer interface that can decipher the thoughts of people who are unable to communicate may help people with completely locked-in syndrome, according to a study published January 31 in PLOS Biology. Researchers studied a brain-computer interface in four patients with advanced amyotrophic lateral sclerosis and completely locked-in syndrome. Patients responded to "yes" or "no" questions by thinking their answers. The noninvasive brain-computer interface assessed changes in frontocentral cortical oxygenation, measured using functional near-infrared spectroscopy, to determine patients' answers. Patients communicated with an above-chance-level correct response rate over 70%. EEG oscillations and electrooculographic signals did not exceed the chance-level threshold for correct communication.
Using a new noninvasive fMRI method, physicians may be able to predict who is more likely to continue experiencing symptoms months or years after concussion, according to a study published online ahead of print January 13 in the Journal of Neurotrauma. Investigators recruited 75 patients with mild traumatic brain injury (mTBI) and 47 healthy subjects as part of the prospective, multicenter Transforming Research and Clinical Knowledge in TBI pilot study. Researchers compared the functional connectivity of the resting-state networks between patients and controls, and group differences in the interactions between resting-state networks. They assessed patients' cognitive and behavioral performance at six months post injury. Spatial maps of resting-state networks involved in behavioral and cognitive processes differed between patients with mTBI and healthy controls, and these differences were predictive of patients' outcomes at six months post injury.
Among patients with Alzheimer's disease, lifelong bilingualism correlates with functional modulations in crucial neural networks, suggesting neural reserve and compensatory mechanisms, according to a study published online ahead of print January 30 in the Proceedings of the National Academy of Sciences. Eighty-five patients with Alzheimer's disease (45 German-Italian bilingual speakers and 40 monolingual speakers) matched for disease duration were included in this study. Bilingual individuals were on average five years older than people who did not speak another language. Consistent with models of cognitive reserve, cerebral hypometabolism was more severe in the group of bilingual individuals with Alzheimer's disease. Metabolic connectivity analyses supported a neuroprotective effect of bilingualism by showing increased connectivity in the executive control and the default mode networks in bilingual patients, compared with monolingual patients.
The Huntington's Disease Society of America (HDSA), in conjunction with the FDA, conducted two surveys to gather the perspectives of patients with Huntington's disease and juvenile Huntington's disease and their caregivers. Findings from the surveys were published online ahead of print January 24 in the Journal of Huntington's Disease. One survey covered disease symptoms that matter most to people with Huntington's disease, and the other covered current approaches to treatment. The surveys received a total of 3,631 responses. "The frequency and impact of symptoms appear to be felt more by caregivers than individuals with Huntington's Disease, especially when it comes to loss of abilities," said lead investigator George J. Yohrling, PhD, Senior Director of Mission and Scientific Affairs for the HDSA. "There was also a large difference in the perception of symptom frequency between caregivers and individuals with Huntington's disease."
Intentional and unintentional head impacts are independently associated with moderate to severe CNS symptoms in adult amateur soccer players, according to a study published online ahead of print February 1 in Neurology. Soccer players completed an online questionnaire about how often they played soccer during the previous two weeks, how many times they had unintentional head impacts, how many times they headed the ball, and the frequency and severity of CNS symptoms. A total of 222 players completed 470 questionnaires. Heading-related symptoms were reported in 20% of the questionnaires. Heading in the highest quartile was significantly associated with CNS symptoms when controlling for unintentional head impacts. People with unintentional head impacts were at increased risk for CNS symptoms when controlling for heading.
Meditation or music listening may significantly enhance subjective memory function and objective cognitive performance in adults with subjective cognitive decline, according to a study published February 3 in the Journal of Alzheimer's Disease. A total of 60 participants with subjective cognitive decline were randomized to a Kirtan Kriya meditation program or a music listening program. The researchers asked participants to practice 12 minutes each day for three months, then at their discretion for the ensuing three months. At baseline, three months, and six months, researchers measured memory and cognitive functioning. Fifty-three participants completed the study. Both groups showed marked and significant improvements at three months in memory and cognitive performance. At six months, overall gains were maintained or improved, with effect sizes ranging from medium to large.
Yoga and aerobic exercise interventions do not significantly reduce objectively measured sleep disturbances among midlife women who are experiencing hot flashes, according to a study published January 15 in the Journal of Clinical Sleep Medicine. Researchers conducted secondary analyses of a randomized controlled trial in the Menopause Strategies: Finding Lasting Answers for Symptoms and Health network. In the trial, 186 late transition and postmenopausal women ages 40 to 62 with hot flashes were randomized to 12 weeks of yoga, supervised aerobic exercise, or usual activity. Changes in the actigraphic sleep outcomes from baseline to weeks 11 to 12 were small and did not differ between groups. An exploratory analysis suggested that women with poor self-reported sleep quality at baseline potentially had improved sleep stability following yoga.
Longitudinal data provide strong evidence of cognitive aging in midlife women, with substantial within-woman declines in processing speed and memory, according to a study published January 3 in PLoS One. Researchers used data from 2,124 participants from the Study of Women's Health Across the Nation. Participants completed annual tests of processing speed, verbal episodic memory, and working memory. Average age at baseline was 54. There were 7,185 cognitive assessments with a median follow-up time of 6.5 years. In mixed effects regression, adjusted for practice effects, retention, menopause symptoms, and covariates, scores on two of four cognition tests declined. Mean decline in cognitive speed was 0.28 per year or 4.9% in 10 years, and mean decline in verbal episodic memory (delayed testing) was 0.02 per year or 2% in 10 years.
The FDA has approved Emflaza (deflazacort) for the treatment of Duchenne muscular dystrophy in patients age 5 and older. The corticosteroid is available in an immediate-release tablet formulation (6 mg, 18 mg, 30 mg, and 36 mg) as well as an oral suspension formulation (22.75 mg/mL). In a multicenter, randomized, double-blind, placebo-controlled study of 196 male pediatric patients, patients who received deflazacort had improved muscle strength at 12 weeks, compared with patients who received placebo. Through the 52-week study, an overall stability in average muscle strength was maintained in patients who received deflazacort. Results on several timed measures of patient function (eg, time to stand from supine, time to climb four stairs, and time to walk or run 30 feet) also numerically favored deflazacort 0.9 mg/kg/day at week 12. Marathon Pharmaceuticals, headquartered in Northbrook, Illinois, markets Emflaza.
—Kimberly Williams
Serum levels of ubiquitin C-terminal hydrolase-L1 (UCH-L1) and glial fibrillary acidic protein (GFAP) were unable to distinguish between patients with mild traumatic brain injury (mTBI) and patients with orthopedic trauma, according to a study published online ahead of print January 27 in the Journal of Neurotrauma. The results cast doubt on the value of these proposed biomarkers in diagnosing mTBI, the researchers said. Serum UCH-L1 and GFAP were longitudinally measured in 73 patients with acute orthopedic injury and in 93 patients with CT-negative mTBI when they arrived at the hospital and one, two, three, and seven days after admission, as well as at a follow-up visit between three and 10 months after injury. Levels of GFAP were higher in patients with orthopedic trauma than in patients with mTBI on arrival, but subsequent levels did not differ between groups. Levels of UCH-L1 did not significantly differ between the groups.
High-dose immunosuppressive therapy and autologous hematopoietic cell transplantation without maintenance therapy is effective for inducing long-term sustained remission of active relapsing-remitting multiple sclerosis at five years, according to a study published online ahead of print February 1 in Neurology. Twenty-five participants were evaluated for transplant, and 24 participants underwent high-dose immunosuppressive therapy and hematopoietic cell transplantation. Median follow-up was 62 months. Event-free survival (ie, survival without disability progression, relapse, or new lesions on MRI) was 69.2%. Progression-free survival, clinical relapse-free survival, and MRI activity-free survival were 91.3%, 86.9%, and 86.3%, respectively. Adverse events were consistent with toxic effects associated with high-dose immunosuppressive therapy and hematopoietic cell transplantation, including cytopenia and infection. Neurologic disability improved among participants who survived and completed the study, with a median change in Expanded Disability Status Scale score of -0.5.
Estimated glomerular filtration rate on admission is an important predictor of poststroke short-term outcomes, according to a cohort study published in the February issue of Stroke. Investigators analyzed data from 232,236 patients with ischemic stroke in Get With The Guidelines-Stroke. Patients were age 65 or older. In all, 11.8% of patients died during hospitalization or were discharged to hospice, and 38.6% were discharged home. Renal dysfunction was independently associated with an increased risk of in-hospital mortality that was highest among those with an estimated glomerular filtration rate of less than 15 mL/min/1.73 m2 without dialysis (odds ratio, 2.52). In addition, receiving dialysis and having an estimated glomerular filtration rate of less than 29 mL/min/1.73 m2 were associated with lower odds of being discharged home.
Habitual sleep duration in monozygotic twins may be associated with distinct patterns of differential gene expression and pathway enrichment that affect immune response, according to a study published in the January issue of Sleep. Investigators selected 11 healthy monozygotic twin pairs (82% female; mean age, 42.7) based on subjective sleep duration discordance and then monitored participants' habitual sleep duration with two weeks of wrist actigraphy. Peripheral blood leukocyte RNA from fasting blood samples was obtained on the final day of actigraphic measurement and hybridized to Illumina humanHT-12 microarrays. The mean 24-hour sleep duration of the total sample was 439.2 minutes. Mean within-pair sleep duration difference per 24 hours was 64.4 minutes. The researchers observed distinctive pathway enrichment based on sleep duration differences. Habitual short sleep was associated with upregulation of genes involved in transcription, ribosome, translation, and oxidative phosphorylation. Genes that were downregulated with short sleep were highly enriched in immunoinfammatory pathways, as well as developmental programs, coagulation cascade, and cell adhesion.
A brain-computer interface that can decipher the thoughts of people who are unable to communicate may help people with completely locked-in syndrome, according to a study published January 31 in PLOS Biology. Researchers studied a brain-computer interface in four patients with advanced amyotrophic lateral sclerosis and completely locked-in syndrome. Patients responded to "yes" or "no" questions by thinking their answers. The noninvasive brain-computer interface assessed changes in frontocentral cortical oxygenation, measured using functional near-infrared spectroscopy, to determine patients' answers. Patients communicated with an above-chance-level correct response rate over 70%. EEG oscillations and electrooculographic signals did not exceed the chance-level threshold for correct communication.
Using a new noninvasive fMRI method, physicians may be able to predict who is more likely to continue experiencing symptoms months or years after concussion, according to a study published online ahead of print January 13 in the Journal of Neurotrauma. Investigators recruited 75 patients with mild traumatic brain injury (mTBI) and 47 healthy subjects as part of the prospective, multicenter Transforming Research and Clinical Knowledge in TBI pilot study. Researchers compared the functional connectivity of the resting-state networks between patients and controls, and group differences in the interactions between resting-state networks. They assessed patients' cognitive and behavioral performance at six months post injury. Spatial maps of resting-state networks involved in behavioral and cognitive processes differed between patients with mTBI and healthy controls, and these differences were predictive of patients' outcomes at six months post injury.
Among patients with Alzheimer's disease, lifelong bilingualism correlates with functional modulations in crucial neural networks, suggesting neural reserve and compensatory mechanisms, according to a study published online ahead of print January 30 in the Proceedings of the National Academy of Sciences. Eighty-five patients with Alzheimer's disease (45 German-Italian bilingual speakers and 40 monolingual speakers) matched for disease duration were included in this study. Bilingual individuals were on average five years older than people who did not speak another language. Consistent with models of cognitive reserve, cerebral hypometabolism was more severe in the group of bilingual individuals with Alzheimer's disease. Metabolic connectivity analyses supported a neuroprotective effect of bilingualism by showing increased connectivity in the executive control and the default mode networks in bilingual patients, compared with monolingual patients.
The Huntington's Disease Society of America (HDSA), in conjunction with the FDA, conducted two surveys to gather the perspectives of patients with Huntington's disease and juvenile Huntington's disease and their caregivers. Findings from the surveys were published online ahead of print January 24 in the Journal of Huntington's Disease. One survey covered disease symptoms that matter most to people with Huntington's disease, and the other covered current approaches to treatment. The surveys received a total of 3,631 responses. "The frequency and impact of symptoms appear to be felt more by caregivers than individuals with Huntington's Disease, especially when it comes to loss of abilities," said lead investigator George J. Yohrling, PhD, Senior Director of Mission and Scientific Affairs for the HDSA. "There was also a large difference in the perception of symptom frequency between caregivers and individuals with Huntington's disease."
Intentional and unintentional head impacts are independently associated with moderate to severe CNS symptoms in adult amateur soccer players, according to a study published online ahead of print February 1 in Neurology. Soccer players completed an online questionnaire about how often they played soccer during the previous two weeks, how many times they had unintentional head impacts, how many times they headed the ball, and the frequency and severity of CNS symptoms. A total of 222 players completed 470 questionnaires. Heading-related symptoms were reported in 20% of the questionnaires. Heading in the highest quartile was significantly associated with CNS symptoms when controlling for unintentional head impacts. People with unintentional head impacts were at increased risk for CNS symptoms when controlling for heading.
Meditation or music listening may significantly enhance subjective memory function and objective cognitive performance in adults with subjective cognitive decline, according to a study published February 3 in the Journal of Alzheimer's Disease. A total of 60 participants with subjective cognitive decline were randomized to a Kirtan Kriya meditation program or a music listening program. The researchers asked participants to practice 12 minutes each day for three months, then at their discretion for the ensuing three months. At baseline, three months, and six months, researchers measured memory and cognitive functioning. Fifty-three participants completed the study. Both groups showed marked and significant improvements at three months in memory and cognitive performance. At six months, overall gains were maintained or improved, with effect sizes ranging from medium to large.
Yoga and aerobic exercise interventions do not significantly reduce objectively measured sleep disturbances among midlife women who are experiencing hot flashes, according to a study published January 15 in the Journal of Clinical Sleep Medicine. Researchers conducted secondary analyses of a randomized controlled trial in the Menopause Strategies: Finding Lasting Answers for Symptoms and Health network. In the trial, 186 late transition and postmenopausal women ages 40 to 62 with hot flashes were randomized to 12 weeks of yoga, supervised aerobic exercise, or usual activity. Changes in the actigraphic sleep outcomes from baseline to weeks 11 to 12 were small and did not differ between groups. An exploratory analysis suggested that women with poor self-reported sleep quality at baseline potentially had improved sleep stability following yoga.
Longitudinal data provide strong evidence of cognitive aging in midlife women, with substantial within-woman declines in processing speed and memory, according to a study published January 3 in PLoS One. Researchers used data from 2,124 participants from the Study of Women's Health Across the Nation. Participants completed annual tests of processing speed, verbal episodic memory, and working memory. Average age at baseline was 54. There were 7,185 cognitive assessments with a median follow-up time of 6.5 years. In mixed effects regression, adjusted for practice effects, retention, menopause symptoms, and covariates, scores on two of four cognition tests declined. Mean decline in cognitive speed was 0.28 per year or 4.9% in 10 years, and mean decline in verbal episodic memory (delayed testing) was 0.02 per year or 2% in 10 years.
The FDA has approved Emflaza (deflazacort) for the treatment of Duchenne muscular dystrophy in patients age 5 and older. The corticosteroid is available in an immediate-release tablet formulation (6 mg, 18 mg, 30 mg, and 36 mg) as well as an oral suspension formulation (22.75 mg/mL). In a multicenter, randomized, double-blind, placebo-controlled study of 196 male pediatric patients, patients who received deflazacort had improved muscle strength at 12 weeks, compared with patients who received placebo. Through the 52-week study, an overall stability in average muscle strength was maintained in patients who received deflazacort. Results on several timed measures of patient function (eg, time to stand from supine, time to climb four stairs, and time to walk or run 30 feet) also numerically favored deflazacort 0.9 mg/kg/day at week 12. Marathon Pharmaceuticals, headquartered in Northbrook, Illinois, markets Emflaza.
—Kimberly Williams

Initial HCV test results are false positive in almost half of general population
Nearly half of patients in the general population who test positive for hepatitis C virus (HCV) do not have the disease, according to Dr. Anne Moorman and her associates.
From a sample of 22,359 National Health and Nutrition Examination Study participants, 479 people received positive HCV antibody test results from 2007 to 2012. Of this group, 477 participants underwent further follow-up testing using a recombinant immunoblot assay. RIBA testing confirmed positive test results for 323 participants, while 105 patients received negative test results and 49 received indeterminate test results.
“False-positive antibody assays may occur with great frequency, emphasizing the need for “reflex” HCV RNA testing to ascertain current infection status,” the investigators noted.
Find the full study in the Journal of Clinical Virology (doi: 10.1016/j.jcv.2017.01.007).
Nearly half of patients in the general population who test positive for hepatitis C virus (HCV) do not have the disease, according to Dr. Anne Moorman and her associates.
From a sample of 22,359 National Health and Nutrition Examination Study participants, 479 people received positive HCV antibody test results from 2007 to 2012. Of this group, 477 participants underwent further follow-up testing using a recombinant immunoblot assay. RIBA testing confirmed positive test results for 323 participants, while 105 patients received negative test results and 49 received indeterminate test results.
“False-positive antibody assays may occur with great frequency, emphasizing the need for “reflex” HCV RNA testing to ascertain current infection status,” the investigators noted.
Find the full study in the Journal of Clinical Virology (doi: 10.1016/j.jcv.2017.01.007).
Nearly half of patients in the general population who test positive for hepatitis C virus (HCV) do not have the disease, according to Dr. Anne Moorman and her associates.
From a sample of 22,359 National Health and Nutrition Examination Study participants, 479 people received positive HCV antibody test results from 2007 to 2012. Of this group, 477 participants underwent further follow-up testing using a recombinant immunoblot assay. RIBA testing confirmed positive test results for 323 participants, while 105 patients received negative test results and 49 received indeterminate test results.
“False-positive antibody assays may occur with great frequency, emphasizing the need for “reflex” HCV RNA testing to ascertain current infection status,” the investigators noted.
Find the full study in the Journal of Clinical Virology (doi: 10.1016/j.jcv.2017.01.007).
FROM JOURNAL OF CLINICAL VIROLOGY