User login
Nonhealing Eroded Plaque on an Interdigital Web Space of the Foot
The Diagnosis: Basal Cell Nevus Syndrome
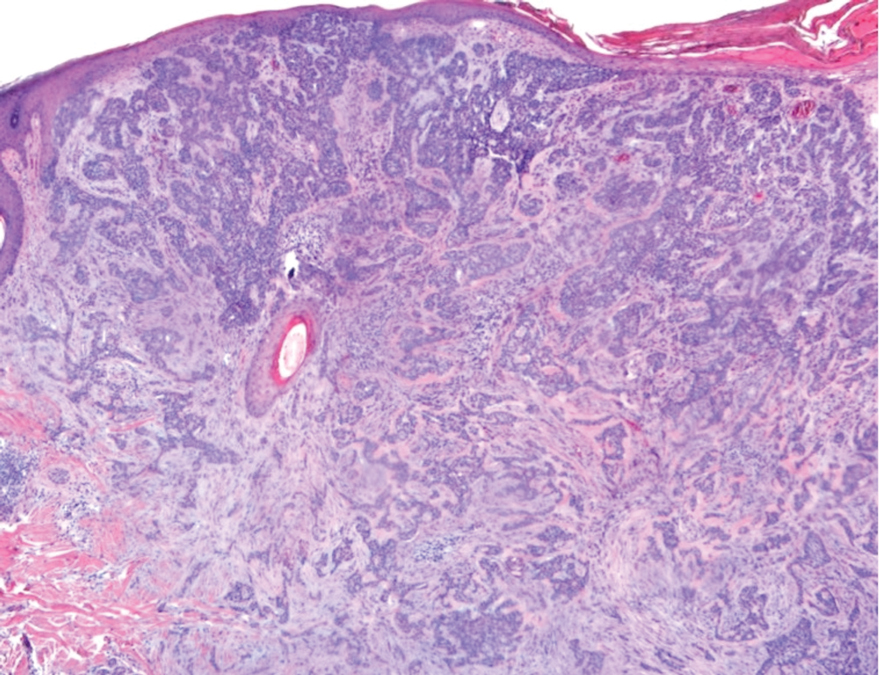
Given the patient’s history of numerous basal cell carcinomas (BCCs), odontogenic keratocysts, palmar pits, and a nonhealing ulcer, the clinical presentation was highly suggestive of interdigital BCC in the setting of basal cell nevus syndrome (BCNS). A shave biopsy was performed revealing islands of basaloid cells with peripheral palisading and a retraction artifact surrounded by fibromyxoid stroma, consistent with nodular and infiltrative BCC (Figure 1).
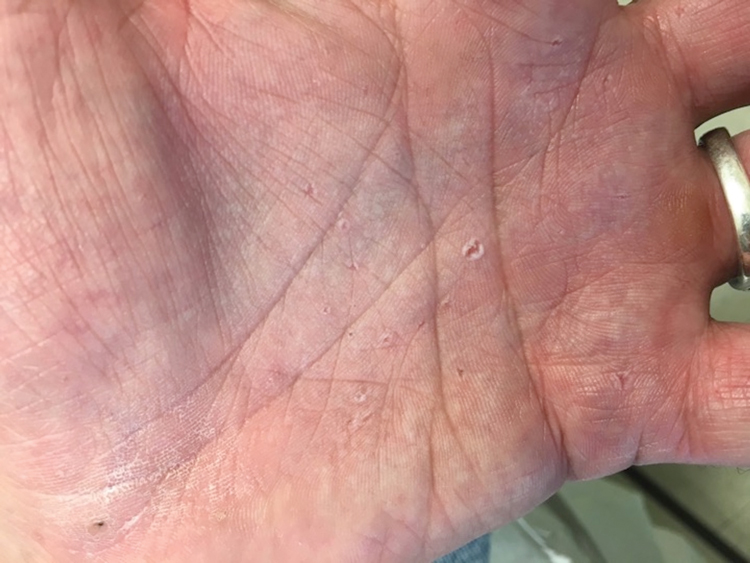
Basal cell nevus syndrome (also known as Gorlin syndrome) is a rare neurocutaneous syndrome that manifests with multiple BCCs; palmar and plantar pits (Figure 2); central nervous system tumors; and skeletal anomalies including jaw cysts, macrocephaly, frontal bossing, and bifid ribs.1 It is an autosomal-dominant condition caused by mutations in the PTCH1 gene, a tumor suppressor gene involved in the Hedgehog signaling pathway.2 Basal cell carcinoma is the most distinctive feature of BCNS, causing notable morbidity. Tumors typically present between puberty and 35 years of age, and patients can have anywhere from a few to thousands of tumors. They rarely become locally aggressive; however, with radiation therapy, proliferation and local invasion may occur within a few years. Therefore, radiotherapy should be avoided in these patients.1
Although the most common sites for BCCs in BCNS are the head, neck, and back, there is a higher rate of occurrence on sun-protected areas in BCNS compared to the general population.3 Our patient presented with interdigital BCC of the foot, which is an extremely rare occurrence. PubMed and Ovid searches using the terms basal cell carcinoma, BCC, foot, interdigital, and nonmelanoma skin cancer revealed only 3 cases of interdigital BCC of the foot. One case was associated with prior surgical trauma, the second presented as a junctional nevus, and the third did not appear to have any associated inciting factors.4-6 Dermatologists need to have a low threshold for biopsy for any unusual nonhealing lesions, especially in the setting of BCNS. Basal cell carcinomas in BCNS cannot be histologically differentiated from sporadic BCCs, and management largely depends on the size, location, recurrence, and number of lesions. Treatment methods range from topical agents to Mohs micrographic surgery.1
Nonhealing lesions of the foot may give an initial clinical impression of infection overlying peripheral vascular disease or diabetes mellitus with the possibility of associated osteomyelitis. Our patient had no clinical history to suggest peripheral vascular disease or diabetes mellitus, and he had palpable dorsalis pedis pulses as well as a normal neurologic examination. Clinicians also may consider fungal infection in the differential diagnosis. Erosio interdigitalis blastomycetica is a superficial yeast infection described as a well-defined, red, shiny plaque found in chronically wet areas, usually affecting the third or fourth interdigital spaces of the fingers.7 However, the lack of improvement with antibiotics and antifungals argued against bacterial or fungal infection in our patient. Although BCC also is a common feature of Bazex Dupré-Christol syndrome, it also is characterized by follicular atrophoderma, milia, hypohidrosis, and hypotrichosis,8 which were not evident in our patient. Pseudomonas hot foot syndrome is characterized by painful, plantar, erythematous nodules after exposure to ontaminated water that typically is self-limited but does respond to antibiotics for Pseudomonas.9
Our patient underwent Mohs micrographic surgery with a complex repair utilizing a full-thickness skin graft. There were no signs of recurrence at 3-month follow-up, and he was counseled on the importance of sun-protective behaviors along with regular dermatologic follow-up.
1. Gorlin RJ. Nevoid basal cell (Gorlin) syndrome. Genet Med. 2004; 6:530-539.
2. Bale A. The nevoid basal cell carcinoma syndrome: genetics and mechanism of carcinogenesis. Cancer Invest. 1997;15:180-186.
3. Goldstein AM, Bale SJ, Peck GL, et al. Sun exposure and basal cell carcinomas in nevoid basal cell carcinoma syndrome. J Am Acad Dermatol. 1993;29:34-41.
4. Silvers SH. Interdigital pedal basal cell carcinoma. Cutis. 1983;31:199-200.
5. Weitzner S. Basal cell carcinoma of toeweb presenting as a junctional nevus. Southwest Med. 1968;49:175.
6. Niwa A, Pimentel E. Basal cell carcinoma in unusual locations. An Bras Dermatol. 2006;81:281-284.
7. Mitchell JH. Erosio interdigitalis blastomycetica. Arch Derm Syphilol. 1922;6:675-679.
8. Kidd A, Carson L, Gregory DW, et al. A Scottish family with Bazex-Dupré-Christol syndrome: follicular atrophoderma, congenital hypotrichosis, and basal cell carcinoma. J Med Genet. 1996;33:493-497.
9. Yu Y, Cheng AS, Wang L, et al. Hot tub folliculitis or hot hand-foot syndrome caused by Pseudomonas aeruginosa. J Am Acad Dermatol. 2007;57:596-600.
The Diagnosis: Basal Cell Nevus Syndrome
Given the patient’s history of numerous basal cell carcinomas (BCCs), odontogenic keratocysts, palmar pits, and a nonhealing ulcer, the clinical presentation was highly suggestive of interdigital BCC in the setting of basal cell nevus syndrome (BCNS). A shave biopsy was performed revealing islands of basaloid cells with peripheral palisading and a retraction artifact surrounded by fibromyxoid stroma, consistent with nodular and infiltrative BCC (Figure 1).
Basal cell nevus syndrome (also known as Gorlin syndrome) is a rare neurocutaneous syndrome that manifests with multiple BCCs; palmar and plantar pits (Figure 2); central nervous system tumors; and skeletal anomalies including jaw cysts, macrocephaly, frontal bossing, and bifid ribs.1 It is an autosomal-dominant condition caused by mutations in the PTCH1 gene, a tumor suppressor gene involved in the Hedgehog signaling pathway.2 Basal cell carcinoma is the most distinctive feature of BCNS, causing notable morbidity. Tumors typically present between puberty and 35 years of age, and patients can have anywhere from a few to thousands of tumors. They rarely become locally aggressive; however, with radiation therapy, proliferation and local invasion may occur within a few years. Therefore, radiotherapy should be avoided in these patients.1
Although the most common sites for BCCs in BCNS are the head, neck, and back, there is a higher rate of occurrence on sun-protected areas in BCNS compared to the general population.3 Our patient presented with interdigital BCC of the foot, which is an extremely rare occurrence. PubMed and Ovid searches using the terms basal cell carcinoma, BCC, foot, interdigital, and nonmelanoma skin cancer revealed only 3 cases of interdigital BCC of the foot. One case was associated with prior surgical trauma, the second presented as a junctional nevus, and the third did not appear to have any associated inciting factors.4-6 Dermatologists need to have a low threshold for biopsy for any unusual nonhealing lesions, especially in the setting of BCNS. Basal cell carcinomas in BCNS cannot be histologically differentiated from sporadic BCCs, and management largely depends on the size, location, recurrence, and number of lesions. Treatment methods range from topical agents to Mohs micrographic surgery.1
Nonhealing lesions of the foot may give an initial clinical impression of infection overlying peripheral vascular disease or diabetes mellitus with the possibility of associated osteomyelitis. Our patient had no clinical history to suggest peripheral vascular disease or diabetes mellitus, and he had palpable dorsalis pedis pulses as well as a normal neurologic examination. Clinicians also may consider fungal infection in the differential diagnosis. Erosio interdigitalis blastomycetica is a superficial yeast infection described as a well-defined, red, shiny plaque found in chronically wet areas, usually affecting the third or fourth interdigital spaces of the fingers.7 However, the lack of improvement with antibiotics and antifungals argued against bacterial or fungal infection in our patient. Although BCC also is a common feature of Bazex Dupré-Christol syndrome, it also is characterized by follicular atrophoderma, milia, hypohidrosis, and hypotrichosis,8 which were not evident in our patient. Pseudomonas hot foot syndrome is characterized by painful, plantar, erythematous nodules after exposure to ontaminated water that typically is self-limited but does respond to antibiotics for Pseudomonas.9
Our patient underwent Mohs micrographic surgery with a complex repair utilizing a full-thickness skin graft. There were no signs of recurrence at 3-month follow-up, and he was counseled on the importance of sun-protective behaviors along with regular dermatologic follow-up.
The Diagnosis: Basal Cell Nevus Syndrome
Given the patient’s history of numerous basal cell carcinomas (BCCs), odontogenic keratocysts, palmar pits, and a nonhealing ulcer, the clinical presentation was highly suggestive of interdigital BCC in the setting of basal cell nevus syndrome (BCNS). A shave biopsy was performed revealing islands of basaloid cells with peripheral palisading and a retraction artifact surrounded by fibromyxoid stroma, consistent with nodular and infiltrative BCC (Figure 1).
Basal cell nevus syndrome (also known as Gorlin syndrome) is a rare neurocutaneous syndrome that manifests with multiple BCCs; palmar and plantar pits (Figure 2); central nervous system tumors; and skeletal anomalies including jaw cysts, macrocephaly, frontal bossing, and bifid ribs.1 It is an autosomal-dominant condition caused by mutations in the PTCH1 gene, a tumor suppressor gene involved in the Hedgehog signaling pathway.2 Basal cell carcinoma is the most distinctive feature of BCNS, causing notable morbidity. Tumors typically present between puberty and 35 years of age, and patients can have anywhere from a few to thousands of tumors. They rarely become locally aggressive; however, with radiation therapy, proliferation and local invasion may occur within a few years. Therefore, radiotherapy should be avoided in these patients.1
Although the most common sites for BCCs in BCNS are the head, neck, and back, there is a higher rate of occurrence on sun-protected areas in BCNS compared to the general population.3 Our patient presented with interdigital BCC of the foot, which is an extremely rare occurrence. PubMed and Ovid searches using the terms basal cell carcinoma, BCC, foot, interdigital, and nonmelanoma skin cancer revealed only 3 cases of interdigital BCC of the foot. One case was associated with prior surgical trauma, the second presented as a junctional nevus, and the third did not appear to have any associated inciting factors.4-6 Dermatologists need to have a low threshold for biopsy for any unusual nonhealing lesions, especially in the setting of BCNS. Basal cell carcinomas in BCNS cannot be histologically differentiated from sporadic BCCs, and management largely depends on the size, location, recurrence, and number of lesions. Treatment methods range from topical agents to Mohs micrographic surgery.1
Nonhealing lesions of the foot may give an initial clinical impression of infection overlying peripheral vascular disease or diabetes mellitus with the possibility of associated osteomyelitis. Our patient had no clinical history to suggest peripheral vascular disease or diabetes mellitus, and he had palpable dorsalis pedis pulses as well as a normal neurologic examination. Clinicians also may consider fungal infection in the differential diagnosis. Erosio interdigitalis blastomycetica is a superficial yeast infection described as a well-defined, red, shiny plaque found in chronically wet areas, usually affecting the third or fourth interdigital spaces of the fingers.7 However, the lack of improvement with antibiotics and antifungals argued against bacterial or fungal infection in our patient. Although BCC also is a common feature of Bazex Dupré-Christol syndrome, it also is characterized by follicular atrophoderma, milia, hypohidrosis, and hypotrichosis,8 which were not evident in our patient. Pseudomonas hot foot syndrome is characterized by painful, plantar, erythematous nodules after exposure to ontaminated water that typically is self-limited but does respond to antibiotics for Pseudomonas.9
Our patient underwent Mohs micrographic surgery with a complex repair utilizing a full-thickness skin graft. There were no signs of recurrence at 3-month follow-up, and he was counseled on the importance of sun-protective behaviors along with regular dermatologic follow-up.
1. Gorlin RJ. Nevoid basal cell (Gorlin) syndrome. Genet Med. 2004; 6:530-539.
2. Bale A. The nevoid basal cell carcinoma syndrome: genetics and mechanism of carcinogenesis. Cancer Invest. 1997;15:180-186.
3. Goldstein AM, Bale SJ, Peck GL, et al. Sun exposure and basal cell carcinomas in nevoid basal cell carcinoma syndrome. J Am Acad Dermatol. 1993;29:34-41.
4. Silvers SH. Interdigital pedal basal cell carcinoma. Cutis. 1983;31:199-200.
5. Weitzner S. Basal cell carcinoma of toeweb presenting as a junctional nevus. Southwest Med. 1968;49:175.
6. Niwa A, Pimentel E. Basal cell carcinoma in unusual locations. An Bras Dermatol. 2006;81:281-284.
7. Mitchell JH. Erosio interdigitalis blastomycetica. Arch Derm Syphilol. 1922;6:675-679.
8. Kidd A, Carson L, Gregory DW, et al. A Scottish family with Bazex-Dupré-Christol syndrome: follicular atrophoderma, congenital hypotrichosis, and basal cell carcinoma. J Med Genet. 1996;33:493-497.
9. Yu Y, Cheng AS, Wang L, et al. Hot tub folliculitis or hot hand-foot syndrome caused by Pseudomonas aeruginosa. J Am Acad Dermatol. 2007;57:596-600.
1. Gorlin RJ. Nevoid basal cell (Gorlin) syndrome. Genet Med. 2004; 6:530-539.
2. Bale A. The nevoid basal cell carcinoma syndrome: genetics and mechanism of carcinogenesis. Cancer Invest. 1997;15:180-186.
3. Goldstein AM, Bale SJ, Peck GL, et al. Sun exposure and basal cell carcinomas in nevoid basal cell carcinoma syndrome. J Am Acad Dermatol. 1993;29:34-41.
4. Silvers SH. Interdigital pedal basal cell carcinoma. Cutis. 1983;31:199-200.
5. Weitzner S. Basal cell carcinoma of toeweb presenting as a junctional nevus. Southwest Med. 1968;49:175.
6. Niwa A, Pimentel E. Basal cell carcinoma in unusual locations. An Bras Dermatol. 2006;81:281-284.
7. Mitchell JH. Erosio interdigitalis blastomycetica. Arch Derm Syphilol. 1922;6:675-679.
8. Kidd A, Carson L, Gregory DW, et al. A Scottish family with Bazex-Dupré-Christol syndrome: follicular atrophoderma, congenital hypotrichosis, and basal cell carcinoma. J Med Genet. 1996;33:493-497.
9. Yu Y, Cheng AS, Wang L, et al. Hot tub folliculitis or hot hand-foot syndrome caused by Pseudomonas aeruginosa. J Am Acad Dermatol. 2007;57:596-600.
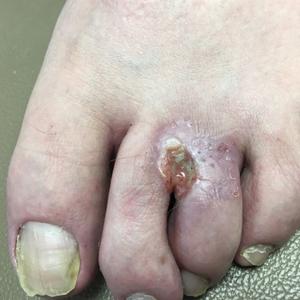
A 53-year-old man with a history of numerous basal cell carcinomas and odontogenic keratocysts presented with a nonhealing erosion between the left second and third toes of several months’ duration. He was treated empirically with multiple courses of topical and systemic antibiotics as well as antifungals with minimal improvement. Physical examination revealed a 1.2×0.6-cm eroded plaque with rolled borders on the left second toe web; bilateral palmar pits; diffuse actinic damage; and several well-healed surgical scars on the head, neck, and back. Neurologic examination was normal, and dorsalis pedis pulses were equal and palpable bilaterally.
The HPV vaccine is now recommended for adults aged 27–45: Counseling implications
The US Food and Drug Administration (FDA) recently extended the approval for Gardasil 9 (to prevent HPV-associated cancers, cancer precursors, and genital lesions) to men and women aged 27 to 45.1 In this editorial, we discuss the evolution of the HPV vaccine since its initial approval more than 10 years ago, the benefits of primary prevention with the HPV vaccine, and the case for the FDA’s recent extension of coverage to older men and women.
The evolution of the HPV vaccine
Since recognition in the 1980s and 90s that high-risk strains of HPV, notably HPV types 16 and 18, were linked to cervical cancer, there have been exciting advances in detection and prevention of high-risk HPV infection. About 70% of cervical cancers are attributable to these 2 oncogenic types.2 The first vaccine licensed, Gardasil (Merck), was approved in 2006 for girls and women aged 9 through 26 to prevent HPV-related diseases caused by types 6, 11, 16, and 18.3 The vaccine was effective for prevention of cervical cancer; genital warts; and grades 2 and 3 of cervical, vulvar, and vaginal intraepithelial neoplasia. In 2008, prevention of vulvar and vaginal cancers was added to the indication. By 2009, prevention of genital warts was added, and use in males aged 9 to 15 was approved. By 2010 sufficient data were accumulated to document prevention of anal cancer and anal intraepithelial neoplasia in men and women, and this indication was added.
In 2014 Gardasil 9 was approved to extend coverage to an additional 5 oncogenic HPV types (31, 33, 45, 52, and 58), now covering an additional 20% of cervical cancers, and in 2015 Gardasil 9 indications were expanded to include boys and men 9 to 26 years of age. Immunogenicity studies were performed to infer effectiveness of a 2-dose regimen in boys and girls aged 9 to 14 years, which was recommended by the Advisory Committee on Immunization Practices (ACIP) of the Centers for Disease Control and Prevention (CDC) in late 2016.4
Until October 2018, Gardasil 9 was indicated for prevention of genital warts, cervical, vaginal, vulvar and anal cancers and cancer precursors for males and females aged 9 to 26 years. In October the FDA extended approval of the 3-dose vaccine regimen to men and women up to age 45.
HPV vaccine uptake
HPV vaccination has been underutilized in the United States. In 2017, a disappointing 49% of adolescents were up to date on vaccination, and 66% had received at least one dose.5 In rural areas the vaccination rates are 11 points lower than in urban regions.6 The CDC notes an increasing number of HPV-associated cancers—from 30,000 per year in 1999 to 43,000 per year in 2015—due mostly to increases in oral and anal carcinomas. Vaccination with Gardasil 9 could prevent 90% of those cases.7
Non-US successes. HPV vaccine uptake in Australia provides an excellent opportunity to study the impact of universally available, school-based vaccinations. In 2007 Australia implemented a program of free HPV vaccination distributed through schools. Boys and girls aged 12 and 13 were targeted that year, with catch-up vaccinations for those aged 13 to 18 in 2007-2009 in schools and for those aged 18 to 26 reached in the community.8
Continue to: Ali and colleagues studied the...
Ali and colleagues studied the preprogram and postprogram incidence of genital warts.9 About 83% received at least 1 dose of vaccine, and 73% of the eligible population completed the 3-dose regimen. There was a significant reduction in warts in both men and women younger than age 21 from 2007 to 2011 (12.1% to 2.2% in men and 11.5% to 0.85% in women). In the 21 to 30 age group there were similar reductions. This study demonstrates that with universal access and public implementation, the rates of HPV-associated disease can be reduced dramatically.
Data informing expanded vaccination ages
Will vaccination of an older population, with presumably many of whom sexually active and at risk for prior exposure to multiple HPV types, have a reasonable impact on lowering HPV-associated cancers? Are HPV-detected lesions in 27- to 45-year-old women the result of reactivation of latent HPV infection, or are they related to new-onset exposure? The FDA reviewed data from 3 studies of HPV vaccination in women aged 27 to 45. The first enrolled women who were naïve to oncogenic HPV types and provided all 3 doses of quadrivalent vaccine were followed for 4 years, along with a comparison group of nonvaccinated women. The second study allowed the nonvaccinated group to receive vaccine in year 4. Both groups were followed up to 10 years with the relevant outcome defined as cumulative incidence of HPV 6/11/16/18-related CIN and condyloma. The third study looked at the same outcomes in a set of all women—whether HPV high-risk naïve or not—after receiving vaccine and followed more than 10 years.7 This last study is most relevant to ObGyns, as it is closest to how we would consider vaccinating our patients.
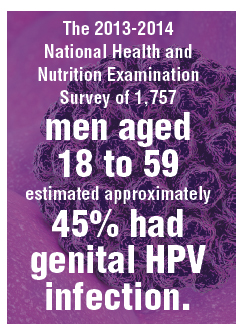
The study findings are reassuring: A large proportion of HPV infections in women between 27 and 45 are the result of new exposure/infection. A study of 420 online daters aged 25 to 65 showed an annual incidence of high-risk HPV types in vaginal swabs of 25.4%, of which 64% were likely new acquisitions.10 The 2013-2014 National Health and Nutrition Examination Survey of 1,757 men aged 18 to 59 estimated approximately 45% had genital HPV infection. There was a bimodal distribution of disease with peaks at 28 to 32 and a larger second peak at 58 to 59 years of age.11 Bottom line: Men and women older than age 26 who are sexually active likely acquire new HPV infections with oncogenic types. Exposure to high-risk HPV types prior to vaccination—as we would expect in the real-world setting—did not eliminate the substantial benefit of immunization.
Based on these study results, and extrapolation to the 9-valent vaccine, the FDA extended the approval of Gardasil 9 to men and women from age 9 to 45. The indications and usage will remain the same: for prevention of cervical, vulvar, vaginal, and anal cancer and genital warts as well as precancerous or dysplastic lesions of the cervix, vulva, vagina, and anus related to HPV types 6, 11, 16, 18, 31, 33, 45, 52, and 58.
Continue to: Impact of the new...
Impact of the new indication on HPV-related disease
As described above, widespread vaccination of young girls and boys is going to have major impact on HPV-related disease, including precancer and cancer. Because there is evidence that older women and men are at risk for new HPV infection,10 there likely will be some benefit from vaccination of adults. It is difficult, however, to extrapolate the degree to which adult vaccination will impact HPV-related disease. This is because we do not fully understand the rates at which new HPV infection in the cervices of older women will progress to high-grade dysplasia or cancer. Further, the pathophysiology of HPV-related cancers at other anogenital sites and new oral-pharyngeal infection is poorly understood in comparison with our knowledge of the natural history of high-risk HPV infection in younger women. That said, because of the outstanding efficacy of HPV vaccination and the low-risk profile, even if the actual impact on prevention of cancer or morbidity from dysplasia is relatively low, adult vaccination benefits outweigh the limited risks.
It may be that increased vaccination and awareness of vaccination for adults may enhance the adherence and acceptance of widespread vaccination of boys and girls. Adult vaccination could create a cultural shift toward HPV vaccination acceptance when adult parents and loved ones of vaccine-age boys and girls have been vaccinated themselves.
Current and future insurance coverage
The Affordable Care Act, otherwise known as Obamacare, mandates coverage for all immunizations recommended by the ACIP. HPV vaccination up to age 26 is fully covered, without copay or deductible. The ACIP did consider extension of the indications for HPV vaccination to men and women up to age 45 at their October 2018 meeting. They are tasked with considering not only safety and efficacy but also the cost effectiveness of implementing vaccination. They continue to study the costs and potential benefits of extending HPV vaccination to age 45. Their recommendations may be determined at the February 2019 meeting—or even later in 2019. The American College of Obstetricians and Gynecologists (ACOG) relies upon ACIP for practice guidance. Once the ACIP has made a determination, and if new guidelines are published in the Morbidity and Mortality Weekly Report, insurance coverage and ACOG guidance will be updated.
How should we react and change practice based on this new indication?
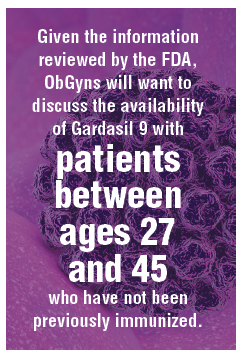
Given the information reviewed by the FDA, ObGyns will want to discuss the availability of Gardasil 9 with our patients between ages 27 and 45 who have not been previously immunized.
Especially for our patients with exposure to multiple or new sexual partners, immunization against oncogenic HPV viral types is effective in providing protection from cancer precursors and cancers of the cervix, vulva, vagina, and anus—and of course from genital warts. They should understand that, until formal recommendations are published by the ACIP, they are likely to be responsible for the cost of the vaccination series. These conversations will also remind our patients to immunize their teens against HPV. The more conversation we have regarding the benefits of vaccination against high-risk HPV types, the more likely we are to be able to achieve the impressive results seen in Australia.
- US Food and Drug Administration website. FDA approves expanded use of Gardasil 9 to include individuals 27 through 45 years old. https://www.fda.gov/NewsEvents/Newsroom/PressAnnouncements/ucm622715.htm. Updated October 9, 2018. Accessed December 27, 2018.
- World Health Organization website. Human papillomavirus (HPV) and cervical cancer. https://www.who.int/news-room/fact-sheets/detail/human-papillomavirus-(hpv)-and-cervical-cancer. February 15, 2018. Accessed December 27, 2018.
- Centers for Disease Control and Prevention website. Human papillomavirus (HPV) vaccine safety. https://www.cdc.gov/vaccinesafety/vaccines/hpv-vaccine.html. Last reviewed October 27, 2015. Accessed December 27, 2018.
- Meites E, Kempe A, Markowitz LE. Use of a 2-dose schedule for human papillomavirus vaccination—updated recommendations of the Advisory Committee on Immunization Practices. MMWR. 2016;65(49):1405–1408.
- AAP News website. Jenko M. CDC: 49% of teens up to date on HPV vaccine. http://www.aappublications.org/news/2018/08/23/vac cinationrates082318. August 23, 2018. Accessed December 27, 2018.
- Walker TY, Elam-Evans LD, Yankey D, et al. National, regional, state, and selected local area vaccination coverage among adolescents aged 13–17 years—United States, 2017. MMWR Morb Mortal Wkly Rep. 2018;67:909-917.
- Montague L. Summary basis for regulatory action. October 5, 2018. https://www.fda.gov/downloads/BiologicsBloodVaccines/Vaccines/ApprovedProducts/UCM622941.pdf. Accessed December 27, 2018.
- Tabrizi SN, Brotherton JM, Kaldor JM, et al. Fall in human papillomavirus prevalence following a national vaccination program. J Infect Dis. 2012;206:1645-1651.
- Ali H, Donovan B, Wand H, et al. Genital warts in young Australians five years into national human papillomavirus vaccination programme: national surveillance data [published correction appears in BMJ. 2013;346:F2942]. BMJ. 2013;346:F2032.
- Winer RL, Hughes JP, Feng Q, et al. Incident detection of high-risk human papillomavirus infections in a cohort of high-risk women aged 25-65 years. J Infect Dis. 2016;214:665-675.
- Han JJ, Beltran TH, Song JW, et al. Prevalence of genital human papillomavirus infection and human papillomavirus vaccination rates among US adult men: National Health and Nutrition Examination Survey (NHANES) 2013-2014. JAMA Oncol. 2017;3:810-816.
The US Food and Drug Administration (FDA) recently extended the approval for Gardasil 9 (to prevent HPV-associated cancers, cancer precursors, and genital lesions) to men and women aged 27 to 45.1 In this editorial, we discuss the evolution of the HPV vaccine since its initial approval more than 10 years ago, the benefits of primary prevention with the HPV vaccine, and the case for the FDA’s recent extension of coverage to older men and women.
The evolution of the HPV vaccine
Since recognition in the 1980s and 90s that high-risk strains of HPV, notably HPV types 16 and 18, were linked to cervical cancer, there have been exciting advances in detection and prevention of high-risk HPV infection. About 70% of cervical cancers are attributable to these 2 oncogenic types.2 The first vaccine licensed, Gardasil (Merck), was approved in 2006 for girls and women aged 9 through 26 to prevent HPV-related diseases caused by types 6, 11, 16, and 18.3 The vaccine was effective for prevention of cervical cancer; genital warts; and grades 2 and 3 of cervical, vulvar, and vaginal intraepithelial neoplasia. In 2008, prevention of vulvar and vaginal cancers was added to the indication. By 2009, prevention of genital warts was added, and use in males aged 9 to 15 was approved. By 2010 sufficient data were accumulated to document prevention of anal cancer and anal intraepithelial neoplasia in men and women, and this indication was added.
In 2014 Gardasil 9 was approved to extend coverage to an additional 5 oncogenic HPV types (31, 33, 45, 52, and 58), now covering an additional 20% of cervical cancers, and in 2015 Gardasil 9 indications were expanded to include boys and men 9 to 26 years of age. Immunogenicity studies were performed to infer effectiveness of a 2-dose regimen in boys and girls aged 9 to 14 years, which was recommended by the Advisory Committee on Immunization Practices (ACIP) of the Centers for Disease Control and Prevention (CDC) in late 2016.4
Until October 2018, Gardasil 9 was indicated for prevention of genital warts, cervical, vaginal, vulvar and anal cancers and cancer precursors for males and females aged 9 to 26 years. In October the FDA extended approval of the 3-dose vaccine regimen to men and women up to age 45.
HPV vaccine uptake
HPV vaccination has been underutilized in the United States. In 2017, a disappointing 49% of adolescents were up to date on vaccination, and 66% had received at least one dose.5 In rural areas the vaccination rates are 11 points lower than in urban regions.6 The CDC notes an increasing number of HPV-associated cancers—from 30,000 per year in 1999 to 43,000 per year in 2015—due mostly to increases in oral and anal carcinomas. Vaccination with Gardasil 9 could prevent 90% of those cases.7
Non-US successes. HPV vaccine uptake in Australia provides an excellent opportunity to study the impact of universally available, school-based vaccinations. In 2007 Australia implemented a program of free HPV vaccination distributed through schools. Boys and girls aged 12 and 13 were targeted that year, with catch-up vaccinations for those aged 13 to 18 in 2007-2009 in schools and for those aged 18 to 26 reached in the community.8
Continue to: Ali and colleagues studied the...
Ali and colleagues studied the preprogram and postprogram incidence of genital warts.9 About 83% received at least 1 dose of vaccine, and 73% of the eligible population completed the 3-dose regimen. There was a significant reduction in warts in both men and women younger than age 21 from 2007 to 2011 (12.1% to 2.2% in men and 11.5% to 0.85% in women). In the 21 to 30 age group there were similar reductions. This study demonstrates that with universal access and public implementation, the rates of HPV-associated disease can be reduced dramatically.
Data informing expanded vaccination ages
Will vaccination of an older population, with presumably many of whom sexually active and at risk for prior exposure to multiple HPV types, have a reasonable impact on lowering HPV-associated cancers? Are HPV-detected lesions in 27- to 45-year-old women the result of reactivation of latent HPV infection, or are they related to new-onset exposure? The FDA reviewed data from 3 studies of HPV vaccination in women aged 27 to 45. The first enrolled women who were naïve to oncogenic HPV types and provided all 3 doses of quadrivalent vaccine were followed for 4 years, along with a comparison group of nonvaccinated women. The second study allowed the nonvaccinated group to receive vaccine in year 4. Both groups were followed up to 10 years with the relevant outcome defined as cumulative incidence of HPV 6/11/16/18-related CIN and condyloma. The third study looked at the same outcomes in a set of all women—whether HPV high-risk naïve or not—after receiving vaccine and followed more than 10 years.7 This last study is most relevant to ObGyns, as it is closest to how we would consider vaccinating our patients.
The study findings are reassuring: A large proportion of HPV infections in women between 27 and 45 are the result of new exposure/infection. A study of 420 online daters aged 25 to 65 showed an annual incidence of high-risk HPV types in vaginal swabs of 25.4%, of which 64% were likely new acquisitions.10 The 2013-2014 National Health and Nutrition Examination Survey of 1,757 men aged 18 to 59 estimated approximately 45% had genital HPV infection. There was a bimodal distribution of disease with peaks at 28 to 32 and a larger second peak at 58 to 59 years of age.11 Bottom line: Men and women older than age 26 who are sexually active likely acquire new HPV infections with oncogenic types. Exposure to high-risk HPV types prior to vaccination—as we would expect in the real-world setting—did not eliminate the substantial benefit of immunization.
Based on these study results, and extrapolation to the 9-valent vaccine, the FDA extended the approval of Gardasil 9 to men and women from age 9 to 45. The indications and usage will remain the same: for prevention of cervical, vulvar, vaginal, and anal cancer and genital warts as well as precancerous or dysplastic lesions of the cervix, vulva, vagina, and anus related to HPV types 6, 11, 16, 18, 31, 33, 45, 52, and 58.
Continue to: Impact of the new...
Impact of the new indication on HPV-related disease
As described above, widespread vaccination of young girls and boys is going to have major impact on HPV-related disease, including precancer and cancer. Because there is evidence that older women and men are at risk for new HPV infection,10 there likely will be some benefit from vaccination of adults. It is difficult, however, to extrapolate the degree to which adult vaccination will impact HPV-related disease. This is because we do not fully understand the rates at which new HPV infection in the cervices of older women will progress to high-grade dysplasia or cancer. Further, the pathophysiology of HPV-related cancers at other anogenital sites and new oral-pharyngeal infection is poorly understood in comparison with our knowledge of the natural history of high-risk HPV infection in younger women. That said, because of the outstanding efficacy of HPV vaccination and the low-risk profile, even if the actual impact on prevention of cancer or morbidity from dysplasia is relatively low, adult vaccination benefits outweigh the limited risks.
It may be that increased vaccination and awareness of vaccination for adults may enhance the adherence and acceptance of widespread vaccination of boys and girls. Adult vaccination could create a cultural shift toward HPV vaccination acceptance when adult parents and loved ones of vaccine-age boys and girls have been vaccinated themselves.
Current and future insurance coverage
The Affordable Care Act, otherwise known as Obamacare, mandates coverage for all immunizations recommended by the ACIP. HPV vaccination up to age 26 is fully covered, without copay or deductible. The ACIP did consider extension of the indications for HPV vaccination to men and women up to age 45 at their October 2018 meeting. They are tasked with considering not only safety and efficacy but also the cost effectiveness of implementing vaccination. They continue to study the costs and potential benefits of extending HPV vaccination to age 45. Their recommendations may be determined at the February 2019 meeting—or even later in 2019. The American College of Obstetricians and Gynecologists (ACOG) relies upon ACIP for practice guidance. Once the ACIP has made a determination, and if new guidelines are published in the Morbidity and Mortality Weekly Report, insurance coverage and ACOG guidance will be updated.
How should we react and change practice based on this new indication?
Given the information reviewed by the FDA, ObGyns will want to discuss the availability of Gardasil 9 with our patients between ages 27 and 45 who have not been previously immunized.
Especially for our patients with exposure to multiple or new sexual partners, immunization against oncogenic HPV viral types is effective in providing protection from cancer precursors and cancers of the cervix, vulva, vagina, and anus—and of course from genital warts. They should understand that, until formal recommendations are published by the ACIP, they are likely to be responsible for the cost of the vaccination series. These conversations will also remind our patients to immunize their teens against HPV. The more conversation we have regarding the benefits of vaccination against high-risk HPV types, the more likely we are to be able to achieve the impressive results seen in Australia.
The US Food and Drug Administration (FDA) recently extended the approval for Gardasil 9 (to prevent HPV-associated cancers, cancer precursors, and genital lesions) to men and women aged 27 to 45.1 In this editorial, we discuss the evolution of the HPV vaccine since its initial approval more than 10 years ago, the benefits of primary prevention with the HPV vaccine, and the case for the FDA’s recent extension of coverage to older men and women.
The evolution of the HPV vaccine
Since recognition in the 1980s and 90s that high-risk strains of HPV, notably HPV types 16 and 18, were linked to cervical cancer, there have been exciting advances in detection and prevention of high-risk HPV infection. About 70% of cervical cancers are attributable to these 2 oncogenic types.2 The first vaccine licensed, Gardasil (Merck), was approved in 2006 for girls and women aged 9 through 26 to prevent HPV-related diseases caused by types 6, 11, 16, and 18.3 The vaccine was effective for prevention of cervical cancer; genital warts; and grades 2 and 3 of cervical, vulvar, and vaginal intraepithelial neoplasia. In 2008, prevention of vulvar and vaginal cancers was added to the indication. By 2009, prevention of genital warts was added, and use in males aged 9 to 15 was approved. By 2010 sufficient data were accumulated to document prevention of anal cancer and anal intraepithelial neoplasia in men and women, and this indication was added.
In 2014 Gardasil 9 was approved to extend coverage to an additional 5 oncogenic HPV types (31, 33, 45, 52, and 58), now covering an additional 20% of cervical cancers, and in 2015 Gardasil 9 indications were expanded to include boys and men 9 to 26 years of age. Immunogenicity studies were performed to infer effectiveness of a 2-dose regimen in boys and girls aged 9 to 14 years, which was recommended by the Advisory Committee on Immunization Practices (ACIP) of the Centers for Disease Control and Prevention (CDC) in late 2016.4
Until October 2018, Gardasil 9 was indicated for prevention of genital warts, cervical, vaginal, vulvar and anal cancers and cancer precursors for males and females aged 9 to 26 years. In October the FDA extended approval of the 3-dose vaccine regimen to men and women up to age 45.
HPV vaccine uptake
HPV vaccination has been underutilized in the United States. In 2017, a disappointing 49% of adolescents were up to date on vaccination, and 66% had received at least one dose.5 In rural areas the vaccination rates are 11 points lower than in urban regions.6 The CDC notes an increasing number of HPV-associated cancers—from 30,000 per year in 1999 to 43,000 per year in 2015—due mostly to increases in oral and anal carcinomas. Vaccination with Gardasil 9 could prevent 90% of those cases.7
Non-US successes. HPV vaccine uptake in Australia provides an excellent opportunity to study the impact of universally available, school-based vaccinations. In 2007 Australia implemented a program of free HPV vaccination distributed through schools. Boys and girls aged 12 and 13 were targeted that year, with catch-up vaccinations for those aged 13 to 18 in 2007-2009 in schools and for those aged 18 to 26 reached in the community.8
Continue to: Ali and colleagues studied the...
Ali and colleagues studied the preprogram and postprogram incidence of genital warts.9 About 83% received at least 1 dose of vaccine, and 73% of the eligible population completed the 3-dose regimen. There was a significant reduction in warts in both men and women younger than age 21 from 2007 to 2011 (12.1% to 2.2% in men and 11.5% to 0.85% in women). In the 21 to 30 age group there were similar reductions. This study demonstrates that with universal access and public implementation, the rates of HPV-associated disease can be reduced dramatically.
Data informing expanded vaccination ages
Will vaccination of an older population, with presumably many of whom sexually active and at risk for prior exposure to multiple HPV types, have a reasonable impact on lowering HPV-associated cancers? Are HPV-detected lesions in 27- to 45-year-old women the result of reactivation of latent HPV infection, or are they related to new-onset exposure? The FDA reviewed data from 3 studies of HPV vaccination in women aged 27 to 45. The first enrolled women who were naïve to oncogenic HPV types and provided all 3 doses of quadrivalent vaccine were followed for 4 years, along with a comparison group of nonvaccinated women. The second study allowed the nonvaccinated group to receive vaccine in year 4. Both groups were followed up to 10 years with the relevant outcome defined as cumulative incidence of HPV 6/11/16/18-related CIN and condyloma. The third study looked at the same outcomes in a set of all women—whether HPV high-risk naïve or not—after receiving vaccine and followed more than 10 years.7 This last study is most relevant to ObGyns, as it is closest to how we would consider vaccinating our patients.
The study findings are reassuring: A large proportion of HPV infections in women between 27 and 45 are the result of new exposure/infection. A study of 420 online daters aged 25 to 65 showed an annual incidence of high-risk HPV types in vaginal swabs of 25.4%, of which 64% were likely new acquisitions.10 The 2013-2014 National Health and Nutrition Examination Survey of 1,757 men aged 18 to 59 estimated approximately 45% had genital HPV infection. There was a bimodal distribution of disease with peaks at 28 to 32 and a larger second peak at 58 to 59 years of age.11 Bottom line: Men and women older than age 26 who are sexually active likely acquire new HPV infections with oncogenic types. Exposure to high-risk HPV types prior to vaccination—as we would expect in the real-world setting—did not eliminate the substantial benefit of immunization.
Based on these study results, and extrapolation to the 9-valent vaccine, the FDA extended the approval of Gardasil 9 to men and women from age 9 to 45. The indications and usage will remain the same: for prevention of cervical, vulvar, vaginal, and anal cancer and genital warts as well as precancerous or dysplastic lesions of the cervix, vulva, vagina, and anus related to HPV types 6, 11, 16, 18, 31, 33, 45, 52, and 58.
Continue to: Impact of the new...
Impact of the new indication on HPV-related disease
As described above, widespread vaccination of young girls and boys is going to have major impact on HPV-related disease, including precancer and cancer. Because there is evidence that older women and men are at risk for new HPV infection,10 there likely will be some benefit from vaccination of adults. It is difficult, however, to extrapolate the degree to which adult vaccination will impact HPV-related disease. This is because we do not fully understand the rates at which new HPV infection in the cervices of older women will progress to high-grade dysplasia or cancer. Further, the pathophysiology of HPV-related cancers at other anogenital sites and new oral-pharyngeal infection is poorly understood in comparison with our knowledge of the natural history of high-risk HPV infection in younger women. That said, because of the outstanding efficacy of HPV vaccination and the low-risk profile, even if the actual impact on prevention of cancer or morbidity from dysplasia is relatively low, adult vaccination benefits outweigh the limited risks.
It may be that increased vaccination and awareness of vaccination for adults may enhance the adherence and acceptance of widespread vaccination of boys and girls. Adult vaccination could create a cultural shift toward HPV vaccination acceptance when adult parents and loved ones of vaccine-age boys and girls have been vaccinated themselves.
Current and future insurance coverage
The Affordable Care Act, otherwise known as Obamacare, mandates coverage for all immunizations recommended by the ACIP. HPV vaccination up to age 26 is fully covered, without copay or deductible. The ACIP did consider extension of the indications for HPV vaccination to men and women up to age 45 at their October 2018 meeting. They are tasked with considering not only safety and efficacy but also the cost effectiveness of implementing vaccination. They continue to study the costs and potential benefits of extending HPV vaccination to age 45. Their recommendations may be determined at the February 2019 meeting—or even later in 2019. The American College of Obstetricians and Gynecologists (ACOG) relies upon ACIP for practice guidance. Once the ACIP has made a determination, and if new guidelines are published in the Morbidity and Mortality Weekly Report, insurance coverage and ACOG guidance will be updated.
How should we react and change practice based on this new indication?
Given the information reviewed by the FDA, ObGyns will want to discuss the availability of Gardasil 9 with our patients between ages 27 and 45 who have not been previously immunized.
Especially for our patients with exposure to multiple or new sexual partners, immunization against oncogenic HPV viral types is effective in providing protection from cancer precursors and cancers of the cervix, vulva, vagina, and anus—and of course from genital warts. They should understand that, until formal recommendations are published by the ACIP, they are likely to be responsible for the cost of the vaccination series. These conversations will also remind our patients to immunize their teens against HPV. The more conversation we have regarding the benefits of vaccination against high-risk HPV types, the more likely we are to be able to achieve the impressive results seen in Australia.
- US Food and Drug Administration website. FDA approves expanded use of Gardasil 9 to include individuals 27 through 45 years old. https://www.fda.gov/NewsEvents/Newsroom/PressAnnouncements/ucm622715.htm. Updated October 9, 2018. Accessed December 27, 2018.
- World Health Organization website. Human papillomavirus (HPV) and cervical cancer. https://www.who.int/news-room/fact-sheets/detail/human-papillomavirus-(hpv)-and-cervical-cancer. February 15, 2018. Accessed December 27, 2018.
- Centers for Disease Control and Prevention website. Human papillomavirus (HPV) vaccine safety. https://www.cdc.gov/vaccinesafety/vaccines/hpv-vaccine.html. Last reviewed October 27, 2015. Accessed December 27, 2018.
- Meites E, Kempe A, Markowitz LE. Use of a 2-dose schedule for human papillomavirus vaccination—updated recommendations of the Advisory Committee on Immunization Practices. MMWR. 2016;65(49):1405–1408.
- AAP News website. Jenko M. CDC: 49% of teens up to date on HPV vaccine. http://www.aappublications.org/news/2018/08/23/vac cinationrates082318. August 23, 2018. Accessed December 27, 2018.
- Walker TY, Elam-Evans LD, Yankey D, et al. National, regional, state, and selected local area vaccination coverage among adolescents aged 13–17 years—United States, 2017. MMWR Morb Mortal Wkly Rep. 2018;67:909-917.
- Montague L. Summary basis for regulatory action. October 5, 2018. https://www.fda.gov/downloads/BiologicsBloodVaccines/Vaccines/ApprovedProducts/UCM622941.pdf. Accessed December 27, 2018.
- Tabrizi SN, Brotherton JM, Kaldor JM, et al. Fall in human papillomavirus prevalence following a national vaccination program. J Infect Dis. 2012;206:1645-1651.
- Ali H, Donovan B, Wand H, et al. Genital warts in young Australians five years into national human papillomavirus vaccination programme: national surveillance data [published correction appears in BMJ. 2013;346:F2942]. BMJ. 2013;346:F2032.
- Winer RL, Hughes JP, Feng Q, et al. Incident detection of high-risk human papillomavirus infections in a cohort of high-risk women aged 25-65 years. J Infect Dis. 2016;214:665-675.
- Han JJ, Beltran TH, Song JW, et al. Prevalence of genital human papillomavirus infection and human papillomavirus vaccination rates among US adult men: National Health and Nutrition Examination Survey (NHANES) 2013-2014. JAMA Oncol. 2017;3:810-816.
- US Food and Drug Administration website. FDA approves expanded use of Gardasil 9 to include individuals 27 through 45 years old. https://www.fda.gov/NewsEvents/Newsroom/PressAnnouncements/ucm622715.htm. Updated October 9, 2018. Accessed December 27, 2018.
- World Health Organization website. Human papillomavirus (HPV) and cervical cancer. https://www.who.int/news-room/fact-sheets/detail/human-papillomavirus-(hpv)-and-cervical-cancer. February 15, 2018. Accessed December 27, 2018.
- Centers for Disease Control and Prevention website. Human papillomavirus (HPV) vaccine safety. https://www.cdc.gov/vaccinesafety/vaccines/hpv-vaccine.html. Last reviewed October 27, 2015. Accessed December 27, 2018.
- Meites E, Kempe A, Markowitz LE. Use of a 2-dose schedule for human papillomavirus vaccination—updated recommendations of the Advisory Committee on Immunization Practices. MMWR. 2016;65(49):1405–1408.
- AAP News website. Jenko M. CDC: 49% of teens up to date on HPV vaccine. http://www.aappublications.org/news/2018/08/23/vac cinationrates082318. August 23, 2018. Accessed December 27, 2018.
- Walker TY, Elam-Evans LD, Yankey D, et al. National, regional, state, and selected local area vaccination coverage among adolescents aged 13–17 years—United States, 2017. MMWR Morb Mortal Wkly Rep. 2018;67:909-917.
- Montague L. Summary basis for regulatory action. October 5, 2018. https://www.fda.gov/downloads/BiologicsBloodVaccines/Vaccines/ApprovedProducts/UCM622941.pdf. Accessed December 27, 2018.
- Tabrizi SN, Brotherton JM, Kaldor JM, et al. Fall in human papillomavirus prevalence following a national vaccination program. J Infect Dis. 2012;206:1645-1651.
- Ali H, Donovan B, Wand H, et al. Genital warts in young Australians five years into national human papillomavirus vaccination programme: national surveillance data [published correction appears in BMJ. 2013;346:F2942]. BMJ. 2013;346:F2032.
- Winer RL, Hughes JP, Feng Q, et al. Incident detection of high-risk human papillomavirus infections in a cohort of high-risk women aged 25-65 years. J Infect Dis. 2016;214:665-675.
- Han JJ, Beltran TH, Song JW, et al. Prevalence of genital human papillomavirus infection and human papillomavirus vaccination rates among US adult men: National Health and Nutrition Examination Survey (NHANES) 2013-2014. JAMA Oncol. 2017;3:810-816.
Puppy bite at yoga retreat leads to rabies death: Prompts health warning
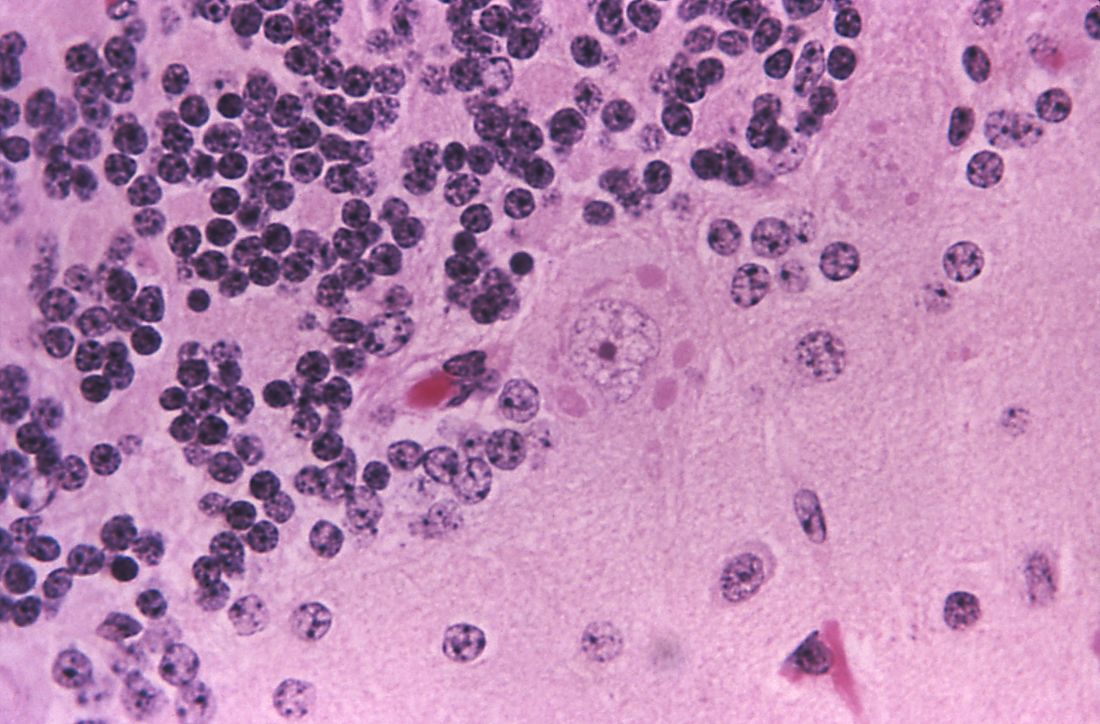
Individuals going to rabies-endemic countries should have a pretrip consultation with a travel health specialist, say authors of a case report describing the death of a woman who sustained a bite from a rabid puppy during a 2017 yoga retreat in rural India.
Preexposure prophylaxis is warranted, especially for individuals expected to be in those countries for long durations, those planning to go to remote areas, or if they plan activities that may put them at risk for rabies exposure, the authors wrote in Morbidity and Mortality Weekly Report.
“In the case of the yoga retreat tour, given the extended length of the tour and the rural and community activities involved, pretravel rabies vaccination should have been considered,” said Julia Murphy, DVM, a veterinarian with the Virginia Department of Health, and her coauthors in the recently published report.
The case also underscores the importance of prompt rabies diagnosis, according to Dr. Murphy and her colleagues: 250 health care workers were assessed for exposure to the patient, 72 (29%) of whom were advised to initiate postexposure prophylaxis and were treated at a cost of nearly a quarter million dollars.
The Virginia woman described in the case report was aged 65 years and had no preexisting health conditions. She had spent more than 2 months on a yoga retreat tour in India and was bitten by a puppy near her hotel in Rishikesh in northern India, according to results of a public health investigation.
That retreat ended on April 7, 2017, according to the report, and on May 3, 2017, the woman started to have pain and paresthesia in her right arm during gardening.
On May 6, she sought care at an urgent care facility, resulting in a diagnosis of carpal tunnel syndrome and a prescription for an NSAID.
The next day, she was evaluated at a hospital for anxiety, insomnia, shortness of breath, and difficulty swallowing water and was given lorazepam for a presumed panic attack. She was discharged and, in her car, experienced claustrophobia and shortness of breath. She returned to the hospital’s ED, received more lorazepam, and was again discharged.
The day after that, she was transported by ambulance to another hospital with increased anxiety, shortness of breath, chest discomfort, and progressive paresthesia; she was found to have elevated cardiac enzymes and underwent emergency cardiac catheterization, which revealed normal arteries.
That evening, the patient became “progressively agitated and combative,” according to the report, and was found to be gasping for air while trying to drink water. When family were questioned about animal exposures, the woman’s husband indicated that she had been bitten on the right hand by a puppy during the yoga retreat, about 6 weeks before the symptoms started.
Once a diagnosis of rabies was confirmed, the woman was started on aggressive treatment but eventually died, according to Dr. Murphy and her coauthors, which made this patient the ninth person in the United States to die from rabies exposure while overseas since 2008. Canine rabies has been eliminated in the United States because of the strict vaccination laws.
“These events underscore the importance of obtaining a thorough pretravel health consultation, particularly when visiting countries with high incidence of emerging or zoonotic pathogens, to ensure awareness of health risks and appropriate pretravel and postexposure health care actions,” they concluded in their report.
Dr. Murphy and her coauthors reported no potential conflicts of interest related to the case report.
SOURCE: Murphy J et al. MMWR Morb Mortal Wkly Rep. 2019 Jan 4;67(5152):1410-4.
Individuals going to rabies-endemic countries should have a pretrip consultation with a travel health specialist, say authors of a case report describing the death of a woman who sustained a bite from a rabid puppy during a 2017 yoga retreat in rural India.
Preexposure prophylaxis is warranted, especially for individuals expected to be in those countries for long durations, those planning to go to remote areas, or if they plan activities that may put them at risk for rabies exposure, the authors wrote in Morbidity and Mortality Weekly Report.
“In the case of the yoga retreat tour, given the extended length of the tour and the rural and community activities involved, pretravel rabies vaccination should have been considered,” said Julia Murphy, DVM, a veterinarian with the Virginia Department of Health, and her coauthors in the recently published report.
The case also underscores the importance of prompt rabies diagnosis, according to Dr. Murphy and her colleagues: 250 health care workers were assessed for exposure to the patient, 72 (29%) of whom were advised to initiate postexposure prophylaxis and were treated at a cost of nearly a quarter million dollars.
The Virginia woman described in the case report was aged 65 years and had no preexisting health conditions. She had spent more than 2 months on a yoga retreat tour in India and was bitten by a puppy near her hotel in Rishikesh in northern India, according to results of a public health investigation.
That retreat ended on April 7, 2017, according to the report, and on May 3, 2017, the woman started to have pain and paresthesia in her right arm during gardening.
On May 6, she sought care at an urgent care facility, resulting in a diagnosis of carpal tunnel syndrome and a prescription for an NSAID.
The next day, she was evaluated at a hospital for anxiety, insomnia, shortness of breath, and difficulty swallowing water and was given lorazepam for a presumed panic attack. She was discharged and, in her car, experienced claustrophobia and shortness of breath. She returned to the hospital’s ED, received more lorazepam, and was again discharged.
The day after that, she was transported by ambulance to another hospital with increased anxiety, shortness of breath, chest discomfort, and progressive paresthesia; she was found to have elevated cardiac enzymes and underwent emergency cardiac catheterization, which revealed normal arteries.
That evening, the patient became “progressively agitated and combative,” according to the report, and was found to be gasping for air while trying to drink water. When family were questioned about animal exposures, the woman’s husband indicated that she had been bitten on the right hand by a puppy during the yoga retreat, about 6 weeks before the symptoms started.
Once a diagnosis of rabies was confirmed, the woman was started on aggressive treatment but eventually died, according to Dr. Murphy and her coauthors, which made this patient the ninth person in the United States to die from rabies exposure while overseas since 2008. Canine rabies has been eliminated in the United States because of the strict vaccination laws.
“These events underscore the importance of obtaining a thorough pretravel health consultation, particularly when visiting countries with high incidence of emerging or zoonotic pathogens, to ensure awareness of health risks and appropriate pretravel and postexposure health care actions,” they concluded in their report.
Dr. Murphy and her coauthors reported no potential conflicts of interest related to the case report.
SOURCE: Murphy J et al. MMWR Morb Mortal Wkly Rep. 2019 Jan 4;67(5152):1410-4.
Individuals going to rabies-endemic countries should have a pretrip consultation with a travel health specialist, say authors of a case report describing the death of a woman who sustained a bite from a rabid puppy during a 2017 yoga retreat in rural India.
Preexposure prophylaxis is warranted, especially for individuals expected to be in those countries for long durations, those planning to go to remote areas, or if they plan activities that may put them at risk for rabies exposure, the authors wrote in Morbidity and Mortality Weekly Report.
“In the case of the yoga retreat tour, given the extended length of the tour and the rural and community activities involved, pretravel rabies vaccination should have been considered,” said Julia Murphy, DVM, a veterinarian with the Virginia Department of Health, and her coauthors in the recently published report.
The case also underscores the importance of prompt rabies diagnosis, according to Dr. Murphy and her colleagues: 250 health care workers were assessed for exposure to the patient, 72 (29%) of whom were advised to initiate postexposure prophylaxis and were treated at a cost of nearly a quarter million dollars.
The Virginia woman described in the case report was aged 65 years and had no preexisting health conditions. She had spent more than 2 months on a yoga retreat tour in India and was bitten by a puppy near her hotel in Rishikesh in northern India, according to results of a public health investigation.
That retreat ended on April 7, 2017, according to the report, and on May 3, 2017, the woman started to have pain and paresthesia in her right arm during gardening.
On May 6, she sought care at an urgent care facility, resulting in a diagnosis of carpal tunnel syndrome and a prescription for an NSAID.
The next day, she was evaluated at a hospital for anxiety, insomnia, shortness of breath, and difficulty swallowing water and was given lorazepam for a presumed panic attack. She was discharged and, in her car, experienced claustrophobia and shortness of breath. She returned to the hospital’s ED, received more lorazepam, and was again discharged.
The day after that, she was transported by ambulance to another hospital with increased anxiety, shortness of breath, chest discomfort, and progressive paresthesia; she was found to have elevated cardiac enzymes and underwent emergency cardiac catheterization, which revealed normal arteries.
That evening, the patient became “progressively agitated and combative,” according to the report, and was found to be gasping for air while trying to drink water. When family were questioned about animal exposures, the woman’s husband indicated that she had been bitten on the right hand by a puppy during the yoga retreat, about 6 weeks before the symptoms started.
Once a diagnosis of rabies was confirmed, the woman was started on aggressive treatment but eventually died, according to Dr. Murphy and her coauthors, which made this patient the ninth person in the United States to die from rabies exposure while overseas since 2008. Canine rabies has been eliminated in the United States because of the strict vaccination laws.
“These events underscore the importance of obtaining a thorough pretravel health consultation, particularly when visiting countries with high incidence of emerging or zoonotic pathogens, to ensure awareness of health risks and appropriate pretravel and postexposure health care actions,” they concluded in their report.
Dr. Murphy and her coauthors reported no potential conflicts of interest related to the case report.
SOURCE: Murphy J et al. MMWR Morb Mortal Wkly Rep. 2019 Jan 4;67(5152):1410-4.
FROM MMWR
Key clinical point: depending on length of trip, location, and activities involved.
Major finding: A Virginia woman died after sustaining a bite from a rabid puppy during a 2017 yoga retreat in rural India.
Study details: Case report including details of the 65-year-old woman’s trip, rabies exposure, symptoms, diagnosis, and eventual death.
Disclosures: Authors reported no potential conflicts of interest.
Source: Murphy J et al. MMWR Morb Mortal Wkly Rep. 2019 Jan 4;67(5152):1410-4.
Danish study finds reassuring data on pregnancy outcomes in atopic dermatitis patients
PARIS – over an 18-year period, which showed no increased risk of pregnancy and birth problems other than modestly increased risks of premature rupture of membranes and neonatal staphylococcal septicemia, according to Jacob P. Thyssen, MD, PhD.

At a session of the European Task Force of Atopic Dermatitis held in conjunction with the annual congress of the European Academy of Dermatology and Venereology, he presented a case control study of 10,668 births to Danish women with atopic dermatitis (AD) during 1997-2014. They were matched 1:10 by age, parity, and birth year to mothers without AD.
The risk of premature rupture of membranes was 15% higher in mothers with AD. And while the increased relative risk of neonatal staphylococcal septicemia was more substantial – a 145% increase – this was in fact a rare complication, observed Dr. Thyssen, a dermatologist at the University of Copenhagen.
There was no significant difference between women with or without AD in rates of preeclampsia, prematurity, pregnancy-induced hypertension, placenta previa, placental abruption, neonatal nonstaphylococcal septicemia, or other complications. The two groups had a similar number of visits to physicians and midwives during pregnancy.
Moreover, although the body mass index was similar in women with or without AD, the risk of gestational diabetes in women with the disease was significantly reduced by 21%; their risk of having a large-for-gestational-age baby with a birth weight of 4,500 g or more was also significantly lower than in controls.
Women received less treatment for AD during their pregnancy than they did beforehand. While pregnant, their disease was managed predominantly with topical corticosteroids and UV therapy. There was very little use of superpotent topical steroids, topical calcineurin inhibitors, or immunosuppressants, although 10% of pregnant women received systemic corticosteroids for their AD.
Dr. Thyssen reported serving as a scientific adviser and paid speaker for Leo Pharma, Roche, Eli Lilly, and Sanofi-Genzyme, although this study was conducted without commercial support.
PARIS – over an 18-year period, which showed no increased risk of pregnancy and birth problems other than modestly increased risks of premature rupture of membranes and neonatal staphylococcal septicemia, according to Jacob P. Thyssen, MD, PhD.
At a session of the European Task Force of Atopic Dermatitis held in conjunction with the annual congress of the European Academy of Dermatology and Venereology, he presented a case control study of 10,668 births to Danish women with atopic dermatitis (AD) during 1997-2014. They were matched 1:10 by age, parity, and birth year to mothers without AD.
The risk of premature rupture of membranes was 15% higher in mothers with AD. And while the increased relative risk of neonatal staphylococcal septicemia was more substantial – a 145% increase – this was in fact a rare complication, observed Dr. Thyssen, a dermatologist at the University of Copenhagen.
There was no significant difference between women with or without AD in rates of preeclampsia, prematurity, pregnancy-induced hypertension, placenta previa, placental abruption, neonatal nonstaphylococcal septicemia, or other complications. The two groups had a similar number of visits to physicians and midwives during pregnancy.
Moreover, although the body mass index was similar in women with or without AD, the risk of gestational diabetes in women with the disease was significantly reduced by 21%; their risk of having a large-for-gestational-age baby with a birth weight of 4,500 g or more was also significantly lower than in controls.
Women received less treatment for AD during their pregnancy than they did beforehand. While pregnant, their disease was managed predominantly with topical corticosteroids and UV therapy. There was very little use of superpotent topical steroids, topical calcineurin inhibitors, or immunosuppressants, although 10% of pregnant women received systemic corticosteroids for their AD.
Dr. Thyssen reported serving as a scientific adviser and paid speaker for Leo Pharma, Roche, Eli Lilly, and Sanofi-Genzyme, although this study was conducted without commercial support.
PARIS – over an 18-year period, which showed no increased risk of pregnancy and birth problems other than modestly increased risks of premature rupture of membranes and neonatal staphylococcal septicemia, according to Jacob P. Thyssen, MD, PhD.
At a session of the European Task Force of Atopic Dermatitis held in conjunction with the annual congress of the European Academy of Dermatology and Venereology, he presented a case control study of 10,668 births to Danish women with atopic dermatitis (AD) during 1997-2014. They were matched 1:10 by age, parity, and birth year to mothers without AD.
The risk of premature rupture of membranes was 15% higher in mothers with AD. And while the increased relative risk of neonatal staphylococcal septicemia was more substantial – a 145% increase – this was in fact a rare complication, observed Dr. Thyssen, a dermatologist at the University of Copenhagen.
There was no significant difference between women with or without AD in rates of preeclampsia, prematurity, pregnancy-induced hypertension, placenta previa, placental abruption, neonatal nonstaphylococcal septicemia, or other complications. The two groups had a similar number of visits to physicians and midwives during pregnancy.
Moreover, although the body mass index was similar in women with or without AD, the risk of gestational diabetes in women with the disease was significantly reduced by 21%; their risk of having a large-for-gestational-age baby with a birth weight of 4,500 g or more was also significantly lower than in controls.
Women received less treatment for AD during their pregnancy than they did beforehand. While pregnant, their disease was managed predominantly with topical corticosteroids and UV therapy. There was very little use of superpotent topical steroids, topical calcineurin inhibitors, or immunosuppressants, although 10% of pregnant women received systemic corticosteroids for their AD.
Dr. Thyssen reported serving as a scientific adviser and paid speaker for Leo Pharma, Roche, Eli Lilly, and Sanofi-Genzyme, although this study was conducted without commercial support.
REPORTING FROM THE EADV CONGRESS
Key clinical point: Birth complications are uncommon for women with atopic dermatitis in pregnancy.
Major finding: The risk of premature rupture of membranes was increased by 15% in women with atopic dermatitis in pregnancy, but their risk of gestational diabetes was reduced by 21%.
Study details: This case control study included 10,668 births to Danish women with atopic dermatitis and 10 times as many matched controls without the disease.
Disclosures: The study presenter reported serving as a scientific adviser and paid speaker for Leo Pharma, Roche, Eli Lilly, and Sanofi-Genzyme, although this study was conducted without commercial support.

Difelikefalin shows promise for hemodialysis-associated itch
PARIS – while achieving across-the-board clinically meaningful improvements in quality of life measures in patients with hemodialysis-associated pruritus in a phase 2 study, Frédérique Menzaghi, PhD, reported at the annual congress of the European Academy of Dermatology and Venereology.

At present there is no approved medication in the United States or Europe for the often intense itching associated with chronic kidney disease. Off-label treatments have limited efficacy.
Dr. Menzaghi is senior vice president for research and development at Cara Therapeutics, which is developing difelikefalin.
More than half – 60% to 70% – of patients on hemodialysis for end-stage renal disease experience chronic pruritus, as do a smaller proportion of individuals with chronic kidney disease (CKD) not requiring dialysis. CKD-associated pruritus is a day-and-night itch that makes life miserable for affected patients. Not only must they endure the predictable complications of skin excoriation, including impetigo, ulcerations, papules, and prurigo nodularis, but they also experience sleep disruption, depressed mood, and a 10%-20% increased mortality risk compared with CKD patients without pruritus.
Difelikefalin is a potent and selective peripheral kappa opioid receptor agonist that doesn’t activate mu or delta opioid receptors. It’s a synthetic drug that mimics endogenous dynorphin. Its key attribute is that it doesn’t cross the blood/brain barrier, so it doesn’t pose a risk for adverse events caused by activation of central opioid receptors. Difelikefalin has two mechanisms of action in CKD-associated pruritus: an antipruritic effect due to inhibition of ion channels responsible for afferent peripheral nerve activity; and an anti-inflammatory effect mediated by activation of kappa opioid receptors expressed by immune system cells, according to Dr. Menzaghi.
She reported on 174 hemodialysis patients with moderate to severe CKD-associated pruritus who were randomized to a double-blind, phase 2, dose-ranging study featuring an intravenous bolus of difelikefalin at 0.5, 1.0, or 1.5 mcg/kg or placebo given immediately after each of the thrice-weekly hemodialysis sessions for 8 weeks.
An oral formulation of difelikefalin is also under investigation for treatment of CKD-associated pruritus. The IV version is being developed for hemodialysis patients because difelikefalin is renally excreted.
“We’re taking advantage of the fact that their kidneys aren’t working. The drug stays in the system until the next dialysis because it can’t be eliminated. It’s quite convenient for these patients,” she explained.
The primary endpoint in the phase 2 study was change from baseline through week 8 in the weekly average of a patient’s daily self-rated 0-10 worst itching intensity numeric rating scale (NRS) scores. All participants had to have a baseline NRS score of at least 4, considered the lower threshold for moderate itch. In fact, the mean baseline score was 6.7-7.1 in the four study arms.
The results
Sixty-four percent of patients on difelikefalin 0.5 mcg/kg – the most effective dose – experienced at least a 3-point reduction, compared with 29% of placebo-treated controls. And a 4-point or greater reduction in NRS from baseline was documented in 51% of patients on difelikefalin at 0.5 mcg/kg, compared with 24% of controls.
Although a 4-point difference is widely considered to represent clinically meaningful improvement in atopic dermatitis studies, Dr. Menzaghi said psychometric analyses of the difelikefalin trial data indicated that a 3-point or greater improvement in NRS score was associated with clinically meaningful change.
“Our data suggest that a 4-point change may not be generalizable to all conditions,” she said.
Hemodialysis patients with severe baseline itch typically improved to moderate itch on difelikefalin, while those with baseline moderate itch – that is, an NRS of 4-6 – dropped down to mild or no itch while on the drug.
“But that’s just a number. The question is, is that really clinically meaningful?” Dr. Menzaghi noted.
The answer, she continued, is yes. A high correlation was seen between reduction in itch intensity and improvement in quality of life. Scores on the 5-D Itch Scale and Skindex-10 improved two- to threefold more in the difelikefalin 0.5-mcg group than in controls. So did scores on the 12-item Medical Outcomes Study Sleep Scale assessing sleep restlessness, awakening during sleep, and trouble falling asleep.
“We think these results suggest that peripheral kappa opioid receptors play an integral role in the modulation of itch signals and represent a primary target for the development of antipruritic agents,” said Dr. Menzaghi.
Indeed, a phase 3 randomized trial of difelikefalin 0.5 mcg/kg versus placebo in 350 hemodialysis patients with CKD-associated itch is ongoing in the United States, Europe, Australia, and Korea. Also ongoing is a phase 2 U.S. study of oral difelikefalin in patients with CKD-associated pruritus, many of whom are not on hemodialysis. In January, the company announced that enrollment in a phase 3 U.S. study of difelikefalin injection (0.5 mcg/kg) in hemodialysis patients with moderate to severe CKD-associated pruritus had been completed. The trials are funded by Cara Therapeutics.
SOURCE: Menzaghi F. EADV Congress, Abstract FC0.4.7.
PARIS – while achieving across-the-board clinically meaningful improvements in quality of life measures in patients with hemodialysis-associated pruritus in a phase 2 study, Frédérique Menzaghi, PhD, reported at the annual congress of the European Academy of Dermatology and Venereology.
At present there is no approved medication in the United States or Europe for the often intense itching associated with chronic kidney disease. Off-label treatments have limited efficacy.
Dr. Menzaghi is senior vice president for research and development at Cara Therapeutics, which is developing difelikefalin.
More than half – 60% to 70% – of patients on hemodialysis for end-stage renal disease experience chronic pruritus, as do a smaller proportion of individuals with chronic kidney disease (CKD) not requiring dialysis. CKD-associated pruritus is a day-and-night itch that makes life miserable for affected patients. Not only must they endure the predictable complications of skin excoriation, including impetigo, ulcerations, papules, and prurigo nodularis, but they also experience sleep disruption, depressed mood, and a 10%-20% increased mortality risk compared with CKD patients without pruritus.
Difelikefalin is a potent and selective peripheral kappa opioid receptor agonist that doesn’t activate mu or delta opioid receptors. It’s a synthetic drug that mimics endogenous dynorphin. Its key attribute is that it doesn’t cross the blood/brain barrier, so it doesn’t pose a risk for adverse events caused by activation of central opioid receptors. Difelikefalin has two mechanisms of action in CKD-associated pruritus: an antipruritic effect due to inhibition of ion channels responsible for afferent peripheral nerve activity; and an anti-inflammatory effect mediated by activation of kappa opioid receptors expressed by immune system cells, according to Dr. Menzaghi.
She reported on 174 hemodialysis patients with moderate to severe CKD-associated pruritus who were randomized to a double-blind, phase 2, dose-ranging study featuring an intravenous bolus of difelikefalin at 0.5, 1.0, or 1.5 mcg/kg or placebo given immediately after each of the thrice-weekly hemodialysis sessions for 8 weeks.
An oral formulation of difelikefalin is also under investigation for treatment of CKD-associated pruritus. The IV version is being developed for hemodialysis patients because difelikefalin is renally excreted.
“We’re taking advantage of the fact that their kidneys aren’t working. The drug stays in the system until the next dialysis because it can’t be eliminated. It’s quite convenient for these patients,” she explained.
The primary endpoint in the phase 2 study was change from baseline through week 8 in the weekly average of a patient’s daily self-rated 0-10 worst itching intensity numeric rating scale (NRS) scores. All participants had to have a baseline NRS score of at least 4, considered the lower threshold for moderate itch. In fact, the mean baseline score was 6.7-7.1 in the four study arms.
The results
Sixty-four percent of patients on difelikefalin 0.5 mcg/kg – the most effective dose – experienced at least a 3-point reduction, compared with 29% of placebo-treated controls. And a 4-point or greater reduction in NRS from baseline was documented in 51% of patients on difelikefalin at 0.5 mcg/kg, compared with 24% of controls.
Although a 4-point difference is widely considered to represent clinically meaningful improvement in atopic dermatitis studies, Dr. Menzaghi said psychometric analyses of the difelikefalin trial data indicated that a 3-point or greater improvement in NRS score was associated with clinically meaningful change.
“Our data suggest that a 4-point change may not be generalizable to all conditions,” she said.
Hemodialysis patients with severe baseline itch typically improved to moderate itch on difelikefalin, while those with baseline moderate itch – that is, an NRS of 4-6 – dropped down to mild or no itch while on the drug.
“But that’s just a number. The question is, is that really clinically meaningful?” Dr. Menzaghi noted.
The answer, she continued, is yes. A high correlation was seen between reduction in itch intensity and improvement in quality of life. Scores on the 5-D Itch Scale and Skindex-10 improved two- to threefold more in the difelikefalin 0.5-mcg group than in controls. So did scores on the 12-item Medical Outcomes Study Sleep Scale assessing sleep restlessness, awakening during sleep, and trouble falling asleep.
“We think these results suggest that peripheral kappa opioid receptors play an integral role in the modulation of itch signals and represent a primary target for the development of antipruritic agents,” said Dr. Menzaghi.
Indeed, a phase 3 randomized trial of difelikefalin 0.5 mcg/kg versus placebo in 350 hemodialysis patients with CKD-associated itch is ongoing in the United States, Europe, Australia, and Korea. Also ongoing is a phase 2 U.S. study of oral difelikefalin in patients with CKD-associated pruritus, many of whom are not on hemodialysis. In January, the company announced that enrollment in a phase 3 U.S. study of difelikefalin injection (0.5 mcg/kg) in hemodialysis patients with moderate to severe CKD-associated pruritus had been completed. The trials are funded by Cara Therapeutics.
SOURCE: Menzaghi F. EADV Congress, Abstract FC0.4.7.
PARIS – while achieving across-the-board clinically meaningful improvements in quality of life measures in patients with hemodialysis-associated pruritus in a phase 2 study, Frédérique Menzaghi, PhD, reported at the annual congress of the European Academy of Dermatology and Venereology.
At present there is no approved medication in the United States or Europe for the often intense itching associated with chronic kidney disease. Off-label treatments have limited efficacy.
Dr. Menzaghi is senior vice president for research and development at Cara Therapeutics, which is developing difelikefalin.
More than half – 60% to 70% – of patients on hemodialysis for end-stage renal disease experience chronic pruritus, as do a smaller proportion of individuals with chronic kidney disease (CKD) not requiring dialysis. CKD-associated pruritus is a day-and-night itch that makes life miserable for affected patients. Not only must they endure the predictable complications of skin excoriation, including impetigo, ulcerations, papules, and prurigo nodularis, but they also experience sleep disruption, depressed mood, and a 10%-20% increased mortality risk compared with CKD patients without pruritus.
Difelikefalin is a potent and selective peripheral kappa opioid receptor agonist that doesn’t activate mu or delta opioid receptors. It’s a synthetic drug that mimics endogenous dynorphin. Its key attribute is that it doesn’t cross the blood/brain barrier, so it doesn’t pose a risk for adverse events caused by activation of central opioid receptors. Difelikefalin has two mechanisms of action in CKD-associated pruritus: an antipruritic effect due to inhibition of ion channels responsible for afferent peripheral nerve activity; and an anti-inflammatory effect mediated by activation of kappa opioid receptors expressed by immune system cells, according to Dr. Menzaghi.
She reported on 174 hemodialysis patients with moderate to severe CKD-associated pruritus who were randomized to a double-blind, phase 2, dose-ranging study featuring an intravenous bolus of difelikefalin at 0.5, 1.0, or 1.5 mcg/kg or placebo given immediately after each of the thrice-weekly hemodialysis sessions for 8 weeks.
An oral formulation of difelikefalin is also under investigation for treatment of CKD-associated pruritus. The IV version is being developed for hemodialysis patients because difelikefalin is renally excreted.
“We’re taking advantage of the fact that their kidneys aren’t working. The drug stays in the system until the next dialysis because it can’t be eliminated. It’s quite convenient for these patients,” she explained.
The primary endpoint in the phase 2 study was change from baseline through week 8 in the weekly average of a patient’s daily self-rated 0-10 worst itching intensity numeric rating scale (NRS) scores. All participants had to have a baseline NRS score of at least 4, considered the lower threshold for moderate itch. In fact, the mean baseline score was 6.7-7.1 in the four study arms.
The results
Sixty-four percent of patients on difelikefalin 0.5 mcg/kg – the most effective dose – experienced at least a 3-point reduction, compared with 29% of placebo-treated controls. And a 4-point or greater reduction in NRS from baseline was documented in 51% of patients on difelikefalin at 0.5 mcg/kg, compared with 24% of controls.
Although a 4-point difference is widely considered to represent clinically meaningful improvement in atopic dermatitis studies, Dr. Menzaghi said psychometric analyses of the difelikefalin trial data indicated that a 3-point or greater improvement in NRS score was associated with clinically meaningful change.
“Our data suggest that a 4-point change may not be generalizable to all conditions,” she said.
Hemodialysis patients with severe baseline itch typically improved to moderate itch on difelikefalin, while those with baseline moderate itch – that is, an NRS of 4-6 – dropped down to mild or no itch while on the drug.
“But that’s just a number. The question is, is that really clinically meaningful?” Dr. Menzaghi noted.
The answer, she continued, is yes. A high correlation was seen between reduction in itch intensity and improvement in quality of life. Scores on the 5-D Itch Scale and Skindex-10 improved two- to threefold more in the difelikefalin 0.5-mcg group than in controls. So did scores on the 12-item Medical Outcomes Study Sleep Scale assessing sleep restlessness, awakening during sleep, and trouble falling asleep.
“We think these results suggest that peripheral kappa opioid receptors play an integral role in the modulation of itch signals and represent a primary target for the development of antipruritic agents,” said Dr. Menzaghi.
Indeed, a phase 3 randomized trial of difelikefalin 0.5 mcg/kg versus placebo in 350 hemodialysis patients with CKD-associated itch is ongoing in the United States, Europe, Australia, and Korea. Also ongoing is a phase 2 U.S. study of oral difelikefalin in patients with CKD-associated pruritus, many of whom are not on hemodialysis. In January, the company announced that enrollment in a phase 3 U.S. study of difelikefalin injection (0.5 mcg/kg) in hemodialysis patients with moderate to severe CKD-associated pruritus had been completed. The trials are funded by Cara Therapeutics.
SOURCE: Menzaghi F. EADV Congress, Abstract FC0.4.7.
REPORTING FROM THE EADV CONGRESS
Key clinical point: Moderate to severe chronic itching associated with chronic kidney disease is a common and underrecognized problem with a huge quality of life impact.
Major finding: Sixty-four percent of hemodialysis patients on difelikefalin 0.5 mcg/kg experienced at least a 3-point reduction on a 0-10 worst daily itch numeric rating scale, compared with 29% of placebo-treated controls.
Study details: This phase 2, multicenter, 8-week, double-blind study comprised 174 patients with moderate to severe hemodialysis-related itching.
Disclosures: The study was sponsored by Cara Therapeutics and presented by a company officer.
Source: Menzaghi F. EADV Congress, Abstract FC0.4.7.

Veterans Learn the Healing Arts
Making art is not only life enriching—it can help reduce stress and anxiety, provide emotional release, relieve depression, and boost self-esteem. That is why art therapy has been a valuable part of VA mental health services since 1945. Plein air painting—painting outdoors “in the fresh air”—gives an added dimension to that. It can be both calming and energizing, offers challenges not found in a studio setting, teaches observation, and can lead to rewarding social interactions and connections. Not least, there is the benefit of being surrounded by nature.
The publishers and editor of Plein Air magazine wanted to introduce more veterans to the pleasures and benefits of outdoor painting, so they created the Plein Air Force Veterans Squad. Dennis Tyson, Commander of the Veterans Squad, says the goal is to “[s]how our gratitude to veterans by teaching them painting, allowing them to enjoy the benefits and stress reduction that come with painting outdoors.” The program seeks to enlist painters from around the nation to visit veterans’ groups, do demonstrations, and offer free lessons. The guiding principle, Tyson says, is that cost should not prevent any veteran from participating, so lessons and supplies are free or low-cost.
The program runs 2 websites. PleinAirForce.com gives existing plein air painters “missions” and tools to spread the word about plein air painting. That site provides scripts, posters, and guidance on promoting speaking engagements. A main purpose is to drive veterans and others interested in learning to the second website, PaintOutside.com, “so we can give them encouragement, free lessons, tips and tools to start painting.” PaintOutside.com also offers a directory of artists who teach, and a directory of “painting buddies.”
In addition to the websites, interested veterans can get more information at www.facebook.com/pleinairmagazine.
Making art is not only life enriching—it can help reduce stress and anxiety, provide emotional release, relieve depression, and boost self-esteem. That is why art therapy has been a valuable part of VA mental health services since 1945. Plein air painting—painting outdoors “in the fresh air”—gives an added dimension to that. It can be both calming and energizing, offers challenges not found in a studio setting, teaches observation, and can lead to rewarding social interactions and connections. Not least, there is the benefit of being surrounded by nature.
The publishers and editor of Plein Air magazine wanted to introduce more veterans to the pleasures and benefits of outdoor painting, so they created the Plein Air Force Veterans Squad. Dennis Tyson, Commander of the Veterans Squad, says the goal is to “[s]how our gratitude to veterans by teaching them painting, allowing them to enjoy the benefits and stress reduction that come with painting outdoors.” The program seeks to enlist painters from around the nation to visit veterans’ groups, do demonstrations, and offer free lessons. The guiding principle, Tyson says, is that cost should not prevent any veteran from participating, so lessons and supplies are free or low-cost.
The program runs 2 websites. PleinAirForce.com gives existing plein air painters “missions” and tools to spread the word about plein air painting. That site provides scripts, posters, and guidance on promoting speaking engagements. A main purpose is to drive veterans and others interested in learning to the second website, PaintOutside.com, “so we can give them encouragement, free lessons, tips and tools to start painting.” PaintOutside.com also offers a directory of artists who teach, and a directory of “painting buddies.”
In addition to the websites, interested veterans can get more information at www.facebook.com/pleinairmagazine.
Making art is not only life enriching—it can help reduce stress and anxiety, provide emotional release, relieve depression, and boost self-esteem. That is why art therapy has been a valuable part of VA mental health services since 1945. Plein air painting—painting outdoors “in the fresh air”—gives an added dimension to that. It can be both calming and energizing, offers challenges not found in a studio setting, teaches observation, and can lead to rewarding social interactions and connections. Not least, there is the benefit of being surrounded by nature.
The publishers and editor of Plein Air magazine wanted to introduce more veterans to the pleasures and benefits of outdoor painting, so they created the Plein Air Force Veterans Squad. Dennis Tyson, Commander of the Veterans Squad, says the goal is to “[s]how our gratitude to veterans by teaching them painting, allowing them to enjoy the benefits and stress reduction that come with painting outdoors.” The program seeks to enlist painters from around the nation to visit veterans’ groups, do demonstrations, and offer free lessons. The guiding principle, Tyson says, is that cost should not prevent any veteran from participating, so lessons and supplies are free or low-cost.
The program runs 2 websites. PleinAirForce.com gives existing plein air painters “missions” and tools to spread the word about plein air painting. That site provides scripts, posters, and guidance on promoting speaking engagements. A main purpose is to drive veterans and others interested in learning to the second website, PaintOutside.com, “so we can give them encouragement, free lessons, tips and tools to start painting.” PaintOutside.com also offers a directory of artists who teach, and a directory of “painting buddies.”
In addition to the websites, interested veterans can get more information at www.facebook.com/pleinairmagazine.
Gender, racial, socioeconomic differences found in obesity-depression link
Association holds for white women across income levels, black men with incomes of $100,000 or higher.
Among white women, obesity is positively associated with depressive symptoms across all income levels. However, among black women, no such associations are found – regardless of income. Meanwhile, among men, the link between obesity and depression appears strong for black men with high household incomes, a cross-sectional analysis of 12,220 adults suggests.
“This work underscores the importance of disentangling the association of race and [socioeconomic status] to gain a better understanding of how each operates to impact health outcomes,” wrote Caryn N. Bell, PhD, and her associates. The report is in Preventive Medicine.
The study comprised 3,755 black subjects, 55.5% of whom were women, and 8,465 white subjects, 51.8% of whom were women. They completed a detailed questionnaire as part of the 2007-2014 National Health and Nutrition Examination Survey and had a physical exam. Depressive symptoms were measured by the Patient Health Questionnaire-9 (PHQ-9), and obesity was defined as a body mass index of 30 kg/m2 or higher. About 1% of both black and white subjects had severe depressive symptoms, meaning a PHQ-9 score ranging from 20 to 27 points.
A greater percentage of black participants were obese (47.3% vs. 34.4%), and black participants were less likely to live in a household earning $100,000 per year or more (10.9% vs. 28.3%). Black participants were a bit younger (mean age 44.8 years vs. 49.2 years), and less likely to be currently married, college graduates, insured, and physically active. A higher percentage reported fair to poor health (23.9% vs. 14.6%). The differences were statistically significant.
For white women, the association between obesity and depression held across all income levels. For black women, this association was not found at any income level. For black men, the link between obesity and depression was limited to those with a household income of $100,000 or more (odds ratio, 4.65; 95% confidence interval, 1.48-14.59). And for white men, the association was limited to those with a household income of $35,000-$74,999 (OR, 1.44; 95% CI, 1.02-2.03).
The effect of race on obesity and depression has been well studied – it’s known, for instance, that the association between obesity and depression is strongest among white women – but the role of income as a modifier has not been well addressed, wrote Dr. Bell, an assistant professor in the department of African American studies at the University of Maryland, College Park, and her associates.
Dr. Bell and her associates wrote.
As for explanations, the authors suggested that strong, antiobesity stigma “may be present among white women at all income levels,” and may drive depression regardless of how much they make.
The prevalence of depressive symptoms at specific income levels among men suggests that something other than stigma is at work. Depression among obese, middle-income white men might be tied to “an unmeasured factor like subjective social status.” Meanwhile, obese black men with high household incomes “have less income and wealth than their white counterparts” because “of various forms of structural racism. ... This may be manifested with higher rates of depression through obesity-related factors like unhealthy coping behaviors and stress,” the investigators said.
Dr. Bell and her associates cited a few limitations. One is that the study looked only at those factors among black and white people. “Results could differ with other ethnic groups,” they wrote. In addition, income was self-reported, and three-way interactions – which are tough to interpret – were used. Nevertheless, they said, the study results have key public health implications.
The study had no financial disclosures, and the investigators reported having no conflicts of interest.
SOURCE: Bell CN et al. Prev Med. 2018 Dec 3. doi: 10.1016/j.ypmed.2018.11.024.
Association holds for white women across income levels, black men with incomes of $100,000 or higher.
Association holds for white women across income levels, black men with incomes of $100,000 or higher.
Among white women, obesity is positively associated with depressive symptoms across all income levels. However, among black women, no such associations are found – regardless of income. Meanwhile, among men, the link between obesity and depression appears strong for black men with high household incomes, a cross-sectional analysis of 12,220 adults suggests.
“This work underscores the importance of disentangling the association of race and [socioeconomic status] to gain a better understanding of how each operates to impact health outcomes,” wrote Caryn N. Bell, PhD, and her associates. The report is in Preventive Medicine.
The study comprised 3,755 black subjects, 55.5% of whom were women, and 8,465 white subjects, 51.8% of whom were women. They completed a detailed questionnaire as part of the 2007-2014 National Health and Nutrition Examination Survey and had a physical exam. Depressive symptoms were measured by the Patient Health Questionnaire-9 (PHQ-9), and obesity was defined as a body mass index of 30 kg/m2 or higher. About 1% of both black and white subjects had severe depressive symptoms, meaning a PHQ-9 score ranging from 20 to 27 points.
A greater percentage of black participants were obese (47.3% vs. 34.4%), and black participants were less likely to live in a household earning $100,000 per year or more (10.9% vs. 28.3%). Black participants were a bit younger (mean age 44.8 years vs. 49.2 years), and less likely to be currently married, college graduates, insured, and physically active. A higher percentage reported fair to poor health (23.9% vs. 14.6%). The differences were statistically significant.
For white women, the association between obesity and depression held across all income levels. For black women, this association was not found at any income level. For black men, the link between obesity and depression was limited to those with a household income of $100,000 or more (odds ratio, 4.65; 95% confidence interval, 1.48-14.59). And for white men, the association was limited to those with a household income of $35,000-$74,999 (OR, 1.44; 95% CI, 1.02-2.03).
The effect of race on obesity and depression has been well studied – it’s known, for instance, that the association between obesity and depression is strongest among white women – but the role of income as a modifier has not been well addressed, wrote Dr. Bell, an assistant professor in the department of African American studies at the University of Maryland, College Park, and her associates.
Dr. Bell and her associates wrote.
As for explanations, the authors suggested that strong, antiobesity stigma “may be present among white women at all income levels,” and may drive depression regardless of how much they make.
The prevalence of depressive symptoms at specific income levels among men suggests that something other than stigma is at work. Depression among obese, middle-income white men might be tied to “an unmeasured factor like subjective social status.” Meanwhile, obese black men with high household incomes “have less income and wealth than their white counterparts” because “of various forms of structural racism. ... This may be manifested with higher rates of depression through obesity-related factors like unhealthy coping behaviors and stress,” the investigators said.
Dr. Bell and her associates cited a few limitations. One is that the study looked only at those factors among black and white people. “Results could differ with other ethnic groups,” they wrote. In addition, income was self-reported, and three-way interactions – which are tough to interpret – were used. Nevertheless, they said, the study results have key public health implications.
The study had no financial disclosures, and the investigators reported having no conflicts of interest.
SOURCE: Bell CN et al. Prev Med. 2018 Dec 3. doi: 10.1016/j.ypmed.2018.11.024.
Among white women, obesity is positively associated with depressive symptoms across all income levels. However, among black women, no such associations are found – regardless of income. Meanwhile, among men, the link between obesity and depression appears strong for black men with high household incomes, a cross-sectional analysis of 12,220 adults suggests.
“This work underscores the importance of disentangling the association of race and [socioeconomic status] to gain a better understanding of how each operates to impact health outcomes,” wrote Caryn N. Bell, PhD, and her associates. The report is in Preventive Medicine.
The study comprised 3,755 black subjects, 55.5% of whom were women, and 8,465 white subjects, 51.8% of whom were women. They completed a detailed questionnaire as part of the 2007-2014 National Health and Nutrition Examination Survey and had a physical exam. Depressive symptoms were measured by the Patient Health Questionnaire-9 (PHQ-9), and obesity was defined as a body mass index of 30 kg/m2 or higher. About 1% of both black and white subjects had severe depressive symptoms, meaning a PHQ-9 score ranging from 20 to 27 points.
A greater percentage of black participants were obese (47.3% vs. 34.4%), and black participants were less likely to live in a household earning $100,000 per year or more (10.9% vs. 28.3%). Black participants were a bit younger (mean age 44.8 years vs. 49.2 years), and less likely to be currently married, college graduates, insured, and physically active. A higher percentage reported fair to poor health (23.9% vs. 14.6%). The differences were statistically significant.
For white women, the association between obesity and depression held across all income levels. For black women, this association was not found at any income level. For black men, the link between obesity and depression was limited to those with a household income of $100,000 or more (odds ratio, 4.65; 95% confidence interval, 1.48-14.59). And for white men, the association was limited to those with a household income of $35,000-$74,999 (OR, 1.44; 95% CI, 1.02-2.03).
The effect of race on obesity and depression has been well studied – it’s known, for instance, that the association between obesity and depression is strongest among white women – but the role of income as a modifier has not been well addressed, wrote Dr. Bell, an assistant professor in the department of African American studies at the University of Maryland, College Park, and her associates.
Dr. Bell and her associates wrote.
As for explanations, the authors suggested that strong, antiobesity stigma “may be present among white women at all income levels,” and may drive depression regardless of how much they make.
The prevalence of depressive symptoms at specific income levels among men suggests that something other than stigma is at work. Depression among obese, middle-income white men might be tied to “an unmeasured factor like subjective social status.” Meanwhile, obese black men with high household incomes “have less income and wealth than their white counterparts” because “of various forms of structural racism. ... This may be manifested with higher rates of depression through obesity-related factors like unhealthy coping behaviors and stress,” the investigators said.
Dr. Bell and her associates cited a few limitations. One is that the study looked only at those factors among black and white people. “Results could differ with other ethnic groups,” they wrote. In addition, income was self-reported, and three-way interactions – which are tough to interpret – were used. Nevertheless, they said, the study results have key public health implications.
The study had no financial disclosures, and the investigators reported having no conflicts of interest.
SOURCE: Bell CN et al. Prev Med. 2018 Dec 3. doi: 10.1016/j.ypmed.2018.11.024.
FROM PREVENTIVE MEDICINE
Osteomyelitis amputation risk linked to comorbidity burden
BOSTON – The higher the comorbidity burden, the greater the likelihood that osteomyelitis will lead to amputation within 2 years, according to a review of 1,186 adult osteomyelitis patients at the University of Michigan, Ann Arbor.

The limb amputation incidence was 7.2% over 2 years in patients with no comorbidities, 21.4% among patients with heart failure, 36.1% in patients with diabetes, and 36.7% among those with peripheral vascular disease (PVD).
The 2-year incidence marched steadily upward with combined comorbidities to 47.4% in patients with diabetes and heart failure; 64.5% in patients with diabetes and PVD; and 75.0% in patients with diabetes, heart failure, and PVD.
“What this means is that looking at diabetes versus no diabetes alone is not sufficient to gauge the risk of amputation. We have to look at the patient’s comorbidity profile as a whole; greater comorbidity burden and different combinations of comorbidities [increase] amputation incidence, but there’s considerable risk [7.2%] even among otherwise healthy patients,” said lead investigator Toby Keeney-Bonthrone, a medical student at the university.
The ultimate goal of the work is to develop an osteomyelitis amputation risk calculator for physicians and patients to improve decision making, validated by nationwide data. “The question is if some patients would benefit from [an earlier,] more prophylactic amputation. Would it be better to just take off the limb and be done with it, and would that decrease overall morbidity?” he said at the annual clinical congress of the American College of Surgeons.
“We often find ourselves reacting to osteomyelitis as it progresses. I think patients deserve a better deal than that. They deserve for us to think one or two steps ahead,” Mr. Keeney-Bonthrone said.
The immediate goal of the study was to fill the data gap on long-term osteomyelitis outcomes, something that hasn’t been addressed much in the literature. The team reviewed adult patients from 2004 to 2015 who were followed for at least 2 years after diagnosis; 610 had diabetes, a known risk factor for osteomyelitis and amputation, and 576 did not.
Comorbidities were considerably more common in the diabetes group, including PVD and heart failure, but also chronic obstructive pulmonary disease, previous heart attack, prior amputation, and especially renal disease. The 2-year amputation incidence was also higher in the diabetes group (43.1% vs. 12.3%), as was 2-year mortality (22.3% vs. 15.5%).
Odds ratios for lower limb amputation climbed in a stepwise fashion on multivariate analysis, from almost a 100% increase in men and in black patients to a 158% increase among patients with past amputations; a 206% increase with PVD; a 256% increase in patients with type 2 diabetes, and a 349% increase among patients with type 1 diabetes. The investigators were puzzled that the amputation risk was higher among type 1 patients than in those with type 2, because comorbidity burdens are generally higher in type 2 diabetes.
No data was provided on treatment differences between the groups, including antibiotic use.
The work was funded by the National Institutes of Health. The investigators reported no relevant disclosures.
SOURCE: Keeney-Bonthrone T et al. J Am Coll Surg. 2018 Oct;227(4), S105.
BOSTON – The higher the comorbidity burden, the greater the likelihood that osteomyelitis will lead to amputation within 2 years, according to a review of 1,186 adult osteomyelitis patients at the University of Michigan, Ann Arbor.
The limb amputation incidence was 7.2% over 2 years in patients with no comorbidities, 21.4% among patients with heart failure, 36.1% in patients with diabetes, and 36.7% among those with peripheral vascular disease (PVD).
The 2-year incidence marched steadily upward with combined comorbidities to 47.4% in patients with diabetes and heart failure; 64.5% in patients with diabetes and PVD; and 75.0% in patients with diabetes, heart failure, and PVD.
“What this means is that looking at diabetes versus no diabetes alone is not sufficient to gauge the risk of amputation. We have to look at the patient’s comorbidity profile as a whole; greater comorbidity burden and different combinations of comorbidities [increase] amputation incidence, but there’s considerable risk [7.2%] even among otherwise healthy patients,” said lead investigator Toby Keeney-Bonthrone, a medical student at the university.
The ultimate goal of the work is to develop an osteomyelitis amputation risk calculator for physicians and patients to improve decision making, validated by nationwide data. “The question is if some patients would benefit from [an earlier,] more prophylactic amputation. Would it be better to just take off the limb and be done with it, and would that decrease overall morbidity?” he said at the annual clinical congress of the American College of Surgeons.
“We often find ourselves reacting to osteomyelitis as it progresses. I think patients deserve a better deal than that. They deserve for us to think one or two steps ahead,” Mr. Keeney-Bonthrone said.
The immediate goal of the study was to fill the data gap on long-term osteomyelitis outcomes, something that hasn’t been addressed much in the literature. The team reviewed adult patients from 2004 to 2015 who were followed for at least 2 years after diagnosis; 610 had diabetes, a known risk factor for osteomyelitis and amputation, and 576 did not.
Comorbidities were considerably more common in the diabetes group, including PVD and heart failure, but also chronic obstructive pulmonary disease, previous heart attack, prior amputation, and especially renal disease. The 2-year amputation incidence was also higher in the diabetes group (43.1% vs. 12.3%), as was 2-year mortality (22.3% vs. 15.5%).
Odds ratios for lower limb amputation climbed in a stepwise fashion on multivariate analysis, from almost a 100% increase in men and in black patients to a 158% increase among patients with past amputations; a 206% increase with PVD; a 256% increase in patients with type 2 diabetes, and a 349% increase among patients with type 1 diabetes. The investigators were puzzled that the amputation risk was higher among type 1 patients than in those with type 2, because comorbidity burdens are generally higher in type 2 diabetes.
No data was provided on treatment differences between the groups, including antibiotic use.
The work was funded by the National Institutes of Health. The investigators reported no relevant disclosures.
SOURCE: Keeney-Bonthrone T et al. J Am Coll Surg. 2018 Oct;227(4), S105.
BOSTON – The higher the comorbidity burden, the greater the likelihood that osteomyelitis will lead to amputation within 2 years, according to a review of 1,186 adult osteomyelitis patients at the University of Michigan, Ann Arbor.
The limb amputation incidence was 7.2% over 2 years in patients with no comorbidities, 21.4% among patients with heart failure, 36.1% in patients with diabetes, and 36.7% among those with peripheral vascular disease (PVD).
The 2-year incidence marched steadily upward with combined comorbidities to 47.4% in patients with diabetes and heart failure; 64.5% in patients with diabetes and PVD; and 75.0% in patients with diabetes, heart failure, and PVD.
“What this means is that looking at diabetes versus no diabetes alone is not sufficient to gauge the risk of amputation. We have to look at the patient’s comorbidity profile as a whole; greater comorbidity burden and different combinations of comorbidities [increase] amputation incidence, but there’s considerable risk [7.2%] even among otherwise healthy patients,” said lead investigator Toby Keeney-Bonthrone, a medical student at the university.
The ultimate goal of the work is to develop an osteomyelitis amputation risk calculator for physicians and patients to improve decision making, validated by nationwide data. “The question is if some patients would benefit from [an earlier,] more prophylactic amputation. Would it be better to just take off the limb and be done with it, and would that decrease overall morbidity?” he said at the annual clinical congress of the American College of Surgeons.
“We often find ourselves reacting to osteomyelitis as it progresses. I think patients deserve a better deal than that. They deserve for us to think one or two steps ahead,” Mr. Keeney-Bonthrone said.
The immediate goal of the study was to fill the data gap on long-term osteomyelitis outcomes, something that hasn’t been addressed much in the literature. The team reviewed adult patients from 2004 to 2015 who were followed for at least 2 years after diagnosis; 610 had diabetes, a known risk factor for osteomyelitis and amputation, and 576 did not.
Comorbidities were considerably more common in the diabetes group, including PVD and heart failure, but also chronic obstructive pulmonary disease, previous heart attack, prior amputation, and especially renal disease. The 2-year amputation incidence was also higher in the diabetes group (43.1% vs. 12.3%), as was 2-year mortality (22.3% vs. 15.5%).
Odds ratios for lower limb amputation climbed in a stepwise fashion on multivariate analysis, from almost a 100% increase in men and in black patients to a 158% increase among patients with past amputations; a 206% increase with PVD; a 256% increase in patients with type 2 diabetes, and a 349% increase among patients with type 1 diabetes. The investigators were puzzled that the amputation risk was higher among type 1 patients than in those with type 2, because comorbidity burdens are generally higher in type 2 diabetes.
No data was provided on treatment differences between the groups, including antibiotic use.
The work was funded by the National Institutes of Health. The investigators reported no relevant disclosures.
SOURCE: Keeney-Bonthrone T et al. J Am Coll Surg. 2018 Oct;227(4), S105.
REPORTING FROM THE 2018 ACS CLINICAL CONGRESS
Key clinical point:
Major finding: The 2-year incidence marched steadily upward with combined comorbidities to 47.5% in patients with diabetes and heart failure; 64.5% in patients with diabetes and peripheral vascular disease, and 75% in patients with diabetes, heart failure, and peripheral vascular disease.
Study details: A review of 1,186 adult osteomyelitis patients
Disclosures: The work was funded by the National Institutes of Health. The investigators reported no relevant disclosures.
Source: Keeney-Bonthrone T et al. J Am Coll Surg. 2018 Oct;227(4), S105.
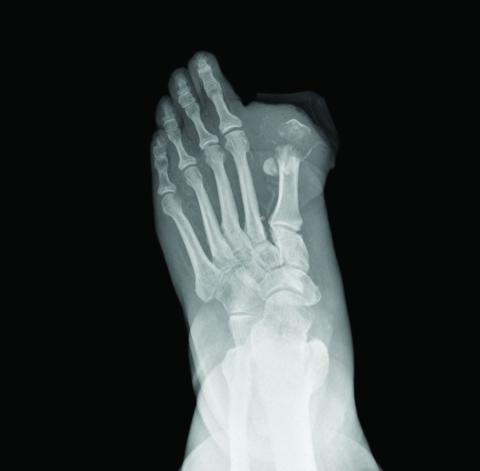
For pelvic pain, think outside the lower body
LAS VEGAS – An estimated 15%-25% of women aged 18-50 years suffer from chronic pelvic pain, a condition that commonly leads to sick days, reduced activity, and higher medication use. Treatments like surgery and opioids may seem feasible, but an obstetrician-gynecologist who studies pain urged colleagues to think twice.

In some cases, pelvic pain patients may suffer from centralized pain syndromes, conditions linked to the central nervous system that may not respond well to those common treatments, said Sawsan As-Sanie, MD, MPH, director of the University of Michigan Endometriosis Center, Ann Arbor.
“If we have laser vision on the pelvis, we may help some patients, but many of us will do harm,” said Dr. As-Sanie, who spoke at the Pelvic Anatomy and Gynecologic Surgery Symposium.
Endometriosis is frequently linked to pelvic pain. But, she said, the link between the two is fuzzier than has been assumed.
“It would make sense that endometriosis or pelvic adhesions would activate nociceptive pain, and [there are] a lot of data to support that this is, in part, how endometriosis causes pain,” she said. “But I would argue it really isn’t that simple because the relationship between endometriosis and pelvic pain is very complex and not explained entirely by the lesion.” For example, “we know that pain recurs after medical and surgical therapy, often without evidence of recurrent endometriosis.” And, there’s little relationship between pain symptoms and the location or extent of endometriosis.
What’s going on? Dr. As-Sanie suggested central pain syndromes can play a significant role in pelvic pain. These syndromes are 1.5-2 times more common in women than men, and are triggered or exacerbated by stressors.
She also emphasized the wide-ranging effects of these syndromes. “We focus on pain, but it’s clearly not a just a pain disorder,” noting that patients can report fatigue, poor sleep, greater sensitivity to light and sound, and memory difficulties that produce “fibromyalgia fog.”
Research suggests that patients with central pain syndromes experience changes in both brain structure and function, she said. As for pelvic pain specifically, studies have linked it to increased pain sensitivity and altered central nervous system structure and function regardless of whether endometriosis is present.
How should patients with pelvic pain be treated in light of this information? Dr. As-Sanie suggests first trying “gold standard” approaches to treat contributing factors whether they’re gynecologic, urologic, gastrointestinal, musculoskeletal or nerve related.
If those strategies don’t work, she said, “consider treating centralized pain” with a blend of approaches: behavioral (such as diet and cognitive-behavior therapy), medical (such as hormone modulation), and interventional (such as physical therapy and surgery).
Also consider pharmacologic therapies, said Dr. As-Sanie, who identified dual reuptake inhibitors (venlafaxine [Effexor] and duloxetine [Cymbalta] are a class of antidepressants that block the reuptake of both serotonin and norepinephrine) and anticonvulsants as drugs with strong evidence as treatments for central pain syndromes.
“Start at low doses and titrate up,” she advised, and “if at any point a given medication doesn’t work, we should try another.”
The Pelvic Anatomy and Gynecologic Surgery Symposium was jointly provided by Global Academy for Medical Education and the University of Cincinnati. Global Academy and this news organization are owned by the same company.
Dr. As-Sanie discloses she is a consultant for AbbVie and Myovant.
LAS VEGAS – An estimated 15%-25% of women aged 18-50 years suffer from chronic pelvic pain, a condition that commonly leads to sick days, reduced activity, and higher medication use. Treatments like surgery and opioids may seem feasible, but an obstetrician-gynecologist who studies pain urged colleagues to think twice.
In some cases, pelvic pain patients may suffer from centralized pain syndromes, conditions linked to the central nervous system that may not respond well to those common treatments, said Sawsan As-Sanie, MD, MPH, director of the University of Michigan Endometriosis Center, Ann Arbor.
“If we have laser vision on the pelvis, we may help some patients, but many of us will do harm,” said Dr. As-Sanie, who spoke at the Pelvic Anatomy and Gynecologic Surgery Symposium.
Endometriosis is frequently linked to pelvic pain. But, she said, the link between the two is fuzzier than has been assumed.
“It would make sense that endometriosis or pelvic adhesions would activate nociceptive pain, and [there are] a lot of data to support that this is, in part, how endometriosis causes pain,” she said. “But I would argue it really isn’t that simple because the relationship between endometriosis and pelvic pain is very complex and not explained entirely by the lesion.” For example, “we know that pain recurs after medical and surgical therapy, often without evidence of recurrent endometriosis.” And, there’s little relationship between pain symptoms and the location or extent of endometriosis.
What’s going on? Dr. As-Sanie suggested central pain syndromes can play a significant role in pelvic pain. These syndromes are 1.5-2 times more common in women than men, and are triggered or exacerbated by stressors.
She also emphasized the wide-ranging effects of these syndromes. “We focus on pain, but it’s clearly not a just a pain disorder,” noting that patients can report fatigue, poor sleep, greater sensitivity to light and sound, and memory difficulties that produce “fibromyalgia fog.”
Research suggests that patients with central pain syndromes experience changes in both brain structure and function, she said. As for pelvic pain specifically, studies have linked it to increased pain sensitivity and altered central nervous system structure and function regardless of whether endometriosis is present.
How should patients with pelvic pain be treated in light of this information? Dr. As-Sanie suggests first trying “gold standard” approaches to treat contributing factors whether they’re gynecologic, urologic, gastrointestinal, musculoskeletal or nerve related.
If those strategies don’t work, she said, “consider treating centralized pain” with a blend of approaches: behavioral (such as diet and cognitive-behavior therapy), medical (such as hormone modulation), and interventional (such as physical therapy and surgery).
Also consider pharmacologic therapies, said Dr. As-Sanie, who identified dual reuptake inhibitors (venlafaxine [Effexor] and duloxetine [Cymbalta] are a class of antidepressants that block the reuptake of both serotonin and norepinephrine) and anticonvulsants as drugs with strong evidence as treatments for central pain syndromes.
“Start at low doses and titrate up,” she advised, and “if at any point a given medication doesn’t work, we should try another.”
The Pelvic Anatomy and Gynecologic Surgery Symposium was jointly provided by Global Academy for Medical Education and the University of Cincinnati. Global Academy and this news organization are owned by the same company.
Dr. As-Sanie discloses she is a consultant for AbbVie and Myovant.
LAS VEGAS – An estimated 15%-25% of women aged 18-50 years suffer from chronic pelvic pain, a condition that commonly leads to sick days, reduced activity, and higher medication use. Treatments like surgery and opioids may seem feasible, but an obstetrician-gynecologist who studies pain urged colleagues to think twice.
In some cases, pelvic pain patients may suffer from centralized pain syndromes, conditions linked to the central nervous system that may not respond well to those common treatments, said Sawsan As-Sanie, MD, MPH, director of the University of Michigan Endometriosis Center, Ann Arbor.
“If we have laser vision on the pelvis, we may help some patients, but many of us will do harm,” said Dr. As-Sanie, who spoke at the Pelvic Anatomy and Gynecologic Surgery Symposium.
Endometriosis is frequently linked to pelvic pain. But, she said, the link between the two is fuzzier than has been assumed.
“It would make sense that endometriosis or pelvic adhesions would activate nociceptive pain, and [there are] a lot of data to support that this is, in part, how endometriosis causes pain,” she said. “But I would argue it really isn’t that simple because the relationship between endometriosis and pelvic pain is very complex and not explained entirely by the lesion.” For example, “we know that pain recurs after medical and surgical therapy, often without evidence of recurrent endometriosis.” And, there’s little relationship between pain symptoms and the location or extent of endometriosis.
What’s going on? Dr. As-Sanie suggested central pain syndromes can play a significant role in pelvic pain. These syndromes are 1.5-2 times more common in women than men, and are triggered or exacerbated by stressors.
She also emphasized the wide-ranging effects of these syndromes. “We focus on pain, but it’s clearly not a just a pain disorder,” noting that patients can report fatigue, poor sleep, greater sensitivity to light and sound, and memory difficulties that produce “fibromyalgia fog.”
Research suggests that patients with central pain syndromes experience changes in both brain structure and function, she said. As for pelvic pain specifically, studies have linked it to increased pain sensitivity and altered central nervous system structure and function regardless of whether endometriosis is present.
How should patients with pelvic pain be treated in light of this information? Dr. As-Sanie suggests first trying “gold standard” approaches to treat contributing factors whether they’re gynecologic, urologic, gastrointestinal, musculoskeletal or nerve related.
If those strategies don’t work, she said, “consider treating centralized pain” with a blend of approaches: behavioral (such as diet and cognitive-behavior therapy), medical (such as hormone modulation), and interventional (such as physical therapy and surgery).
Also consider pharmacologic therapies, said Dr. As-Sanie, who identified dual reuptake inhibitors (venlafaxine [Effexor] and duloxetine [Cymbalta] are a class of antidepressants that block the reuptake of both serotonin and norepinephrine) and anticonvulsants as drugs with strong evidence as treatments for central pain syndromes.
“Start at low doses and titrate up,” she advised, and “if at any point a given medication doesn’t work, we should try another.”
The Pelvic Anatomy and Gynecologic Surgery Symposium was jointly provided by Global Academy for Medical Education and the University of Cincinnati. Global Academy and this news organization are owned by the same company.
Dr. As-Sanie discloses she is a consultant for AbbVie and Myovant.
EXPERT ANALYSIS FROM PAGS

Effectiveness of SIESTA on Objective and Subjective Metrics of Nighttime Hospital Sleep Disruptors
Although sleep is critical to patient recovery in the hospital, hospitalization is not restful,1,2 and inpatient sleep deprivation has been linked to poor health outcomes.1-4 The American Academy of Nursing’s Choosing Wisely® campaign recommends nurses reduce unnecessary nocturnal care.5 However, interventions to improve inpatient sleep are not widely implemented.6 Targeting routine disruptions, such as overnight vital signs, by changing default settings in the electronic health record (EHR)with “nudges” could be a cost-effective strategy to improve inpatient sleep.4,7
We created Sleep for Inpatients: Empowering Staff to Act (SIESTA), which pairs nudges in the EHR with interprofessional education and empowerment,8 and tested its effectiveness on objectively and subjectively measured nocturnal sleep disruptors.
METHODS
Study Design
Two 18-room University of Chicago Medicine general-medicine units were used in this prospective study. The SIESTA-enhanced unit underwent the full sleep intervention: nursing education and empowerment, physician education, and EHR changes. The standard unit did not receive nursing interventions but received all other forms of intervention. Because physicians simultaneously cared for patients on both units, all internal medicine residents and hospitalists received the same education. The study population included physicians, nurses, and awake English-speaking patients who were cognitively intact and admitted to these two units. The University of Chicago Institutional Review Board approved this study (12-1766; 16685B).
Development of SIESTA
To develop SIESTA, patients were surveyed, and focus groups of staff were conducted; overnight vitals, medications, and phlebotomy were identified as major barriers to patient sleep.9 We found that physicians did not know how to change the default vital signs order “every 4 hours” or how to batch-order morning phlebotomy at a time other than 4:00
Behavioral Nudges
The SIESTA team worked with clinical informaticists to change the default orders in EpicTM (Epic Systems Corporation, 2017, Verona, Wisconsin) in September 2015 so that physicians would be asked, “Continue vital signs throughout the night?”10 Previously, this question was marked “Yes” by default and hidden. While the default protocol for heparin q8h was maintained, heparin q12h (9:00
SIESTA Physician Education
We created a 20-minute presentation on the consequences and causes of in-hospital sleep deprivation and evidence-based behavioral modification. We distributed pocket cards describing the mnemonic SIESTA (Screen patients for sleep disorders, Instruct patients on sleep hygiene, Eliminate disruptions, Shut doors, Treat pain, and Alarm and noise control). Physicians were instructed to consider forgoing overnight vitals, using clinical judgment to identify stable patients, use a sleep-promoting VTE prophylaxis option, and order daily labs at 10:00
SIESTA-Enhanced Unit
In the SIESTA-enhanced unit, nurses received education using pocket cards and were coached to collaborate with physicians to implement sleep-friendly orders. Customized signage depicting empowered nurses advocating for patients was posted near the huddle board. Because these nurses suggested adding SIESTA to the nurses’ ongoing daily huddles at 4:00
Data Collection
Objectively Measured Sleep Disruptors
Adoption of SIESTA orders from March 2015 to March 2016 was assessed with a monthly EpicTM Clarity report. From August 1, 2015 to April 1, 2016, nocturnal room entries were recorded using the GOJO SMARTLINKTM Hand Hygiene system (GOJO Industries Inc., 2017, Akron, Ohio). This system includes two components: the hand-sanitizer dispensers, which track dispenses (numerator), and door-mounted Activity Counters, which use heat sensors that react to body heat emitted by a person passing through the doorway (denominator for hand-hygiene compliance). For our analysis, we only used Activity Counter data, which count room entries and exits, regardless of whether sanitizer was dispensed.
Patient-Reported Nighttime Sleep Disruptions
From June 2015 to March 2016, research assistants administered a 10-item Potential Hospital Sleep Disruptions and Noises Questionnaire (PHSDNQ) to patients in both units. Responses to this questionnaire correlate with actigraphy-based sleep measurements.9,12,13 Surveys were administered every other weekday to patients available to participate (eg, willing to participate, on the unit, awake). Survey data were stored on the REDCap Database (Version 6.14.0; Vanderbilt University, 2016, Nashville, Tennessee). Pre- and post-intervention Hospital Consumer Assessment of Healthcare Providers and Systems (HCAHPS) “top-box ratings” for percent quiet at night and percent pain well controlled were also compared.
Data Analysis
Objectively Measured Potential Sleep Disruptors
The proportion of sleep-friendly orders was analyzed using a two-sample test for proportions pre-post for the SIESTA-enhanced and standard units. The difference in use of SIESTA orders between units was analyzed via multivariable logistic regression, testing for independent associations between post-period, SIESTA-enhanced unit, and an interaction term (post-period × SIESTA unit) on use of sleep-friendly orders.
Room entries per night (11:00
Patient-Reported Nighttime Sleep Disruptions
Per prior studies, we defined a score 2 or higher as “sleep disruption.”9 Differences between units were evaluated via multivariable logistic regression to examine the association between the interaction of post-period × SIESTA-enhanced unit and odds of not reporting a sleep disruption. Significance was denoted as P = .05.
RESULTS
Between March 2015 and March 2016, 1,083 general-medicine patients were admitted to the SIESTA-enhanced and standard units (Table).
Nocturnal Orders
From March 2015 to March 2016, 1,669 EpicTM general medicine orders were reviewed (Figure). In the SIESTA-enhanced unit, the mean percentage of sleep-friendly orders rose for both vital signs (+31% [95% CI = 25%, 36%]; P < .001, npre = 306, npost = 306] and VTE prophylaxis (+28% [95% CI = 18%, 37%]; P < .001, npre = 158, npost = 173]. Similar changes were observed in the standard unit for sleep-friendly vital signs (+20% [95% CI = 14%, 25%]; P < .001, npre = 252, npost = 219) and VTE prophylaxis (+16% [95% CI = 6%, 25%]; P = .002, npre = 130, npost = 125). Differences between the two units were not statistically significant, and no significant change in timing of laboratory orders postintervention was found.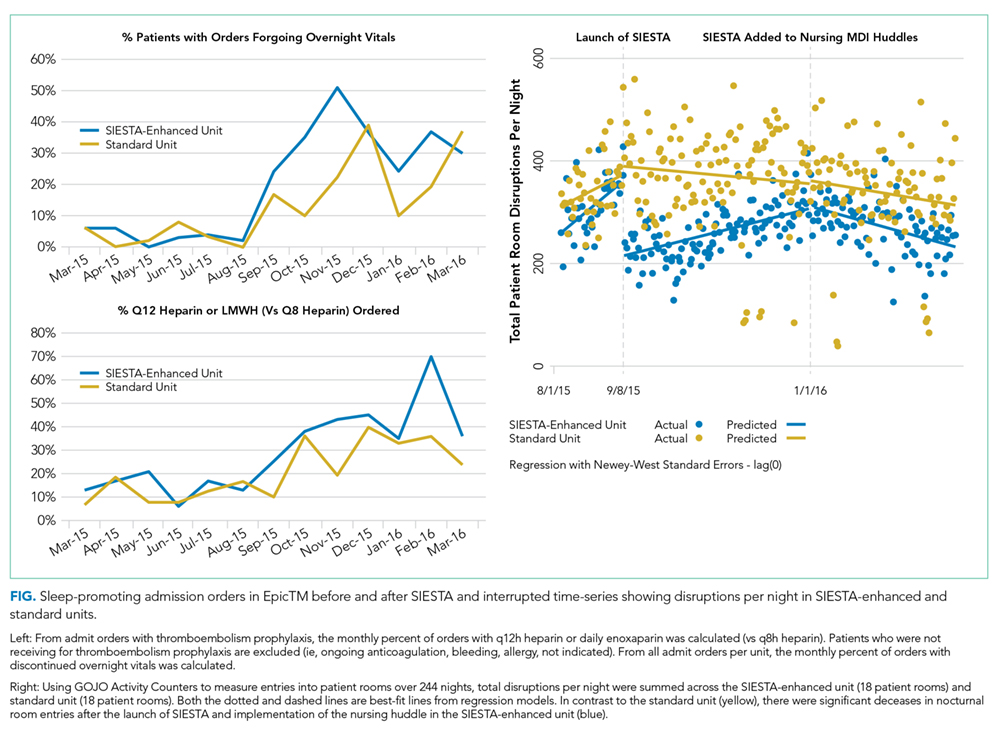
Nighttime Room Entries
Immediately after SIESTA launch, an average decrease of 114 total entries/night were noted in the SIESTA-enhanced unit, ([95% CI = −138, −91]; P < .001), corresponding to a 44% reduction (−6.3 entries/room) from the mean of 14.3 entries per patient room at baseline (Figure). No statistically significant change was seen in the standard unit. After SIESTA was incorporated into nursing huddles, total disruptions/night decreased by 1.31 disruptions/night ([95% CI = −1.64, −0.98]; P < .001) in the SIESTA-enhanced unit; by comparison, no significant changes were observed in the standard unit.
Patient-Reported Nighttime Sleep Disruptions
Between June 2015 and March 2016, 201 patient surveys were collected. A significant interaction was observed between the SIESTA-enhanced unit and post-period, and patients in the SIESTA-enhanced unit were more likely to report not being disrupted by medications (OR 4.08 [95% CI = 1.13–14.07]; P = .031) and vital signs (OR 3.35 [95% CI = 1.00–11.2]; P = .05) than those in the standard unit. HCAHPS top-box scores for the SIESTA unit increased by 7% for the “Quiet at night” category and 9% for the “Pain well controlled” category; by comparison, no major changes (>5%) were observed in the standard unit.
DISCUSSION
The present SIESTA intervention demonstrated that physician education coupled with EHR default changes are associated with a significant reduction in orders for overnight vital signs and medication administration in both units. However, addition of nursing education and empowerment in the SIESTA-enhanced unit was associated with fewer nocturnal room entries and improvements in patient-reported outcomes compared with those in the standard unit.
This study presents several implications for hospital initiatives aiming to improve patient sleep.14 Our study is consistent with other research highlighting the hypothesis that altering the default settings of EHR systems can influence physician behavior in a sustainable manner.15 However, our study also finds that, even when sleep-friendly orders are present, creating a sleep-friendly environment likely depends on the unit-based nurses championing the cause. While the initial decrease in nocturnal room entries post-SIESTA eventually faded, sustainable changes were observed only after SIESTA was added to nursing huddles, which illustrates the importance of using multiple methods to nudge staff.
Our study includes a number of limitations. It is not a randomized controlled trial, we cannot assume causality, and contamination was assumed, as residents and hospitalists worked in both units. Our single-site study may not be generalizable. Low HCAHPS response rates (10%-20%) also prevent demonstration of statistically significant differences. Finally, our convenience sampling strategy means not all inpatients were surveyed, and objective sleep duration was not measured.
In summary, at the University of Chicago, SIESTA could be associated with adoption of sleep-friendly vitals and medication orders, a decrease in nighttime room entries, and improved patient experience.
Disclosures
The authors have nothing to disclose.
Funding
This study was funded by the National Institute on Aging (NIA Grant No. T35AG029795) and the National Heart, Lung, and Blood Institute (NHLBI Grant Nos. R25HL116372 and K24HL136859).
1. Delaney LJ, Van Haren F, Lopez V. Sleeping on a problem: the impact of sleep disturbance on intensive care patients - a clinical review [published online ahead of print February 26, 2016]. Ann Intensive Care. 2015;5(3). doi: 10.1186/s13613-015-0043-2. PubMed
2. Arora VM, Chang KL, Fazal AZ, et al. Objective sleep duration and quality in hospitalized older adults: associations with blood pressure and mood. J Am Geriatr Soc. 2011;59(11):2185-2186. doi: 10.1111/j.1532-5415.2011.03644.x. PubMed
3. Knutson KL, Spiegel K, Penev P, Van Cauter E. The metabolic consequences of sleep deprivation. Sleep Med Rev. 2007;11(3):163-178. doi: 10.1016/j.smrv.2007.01.002. PubMed
4. Manian FA, Manian CJ. Sleep quality in adult hospitalized patients with infection: an observational study. Am J Med Sci. 2015;349(1):56-60. doi: 10.1097/MAJ.0000000000000355. PubMed
5. American Academy of Nursing announced engagement in National Choosing Wisely Campaign. Nurs Outlook. 2015;63(1):96-98. doi: 10.1016/j.outlook.2014.12.017. PubMed
6. Gathecha E, Rios R, Buenaver LF, Landis R, Howell E, Wright S. Pilot study aiming to support sleep quality and duration during hospitalizations. J Hosp Med. 2016;11(7):467-472. doi: 10.1002/jhm.2578. PubMed
7. Fillary J, Chaplin H, Jones G, Thompson A, Holme A, Wilson P. Noise at night in hospital general wards: a mapping of the literature. Br J Nurs. 2015;24(10):536-540. doi: 10.12968/bjon.2015.24.10.536. PubMed
8. Thaler R, Sunstein C. Nudge: Improving Decisions About Health, Wealth and Happiness. Yale University Press; 2008.
9. Grossman MN, Anderson SL, Worku A, et al. Awakenings? Patient and hospital staff perceptions of nighttime disruptions and their effect on patient sleep. J Clin Sleep Med. 2017;13(2):301-306. doi: 10.5664/jcsm.6468. PubMed
10. Yoder JC, Yuen TC, Churpek MM, Arora VM, Edelson DP. A prospective study of nighttime vital sign monitoring frequency and risk of clinical deterioration. JAMA Intern Med. 2013;173(16):1554-1555. doi: 10.1001/jamainternmed.2013.7791. PubMed
11. Phung OJ, Kahn SR, Cook DJ, Murad MH. Dosing frequency of unfractionated heparin thromboprophylaxis: a meta-analysis. Chest. 2011;140(2):374-381. doi: 10.1378/chest.10-3084. PubMed
12. Gabor JY, Cooper AB, Hanly PJ. Sleep disruption in the intensive care unit. Curr Opin Crit Care. 2001;7(1):21-27. PubMed
13. Topf M. Personal and environmental predictors of patient disturbance due to hospital noise. J Appl Psychol. 1985;70(1):22-28. doi: 10.1037/0021-9010.70.1.22. PubMed
14. Cho HJ, Wray CM, Maione S, et al. Right care in hospital medicine: co-creation of ten opportunities in overuse and underuse for improving value in hospital medicine. J Gen Intern Med. 2018;33(6):804-806. doi: 10.1007/s11606-018-4371-4. PubMed
15. Halpern SD, Ubel PA, Asch DA. Harnessing the power of default options to improve health care. N Engl J Med. 2007;357(13):1340-1344. doi: 10.1056/NEJMsb071595. PubMed
Although sleep is critical to patient recovery in the hospital, hospitalization is not restful,1,2 and inpatient sleep deprivation has been linked to poor health outcomes.1-4 The American Academy of Nursing’s Choosing Wisely® campaign recommends nurses reduce unnecessary nocturnal care.5 However, interventions to improve inpatient sleep are not widely implemented.6 Targeting routine disruptions, such as overnight vital signs, by changing default settings in the electronic health record (EHR)with “nudges” could be a cost-effective strategy to improve inpatient sleep.4,7
We created Sleep for Inpatients: Empowering Staff to Act (SIESTA), which pairs nudges in the EHR with interprofessional education and empowerment,8 and tested its effectiveness on objectively and subjectively measured nocturnal sleep disruptors.
METHODS
Study Design
Two 18-room University of Chicago Medicine general-medicine units were used in this prospective study. The SIESTA-enhanced unit underwent the full sleep intervention: nursing education and empowerment, physician education, and EHR changes. The standard unit did not receive nursing interventions but received all other forms of intervention. Because physicians simultaneously cared for patients on both units, all internal medicine residents and hospitalists received the same education. The study population included physicians, nurses, and awake English-speaking patients who were cognitively intact and admitted to these two units. The University of Chicago Institutional Review Board approved this study (12-1766; 16685B).
Development of SIESTA
To develop SIESTA, patients were surveyed, and focus groups of staff were conducted; overnight vitals, medications, and phlebotomy were identified as major barriers to patient sleep.9 We found that physicians did not know how to change the default vital signs order “every 4 hours” or how to batch-order morning phlebotomy at a time other than 4:00
Behavioral Nudges
The SIESTA team worked with clinical informaticists to change the default orders in EpicTM (Epic Systems Corporation, 2017, Verona, Wisconsin) in September 2015 so that physicians would be asked, “Continue vital signs throughout the night?”10 Previously, this question was marked “Yes” by default and hidden. While the default protocol for heparin q8h was maintained, heparin q12h (9:00
SIESTA Physician Education
We created a 20-minute presentation on the consequences and causes of in-hospital sleep deprivation and evidence-based behavioral modification. We distributed pocket cards describing the mnemonic SIESTA (Screen patients for sleep disorders, Instruct patients on sleep hygiene, Eliminate disruptions, Shut doors, Treat pain, and Alarm and noise control). Physicians were instructed to consider forgoing overnight vitals, using clinical judgment to identify stable patients, use a sleep-promoting VTE prophylaxis option, and order daily labs at 10:00
SIESTA-Enhanced Unit
In the SIESTA-enhanced unit, nurses received education using pocket cards and were coached to collaborate with physicians to implement sleep-friendly orders. Customized signage depicting empowered nurses advocating for patients was posted near the huddle board. Because these nurses suggested adding SIESTA to the nurses’ ongoing daily huddles at 4:00
Data Collection
Objectively Measured Sleep Disruptors
Adoption of SIESTA orders from March 2015 to March 2016 was assessed with a monthly EpicTM Clarity report. From August 1, 2015 to April 1, 2016, nocturnal room entries were recorded using the GOJO SMARTLINKTM Hand Hygiene system (GOJO Industries Inc., 2017, Akron, Ohio). This system includes two components: the hand-sanitizer dispensers, which track dispenses (numerator), and door-mounted Activity Counters, which use heat sensors that react to body heat emitted by a person passing through the doorway (denominator for hand-hygiene compliance). For our analysis, we only used Activity Counter data, which count room entries and exits, regardless of whether sanitizer was dispensed.
Patient-Reported Nighttime Sleep Disruptions
From June 2015 to March 2016, research assistants administered a 10-item Potential Hospital Sleep Disruptions and Noises Questionnaire (PHSDNQ) to patients in both units. Responses to this questionnaire correlate with actigraphy-based sleep measurements.9,12,13 Surveys were administered every other weekday to patients available to participate (eg, willing to participate, on the unit, awake). Survey data were stored on the REDCap Database (Version 6.14.0; Vanderbilt University, 2016, Nashville, Tennessee). Pre- and post-intervention Hospital Consumer Assessment of Healthcare Providers and Systems (HCAHPS) “top-box ratings” for percent quiet at night and percent pain well controlled were also compared.
Data Analysis
Objectively Measured Potential Sleep Disruptors
The proportion of sleep-friendly orders was analyzed using a two-sample test for proportions pre-post for the SIESTA-enhanced and standard units. The difference in use of SIESTA orders between units was analyzed via multivariable logistic regression, testing for independent associations between post-period, SIESTA-enhanced unit, and an interaction term (post-period × SIESTA unit) on use of sleep-friendly orders.
Room entries per night (11:00
Patient-Reported Nighttime Sleep Disruptions
Per prior studies, we defined a score 2 or higher as “sleep disruption.”9 Differences between units were evaluated via multivariable logistic regression to examine the association between the interaction of post-period × SIESTA-enhanced unit and odds of not reporting a sleep disruption. Significance was denoted as P = .05.
RESULTS
Between March 2015 and March 2016, 1,083 general-medicine patients were admitted to the SIESTA-enhanced and standard units (Table).
Nocturnal Orders
From March 2015 to March 2016, 1,669 EpicTM general medicine orders were reviewed (Figure). In the SIESTA-enhanced unit, the mean percentage of sleep-friendly orders rose for both vital signs (+31% [95% CI = 25%, 36%]; P < .001, npre = 306, npost = 306] and VTE prophylaxis (+28% [95% CI = 18%, 37%]; P < .001, npre = 158, npost = 173]. Similar changes were observed in the standard unit for sleep-friendly vital signs (+20% [95% CI = 14%, 25%]; P < .001, npre = 252, npost = 219) and VTE prophylaxis (+16% [95% CI = 6%, 25%]; P = .002, npre = 130, npost = 125). Differences between the two units were not statistically significant, and no significant change in timing of laboratory orders postintervention was found.
Nighttime Room Entries
Immediately after SIESTA launch, an average decrease of 114 total entries/night were noted in the SIESTA-enhanced unit, ([95% CI = −138, −91]; P < .001), corresponding to a 44% reduction (−6.3 entries/room) from the mean of 14.3 entries per patient room at baseline (Figure). No statistically significant change was seen in the standard unit. After SIESTA was incorporated into nursing huddles, total disruptions/night decreased by 1.31 disruptions/night ([95% CI = −1.64, −0.98]; P < .001) in the SIESTA-enhanced unit; by comparison, no significant changes were observed in the standard unit.
Patient-Reported Nighttime Sleep Disruptions
Between June 2015 and March 2016, 201 patient surveys were collected. A significant interaction was observed between the SIESTA-enhanced unit and post-period, and patients in the SIESTA-enhanced unit were more likely to report not being disrupted by medications (OR 4.08 [95% CI = 1.13–14.07]; P = .031) and vital signs (OR 3.35 [95% CI = 1.00–11.2]; P = .05) than those in the standard unit. HCAHPS top-box scores for the SIESTA unit increased by 7% for the “Quiet at night” category and 9% for the “Pain well controlled” category; by comparison, no major changes (>5%) were observed in the standard unit.
DISCUSSION
The present SIESTA intervention demonstrated that physician education coupled with EHR default changes are associated with a significant reduction in orders for overnight vital signs and medication administration in both units. However, addition of nursing education and empowerment in the SIESTA-enhanced unit was associated with fewer nocturnal room entries and improvements in patient-reported outcomes compared with those in the standard unit.
This study presents several implications for hospital initiatives aiming to improve patient sleep.14 Our study is consistent with other research highlighting the hypothesis that altering the default settings of EHR systems can influence physician behavior in a sustainable manner.15 However, our study also finds that, even when sleep-friendly orders are present, creating a sleep-friendly environment likely depends on the unit-based nurses championing the cause. While the initial decrease in nocturnal room entries post-SIESTA eventually faded, sustainable changes were observed only after SIESTA was added to nursing huddles, which illustrates the importance of using multiple methods to nudge staff.
Our study includes a number of limitations. It is not a randomized controlled trial, we cannot assume causality, and contamination was assumed, as residents and hospitalists worked in both units. Our single-site study may not be generalizable. Low HCAHPS response rates (10%-20%) also prevent demonstration of statistically significant differences. Finally, our convenience sampling strategy means not all inpatients were surveyed, and objective sleep duration was not measured.
In summary, at the University of Chicago, SIESTA could be associated with adoption of sleep-friendly vitals and medication orders, a decrease in nighttime room entries, and improved patient experience.
Disclosures
The authors have nothing to disclose.
Funding
This study was funded by the National Institute on Aging (NIA Grant No. T35AG029795) and the National Heart, Lung, and Blood Institute (NHLBI Grant Nos. R25HL116372 and K24HL136859).
Although sleep is critical to patient recovery in the hospital, hospitalization is not restful,1,2 and inpatient sleep deprivation has been linked to poor health outcomes.1-4 The American Academy of Nursing’s Choosing Wisely® campaign recommends nurses reduce unnecessary nocturnal care.5 However, interventions to improve inpatient sleep are not widely implemented.6 Targeting routine disruptions, such as overnight vital signs, by changing default settings in the electronic health record (EHR)with “nudges” could be a cost-effective strategy to improve inpatient sleep.4,7
We created Sleep for Inpatients: Empowering Staff to Act (SIESTA), which pairs nudges in the EHR with interprofessional education and empowerment,8 and tested its effectiveness on objectively and subjectively measured nocturnal sleep disruptors.
METHODS
Study Design
Two 18-room University of Chicago Medicine general-medicine units were used in this prospective study. The SIESTA-enhanced unit underwent the full sleep intervention: nursing education and empowerment, physician education, and EHR changes. The standard unit did not receive nursing interventions but received all other forms of intervention. Because physicians simultaneously cared for patients on both units, all internal medicine residents and hospitalists received the same education. The study population included physicians, nurses, and awake English-speaking patients who were cognitively intact and admitted to these two units. The University of Chicago Institutional Review Board approved this study (12-1766; 16685B).
Development of SIESTA
To develop SIESTA, patients were surveyed, and focus groups of staff were conducted; overnight vitals, medications, and phlebotomy were identified as major barriers to patient sleep.9 We found that physicians did not know how to change the default vital signs order “every 4 hours” or how to batch-order morning phlebotomy at a time other than 4:00
Behavioral Nudges
The SIESTA team worked with clinical informaticists to change the default orders in EpicTM (Epic Systems Corporation, 2017, Verona, Wisconsin) in September 2015 so that physicians would be asked, “Continue vital signs throughout the night?”10 Previously, this question was marked “Yes” by default and hidden. While the default protocol for heparin q8h was maintained, heparin q12h (9:00
SIESTA Physician Education
We created a 20-minute presentation on the consequences and causes of in-hospital sleep deprivation and evidence-based behavioral modification. We distributed pocket cards describing the mnemonic SIESTA (Screen patients for sleep disorders, Instruct patients on sleep hygiene, Eliminate disruptions, Shut doors, Treat pain, and Alarm and noise control). Physicians were instructed to consider forgoing overnight vitals, using clinical judgment to identify stable patients, use a sleep-promoting VTE prophylaxis option, and order daily labs at 10:00
SIESTA-Enhanced Unit
In the SIESTA-enhanced unit, nurses received education using pocket cards and were coached to collaborate with physicians to implement sleep-friendly orders. Customized signage depicting empowered nurses advocating for patients was posted near the huddle board. Because these nurses suggested adding SIESTA to the nurses’ ongoing daily huddles at 4:00
Data Collection
Objectively Measured Sleep Disruptors
Adoption of SIESTA orders from March 2015 to March 2016 was assessed with a monthly EpicTM Clarity report. From August 1, 2015 to April 1, 2016, nocturnal room entries were recorded using the GOJO SMARTLINKTM Hand Hygiene system (GOJO Industries Inc., 2017, Akron, Ohio). This system includes two components: the hand-sanitizer dispensers, which track dispenses (numerator), and door-mounted Activity Counters, which use heat sensors that react to body heat emitted by a person passing through the doorway (denominator for hand-hygiene compliance). For our analysis, we only used Activity Counter data, which count room entries and exits, regardless of whether sanitizer was dispensed.
Patient-Reported Nighttime Sleep Disruptions
From June 2015 to March 2016, research assistants administered a 10-item Potential Hospital Sleep Disruptions and Noises Questionnaire (PHSDNQ) to patients in both units. Responses to this questionnaire correlate with actigraphy-based sleep measurements.9,12,13 Surveys were administered every other weekday to patients available to participate (eg, willing to participate, on the unit, awake). Survey data were stored on the REDCap Database (Version 6.14.0; Vanderbilt University, 2016, Nashville, Tennessee). Pre- and post-intervention Hospital Consumer Assessment of Healthcare Providers and Systems (HCAHPS) “top-box ratings” for percent quiet at night and percent pain well controlled were also compared.
Data Analysis
Objectively Measured Potential Sleep Disruptors
The proportion of sleep-friendly orders was analyzed using a two-sample test for proportions pre-post for the SIESTA-enhanced and standard units. The difference in use of SIESTA orders between units was analyzed via multivariable logistic regression, testing for independent associations between post-period, SIESTA-enhanced unit, and an interaction term (post-period × SIESTA unit) on use of sleep-friendly orders.
Room entries per night (11:00
Patient-Reported Nighttime Sleep Disruptions
Per prior studies, we defined a score 2 or higher as “sleep disruption.”9 Differences between units were evaluated via multivariable logistic regression to examine the association between the interaction of post-period × SIESTA-enhanced unit and odds of not reporting a sleep disruption. Significance was denoted as P = .05.
RESULTS
Between March 2015 and March 2016, 1,083 general-medicine patients were admitted to the SIESTA-enhanced and standard units (Table).
Nocturnal Orders
From March 2015 to March 2016, 1,669 EpicTM general medicine orders were reviewed (Figure). In the SIESTA-enhanced unit, the mean percentage of sleep-friendly orders rose for both vital signs (+31% [95% CI = 25%, 36%]; P < .001, npre = 306, npost = 306] and VTE prophylaxis (+28% [95% CI = 18%, 37%]; P < .001, npre = 158, npost = 173]. Similar changes were observed in the standard unit for sleep-friendly vital signs (+20% [95% CI = 14%, 25%]; P < .001, npre = 252, npost = 219) and VTE prophylaxis (+16% [95% CI = 6%, 25%]; P = .002, npre = 130, npost = 125). Differences between the two units were not statistically significant, and no significant change in timing of laboratory orders postintervention was found.
Nighttime Room Entries
Immediately after SIESTA launch, an average decrease of 114 total entries/night were noted in the SIESTA-enhanced unit, ([95% CI = −138, −91]; P < .001), corresponding to a 44% reduction (−6.3 entries/room) from the mean of 14.3 entries per patient room at baseline (Figure). No statistically significant change was seen in the standard unit. After SIESTA was incorporated into nursing huddles, total disruptions/night decreased by 1.31 disruptions/night ([95% CI = −1.64, −0.98]; P < .001) in the SIESTA-enhanced unit; by comparison, no significant changes were observed in the standard unit.
Patient-Reported Nighttime Sleep Disruptions
Between June 2015 and March 2016, 201 patient surveys were collected. A significant interaction was observed between the SIESTA-enhanced unit and post-period, and patients in the SIESTA-enhanced unit were more likely to report not being disrupted by medications (OR 4.08 [95% CI = 1.13–14.07]; P = .031) and vital signs (OR 3.35 [95% CI = 1.00–11.2]; P = .05) than those in the standard unit. HCAHPS top-box scores for the SIESTA unit increased by 7% for the “Quiet at night” category and 9% for the “Pain well controlled” category; by comparison, no major changes (>5%) were observed in the standard unit.
DISCUSSION
The present SIESTA intervention demonstrated that physician education coupled with EHR default changes are associated with a significant reduction in orders for overnight vital signs and medication administration in both units. However, addition of nursing education and empowerment in the SIESTA-enhanced unit was associated with fewer nocturnal room entries and improvements in patient-reported outcomes compared with those in the standard unit.
This study presents several implications for hospital initiatives aiming to improve patient sleep.14 Our study is consistent with other research highlighting the hypothesis that altering the default settings of EHR systems can influence physician behavior in a sustainable manner.15 However, our study also finds that, even when sleep-friendly orders are present, creating a sleep-friendly environment likely depends on the unit-based nurses championing the cause. While the initial decrease in nocturnal room entries post-SIESTA eventually faded, sustainable changes were observed only after SIESTA was added to nursing huddles, which illustrates the importance of using multiple methods to nudge staff.
Our study includes a number of limitations. It is not a randomized controlled trial, we cannot assume causality, and contamination was assumed, as residents and hospitalists worked in both units. Our single-site study may not be generalizable. Low HCAHPS response rates (10%-20%) also prevent demonstration of statistically significant differences. Finally, our convenience sampling strategy means not all inpatients were surveyed, and objective sleep duration was not measured.
In summary, at the University of Chicago, SIESTA could be associated with adoption of sleep-friendly vitals and medication orders, a decrease in nighttime room entries, and improved patient experience.
Disclosures
The authors have nothing to disclose.
Funding
This study was funded by the National Institute on Aging (NIA Grant No. T35AG029795) and the National Heart, Lung, and Blood Institute (NHLBI Grant Nos. R25HL116372 and K24HL136859).
1. Delaney LJ, Van Haren F, Lopez V. Sleeping on a problem: the impact of sleep disturbance on intensive care patients - a clinical review [published online ahead of print February 26, 2016]. Ann Intensive Care. 2015;5(3). doi: 10.1186/s13613-015-0043-2. PubMed
2. Arora VM, Chang KL, Fazal AZ, et al. Objective sleep duration and quality in hospitalized older adults: associations with blood pressure and mood. J Am Geriatr Soc. 2011;59(11):2185-2186. doi: 10.1111/j.1532-5415.2011.03644.x. PubMed
3. Knutson KL, Spiegel K, Penev P, Van Cauter E. The metabolic consequences of sleep deprivation. Sleep Med Rev. 2007;11(3):163-178. doi: 10.1016/j.smrv.2007.01.002. PubMed
4. Manian FA, Manian CJ. Sleep quality in adult hospitalized patients with infection: an observational study. Am J Med Sci. 2015;349(1):56-60. doi: 10.1097/MAJ.0000000000000355. PubMed
5. American Academy of Nursing announced engagement in National Choosing Wisely Campaign. Nurs Outlook. 2015;63(1):96-98. doi: 10.1016/j.outlook.2014.12.017. PubMed
6. Gathecha E, Rios R, Buenaver LF, Landis R, Howell E, Wright S. Pilot study aiming to support sleep quality and duration during hospitalizations. J Hosp Med. 2016;11(7):467-472. doi: 10.1002/jhm.2578. PubMed
7. Fillary J, Chaplin H, Jones G, Thompson A, Holme A, Wilson P. Noise at night in hospital general wards: a mapping of the literature. Br J Nurs. 2015;24(10):536-540. doi: 10.12968/bjon.2015.24.10.536. PubMed
8. Thaler R, Sunstein C. Nudge: Improving Decisions About Health, Wealth and Happiness. Yale University Press; 2008.
9. Grossman MN, Anderson SL, Worku A, et al. Awakenings? Patient and hospital staff perceptions of nighttime disruptions and their effect on patient sleep. J Clin Sleep Med. 2017;13(2):301-306. doi: 10.5664/jcsm.6468. PubMed
10. Yoder JC, Yuen TC, Churpek MM, Arora VM, Edelson DP. A prospective study of nighttime vital sign monitoring frequency and risk of clinical deterioration. JAMA Intern Med. 2013;173(16):1554-1555. doi: 10.1001/jamainternmed.2013.7791. PubMed
11. Phung OJ, Kahn SR, Cook DJ, Murad MH. Dosing frequency of unfractionated heparin thromboprophylaxis: a meta-analysis. Chest. 2011;140(2):374-381. doi: 10.1378/chest.10-3084. PubMed
12. Gabor JY, Cooper AB, Hanly PJ. Sleep disruption in the intensive care unit. Curr Opin Crit Care. 2001;7(1):21-27. PubMed
13. Topf M. Personal and environmental predictors of patient disturbance due to hospital noise. J Appl Psychol. 1985;70(1):22-28. doi: 10.1037/0021-9010.70.1.22. PubMed
14. Cho HJ, Wray CM, Maione S, et al. Right care in hospital medicine: co-creation of ten opportunities in overuse and underuse for improving value in hospital medicine. J Gen Intern Med. 2018;33(6):804-806. doi: 10.1007/s11606-018-4371-4. PubMed
15. Halpern SD, Ubel PA, Asch DA. Harnessing the power of default options to improve health care. N Engl J Med. 2007;357(13):1340-1344. doi: 10.1056/NEJMsb071595. PubMed
1. Delaney LJ, Van Haren F, Lopez V. Sleeping on a problem: the impact of sleep disturbance on intensive care patients - a clinical review [published online ahead of print February 26, 2016]. Ann Intensive Care. 2015;5(3). doi: 10.1186/s13613-015-0043-2. PubMed
2. Arora VM, Chang KL, Fazal AZ, et al. Objective sleep duration and quality in hospitalized older adults: associations with blood pressure and mood. J Am Geriatr Soc. 2011;59(11):2185-2186. doi: 10.1111/j.1532-5415.2011.03644.x. PubMed
3. Knutson KL, Spiegel K, Penev P, Van Cauter E. The metabolic consequences of sleep deprivation. Sleep Med Rev. 2007;11(3):163-178. doi: 10.1016/j.smrv.2007.01.002. PubMed
4. Manian FA, Manian CJ. Sleep quality in adult hospitalized patients with infection: an observational study. Am J Med Sci. 2015;349(1):56-60. doi: 10.1097/MAJ.0000000000000355. PubMed
5. American Academy of Nursing announced engagement in National Choosing Wisely Campaign. Nurs Outlook. 2015;63(1):96-98. doi: 10.1016/j.outlook.2014.12.017. PubMed
6. Gathecha E, Rios R, Buenaver LF, Landis R, Howell E, Wright S. Pilot study aiming to support sleep quality and duration during hospitalizations. J Hosp Med. 2016;11(7):467-472. doi: 10.1002/jhm.2578. PubMed
7. Fillary J, Chaplin H, Jones G, Thompson A, Holme A, Wilson P. Noise at night in hospital general wards: a mapping of the literature. Br J Nurs. 2015;24(10):536-540. doi: 10.12968/bjon.2015.24.10.536. PubMed
8. Thaler R, Sunstein C. Nudge: Improving Decisions About Health, Wealth and Happiness. Yale University Press; 2008.
9. Grossman MN, Anderson SL, Worku A, et al. Awakenings? Patient and hospital staff perceptions of nighttime disruptions and their effect on patient sleep. J Clin Sleep Med. 2017;13(2):301-306. doi: 10.5664/jcsm.6468. PubMed
10. Yoder JC, Yuen TC, Churpek MM, Arora VM, Edelson DP. A prospective study of nighttime vital sign monitoring frequency and risk of clinical deterioration. JAMA Intern Med. 2013;173(16):1554-1555. doi: 10.1001/jamainternmed.2013.7791. PubMed
11. Phung OJ, Kahn SR, Cook DJ, Murad MH. Dosing frequency of unfractionated heparin thromboprophylaxis: a meta-analysis. Chest. 2011;140(2):374-381. doi: 10.1378/chest.10-3084. PubMed
12. Gabor JY, Cooper AB, Hanly PJ. Sleep disruption in the intensive care unit. Curr Opin Crit Care. 2001;7(1):21-27. PubMed
13. Topf M. Personal and environmental predictors of patient disturbance due to hospital noise. J Appl Psychol. 1985;70(1):22-28. doi: 10.1037/0021-9010.70.1.22. PubMed
14. Cho HJ, Wray CM, Maione S, et al. Right care in hospital medicine: co-creation of ten opportunities in overuse and underuse for improving value in hospital medicine. J Gen Intern Med. 2018;33(6):804-806. doi: 10.1007/s11606-018-4371-4. PubMed
15. Halpern SD, Ubel PA, Asch DA. Harnessing the power of default options to improve health care. N Engl J Med. 2007;357(13):1340-1344. doi: 10.1056/NEJMsb071595. PubMed
© 2019 Society of Hospital Medicine