User login
Naloxone Dispensing in Patients at Risk for Opioid Overdose After Total Knee Arthroplasty Within the Veterans Health Administration
Opioid overdose is a major public health challenge, with recent reports estimating 41 deaths per day in the United States from prescription opioid overdose.1,2 Prescribing naloxone has increasingly been advocated to reduce the risk of opioid overdose for patients identified as high risk. Naloxone distribution has been shown to decrease the incidence of opioid overdoses in the general population.3,4 The Centers for Disease Control and Prevention (CDC) Guideline for Prescribing Opioids for Chronic Pain recommends considering naloxone prescription for patients with a history of overdose or substance use disorder, opioid dosages ≥ 50 morphine equivalent daily dose (MEDD), and concurrent use of benzodiazepines.5
Although the CDC guidelines are intended for primary care clinicians in outpatient settings, naloxone prescribing is also relevant in the postsurgical setting.5 Many surgical patients are at risk for opioid overdose and data from the Veterans Health Administration (VHA) has shown that risk of opioid overdose is 11-fold higher in the 30 days following discharge from a surgical admission, when compared with the subsequent calendar year.6,7 This likely occurs due to new prescriptions or escalated doses of opioids following surgery. Overdose risk may be particularly relevant to orthopedic surgery as postoperative opioids are commonly prescribed.8 Patients undergoing total knee arthroplasty (TKA) may represent a vulnerable population to overdose as it is one of the most commonly performed surgeries for the treatment of chronic pain, and is frequently performed in older adults with medical comorbidities.9,10
Identifying patients at high risk for opioid overdose is important for targeted naloxone dispensing.5 A risk index for overdose or serious opioid-induced respiratory depression (RIOSORD) tool has been developed and validated in veteran and other populations to identify such patients.11 The RIOSORD tool classifies patients by risk level (1-10) and predicts probability of overdose or serious opioid-induced respiratory depression (OSORD). A patient’s level of risk is based on a weighted combination of the 15 independent risk factors most highly associated with OSORD, including comorbid conditions, prescription drug use, and health care utilization.12 Using the RIOSORD tool, the VHA Opioid Education and Naloxone Distribution (OEND) program is a risk mitigation initiative that aims to decrease opioid-related overdose morbidity and mortality. This is achieved via opioid overdose education for prevention, recognition, and response and includes outpatient naloxone prescription.13,14
Despite the comprehensive OEND program, there exists very little data to guide postsurgical naloxone prescribing. The prevalence of known risk factors for overdose in surgical patients remains unknown, as does the prevalence of perioperative naloxone distribution. Understanding overdose risk factors and naloxone prescribing patterns in surgical patients may identify potential targets for OEND efforts. This study retrospectively estimated RIOSORD scores for TKA patients between 2013 to 2016 and described naloxone distribution based on RIOSORD scores and risk factors.
Methods
We identified patients who had undergone primary TKA at VHA hospitals using Current Procedural Terminology (CPT), International Classification of Diseases, Ninth Revision (ICD-9) procedure codes, and data extracted from the VHA Corporate Data Warehouse (CDW) of electronic health records (EHRs). Our study was granted approval with exemption from informed consent by the Durham Veteran Affairs Healthcare System Institutional Review Board.
This retrospective cohort study included all veterans who underwent elective primary TKA from January 1, 2013 through December 31, 2016. We excluded patients who died before discharge.
Outcomes
Our primary outcome was being dispensed an outpatient naloxone prescription following TKA. Naloxone dispensing was identified by examining CDW outpatient pharmacy records with a final dispense date from 1 year before surgery through 7 days after discharge following TKA. To exclude naloxone administration that may have been given in a clinic, prescription data included only records with an outpatient prescription copay. Naloxone dispensing in the year before surgery was chosen to estimate likely preoperative possession of naloxone which could be available in the postoperative period. Naloxone dispensing until 7 days after discharge was chosen to identify any new dispensing that would be available in the postoperative period. These outcomes were examined over the study time frame on an annual basis.
Patient Factors
Demographic variables included age, sex, and race/ethnicity. Independent risk factors for overdose from RIOSORD were identified for each patient.15 These risk factors included comorbidities (opioid use disorder, schizophrenia, bipolar disorder, liver disease, chronic kidney disease, sleep apnea, or lung disease) and prescription drug use (use of opioids, benzodiazepines, long-acting opioids, ≥ 50 MEDD or ≥ 100 MEDD). ICD-9 and ICD-10 diagnosis codes were used to identify comorbidities. Risk classes on day of surgery were identified using a RIOSORD algorithm code. Consistent with the display of RIOSORD risk classes on the VHA Academic Detailing Service OEND risk report, patients were grouped into 3 groups based on their RIOSORD score: classes 1 to 4 (low risk), 5 to 7 (moderate risk), and 8 to 10 (high risk).
Descriptive statistics were used to summarize data on patient demographics, RIOSORD risk factors, overdose events, and naloxone dispensing over time.
Results
The study cohort included 38,011 veterans who underwent primary TKA in the VHA between January 1, 2013 and December 30, 2016. In this cohort, the mean age was 65 years, 93% were male, and 77% were White patients (Table 1). The most common comorbidities were lung disease in 9170 (24.1%) patients, sleep apnea in 6630 (17.4%) patients, chronic kidney disease in 4036 (10.6%) patients, liver disease in 2822 (7.4%) patients, and bipolar disorder in 1748 (4.6%) patients.
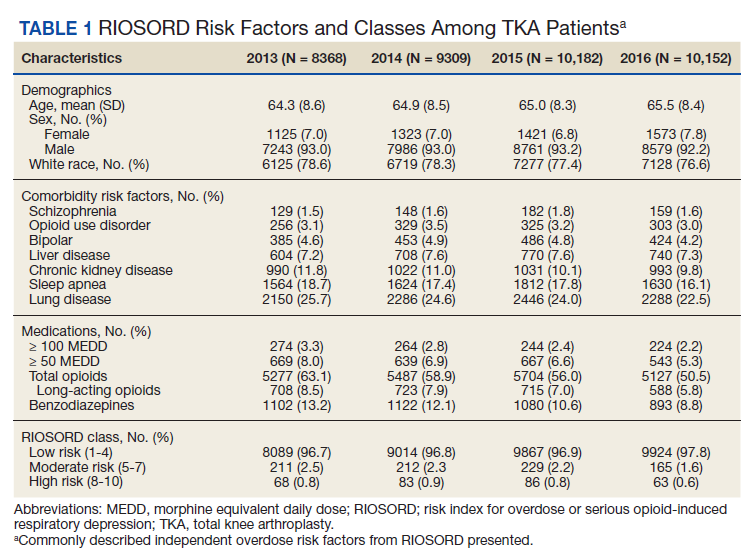
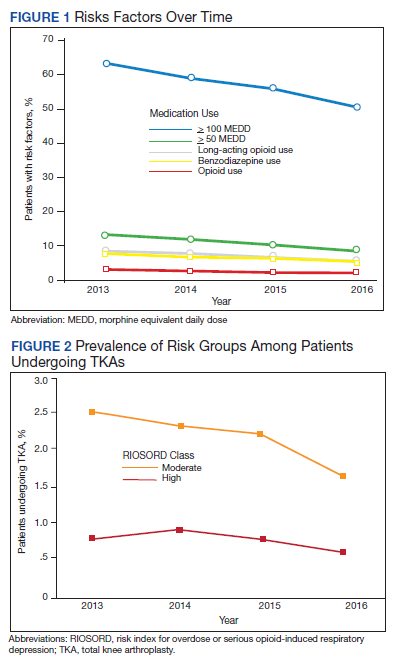
In 2013, 63.1% of patients presenting for surgery were actively prescribed opioids. By 2016, this decreased to 50.5%. Benzodiazepine use decreased from 13.2 to 8.8% and long-acting opioid use decreased from 8.5 to 5.8% over the same period. Patients taking ≥ 50 MEDD decreased from 8.0 to 5.3% and patients taking ≥ 100 MEDD decreased from 3.3 to 2.2%. The prevalence of moderate-risk patients decreased from 2.5 to 1.6% and high-risk patients decreased from 0.8 to 0.6% (Figure 1). Cumulatively, the prevalence of presenting with either moderate or high risk of overdose decreased from 3.3 to 2.2% between 2013 to 2016.
Naloxone Dispensing
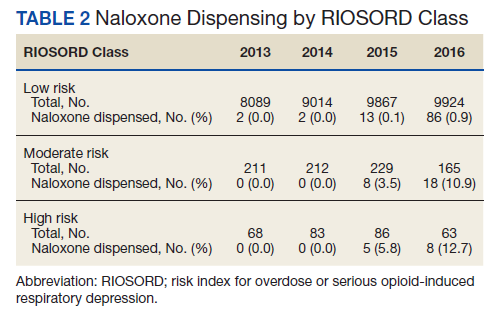
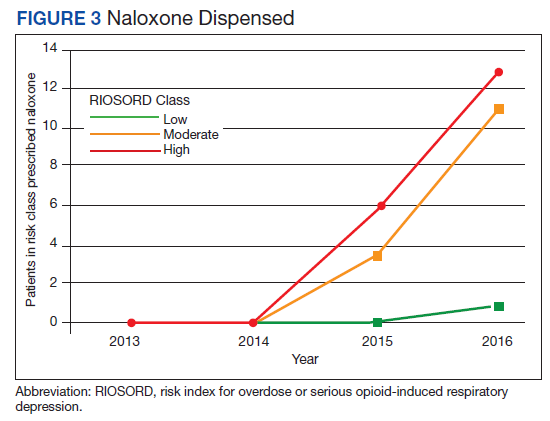
In 2013, naloxone was not dispensed to any patients at moderate or high risk for overdose between 365 days prior to surgery until 7 days after discharge (Table 2 and Figure 2). Low-risk group naloxone dispensing increased to 2 (0.0%) in 2014, to 13 (0.1%), in 2015, and to 86 (0.9%) in 2016. Moderate-risk group naloxone dispensing remained at 0 (0.0%) in 2014, but increased to 8 (3.5%) in 2015, and to 18 (10.9%) in 2016. High-risk group naloxone dispensing remained at 0 (0.0%) in 2014, but increased to 5 (5.8%) in 2015, and to 8 (12.7%) in 2016 (Figure 3).
Discussion
Our data demonstrate that patients presenting for TKA between 2013 and 2016 routinely had individual risk factors for overdose related to either prescription drug use or comorbidities. We also show that, although the number of patients at moderate and high risk for opioid overdose is decreasing, 2.2% of TKA patients remain at moderate or high risk for opioid overdose based on a weighted combination of these individual risk factors using RIOSORD. As demand for primary TKA is projected to grow to 3.5 million procedures by 2030, using prevalence from 2016, we estimate that 76,560 patients may present for TKA across the US with moderate or high risk for opioid overdose.9 Following discharge, this risk may be even higher as this estimate does not yet account for postoperative opioid use. We demonstrate that through a VHA OEND initiative, naloxone distribution increased and appeared to be targeted to those most at risk using a simple validated tool like RIOSORD.
Presence of an individual risk factor for overdose was present in as many as 63.1% of patients presenting for TKA, as was seen in 2013 with preoperative opioid use. The 3 highest scoring prescription use–related risk factors in RIOSORD are use of opioids ≥ 100 MEDD (16 points), ≥ 50 MEDD (9 points), and long-acting formulations (9 points). All 3 decreased in prevalence over the study period but by 2016 were still seen in 2.2% for ≥ 100 MEDD, 5.3% for ≥ 50 MEDD, and 5.8% for long-acting opioids. This decrease was not surprising given implementation of a VHA-wide opioid safety initiative and the OEND program, but this could also be related to changes in patient selection for surgery in the context of increased awareness of the opioid epidemic. Despite the trend toward safer opioid prescribing, by 2016 over half of patients (50.5%) who presented for TKA were already taking opioids, with 10.6% (543 of 5127) on doses ≥ 50 MEDD.
We observed a decrease in RIOSORD risk each year, consistent with decreasing prescription-related risk factors over time. This was most obvious in the moderate-risk group. It is unclear why a similar decrease was not as obvious in the high-risk group, but this in part may be due to the already low numbers of patients in the high-risk group. This may also represent the high-risk group being somewhat resistant to the initiatives that shifted moderate-risk patients to the low-risk group. There were proportionately more patients in the moderate- and high-risk groups in the original RIOSORD population than in our surgical population, which may be attributed to the fewer comorbidities seen in our surgical population, as well as the higher opioid-prescribing patterns seen prior to the VA OEND initiative.12
Naloxone prescribing was rare prior to the OEND initiative and increased from 2013 to 2016. Increases were most marked in those in moderate- and high-risk groups, although naloxone prescribing also increased among the low-risk group. Integration of RIOSORD stratification into the OEND initiative likely played a role in targeting increased access to naloxone among those at highest risk of overdose. Naloxone dispensing increased for every group, although a significant proportion of moderate- and high-risk patients, 89.1% and 87.3%, respectively, were still not dispensed naloxone by 2016. Moreover, our estimates of perioperative naloxone access were likely an overestimate by including patients dispensed naloxone up to 1 year before surgery until 7 days after surgery. The aim was to include patients who may not have been prescribed naloxone postoperatively because of an existing naloxone prescription at home. Perioperative naloxone access estimates would have been even lower if a narrower window had been used to approximate perioperative access. This identifies an important gap between those who may benefit from naloxone dispensing and those who received naloxone. This in part may be because OEND has not been implemented as routinely in surgical settings as other settings (eg, primary care). OEND efforts may more effectively increase naloxone prescribing among surgical patients if these efforts were targeted at surgical and anesthesia departments. Given that the Comprehensive Addiction and Recovery Act of 2016 requires an assessment of patient risk prior to opioid prescribing and VHA efforts to increase utilization of tools like the Stratification Tool for Opioid Risk Mitigation (STORM), which estimates patient risk when initiating an opioid prescription and includes naloxone as one of many risk mitigation strategies, we anticipate that rates of naloxone prescribing will increase over time.
Limitations
Our study captures a large number of patients across VHA hospitals of varying size nationwide, including a mix of those with and without academic medical center affiliations. This veteran population may not represent the US commercially insured population (CIP). Zedler and colleagues highlighted the differences in prevalence of individual risk factors: notably, the CIP had a substantially higher proportion of females and younger patients.11 VHA had a greater prevalence of common chronic conditions associated with older age. The frequency of opioid dependence was similar among CIP and VHA. However, substance abuse and nonopioid substance dependence diagnoses were 4-fold more frequent among VHA controls as CIP controls. Prescribing of all opioids, except morphine and methadone, was substantially greater in CIP than in VHA.11 Despite a difference in individual risk factors, a CIP-specific RIOSORD has been validated and can be used outside of the VHA to obviate the limitations of the VHA-specific RIOSORD.11
Other limitations include our estimation of naloxone access. We do not know whether naloxone was administered or have a reliable estimate of overdose incidence in this postoperative TKA population. Also, it is important to note that RIOSORD was not developed for surgical patients. The use of RIOSORD in a postoperative population likely underestimates risk of opioid overdose due to the frequent prescriptions of new opioids or escalation of existing MEDD to the postoperative patient. Our study was also retrospective in nature and reliant on accurate coding of patient risk factors. It is possible that comorbidities were not accurately identified by EHR and therefore subject to inconsistency.
Conclusions
Veterans presenting for TKA routinely have risk factors for opioid overdose. We observed a trend toward decreasing overdose risk which coincided with the Opioid Safety and OEND initiatives within the VHA. We also observed an increase in naloxone prescription for moderate- and high-risk patients undergoing TKA, although most of these patients still did not receive naloxone as of 2016. More research is needed to refine and validate the RIOSORD score for surgical populations. Expanding initiatives such as OEND to include surgical patients presents an opportunity to improve access to naloxone for postoperative patients that may help reduce opioid overdose in this population.
1. Rudd RA, Seth P, David F, Scholl L. Increases in drug and opioid-involved overdose deaths - United States, 2010-2015. MMWR Morb Mortal Wkly Rep. 2016;65(50-51):1445-1452. Published 2016 Dec 30. doi:10.15585/mmwr.mm655051e1
2. Wilson N, Kariisa M, Seth P, Smith H, Davis NL. Drug and opioid-involved overdose deaths - United States, 2017-2018. MMWR Morb Mortal Wkly Rep. 2020;69(11):290-297. doi:10.15585/mmwr.mm6911a4
3. Walley AY, Xuan Z, Hackman HH, et al. Opioid overdose rates and implementation of overdose education and nasal naloxone distribution in Massachusetts: interrupted time series analysis. BMJ. Jan 30 2013;346:f174. doi:10.1136/bmj.f174
4. McClellan C, Lambdin BH, Ali MM, et al. Opioid-overdose laws association with opioid use and overdose mortality. Addict Behav. 2018;86:90-95. doi:10.1016/j.addbeh.2018.03.014
5. Dowell D, Haegerich TM, Chou R. CDC Guideline for prescribing opioids for chronic pain--United States, 2016. JAMA. 2016;315(15):1624-1645. doi:10.1001/jama.2016.1464
6. Brat GA, Agniel D, Beam A, et al. Postsurgical prescriptions for opioid naive patients and association with overdose and misuse: retrospective cohort study. BMJ. 2018;360:j5790. Published 2018 Jan 17. doi:10.1136/bmj.j5790
7. Mudumbai SC, Lewis ET, Oliva EM, et al. Overdose risk associated with opioid use upon hospital discharge in Veterans Health Administration surgical patients. Pain Med. 2019;20(5):1020-1031. doi:10.1093/pm/pny150
8. Hsia HL, Takemoto S, van de Ven T, et al. Acute pain is associated with chronic opioid use after total knee arthroplasty. Reg Anesth Pain Med. 2018;43(7):705-711. doi:10.1097/AAP.0000000000000831
9. Kurtz S, Ong K, Lau E, Mowat F, Halpern M. Projections of primary and revision hip and knee arthroplasty in the United States from 2005 to 2030. J Bone Joint Surg Am. 2007;89(4):780-785. doi:10.2106/JBJS.F.00222
10. Kurtz SM, Ong KL, Lau E, Bozic KJ. Impact of the economic downturn on total joint replacement demand in the United States: updated projections to 2021. J Bone Joint Surg Am. 2014;96(8):624-630. doi:10.2106/JBJS.M.00285
11. Zedler BK, Saunders WB, Joyce AR, Vick CC, Murrelle EL. Validation of a screening risk index for serious prescription opioid-induced respiratory depression or overdose in a US commercial health plan claims database. Pain Med. 2018;19(1):68-78. doi:10.1093/pm/pnx009
12. Zedler B, Xie L, Wang L, et al. Development of a risk index for serious prescription opioid-induced respiratory depression or overdose in Veterans Health Administration patients. Pain Med. 2015;16(8):1566-79. doi:10.1111/pme.12777
13. Oliva EM, Bowe T, Tavakoli S, et al. Development and applications of the Veterans Health Administration’s Stratification Tool for Opioid Risk Mitigation (STORM) to improve opioid safety and prevent overdose and suicide. Psychol Serv. 2017;14(1):34-49. doi:10.1037/ser0000099
14. Oliva EM, Christopher MLD, Wells D, et al. Opioid overdose education and naloxone distribution: development of the Veterans Health Administration’s national program. J Am Pharm Assoc (2003). 2017;57(2S):S168-S179.e4. doi:10.1016/j.japh.2017.01.022
15. Noël PH, Copeland LA, Perrin RA, et al. VHA Corporate Data Warehouse height and weight data: opportunities and challenges for health services research. J Rehabil Res Dev. 2010;47(8):739-750. doi:10.1682/jrrd.2009.08.0110
Opioid overdose is a major public health challenge, with recent reports estimating 41 deaths per day in the United States from prescription opioid overdose.1,2 Prescribing naloxone has increasingly been advocated to reduce the risk of opioid overdose for patients identified as high risk. Naloxone distribution has been shown to decrease the incidence of opioid overdoses in the general population.3,4 The Centers for Disease Control and Prevention (CDC) Guideline for Prescribing Opioids for Chronic Pain recommends considering naloxone prescription for patients with a history of overdose or substance use disorder, opioid dosages ≥ 50 morphine equivalent daily dose (MEDD), and concurrent use of benzodiazepines.5
Although the CDC guidelines are intended for primary care clinicians in outpatient settings, naloxone prescribing is also relevant in the postsurgical setting.5 Many surgical patients are at risk for opioid overdose and data from the Veterans Health Administration (VHA) has shown that risk of opioid overdose is 11-fold higher in the 30 days following discharge from a surgical admission, when compared with the subsequent calendar year.6,7 This likely occurs due to new prescriptions or escalated doses of opioids following surgery. Overdose risk may be particularly relevant to orthopedic surgery as postoperative opioids are commonly prescribed.8 Patients undergoing total knee arthroplasty (TKA) may represent a vulnerable population to overdose as it is one of the most commonly performed surgeries for the treatment of chronic pain, and is frequently performed in older adults with medical comorbidities.9,10
Identifying patients at high risk for opioid overdose is important for targeted naloxone dispensing.5 A risk index for overdose or serious opioid-induced respiratory depression (RIOSORD) tool has been developed and validated in veteran and other populations to identify such patients.11 The RIOSORD tool classifies patients by risk level (1-10) and predicts probability of overdose or serious opioid-induced respiratory depression (OSORD). A patient’s level of risk is based on a weighted combination of the 15 independent risk factors most highly associated with OSORD, including comorbid conditions, prescription drug use, and health care utilization.12 Using the RIOSORD tool, the VHA Opioid Education and Naloxone Distribution (OEND) program is a risk mitigation initiative that aims to decrease opioid-related overdose morbidity and mortality. This is achieved via opioid overdose education for prevention, recognition, and response and includes outpatient naloxone prescription.13,14
Despite the comprehensive OEND program, there exists very little data to guide postsurgical naloxone prescribing. The prevalence of known risk factors for overdose in surgical patients remains unknown, as does the prevalence of perioperative naloxone distribution. Understanding overdose risk factors and naloxone prescribing patterns in surgical patients may identify potential targets for OEND efforts. This study retrospectively estimated RIOSORD scores for TKA patients between 2013 to 2016 and described naloxone distribution based on RIOSORD scores and risk factors.
Methods
We identified patients who had undergone primary TKA at VHA hospitals using Current Procedural Terminology (CPT), International Classification of Diseases, Ninth Revision (ICD-9) procedure codes, and data extracted from the VHA Corporate Data Warehouse (CDW) of electronic health records (EHRs). Our study was granted approval with exemption from informed consent by the Durham Veteran Affairs Healthcare System Institutional Review Board.
This retrospective cohort study included all veterans who underwent elective primary TKA from January 1, 2013 through December 31, 2016. We excluded patients who died before discharge.
Outcomes
Our primary outcome was being dispensed an outpatient naloxone prescription following TKA. Naloxone dispensing was identified by examining CDW outpatient pharmacy records with a final dispense date from 1 year before surgery through 7 days after discharge following TKA. To exclude naloxone administration that may have been given in a clinic, prescription data included only records with an outpatient prescription copay. Naloxone dispensing in the year before surgery was chosen to estimate likely preoperative possession of naloxone which could be available in the postoperative period. Naloxone dispensing until 7 days after discharge was chosen to identify any new dispensing that would be available in the postoperative period. These outcomes were examined over the study time frame on an annual basis.
Patient Factors
Demographic variables included age, sex, and race/ethnicity. Independent risk factors for overdose from RIOSORD were identified for each patient.15 These risk factors included comorbidities (opioid use disorder, schizophrenia, bipolar disorder, liver disease, chronic kidney disease, sleep apnea, or lung disease) and prescription drug use (use of opioids, benzodiazepines, long-acting opioids, ≥ 50 MEDD or ≥ 100 MEDD). ICD-9 and ICD-10 diagnosis codes were used to identify comorbidities. Risk classes on day of surgery were identified using a RIOSORD algorithm code. Consistent with the display of RIOSORD risk classes on the VHA Academic Detailing Service OEND risk report, patients were grouped into 3 groups based on their RIOSORD score: classes 1 to 4 (low risk), 5 to 7 (moderate risk), and 8 to 10 (high risk).
Descriptive statistics were used to summarize data on patient demographics, RIOSORD risk factors, overdose events, and naloxone dispensing over time.
Results
The study cohort included 38,011 veterans who underwent primary TKA in the VHA between January 1, 2013 and December 30, 2016. In this cohort, the mean age was 65 years, 93% were male, and 77% were White patients (Table 1). The most common comorbidities were lung disease in 9170 (24.1%) patients, sleep apnea in 6630 (17.4%) patients, chronic kidney disease in 4036 (10.6%) patients, liver disease in 2822 (7.4%) patients, and bipolar disorder in 1748 (4.6%) patients.
In 2013, 63.1% of patients presenting for surgery were actively prescribed opioids. By 2016, this decreased to 50.5%. Benzodiazepine use decreased from 13.2 to 8.8% and long-acting opioid use decreased from 8.5 to 5.8% over the same period. Patients taking ≥ 50 MEDD decreased from 8.0 to 5.3% and patients taking ≥ 100 MEDD decreased from 3.3 to 2.2%. The prevalence of moderate-risk patients decreased from 2.5 to 1.6% and high-risk patients decreased from 0.8 to 0.6% (Figure 1). Cumulatively, the prevalence of presenting with either moderate or high risk of overdose decreased from 3.3 to 2.2% between 2013 to 2016.
Naloxone Dispensing
In 2013, naloxone was not dispensed to any patients at moderate or high risk for overdose between 365 days prior to surgery until 7 days after discharge (Table 2 and Figure 2). Low-risk group naloxone dispensing increased to 2 (0.0%) in 2014, to 13 (0.1%), in 2015, and to 86 (0.9%) in 2016. Moderate-risk group naloxone dispensing remained at 0 (0.0%) in 2014, but increased to 8 (3.5%) in 2015, and to 18 (10.9%) in 2016. High-risk group naloxone dispensing remained at 0 (0.0%) in 2014, but increased to 5 (5.8%) in 2015, and to 8 (12.7%) in 2016 (Figure 3).
Discussion
Our data demonstrate that patients presenting for TKA between 2013 and 2016 routinely had individual risk factors for overdose related to either prescription drug use or comorbidities. We also show that, although the number of patients at moderate and high risk for opioid overdose is decreasing, 2.2% of TKA patients remain at moderate or high risk for opioid overdose based on a weighted combination of these individual risk factors using RIOSORD. As demand for primary TKA is projected to grow to 3.5 million procedures by 2030, using prevalence from 2016, we estimate that 76,560 patients may present for TKA across the US with moderate or high risk for opioid overdose.9 Following discharge, this risk may be even higher as this estimate does not yet account for postoperative opioid use. We demonstrate that through a VHA OEND initiative, naloxone distribution increased and appeared to be targeted to those most at risk using a simple validated tool like RIOSORD.
Presence of an individual risk factor for overdose was present in as many as 63.1% of patients presenting for TKA, as was seen in 2013 with preoperative opioid use. The 3 highest scoring prescription use–related risk factors in RIOSORD are use of opioids ≥ 100 MEDD (16 points), ≥ 50 MEDD (9 points), and long-acting formulations (9 points). All 3 decreased in prevalence over the study period but by 2016 were still seen in 2.2% for ≥ 100 MEDD, 5.3% for ≥ 50 MEDD, and 5.8% for long-acting opioids. This decrease was not surprising given implementation of a VHA-wide opioid safety initiative and the OEND program, but this could also be related to changes in patient selection for surgery in the context of increased awareness of the opioid epidemic. Despite the trend toward safer opioid prescribing, by 2016 over half of patients (50.5%) who presented for TKA were already taking opioids, with 10.6% (543 of 5127) on doses ≥ 50 MEDD.
We observed a decrease in RIOSORD risk each year, consistent with decreasing prescription-related risk factors over time. This was most obvious in the moderate-risk group. It is unclear why a similar decrease was not as obvious in the high-risk group, but this in part may be due to the already low numbers of patients in the high-risk group. This may also represent the high-risk group being somewhat resistant to the initiatives that shifted moderate-risk patients to the low-risk group. There were proportionately more patients in the moderate- and high-risk groups in the original RIOSORD population than in our surgical population, which may be attributed to the fewer comorbidities seen in our surgical population, as well as the higher opioid-prescribing patterns seen prior to the VA OEND initiative.12
Naloxone prescribing was rare prior to the OEND initiative and increased from 2013 to 2016. Increases were most marked in those in moderate- and high-risk groups, although naloxone prescribing also increased among the low-risk group. Integration of RIOSORD stratification into the OEND initiative likely played a role in targeting increased access to naloxone among those at highest risk of overdose. Naloxone dispensing increased for every group, although a significant proportion of moderate- and high-risk patients, 89.1% and 87.3%, respectively, were still not dispensed naloxone by 2016. Moreover, our estimates of perioperative naloxone access were likely an overestimate by including patients dispensed naloxone up to 1 year before surgery until 7 days after surgery. The aim was to include patients who may not have been prescribed naloxone postoperatively because of an existing naloxone prescription at home. Perioperative naloxone access estimates would have been even lower if a narrower window had been used to approximate perioperative access. This identifies an important gap between those who may benefit from naloxone dispensing and those who received naloxone. This in part may be because OEND has not been implemented as routinely in surgical settings as other settings (eg, primary care). OEND efforts may more effectively increase naloxone prescribing among surgical patients if these efforts were targeted at surgical and anesthesia departments. Given that the Comprehensive Addiction and Recovery Act of 2016 requires an assessment of patient risk prior to opioid prescribing and VHA efforts to increase utilization of tools like the Stratification Tool for Opioid Risk Mitigation (STORM), which estimates patient risk when initiating an opioid prescription and includes naloxone as one of many risk mitigation strategies, we anticipate that rates of naloxone prescribing will increase over time.
Limitations
Our study captures a large number of patients across VHA hospitals of varying size nationwide, including a mix of those with and without academic medical center affiliations. This veteran population may not represent the US commercially insured population (CIP). Zedler and colleagues highlighted the differences in prevalence of individual risk factors: notably, the CIP had a substantially higher proportion of females and younger patients.11 VHA had a greater prevalence of common chronic conditions associated with older age. The frequency of opioid dependence was similar among CIP and VHA. However, substance abuse and nonopioid substance dependence diagnoses were 4-fold more frequent among VHA controls as CIP controls. Prescribing of all opioids, except morphine and methadone, was substantially greater in CIP than in VHA.11 Despite a difference in individual risk factors, a CIP-specific RIOSORD has been validated and can be used outside of the VHA to obviate the limitations of the VHA-specific RIOSORD.11
Other limitations include our estimation of naloxone access. We do not know whether naloxone was administered or have a reliable estimate of overdose incidence in this postoperative TKA population. Also, it is important to note that RIOSORD was not developed for surgical patients. The use of RIOSORD in a postoperative population likely underestimates risk of opioid overdose due to the frequent prescriptions of new opioids or escalation of existing MEDD to the postoperative patient. Our study was also retrospective in nature and reliant on accurate coding of patient risk factors. It is possible that comorbidities were not accurately identified by EHR and therefore subject to inconsistency.
Conclusions
Veterans presenting for TKA routinely have risk factors for opioid overdose. We observed a trend toward decreasing overdose risk which coincided with the Opioid Safety and OEND initiatives within the VHA. We also observed an increase in naloxone prescription for moderate- and high-risk patients undergoing TKA, although most of these patients still did not receive naloxone as of 2016. More research is needed to refine and validate the RIOSORD score for surgical populations. Expanding initiatives such as OEND to include surgical patients presents an opportunity to improve access to naloxone for postoperative patients that may help reduce opioid overdose in this population.
1. Rudd RA, Seth P, David F, Scholl L. Increases in drug and opioid-involved overdose deaths - United States, 2010-2015. MMWR Morb Mortal Wkly Rep. 2016;65(50-51):1445-1452. Published 2016 Dec 30. doi:10.15585/mmwr.mm655051e1
2. Wilson N, Kariisa M, Seth P, Smith H, Davis NL. Drug and opioid-involved overdose deaths - United States, 2017-2018. MMWR Morb Mortal Wkly Rep. 2020;69(11):290-297. doi:10.15585/mmwr.mm6911a4
3. Walley AY, Xuan Z, Hackman HH, et al. Opioid overdose rates and implementation of overdose education and nasal naloxone distribution in Massachusetts: interrupted time series analysis. BMJ. Jan 30 2013;346:f174. doi:10.1136/bmj.f174
4. McClellan C, Lambdin BH, Ali MM, et al. Opioid-overdose laws association with opioid use and overdose mortality. Addict Behav. 2018;86:90-95. doi:10.1016/j.addbeh.2018.03.014
5. Dowell D, Haegerich TM, Chou R. CDC Guideline for prescribing opioids for chronic pain--United States, 2016. JAMA. 2016;315(15):1624-1645. doi:10.1001/jama.2016.1464
6. Brat GA, Agniel D, Beam A, et al. Postsurgical prescriptions for opioid naive patients and association with overdose and misuse: retrospective cohort study. BMJ. 2018;360:j5790. Published 2018 Jan 17. doi:10.1136/bmj.j5790
7. Mudumbai SC, Lewis ET, Oliva EM, et al. Overdose risk associated with opioid use upon hospital discharge in Veterans Health Administration surgical patients. Pain Med. 2019;20(5):1020-1031. doi:10.1093/pm/pny150
8. Hsia HL, Takemoto S, van de Ven T, et al. Acute pain is associated with chronic opioid use after total knee arthroplasty. Reg Anesth Pain Med. 2018;43(7):705-711. doi:10.1097/AAP.0000000000000831
9. Kurtz S, Ong K, Lau E, Mowat F, Halpern M. Projections of primary and revision hip and knee arthroplasty in the United States from 2005 to 2030. J Bone Joint Surg Am. 2007;89(4):780-785. doi:10.2106/JBJS.F.00222
10. Kurtz SM, Ong KL, Lau E, Bozic KJ. Impact of the economic downturn on total joint replacement demand in the United States: updated projections to 2021. J Bone Joint Surg Am. 2014;96(8):624-630. doi:10.2106/JBJS.M.00285
11. Zedler BK, Saunders WB, Joyce AR, Vick CC, Murrelle EL. Validation of a screening risk index for serious prescription opioid-induced respiratory depression or overdose in a US commercial health plan claims database. Pain Med. 2018;19(1):68-78. doi:10.1093/pm/pnx009
12. Zedler B, Xie L, Wang L, et al. Development of a risk index for serious prescription opioid-induced respiratory depression or overdose in Veterans Health Administration patients. Pain Med. 2015;16(8):1566-79. doi:10.1111/pme.12777
13. Oliva EM, Bowe T, Tavakoli S, et al. Development and applications of the Veterans Health Administration’s Stratification Tool for Opioid Risk Mitigation (STORM) to improve opioid safety and prevent overdose and suicide. Psychol Serv. 2017;14(1):34-49. doi:10.1037/ser0000099
14. Oliva EM, Christopher MLD, Wells D, et al. Opioid overdose education and naloxone distribution: development of the Veterans Health Administration’s national program. J Am Pharm Assoc (2003). 2017;57(2S):S168-S179.e4. doi:10.1016/j.japh.2017.01.022
15. Noël PH, Copeland LA, Perrin RA, et al. VHA Corporate Data Warehouse height and weight data: opportunities and challenges for health services research. J Rehabil Res Dev. 2010;47(8):739-750. doi:10.1682/jrrd.2009.08.0110
Anxiety in men tied to risk factors for CVD, diabetes
Among healthy middle-aged men, those who were more anxious were more likely to develop high levels of multiple biomarkers of cardiometabolic risk over a 40-year follow-up in a new study.
“By middle adulthood, higher anxiety levels are associated with stable differences” in biomarkers of risk for coronary artery disease (CAD), stroke, and type 2 diabetes, which “are maintained into older ages,” the researchers wrote.
Anxious individuals “may experience deteriorations in cardiometabolic health earlier in life and remain on a stable trajectory of heightened risk into older ages,” they concluded.
The study, led by Lewina Lee, PhD, was published online Jan. 24, 2022, in the Journal of the American Heart Association.
“Men who had higher levels of anxiety at the beginning of the study had consistently higher biological risk for cardiometabolic disease than less anxious men from midlife into old age,” Dr. Lee, assistant professor of psychiatry, Boston University, summarized in an email.
Clinicians may not screen for heart disease and diabetes, and/or only discuss lifestyle modifications when patients are older or have the first signs of disease, she added.
However, the study findings “suggest that worries and anxiety are associated with preclinical pathophysiological processes that tend to culminate in cardiometabolic disease” and show “the importance of screening for mental health difficulties, such as worries and anxiety, in men as early as in their 30s and 40s,” she stressed.
Since most of the men were White (97%) and veterans (94%), “it would be important for future studies to evaluate if these associations exist among women, people from diverse racial and ethnic groups, and in more socioeconomically varying samples, and to consider how anxiety may relate to the development of cardiometabolic risk in much younger individuals than those in our study,” Dr. Lee said in a press release from the American Heart Association.
“This study adds to the growing body of research that link psychological health to cardiovascular risk,” Glenn N. Levine, MD, who was not involved with this research, told this news organization in an email.
“We know that factors such as depression and stress can increase cardiac risk; this study further supports that anxiety can as well,” added Dr. Levine, chief of cardiology, Michael E. DeBakey Veterans Affairs Medical Center, Houston.
“Everyone experiences some anxiety in their life,” he added. However, “if a provider senses that a patient’s anxiety is far beyond the ‘normal’ that we all have from time to time, and it is seemingly adversely impacting both their psychological and physical health, it would be reasonable to suggest to the patient that it might be useful to speak with a mental health professional, and if the patient is receptive, to then make a formal consultation or referral,” said Dr. Levine, who was writing group chair of a recent AHA Scientific Statement on mind-heart-body connection.
Neuroticism and worry
Several studies have linked anxiety to a greater risk of cardiometabolic disease onset, Dr. Lee and colleagues wrote, but it is unclear if anxious individuals have a steadily worsening risk as they age, or if they have a higher risk in middle age, which stays the same in older age.
To investigate this, they analyzed data from 1561 men who were seen at the VA Boston outpatient clinic and did not have CAD, type 2 diabetes, stroke, or cancer when they enrolled in the Normative Aging Study.
The men had a mean age of 53 years (range, 33-84) in 1975 and were followed until 2015 or until dropout from the study or death.
At baseline, the study participants filled in the Eysenck Personality Inventory, which assesses neuroticism, and also responded to a scale indicating how much they worry about 20 issues (excluding health).
“Neuroticism,” the researchers explained, “is a tendency to perceive experiences as threatening, feel that challenges are uncontrollable, and experience frequent and disproportionately intense negative emotions,” such as fear, anxiety, sadness, and anger, “across many situations.”
“Worry refers to attempts to solve a problem where future outcome is uncertain and potentially positive or negative,” Dr. Lee noted. Although worry can be healthy and lead to constructive solutions, “it may be unhealthy, especially when it becomes uncontrollable and interferes with day-to-day functioning.”
Of note, in 1980, the American Psychiatric Association removed the term neurosis from its diagnostic manual. What was previously called neurosis is included as part of generalized anxiety disorder; GAD also encompasses excessive worry.
Cardiometabolic risk from midlife to old age
The men in the current study had on-site physical examinations every 3-5 years.
The researchers calculated the men’s cardiometabolic risk score (from 0 to 7) by assigning 1 point each for the following: systolic blood pressure greater than 130 mm Hg, diastolic blood pressure greater than 85 mm Hg, total cholesterol of at least 240 mg/dL, triglycerides of at least 150 mg/dL, body mass index of at least 30 kg/m2, glucose of at least 100 mg/dL, and erythrocyte sedimentation rate of at least 14 mm/hour.
Alternatively, patients were assigned a point each for taking medication that could affect these markers (except for body mass index).
Overall, on average, at baseline, the men had a cardiometabolic risk score of 2.9. From age 33-65, this score increased to 3.8, and then it did not increase as much later on.
That is, the cardiometabolic risk score increased by 0.8 per decade until age 65, followed by a slower increase of 0.5 per decade.
At all ages, men with higher levels of neuroticism or worry had a higher cardiometabolic risk score
Each additional standard deviation of neuroticism was associated with a 13% increased risk of having six or more of the seven cardiometabolic risk markers during follow-up, after adjusting for age, demographics, and family history of CAD, but the relationship was attenuated after also adjusting for health behaviors (for example, smoking, alcohol consumption, physical activity, and past-year physician visit at baseline).
Similarly, each additional standard deviation of worry was associated with a 10% increased risk of having six or more of the seven cardiometabolic risk markers during follow-up after the same adjustments, and was also no longer significantly different after the same further adjustments.
The research was supported by grants from the National Institutes of Health and a Senior Research Career Scientist Award from the Office of Research and Development, Department of Veterans Affairs. The Normative Aging Study is a research component of the Massachusetts Veterans Epidemiology Research and Information Center and is supported by the VA Cooperative Studies Program/Epidemiological Research Centers. The study authors and Dr. Levine disclosed no relevant financial relationships.
A version of this article first appeared on Medscape.com.
FROM THE JOURNAL OF THE AMERICAN HEART ASSOCIATION
Integrating Massage Therapy Into the Health Care of Female Veterans
There are approximately 2 million female veterans in the United States, representing about 10% of the veteran population.1 In 2015, 456,000 female veterans used the US Department of Veterans Affairs (VA) health care services. The VA predicts an increase in utilization over the next 20 years.2
Female veterans are more likely to have musculoskeletal disorder multimorbidity compared with male veterans and have higher rates of depressive and bipolar disorders, anxiety, and posttraumatic stress disorder (PTSD).3,4 Compared with male veterans, female veterans are younger, more likely to be unmarried and to have served during the wars in Iraq and Afghanistan.3 Fifty-five percent of women veterans vs 41% of men veterans have a service-connected disability, and a greater percentage of women veterans have a service connection rating > 50%.5 The top service-connected disabilities for women veterans are PTSD, major depressive disorder, migraines, and lumbosacral or cervical strain.2 In addition, one-third of women veterans using VA health care report experiencing military sexual trauma (MST).6 Military service may impact the health of female veterans both physically and mentally. Providing treatments and programs to improve their health and their health care experience are current VA priorities.
The VA is changing the way health care is conceptualized and delivered by implementing a holistic model of care known as Whole Health, which seeks to empower and equip patients to take charge of their health, blending conventional medicine with self-care and complementary and integrative health (CIH) approaches, such as massage therapy, yoga, acupuncture, and meditation.7 CIH therapies can help improve physical and mental health with little to no adverse effects.8-10
As part of the Whole Health initiative at the VA Ann Arbor Healthcare System (VAAAHS) in Michigan, the massage program was expanded in 2017 to offer relaxation massages to female veterans attending the women’s health clinic, which provides gynecologic care. Patients visiting a gynecology clinic often experience anxiety and pain related to invasive procedures and examinations. This is especially true for female veterans who experienced MST.11
VAAAHS has 1 staff massage therapist (MT). To expand the program to the women’s health clinic, volunteer licensed MTs were recruited and trained in specific procedures by the staff MT.
Several studies have demonstrated the effect of therapeutic massage on pain and anxiety in predominantly male veteran study populations, including veterans needing postsurgical and palliative care as well as those experiencing chronic pain and knee osteoarthritis.12-16 Little is known about the effects of massage therapy on female veterans. The purpose of this pilot study was to examine the effects of massage therapy among female veterans participating in the women’s health massage program.
Methods
The setting for this pre-post intervention study was VAAAHS. Veterans were called in advance by clinic staff and scheduled for 60-minute appointments either before or after their clinic appointment, depending on availability. MTs were instructed to provide relaxation massage using Swedish massage techniques with moderate pressure, avoiding deep pressure techniques.
The volunteer MTs gave the participants a survey to provide comments and to rate baseline pain and other symptoms prior to and following the massage. The MT left the room to provide privacy while completing the survey. The staff included the symptom data in the massage note as clinical outcomes and entered them into the electronic health record. Massages were given from October 1, 2017 to June 30, 2018. Data including symptom scores, demographics, the presence of chronic pain, mental health diagnoses, patient comments, and opioid use were abstracted from the electronic health record by 2 members of the study team and entered into an Excel database. This study was approved by the VAAAHS Institutional Review Board.
Study Measures
Pain intensity, pain unpleasantness (the affective component of pain), anxiety, shortness of breath, relaxation, and inner peace were rated pre- and postmassage on a 0 to 10 scale. Shortness of breath was included due to the relationship between breathing and anxiety. Inner peace was assessed to measure the calming effects of massage therapy. Beck and colleagues found the concept of inner peace was an important outcome of massage therapy.17 The scale anchors for pain intensity were “no pain” and “severe pain”; and “not at all unpleasant” and “as unpleasant as it can be” for pain unpleasantness. For anxiety, the anchors were “no anxiety” and “as anxious as I can be.” Anchors for relaxation and inner peace were reversed so that a 0 indicated low relaxation and inner peace while a 10 indicated the highest state of relaxation and inner peace.
Chronic pain was defined as pain existing for > 3 months. A history of chronic pain was determined from a review and synthesis of primary care and specialty care recorded diagnoses, patient concerns, and service-connected disabilities. The diagnoses included lumbosacral or cervical strain, chronic low back, joint (knee, shoulder, hip, ankle), neck, or pelvic pain, fibromyalgia, headache, migraine, osteoarthritis, and myofascial pain syndrome. The presence of mental health conditions, including depression, anxiety, bipolar disorders, and PTSD, were similarly determined by a review of mental health clinical notes. Sex was determined from the gynecology note.
Statistical Analysis
Means and medians were calculated for short-term changes in symptom scores. Due to skewness in the short-term changes, significance was tested using a nonparametric sign test. Significance was adjusted using the Bonferroni correction to protect the overall type I error level at 5% from multiple testing. We also assessed for differences in symptom changes in 4 subgroups, using an unadjusted general linear model: those with (1) chronic pain vs without; (2) an anxiety diagnosis vs without; (3) depression vs without; and (4) a PTSD diagnosis vs without. Data were analyzed using SPSS 25 and SAS 9.4.
Results
Results are based on the first massage received by 96 unique individuals (Table 1). Fifty-one (53%) patients were aged 21 to 40 years, and 45 (47%) were aged ≥ 41 years. Most participants (80%) had had a previous massage. Seven (7%) participants were currently on prescription opioids; 76 (79%) participants had a history of one or more chronic pain diagnoses (eg, back pain, migraine headaches, fibromyalgia) and 78 (81%) had a history of a mental health diagnosis (eg, depression, anxiety, PTSD). Massage sessions ranged from 30 to 60 minutes; most patients received massage therapy for 50 minutes.
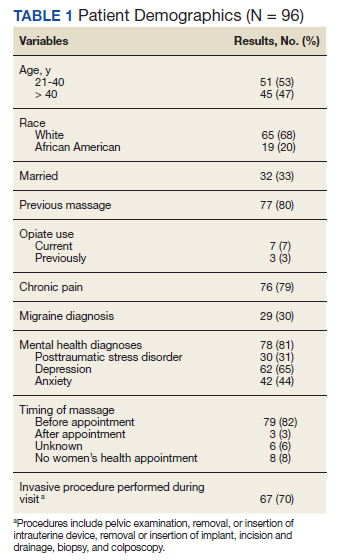
Prior to massage, mean scores were 3.9 pain intensity, 3.7 pain unpleasantness, 3.8 anxiety, 1.0 shortness of breath, 4.0 relaxation, and 4.2 inner peace. Short-term changes in symptom scores are shown in Table 2. The mean score for pain intensity decreased by 1.9 points, pain unpleasantness by 2.0 points, anxiety by 2.4 points. The greatest change occurred for relaxation, which increased by 4.3 points. All changes in symptoms were statistically significant (P < .001). For subgroup comparisons
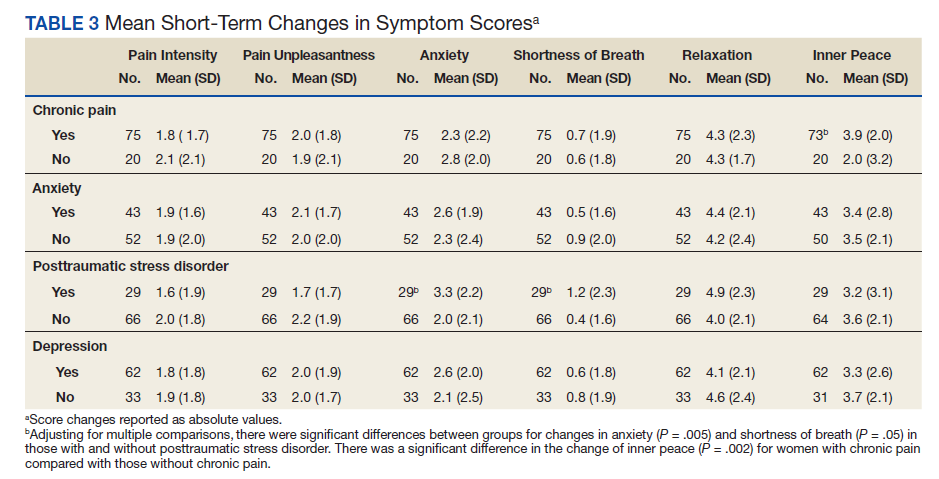
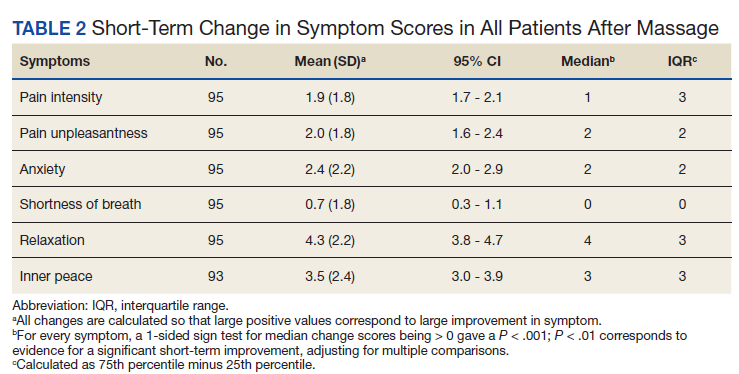
Verbal feedback and written comments about the massage experience were all favorable: No adverse events were reported.
Discussion
Massage therapy may be a useful treatment for female veterans experiencing chronic pain, anxiety disorders, depression, or situational anxiety related to gynecologic procedures. After receiving a relaxation massage, female veterans reported decreased pain intensity, pain unpleasantness, and anxiety while reporting increased relaxation and feelings of inner peace. The effects of massage were consistent for all the symptoms or characteristics assessed, suggesting that massage may act on the body in multiple ways.
These changes parallel those seen in a palliative care population primarily composed of male veterans.14 However, the female veterans in this cohort experienced greater changes in relaxation and feelings of inner peace, which may be partly due to relief of tension related to an upcoming stressful appointment. The large mean decrease in anxiety level among female veterans with PTSD is notable as well as the larger increase in inner peace in those with chronic pain.
Many patients expressed their gratitude for the massage and interest in having access to more massage therapy. Female patients who have experienced sexual trauma or other trauma may especially benefit from massage prior to painful, invasive gynecologic procedures. Anecdotally, 2 nurse chaperones in the clinic mentioned separately to the massage program supervisor that the massages helped some very anxious women better tolerate an invasive procedure that would have been otherwise extremely difficult.
Female veterans are more likely to have musculoskeletal issues after deployment and have higher rates of anxiety, PTSD, and depression compared with those of male veterans.3,4,18,19 Determining relationships between and causes of chronic pain, depression, and PTSD is very challenging but the increased prevalence of chronic pain and comorbid mental health conditions in female veterans may be partially related to MST or other trauma experiences.20-22 Female veterans are most likely to have more than one source of chronic pain.23-25 Female patients with chronic musculoskeletal pain report more pain-related disability.26 Furthermore, greater disability in the context of depression is reported by women with pain compared with those of men.27 Most (78%) female veterans in a primary care population reported chronic pain.23 Similarly, 79% of the female veterans in this study population had chronic pain and 81% had a history of mental health disorders, including depression, anxiety, and PTSD.
Studies have shown that massage therapy improves pain in populations experiencing chronic low back, neck, and knee pain.28-32 A 2020 Agency for Healthcare Research and Quality review determined there is some evidence that massage therapy is helpful for chronic low back and neck pain and fibromyalgia.33 Research also has demonstrated that massage reduces anxiety and depression in several different population types.13,34,35 Li and colleagues showed that foot massage increased oxytocin levels in healthy males.36 Although further research is needed to determine the mechanisms of massage therapy, there are important physiologic effects. Unlike most medications, massage therapy is unique in that it can impact health and well-being through multiple mechanisms; for example, by reducing pain, improving mood, providing a sense of social connection and/or improving mobility.
Patients using CIH therapies report greater awareness of the need for ongoing engagement in their own care and health behavior changes.37,38
Driscoll and colleagues reported that women veterans are interested in conservative treatment for their chronic musculoskeletal pain and are open to using CIH therapies.39 Research suggests that veterans are interested in and, in some cases, already using massage therapy.23,40-43 Access to massage therapy and other CIH therapies offers patients choice and control over the types and timing of therapy they receive, exemplified by the 80% of patients in our study who previously received a massage and sought another before a potentially stressful situation.
Access to massage therapy or other CIH therapies may reduce the need for more expensive procedures. Although research on the cost-effectiveness of massage therapy is limited, Herman and colleagues did an economic evaluation of CIH therapies in a veteran population, finding that CIH users had lower annual health care costs and lower pain in the year after CIH started. Sensitivity analyses indicated similar results for acupuncture, chiropractic care, and massage but higher costs for those with 8 or more visits.44
The prevalence of comorbid mental health conditions with MSD suggests that female veterans may benefit from multidisciplinary treatment of pain and depression.3,26 Women-centered programs would be both encouraging and validating to women.39 Massage therapy can be combined with physical therapy, yoga, tai chi, and meditation programs to improve pain, anxiety, strength, and flexibility and can be incorporated into a multimodal treatment plan. Likewise, other subpopulations of female veterans with chronic pain, mental health conditions, or cancer could be targeted with multidisciplinary programs that include massage therapy.
Limitations
This study has several limitations including lack of a control group, a self-selected population, the lack of objective biochemical measurements, and possible respondent bias to please the MTs. Eighty percent had previously experienced massage therapy and may have been biased toward the effects of massage before receiving the intervention. The first report of the effects of massage therapy in an exclusively female veteran population is a major strength of this study.
Further research including randomized controlled trials is needed, especially in populations with coexisting chronic pain and mental health disorders, as is exploring the acceptability of massage therapy for female veterans with MST. Finding viable alternatives to medications has become even more important as the nation addresses the challenge of the opioid crisis.45,46
Conclusions
Female veterans are increasingly seeking VA health care.
Acknowledgments
The authors express our gratitude to the Women Veteran Program Manager, Cheryl Allen, RN; Massage Therapists Denise McGee and Kimberly Morro; Dara Ganoczy, MPH, for help with statistical analysis; and Mark Hausman, MD, for leadership support.
1. US Department of Veteran Affairs, National Center for Veterans Analysis and Statistics. Veteran population. Updated April 14, 2021. Accessed January 6, 2022. https://www.va.gov/vetdata/veteran_population.asp
2. US Department of Veteran Affairs. Women veterans report: the past, present, and future of women veterans. Published February 2017. Accessed January 6, 2022. https://www.va.gov/vetdata/docs/specialreports/women_veterans_2015_final.pdf
3. Higgins DM, Fenton BT, Driscoll MA, et al. Gender differences in demographic and clinical correlates among veterans with musculoskeletal disorders. Womens Health Issues. 2017;27(4):463-470. doi:10.1016/j.whi.2017.01.008
4. Lehavot K, Goldberg SB, Chen JA, et al. Do trauma type, stressful life events, and social support explain women veterans’ high prevalence of PTSD?. Soc Psychiatry Psychiatr Epidemiol. 2018;53(9):943-953. doi:10.1007/s00127-018-1550-x
5. Levander XA, Overland MK. Care of women veterans. Med Clin North Am. 2015;99(3):651-662. doi:10.1016/j.mcna.2015.01.013
6. US Department of Veteran Affairs. Facts and statistics about women veterans. Updated May 28. 2020. Accessed January 6, 2022. https://www.womenshealth.va.gov/womenshealth/latestinformation/facts.asp
7. Krejci LP, Carter K, Gaudet T. Whole health: the vision and implementation of personalized, proactive, patient-driven health care for veterans. Med Care. 2014;52(12)(suppl 5):S5-S8. doi:10.1097/MLR.0000000000000226
8. Elwy AR, Taylor SL, Zhao S, et al. Participating in complementary and integrative health approaches is associated with veterans’ patient-reported outcomes over time. Med Care. 2020;58:S125-S132. doi:10.1097/MLR.0000000000001357
9. Smeeding SJ, Bradshaw DH, Kumpfer K, Trevithick S, Stoddard GJ. Outcome evaluation of the Veterans Affairs Salt Lake City Integrative Health Clinic for chronic pain and stress-related depression, anxiety, and post-traumatic stress disorder. J Altern Complement Med. 2010;16(8):823-835. doi:10.1089/acm.2009.0510
10. Hull A, Brooks Holliday S, Eickhoff C, et al. Veteran participation in the integrative health and wellness program: impact on self-reported mental and physical health outcomes. Psychol Serv. 2019;16(3):475-483. doi:10.1037/ser0000192
11. Zephyrin LC. Reproductive health management for the care of women veterans [published correction appears in Obstet Gynecol. 2016 Mar;127(3):605]. Obstet Gynecol. 2016;127(2):383-392. doi:10.1097/AOG.0000000000001252
12. Piotrowski MM, Paterson C, Mitchinson A, Kim HM, Kirsh M, Hinshaw DB. Massage as adjuvant therapy in the management of acute postoperative pain: a preliminary study in men. J Am Coll Surg. 2003;197(6):1037-1046. doi:10.1016/j.jamcollsurg.2003.07.020
13. Mitchinson AR, Kim HM, Rosenberg JM, et al. Acute postoperative pain management using massage as an adjuvant therapy: a randomized trial. Arch Surg. 2007;142(12):1158-1167. doi:10.1001/archsurg.142.12.1158
14. Mitchinson A, Fletcher CE, Kim HM, Montagnini M, Hinshaw DB. Integrating massage therapy within the palliative care of veterans with advanced illnesses: an outcome study. Am J Hosp Palliat Care. 2014;31(1):6-12. doi:10.1177/1049909113476568
15. Fletcher CE, Mitchinson AR, Trumble EL, Hinshaw DB, Dusek JA. Perceptions of other integrative health therapies by veterans with pain who are receiving massage. J Rehabil Res Dev. 2016;53(1):117-126. doi:10.1682/JRRD.2015.01.0015
16. Juberg M, Jerger KK, Allen KD, Dmitrieva NO, Keever T, Perlman AI. Pilot study of massage in veterans with knee osteoarthritis. J Altern Complement Med. 2015;21(6):333-338. doi:10.1089/acm.2014.0254
17. Beck I, Runeson I, Blomqvist K. To find inner peace: soft massage as an established and integrated part of palliative care. Int J Palliate Nurse. 2009;15(11):541-545. doi: 10.12968/ijpn.2009.15.11.45493
18. Haskell SG, Ning Y, Krebs E, et al. Prevalence of painful musculoskeletal conditions in female and male veterans in 7 years after return from deployment in Operation Enduring Freedom/Operation Iraqi Freedom. Clin J Pain. 2012;28(2):163-167. doi:10.1097/AJP.0b013e318223d951
19. Maguen S, Ren L, Bosch JO, Marmar CR, Seal KH. Gender differences in mental health diagnoses among Iraq and Afghanistan veterans enrolled in veterans affairs health care. Am J Public Health. 2010;100(12):2450-2456. doi:10.2105/AJPH.2009.166165
20. Outcalt SD, Kroenke K, Krebs EE, et al. Chronic pain and comorbid mental health conditions: independent associations of posttraumatic stress disorder and depression with pain, disability, and quality of life. J Behav Med. 2015;38(3):535-543. doi:10.1007/s10865-015-9628-3
21. Gibson CJ, Maguen S, Xia F, Barnes DE, Peltz CB, Yaffe K. Military sexual trauma in older women veterans: prevalence and comorbidities. J Gen Intern Med. 2020;35(1):207-213. doi:10.1007/s11606-019-05342-7
22. Tan G, Teo I, Srivastava D, et al. Improving access to care for women veterans suffering from chronic pain and depression associated with trauma. Pain Med. 2013;14(7):1010-1020. doi:10.1111/pme.12131
23. Haskell SG, Heapy A, Reid MC, Papas RK, Kerns RD. The prevalence and age-related characteristics of pain in a sample of women veterans receiving primary care. J Womens Health (Larchmt). 2006;15(7):862-869. doi:10.1089/jwh.2006.15.862
24. Driscoll MA, Higgins D, Shamaskin-Garroway A, et al. Examining gender as a correlate of self-reported pain treatment use among recent service veterans with deployment-related musculoskeletal disorders. Pain Med. 2017;18(9):1767-1777. doi:10.1093/pm/pnx023
25. Weimer MB, Macey TA, Nicolaidis C, Dobscha SK, Duckart JP, Morasco BJ. Sex differences in the medical care of VA patients with chronic non-cancer pain. Pain Med. 2013;14(12):1839-1847. doi:10.1111/pme.12177
26. Stubbs D, Krebs E, Bair M, et al. Sex differences in pain and pain-related disability among primary care patients with chronic musculoskeletal pain. Pain Med. 2010;11(2):232-239. doi:10.1111/j.1526-4637.2009.00760.x
27. Keogh E, McCracken LM, Eccleston C. Gender moderates the association between depression and disability in chronic pain patients. Eur J Pain. 2006;10(5):413-422. doi:10.1016/j.ejpain.2005.05.007
28. Miake-Lye IM, Mak S, Lee J, et al. Massage for pain: an evidence map. J Altern Complement Med. 2019;25(5):475-502. doi:10.1089/acm.2018.0282
29. Cherkin DC, Sherman KJ, Kahn J, et al. A comparison of the effects of 2 types of massage and usual care on chronic low back pain: a randomized, controlled trial. Ann Intern Med. 2011;155(1):1-9. doi:10.7326/0003-4819-155-1-201107050-00002
30. Sherman KJ, Cook AJ, Wellman RD, et al. Five-week outcomes from a dosing trial of therapeutic massage for chronic neck pain. Ann Fam Med. 2014;12(2):112-120. doi:10.1370/afm.1602
31. Perlman AI, Sabina A, Williams AL, Njike VY, Katz DL. Massage therapy for osteoarthritis of the knee: a randomized controlled trial. Arch Intern Med. 2006;166(22):2533-2538. doi:10.1001/archinte.166.22.2533
32. Perlman A, Fogerite SG, Glass O, et al. Efficacy and safety of massage for osteoarthritis of the knee: a randomized clinical trial. J Gen Intern Med. 2019;34(3):379-386. doi:10.1007/s11606-018-4763-5
33. Skelly AC, Chou R, Dettori JR, et al. Noninvasive Nonpharmacological Treatment for Chronic Pain: A Systematic Review Update. Comparative Effectiveness Review. No. 227. Agency for Healthcare Research and Quality; 2020. doi:10.23970/AHRQEPCCER227
34. Moyer CA, Rounds J, Hannum JW. A meta-analysis of massage therapy research. Psychol Bull. 2004;130(1):3-18. doi:10.1037/0033-2909.130.1.3
35. Field T, Hernandez-Reif M, Diego M, Schanberg S, Kuhn C. Cortisol decreases and serotonin and dopamine increase following massage therapy. Int J Neurosci. 2005;115(10):1397-1413. doi:10.1080/ 00207450590956459
36. Li Q, Becker B, Wernicke J, et al. Foot massage evokes oxytocin release and activation of orbitofrontal cortex and superior temporal sulcus. Psychoneuroendocrinology. 2019;101:193-203. doi:10.1016/j.psyneuen.2018.11.016
37. Eaves ER, Sherman KJ, Ritenbaugh C, et al. A qualitative study of changes in expectations over time among patients with chronic low back pain seeking four CAM therapies. BMC Complement Altern Med. 2015;15:12. Published 2015 Feb 5. doi:10.1186/s12906-015-0531-9
38. Bishop FL, Lauche R, Cramer H, et al. Health behavior change and complementary medicine use: National Health Interview Survey 2012. Medicina (Kaunas). 2019;55(10):632. Published 2019 Sep 24. doi:10.3390/medicina55100632
39. Driscoll MA, Knobf MT, Higgins DM, Heapy A, Lee A, Haskell S. Patient experiences navigating chronic pain management in an integrated health care system: a qualitative investigation of women and men. Pain Med. 2018;19(suppl 1):S19-S29. doi:10.1093/pm/pny139
40. Denneson LM, Corson K, Dobscha SK. Complementary and alternative medicine use among veterans with chronic noncancer pain. J Rehabil Res Dev. 2011;48(9):1119-1128. doi:10.1682/jrrd.2010.12.0243
41. Taylor SL, Herman PM, Marshall NJ, et al. Use of complementary and integrated health: a retrospective analysis of U.S. veterans with chronic musculoskeletal pain nationally. J Altern Complement Med. 2019;25(1):32-39. doi:10.1089/acm.2018.0276
42. Evans EA, Herman PM, Washington DL, et al. Gender differences in use of complementary and integrative health by U.S. military veterans with chronic musculoskeletal pain. Womens Health Issues. 2018;28(5):379-386. doi:10.1016/j.whi.2018.07.003
43. Reinhard MJ, Nassif TH, Bloeser K, et al. CAM utilization among OEF/OIF veterans: findings from the National Health Study for a New Generation of US Veterans. Med Care. 2014;52(12)(suppl 5):S45-S49. doi:10.1097/MLR.0000000000000229
44. Herman PM, Yuan AH, Cefalu MS, et al. The use of complementary and integrative health approaches for chronic musculoskeletal pain in younger US Veterans: An economic evaluation. PLoS One. 2019;14(6):e0217831. Published 2019 Jun 5. doi:10.1371/journal.pone.0217831
45. Jonas WB, Schoomaker EB. Pain and opioids in the military: we must do better. JAMA Intern Med. 2014;174(8):1402-1403. doi:10.1001/jamainternmed.2014.2114
46. Han B, Compton WM, Blanco C, Crane E, Lee J, Jones CM. Prescription opioid use, misuse, and use disorders in U.S. adults: 2015 National Survey on Drug Use and Health. Ann Intern Med. 2017;167(5):293-301. doi:10.7326/M17-0865
There are approximately 2 million female veterans in the United States, representing about 10% of the veteran population.1 In 2015, 456,000 female veterans used the US Department of Veterans Affairs (VA) health care services. The VA predicts an increase in utilization over the next 20 years.2
Female veterans are more likely to have musculoskeletal disorder multimorbidity compared with male veterans and have higher rates of depressive and bipolar disorders, anxiety, and posttraumatic stress disorder (PTSD).3,4 Compared with male veterans, female veterans are younger, more likely to be unmarried and to have served during the wars in Iraq and Afghanistan.3 Fifty-five percent of women veterans vs 41% of men veterans have a service-connected disability, and a greater percentage of women veterans have a service connection rating > 50%.5 The top service-connected disabilities for women veterans are PTSD, major depressive disorder, migraines, and lumbosacral or cervical strain.2 In addition, one-third of women veterans using VA health care report experiencing military sexual trauma (MST).6 Military service may impact the health of female veterans both physically and mentally. Providing treatments and programs to improve their health and their health care experience are current VA priorities.
The VA is changing the way health care is conceptualized and delivered by implementing a holistic model of care known as Whole Health, which seeks to empower and equip patients to take charge of their health, blending conventional medicine with self-care and complementary and integrative health (CIH) approaches, such as massage therapy, yoga, acupuncture, and meditation.7 CIH therapies can help improve physical and mental health with little to no adverse effects.8-10
As part of the Whole Health initiative at the VA Ann Arbor Healthcare System (VAAAHS) in Michigan, the massage program was expanded in 2017 to offer relaxation massages to female veterans attending the women’s health clinic, which provides gynecologic care. Patients visiting a gynecology clinic often experience anxiety and pain related to invasive procedures and examinations. This is especially true for female veterans who experienced MST.11
VAAAHS has 1 staff massage therapist (MT). To expand the program to the women’s health clinic, volunteer licensed MTs were recruited and trained in specific procedures by the staff MT.
Several studies have demonstrated the effect of therapeutic massage on pain and anxiety in predominantly male veteran study populations, including veterans needing postsurgical and palliative care as well as those experiencing chronic pain and knee osteoarthritis.12-16 Little is known about the effects of massage therapy on female veterans. The purpose of this pilot study was to examine the effects of massage therapy among female veterans participating in the women’s health massage program.
Methods
The setting for this pre-post intervention study was VAAAHS. Veterans were called in advance by clinic staff and scheduled for 60-minute appointments either before or after their clinic appointment, depending on availability. MTs were instructed to provide relaxation massage using Swedish massage techniques with moderate pressure, avoiding deep pressure techniques.
The volunteer MTs gave the participants a survey to provide comments and to rate baseline pain and other symptoms prior to and following the massage. The MT left the room to provide privacy while completing the survey. The staff included the symptom data in the massage note as clinical outcomes and entered them into the electronic health record. Massages were given from October 1, 2017 to June 30, 2018. Data including symptom scores, demographics, the presence of chronic pain, mental health diagnoses, patient comments, and opioid use were abstracted from the electronic health record by 2 members of the study team and entered into an Excel database. This study was approved by the VAAAHS Institutional Review Board.
Study Measures
Pain intensity, pain unpleasantness (the affective component of pain), anxiety, shortness of breath, relaxation, and inner peace were rated pre- and postmassage on a 0 to 10 scale. Shortness of breath was included due to the relationship between breathing and anxiety. Inner peace was assessed to measure the calming effects of massage therapy. Beck and colleagues found the concept of inner peace was an important outcome of massage therapy.17 The scale anchors for pain intensity were “no pain” and “severe pain”; and “not at all unpleasant” and “as unpleasant as it can be” for pain unpleasantness. For anxiety, the anchors were “no anxiety” and “as anxious as I can be.” Anchors for relaxation and inner peace were reversed so that a 0 indicated low relaxation and inner peace while a 10 indicated the highest state of relaxation and inner peace.
Chronic pain was defined as pain existing for > 3 months. A history of chronic pain was determined from a review and synthesis of primary care and specialty care recorded diagnoses, patient concerns, and service-connected disabilities. The diagnoses included lumbosacral or cervical strain, chronic low back, joint (knee, shoulder, hip, ankle), neck, or pelvic pain, fibromyalgia, headache, migraine, osteoarthritis, and myofascial pain syndrome. The presence of mental health conditions, including depression, anxiety, bipolar disorders, and PTSD, were similarly determined by a review of mental health clinical notes. Sex was determined from the gynecology note.
Statistical Analysis
Means and medians were calculated for short-term changes in symptom scores. Due to skewness in the short-term changes, significance was tested using a nonparametric sign test. Significance was adjusted using the Bonferroni correction to protect the overall type I error level at 5% from multiple testing. We also assessed for differences in symptom changes in 4 subgroups, using an unadjusted general linear model: those with (1) chronic pain vs without; (2) an anxiety diagnosis vs without; (3) depression vs without; and (4) a PTSD diagnosis vs without. Data were analyzed using SPSS 25 and SAS 9.4.
Results
Results are based on the first massage received by 96 unique individuals (Table 1). Fifty-one (53%) patients were aged 21 to 40 years, and 45 (47%) were aged ≥ 41 years. Most participants (80%) had had a previous massage. Seven (7%) participants were currently on prescription opioids; 76 (79%) participants had a history of one or more chronic pain diagnoses (eg, back pain, migraine headaches, fibromyalgia) and 78 (81%) had a history of a mental health diagnosis (eg, depression, anxiety, PTSD). Massage sessions ranged from 30 to 60 minutes; most patients received massage therapy for 50 minutes.
Prior to massage, mean scores were 3.9 pain intensity, 3.7 pain unpleasantness, 3.8 anxiety, 1.0 shortness of breath, 4.0 relaxation, and 4.2 inner peace. Short-term changes in symptom scores are shown in Table 2. The mean score for pain intensity decreased by 1.9 points, pain unpleasantness by 2.0 points, anxiety by 2.4 points. The greatest change occurred for relaxation, which increased by 4.3 points. All changes in symptoms were statistically significant (P < .001). For subgroup comparisons
Verbal feedback and written comments about the massage experience were all favorable: No adverse events were reported.
Discussion
Massage therapy may be a useful treatment for female veterans experiencing chronic pain, anxiety disorders, depression, or situational anxiety related to gynecologic procedures. After receiving a relaxation massage, female veterans reported decreased pain intensity, pain unpleasantness, and anxiety while reporting increased relaxation and feelings of inner peace. The effects of massage were consistent for all the symptoms or characteristics assessed, suggesting that massage may act on the body in multiple ways.
These changes parallel those seen in a palliative care population primarily composed of male veterans.14 However, the female veterans in this cohort experienced greater changes in relaxation and feelings of inner peace, which may be partly due to relief of tension related to an upcoming stressful appointment. The large mean decrease in anxiety level among female veterans with PTSD is notable as well as the larger increase in inner peace in those with chronic pain.
Many patients expressed their gratitude for the massage and interest in having access to more massage therapy. Female patients who have experienced sexual trauma or other trauma may especially benefit from massage prior to painful, invasive gynecologic procedures. Anecdotally, 2 nurse chaperones in the clinic mentioned separately to the massage program supervisor that the massages helped some very anxious women better tolerate an invasive procedure that would have been otherwise extremely difficult.
Female veterans are more likely to have musculoskeletal issues after deployment and have higher rates of anxiety, PTSD, and depression compared with those of male veterans.3,4,18,19 Determining relationships between and causes of chronic pain, depression, and PTSD is very challenging but the increased prevalence of chronic pain and comorbid mental health conditions in female veterans may be partially related to MST or other trauma experiences.20-22 Female veterans are most likely to have more than one source of chronic pain.23-25 Female patients with chronic musculoskeletal pain report more pain-related disability.26 Furthermore, greater disability in the context of depression is reported by women with pain compared with those of men.27 Most (78%) female veterans in a primary care population reported chronic pain.23 Similarly, 79% of the female veterans in this study population had chronic pain and 81% had a history of mental health disorders, including depression, anxiety, and PTSD.
Studies have shown that massage therapy improves pain in populations experiencing chronic low back, neck, and knee pain.28-32 A 2020 Agency for Healthcare Research and Quality review determined there is some evidence that massage therapy is helpful for chronic low back and neck pain and fibromyalgia.33 Research also has demonstrated that massage reduces anxiety and depression in several different population types.13,34,35 Li and colleagues showed that foot massage increased oxytocin levels in healthy males.36 Although further research is needed to determine the mechanisms of massage therapy, there are important physiologic effects. Unlike most medications, massage therapy is unique in that it can impact health and well-being through multiple mechanisms; for example, by reducing pain, improving mood, providing a sense of social connection and/or improving mobility.
Patients using CIH therapies report greater awareness of the need for ongoing engagement in their own care and health behavior changes.37,38
Driscoll and colleagues reported that women veterans are interested in conservative treatment for their chronic musculoskeletal pain and are open to using CIH therapies.39 Research suggests that veterans are interested in and, in some cases, already using massage therapy.23,40-43 Access to massage therapy and other CIH therapies offers patients choice and control over the types and timing of therapy they receive, exemplified by the 80% of patients in our study who previously received a massage and sought another before a potentially stressful situation.
Access to massage therapy or other CIH therapies may reduce the need for more expensive procedures. Although research on the cost-effectiveness of massage therapy is limited, Herman and colleagues did an economic evaluation of CIH therapies in a veteran population, finding that CIH users had lower annual health care costs and lower pain in the year after CIH started. Sensitivity analyses indicated similar results for acupuncture, chiropractic care, and massage but higher costs for those with 8 or more visits.44
The prevalence of comorbid mental health conditions with MSD suggests that female veterans may benefit from multidisciplinary treatment of pain and depression.3,26 Women-centered programs would be both encouraging and validating to women.39 Massage therapy can be combined with physical therapy, yoga, tai chi, and meditation programs to improve pain, anxiety, strength, and flexibility and can be incorporated into a multimodal treatment plan. Likewise, other subpopulations of female veterans with chronic pain, mental health conditions, or cancer could be targeted with multidisciplinary programs that include massage therapy.
Limitations
This study has several limitations including lack of a control group, a self-selected population, the lack of objective biochemical measurements, and possible respondent bias to please the MTs. Eighty percent had previously experienced massage therapy and may have been biased toward the effects of massage before receiving the intervention. The first report of the effects of massage therapy in an exclusively female veteran population is a major strength of this study.
Further research including randomized controlled trials is needed, especially in populations with coexisting chronic pain and mental health disorders, as is exploring the acceptability of massage therapy for female veterans with MST. Finding viable alternatives to medications has become even more important as the nation addresses the challenge of the opioid crisis.45,46
Conclusions
Female veterans are increasingly seeking VA health care.
Acknowledgments
The authors express our gratitude to the Women Veteran Program Manager, Cheryl Allen, RN; Massage Therapists Denise McGee and Kimberly Morro; Dara Ganoczy, MPH, for help with statistical analysis; and Mark Hausman, MD, for leadership support.
1. US Department of Veteran Affairs, National Center for Veterans Analysis and Statistics. Veteran population. Updated April 14, 2021. Accessed January 6, 2022. https://www.va.gov/vetdata/veteran_population.asp
2. US Department of Veteran Affairs. Women veterans report: the past, present, and future of women veterans. Published February 2017. Accessed January 6, 2022. https://www.va.gov/vetdata/docs/specialreports/women_veterans_2015_final.pdf
3. Higgins DM, Fenton BT, Driscoll MA, et al. Gender differences in demographic and clinical correlates among veterans with musculoskeletal disorders. Womens Health Issues. 2017;27(4):463-470. doi:10.1016/j.whi.2017.01.008
4. Lehavot K, Goldberg SB, Chen JA, et al. Do trauma type, stressful life events, and social support explain women veterans’ high prevalence of PTSD?. Soc Psychiatry Psychiatr Epidemiol. 2018;53(9):943-953. doi:10.1007/s00127-018-1550-x
5. Levander XA, Overland MK. Care of women veterans. Med Clin North Am. 2015;99(3):651-662. doi:10.1016/j.mcna.2015.01.013
6. US Department of Veteran Affairs. Facts and statistics about women veterans. Updated May 28. 2020. Accessed January 6, 2022. https://www.womenshealth.va.gov/womenshealth/latestinformation/facts.asp
7. Krejci LP, Carter K, Gaudet T. Whole health: the vision and implementation of personalized, proactive, patient-driven health care for veterans. Med Care. 2014;52(12)(suppl 5):S5-S8. doi:10.1097/MLR.0000000000000226
8. Elwy AR, Taylor SL, Zhao S, et al. Participating in complementary and integrative health approaches is associated with veterans’ patient-reported outcomes over time. Med Care. 2020;58:S125-S132. doi:10.1097/MLR.0000000000001357
9. Smeeding SJ, Bradshaw DH, Kumpfer K, Trevithick S, Stoddard GJ. Outcome evaluation of the Veterans Affairs Salt Lake City Integrative Health Clinic for chronic pain and stress-related depression, anxiety, and post-traumatic stress disorder. J Altern Complement Med. 2010;16(8):823-835. doi:10.1089/acm.2009.0510
10. Hull A, Brooks Holliday S, Eickhoff C, et al. Veteran participation in the integrative health and wellness program: impact on self-reported mental and physical health outcomes. Psychol Serv. 2019;16(3):475-483. doi:10.1037/ser0000192
11. Zephyrin LC. Reproductive health management for the care of women veterans [published correction appears in Obstet Gynecol. 2016 Mar;127(3):605]. Obstet Gynecol. 2016;127(2):383-392. doi:10.1097/AOG.0000000000001252
12. Piotrowski MM, Paterson C, Mitchinson A, Kim HM, Kirsh M, Hinshaw DB. Massage as adjuvant therapy in the management of acute postoperative pain: a preliminary study in men. J Am Coll Surg. 2003;197(6):1037-1046. doi:10.1016/j.jamcollsurg.2003.07.020
13. Mitchinson AR, Kim HM, Rosenberg JM, et al. Acute postoperative pain management using massage as an adjuvant therapy: a randomized trial. Arch Surg. 2007;142(12):1158-1167. doi:10.1001/archsurg.142.12.1158
14. Mitchinson A, Fletcher CE, Kim HM, Montagnini M, Hinshaw DB. Integrating massage therapy within the palliative care of veterans with advanced illnesses: an outcome study. Am J Hosp Palliat Care. 2014;31(1):6-12. doi:10.1177/1049909113476568
15. Fletcher CE, Mitchinson AR, Trumble EL, Hinshaw DB, Dusek JA. Perceptions of other integrative health therapies by veterans with pain who are receiving massage. J Rehabil Res Dev. 2016;53(1):117-126. doi:10.1682/JRRD.2015.01.0015
16. Juberg M, Jerger KK, Allen KD, Dmitrieva NO, Keever T, Perlman AI. Pilot study of massage in veterans with knee osteoarthritis. J Altern Complement Med. 2015;21(6):333-338. doi:10.1089/acm.2014.0254
17. Beck I, Runeson I, Blomqvist K. To find inner peace: soft massage as an established and integrated part of palliative care. Int J Palliate Nurse. 2009;15(11):541-545. doi: 10.12968/ijpn.2009.15.11.45493
18. Haskell SG, Ning Y, Krebs E, et al. Prevalence of painful musculoskeletal conditions in female and male veterans in 7 years after return from deployment in Operation Enduring Freedom/Operation Iraqi Freedom. Clin J Pain. 2012;28(2):163-167. doi:10.1097/AJP.0b013e318223d951
19. Maguen S, Ren L, Bosch JO, Marmar CR, Seal KH. Gender differences in mental health diagnoses among Iraq and Afghanistan veterans enrolled in veterans affairs health care. Am J Public Health. 2010;100(12):2450-2456. doi:10.2105/AJPH.2009.166165
20. Outcalt SD, Kroenke K, Krebs EE, et al. Chronic pain and comorbid mental health conditions: independent associations of posttraumatic stress disorder and depression with pain, disability, and quality of life. J Behav Med. 2015;38(3):535-543. doi:10.1007/s10865-015-9628-3
21. Gibson CJ, Maguen S, Xia F, Barnes DE, Peltz CB, Yaffe K. Military sexual trauma in older women veterans: prevalence and comorbidities. J Gen Intern Med. 2020;35(1):207-213. doi:10.1007/s11606-019-05342-7
22. Tan G, Teo I, Srivastava D, et al. Improving access to care for women veterans suffering from chronic pain and depression associated with trauma. Pain Med. 2013;14(7):1010-1020. doi:10.1111/pme.12131
23. Haskell SG, Heapy A, Reid MC, Papas RK, Kerns RD. The prevalence and age-related characteristics of pain in a sample of women veterans receiving primary care. J Womens Health (Larchmt). 2006;15(7):862-869. doi:10.1089/jwh.2006.15.862
24. Driscoll MA, Higgins D, Shamaskin-Garroway A, et al. Examining gender as a correlate of self-reported pain treatment use among recent service veterans with deployment-related musculoskeletal disorders. Pain Med. 2017;18(9):1767-1777. doi:10.1093/pm/pnx023
25. Weimer MB, Macey TA, Nicolaidis C, Dobscha SK, Duckart JP, Morasco BJ. Sex differences in the medical care of VA patients with chronic non-cancer pain. Pain Med. 2013;14(12):1839-1847. doi:10.1111/pme.12177
26. Stubbs D, Krebs E, Bair M, et al. Sex differences in pain and pain-related disability among primary care patients with chronic musculoskeletal pain. Pain Med. 2010;11(2):232-239. doi:10.1111/j.1526-4637.2009.00760.x
27. Keogh E, McCracken LM, Eccleston C. Gender moderates the association between depression and disability in chronic pain patients. Eur J Pain. 2006;10(5):413-422. doi:10.1016/j.ejpain.2005.05.007
28. Miake-Lye IM, Mak S, Lee J, et al. Massage for pain: an evidence map. J Altern Complement Med. 2019;25(5):475-502. doi:10.1089/acm.2018.0282
29. Cherkin DC, Sherman KJ, Kahn J, et al. A comparison of the effects of 2 types of massage and usual care on chronic low back pain: a randomized, controlled trial. Ann Intern Med. 2011;155(1):1-9. doi:10.7326/0003-4819-155-1-201107050-00002
30. Sherman KJ, Cook AJ, Wellman RD, et al. Five-week outcomes from a dosing trial of therapeutic massage for chronic neck pain. Ann Fam Med. 2014;12(2):112-120. doi:10.1370/afm.1602
31. Perlman AI, Sabina A, Williams AL, Njike VY, Katz DL. Massage therapy for osteoarthritis of the knee: a randomized controlled trial. Arch Intern Med. 2006;166(22):2533-2538. doi:10.1001/archinte.166.22.2533
32. Perlman A, Fogerite SG, Glass O, et al. Efficacy and safety of massage for osteoarthritis of the knee: a randomized clinical trial. J Gen Intern Med. 2019;34(3):379-386. doi:10.1007/s11606-018-4763-5
33. Skelly AC, Chou R, Dettori JR, et al. Noninvasive Nonpharmacological Treatment for Chronic Pain: A Systematic Review Update. Comparative Effectiveness Review. No. 227. Agency for Healthcare Research and Quality; 2020. doi:10.23970/AHRQEPCCER227
34. Moyer CA, Rounds J, Hannum JW. A meta-analysis of massage therapy research. Psychol Bull. 2004;130(1):3-18. doi:10.1037/0033-2909.130.1.3
35. Field T, Hernandez-Reif M, Diego M, Schanberg S, Kuhn C. Cortisol decreases and serotonin and dopamine increase following massage therapy. Int J Neurosci. 2005;115(10):1397-1413. doi:10.1080/ 00207450590956459
36. Li Q, Becker B, Wernicke J, et al. Foot massage evokes oxytocin release and activation of orbitofrontal cortex and superior temporal sulcus. Psychoneuroendocrinology. 2019;101:193-203. doi:10.1016/j.psyneuen.2018.11.016
37. Eaves ER, Sherman KJ, Ritenbaugh C, et al. A qualitative study of changes in expectations over time among patients with chronic low back pain seeking four CAM therapies. BMC Complement Altern Med. 2015;15:12. Published 2015 Feb 5. doi:10.1186/s12906-015-0531-9
38. Bishop FL, Lauche R, Cramer H, et al. Health behavior change and complementary medicine use: National Health Interview Survey 2012. Medicina (Kaunas). 2019;55(10):632. Published 2019 Sep 24. doi:10.3390/medicina55100632
39. Driscoll MA, Knobf MT, Higgins DM, Heapy A, Lee A, Haskell S. Patient experiences navigating chronic pain management in an integrated health care system: a qualitative investigation of women and men. Pain Med. 2018;19(suppl 1):S19-S29. doi:10.1093/pm/pny139
40. Denneson LM, Corson K, Dobscha SK. Complementary and alternative medicine use among veterans with chronic noncancer pain. J Rehabil Res Dev. 2011;48(9):1119-1128. doi:10.1682/jrrd.2010.12.0243
41. Taylor SL, Herman PM, Marshall NJ, et al. Use of complementary and integrated health: a retrospective analysis of U.S. veterans with chronic musculoskeletal pain nationally. J Altern Complement Med. 2019;25(1):32-39. doi:10.1089/acm.2018.0276
42. Evans EA, Herman PM, Washington DL, et al. Gender differences in use of complementary and integrative health by U.S. military veterans with chronic musculoskeletal pain. Womens Health Issues. 2018;28(5):379-386. doi:10.1016/j.whi.2018.07.003
43. Reinhard MJ, Nassif TH, Bloeser K, et al. CAM utilization among OEF/OIF veterans: findings from the National Health Study for a New Generation of US Veterans. Med Care. 2014;52(12)(suppl 5):S45-S49. doi:10.1097/MLR.0000000000000229
44. Herman PM, Yuan AH, Cefalu MS, et al. The use of complementary and integrative health approaches for chronic musculoskeletal pain in younger US Veterans: An economic evaluation. PLoS One. 2019;14(6):e0217831. Published 2019 Jun 5. doi:10.1371/journal.pone.0217831
45. Jonas WB, Schoomaker EB. Pain and opioids in the military: we must do better. JAMA Intern Med. 2014;174(8):1402-1403. doi:10.1001/jamainternmed.2014.2114
46. Han B, Compton WM, Blanco C, Crane E, Lee J, Jones CM. Prescription opioid use, misuse, and use disorders in U.S. adults: 2015 National Survey on Drug Use and Health. Ann Intern Med. 2017;167(5):293-301. doi:10.7326/M17-0865
PTSD Disability Examination Reports: A Comparison of Veterans Health Administration and Contract Examiners
Updated June 17, 2022
The US Department of Veterans Affairs (VA) provides health care for > 9 million military veterans, nearly half of all former service members.1 Over the past 15 years, there has been a steady and substantial increase in the frequency of disability awards for veterans with post-9/11 military service. Recent data from the Bureau of Labor Statistics indicate that 41% of veterans who served after 9/11 receive service-connected disability benefits compared with 28% of veterans overall.2 More than 5 million veterans receive VA service-related disability benefits.2,3 More than half of the VA $243 billion budget for fiscal year (FY) 2021 ($135.5 billion) was allocated to the Veterans Benefits Administration (VBA), of which $115.7 billion (85%) was allocated specifically for service-related compensation claims payments.4
The VA predicted that VBA will have completed 1.4 million ratings for disability claims in 2021.5 A substantial percentage of these claims will be for mental disorders, specifically posttraumatic stress disorder (PTSD). VA officials testifying before Congress in 2017 noted that the number of PTSD claims had nearly tripled in the previous 10 years.6 As far back as 2013, McNally and Frueh analyzed “the skyrocketing of disability claims,” particularly for PTSD, among veterans who served in Iraq and Afghanistan.7
This large increase has placed an unprecedented burden on the VBA to expand its capacity to conduct initial PTSD disability evaluations that by regulations are completed by psychologists or psychiatrists. This need has led the VBA to make significant changes in the compensation and pension (C&P) process, including a reduced role for Veterans Health Administration (VHA) examiners and increased reliance on non-VA (contract) examiners through the Contract Medical Disability Examination (MDE) program. In 2019, the MDE budget was $1.23 billion; in 2020, it was increased to $1.79 billion, and for 2021, it was $2.23 billion, reflecting the increasing investment of resources in non-VA examiners, ostensibly to both increase capacity and save costs.5
Anecdotally, concerns have been raised regarding inadequate training of contract examiners as well as inadequate reports by these examiners. A 2018 Government Accountability Office (GAO) report concluded that VA lacked the data to determine whether contract examiners were meeting standards for quality, timeliness, and accuracy.8 The GAO report noted that VA required 92% of contractor reports contained no obvious errors, a relatively low target; however, in the first half of 2017, only 1 contractor group met that target. The report noted further that “VBA does not verify if examiners have completed training nor does it collect information to assess training effectiveness in preparing examiners.”8 A subsequent analysis of contract examinations completed by the VA Office of the Inspector General (OIG) in 2019 concluded that the MDE program was “hampered in their ability to provide oversight because of limitations with VBA’s electronic examination management systems, the lack of reliable data, and inadequate staffing of the program.”9
These reports have focused almost exclusively on simple performance metrics, such as timeliness of examination completion. However, the 2018 GAO report referenced isolated “focused reviews” of complaints about the quality of examinations by contract examiners and gave as an example an isolated “review of one contracted examiner who had high rates of diagnosing severe posttraumatic stress disorder.”8 After review indicated the examiner’s reports were of poor quality, the VBA discontinued the examiner’s contract.
Unfortunately, despite such anecdotal reports and isolated actions, to date there are no published reports examining and comparing the quality of PTSD examination reports completed by VHA and contract examiners or the subsequent disability determinations made by the VBA as a result of these evaluations. In a November 2020 letter to the VA Secretary, 11 US Senators expressed “grave concerns” regarding the VA decision to privatize C&P programs noting, among other concerns, that there were “no clinical quality measurement for, or evaluation of, contractor examinations.”10 The letter cited anecdotal evidence of contract examiners not reviewing veteran’s medical records and diagnosing conditions “without supporting evidence.”10
The purpose of the present evaluation was to provide a systematic comparison of the content and quality of initial PTSD disability examinations conducted by VHA and non-VA contract examiners. In addition, this study compared the disability rating decisions resulting from VHA and contract examinations.
Methods
A random sample of 100 Initial PTSD Disability Benefits Questionnaires (DBQs)—structured forms completed by all examiners—were obtained from a list supplied by the VA Office of Performance Analysis and Integrity. All examinations were from the Veterans Integrated Service Network (VISN) 1, encompassing the New England region and were conducted in 2019 and 2020. Two of the 100 cases were excluded for technical reasons, resulting in 98 examination reports. However, the final pool yielded 62 contract examinations and only 36 VHA examinations. To make the sample sizes more comparable, an additional 15 examinations were randomly selected from the local examination database (also VISN 1) to complement the original examination pool.
Once DBQs were retrieved, all identifying information was deleted, and cases were analyzed using assigned record numbers. All coding was completed by the 2 principal investigators, both VA psychologists with extensive training and experience in C&P evaluation and treatment of veterans with PTSD. Due to inherent structural differences between the forms used for VA and contract examinations, raters could not be masked/blinded to the source of the report.
A number of measures were taken to reduce bias and enhance objectivity of rating. First, objectively coded variables (eg, age and sex of veteran, period of service, trauma type, diagnoses rendered by the examiner, impairment category endorsed, number and type of symptoms) were transcribed directly from the DBQ as recorded by the examiner. Second, to rate report quality, an initial categorical rating scale was developed based on predetermined elements of examination quality that were considered essential. After refinement and preliminary analysis of interrater reliabilities, 3 quality-related indices were identified: (1) level of detail in description of key content areas (history before service, service trauma, after service social and vocational history, mental health history, substance use); (2) synthesis of history and findings in explaining opinion rendered; and (3) clarity of opinion regarding causation required “at least as likely as not” degree of confidence. The first 2 quality ratings were based on a 3-point scale (poor, fair, good), and the third variable was coded as yes or no. (eAppendix available at doi:10.12788/fp.0225). Interrater reliabilities calculated based on a subsample of 18 cases, randomly selected and rated by both raters, yielded Cohen κ in the acceptable range (.61, .72, and .89 for detail, synthesis, and clarity, respectively). Finally, for information regarding VBA decision making, rating decision documents contained in the Veterans Benefit Management System database were reviewed to determine whether the veteran was granted service connection for PTSD or another mental disorder based on the examination report in question and, if so, the disability rating percentage awarded. These were recorded independently after all other coding had been completed.
Results
Comparison of VHA and contract examinations revealed no significant differences between groups on relevant sociodemographic and other measures (Table). Missing data were not obtained from other records or sources, and for this study, reflect only what is recorded in the examination reports except for age, which was calculated using veteran’s date of birth and the date of examination.
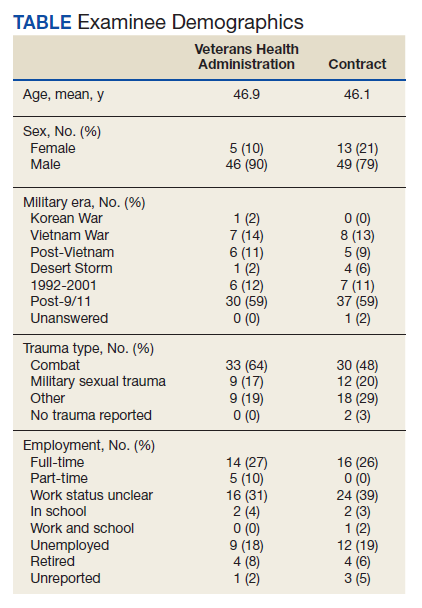
To examine differences between VHA and contract examinations, the groups were first compared on a set of predetermined objectively coded variables taken directly from the DBQ. The frequency of PTSD diagnoses by VHA (57%) and contract (71%) examiners was not significantly different nor were rates of non-PTSD diagnoses by VHA (51%) and contract (73%) examiners. There also was no difference in the mean number of PTSD symptoms endorsed across PTSD diagnostic criteria B, C, D, and E (maximum of 20) recorded by VHA (9.4) and contract (10.9) examiners.
Contract examiners recorded a significantly greater mean number of “other symptoms” on a checklist of 31 possible symptoms as compared to VHA examiners: 7.3 vs 5.8, respectively (t[104] = 2.27, P < .05). An initial analysis of overall social/vocational impairment ratings coded by examiners did not reveal significant differences between examiner groups. However, when the 2 most severe impairment categories were combined to create a pooled “severe” category, 31% of contract examiners rated veterans as severely impaired compared with only 12% of VHA examiners (χ2 = 5.79, 1 df, P < .05) (Figure 1).
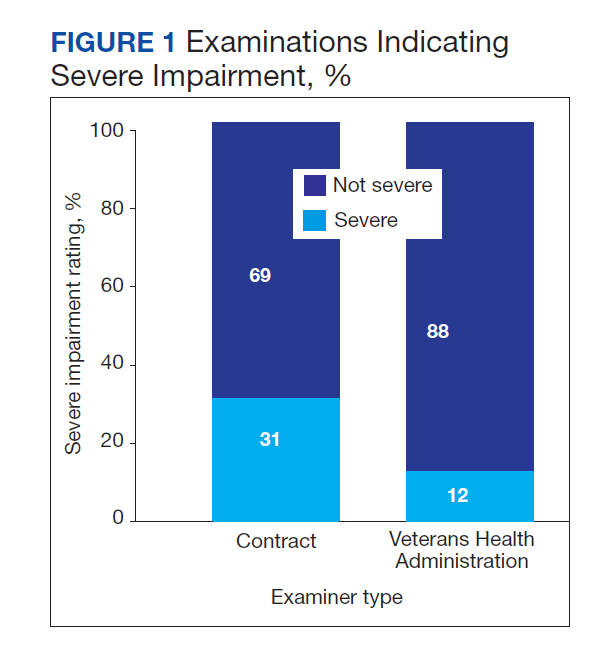
VHA and contract examinations were compared on 3 measures of report quality. Significant differences were found for both level of detail (χ2 = 16.44, 2 df, P < .01) and synthesis (χ2 = 6.68, 2 df, P < .05). Contract examinations were more likely to be rated as poor and less likely to be rated good, with a similar proportion of fair ratings for the 2 examination types (Figures 2 and 3). There was no significant difference in the proportion of VHA and contract examinations providing clear statement of opinion regarding causation (ie, whether or not the diagnosed condition was service related), with the majority rendering an adequate opinion in both examiner groups (VHA, 78%; contract, 79%).
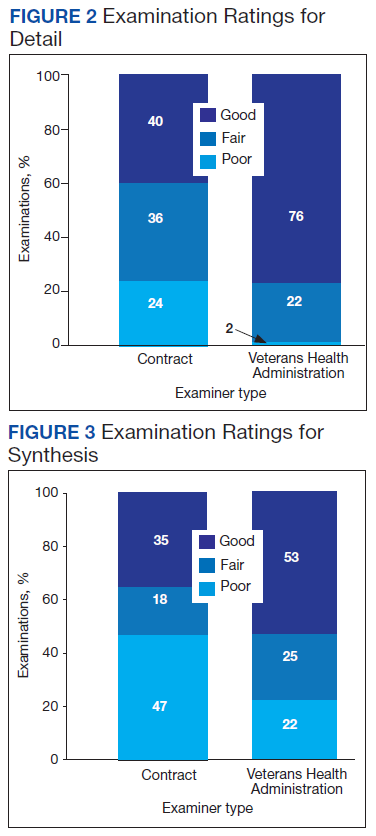
Qualitative review revealed examples of markedly deficient examinations among contract examinations, including several reports that contained no review of records, no report of relevant background, and no mention or assessment of social and vocational function needed to inform opinions about diagnosis and impairment.
Finally, the VBA database was used to compare the resulting disability award decisions made by VBA based on the examination reports in question. Examination by contractors resulted in significantly higher mean service-connected disability ratings for examinees compared with VHA examiners (46.8 vs 33.5, respectively; t[108] = 2.3, P < .05).
Discussion
The present study provides the first reported systematic comparison of VA disability examinations for PTSD completed by examiners employed by the VHA and those hired as contract examiners through the MDE program. Although the frequency of PTSD diagnoses by contract examiners was higher than that of VHA examiners (71% vs 57%, respectively), the difference was not statistically significant. However, contract examiners recorded significantly more symptoms for examinees and rated them as severely impaired more frequently than did their VHA counterparts. In keeping with rating guidelines used by the VBA, these differences in examination content resulted in higher disability ratings for veterans seen by contract examiners.
Along with these elevated reports in symptom and severity ratings, contract examiners were less likely to provide adequate detail in the narrative sections of their reports and less frequently provided a satisfactory explanation and synthesis of relevant history and findings in support of their conclusions. Although not reflected in the statistical analysis, case-by-case review revealed some startlingly inadequate examination reports by contract examiners, several of which contained no review of records, no report or discussion of relevant background, and no discussion or analysis of social and vocational function to inform and support their opinion about level of impairment. None of the VHA examination reports reviewed lacked information to that degree.
Such deficiencies in detail and synthesis run counter to accepted guidelines for the adequate assessment of psychological injury in general and in VA disability claims specifically.11,12 For example, Watson and colleagues proposed that a minimum of 3 hours was required to conduct an initial PTSD examination, with more complex cases possibly taking longer.11 There is no information available about how long contract examiners take to complete their examinations and how that compares with the time taken by VA examiners. The VBA failure to monitor whether or not examiners follow accepted guidelines for PTSD examination has not previously been evaluated. Historically, a large number of clinicians, researchers, and policy critics have raised concerns about the potential for exaggeration or malingering among VA PTSD disability claimants and have urged the need to adequately assess for unreliable reporting and presentation.13,14 However, the possibility of systematic examiner deficiency and/or bias increasing the frequency of false or inflated claims being approved has received little empirical attention.
Although contract examiners did not diagnose PTSD significantly more frequently than VHA examiners (71% vs 57%, respectively), the overall frequency of PTSD diagnosis across both groups (65%) was substantially higher than previous figures that have, on average, estimated the lifetime prevalence of PTSD in trauma-exposed veterans to be about 31%.15 A re-analysis of the same National Vietnam Veterans Readjustment Survey data, but applying more conservative diagnostic criteria, reduced the lifetime prevalence to just under 19%, with point prevalence estimates even lower.15,16
In a study of concordance rates between service connection for PTSD and both current and lifetime diagnosis by independent, structured assessment, Marx and colleagues found that a “significant minority” of veterans who were already receiving service-connected disability for PTSD did not meet lifetime and/or current diagnostic criteria.17 Although it is possible that the group of veterans who were applying for disability benefits in our study had a higher rate of PTSD, it also is possible if not likely that the PTSD examination process overall yields inflated rates of diagnosis and levels of impairment. This speaks to the concern raised by Marx and colleagues who found that veterans with service connection for PTSD who received related benefits “may not have the disorder.”17
Limitations
A methodological limitation of the present study was that, due to structural differences in the DBQ forms used for VHA and contract examinations, the reports could not be de-identified as to examiner type and thus raters could not be masked/blinded. To mitigate bias, a predetermined, piloted, and refined coding and rating plan for report quality metrics was adhered to strictly, and interrater reliabilities were acceptable. Future study is suggested in which all report content is standardized for coding using the same format, which at present would require a complete rewriting of the entire report; this problem could be resolved by having the VBA adopt a more coherent system in which all reports, regardless of examiner type, use a single, standardized template. Further study using larger data sets and expanding to other VA regions also is needed.
Conclusions
The present study suggests that poor examination and report quality—by contract examiners and to a lesser degree VHA examiners—are not uncommon. The findings confirm and extend previous anecdotal reports of deficiencies in PTSD examinations performed by contract examiners and provide empirical support for concerns raised of global deficiencies in the VBA oversight of the MDE program. Such deficiencies have significant implications for the quality and integrity of the VA disability determination process for veterans claiming PTSD related to military service.
The current findings support and strengthen the call for development and management of a structured and enforced training and quality assurance/improvement program for VA PTSD disability examinations. Such training and oversight will be critical to improve the quality and integrity of these examinations, reduce error and waste in VBA’s Compensation and Pension process, and in doing so optimize VA financial resources to best serve veterans’ benefits and health care needs.
1. US Department of Veterans Affairs, Veterans Health Adminstration. About VHA. Updated April 23, 2021. Accessed January 6, 2022. www.va.gov/health/aboutvha.asp
2. US Department of Labor, Bureau of Labor Statistics. News release. Employment situation of veterans—2020. Published March 18, 2020. Accessed January 6, 2022. https://www.bls.gov/news.release/pdf/vet.pdf
3. US Department of Veterans Affairs, National Center for Veterans Analysis and Statistics. Department of Veterans Affairs statistics at a glance. Updated December 31, 2020. Accessed January 6, 2022. https://www.va.gov/vetdata/docs/Quickfacts/Stats_at_a_glance_12_31_20.PDF
4. US Department of Veterans Affairs. FY 2021 Budget submission: budget in brief. Published February 2020. Accessed January 6, 2022. https://www.va.gov/budget/docs/summary/archive/FY-2021-VA-BudgetSubmission.zip
5. US Department of Veterans Affairs. FY 2021 budget submission: benefits and burial programs and Departmental Administration volume 3 of 4:178. Published February 2020. Accessed January 6, 2022. https://www.va.gov/budget/docs/summary/archive/FY-2021-VA-BudgetSubmission.zip
6. Statement of Ronald Burke, assistant deputy under secretary, office of field operations Veterans Benefits Administration before the Subcommittee on Disability And Memorial Affairs of the House Committee on Veterans’ Affairs. Published July 25, 2017. Accessed January 6, 2022. https://www.congress.gov/115/meeting/house/106322/witnesses/HHRG-115-VR09-Wstate-BurkeR-20170725.pdf
7. McNally RJ, Frueh BC. Why are Iraq and Afghanistan War veterans seeking PTSD disability compensation at unprecedented rates? J Anxiety Disord. 2013;27(5):520-526. doi:10.1016/j.janxdis.2013.07.002
8. US Government Accountability Office. VA disability exams: improved performance analysis and training oversight needed for contracted exams. GAO-19-13. Published October 2018. Accessed January 6, 2022. https://www.gao.gov/assets/gao-19-13.pdf
9. US Department of Veterans Affairs, Office of Inspector General. Inadequate oversight of contracted disability exam cancellations. Report #18-04266-115. Published June 10, 2019. Accessed January 6, 2022. https://www.va.gov/oig/pubs/VAOIG-18-04266-115.pdf
10. Letter to VA Secretary Wilkie. Published November 11, 2020. Accessed January 6, 2022. https://www.veterans.senate.gov/download/candp-exam-va-letter
11. Watson PW, McFall M, McBrine C, Schnurr PP, Friedman MJ, Keane TM, Hamblen JL (2005). Best practice manual for posttraumatic stress disorder (PTSD) compensation and pension examinations. Portland, OR: Northwest Network Mental Illness Research, Education, and Clinical Center, VA Puget Sound Healthcare System.
12. Worthen MD, Moering RG. A practical guide to conducting VA compensation and pension exams for PTSD and other mental disorders. Psychol Inj and Law. 2011;4:187-216. doi:10.1007/s12207-011-9115-2
13. DeViva JC, Bloem WD. Symptom exaggeration and compensation seeking among combat veterans with posttraumatic stress disorder. J Trauma Stress. 2003;16(5):503-507. doi:10.1023/A:1025766713188
14. Ray CL. Feigning screeners in VA PTSD compensation and pension examinations. Psychol Inj and Law. 2014;7:370-387. doi:10.1007/s12207-014-9210-2
15. Kulka RA, Schlenger WE, Fairbank JA, et al. Trauma and the Vietnam War Generation: Report of Findings From the National Vietnam Veterans Readjustment Study. Brunner Mazel Publishers; 1990.
16. Dohrenwend BP, Turner JB, Turse NA, Adams BG, Koenen KC, Marshall R. The psychological risks of Vietnam for U.S. veterans: a revisit with new data and methods. Science. 2006;313(5789):979-982. doi:10.1126/science.1128944
17. Marx BP, Bovin MJ, Szafranski DD, et al. Validity of posttraumatic stress disorder service connection status in Veterans Affairs electronic records of Iraq and Afghanistan Veterans. J Clin Psychiatry. 2016;77(4):517-522. doi:10.4088/JCP.14m09666
Updated June 17, 2022
The US Department of Veterans Affairs (VA) provides health care for > 9 million military veterans, nearly half of all former service members.1 Over the past 15 years, there has been a steady and substantial increase in the frequency of disability awards for veterans with post-9/11 military service. Recent data from the Bureau of Labor Statistics indicate that 41% of veterans who served after 9/11 receive service-connected disability benefits compared with 28% of veterans overall.2 More than 5 million veterans receive VA service-related disability benefits.2,3 More than half of the VA $243 billion budget for fiscal year (FY) 2021 ($135.5 billion) was allocated to the Veterans Benefits Administration (VBA), of which $115.7 billion (85%) was allocated specifically for service-related compensation claims payments.4
The VA predicted that VBA will have completed 1.4 million ratings for disability claims in 2021.5 A substantial percentage of these claims will be for mental disorders, specifically posttraumatic stress disorder (PTSD). VA officials testifying before Congress in 2017 noted that the number of PTSD claims had nearly tripled in the previous 10 years.6 As far back as 2013, McNally and Frueh analyzed “the skyrocketing of disability claims,” particularly for PTSD, among veterans who served in Iraq and Afghanistan.7
This large increase has placed an unprecedented burden on the VBA to expand its capacity to conduct initial PTSD disability evaluations that by regulations are completed by psychologists or psychiatrists. This need has led the VBA to make significant changes in the compensation and pension (C&P) process, including a reduced role for Veterans Health Administration (VHA) examiners and increased reliance on non-VA (contract) examiners through the Contract Medical Disability Examination (MDE) program. In 2019, the MDE budget was $1.23 billion; in 2020, it was increased to $1.79 billion, and for 2021, it was $2.23 billion, reflecting the increasing investment of resources in non-VA examiners, ostensibly to both increase capacity and save costs.5
Anecdotally, concerns have been raised regarding inadequate training of contract examiners as well as inadequate reports by these examiners. A 2018 Government Accountability Office (GAO) report concluded that VA lacked the data to determine whether contract examiners were meeting standards for quality, timeliness, and accuracy.8 The GAO report noted that VA required 92% of contractor reports contained no obvious errors, a relatively low target; however, in the first half of 2017, only 1 contractor group met that target. The report noted further that “VBA does not verify if examiners have completed training nor does it collect information to assess training effectiveness in preparing examiners.”8 A subsequent analysis of contract examinations completed by the VA Office of the Inspector General (OIG) in 2019 concluded that the MDE program was “hampered in their ability to provide oversight because of limitations with VBA’s electronic examination management systems, the lack of reliable data, and inadequate staffing of the program.”9
These reports have focused almost exclusively on simple performance metrics, such as timeliness of examination completion. However, the 2018 GAO report referenced isolated “focused reviews” of complaints about the quality of examinations by contract examiners and gave as an example an isolated “review of one contracted examiner who had high rates of diagnosing severe posttraumatic stress disorder.”8 After review indicated the examiner’s reports were of poor quality, the VBA discontinued the examiner’s contract.
Unfortunately, despite such anecdotal reports and isolated actions, to date there are no published reports examining and comparing the quality of PTSD examination reports completed by VHA and contract examiners or the subsequent disability determinations made by the VBA as a result of these evaluations. In a November 2020 letter to the VA Secretary, 11 US Senators expressed “grave concerns” regarding the VA decision to privatize C&P programs noting, among other concerns, that there were “no clinical quality measurement for, or evaluation of, contractor examinations.”10 The letter cited anecdotal evidence of contract examiners not reviewing veteran’s medical records and diagnosing conditions “without supporting evidence.”10
The purpose of the present evaluation was to provide a systematic comparison of the content and quality of initial PTSD disability examinations conducted by VHA and non-VA contract examiners. In addition, this study compared the disability rating decisions resulting from VHA and contract examinations.
Methods
A random sample of 100 Initial PTSD Disability Benefits Questionnaires (DBQs)—structured forms completed by all examiners—were obtained from a list supplied by the VA Office of Performance Analysis and Integrity. All examinations were from the Veterans Integrated Service Network (VISN) 1, encompassing the New England region and were conducted in 2019 and 2020. Two of the 100 cases were excluded for technical reasons, resulting in 98 examination reports. However, the final pool yielded 62 contract examinations and only 36 VHA examinations. To make the sample sizes more comparable, an additional 15 examinations were randomly selected from the local examination database (also VISN 1) to complement the original examination pool.
Once DBQs were retrieved, all identifying information was deleted, and cases were analyzed using assigned record numbers. All coding was completed by the 2 principal investigators, both VA psychologists with extensive training and experience in C&P evaluation and treatment of veterans with PTSD. Due to inherent structural differences between the forms used for VA and contract examinations, raters could not be masked/blinded to the source of the report.
A number of measures were taken to reduce bias and enhance objectivity of rating. First, objectively coded variables (eg, age and sex of veteran, period of service, trauma type, diagnoses rendered by the examiner, impairment category endorsed, number and type of symptoms) were transcribed directly from the DBQ as recorded by the examiner. Second, to rate report quality, an initial categorical rating scale was developed based on predetermined elements of examination quality that were considered essential. After refinement and preliminary analysis of interrater reliabilities, 3 quality-related indices were identified: (1) level of detail in description of key content areas (history before service, service trauma, after service social and vocational history, mental health history, substance use); (2) synthesis of history and findings in explaining opinion rendered; and (3) clarity of opinion regarding causation required “at least as likely as not” degree of confidence. The first 2 quality ratings were based on a 3-point scale (poor, fair, good), and the third variable was coded as yes or no. (eAppendix available at doi:10.12788/fp.0225). Interrater reliabilities calculated based on a subsample of 18 cases, randomly selected and rated by both raters, yielded Cohen κ in the acceptable range (.61, .72, and .89 for detail, synthesis, and clarity, respectively). Finally, for information regarding VBA decision making, rating decision documents contained in the Veterans Benefit Management System database were reviewed to determine whether the veteran was granted service connection for PTSD or another mental disorder based on the examination report in question and, if so, the disability rating percentage awarded. These were recorded independently after all other coding had been completed.
Results
Comparison of VHA and contract examinations revealed no significant differences between groups on relevant sociodemographic and other measures (Table). Missing data were not obtained from other records or sources, and for this study, reflect only what is recorded in the examination reports except for age, which was calculated using veteran’s date of birth and the date of examination.
To examine differences between VHA and contract examinations, the groups were first compared on a set of predetermined objectively coded variables taken directly from the DBQ. The frequency of PTSD diagnoses by VHA (57%) and contract (71%) examiners was not significantly different nor were rates of non-PTSD diagnoses by VHA (51%) and contract (73%) examiners. There also was no difference in the mean number of PTSD symptoms endorsed across PTSD diagnostic criteria B, C, D, and E (maximum of 20) recorded by VHA (9.4) and contract (10.9) examiners.
Contract examiners recorded a significantly greater mean number of “other symptoms” on a checklist of 31 possible symptoms as compared to VHA examiners: 7.3 vs 5.8, respectively (t[104] = 2.27, P < .05). An initial analysis of overall social/vocational impairment ratings coded by examiners did not reveal significant differences between examiner groups. However, when the 2 most severe impairment categories were combined to create a pooled “severe” category, 31% of contract examiners rated veterans as severely impaired compared with only 12% of VHA examiners (χ2 = 5.79, 1 df, P < .05) (Figure 1).
VHA and contract examinations were compared on 3 measures of report quality. Significant differences were found for both level of detail (χ2 = 16.44, 2 df, P < .01) and synthesis (χ2 = 6.68, 2 df, P < .05). Contract examinations were more likely to be rated as poor and less likely to be rated good, with a similar proportion of fair ratings for the 2 examination types (Figures 2 and 3). There was no significant difference in the proportion of VHA and contract examinations providing clear statement of opinion regarding causation (ie, whether or not the diagnosed condition was service related), with the majority rendering an adequate opinion in both examiner groups (VHA, 78%; contract, 79%).
Qualitative review revealed examples of markedly deficient examinations among contract examinations, including several reports that contained no review of records, no report of relevant background, and no mention or assessment of social and vocational function needed to inform opinions about diagnosis and impairment.
Finally, the VBA database was used to compare the resulting disability award decisions made by VBA based on the examination reports in question. Examination by contractors resulted in significantly higher mean service-connected disability ratings for examinees compared with VHA examiners (46.8 vs 33.5, respectively; t[108] = 2.3, P < .05).
Discussion
The present study provides the first reported systematic comparison of VA disability examinations for PTSD completed by examiners employed by the VHA and those hired as contract examiners through the MDE program. Although the frequency of PTSD diagnoses by contract examiners was higher than that of VHA examiners (71% vs 57%, respectively), the difference was not statistically significant. However, contract examiners recorded significantly more symptoms for examinees and rated them as severely impaired more frequently than did their VHA counterparts. In keeping with rating guidelines used by the VBA, these differences in examination content resulted in higher disability ratings for veterans seen by contract examiners.
Along with these elevated reports in symptom and severity ratings, contract examiners were less likely to provide adequate detail in the narrative sections of their reports and less frequently provided a satisfactory explanation and synthesis of relevant history and findings in support of their conclusions. Although not reflected in the statistical analysis, case-by-case review revealed some startlingly inadequate examination reports by contract examiners, several of which contained no review of records, no report or discussion of relevant background, and no discussion or analysis of social and vocational function to inform and support their opinion about level of impairment. None of the VHA examination reports reviewed lacked information to that degree.
Such deficiencies in detail and synthesis run counter to accepted guidelines for the adequate assessment of psychological injury in general and in VA disability claims specifically.11,12 For example, Watson and colleagues proposed that a minimum of 3 hours was required to conduct an initial PTSD examination, with more complex cases possibly taking longer.11 There is no information available about how long contract examiners take to complete their examinations and how that compares with the time taken by VA examiners. The VBA failure to monitor whether or not examiners follow accepted guidelines for PTSD examination has not previously been evaluated. Historically, a large number of clinicians, researchers, and policy critics have raised concerns about the potential for exaggeration or malingering among VA PTSD disability claimants and have urged the need to adequately assess for unreliable reporting and presentation.13,14 However, the possibility of systematic examiner deficiency and/or bias increasing the frequency of false or inflated claims being approved has received little empirical attention.
Although contract examiners did not diagnose PTSD significantly more frequently than VHA examiners (71% vs 57%, respectively), the overall frequency of PTSD diagnosis across both groups (65%) was substantially higher than previous figures that have, on average, estimated the lifetime prevalence of PTSD in trauma-exposed veterans to be about 31%.15 A re-analysis of the same National Vietnam Veterans Readjustment Survey data, but applying more conservative diagnostic criteria, reduced the lifetime prevalence to just under 19%, with point prevalence estimates even lower.15,16
In a study of concordance rates between service connection for PTSD and both current and lifetime diagnosis by independent, structured assessment, Marx and colleagues found that a “significant minority” of veterans who were already receiving service-connected disability for PTSD did not meet lifetime and/or current diagnostic criteria.17 Although it is possible that the group of veterans who were applying for disability benefits in our study had a higher rate of PTSD, it also is possible if not likely that the PTSD examination process overall yields inflated rates of diagnosis and levels of impairment. This speaks to the concern raised by Marx and colleagues who found that veterans with service connection for PTSD who received related benefits “may not have the disorder.”17
Limitations
A methodological limitation of the present study was that, due to structural differences in the DBQ forms used for VHA and contract examinations, the reports could not be de-identified as to examiner type and thus raters could not be masked/blinded. To mitigate bias, a predetermined, piloted, and refined coding and rating plan for report quality metrics was adhered to strictly, and interrater reliabilities were acceptable. Future study is suggested in which all report content is standardized for coding using the same format, which at present would require a complete rewriting of the entire report; this problem could be resolved by having the VBA adopt a more coherent system in which all reports, regardless of examiner type, use a single, standardized template. Further study using larger data sets and expanding to other VA regions also is needed.
Conclusions
The present study suggests that poor examination and report quality—by contract examiners and to a lesser degree VHA examiners—are not uncommon. The findings confirm and extend previous anecdotal reports of deficiencies in PTSD examinations performed by contract examiners and provide empirical support for concerns raised of global deficiencies in the VBA oversight of the MDE program. Such deficiencies have significant implications for the quality and integrity of the VA disability determination process for veterans claiming PTSD related to military service.
The current findings support and strengthen the call for development and management of a structured and enforced training and quality assurance/improvement program for VA PTSD disability examinations. Such training and oversight will be critical to improve the quality and integrity of these examinations, reduce error and waste in VBA’s Compensation and Pension process, and in doing so optimize VA financial resources to best serve veterans’ benefits and health care needs.
1. US Department of Veterans Affairs, Veterans Health Adminstration. About VHA. Updated April 23, 2021. Accessed January 6, 2022. www.va.gov/health/aboutvha.asp
2. US Department of Labor, Bureau of Labor Statistics. News release. Employment situation of veterans—2020. Published March 18, 2020. Accessed January 6, 2022. https://www.bls.gov/news.release/pdf/vet.pdf
3. US Department of Veterans Affairs, National Center for Veterans Analysis and Statistics. Department of Veterans Affairs statistics at a glance. Updated December 31, 2020. Accessed January 6, 2022. https://www.va.gov/vetdata/docs/Quickfacts/Stats_at_a_glance_12_31_20.PDF
4. US Department of Veterans Affairs. FY 2021 Budget submission: budget in brief. Published February 2020. Accessed January 6, 2022. https://www.va.gov/budget/docs/summary/archive/FY-2021-VA-BudgetSubmission.zip
5. US Department of Veterans Affairs. FY 2021 budget submission: benefits and burial programs and Departmental Administration volume 3 of 4:178. Published February 2020. Accessed January 6, 2022. https://www.va.gov/budget/docs/summary/archive/FY-2021-VA-BudgetSubmission.zip
6. Statement of Ronald Burke, assistant deputy under secretary, office of field operations Veterans Benefits Administration before the Subcommittee on Disability And Memorial Affairs of the House Committee on Veterans’ Affairs. Published July 25, 2017. Accessed January 6, 2022. https://www.congress.gov/115/meeting/house/106322/witnesses/HHRG-115-VR09-Wstate-BurkeR-20170725.pdf
7. McNally RJ, Frueh BC. Why are Iraq and Afghanistan War veterans seeking PTSD disability compensation at unprecedented rates? J Anxiety Disord. 2013;27(5):520-526. doi:10.1016/j.janxdis.2013.07.002
8. US Government Accountability Office. VA disability exams: improved performance analysis and training oversight needed for contracted exams. GAO-19-13. Published October 2018. Accessed January 6, 2022. https://www.gao.gov/assets/gao-19-13.pdf
9. US Department of Veterans Affairs, Office of Inspector General. Inadequate oversight of contracted disability exam cancellations. Report #18-04266-115. Published June 10, 2019. Accessed January 6, 2022. https://www.va.gov/oig/pubs/VAOIG-18-04266-115.pdf
10. Letter to VA Secretary Wilkie. Published November 11, 2020. Accessed January 6, 2022. https://www.veterans.senate.gov/download/candp-exam-va-letter
11. Watson PW, McFall M, McBrine C, Schnurr PP, Friedman MJ, Keane TM, Hamblen JL (2005). Best practice manual for posttraumatic stress disorder (PTSD) compensation and pension examinations. Portland, OR: Northwest Network Mental Illness Research, Education, and Clinical Center, VA Puget Sound Healthcare System.
12. Worthen MD, Moering RG. A practical guide to conducting VA compensation and pension exams for PTSD and other mental disorders. Psychol Inj and Law. 2011;4:187-216. doi:10.1007/s12207-011-9115-2
13. DeViva JC, Bloem WD. Symptom exaggeration and compensation seeking among combat veterans with posttraumatic stress disorder. J Trauma Stress. 2003;16(5):503-507. doi:10.1023/A:1025766713188
14. Ray CL. Feigning screeners in VA PTSD compensation and pension examinations. Psychol Inj and Law. 2014;7:370-387. doi:10.1007/s12207-014-9210-2
15. Kulka RA, Schlenger WE, Fairbank JA, et al. Trauma and the Vietnam War Generation: Report of Findings From the National Vietnam Veterans Readjustment Study. Brunner Mazel Publishers; 1990.
16. Dohrenwend BP, Turner JB, Turse NA, Adams BG, Koenen KC, Marshall R. The psychological risks of Vietnam for U.S. veterans: a revisit with new data and methods. Science. 2006;313(5789):979-982. doi:10.1126/science.1128944
17. Marx BP, Bovin MJ, Szafranski DD, et al. Validity of posttraumatic stress disorder service connection status in Veterans Affairs electronic records of Iraq and Afghanistan Veterans. J Clin Psychiatry. 2016;77(4):517-522. doi:10.4088/JCP.14m09666
The Balance of Truth-Telling and Respect for Confidentiality: The Ethics of Case Reports
Medical case reports are as old as the healing profession itself.1 These ancient medical stories have a modern definition: “A case report is a narrative that describes, for medical, scientific or educational purposes, a medical problem experienced by one or more patients.”2 Case report experts describe the 3-fold purposes of this type of research: as a mainstay of education; a harbinger of emerging illnesses; and an appraiser of new interventions. Case-based education has long been a pillar of health professions education: Nurses, doctors, and allied health professionals are taught and learn through reading and discussing with their teachers and each other about cases of their own patients and of those in the literature.3 Case reports also have helped identify and raise awareness of new diseases and rare conditions, such as HIV.4 Finally, case reports have alerted regulatory agencies and the medical community about medication adverse effects, such as birth defects from thalidomide.5
Case reports also have been criticized on both scientific and ethical grounds. Critics argue that many case reports often lack the rigor and consistency of other types of research.6 Three recent trends in medical publication have strengthened the validity of these criticisms: the increase in the popularity of case reports; the corresponding increase in submissions to journals, including Federal Practitioner; and the rise of predatory publishers.7,8
The ethical scrutiny of case reports discussed in this column focuses on the tension between providing readers with adequate, accurate information to fulfil the goals of case reports while also protecting patient confidentiality. The latter issue during most of the history of medicine was not considered by health care professionals when the prevailing paternalism supported a professional-oriented approach to health care. The rise of bioethics in the 1960s and 1970s began the shift toward patient autonomy in medical decision making and patient rights to control their protected health information that rendered case reports ethically problematic.
To address both changes in ethical standards and scientific limitations, a committee of clinicians, researchers, and journal editors formed the Case Report (CARE) group.2,8 The group undertook an effort to improve the quality of case reports. From 2011 to 2012, they developed the CARE guidelines for clinical case reporting. The guidance took the form of a Statement and Checklist presented at the 2013 International Congress on Peer Review and Biomedical Publication. Since their presentation, multiple prestigious medical journals in many countries have implemented these recommendations.
As part of an overall effort to raise the ethical caliber of our own journal, Federal Practitioner will begin to implement the CARE guidelines for case reports for all future submissions. Use of the CARE recommendations will help prospective authors enhance the scientific value and ethical caliber of case reports submitted to the journal as well as assist the Federal Practitioner editorial team, editorial board, and peer reviewers to evaluate submissions more judiciously.
An essential part of the CARE guidelines is that the patient who is the subject of the case report provide informed consent for the publication of their personal narrative. The CARE group considers this an “ethical duty” of authors and editors alike. In “exceptional circumstances” such as if the patient is a minor or permanently incapacitated, a guardian or relative may grant consent. In the rare event that even with exhaustive attempts, if informed consent cannot be obtained from a patient or their representative, then the authors of the case report must submit a statement to this effect.4 Some journals may require that the authors obtain the approval of an institutional review board or the permission of an ethics or other institutional committee or a privacy officer.2
Requesting the patient’s consent is an extension of the shared decision making that is now a best practice in clinical care into the arena of research, making the patient or their representative a partner in the work. Ethicists have recommended inviting patients or relatives to read a draft of the case report and agree to its publication or request specific modifications to the manuscript. The CARE group rightly points out that with the rise of open notes in medical documentation, patients increasingly have access to their charts in near or real time.2 Gone are the days of Sir William Osler when only doctors read medical journals and all of these technical developments as well as standards of research and social changes in the practitioner-patient relationship make it imperative that writers and editors join together to make case reports more transparent, accurate, and consistent.7
An additional step to protect patient privacy is the requirement that authors either de-identify potentially identifiable health information, such as age, birth, death, admission, and discharge dates, or in some instances obtain separate consent for the release of that protected data.8 These restrictions constitute a challenge to case report authors who in some instances may consider these same facts critical to the integrity of the case presentation that have made some scholars doubt their continued viability. After all, the contribution of the case to the medical literature often lies in its very particularity. Conversely, no matter how frustrated we might become during writing a case report, we would not want to see our own protected health information or that of our family on a website or in print without our knowledge or approval. Indeed, the International Committee of Medical Journal Editors states that “If identifying characteristics are de-identified, authors should provide assurance, and editors should so note, that such changes do not distort scientific meaning.”9
However, the exponential growth of the internet, the spread of social media, and the ubiquity of a plethora of electronic devices, which prior generations of writers and readers could not even imagine, make these limitations necessary to protect patient privacy and the public’s trust in health care professionals. The CARE guidelines can help authors of case reports hone the art of anonymizing the protected health information of subjects of case reports, such as ethnicity and occupation, while accurately conveying the clinical specifics of the case that make it valuable to students and colleagues.
We at Federal Practitioner recognize there is a real tension between truth-telling in case report publication and respect for patient confidentiality that will never be perfectly achieved, but is one that is important for medical knowledge, making it worthy of the continuous efforts of authors and editors to negotiate.
1. Nissen T, Wynn R. The history of the case report: a selective review. JRSM Open. 2014;5(4):2054270414523410. Published 2014 Mar 12. doi:10.1177/2054270414523410
2. Gagnier JJ, Kienle G, Altman DG, et al. The CARE guidelines: consensus-based clinical case reporting guideline development. BMJ Case Rep. 2013;2013:bcr2013201554. Published 2013 Oct 23. doi:10.1136/bcr-2013-201554
3. McLean SF. Case-based learning and its application in medical and health-care fields: a review of worldwide literature. J Med Educ Curric Dev. 2016;3:JMECD.S20377. Published 2016 Apr 27. doi:10.4137/JMECD.S20377
4. Centers for Disease Control (CDC). Pneumocystis pneumonia—Los Angeles. MMWR Morb Mortal Wkly Rep. 1981;30(21):250-252.
5. McBride WG. Thalidomide and congenital abnormalities. Lancet 1961;278(7216):1358. doi:10.1016/S0140-6736(61)90927-8
6. Vandenbroucke JP. In defense of case reports and case series. Ann Intern Med. 2001;134(4):330-334. doi:10.7326/0003-4819-134-4-200102200-00017
7. Rosoff PM. Can the case report withstand ethical scrutiny? Hastings Cent Rep. 2019;49(6):17-21. doi:10.1002/hast.1065
8. Riley DS, Barber MS, Kienle GS, et al. CARE guidelines for case reports: explanation and elaboration document. J Clin Epidemiol. 2017;89:218-235. doi:10.1016/j.jclinepi.2017.04.026
9. International Committee of Medical Journal Editors. Recommendations for the conduct, reporting, editing, and publication of scholarly work in medical journals. Updated December 2021. Accessed January 31, 2022. http://www.icmje.org/news-and-editorials/new_journal_dec2021.html
Medical case reports are as old as the healing profession itself.1 These ancient medical stories have a modern definition: “A case report is a narrative that describes, for medical, scientific or educational purposes, a medical problem experienced by one or more patients.”2 Case report experts describe the 3-fold purposes of this type of research: as a mainstay of education; a harbinger of emerging illnesses; and an appraiser of new interventions. Case-based education has long been a pillar of health professions education: Nurses, doctors, and allied health professionals are taught and learn through reading and discussing with their teachers and each other about cases of their own patients and of those in the literature.3 Case reports also have helped identify and raise awareness of new diseases and rare conditions, such as HIV.4 Finally, case reports have alerted regulatory agencies and the medical community about medication adverse effects, such as birth defects from thalidomide.5
Case reports also have been criticized on both scientific and ethical grounds. Critics argue that many case reports often lack the rigor and consistency of other types of research.6 Three recent trends in medical publication have strengthened the validity of these criticisms: the increase in the popularity of case reports; the corresponding increase in submissions to journals, including Federal Practitioner; and the rise of predatory publishers.7,8
The ethical scrutiny of case reports discussed in this column focuses on the tension between providing readers with adequate, accurate information to fulfil the goals of case reports while also protecting patient confidentiality. The latter issue during most of the history of medicine was not considered by health care professionals when the prevailing paternalism supported a professional-oriented approach to health care. The rise of bioethics in the 1960s and 1970s began the shift toward patient autonomy in medical decision making and patient rights to control their protected health information that rendered case reports ethically problematic.
To address both changes in ethical standards and scientific limitations, a committee of clinicians, researchers, and journal editors formed the Case Report (CARE) group.2,8 The group undertook an effort to improve the quality of case reports. From 2011 to 2012, they developed the CARE guidelines for clinical case reporting. The guidance took the form of a Statement and Checklist presented at the 2013 International Congress on Peer Review and Biomedical Publication. Since their presentation, multiple prestigious medical journals in many countries have implemented these recommendations.
As part of an overall effort to raise the ethical caliber of our own journal, Federal Practitioner will begin to implement the CARE guidelines for case reports for all future submissions. Use of the CARE recommendations will help prospective authors enhance the scientific value and ethical caliber of case reports submitted to the journal as well as assist the Federal Practitioner editorial team, editorial board, and peer reviewers to evaluate submissions more judiciously.
An essential part of the CARE guidelines is that the patient who is the subject of the case report provide informed consent for the publication of their personal narrative. The CARE group considers this an “ethical duty” of authors and editors alike. In “exceptional circumstances” such as if the patient is a minor or permanently incapacitated, a guardian or relative may grant consent. In the rare event that even with exhaustive attempts, if informed consent cannot be obtained from a patient or their representative, then the authors of the case report must submit a statement to this effect.4 Some journals may require that the authors obtain the approval of an institutional review board or the permission of an ethics or other institutional committee or a privacy officer.2
Requesting the patient’s consent is an extension of the shared decision making that is now a best practice in clinical care into the arena of research, making the patient or their representative a partner in the work. Ethicists have recommended inviting patients or relatives to read a draft of the case report and agree to its publication or request specific modifications to the manuscript. The CARE group rightly points out that with the rise of open notes in medical documentation, patients increasingly have access to their charts in near or real time.2 Gone are the days of Sir William Osler when only doctors read medical journals and all of these technical developments as well as standards of research and social changes in the practitioner-patient relationship make it imperative that writers and editors join together to make case reports more transparent, accurate, and consistent.7
An additional step to protect patient privacy is the requirement that authors either de-identify potentially identifiable health information, such as age, birth, death, admission, and discharge dates, or in some instances obtain separate consent for the release of that protected data.8 These restrictions constitute a challenge to case report authors who in some instances may consider these same facts critical to the integrity of the case presentation that have made some scholars doubt their continued viability. After all, the contribution of the case to the medical literature often lies in its very particularity. Conversely, no matter how frustrated we might become during writing a case report, we would not want to see our own protected health information or that of our family on a website or in print without our knowledge or approval. Indeed, the International Committee of Medical Journal Editors states that “If identifying characteristics are de-identified, authors should provide assurance, and editors should so note, that such changes do not distort scientific meaning.”9
However, the exponential growth of the internet, the spread of social media, and the ubiquity of a plethora of electronic devices, which prior generations of writers and readers could not even imagine, make these limitations necessary to protect patient privacy and the public’s trust in health care professionals. The CARE guidelines can help authors of case reports hone the art of anonymizing the protected health information of subjects of case reports, such as ethnicity and occupation, while accurately conveying the clinical specifics of the case that make it valuable to students and colleagues.
We at Federal Practitioner recognize there is a real tension between truth-telling in case report publication and respect for patient confidentiality that will never be perfectly achieved, but is one that is important for medical knowledge, making it worthy of the continuous efforts of authors and editors to negotiate.
1. Nissen T, Wynn R. The history of the case report: a selective review. JRSM Open. 2014;5(4):2054270414523410. Published 2014 Mar 12. doi:10.1177/2054270414523410
2. Gagnier JJ, Kienle G, Altman DG, et al. The CARE guidelines: consensus-based clinical case reporting guideline development. BMJ Case Rep. 2013;2013:bcr2013201554. Published 2013 Oct 23. doi:10.1136/bcr-2013-201554
3. McLean SF. Case-based learning and its application in medical and health-care fields: a review of worldwide literature. J Med Educ Curric Dev. 2016;3:JMECD.S20377. Published 2016 Apr 27. doi:10.4137/JMECD.S20377
4. Centers for Disease Control (CDC). Pneumocystis pneumonia—Los Angeles. MMWR Morb Mortal Wkly Rep. 1981;30(21):250-252.
5. McBride WG. Thalidomide and congenital abnormalities. Lancet 1961;278(7216):1358. doi:10.1016/S0140-6736(61)90927-8
6. Vandenbroucke JP. In defense of case reports and case series. Ann Intern Med. 2001;134(4):330-334. doi:10.7326/0003-4819-134-4-200102200-00017
7. Rosoff PM. Can the case report withstand ethical scrutiny? Hastings Cent Rep. 2019;49(6):17-21. doi:10.1002/hast.1065
8. Riley DS, Barber MS, Kienle GS, et al. CARE guidelines for case reports: explanation and elaboration document. J Clin Epidemiol. 2017;89:218-235. doi:10.1016/j.jclinepi.2017.04.026
9. International Committee of Medical Journal Editors. Recommendations for the conduct, reporting, editing, and publication of scholarly work in medical journals. Updated December 2021. Accessed January 31, 2022. http://www.icmje.org/news-and-editorials/new_journal_dec2021.html
Evaluating the Impact of a Urinalysis to Reflex Culture Process Change in the Emergency Department at a Veterans Affairs Hospital
Automated urine cultures (UCs) following urinalysis (UA) are often used in emergency departments (EDs) to identify urinary tract infections (UTIs). The fast-paced environment of the ED makes this method of proactive collection and facilitation of UC favorable. However, results are often reported as no organism growth or the growth of clinically insignificant organisms, leading to the overdetection and overtreatment of asymptomatic bacteriuria (ASB).1-3 An estimated 30 to 60% of patients with ASB receive unwarranted antibiotic treatment, which is associated with an increased risk of developing Clostridioides difficile infection and contributes to the development of antimicrobial resistance.4-10 The costs associated with UC are an important consideration given the use of resources, the time and effort required to collect and process large numbers of negative cultures, and further efforts devoted to the follow-up of ED culture results.
Changes in traditional testing involving testing of both a UA and UC to reflex testing where urine specimens undergo culture only if they meet certain criteria have been described.11-14 This change in traditional testing aims to reduce the number of potentially unnecessary cultures performed without compromising clinical care. Leukocyte quantity in the UA has been shown to be a reliable predictor of true infection.11,15 Fok and colleagues demonstrated that reflex urine testing in ambulatory male urology patients in which cultures were done on only urine specimens with > 5 white blood cells per high-power field (WBC/HPF) would have missed only 7% of positive UCs, while avoiding 69% of cultures.11
At the Edward Hines, Jr Veterans Affairs Hospital (Hines VA), inappropriate UC ordering and treatment for ASB has been identified as an area needing improvement. An evaluation was conducted at the facility to determine the population of inpatient veterans with a positive UC who were appropriately managed. Of the 113 study patients with a positive UC included in this review, 77 (68%) had a diagnosis of ASB, with > 80% of patients with ASB (and no other suspected infections) receiving antimicrobial therapy.8 A subsequent evaluation was conducted at the Hines VA ED to evaluate UTI treatment and follow-up. Of the 173 ED patients included, 23% received antibiotic therapy for an ASB and 60% had a UA and UC collected but did not report symptoms.9 Finally, a review by the Hines VA laboratory showed that in May 2017, of 359 UCs sent from various locations of the hospital, 38% were obtained in the setting of a negative UA.
A multidisciplinary group with representation from primary care, infectious diseases, pharmacy, nursing, laboratory, and informatics was created with a goal to improve the workup and management of UTIs. In addition to periodic education for the clinicians regarding appropriate use and interpretation of UA and UC along with judicious use of antimicrobials especially in the setting of ASB, a UA to reflex culture process change was implemented. This allowed for automatic cancellation of a UC in the setting of a negative UA, which was designed to help facilitate appropriate UC ordering.
Methods
The primary objective of this study was to compare the frequency of inappropriate UC use and inappropriate antibiotic prescribing pre- and postimplementation of this UA to reflex culture process change. An inappropriate UC was defined as a UC ordered despite a negative UA in asymptomatic patients. Inappropriate antibiotic prescribing was defined as treatment of patients with ASB. The secondary objective evaluated postintervention data to assess the frequency of outpatient, ED, and hospital visits for UTI-related symptoms in the group of patients that had a UC cancelled as a result of the new process change (within a 7-day period of the initial UA) to determine whether patients with true infections were missed due to the process change.
Study Design and Setting
This pre-post quality improvement (QI) study analyzed the UC-ordering practices for UTIs sent from the ED at the Hines VA. This VA is a 483-bed tertiary care hospital in Chicago, Illinois, and serves > 57,000 veterans and about 23,000 ED visits annually. This study was approved by the Edward Hines, Jr VA Institutional Review Board as a quality assurance/QI proposal prior to data collection.
Patient Selection
All patients who
When comparing postintervention data with preintervention data for the primary study objective, the same exclusion criteria from the 2015 study were applied to the present study, which excluded ED patients who were admitted for inpatient care, concurrent antibiotic therapy for a non-UTI indication, duplicate cultures, and use of chronic bladder management devices. All patients identified as receiving a UA during the specified postintervention study period were included for evaluation of the secondary study objective.
Interventions
After physician education, an ED process change was implemented on October 3, 2017. This process change involved the creation of new order sets in the EHR that allowed clinicians to order a UA only, a UA with culture that would be cancelled by laboratory personnel if the UA did not result in > 5 WBC/HPF, and a UA with culture designated as do not cancel, where the UC was processed regardless of the UA results. The scenarios in which the latter option was considered appropriate were listed on the ordering screen and included pregnancy, a genitourinary procedure with necessary preoperative culture, and neutropenia.
Measurements
Postimplementation, all UAs were reviewed and grouped as follows: (1) positive UA with subsequent UC; (2) negative UA, culture cancelled; (3) only UA ordered (no culture); or (4) do not cancel UC ordered. Of the UAs that were analyzed, the following data were collected: demographics, comorbidities, concurrent medications for benign prostatic hyperplasia (BPH) and/or overactive bladder (OAB), documented allergies/adverse drug reactions to antibiotics, date of ED visit, documented UTI signs/symptoms (defined as frequency, urgency, dysuria, fever, suprapubic pain, or altered mental status in patients unable to verbalize urinary symptoms), UC results and susceptibilities, number of UCs repeated within 7 days after initial UA, requirement of antibiotic for UTI within 7 days of initial UA, antibiotic prescribed, duration of antibiotic therapy, and outpatient visits, ED visits, or need for hospital admission within 7 days of the initial UA for UTI-related symptoms. Other relevant UA and UC data that could not be obtained from the EHR were collected by generating a report using the Veterans Information Systems and Technology Architecture (VistA).
Analysis
Statistical analysis was performed using SAS v9.4. Independent t tests and Fisher exact tests were used to describe difference pre- and postintervention. Statistical significance was considered for P < .05. Based on results from the previous study conducted at this facility in addition to a literature review, it was determined that 92 patients in each group (pre- and postintervention) would be necessary to detect a 15% increase in percentage of patients appropriately treated for a UTI.
Results
There were 684 UAs evaluated from ED visits, 429 preintervention and 255 postintervention. The 255 patients were evaluated for the secondary objective of the study. Of the 255 patients with UAs identified postintervention, 150 were excluded based on the predefined exclusion criteria, and the remaining 105 were compared with the 173 patients from the preintervention group and were included in the analysis for the primary objective (Figure 1).
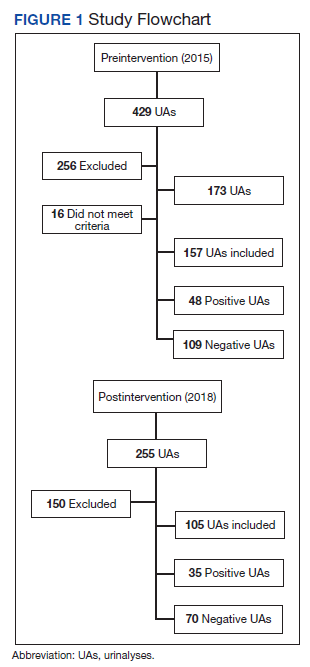
Patients in the postintervention group were younger than those in the preintervention group (P < .02): otherwise the groups were similar (Table 1). Inappropriate antibiotics for ASB decreased from 10.2% preintervention to 1.9% postintervention (odds ratio, 0.17; P = .01) (Table 2). UC processing despite a negative UA significantly decreased from 100% preintervention to 38.6% postintervention (P < .001) (Table 3). In patients with a negative UA, antibiotic prescribing decreased by 25.3% postintervention, but this difference was not statistically significant.
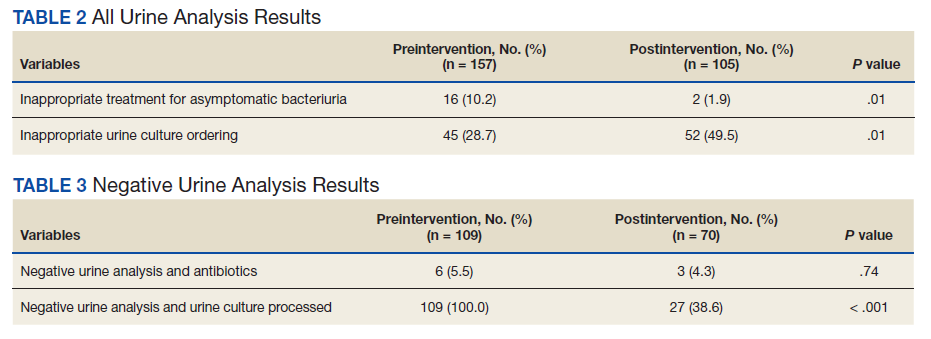
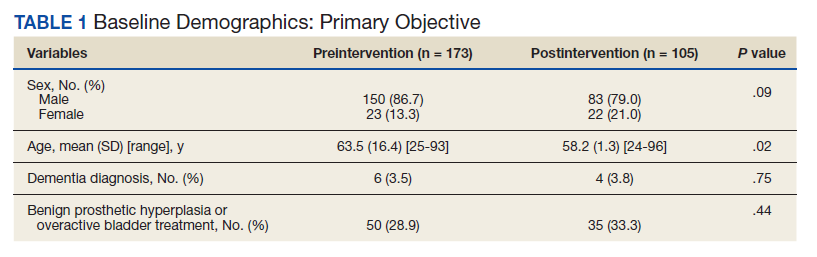
Postintervention, of 255 UAs evaluated, 95 (37.3%) were positive with a processed UC and 95 (37.3%) were negative with UC cancelled, 43 (16.9%) were ordered as DNC, and 22 (8.6%) were ordered without a UC (Figure 2). Twenty-eight of the 95 (29.5%) UAs with processed UCs did not meet the criteria for a positive UA and were not designated as DNC. When the UCs of this subgroup of patients were further analyzed, we found that 2 of the cultures were positive of which 1 patient was symptomatic and required antibiotic therapy.
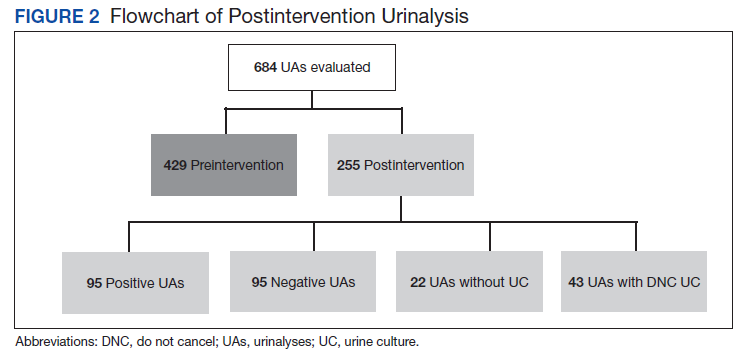
Of the 95 patients with a negative UA, 69 (72.6%) presented without any UTI-related symptoms. In this group, there were no reports of outpatient visits, ED visits, or hospital admissions within 7 days of initial UA for UTI-related symptoms. None of the UCs ordered as DNC had a supporting reason identified. Nonetheless, the UC results from this patient subgroup also were analyzed further and resulted in 4 patients with negative UA and positive subsequent UC, 1 was symptomatic and required antibiotic therapy.
Discussion
A simple process change at the Hines VA resulted in benefits related to antimicrobial stewardship without conferring adverse outcomes on patient safety. Both UC processing despite a negative UA and inappropriate antibiotic prescribing for ASB were reduced significantly postintervention. This process change was piloted in the ED where UCs are often included as part of the initial diagnostic testing in patients who may not report UTI-related symptoms but for whom a UC is often bundled with other infectious workup, depending on the patient presentation.
Reflex testing of urine specimens has been described in the literature, both in an exploratory nature where impact of a reflex UC cancellation protocol based on certain UA criteria is measured by percent reduction of UCs processed as well as results of such interventions implemented into clinical practice.11-13 A retrospective study performed at the University of North Carolina Medical Center evaluated patients who presented to the ED during a 6-month period and had both an automated UA and UC collected. UC processing was restricted to UA that was positive for nitrites, leukocyte esterase, bacteria, or > 10 WBC/HPF. Use of this reflex culture cancellation protocol could have eliminated 604 of the 1546 (39.1%) cultures processed. However, 11 of the 314 (3.5%) positive cultures could have been missed.13 This same protocol was externally validated at another large academic ED setting, where similar results were found.14
In clinical practice, there is a natural tendency to reflexively prescribe antibiotics based on the results of a positive UC due to the hesitancy in ignoring these results, despite lack of a suspicion for a true infection. Leis and colleagues explored this in a proof-of-concept study evaluating the impact of discontinuing the routine reporting of positive UC results from noncatheterized inpatients and requesting clinicians to call the laboratory for results if a UTI was suspected.16 This intervention resulted in a statistically significant reduction in treatment of ASB in noncatheterized patients from 48 to 12% pre- and postintervention. Clinicians requested culture results only 14% of the time, and there were no adverse outcomes among untreated noncatheterized patients. More recently, a QI study conducted at a large community hospital in Toronto, Ontario, Canada, implemented a 2-step model of care for urine collection.17 UC was collected but only processed by the microbiology laboratory if the ED physicians deemed it necessary after clinical assessment.
After implementation, there was a decrease in the proportion of ED visits associated with processed UC (from 6.0% to 4.7% of visits per week; P < .001), ED visits associated with callbacks for processing UC (1.8% to 1.1% of visits per month; P < .001), and antimicrobial prescriptions for urinary symptoms among hospitalized patients (from 20.6% to 10.9%; P < .001). Equally important, despite the 937 cases in which urine was collected but cultures were not processed, no evidence of untreated UTIs was identified.17
The results from the present study similarly demonstrate minimal concern for potentially undertreating these patients. As seen in the subgroup of patients included in the positive UA group, which did not meet criteria for positive UA per protocol (n = 29), only 2 of the subsequent cultures were positive, of which only 1 patient required antibiotic therapy based on the clinical presentation. In addition, in the group of negative UAs with subsequent cancellation of the UC, there were no found reports of outpatient visits, ED visits, or hospital admissions within 7 days of the initial UA for UTI-related symptoms.
Limitations
This single-center, pre-post QI study was not without limitations. Manual chart reviews were required, and accuracy of information was dependent on clinician documentation and assessment of UTI-related symptoms. The population studied was predominately older males; thus, results may not be applicable to females or young adults. Additionally, recognition of a negative UA and subsequent cancellation of the UC was dependent on laboratory personnel. As noted in the patient group with a positive UA, some of these UAs were negative and may have been overlooked; therefore, subsequent UCs were inappropriately processed. However, this occurred infrequently and confirmed the low probability of true UTI in the setting of a negative UA. Follow-up for UTI-related symptoms may not have been captured if a patient had presented to an outside facility. Last, definitions of a positive UA differed slightly between the pre- and postintervention groups. The preintervention study defined a positive UA as a WBC count > 5 WBC/HPF and positive leukocyte esterase, whereas the present study defined a positive UA with a WBC count > 5. This may have resulted in an overestimation of positive UA in the postintervention group.
Conclusions
Better selective use of UC testing may improve stewardship resources and reduce costs impacting both ED and clinical laboratories. Furthermore, benefits can include a reduction in the use of time and resources required to collect samples for culture, use of test supplies, the time and effort required to process the large number of negative cultures, and resources devoted to the follow-up of these ED culture results. The described UA to reflex culture process change demonstrated a significant reduction in the processing of inappropriate UC and unnecessary antibiotics for ASB. There were no missed UTIs or other adverse patient outcomes noted. This process change has been implemented in all departments at the Hines VA and additional data will be collected to ensure consistent outcomes.
1. Chironda B, Clancy S, Powis JE. Optimizing urine culture collection in the emergency department using frontline ownership interventions. Clin Infect Dis. 2014;59(7):1038-1039. doi:10.1093/cid/ciu412
2. Nagurney JT, Brown DF, Chang Y, Sane S, Wang AC, Weiner JB. Use of diagnostic testing in the emergency department for patients presenting with non-traumatic abdominal pain. J Emerg Med. 2003;25(4):363-371. doi:10.1016/s0736-4679(03)00237-3
3. Lammers RL, Gibson S, Kovacs D, Sears W, Strachan G. Comparison of test characteristics of urine dipstick and urinalysis at various test cutoff points. Ann Emerg Med. 2001;38(5):505-512. doi:10.1067/mem.2001.119427
4. Nicolle LE, Gupta K, Bradley SF, et al. Clinical practice guideline for the management of asymptomatic bacteriuria: 2019 update by the Infectious Diseases Society of America. Clin Infect Dis. 2019;68(10):1611-1615. doi:10.1093/cid/ciy1121
5. Trautner BW, Grigoryan L, Petersen NJ, et al. Effectiveness of an antimicrobial stewardship approach for urinary catheter-associated asymptomatic bacteriuria. JAMA Intern Med. 2015;175(7):1120-1127. doi:10.1001/jamainternmed.2015.1878
6. Hartley S, Valley S, Kuhn L, et al. Overtreatment of asymptomatic bacteriuria: identifying targets for improvement. Infect Control Hosp Epidemiol. 2015;36(4):470-473. doi:10.1017/ice.2014.73
7. Bader MS, Loeb M, Brooks AA. An update on the management of urinary tract infections in the era of antimicrobial resistance. Postgrad Med. 2017;129(2):242-258. doi:10.1080/00325481.2017.1246055
8. Spivak ES, Burk M, Zhang R, et al. Management of bacteriuria in Veterans Affairs hospitals. Clin Infect Dis. 2017;65(6):910-917. doi:10.1093/cid/cix474
9. Kim EY, Patel U, Patel B, Suda KJ. Evaluation of bacteriuria treatment and follow-up initiated in the emergency department at a Veterans Affairs hospital. J Pharm Technol. 2017;33(5):183-188. doi:10.1177/8755122517718214
10. Brown E, Talbot GH, Axelrod P, Provencher M, Hoegg C. Risk factors for Clostridium difficile toxin-associated diarrhea. Infect Control Hosp Epidemiol. 1990;11(6):283-290. doi:10.1086/646173
11. Fok C, Fitzgerald MP, Turk T, Mueller E, Dalaza L, Schreckenberger P. Reflex testing of male urine specimens misses few positive cultures may reduce unnecessary testing of normal specimens. Urology. 2010;75(1):74-76. doi:10.1016/j.urology.2009.08.071
12. Munigala S, Jackups RR Jr, Poirier RF, et al. Impact of order set design on urine culturing practices at an academic medical centre emergency department. BMJ Qual Saf. 2018;27(8):587-592. doi:10.1136/bmjqs-2017-006899
13. Jones CW, Culbreath KD, Mehrotra A, Gilligan PH. Reflect urine culture cancellation in the emergency department. J Emerg Med. 2014;46(1):71-76. doi:10.1016/j.jemermed.2013.08.042
14. Hertz JT, Lescallette RD, Barrett TW, Ward MJ, Self WH. External validation of an ED protocol for reflex urine culture cancelation. Am J Emerg Med. 2015;33(12):1838-1839. doi:10.1016/j.ajem.2015.09.026
15. Stamm WE. Measurement of pyuria and its relation to bacteriuria. Am J Med. 1983;75(1B):53-58. doi:10.1016/0002-9343(83)90073-6
16. Leis JA, Rebick GW, Daneman N, et al. Reducing antimicrobial therapy for asymptomatic bacteriuria among noncatheterized inpatients: a proof-of-concept study. Clin Infect Dis. 2014;58(7):980-983. doi:10.1093/cid/ciu010
17. Stagg A, Lutz H, Kirpalaney S, et al. Impact of two-step urine culture ordering in the emergency department: a time series analysis. BMJ Qual Saf. 2017;27:140-147. doi:10.1136/bmjqs-2016-006250
Automated urine cultures (UCs) following urinalysis (UA) are often used in emergency departments (EDs) to identify urinary tract infections (UTIs). The fast-paced environment of the ED makes this method of proactive collection and facilitation of UC favorable. However, results are often reported as no organism growth or the growth of clinically insignificant organisms, leading to the overdetection and overtreatment of asymptomatic bacteriuria (ASB).1-3 An estimated 30 to 60% of patients with ASB receive unwarranted antibiotic treatment, which is associated with an increased risk of developing Clostridioides difficile infection and contributes to the development of antimicrobial resistance.4-10 The costs associated with UC are an important consideration given the use of resources, the time and effort required to collect and process large numbers of negative cultures, and further efforts devoted to the follow-up of ED culture results.
Changes in traditional testing involving testing of both a UA and UC to reflex testing where urine specimens undergo culture only if they meet certain criteria have been described.11-14 This change in traditional testing aims to reduce the number of potentially unnecessary cultures performed without compromising clinical care. Leukocyte quantity in the UA has been shown to be a reliable predictor of true infection.11,15 Fok and colleagues demonstrated that reflex urine testing in ambulatory male urology patients in which cultures were done on only urine specimens with > 5 white blood cells per high-power field (WBC/HPF) would have missed only 7% of positive UCs, while avoiding 69% of cultures.11
At the Edward Hines, Jr Veterans Affairs Hospital (Hines VA), inappropriate UC ordering and treatment for ASB has been identified as an area needing improvement. An evaluation was conducted at the facility to determine the population of inpatient veterans with a positive UC who were appropriately managed. Of the 113 study patients with a positive UC included in this review, 77 (68%) had a diagnosis of ASB, with > 80% of patients with ASB (and no other suspected infections) receiving antimicrobial therapy.8 A subsequent evaluation was conducted at the Hines VA ED to evaluate UTI treatment and follow-up. Of the 173 ED patients included, 23% received antibiotic therapy for an ASB and 60% had a UA and UC collected but did not report symptoms.9 Finally, a review by the Hines VA laboratory showed that in May 2017, of 359 UCs sent from various locations of the hospital, 38% were obtained in the setting of a negative UA.
A multidisciplinary group with representation from primary care, infectious diseases, pharmacy, nursing, laboratory, and informatics was created with a goal to improve the workup and management of UTIs. In addition to periodic education for the clinicians regarding appropriate use and interpretation of UA and UC along with judicious use of antimicrobials especially in the setting of ASB, a UA to reflex culture process change was implemented. This allowed for automatic cancellation of a UC in the setting of a negative UA, which was designed to help facilitate appropriate UC ordering.
Methods
The primary objective of this study was to compare the frequency of inappropriate UC use and inappropriate antibiotic prescribing pre- and postimplementation of this UA to reflex culture process change. An inappropriate UC was defined as a UC ordered despite a negative UA in asymptomatic patients. Inappropriate antibiotic prescribing was defined as treatment of patients with ASB. The secondary objective evaluated postintervention data to assess the frequency of outpatient, ED, and hospital visits for UTI-related symptoms in the group of patients that had a UC cancelled as a result of the new process change (within a 7-day period of the initial UA) to determine whether patients with true infections were missed due to the process change.
Study Design and Setting
This pre-post quality improvement (QI) study analyzed the UC-ordering practices for UTIs sent from the ED at the Hines VA. This VA is a 483-bed tertiary care hospital in Chicago, Illinois, and serves > 57,000 veterans and about 23,000 ED visits annually. This study was approved by the Edward Hines, Jr VA Institutional Review Board as a quality assurance/QI proposal prior to data collection.
Patient Selection
All patients who
When comparing postintervention data with preintervention data for the primary study objective, the same exclusion criteria from the 2015 study were applied to the present study, which excluded ED patients who were admitted for inpatient care, concurrent antibiotic therapy for a non-UTI indication, duplicate cultures, and use of chronic bladder management devices. All patients identified as receiving a UA during the specified postintervention study period were included for evaluation of the secondary study objective.
Interventions
After physician education, an ED process change was implemented on October 3, 2017. This process change involved the creation of new order sets in the EHR that allowed clinicians to order a UA only, a UA with culture that would be cancelled by laboratory personnel if the UA did not result in > 5 WBC/HPF, and a UA with culture designated as do not cancel, where the UC was processed regardless of the UA results. The scenarios in which the latter option was considered appropriate were listed on the ordering screen and included pregnancy, a genitourinary procedure with necessary preoperative culture, and neutropenia.
Measurements
Postimplementation, all UAs were reviewed and grouped as follows: (1) positive UA with subsequent UC; (2) negative UA, culture cancelled; (3) only UA ordered (no culture); or (4) do not cancel UC ordered. Of the UAs that were analyzed, the following data were collected: demographics, comorbidities, concurrent medications for benign prostatic hyperplasia (BPH) and/or overactive bladder (OAB), documented allergies/adverse drug reactions to antibiotics, date of ED visit, documented UTI signs/symptoms (defined as frequency, urgency, dysuria, fever, suprapubic pain, or altered mental status in patients unable to verbalize urinary symptoms), UC results and susceptibilities, number of UCs repeated within 7 days after initial UA, requirement of antibiotic for UTI within 7 days of initial UA, antibiotic prescribed, duration of antibiotic therapy, and outpatient visits, ED visits, or need for hospital admission within 7 days of the initial UA for UTI-related symptoms. Other relevant UA and UC data that could not be obtained from the EHR were collected by generating a report using the Veterans Information Systems and Technology Architecture (VistA).
Analysis
Statistical analysis was performed using SAS v9.4. Independent t tests and Fisher exact tests were used to describe difference pre- and postintervention. Statistical significance was considered for P < .05. Based on results from the previous study conducted at this facility in addition to a literature review, it was determined that 92 patients in each group (pre- and postintervention) would be necessary to detect a 15% increase in percentage of patients appropriately treated for a UTI.
Results
There were 684 UAs evaluated from ED visits, 429 preintervention and 255 postintervention. The 255 patients were evaluated for the secondary objective of the study. Of the 255 patients with UAs identified postintervention, 150 were excluded based on the predefined exclusion criteria, and the remaining 105 were compared with the 173 patients from the preintervention group and were included in the analysis for the primary objective (Figure 1).
Patients in the postintervention group were younger than those in the preintervention group (P < .02): otherwise the groups were similar (Table 1). Inappropriate antibiotics for ASB decreased from 10.2% preintervention to 1.9% postintervention (odds ratio, 0.17; P = .01) (Table 2). UC processing despite a negative UA significantly decreased from 100% preintervention to 38.6% postintervention (P < .001) (Table 3). In patients with a negative UA, antibiotic prescribing decreased by 25.3% postintervention, but this difference was not statistically significant.
Postintervention, of 255 UAs evaluated, 95 (37.3%) were positive with a processed UC and 95 (37.3%) were negative with UC cancelled, 43 (16.9%) were ordered as DNC, and 22 (8.6%) were ordered without a UC (Figure 2). Twenty-eight of the 95 (29.5%) UAs with processed UCs did not meet the criteria for a positive UA and were not designated as DNC. When the UCs of this subgroup of patients were further analyzed, we found that 2 of the cultures were positive of which 1 patient was symptomatic and required antibiotic therapy.
Of the 95 patients with a negative UA, 69 (72.6%) presented without any UTI-related symptoms. In this group, there were no reports of outpatient visits, ED visits, or hospital admissions within 7 days of initial UA for UTI-related symptoms. None of the UCs ordered as DNC had a supporting reason identified. Nonetheless, the UC results from this patient subgroup also were analyzed further and resulted in 4 patients with negative UA and positive subsequent UC, 1 was symptomatic and required antibiotic therapy.
Discussion
A simple process change at the Hines VA resulted in benefits related to antimicrobial stewardship without conferring adverse outcomes on patient safety. Both UC processing despite a negative UA and inappropriate antibiotic prescribing for ASB were reduced significantly postintervention. This process change was piloted in the ED where UCs are often included as part of the initial diagnostic testing in patients who may not report UTI-related symptoms but for whom a UC is often bundled with other infectious workup, depending on the patient presentation.
Reflex testing of urine specimens has been described in the literature, both in an exploratory nature where impact of a reflex UC cancellation protocol based on certain UA criteria is measured by percent reduction of UCs processed as well as results of such interventions implemented into clinical practice.11-13 A retrospective study performed at the University of North Carolina Medical Center evaluated patients who presented to the ED during a 6-month period and had both an automated UA and UC collected. UC processing was restricted to UA that was positive for nitrites, leukocyte esterase, bacteria, or > 10 WBC/HPF. Use of this reflex culture cancellation protocol could have eliminated 604 of the 1546 (39.1%) cultures processed. However, 11 of the 314 (3.5%) positive cultures could have been missed.13 This same protocol was externally validated at another large academic ED setting, where similar results were found.14
In clinical practice, there is a natural tendency to reflexively prescribe antibiotics based on the results of a positive UC due to the hesitancy in ignoring these results, despite lack of a suspicion for a true infection. Leis and colleagues explored this in a proof-of-concept study evaluating the impact of discontinuing the routine reporting of positive UC results from noncatheterized inpatients and requesting clinicians to call the laboratory for results if a UTI was suspected.16 This intervention resulted in a statistically significant reduction in treatment of ASB in noncatheterized patients from 48 to 12% pre- and postintervention. Clinicians requested culture results only 14% of the time, and there were no adverse outcomes among untreated noncatheterized patients. More recently, a QI study conducted at a large community hospital in Toronto, Ontario, Canada, implemented a 2-step model of care for urine collection.17 UC was collected but only processed by the microbiology laboratory if the ED physicians deemed it necessary after clinical assessment.
After implementation, there was a decrease in the proportion of ED visits associated with processed UC (from 6.0% to 4.7% of visits per week; P < .001), ED visits associated with callbacks for processing UC (1.8% to 1.1% of visits per month; P < .001), and antimicrobial prescriptions for urinary symptoms among hospitalized patients (from 20.6% to 10.9%; P < .001). Equally important, despite the 937 cases in which urine was collected but cultures were not processed, no evidence of untreated UTIs was identified.17
The results from the present study similarly demonstrate minimal concern for potentially undertreating these patients. As seen in the subgroup of patients included in the positive UA group, which did not meet criteria for positive UA per protocol (n = 29), only 2 of the subsequent cultures were positive, of which only 1 patient required antibiotic therapy based on the clinical presentation. In addition, in the group of negative UAs with subsequent cancellation of the UC, there were no found reports of outpatient visits, ED visits, or hospital admissions within 7 days of the initial UA for UTI-related symptoms.
Limitations
This single-center, pre-post QI study was not without limitations. Manual chart reviews were required, and accuracy of information was dependent on clinician documentation and assessment of UTI-related symptoms. The population studied was predominately older males; thus, results may not be applicable to females or young adults. Additionally, recognition of a negative UA and subsequent cancellation of the UC was dependent on laboratory personnel. As noted in the patient group with a positive UA, some of these UAs were negative and may have been overlooked; therefore, subsequent UCs were inappropriately processed. However, this occurred infrequently and confirmed the low probability of true UTI in the setting of a negative UA. Follow-up for UTI-related symptoms may not have been captured if a patient had presented to an outside facility. Last, definitions of a positive UA differed slightly between the pre- and postintervention groups. The preintervention study defined a positive UA as a WBC count > 5 WBC/HPF and positive leukocyte esterase, whereas the present study defined a positive UA with a WBC count > 5. This may have resulted in an overestimation of positive UA in the postintervention group.
Conclusions
Better selective use of UC testing may improve stewardship resources and reduce costs impacting both ED and clinical laboratories. Furthermore, benefits can include a reduction in the use of time and resources required to collect samples for culture, use of test supplies, the time and effort required to process the large number of negative cultures, and resources devoted to the follow-up of these ED culture results. The described UA to reflex culture process change demonstrated a significant reduction in the processing of inappropriate UC and unnecessary antibiotics for ASB. There were no missed UTIs or other adverse patient outcomes noted. This process change has been implemented in all departments at the Hines VA and additional data will be collected to ensure consistent outcomes.
1. Chironda B, Clancy S, Powis JE. Optimizing urine culture collection in the emergency department using frontline ownership interventions. Clin Infect Dis. 2014;59(7):1038-1039. doi:10.1093/cid/ciu412
2. Nagurney JT, Brown DF, Chang Y, Sane S, Wang AC, Weiner JB. Use of diagnostic testing in the emergency department for patients presenting with non-traumatic abdominal pain. J Emerg Med. 2003;25(4):363-371. doi:10.1016/s0736-4679(03)00237-3
3. Lammers RL, Gibson S, Kovacs D, Sears W, Strachan G. Comparison of test characteristics of urine dipstick and urinalysis at various test cutoff points. Ann Emerg Med. 2001;38(5):505-512. doi:10.1067/mem.2001.119427
4. Nicolle LE, Gupta K, Bradley SF, et al. Clinical practice guideline for the management of asymptomatic bacteriuria: 2019 update by the Infectious Diseases Society of America. Clin Infect Dis. 2019;68(10):1611-1615. doi:10.1093/cid/ciy1121
5. Trautner BW, Grigoryan L, Petersen NJ, et al. Effectiveness of an antimicrobial stewardship approach for urinary catheter-associated asymptomatic bacteriuria. JAMA Intern Med. 2015;175(7):1120-1127. doi:10.1001/jamainternmed.2015.1878
6. Hartley S, Valley S, Kuhn L, et al. Overtreatment of asymptomatic bacteriuria: identifying targets for improvement. Infect Control Hosp Epidemiol. 2015;36(4):470-473. doi:10.1017/ice.2014.73
7. Bader MS, Loeb M, Brooks AA. An update on the management of urinary tract infections in the era of antimicrobial resistance. Postgrad Med. 2017;129(2):242-258. doi:10.1080/00325481.2017.1246055
8. Spivak ES, Burk M, Zhang R, et al. Management of bacteriuria in Veterans Affairs hospitals. Clin Infect Dis. 2017;65(6):910-917. doi:10.1093/cid/cix474
9. Kim EY, Patel U, Patel B, Suda KJ. Evaluation of bacteriuria treatment and follow-up initiated in the emergency department at a Veterans Affairs hospital. J Pharm Technol. 2017;33(5):183-188. doi:10.1177/8755122517718214
10. Brown E, Talbot GH, Axelrod P, Provencher M, Hoegg C. Risk factors for Clostridium difficile toxin-associated diarrhea. Infect Control Hosp Epidemiol. 1990;11(6):283-290. doi:10.1086/646173
11. Fok C, Fitzgerald MP, Turk T, Mueller E, Dalaza L, Schreckenberger P. Reflex testing of male urine specimens misses few positive cultures may reduce unnecessary testing of normal specimens. Urology. 2010;75(1):74-76. doi:10.1016/j.urology.2009.08.071
12. Munigala S, Jackups RR Jr, Poirier RF, et al. Impact of order set design on urine culturing practices at an academic medical centre emergency department. BMJ Qual Saf. 2018;27(8):587-592. doi:10.1136/bmjqs-2017-006899
13. Jones CW, Culbreath KD, Mehrotra A, Gilligan PH. Reflect urine culture cancellation in the emergency department. J Emerg Med. 2014;46(1):71-76. doi:10.1016/j.jemermed.2013.08.042
14. Hertz JT, Lescallette RD, Barrett TW, Ward MJ, Self WH. External validation of an ED protocol for reflex urine culture cancelation. Am J Emerg Med. 2015;33(12):1838-1839. doi:10.1016/j.ajem.2015.09.026
15. Stamm WE. Measurement of pyuria and its relation to bacteriuria. Am J Med. 1983;75(1B):53-58. doi:10.1016/0002-9343(83)90073-6
16. Leis JA, Rebick GW, Daneman N, et al. Reducing antimicrobial therapy for asymptomatic bacteriuria among noncatheterized inpatients: a proof-of-concept study. Clin Infect Dis. 2014;58(7):980-983. doi:10.1093/cid/ciu010
17. Stagg A, Lutz H, Kirpalaney S, et al. Impact of two-step urine culture ordering in the emergency department: a time series analysis. BMJ Qual Saf. 2017;27:140-147. doi:10.1136/bmjqs-2016-006250
AHA annual stats update highlights heart-brain connection
in its annual statistical update on heart disease and stroke.
“For several years now, the AHA and the scientific community have increasingly recognized the connections between cardiovascular health and brain health, so it was time for us to cement this into its own chapter, which we highlight as the brain health chapter,” Connie W. Tsao, MD, MPH, chair of the statistical update writing group, with Harvard Medical School, Boston, said in an AHA podcast.
“The global rate of brain disease is quickly outpacing heart disease,” Mitchell S. V. Elkind, MD, immediate past president of the AHA, added in a news release.
“The rate of deaths from Alzheimer’s disease and other dementias rose more than twice as much in the past decade compared to the rate of deaths from heart disease, and that is something we must address,” said Dr. Elkind, with Columbia University Vagelos College of Physicians and Surgeons in New York.
“It’s becoming more evident that reducing vascular disease risk factors can make a real difference in helping people live longer, healthier lives, free of heart disease and brain disease,” Dr. Elkind added.
The AHA’s Heart Disease and Stroke Statistics – 2022 Update was published online January 26 in Circulation).
The report highlights some of the research connecting heart and brain health, including the following:
- A meta-analysis of 139 studies showed that people with midlife hypertension were five times more likely to experience impairment on global cognition and about twice as likely to experience reduced executive function, dementia, and Alzheimer’s disease.
- A meta-analysis of four longitudinal studies found that the risk for dementia associated with heart failure was increased nearly twofold.
- In the large prospective Atherosclerosis Risk in Communities (ARIC) Neurocognitive Study, atrial fibrillation was associated with greater cognitive decline and dementia over 20 years.
- A meta-analysis of 10 prospective studies (including 24,801 participants) showed that coronary heart disease (CHD) was associated with a 40% increased risk of poor cognitive outcomes, including dementia, cognitive impairment, or cognitive decline.
“This new chapter on brain health was a critical one to add,” Dr. Tsao said in the news release.
“The data we’ve collected brings to light the strong correlations between heart health and brain health and makes it an easy story to tell -- what’s good for the heart is good for the brain,” Dr. Tsao added.
Along with the new chapter on brain health, the 2022 statistical update provides the latest statistics and heart disease and stroke. Among the highlights:
- Cardiovascular disease (CVD) remains the leading cause of death worldwide. In the United States in 2019, CVD, listed as the underlying cause of death, accounted for 874,613 deaths, about 2,396 deaths each day. On average, someone dies of CVD every 36 seconds.
- CVD claims more lives each year in the United States than all forms of cancer and chronic lower respiratory disease combined.
- In 2019, CHD was the leading cause (41.3%) of deaths attributable to CVD, followed by other CVD (17.3%), stroke (17.2%), hypertension (11.7%), heart failure (9.9%), and diseases of the arteries (2.8%).
- In 2019, stroke accounted for roughly 1 in every 19 deaths in the United States. On average, someone in the United States has a stroke every 40 seconds and someone dies of stroke every 3 minutes 30 seconds. When considered separately from other CVD, stroke ranks number five among all causes of death in the United States.
While the annual statistics update aims to be a contemporary update of annual heart disease and stroke statistics over the past year, it also examines trends over time, Dr. Tsao explains in the podcast.
“One noteworthy point is that we saw a decline in the rate of cardiovascular mortality over the past three decades or so until about 2010. But over the past decade now, we’re also seeing a rise in these numbers,” she said.
This could be due to rising rates of obesity, diabetes, and poor hypertension control, as well as other lifestyle behaviors, Tsao said.
Key risk factor data
Each year, the statistical update gauges the cardiovascular health of Americans by tracking seven key health factors and behaviors that increase risk for heart disease and stroke. Below is a snapshot of the latest risk factor data.
Smoking
In 2019, smoking was the leading risk factor for years of life lost to premature death and the third leading risk factor for years of life lived with disability or injury.
According to the 2020 surgeon general’s report on smoking cessation, more than 480,000 Americans die as a result of cigarette smoking, and more than 41,000 die of secondhand smoke exposure each year (roughly 1 in 5 deaths annually).
One in 7 adults are current smokers, 1 in 6 female adults are current smokers, and 1 in 5 high school students use e-cigarettes.
Physical inactivity
In 2018, 25.4% of U.S. adults did not engage in leisure-time physical activity, and only 24.0% met the 2018 Physical Activity Guidelines for Americans for both aerobic and muscle strengthening.
Among U.S. high school students in 2019, only 44.1% were physically active for 60 minutes or more on at least 5 days of the week.
Nutrition
While there is some evidence that Americans are improving their diet, fewer than 10% of U.S. adults met guidelines for whole grain, whole fruit, and nonstarchy vegetable consumption each day in 2017–2018.
Overweight/obesity
The prevalence of obesity among adults increased from 1999–2000 through 2017–2018 from 30.5% to 42.4%. Overall prevalence of obesity and severe obesity in U.S. youth 2 to 19 years of age increased from 13.9% to 19.3% and 2.6% to 6.1% between 1999–2000 and 2017–2018.
Cholesterol
Close to 94 million (38.1%) U.S. adults have total cholesterol of 200 mg/dL or higher, according to 2015–2018 data; about 28.0 million (11.5%) have total cholesterol of 240 mg/dL or higher; and 27.8% have high levels of low-density lipoprotein cholesterol (130 mg/dL or higher).
Diabetes
In 2019, 87,647 U.S. deaths were attributed to diabetes; data show that 9.8 million U.S. adults have undiagnosed diabetes, 28.2 million have diagnosed diabetes, and 113.6 million have prediabetes.
Hypertension
A total of 121.5 million (47.3%) U.S. adults have hypertension, based on 2015–2018 data. In 2019, 102,072 U.S. deaths were primarily attributable to hypertension.
This statistical update was prepared by a volunteer writing group on behalf of the American Heart Association Council on Epidemiology and Prevention Statistics Committee and Stroke Statistics Subcommittee. Disclosures for the writing committee are listed with the original article.
A version of this article first appeared on Medscape.com.
Chronic stress accelerates aging: Epigenetic evidence
The increase in cardiovascular disease caused by chronic stress is related to biologic mechanisms (metabolic, hormonal, inflammatory) and to behavioral mechanisms (lifestyle). There is a popular saying that “stress speeds up aging,” which makes sense if we consider the age-old idea that “our age corresponds to that of our arteries.”
The study of the mechanisms of psychosocial risk factors is of major relevance to the creation of the individual and communal preventive strategies that ensure longevity and maintain quality of life.
The following hypotheses were proposed by a group of researchers from Yale University, in New Haven, Conn., in a recent study:
1. Stress is positively associated with accelerated biologic aging, and this relationship will be mediated by stress-related physiologic changes, such as insulin and hypothalamic-pituitary-adrenal (HPA) signaling.
2. Strong factors associated with psychologic resilience will be protective against the negative consequences of stress on aging. (These relationships are predictive, not causative, as this study is cross-sectional.)
The study
In their study, the team assessed 444 adults with no chronic medical conditions or psychiatric disorders who were 18-50 years of age and living in the greater New Haven area. Levels of obesity and alcohol consumption in the study cohort were generally in line with those in a community population, so alcohol use and body mass index were used as covariates to account for their impact on the results.
The team also used the latest “epigenetic clock,” known as GrimAge. In recent years, several methods of determining biologic age have been developed that trace chemical changes in the DNA that are natural to the aging process but occur at different moments in different people. The epigenetic clocks have proved to be better predictors of longevity and health than chronologic age, and GrimAge predicts mortality better than other epigenetic clocks.
Results
1. Cumulative stress was associated with the acceleration of GrimAge and stress-related physiologic measures of adrenal sensitivity (cortisol/ACTH ratio) and insulin resistance (HOMA). After the researchers controlled for demographic and behavioral factors, HOMA was correlated with GrimAge acceleration.
2. Psychologic resilience factors moderated the association between stress and aging, such that with worse regulation of emotions, there was greater stress-related age acceleration, and with stronger regulation of emotions, any significant effect of stress on GrimAge was prevented. Self-control moderated the relationship between stress and insulin resistance, with high self-control blunting this relationship.
3. In the final model, in those with poor emotion regulation, cumulative stress continued to predict additional GrimAge acceleration, even when demographic, physiologic, and behavioral covariates were accounted for.
Implications
These results elegantly demonstrate that cumulative stress is associated with epigenetic aging in a healthy population, and these associations are modified by biobehavioral resilience factors.
Even after adjustment for demographic and behavioral factors – such as smoking, body mass index, race, and income – people with high chronic stress scores showed markers of accelerated aging and physiologic changes, such as increased insulin resistance.
However, individuals with high scores on two psychologic resilience measures – emotion regulation and self-control – were more resilient to the effects of stress on aging and insulin resistance.
These results support the popular notion that
In other words, the greater the psychologic resilience, the more likely the individual is to live a long and healthy life. “We like to feel as if we have some sovereignty over our destiny and, therefore, it is worth emphasizing to people (and healthcare providers) that it is important to invest in mental health,” said one of the study researchers.
With all the stress we face these days, it is essential to remember that there is no health without mental health. Above all, if we can achieve greater psychologic resilience, we will have a better chance of delaying aging.
A version of this article first appeared on Medscape.com.
Why do some people escape infection that sickens others?
During the COVID-19 pandemic, we’ve seen this play out time and time again when whole families get sick except for one or two fortunate family members. And at so-called superspreader events that infect many, a lucky few typically walk away with their health intact. Did the virus never enter their bodies? Or do some people have natural resistance to pathogens they’ve never been exposed to before encoded in their genes?
Resistance to infectious disease is much more than a scientific curiosity and studying how it works can be a path to curb future outbreaks.
“In the event that we could identify what makes some people resistant, that immediately opens avenues for therapeutics that we could apply in all those other people who do suffer from the disease,” says András Spaan, MD, a microbiologist at Rockefeller University in New York.
Dr. Spaan is part of an international effort to identify genetic variations that spare people from becoming infected with SARS-CoV-2, the virus that causes COVID-19.
There’s far more research on what drives the tendency to get infectious diseases than on resistance to them. But a few researchers are investigating resistance to some of the world’s most common and deadly infectious diseases, and in a few cases, they’ve already translated these insights into treatments.
Perhaps the strongest example of how odd genes of just a few people can inspire treatments to help many comes from research on the human immunodeficiency virus (HIV), the virus that causes acquired immune deficiency syndrome (AIDS).
A genetic quirk
In the mid-1990s, several groups of researchers independently identified a mutation in a gene called CCR5 linked to resistance to HIV infection.
The gene encodes a protein on the surface of some white blood cells that helps set up the movement of other immune cells to fight infections. HIV, meanwhile, uses the CCR5 protein to help it enter the white blood cells that it infects.
The mutation, known as delta 32, results in a shorter than usual protein that doesn’t reach the surface of the cell. People who carry two copies of the delta 32 form of CCR5 do not have any CCR5 protein on the outside of their white blood cells.
Researchers, led by molecular immunologist Philip Murphy, MD, at the National Institute of Allergy and Infectious Diseases in Bethesda, Md, showed in 1997 that people with two copies of the mutation were unusually common among a group of men who were at especially high risk of HIV exposure, but had never contracted the virus. And out of more than 700 HIV-positive people, none carried two copies of CCR5 delta 32.
Pharmaceutical companies used these insights to develop drugs to block CCR5 and delay the development of AIDS. For instance, the drug maraviroc, marketed by Pfizer, was approved for use in HIV-positive people in 2007.
Only a few examples of this kind of inborn, genetically determined complete resistance to infection have ever been heard of. All of them involve cell-surface molecules that are believed to help a virus or other pathogen gain entry to the cell.
Locking out illness
“The first step for any intracellular pathogen is getting inside the cell. And if you’re missing the doorway, then the virus can’t accomplish the first step in its life cycle,” Dr. Murphy says. “Getting inside is fundamental.”
Changes in cell-surface molecules can also make someone more likely to have an infection or severe disease. One such group of cell-surface molecules that have been linked to both increasing and decreasing the risk of various infections are histo-blood group antigens. The most familiar members of this group are the molecules that define blood types A, B, and O.
Scientists have also identified one example of total resistance to infection involving these molecules. In 2003, researchers showed that people who lack a functional copy of a gene known as FUT2 cannot be infected with Norwalk virus, one of more than 30 viruses in the norovirus family that cause illness in the digestive tract.
The gene FUT2 encodes an enzyme that determines whether or not blood group antigens are found in a person’s saliva and other body fluids as well as on their red blood cells.
“It didn’t matter how many virus particles we challenged an individual with, if they did not have that first enzyme, they did not get infected,” says researcher Lisa Lindesmith, a virologist at the University of North Carolina in Chapel Hill.
No norovirus
Norwalk is a relatively rare type of norovirus. But FUT2 deficiency also provides some protection against the most common strains of norovirus, known as GII.4, which have periodically swept across the world over the past quarter-century. These illnesses take an especially heavy toll on children in the developing world, causing malnutrition and contributing to infant and child deaths.
But progress in translating these insights about genetic resistance into drugs or other things that could reduce the burden of noroviruses has been slow.
“The biggest barrier here is lack of ability to study the virus outside of humans,” Lindesmith says.
Noroviruses are very difficult to grow in the lab, “and there’s no small animal model of gastrointestinal illness caused by the viruses.”
We are clearly making giant strides in improving those skills,” says Lindesmith. “But we are just not quite there yet.”
In the years before COVID-19 emerged, tuberculosis was responsible for the largest number of annual worldwide deaths from an infectious disease. It’s a lung disease caused by the bacterium Mycobacterium tuberculosis, and it has been a pandemic for thousands of years.
Some 85%-95% of people with intact immune systems who are infected with TB control the infection and never get active lung disease. And some people who have intense, continuing exposure to the bacterium, which is spread through droplets and aerosols from people with active lung disease, apparently never become infected at all.
Thwarting uberculosis
Understanding the ways of these different forms of resistance could help in the search for vaccines, treatments, and other ways to fight tuberculosis, says Elouise Kroon, MD, a graduate student at Stellenbosch University in Cape Town, South Africa.
“What makes it particularly hard to study is the fact that there is no gold standard to measure infection,” she says. “So, what we do is infer infection from two different types of tests” -- a skin test and a blood test that measure different kinds of immune response to molecules from the bacterium.
Dr. Kroon and other researchers have studied resistance to infection by following people living in the same household as those with active lung disease or people who live and work in crowded conditions in high-risk communities. But not all such studies have used the same definition of so-called resisters, documented exposure in the same way, or followed up to ensure that people continue to test negative over the long term.
The best clue that has emerged from studies so far links resistance to infection to certain variations in immune molecules known as HLA class II antigens, says Marlo Möller, PhD, a professor in the TB Host Genetics Research Group at Stellenbosch University.
“That always seems to pop up everywhere. But the rest is not so obvious,” she says. “A lot of the studies don’t find the same thing. It’s different in different populations,” which may be a result of the long evolutionary history between tuberculosis and humans, as well as the fact that different strains of the bacterium are prevalent in different parts of the world.
COVID-19 is a much newer infectious disease, but teasing out how it contributes to both severe illness and resistance to infection is still a major task.
Overcoming COVID
Early in the pandemic, research by the COVID Human Genetic Effort, the international consortium that Dr. Spaan is part of, linked severe COVID-19 pneumonia to the lack of immune molecules known as type I interferons and to antibodies produced by the body that destroy these molecules. Together, these mechanisms explain about one-fifth of severe COVID-19 cases, the researchers reported in 2021.
A few studies by other groups have explored resistance to COVID-19 infection, suggesting that reduced risk of contracting the virus is tied to certain blood group factors. People with Type O blood appear to be at slightly reduced risk of infection, for example.
But the studies done so far are designed to find common genetic variations, which generally have a small effect on resistance. Now, genetic researchers are launching an effort to identify genetic resistance factors with a big effect, even if they are vanishingly rare.
The group is recruiting people who did not become infected with COVID-19 despite heavy exposure, such as those living in households where all the other members got sick or people who were exposed to a superspreader event but did not become ill. As with tuberculosis, being certain that someone has not been infected with the virus can be tricky, but the team is using several blood tests to home in on the people most likely to have escaped infection.
They plan to sequence the genomes of these people to identify things that strongly affect infection risk, then do more laboratory studies to try to tease out the means of resistance.
Their work is inspired by earlier efforts to uncover inborn resistance to infections, Dr. Spaan says. Despite the lack of known examples of such resistance, he is optimistic about the possibilities. Those earlier efforts took place in “a different epoch,” before there were rapid sequencing technologies, Dr. Spaan says.
“Now we have modern technologies to do this more systematically.”
The emergence of viral variants such as the Delta and Omicron COVID strains raises the stakes of the work, he continues.
“The need to unravel these inborn mechanisms of resistance to COVID has become even more important because of these new variants and the anticipation that we will have COVID with us for years.”
A version of this article first appeared on WebMD.com.
Boosted Americans 97 times less likely to die of COVID-19 than unvaccinated
according to a new update from the CDC.
In addition, fully vaccinated Americans — meaning those with up to two doses, but no booster — are 14 times less likely to die from COVID-19 than unvaccinated people.
“These data confirm that vaccination and boosting continues to protect against severe illness and hospitalization, even during the Omicron surge,” Rochelle Walensky, MD, director of the CDC, said during a briefing by the White House COVID-19 Response Team.
“If you are not up to date on your COVID-19 vaccinations, you have not optimized your protection against severe disease and death, and you should get vaccinated and boosted if you are eligible,” she said.
Dr. Walensky presented the latest numbers on Feb. 2 based on reports from 25 jurisdictions in early December. The number of average weekly deaths for those who were unvaccinated was 9.7 per 100,000 people, as compared with 0.7 of those who were vaccinated and 0.1 of those who had received a booster.
“The data are really stunningly obvious why a booster is really very important,” Anthony Fauci, MD, director of the National Institute of Allergy and Infectious Diseases, said during the briefing.
Dr. Fauci also encouraged vaccination for those who are pregnant and couples who may want to conceive in the near feature. He highlighted two recent studies that found vaccination in either partner didn’t affect fertility, including in vitro fertilization.
Meanwhile, fertility fell temporarily among men who were infected with the coronavirus. Couples were 18% less likely to conceive if the male partner had contracted the coronavirus within 60 days before a menstrual cycle.
“New data adds to previous studies that indicate that COVID-19 vaccination does not negatively impact fertility,” Dr. Fauci said. “Vaccination is recommended for people who are trying to get pregnant now or might become pregnant in the future, as well as their partners.”
About 80% of eligible Americans have received at least one vaccine dose, and 68% are fully vaccinated, according to the latest CDC data. About 51% of those who are eligible for a booster dose have received one.
The FDA could authorize the Pfizer vaccine for children under age 5 later this month. When that happens, about 18 million children will qualify for a shot, Jeff Zients, coordinator of the White House COVID-19 Response Team, said during the briefing. The Biden administration is already working on distribution plans for the shot for young kids, he added.
“We’ll be ready to start getting shots in arms soon after FDA and CDC make their decisions,” he said.
A version of this article first appeared on WebMD.com.