User login
Lucas Franki is an associate editor for MDedge News, and has been with the company since 2014. He has a BA in English from Penn State University and is an Eagle Scout.
Ebola outbreak in Mali expands to capital
New cases in Mali, unrelated to the initial Ebola case in the country, have been reported in the capital city of Bamako, according to a report from the World Health Organization.
Four Ebola patients were reported in Mali as of Nov. 11; all have died. The new outbreak started on Nov. 10 with a nurse who treated an imam who traveled to Mali from Guinea and died of undiagnosed kidney failure, a common symptom of Ebola. The nurse was isolated and Ebola was confirmed, but the nurse died the next day. A friend of the imam who visited him in Bamako also died suddenly, and is suspected to have had Ebola, the WHO said.
There were over 14,000 reported cases of Ebola in Guinea, Sierra Leone, and Liberia as of Nov. 9, with nearly half in Liberia, which has reported more than 6,800 cases and over 2,800 deaths. The reported decline in cases in Liberia has stabilized, and a reversal is possible, according to the WHO report. Guinea has reported nearly 1,900 cases and more than 1,110 deaths; and Sierra Leone has reported over 5,350 cases and more than 1,150 deaths.
In the United States and Spain, all potential Ebola contacts have completed a 21 day follow-up; both countries should be declared Ebola-free by the end of November. While contacts in the United States have completed the follow-up, health care workers who contracted Ebola in West Africa and were moved to the U.S. continue to be treated, according to the WHO.

Pap testing much less likely in women without regular provider
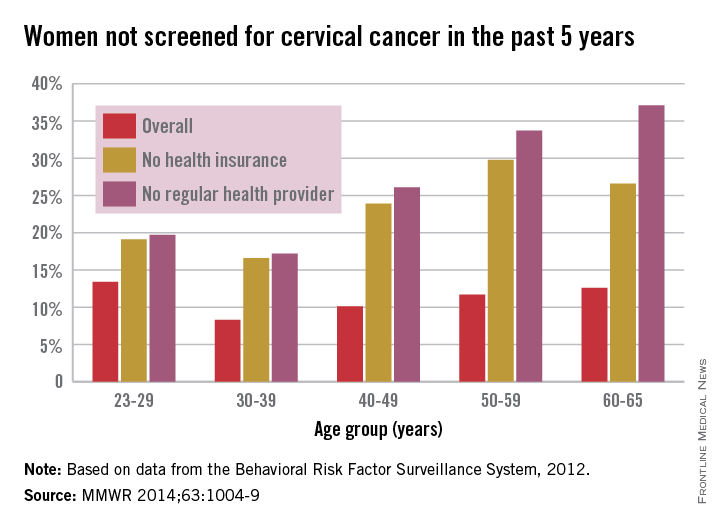
Adult women with no regular health care provider or no health insurance were much less likely to have been screened for cervical cancer in the past 5 years, a study from the Centers for Disease Control and Prevention showed.
In 2012, an estimated 11.4% of U.S. women aged 21-65 years had not had a Pap test to screen for cervical cancer in the past 5 years, compared with 25.5% of women without a regular health care provider and 23.1% of those without insurance, the CDC reported (MMWR 2014;63:1004-9).
By age group, women aged 30-39 years had the lowest overall rate, with only 8.3% not receiving screening in the past 5 years, as well as the lowest rates for those who did not have health insurance or a health care provider, at 16.6% and 17.2%, respectively. In 2012, women aged 23-29 years had the highest overall rate at 13.4%, women aged 50-59 years had the highest rate for no insurance at 29.8%, and women aged 60-65 years had the highest rate for no health care provider at 37.1%.
By ethnicity, black women had the lowest overall 5-year nonscreening rate at 9.2%, although Hispanics had the lowest rate for women without health insurance or a health care provider, at 16.7% and 18.4%, respectively. At 19.7%, Asian/Pacific Islanders had the highest overall rate, as well as the highest rate for women without health insurance at 32.5% and women without a regular health care provider at 40.8%, according to data from the Behavioral Risk Factor Surveillance System.
From 2007 to 2011, a total of 62,150 cervical cancer cases were reported in the United States, and in 2011, the incidence rate was 7.5 per 100,000 people, with the rate falling an average of 1.9% a year over that 5-year period. For the same time period, there were 19,969 deaths, with the overall U.S. death rate at 2.3 per 100,000 people in 2011, with a slight average decrease per year but not enough to be statistically significant, the CDC noted.
FROM MORBIDITY AND MORTALITY WEEKLY REPORT
Veterans more likely to have arthritis at any age
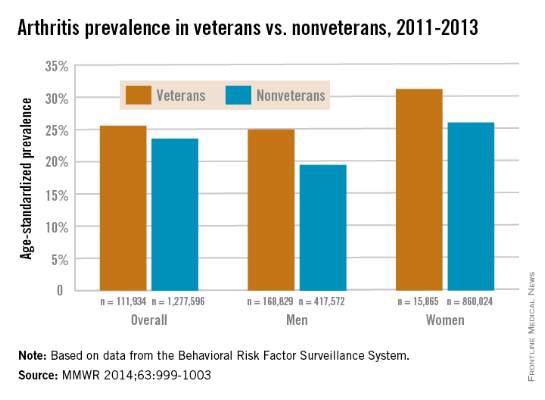
Both male and female veterans were more likely to have arthritis than were nonveterans, according to a study from the Centers for Disease Control and Prevention.
For male veterans, the age-standardized arthritis rate for 2011-2013 was 25%, while for male nonveterans, the rate was 19.5%. Both female veterans and nonveterans had noticeably higher arthritis incidence than did the respective male group: 31.3% for veterans and 26.1% for nonveterans, the CDC found (MMWR 2014;63:999-1003).
Although arthritis rates were higher overall in middle-aged and older people, arthritis rates were consistently higher in younger veterans aged 18-44 years – 11.6% for males and 17.3% for females – compared with 6.9% in male nonveterans and 9.8% in female nonveterans. This suggests “that arthritis and its effects need to be addressed among male and female veterans of all ages,” the CDC researchers said.
Traumatic and overuse injuries were found to be common among active-duty military personnel in another study, the investigators noted, while pointing out that musculoskeletal injuries are a major risk factor for osteoarthritis, which “represents the largest portion of arthritis cases” among veterans.
The study used data collected by the Behavioral Risk Factor Surveillance System.
FROM MORBIDITY AND MORTALITY WEEKLY REPORT
Skin Cancer Treatment Costs Skyrocket Over Past Decade
The average annual cost for skin cancer treatment more than doubled from 2002 to 2011, a report from the Centers for Disease Control and Prevention found.
From 2002 to 2006, the average annual skin cancer treatment cost was $3.6 billion, while for 2007-2011, the average annual cost was $8.1 billion, an increase of about 126%. The cost of nonmelanoma skin cancers increased 74%, from $2.7 billion to $4.8 billion, but the average annual cost for melanoma cancers increased about 280%, from $864 million to $3.3 billion, according to the CDC (Am. J. Prev. Med. 2014 Nov. 9 [doi:10.1016/j.amepre.2014.08.036]).
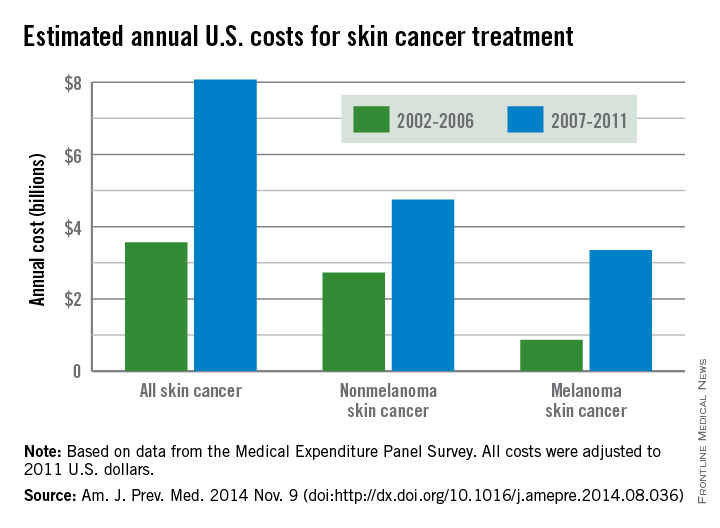
From 2002 to 2006, the average annual number of adults treated for skin cancer was 3.4 million, which increased to an average annual number of 4.9 million for 2007-2011. The average annual cost per person for all skin cancers increased by 57%, from $1,044 for 2002-2006 to $1,643 for 2007-2011, while the average cost for melanomas more than doubled from $2,320 to $4,780. The increase in annual cost for nonmelanoma skin cancers was more modest; only a 25% increase, from $882 to $1,105, was noted between the two time periods, the CDC reported.
The average annual cost for all cancer treatment rose from $67.3 billion for 2002-2006 to $87.8 billion for 2007-2011, an increase of $20.5 billion. While skin cancer treatment costs represented only 5% of all treatment costs in 2002-2006, the increase in skin cancer costs was 22% of the total increase, so from 2007 to 2011, skin cancer represented 9% of all treatment costs, according to data from the Medical Expenditure Panel Survey.
The average annual cost for skin cancer treatment more than doubled from 2002 to 2011, a report from the Centers for Disease Control and Prevention found.
From 2002 to 2006, the average annual skin cancer treatment cost was $3.6 billion, while for 2007-2011, the average annual cost was $8.1 billion, an increase of about 126%. The cost of nonmelanoma skin cancers increased 74%, from $2.7 billion to $4.8 billion, but the average annual cost for melanoma cancers increased about 280%, from $864 million to $3.3 billion, according to the CDC (Am. J. Prev. Med. 2014 Nov. 9 [doi:10.1016/j.amepre.2014.08.036]).
From 2002 to 2006, the average annual number of adults treated for skin cancer was 3.4 million, which increased to an average annual number of 4.9 million for 2007-2011. The average annual cost per person for all skin cancers increased by 57%, from $1,044 for 2002-2006 to $1,643 for 2007-2011, while the average cost for melanomas more than doubled from $2,320 to $4,780. The increase in annual cost for nonmelanoma skin cancers was more modest; only a 25% increase, from $882 to $1,105, was noted between the two time periods, the CDC reported.
The average annual cost for all cancer treatment rose from $67.3 billion for 2002-2006 to $87.8 billion for 2007-2011, an increase of $20.5 billion. While skin cancer treatment costs represented only 5% of all treatment costs in 2002-2006, the increase in skin cancer costs was 22% of the total increase, so from 2007 to 2011, skin cancer represented 9% of all treatment costs, according to data from the Medical Expenditure Panel Survey.
FROM THE AMERICAN JOURNAL OF PREVENTIVE MEDICINE

Skin cancer treatment costs skyrocket over past decade
The average annual cost for skin cancer treatment more than doubled from 2002 to 2011, a report from the Centers for Disease Control and Prevention found.
From 2002 to 2006, the average annual skin cancer treatment cost was $3.6 billion, while for 2007-2011, the average annual cost was $8.1 billion, an increase of about 126%. The cost of nonmelanoma skin cancers increased 74%, from $2.7 billion to $4.8 billion, but the average annual cost for melanoma cancers increased about 280%, from $864 million to $3.3 billion, according to the CDC (Am. J. Prev. Med. 2014 Nov. 9 [doi:10.1016/j.amepre.2014.08.036]).

From 2002 to 2006, the average annual number of adults treated for skin cancer was 3.4 million, which increased to an average annual number of 4.9 million for 2007-2011. The average annual cost per person for all skin cancers increased by 57%, from $1,044 for 2002-2006 to $1,643 for 2007-2011, while the average cost for melanomas more than doubled from $2,320 to $4,780. The increase in annual cost for nonmelanoma skin cancers was more modest; only a 25% increase, from $882 to $1,105, was noted between the two time periods, the CDC reported.
The average annual cost for all cancer treatment rose from $67.3 billion for 2002-2006 to $87.8 billion for 2007-2011, an increase of $20.5 billion. While skin cancer treatment costs represented only 5% of all treatment costs in 2002-2006, the increase in skin cancer costs was 22% of the total increase, so from 2007 to 2011, skin cancer represented 9% of all treatment costs, according to data from the Medical Expenditure Panel Survey.
The average annual cost for skin cancer treatment more than doubled from 2002 to 2011, a report from the Centers for Disease Control and Prevention found.
From 2002 to 2006, the average annual skin cancer treatment cost was $3.6 billion, while for 2007-2011, the average annual cost was $8.1 billion, an increase of about 126%. The cost of nonmelanoma skin cancers increased 74%, from $2.7 billion to $4.8 billion, but the average annual cost for melanoma cancers increased about 280%, from $864 million to $3.3 billion, according to the CDC (Am. J. Prev. Med. 2014 Nov. 9 [doi:10.1016/j.amepre.2014.08.036]).
From 2002 to 2006, the average annual number of adults treated for skin cancer was 3.4 million, which increased to an average annual number of 4.9 million for 2007-2011. The average annual cost per person for all skin cancers increased by 57%, from $1,044 for 2002-2006 to $1,643 for 2007-2011, while the average cost for melanomas more than doubled from $2,320 to $4,780. The increase in annual cost for nonmelanoma skin cancers was more modest; only a 25% increase, from $882 to $1,105, was noted between the two time periods, the CDC reported.
The average annual cost for all cancer treatment rose from $67.3 billion for 2002-2006 to $87.8 billion for 2007-2011, an increase of $20.5 billion. While skin cancer treatment costs represented only 5% of all treatment costs in 2002-2006, the increase in skin cancer costs was 22% of the total increase, so from 2007 to 2011, skin cancer represented 9% of all treatment costs, according to data from the Medical Expenditure Panel Survey.
FROM THE AMERICAN JOURNAL OF PREVENTIVE MEDICINE

Chlamydia infection rates down for females aged 15-19 years
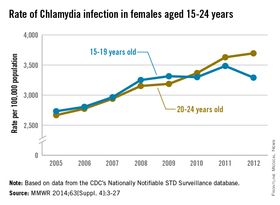
The rate of chlamydia infection for females aged 15-19 years dropped significantly in 2012, while the rate of infection for 20- to 24-year-old females continued to rise, the Centers for Disease Control and Prevention reported.
Chlamydia infection rates increased steadily from 2005 to 2009 for females aged 15-19 years, to a high of just over 3,300 per 100,000 population, but has remained near that rate, with a large rise in infection rate in 2011 balanced by the drop in 2012, according to the CDC.
There was no similar leveling off of infection rates for women aged 20-24 years, with chlamydia infection rates increasing from about 2,700 per 100,000 in 2005 to over 3,700 in 2012, an average annual increase of 4.9% a year.
“The observed increase in diagnosis reflects, at least in part, an increased effort to screen more women for chlamydia infection and bring more infected women in for treatment,” the CDC noted (MMWR 2014;63[Suppl. 4]:3-27).
The report used data from the CDC’s Nationally Notifiable STD Surveillance database.
FROM MMWR

Liberia reporting fewer new Ebola cases in recent weeks
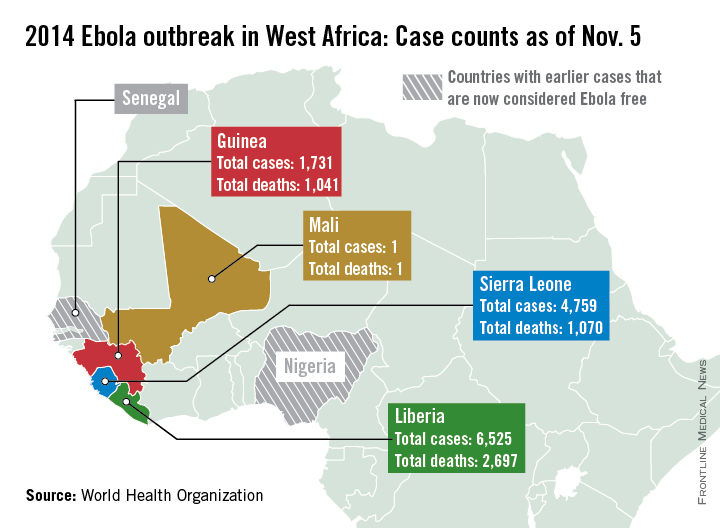
New Ebola case numbers appear to be declining in Liberia and stabilizing in Guinea, according to a report from the World Health Organization.
Only 89 new cases were reported in Liberia in the past week, considerably lower than in August and September when upward of 400 new cases were being reported weekly, the WHO reported, although data for Liberia are missing for Nov. 1 and 2. Guinea reported 93 new cases last week, slightly down from a peak in September and October; with the region of Gueckedou, the starting point of the epidemic, reporting no new cases.
Because of a change in the use of data sources, the number of cases and deaths is less than last week, the WHO explained, with just over 13,000 reported cases and about 4,800 deaths. Liberia has reported more than 6,500 cases and just under 2,700 deaths. Guinea has reported more than 1,700 cases and more than 1,000 deaths. Sierra Leone has more than 4,750 reported cases, but less than 1,100 deaths, only about 30 more than in Guinea. The reason for this is unclear, the report noted.
There have been no new reported cases of Ebola outside the outbreak area of Guinea, Liberia, and Sierra Leone. Mali and the United States continue to monitor potential contacts, while all contacts in Spain have completed a 21-day follow-up. Spain will be declared Ebola free 42 days from Oct. 21, the WHO reported. The unrelated Ebola outbreak in the Democratic Republic of the Congo also appears to be over, and the country should be declared Ebola free by the end of November.

US Preterm Birth Rate Falls to 17-Year Low
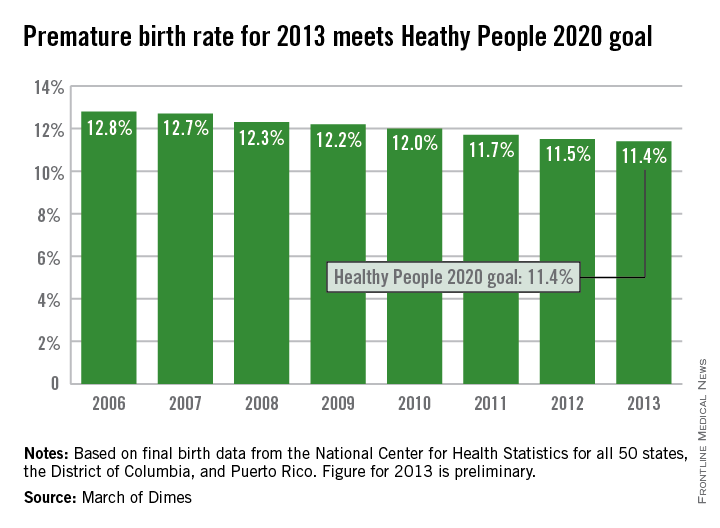
The U.S. preterm birth rate in 2013 was the lowest since 1996, reaching the Healthy People 2020 goal 7 years early, according to a report from the March of Dimes.
Although the U.S. preterm birth rate of 11.4% met the Healthy People 2020 goal, it earned only a C on the March of Dimes’ report card because it did not meet the organization’s goal of a 9.6% rate by 2020. “The U.S. still has one of the highest rates of preterm birth of any high-resource country and we must change that,” Dr. Jennifer L. Howse, March of Dimes president, said in a statement.
The preterm birth rate was at 12.8% in 2006, but since then the rate has declined slowly every year. More than 540,000 babies were born premature in 2006, but fewer than 460,000 were born in 2013. Overall, about 231,000 fewer babies were born preterm since 2006 through sustained intervention, saving $11.9 billion in health care costs, the March of Dimes noted.
The preliminary data for 2013 show that Vermont had the lowest preterm birth rate in the nation at 8.1%, followed by California at 8.8%, and New Hampshire at 9%. At 16.6%, Mississippi had the highest rate, with Alabama and Louisiana at 15.1%. The Southeast United States had the highest preterm birth rates of any region, with the five highest rates all in the Deep South and only Virginia having a rate below 12%, the March of Dimes reported, using data from the National Center for Health Statistics.
U.S. preterm birth rate falls to 17-year low
The U.S. preterm birth rate in 2013 was the lowest since 1996, reaching the Healthy People 2020 goal 7 years early, according to a report from the March of Dimes.
Although the U.S. preterm birth rate of 11.4% met the Healthy People 2020 goal, it earned only a C on the March of Dimes’ report card because it did not meet the organization’s goal of a 9.6% rate by 2020. “The U.S. still has one of the highest rates of preterm birth of any high-resource country and we must change that,” Dr. Jennifer L. Howse, March of Dimes president, said in a statement.
The preterm birth rate was at 12.8% in 2006, but since then the rate has declined slowly every year. More than 540,000 babies were born premature in 2006, but fewer than 460,000 were born in 2013. Overall, about 231,000 fewer babies were born preterm since 2006 through sustained intervention, saving $11.9 billion in health care costs, the March of Dimes noted.
The preliminary data for 2013 show that Vermont had the lowest preterm birth rate in the nation at 8.1%, followed by California at 8.8%, and New Hampshire at 9%. At 16.6%, Mississippi had the highest rate, with Alabama and Louisiana at 15.1%. The Southeast United States had the highest preterm birth rates of any region, with the five highest rates all in the Deep South and only Virginia having a rate below 12%, the March of Dimes reported, using data from the National Center for Health Statistics.

Eastern United States has the highest arthritis rates
The prevalence of arthritis tended to be higher in eastern U.S. states than in western states in 2011, according to a report from the Centers for Disease Control and Prevention.
All seven states with an arthritis rate below 22% were located west of the Mississippi River, with Hawaii having the lowest rate at 18.2%, followed by Utah (19.8%) and Texas (20.2%). The District of Columbia, which is in the East, had an arthritis rate of 20.9%.
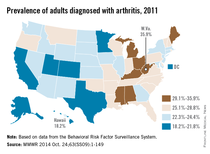
The eight states with an arthritis rate greater than 29% were all east of the Mississippi, with West Virginia having the highest prevalence (35.9%), followed by Kentucky (31.9%) and Michigan (31.0%), according to the report (MMWR 2014;63[SS09]:1-149).
Of 198 reported metropolitan and micropolitan statistical areas (MMSAs), 29 had an arthritis prevalence lower than 20%. Lawrence, Kan., had the lowest rate at 13.5%. Of the 29, only Atlanta; Knoxville, Tenn.; and Raleigh, N.C., are located entirely east of the Mississippi River. Kingsport-Bristol, in Tennessee and Virginia, had the highest arthritis rate at 37%. Of the 16 MMSAs with an arthritis rate greater than 30%, North Platte, Neb., was the only one west of the Mississippi, according to data from the Behavioral Risk Factor Surveillance System.
The prevalence of arthritis tended to be higher in eastern U.S. states than in western states in 2011, according to a report from the Centers for Disease Control and Prevention.
All seven states with an arthritis rate below 22% were located west of the Mississippi River, with Hawaii having the lowest rate at 18.2%, followed by Utah (19.8%) and Texas (20.2%). The District of Columbia, which is in the East, had an arthritis rate of 20.9%.
The eight states with an arthritis rate greater than 29% were all east of the Mississippi, with West Virginia having the highest prevalence (35.9%), followed by Kentucky (31.9%) and Michigan (31.0%), according to the report (MMWR 2014;63[SS09]:1-149).
Of 198 reported metropolitan and micropolitan statistical areas (MMSAs), 29 had an arthritis prevalence lower than 20%. Lawrence, Kan., had the lowest rate at 13.5%. Of the 29, only Atlanta; Knoxville, Tenn.; and Raleigh, N.C., are located entirely east of the Mississippi River. Kingsport-Bristol, in Tennessee and Virginia, had the highest arthritis rate at 37%. Of the 16 MMSAs with an arthritis rate greater than 30%, North Platte, Neb., was the only one west of the Mississippi, according to data from the Behavioral Risk Factor Surveillance System.
FROM MORBIDITY AND MORTALITY WEEKLY REPORT
