User login
Black Malar Papules Following Use of Hydroquinone Cream 2% Purchased Online
Black Malar Papules Following Use of Hydroquinone Cream 2% Purchased Online
To the Editor:
Exogenous ochronosis (EO) is a rare dyschromia that affects individuals with darker skin tones and results from the application of skin-lightening topical agents, most commonly those containing hydroquinone. Hydroquinone-induced EO usually is reported outside the United States, mainly in African and South Asian patients,1 as well as after long-term use of high‑concentration hydroquinone. We report a case of stage II EO that developed in a patient in the United States following 6 months' use of hydroquinone cream 2% that was purchased online.
A 75-year-old Black man presented to the dermatology clinic with dark discoloration on the cheeks of 6 months’ duration. He reported that the hyperpigmentation had developed after 6 months of daily use of an over-the-counter (OTC) cream containing 2% hydroquinone, which he purchased online to treat melasma of the bilateral cheeks and temples that had been present for at least a decade. The patient was otherwise healthy and did not take any other daily medications. He was a landscaper by occupation and spent most days outdoors. He reported a history of recurrent blistering sunburns and reported that he applied sunscreen with a sun protection factor of 30 to the face on most days.
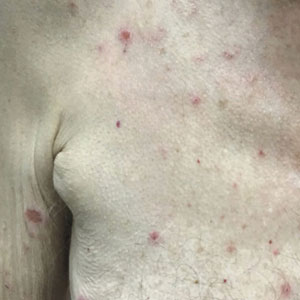
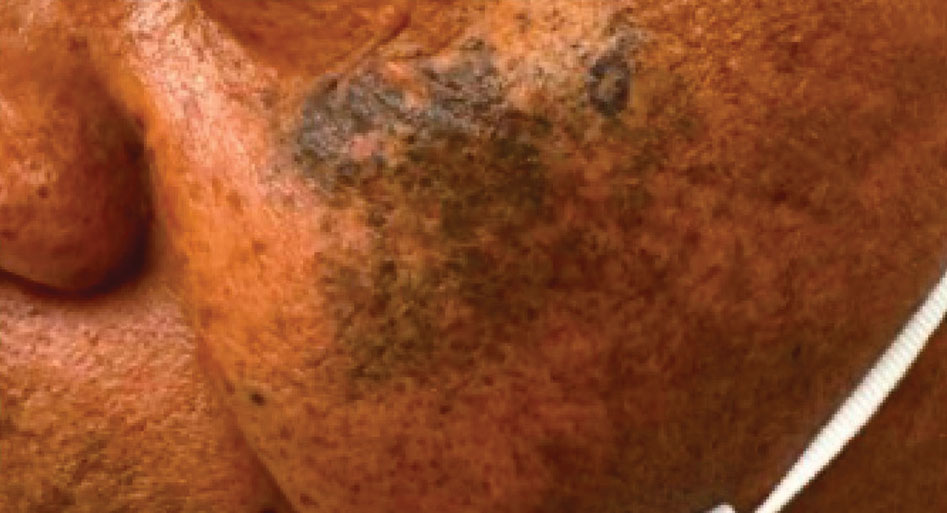
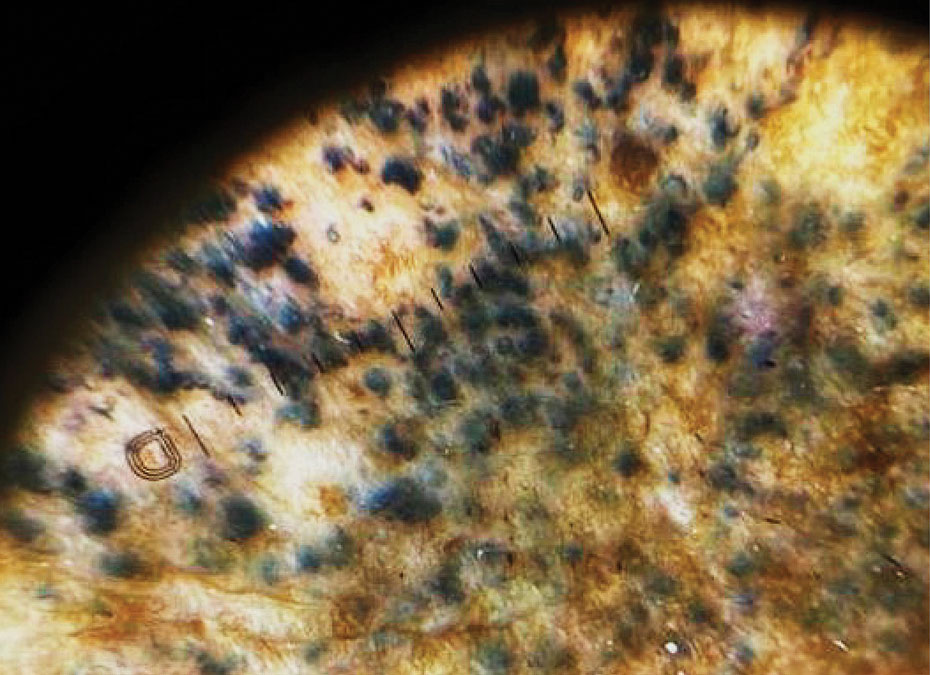
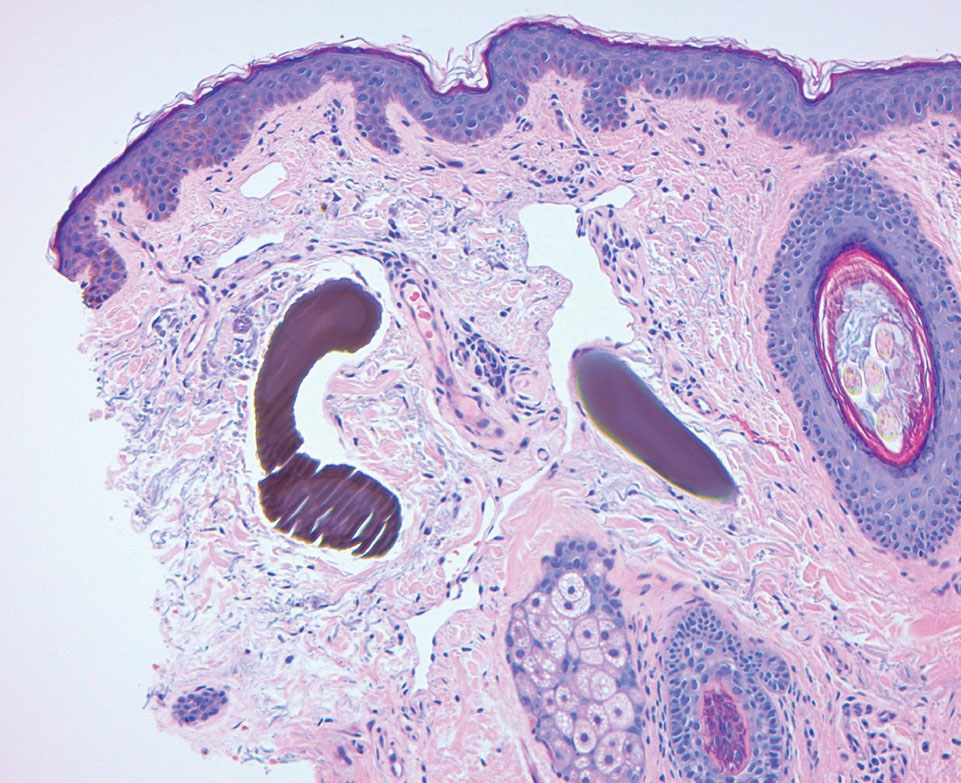
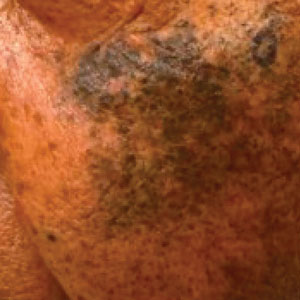
Physical examination revealed gray-black, coarsely textured papules and plaques on a background of brown pigmentation involving the malar cheeks. Reticulated, blue-black, caviarlike papules were present within the plaques (Figure 1). Dermoscopy revealed blue-black globules and globularlike structures on a brown background with the absence of follicular openings (Figure 2). A punch biopsy from the left malar cheek revealed banana-shaped, yellow-brown deposits with heavy elastosis in the superficial dermis (Figure 3). The patient was advised to permanently discontinue hydroquinone and was prescribed topical adapalene. He was evaluated for treatment with a fractional erbium-doped yttrium aluminum garnet laser but ultimately elected not to pursue treatment.
Hydroquinone has long been a first-line topical agent for the treatment of skin dyschromia. It generally is regarded as a safe and effective therapy when used under the supervision of a dermatologist. Prolonged use of topical hydroquinone is known to induce paradoxical EO. This acquired dyschromia is characterized by the development of blue-black or gray-blue pigmented patches as well as caviarlike black papules, papulonodules, and skin atrophy in more severe cases.2 Most cases are documented in African and South Asian countries, with fewer than 100 cases described in the United States.2 Despite the rarity of EO in the United States, concerns regarding the unsupervised use of hydroquinone contributed to regulatory changes. In response to the CARES Act and Over-the-Counter Drug Monograph Reform, the sale of OTC hydroquinone-based products became prohibited in September 2020 in the United States.³ Prior to the CARES Act, an estimated 10 million tubes of OTC hydroquinone were sold, and approximately 330,000 prescriptions were written in 2019.2,4 Subsequently, its availability was converted to prescription only in the United States.
Exogenous ochronosis occurs in 3 clinical stages: (I) erythema and hyperpigmentation, (II) black colloid milia (caviarlike papules) and atrophy, and (III) papulonodules.1 Our patient’s case was unusual, as EO is most commonly described after exposure to high concentrations and prolonged hydroquinone treatment. In a global retrospective review of 126 patients of varied racial and ethnic backgrounds with hydroquinone-induced ochronosis, EO was most frequently reported with concentrations exceeding 4%. The median duration of use was 5 years, and only 12 cases (9.5%) of EO were reported with 1 year of use or less, including 4 cases with 3 months or less of use.1
While large epidemiologic studies from South Africa have reported EO prevalence rates as high as 69% among users of skin-lightening products,6 a search of the PubMed, Scopus, and Web of Science databases using the terms exogenous ochronosis and hydroquinone identified only 39 cases in US-based literature between 1983 and 2020.2 In a retrospective review of 25 cases of EO in the United States, the average length of product use was 9.2 years, and the shortest duration was 1.5 years.7
The pathogenesis of EO is thought to occur due to the inhibitive effect of topical hydroquinone on homogentisic acid oxidase, resulting in the accumulation of homogentisic acid in tissues and ochronotic deposits.1,5 We suspect that our patient’s occupation as a landscaper and associated chronic sun exposure may have accelerated the development of EO, as UV exposure and inadequate photoprotection have been described as risk factors in the development and severity of EO.8 Although the patient reported daily application of sun protection factor 30 sunscreen, the extent of his outdoor occupational exposure may have exceeded the protection afforded.
Treatment of EO is notoriously challenging, and skin changes often are permanent. Of the 25 patients identified in a 10-year retrospective analysis of EO at a single US center, none responded to topical treatment alone.7 Among those who underwent procedural interventions, 3 patients treated with microneedling and 3 patients treated with Q-switched Alexandrite laser demonstrated favorable outcomes; however, this was a retrospective chart review, not a controlled trial with predefined treatment arms.7 Bellew et al9 reported 2 patients with EO who showed progressive lightening in response to Q-switched Alexandrite laser treatments. In this case series, the first patient received 6 treatments at 2-month intervals and the second received 4 treatments at 4-month intervals. Posttreatment biopsies demonstrated decreased dermal pigmentation, and neither patient experienced scarring or textural changes. Méndez Baca et al10 demonstrated successful lightening of pigmentation in a patient with medium-toned skin following 9 sessions with a fractional nonablative picosecond laser. Ceglio et al11 described a stepwise treatment approach in a patient with dark brown skin with EO, beginning with 12 sessions of a 1064-nm Q-switched Nd:YAG laser that yielded slight improvement, followed by 7 sessions of intense pulsed light therapy with partial response, and ultimately achieving marked improvement after 5 bimonthly sessions of fractional 10,600-nm carbon dioxide laser.
This case highlights the potential for EO to develop even with low-concentration (2%) hydroquinone obtained through unregulated online sources, underscoring the need for dermatologist supervision when hydroquinone is used. Despite the 2020 prohibition of OTC hydroquinone sales in the United States, patients continue to access these products online. Clinicians should maintain a high index of suspicion for EO in patients presenting with paradoxical facial hyperpigmentation and a history of unsupervised hydroquinone use.
- Ishack S, Lipner SR. Exogenous ochronosis associated with hydroquinone: a systematic review. Int J Dermatol. 2022;61:675-684. doi:10.1111/ijd.15878
- Qorbani A, Mubasher A, Sarantopoulos GP, et al. Exogenous ochronosis (EO): skin lightening cream causing rare caviar-like lesion with banana-like pigments; review of literature and histological comparison with endogenous counterpart. Autops Case Rep. 2020;10:E2020197. doi:10.4322/acr.2020.197
- Coronavirus Aid, Relief, and Economic Security (CARES) Act, Pub L No. 116-136, §3851, 134 Stat 281 (2020).
- Hydroquinone, found in skin lightening agents worldwide, linked with increased skin cancer risk. Medscape. August 26, 2022. Accessed June 5, 2026.
- Dogliotti M, Leibowitz M. Granulomatous ochronosis—a cosmetic-induced skin disorder in Blacks. S Afr Med J. 1979;56:757-760.
- Hardwick N, Van Gelder LW, Van der Merwe CA, Van der Merwe MP. Exogenous ochronosis: an epidemiological study. Br J Dermatol. 1989;120:229-238. doi:10.1111/j.1365-2133.1989.tb07787.x
- Lazar M, De La Garza H, Vashi NA. Exogenous ochronosis: characterizing a rare disorder in skin of color. J Clin Med. 2023;12:4341. doi:10.3390/jcm12134341
- Findlay GH, de Beer HA. Chronic hydroquinone poisoning of the skin from skin-lightening cosmetics. A South African epidemic of ochronosis of the face in dark-skinned individuals. S Afr Med J. 1980;57:187-190.
- Bellew SG, Alster TS. Treatment of exogenous ochronosis with a Q-switched alexandrite (755 nm) laser. Dermatol Surg. 2004;30:555-558. doi:10.1111/j.1524-4725.2004.30177.x
- Méndez Baca I, Al-Niaimi F, Colina C, et al. A case of ochronosis successfully treated with the picosecond laser. J Cosmet Dermatol. 2019;18:1322-1325. doi:10.1111/jocd.12834
- Ceglio WW, Careta MF, Patriota R, et al. Exogenous ochronosis successfully treated with the combination of intense pulsed light and fractional CO2 laser. An Bras Dermatol. 2023;98:138-140. doi:10.1016/j.abd.2021.08.013
To the Editor:
Exogenous ochronosis (EO) is a rare dyschromia that affects individuals with darker skin tones and results from the application of skin-lightening topical agents, most commonly those containing hydroquinone. Hydroquinone-induced EO usually is reported outside the United States, mainly in African and South Asian patients,1 as well as after long-term use of high‑concentration hydroquinone. We report a case of stage II EO that developed in a patient in the United States following 6 months' use of hydroquinone cream 2% that was purchased online.
A 75-year-old Black man presented to the dermatology clinic with dark discoloration on the cheeks of 6 months’ duration. He reported that the hyperpigmentation had developed after 6 months of daily use of an over-the-counter (OTC) cream containing 2% hydroquinone, which he purchased online to treat melasma of the bilateral cheeks and temples that had been present for at least a decade. The patient was otherwise healthy and did not take any other daily medications. He was a landscaper by occupation and spent most days outdoors. He reported a history of recurrent blistering sunburns and reported that he applied sunscreen with a sun protection factor of 30 to the face on most days.
Physical examination revealed gray-black, coarsely textured papules and plaques on a background of brown pigmentation involving the malar cheeks. Reticulated, blue-black, caviarlike papules were present within the plaques (Figure 1). Dermoscopy revealed blue-black globules and globularlike structures on a brown background with the absence of follicular openings (Figure 2). A punch biopsy from the left malar cheek revealed banana-shaped, yellow-brown deposits with heavy elastosis in the superficial dermis (Figure 3). The patient was advised to permanently discontinue hydroquinone and was prescribed topical adapalene. He was evaluated for treatment with a fractional erbium-doped yttrium aluminum garnet laser but ultimately elected not to pursue treatment.
Hydroquinone has long been a first-line topical agent for the treatment of skin dyschromia. It generally is regarded as a safe and effective therapy when used under the supervision of a dermatologist. Prolonged use of topical hydroquinone is known to induce paradoxical EO. This acquired dyschromia is characterized by the development of blue-black or gray-blue pigmented patches as well as caviarlike black papules, papulonodules, and skin atrophy in more severe cases.2 Most cases are documented in African and South Asian countries, with fewer than 100 cases described in the United States.2 Despite the rarity of EO in the United States, concerns regarding the unsupervised use of hydroquinone contributed to regulatory changes. In response to the CARES Act and Over-the-Counter Drug Monograph Reform, the sale of OTC hydroquinone-based products became prohibited in September 2020 in the United States.³ Prior to the CARES Act, an estimated 10 million tubes of OTC hydroquinone were sold, and approximately 330,000 prescriptions were written in 2019.2,4 Subsequently, its availability was converted to prescription only in the United States.
Exogenous ochronosis occurs in 3 clinical stages: (I) erythema and hyperpigmentation, (II) black colloid milia (caviarlike papules) and atrophy, and (III) papulonodules.1 Our patient’s case was unusual, as EO is most commonly described after exposure to high concentrations and prolonged hydroquinone treatment. In a global retrospective review of 126 patients of varied racial and ethnic backgrounds with hydroquinone-induced ochronosis, EO was most frequently reported with concentrations exceeding 4%. The median duration of use was 5 years, and only 12 cases (9.5%) of EO were reported with 1 year of use or less, including 4 cases with 3 months or less of use.1
While large epidemiologic studies from South Africa have reported EO prevalence rates as high as 69% among users of skin-lightening products,6 a search of the PubMed, Scopus, and Web of Science databases using the terms exogenous ochronosis and hydroquinone identified only 39 cases in US-based literature between 1983 and 2020.2 In a retrospective review of 25 cases of EO in the United States, the average length of product use was 9.2 years, and the shortest duration was 1.5 years.7
The pathogenesis of EO is thought to occur due to the inhibitive effect of topical hydroquinone on homogentisic acid oxidase, resulting in the accumulation of homogentisic acid in tissues and ochronotic deposits.1,5 We suspect that our patient’s occupation as a landscaper and associated chronic sun exposure may have accelerated the development of EO, as UV exposure and inadequate photoprotection have been described as risk factors in the development and severity of EO.8 Although the patient reported daily application of sun protection factor 30 sunscreen, the extent of his outdoor occupational exposure may have exceeded the protection afforded.
Treatment of EO is notoriously challenging, and skin changes often are permanent. Of the 25 patients identified in a 10-year retrospective analysis of EO at a single US center, none responded to topical treatment alone.7 Among those who underwent procedural interventions, 3 patients treated with microneedling and 3 patients treated with Q-switched Alexandrite laser demonstrated favorable outcomes; however, this was a retrospective chart review, not a controlled trial with predefined treatment arms.7 Bellew et al9 reported 2 patients with EO who showed progressive lightening in response to Q-switched Alexandrite laser treatments. In this case series, the first patient received 6 treatments at 2-month intervals and the second received 4 treatments at 4-month intervals. Posttreatment biopsies demonstrated decreased dermal pigmentation, and neither patient experienced scarring or textural changes. Méndez Baca et al10 demonstrated successful lightening of pigmentation in a patient with medium-toned skin following 9 sessions with a fractional nonablative picosecond laser. Ceglio et al11 described a stepwise treatment approach in a patient with dark brown skin with EO, beginning with 12 sessions of a 1064-nm Q-switched Nd:YAG laser that yielded slight improvement, followed by 7 sessions of intense pulsed light therapy with partial response, and ultimately achieving marked improvement after 5 bimonthly sessions of fractional 10,600-nm carbon dioxide laser.
This case highlights the potential for EO to develop even with low-concentration (2%) hydroquinone obtained through unregulated online sources, underscoring the need for dermatologist supervision when hydroquinone is used. Despite the 2020 prohibition of OTC hydroquinone sales in the United States, patients continue to access these products online. Clinicians should maintain a high index of suspicion for EO in patients presenting with paradoxical facial hyperpigmentation and a history of unsupervised hydroquinone use.
- Ishack S, Lipner SR. Exogenous ochronosis associated with hydroquinone: a systematic review. Int J Dermatol. 2022;61:675-684. doi:10.1111/ijd.15878
- Qorbani A, Mubasher A, Sarantopoulos GP, et al. Exogenous ochronosis (EO): skin lightening cream causing rare caviar-like lesion with banana-like pigments; review of literature and histological comparison with endogenous counterpart. Autops Case Rep. 2020;10:E2020197. doi:10.4322/acr.2020.197
- Coronavirus Aid, Relief, and Economic Security (CARES) Act, Pub L No. 116-136, §3851, 134 Stat 281 (2020).
- Hydroquinone, found in skin lightening agents worldwide, linked with increased skin cancer risk. Medscape. August 26, 2022. Accessed June 5, 2026.
- Dogliotti M, Leibowitz M. Granulomatous ochronosis—a cosmetic-induced skin disorder in Blacks. S Afr Med J. 1979;56:757-760.
- Hardwick N, Van Gelder LW, Van der Merwe CA, Van der Merwe MP. Exogenous ochronosis: an epidemiological study. Br J Dermatol. 1989;120:229-238. doi:10.1111/j.1365-2133.1989.tb07787.x
- Lazar M, De La Garza H, Vashi NA. Exogenous ochronosis: characterizing a rare disorder in skin of color. J Clin Med. 2023;12:4341. doi:10.3390/jcm12134341
- Findlay GH, de Beer HA. Chronic hydroquinone poisoning of the skin from skin-lightening cosmetics. A South African epidemic of ochronosis of the face in dark-skinned individuals. S Afr Med J. 1980;57:187-190.
- Bellew SG, Alster TS. Treatment of exogenous ochronosis with a Q-switched alexandrite (755 nm) laser. Dermatol Surg. 2004;30:555-558. doi:10.1111/j.1524-4725.2004.30177.x
- Méndez Baca I, Al-Niaimi F, Colina C, et al. A case of ochronosis successfully treated with the picosecond laser. J Cosmet Dermatol. 2019;18:1322-1325. doi:10.1111/jocd.12834
- Ceglio WW, Careta MF, Patriota R, et al. Exogenous ochronosis successfully treated with the combination of intense pulsed light and fractional CO2 laser. An Bras Dermatol. 2023;98:138-140. doi:10.1016/j.abd.2021.08.013
Black Malar Papules Following Use of Hydroquinone Cream 2% Purchased Online
Black Malar Papules Following Use of Hydroquinone Cream 2% Purchased Online
Practice Points
- Exogenous ochronosis (EO) is a rare adverse effect of topical hydroquinone characterized by blue-black or gray-blue pigmentation, caviarlike papules, and distinctive banana-shaped dermal deposits on histopathology.
- Most reported cases of hydroquinone-induced EO occur after prolonged use of concentrations exceeding 4%; this case developed after only 6 months of exposure to hydroquinone cream 2% purchased online.
- Available evidence suggests that laser-based therapies may offer greater improvement than topical treatments in affected patients.
Rosacea: We Still Haven’t Found What We’re Looking For
Rosacea: We Still Haven’t Found What We’re Looking For
In May 1987, U2 released “I Still Haven’t Found What I’m Looking For” as a single from their legendary fifth album, The Joshua Tree. The song became their second consecutive #1 hit in the United States to chart on the Billboard Hot 100.1 Here I am, almost 4 decades later, composing an editorial focused on where we are now in dermatology with rosacea. The first thought that came to mind is that U2 was right—and still is—because with rosacea, we still haven’t found what we’re looking for.
In this editorial, I am discussing cutaneous rosacea, not including ocular disease and phymatous changes. The first challenge with cutaneous rosacea is to get the dermatology community on the same page with what the clinical disease state includes, as the individual “dots” that comprise the pathophysiology of rosacea are not similarly connected in each affected patient. This confounds our ability to effectively treat the disease state in many cases, as the clinical manifestations of rosacea are highly variable, reflecting relative contributions from different components of the pathophysiology.2-5
On top of this challenge, the vast majority of US Food and Drug Administration (FDA)–approved therapies for rosacea have been directed at reducing papules and pustules, which are not present in all patients, and their associated perilesional erythema.6,7 We have only had topical alpha agonists as FDA-approved therapies for persistent facial erythema, the superficial vascular component of rosacea that is distinct from the papulopustular component and can intensify during flares with flushing episodes. A major limitation of the alpha-agonist topical approach is the short duration of their effects, which last only hours, and the need for consistent application over time, which can be frustrating for patients. Physical modalities such as lights and lasers offer marked assistance, especially for the superficial vascular component, but may be limited by availability, cost, and differences in expertise. Is the above challenging enough? Keep in mind that I still have not addressed the skin barrier aspects of the disease, symptomatology, and patient education challenges.
I don’t want to sound as if dermatology has been defeated, as we have actually been able to provide marked improvement for many patients with rosacea.6-9 This is especially true in those who present with papules and pustules and also are compliant and patient enough to allow for the integration of the topical and/or physical therapies needed to treat the vascular components including telangiectasias. What has lagged has been the ability to develop a more comprehensive selection of pharmaceutical options, as most have targeted the papulopustular manifestation of the disease. There are many highly effective options in this “papules and pustules of rosacea” space, including topical ivermectin, azelaic acid, and metronidazole, along with the addition of a foam formulation of minocycline, a microencapsulated formulation of benzoyl peroxide, and low-dose oral minocycline. What mostly limits experience with newer FDA-approved therapies is access for patients due to insurance coverage issues and generic substitutions. Overall, the development of newer FDA-approved pharmacologic therapies has become relatively stagnant and remains so at the present time.6-9
So where are we now? Much of the emphasis on rosacea management has transitioned to alternative areas of consideration, including skin care and barrier dysfunction, the role of vitamins and other nutrients, and use of natural compounds.
An algorithm created by a consensus panel of dermatologists has provided foundational measures recommended for use in all patients with rosacea and rosacea-prone skin, including education, behavioral modifications, recognition and avoidance of triggers, avoidance of skin irritants, preventive skin care, and sun photoprotection measures.10 The algorithm emphasizes that assessment of an individual’s facial skin condition and grading of cutaneous rosacea are very important at the first visit and continually thereafter during treatment while the preventive measures continue. Individual dermatology panels have published on skin care nuances suggested for specific patient subgroups such as skin of color and Asian and Latino populations.11-13 While the importance of skin care and skin barrier function in rosacea are well known to the dermatology community, it is essential for clinicians to consistently emphasize this importance to their patients and their staff.
A relatively recent publication has thoroughly addressed the potential roles of vitamins and nutrients in rosacea, discussing both systemic supplementation and topical approaches. A variety of ingredients were evaluated—including vitamin B3, a vitamin A derivative, vitamin C, vitamin D, zinc formulations, and omega-3 fatty acids—demonstrating a range of outcomes.14 There are data that support the potential of vitamins and nutrients as an adjunctive approach; however, at present, this area holds potential for future advancement without any definitive products or well-established recommendations available. More well-designed studies that are targeted for specific rosacea populations are needed.
A large array of natural compounds, primarily botanicals and phytochemicals, have been discussed in the literature for both short- and long-term management of rosacea.15 Many cosmeceutical products are gaining public notoriety, as the concept of “natural” is appealing to the lay population due to the assumption that natural implies greater safety, which is not necessarily true. Semenescu et al15 provided a very comprehensive review of the applicable characteristics of several plant-based agents and potential mechanisms that may be beneficial as adjunctive agents in rosacea. Similar to vitamins and nutrients, there is some scientific basis for the routine integration of natural phytochemicals, but research is needed with well-designed studies used in targeted specific rosacea populations.
Unfortunately, I cannot finish this editorial with ground-breaking news about a new gamechanger approach or product; however, I can tell you that dermatology never gives up. Advances in developing adjunctive therapies and future disease targets such as mast cell activation, microvesicle particles, NLRP3 inflammasome pathway, and Janus kinase inhibition are always in motion, and we continue to try to find what we’re looking for.16
- U2. “I Still Haven’t Found What I’m Looking For.” Wikipedia. Accessed May 17, 2026. https://en.wikipedia.org/wiki/I_Still_Haven%27t_Found_What_I%27m_Looking_For
- Geng RSQ, Bourkas AN, Mufti A, et al. Rosacea: pathogenesis and therapeutic correlates. J Cutan Med Surg. 2024;28:178-189. doi:10.1177/12034754241229365
- Yang F, Wang L, Song D, et al. Signaling pathways and targeted therapy for rosacea. Front Immunol. 2024;16:15:1367994. doi:10.3389/fimmu.2024.1367994
- Andrusiewicz A, Khimuk S, Mijas D, et al. Molecular mechanisms in the etiopathology of rosacea-systematic review. Int J Mol Sci. 2025;26:11292. doi:10.3390/ijms262311292
- Schaller M, Almeida LMC, Bewley A, et al. Recommendations for rosacea diagnosis, classification and management: update from the global ROSacea COnsensus 2019 panel. Br J Dermatol. 2020;182:1269-1276. doi:10.1111/bjd.18420
- Del Rosso JQ, Tanghetti E, Webster G, et al. Update on the management of rosacea from the American Acne & Rosacea Society (AARS). Clin Aesthet Dermatol. 2020;13(6 suppl):S17-S24.
- van Zuuren EJ, Arents BWM, van der Linden MMD, et al. Rosacea: new concepts in classification and treatment. Am J Clin Dermatol. 2021;22:457-465. doi:10.1007/s40257-021-00595-7
- Tu KY, Jung CJ, Shih YH, et al. Therapeutic strategies focusing on immune dysregulation and neuroinflammation in rosacea. Front Immunol. 2024;15:1403798. doi:10.3389/fimmu.2024.1403798
- Schaller M, Almeida LMC, Bewley A, et al. Recommendations for rosacea diagnosis, classification and management: update from the global ROSacea COnsensus 2019 panel. Br J Dermatol. 2020;182:1269-1276. doi:10.1111/bjd.18420
- Baldwin H, Alexis A, Andriessen A, et al. Skin barrier deficiency in rosacea: an algorithm integrating OTC skincare products into treatment regimens. Drugs Dermatol. 2022;21:SF3595563-SF35955610. doi:10.36849/JDD.m0922
- Alexis A, Woolery-Lloyd H, Andriessen A, et al. Improving rosacea outcomes in skin of color patients: a review on the nuances in the treatment and the use of cleansers and moisturizers. J Drugs Dermatol. 2022;21:574-580. doi:10.36849/JDD.6838
- Kulthanan K, Andriessen A, Jiang X, et al. A review of the challenges and nuances in treating rosacea in Asian skin types using cleansers and moisturizers as adjuncts. J Drugs Dermatol. 2023;22:45-53. doi:10.36849/JDD.7021
- Gonzalez C, Andriessen A, Antelo D, et al. Treatment and maintenance of cutaneous rosacea in Latino skin types with prescription medications and non-prescription cleansers and moisturizers as adjuncts: a review. J Drugs Dermatol. 2022;21:1111-1118. doi:10.36849/JDD.7010
- Algarin YA, Pulumati A, Jaalouk D, et al. The role of vitamins and nutrients in rosacea. Arch Dermatol Res. 2024;316:142. doi:10.1007/s00403-024-02895-4
- Semenescu J, Similie D, Diaconeasa Z, et al. Recent advances in the management of rosacea through natural compounds. Pharmaceuticals (Basel). 2024;17:212. doi:10.3390/ph17020212
- Fisher GW, Travers JB, Rohan CA. Rosacea pathogenesis and therapeutics: current treatments and a look at future targets. Front Med (Lausanne). 2023;10:1292722. doi:10.3389/fmed.2023.1292722
In May 1987, U2 released “I Still Haven’t Found What I’m Looking For” as a single from their legendary fifth album, The Joshua Tree. The song became their second consecutive #1 hit in the United States to chart on the Billboard Hot 100.1 Here I am, almost 4 decades later, composing an editorial focused on where we are now in dermatology with rosacea. The first thought that came to mind is that U2 was right—and still is—because with rosacea, we still haven’t found what we’re looking for.
In this editorial, I am discussing cutaneous rosacea, not including ocular disease and phymatous changes. The first challenge with cutaneous rosacea is to get the dermatology community on the same page with what the clinical disease state includes, as the individual “dots” that comprise the pathophysiology of rosacea are not similarly connected in each affected patient. This confounds our ability to effectively treat the disease state in many cases, as the clinical manifestations of rosacea are highly variable, reflecting relative contributions from different components of the pathophysiology.2-5
On top of this challenge, the vast majority of US Food and Drug Administration (FDA)–approved therapies for rosacea have been directed at reducing papules and pustules, which are not present in all patients, and their associated perilesional erythema.6,7 We have only had topical alpha agonists as FDA-approved therapies for persistent facial erythema, the superficial vascular component of rosacea that is distinct from the papulopustular component and can intensify during flares with flushing episodes. A major limitation of the alpha-agonist topical approach is the short duration of their effects, which last only hours, and the need for consistent application over time, which can be frustrating for patients. Physical modalities such as lights and lasers offer marked assistance, especially for the superficial vascular component, but may be limited by availability, cost, and differences in expertise. Is the above challenging enough? Keep in mind that I still have not addressed the skin barrier aspects of the disease, symptomatology, and patient education challenges.
I don’t want to sound as if dermatology has been defeated, as we have actually been able to provide marked improvement for many patients with rosacea.6-9 This is especially true in those who present with papules and pustules and also are compliant and patient enough to allow for the integration of the topical and/or physical therapies needed to treat the vascular components including telangiectasias. What has lagged has been the ability to develop a more comprehensive selection of pharmaceutical options, as most have targeted the papulopustular manifestation of the disease. There are many highly effective options in this “papules and pustules of rosacea” space, including topical ivermectin, azelaic acid, and metronidazole, along with the addition of a foam formulation of minocycline, a microencapsulated formulation of benzoyl peroxide, and low-dose oral minocycline. What mostly limits experience with newer FDA-approved therapies is access for patients due to insurance coverage issues and generic substitutions. Overall, the development of newer FDA-approved pharmacologic therapies has become relatively stagnant and remains so at the present time.6-9
So where are we now? Much of the emphasis on rosacea management has transitioned to alternative areas of consideration, including skin care and barrier dysfunction, the role of vitamins and other nutrients, and use of natural compounds.
An algorithm created by a consensus panel of dermatologists has provided foundational measures recommended for use in all patients with rosacea and rosacea-prone skin, including education, behavioral modifications, recognition and avoidance of triggers, avoidance of skin irritants, preventive skin care, and sun photoprotection measures.10 The algorithm emphasizes that assessment of an individual’s facial skin condition and grading of cutaneous rosacea are very important at the first visit and continually thereafter during treatment while the preventive measures continue. Individual dermatology panels have published on skin care nuances suggested for specific patient subgroups such as skin of color and Asian and Latino populations.11-13 While the importance of skin care and skin barrier function in rosacea are well known to the dermatology community, it is essential for clinicians to consistently emphasize this importance to their patients and their staff.
A relatively recent publication has thoroughly addressed the potential roles of vitamins and nutrients in rosacea, discussing both systemic supplementation and topical approaches. A variety of ingredients were evaluated—including vitamin B3, a vitamin A derivative, vitamin C, vitamin D, zinc formulations, and omega-3 fatty acids—demonstrating a range of outcomes.14 There are data that support the potential of vitamins and nutrients as an adjunctive approach; however, at present, this area holds potential for future advancement without any definitive products or well-established recommendations available. More well-designed studies that are targeted for specific rosacea populations are needed.
A large array of natural compounds, primarily botanicals and phytochemicals, have been discussed in the literature for both short- and long-term management of rosacea.15 Many cosmeceutical products are gaining public notoriety, as the concept of “natural” is appealing to the lay population due to the assumption that natural implies greater safety, which is not necessarily true. Semenescu et al15 provided a very comprehensive review of the applicable characteristics of several plant-based agents and potential mechanisms that may be beneficial as adjunctive agents in rosacea. Similar to vitamins and nutrients, there is some scientific basis for the routine integration of natural phytochemicals, but research is needed with well-designed studies used in targeted specific rosacea populations.
Unfortunately, I cannot finish this editorial with ground-breaking news about a new gamechanger approach or product; however, I can tell you that dermatology never gives up. Advances in developing adjunctive therapies and future disease targets such as mast cell activation, microvesicle particles, NLRP3 inflammasome pathway, and Janus kinase inhibition are always in motion, and we continue to try to find what we’re looking for.16
- U2. “I Still Haven’t Found What I’m Looking For.” Wikipedia. Accessed May 17, 2026. https://en.wikipedia.org/wiki/I_Still_Haven%27t_Found_What_I%27m_Looking_For
- Geng RSQ, Bourkas AN, Mufti A, et al. Rosacea: pathogenesis and therapeutic correlates. J Cutan Med Surg. 2024;28:178-189. doi:10.1177/12034754241229365
- Yang F, Wang L, Song D, et al. Signaling pathways and targeted therapy for rosacea. Front Immunol. 2024;16:15:1367994. doi:10.3389/fimmu.2024.1367994
- Andrusiewicz A, Khimuk S, Mijas D, et al. Molecular mechanisms in the etiopathology of rosacea-systematic review. Int J Mol Sci. 2025;26:11292. doi:10.3390/ijms262311292
- Schaller M, Almeida LMC, Bewley A, et al. Recommendations for rosacea diagnosis, classification and management: update from the global ROSacea COnsensus 2019 panel. Br J Dermatol. 2020;182:1269-1276. doi:10.1111/bjd.18420
- Del Rosso JQ, Tanghetti E, Webster G, et al. Update on the management of rosacea from the American Acne & Rosacea Society (AARS). Clin Aesthet Dermatol. 2020;13(6 suppl):S17-S24.
- van Zuuren EJ, Arents BWM, van der Linden MMD, et al. Rosacea: new concepts in classification and treatment. Am J Clin Dermatol. 2021;22:457-465. doi:10.1007/s40257-021-00595-7
- Tu KY, Jung CJ, Shih YH, et al. Therapeutic strategies focusing on immune dysregulation and neuroinflammation in rosacea. Front Immunol. 2024;15:1403798. doi:10.3389/fimmu.2024.1403798
- Schaller M, Almeida LMC, Bewley A, et al. Recommendations for rosacea diagnosis, classification and management: update from the global ROSacea COnsensus 2019 panel. Br J Dermatol. 2020;182:1269-1276. doi:10.1111/bjd.18420
- Baldwin H, Alexis A, Andriessen A, et al. Skin barrier deficiency in rosacea: an algorithm integrating OTC skincare products into treatment regimens. Drugs Dermatol. 2022;21:SF3595563-SF35955610. doi:10.36849/JDD.m0922
- Alexis A, Woolery-Lloyd H, Andriessen A, et al. Improving rosacea outcomes in skin of color patients: a review on the nuances in the treatment and the use of cleansers and moisturizers. J Drugs Dermatol. 2022;21:574-580. doi:10.36849/JDD.6838
- Kulthanan K, Andriessen A, Jiang X, et al. A review of the challenges and nuances in treating rosacea in Asian skin types using cleansers and moisturizers as adjuncts. J Drugs Dermatol. 2023;22:45-53. doi:10.36849/JDD.7021
- Gonzalez C, Andriessen A, Antelo D, et al. Treatment and maintenance of cutaneous rosacea in Latino skin types with prescription medications and non-prescription cleansers and moisturizers as adjuncts: a review. J Drugs Dermatol. 2022;21:1111-1118. doi:10.36849/JDD.7010
- Algarin YA, Pulumati A, Jaalouk D, et al. The role of vitamins and nutrients in rosacea. Arch Dermatol Res. 2024;316:142. doi:10.1007/s00403-024-02895-4
- Semenescu J, Similie D, Diaconeasa Z, et al. Recent advances in the management of rosacea through natural compounds. Pharmaceuticals (Basel). 2024;17:212. doi:10.3390/ph17020212
- Fisher GW, Travers JB, Rohan CA. Rosacea pathogenesis and therapeutics: current treatments and a look at future targets. Front Med (Lausanne). 2023;10:1292722. doi:10.3389/fmed.2023.1292722
Rosacea: We Still Haven’t Found What We’re Looking For
Rosacea: We Still Haven’t Found What We’re Looking For
Topical Hypochlorous Acid for Acne Vulgaris: Mechanisms, Clinical Evidence, and Therapeutic Potential
Topical Hypochlorous Acid for Acne Vulgaris: Mechanisms, Clinical Evidence, and Therapeutic Potential
Acne vulgaris, a chronic inflammatory disease of the pilosebaceous unit, is among the most prevalent dermatologic conditions worldwide. Though symptoms range in severity, patients can experience painful irritation and scarring that can lead to substantial psychological distress and impact quality of life. Cutibacterium acnes plays a central role in acne development through biofilm formation, lipase activity, and activation of innate immune pathways, which together contribute to a cycle of inflammation and comedogenesis.1
First-line treatments for acne vulgaris include topical benzoyl peroxide, topical retinoids, and topical antibiotics, while oral spironolactone and tetracyclines can be used alongside topical therapies for more extensive disease. Additionally, isotretinoin is generally reserved for severe or refractory cases. While these therapies are effective, each has notable limitations and adverse effects that in some cases limit adherence and efficacy. The most common adverse effects seen with topical acne therapies include irritation and dryness. Systemic therapies such as spironolactone can cause fatigue, dizziness, and birth defects, while prolonged antibiotic use can promote the risk for antimicrobial resistance.2
Hypochlorous acid (HOCl) is a naturally occurring weak acid produced by neutrophils and currently is approved by the US Food and Drug Administration for wound cleansing, burn management, and dermal lesion irrigation. Although it is not approved for the treatment of acne, stabilized HOCl formulations have been used off label in dermatology for this purpose. Interest in HOCl stems from its broad-spectrum antimicrobial activity against C acnes, anti-inflammatory properties, and favorable safety profile. This literature review examines the mechanism of action, clinical evidence, and potential role of HOCl in acne management, contextualizing its use relative to current standard therapies.
Methods
A narrative literature review was conducted to identify and synthesize peer-reviewed evidence on the use of HOCl in dermatology, with emphasis on its potential role in acne management. Searches were performed using PubMed and Scopus databases. Search terms included combinations of hypochlorous acid, acne, acne vulgaris, dermatology, antimicrobial, anti-inflammatory, biofilm, and skin barrier. Eligible publications included original research articles, randomized controlled trials, retrospective studies, preclinical in vitro and in vivo studies, and systematic reviews published in English between January 2000 and December 2024. Titles and abstracts were screened for relevance, and the final selection included 16 peer-reviewed articles that met the inclusion criteria.
Results
Hypochlorous acid exhibits rapid, broad-spectrum antimicrobial activity against gram-positive and gram-negative bacteria and fungi. In vitro time-kill assays demonstrated that stabilized HOCl was bactericidal against a variety of pathogens, including methicillin-resistant Staphylococcus aureus, methicillin-sensitive S aureus, Staphylococcus epidermidis, Corynebacterium species, Streptococcus pyogenes, Pseudomonas aeruginosa, Candida albicans, and C acnes. Specifically, HOCl achieved 99.99% or greater kill within 2 minutes.3 Moreover, HOCl’s antimicrobial efficacy against this panel of organisms was found to be comparable to or greater than that of commonly used antiseptics, including povidone-iodine, chlorhexidine gluconate, and isopropyl alcohol.3 An additional study using HOCl stabilized in 0.9% saline (pH, 3.5-4.0) confirmed its rapid activity across gram-positive, gram-negative, and fungal species, again demonstrating 99.99 % or greater reduction within 1 to 2 minutes of exposure.4
Hypochlorous acid also has demonstrated substantial biofilm-disruptive properties. In vitro studies demonstrated that HOCl can penetrate and disrupt early-stage biofilms by oxidizing extracellular polymeric substances and damaging bacterial membranes; however, while HOCl was effective at destroying immature biofilms and preventing biofilm formation, its efficacy against mature, fully established biofilms was more limited.5 Thus, topical HOCl may be most effective during the early colonization phase of acne, helping to prevent biofilm maturation and subsequent inflammatory lesion formation. Unlike traditional topical and oral antibiotics, HOCl’s nonspecific oxidative mechanism of action is less likely to contribute to microbial resistance. These findings highlight HOCl as a rapid, broad-spectrum antimicrobial with additional biofilm-disruptive activity, supporting its potential role as an early-intervention therapeutic in acne treatment.
In addition to its antimicrobial effects, HOCl is a potent anti-inflammatory molecule that exerts its anti-inflammatory effects through several mechanisms. HOCl acts as a mast cell membrane stabilizer, inhibiting degranulation. Hypochlorous acid also has been demonstrated to reduce levels of leukotriene B4 and interleukin (IL) 2, which supports that HOCl has both antipruritic and anti-inflammatory properties.6 In keratinocytes and immune cells, HOCl has been shown to suppress the transcription of multiple proinflammatory cytokines by oxidizing IκB kinase β, which then prevents the activation of the nuclear factor kappa B (NF-κB) signaling pathway.7 Additionally, in a murine model of atopic dermatitis, treatment with HOCl resulted in a downregulation of key proinflammatory and Th2-associated cytokines, including IL-1β, IL-4, IL-6, IL-13, tumor necrosis factor α, thymus and activation-regulated chemokine, thymic stromal lymphopoietin, and IL-31. Parallel in vitro assays revealed that HOCl inhibited phosphorylation of mitogen-activated protein kinase (MAPK) and inhibitor of κB, which inhibits the downstream proinflammatory pathways, thereby elucidating a mechanistic basis for its anti-inflammatory effects.8 C acnes has been shown to activate the toll-like receptor 2 pathway on keratinocytes and macrophages, triggering NF-κB–dependent release of IL-1β and tumor necrosis factor α.9
By inhibiting these same signaling pathways, HOCl may attenuate the inflammatory response associated with acne lesions while simultaneously reducing microbial load. These combined anti-inflammatory and antimicrobial effects also may contribute to improved healing outcomes. Emerging clinical evidence supports HOCl’s benefit in minimizing scarring and postinflammatory sequelae. A comparative study evaluating a silicone-based scar gel containing HOCl vs silicone gel alone found that the HOCl-containing formulation produced greater improvement in hypertrophic and keloid scar appearance and overall scar texture.10 These findings suggest that HOCl may have beneficial effects on wound healing and scar remodeling.
In murine models of acute radiation dermatitis, topical HOCl reduced NF-κB–dependent gene expression, decreased epidermal ulceration, and promoted re-epithelialization to near-normal histologic appearance.7 A double-blind, randomized controlled trial evaluating topical sodium hypochlorite 0.005%, which is a compound in equilibrium with HOCl under physiologic pH, demonstrated a statistically significant reduction in papules among patients with mild to moderate acne after 1 month of treatment (P<.0001). Female participants exhibited greater lesion improvement, suggesting possible hormonal or immunologic modulation of response.11 Although limited in scale, this literature review provides preliminary clinical support for the therapeutic potential of HOCl in the treatment of acne. Collectively, these findings highlight the potential of HOCl as an emerging treatment in acne and other dermatologic conditions.
Comment
Traditional acne therapies include topical agents such as benzoyl peroxide, topical retinoids (eg, tretinoin, adapalene), and salicylic acid, as well as systemic agents such as oral antibiotics, spironolactone, and isotretinoin. While these treatments are effective, their use may be limited by irritation, antibiotic resistance, and systemic adverse effects.
Hypochlorous acid is a potential adjunctive option that acts locally with minimal irritation and without hormonal or systemic activity.12 Its antimicrobial and anti-inflammatory mechanisms target key pathogenic pathways in acne while maintaining excellent cutaneous tolerability. In a randomized, double-blind, placebo-controlled trial of 89 patients comparing topical HOCl solution with benzoyl peroxide for mild to moderate acne, HOCl demonstrated comparable improvement in lesion counts.13 Importantly, no local adverse effects were reported in either group and no dose adjustments were needed during the 12-week treatment period. Although both agents were effective, the absence of irritation with HOCl contrasts with the dryness and erythema frequently associated with benzoyl peroxide.
Additionally, a clinical trial comparing HOCl 0.01% with standard antiseptics, including isopropyl alcohol, povidone-iodine, and chlorhexidine gluconate, showed that HOCl achieved comparable antibacterial reductions while remaining well tolerated and free of facial adverse effects.14 Similarly, studies evaluating HOCl’s antimicrobial efficacy have confirmed that it is nontoxic to periocular and facial tissues, further supporting its safety for use on delicate skin regions.3 Importantly, in an experimental model evaluating both healthy skin and skin with experimentally induced irritant contact dermatitis, repeated application of an HOCl-based formulation did not impair skin barrier function, underscoring its excellent cutaneous compatibility even under inflammatory conditions.15 Ultimately, these findings suggest that HOCl offers efficacy comparable to benzoyl peroxide and retinoids while eliminating the irritation and barrier disruption that can limit the use of these first-line agents.
Topical antibiotics such as clindamycin and erythromycin are used widely for their antimicrobial and anti-inflammatory properties but increasingly are undermined by antibiotic resistance. In contrast, HOCl has been shown to reduce bacterial load without altering microbial diversity, supporting its role as a resistance-neutral antimicrobial option for acne management.16 These characteristics position HOCl as a well-tolerated, resistance-neutral adjunctive treatment that warrants further investigation through larger, controlled trials.
Topical HOCl formulations, particularly those available as sprays or misting solutions, have gained attention on social media for their ease of use and versatility. Although formal studies evaluating adherence or outcomes in this context are currently limited, this emerging consumer trend underscores the perceived convenience of HOCl compared with traditional acne therapies. These formulations can be applied throughout the day, including between exercise and work, supporting adherence among patients with active lifestyles. In contrast to many conventional topical agents that require specific application timing, cleansing routines, or avoidance of cosmetic products, HOCl sprays offer flexible use without disrupting daily activities. These characteristics highlight HOCl’s potential as a user-friendly option that may support consistent application and optimize therapeutic outcomes.
Conclusion
The addition of HOCl to acne treatment regimens offers several potential benefits. Its antimicrobial and anti-inflammatory properties may help prevent new papules and pustules, while its favorable tolerability profile minimizes irritation and systemic adverse effects. Preliminary data also suggest efficacy in androgen-mediated acne, though additional studies are needed to confirm these findings.¹¹ Current evidence remains limited by small sample sizes, short follow-up durations, and a lack of comparative studies among available formulations. Accordingly, HOCl should be considered an adjunctive rather than replacement therapy pending larger studies with longer follow-up.
- Vasam M, Korutla S, Bohara RA. Acne vulgaris: a review of the pathophysiology, treatment, and recent nanotechnology based advances. Biochem Biophys Rep. 2023;36:101578.
- Reynolds RV, Yeung H, Cheng CE, et al. Guidelines of care for the management of acne vulgaris. J Am Acad Dermatol. 2024;90:1006.E1-1006.E30.
- Anagnostopoulos AG, Rong A, Miller D, et al. 0.01% hypochlorous acid as an alternative skin antiseptic: an in vitro comparison. Dermatol Surg. 2018;44:1489-1493.
- Wang L, Bassiri M, Najafi R, et al. Hypochlorous acid as a potential wound care agent: part I. stabilized hypochlorous acid: a component of the inorganic armamentarium of innate immunity. J Burns Wounds. 2007;6:E5.
- Ortega-Peña S, Hidalgo-González C, Robson MC, et al. In vitro microbicidal, anti-biofilm and cytotoxic effects of different commercial antiseptics. Int Wound J. 2017;14:470-479.
- Gold MH, Andriessen A, Bhatia AC, et al. Topical stabilized hypochlorous acid: the future gold standard for wound care and scar management in dermatologic and plastic surgery procedures. J Cosmet Dermatol. 2020;19:270-277.
- Leung TH, Zhang LF, Wang J, et al. Topical hypochlorite ameliorates NF-κB–mediated skin diseases in mice. J Clin Invest. 2013;123:5361-5370.
- Fukuyama T, Martel BC, Linder KE, et al. Hypochlorous acid is antipruritic and anti‐inflammatory in a mouse model of atopic dermatitis. Clin Exp Allergy. 2018;48:78-88.
- Lheure C, Grange PA, Ollagnier G, et al. TLR-2 recognizes Propionibacterium acnes CAMP factor 1 from highly inflammatory strains. PLoS ONE. 2016;11:E0167237.
- Gold MH, Andriessen A, Dayan SH, et al. Hypochlorous acid gel technology—its impact on postprocedure treatment and scar prevention. J Cosmet Dermatol. 2017;16:162-167.
- Dorostkar A, Ghahartars M, Namazi MR, et al. Sodium hypochlorite 0.005% versus placebo in the treatment of mild to moderate acne: a double-blind randomized controlled trial. Dermatol Pract Concept. Published online May 20, 2021.
- del Rosso JQ, Bhatia N. Status report on topical hypochlorous acid: clinical relevance of specific formulations, potential modes of action, and study outcomes. J Clin Aesthet Dermatol. 2018;11:36-39.
- Tirado-Sánchez A, Ponce-Olivera RM. Efficacy and tolerance of superoxidized solution in the treatment of mild to moderate inflammatory acne. a double-blinded, placebo- controlled, parallel-group, randomized, clinical trial. J Dermatolog Treat. 2009;20:289-292.
- Tran AQ, Topilow N, Rong A, et al. Comparison of skin antiseptic agents and the role of 0.01% hypochlorous acid. Aesthet Surg J. 2021;41:1170-1175.
- Yüksel YT, Sonne M, Nørreslet LB, et al. Skin barrier response to active chlorine hand disinfectant—an experimental study comparing skin barrier response to active chlorine hand disinfectant and alcohol-based hand rub on healthy skin and eczematous skin. Skin Res Technol. 2022;28:89-97.
- Stroman D, Mintun K, Epstein A, et al. Reduction in bacterial load using hypochlorous acid hygiene solution on ocular skin. OPTH. 2017;11:707-714.
Acne vulgaris, a chronic inflammatory disease of the pilosebaceous unit, is among the most prevalent dermatologic conditions worldwide. Though symptoms range in severity, patients can experience painful irritation and scarring that can lead to substantial psychological distress and impact quality of life. Cutibacterium acnes plays a central role in acne development through biofilm formation, lipase activity, and activation of innate immune pathways, which together contribute to a cycle of inflammation and comedogenesis.1
First-line treatments for acne vulgaris include topical benzoyl peroxide, topical retinoids, and topical antibiotics, while oral spironolactone and tetracyclines can be used alongside topical therapies for more extensive disease. Additionally, isotretinoin is generally reserved for severe or refractory cases. While these therapies are effective, each has notable limitations and adverse effects that in some cases limit adherence and efficacy. The most common adverse effects seen with topical acne therapies include irritation and dryness. Systemic therapies such as spironolactone can cause fatigue, dizziness, and birth defects, while prolonged antibiotic use can promote the risk for antimicrobial resistance.2
Hypochlorous acid (HOCl) is a naturally occurring weak acid produced by neutrophils and currently is approved by the US Food and Drug Administration for wound cleansing, burn management, and dermal lesion irrigation. Although it is not approved for the treatment of acne, stabilized HOCl formulations have been used off label in dermatology for this purpose. Interest in HOCl stems from its broad-spectrum antimicrobial activity against C acnes, anti-inflammatory properties, and favorable safety profile. This literature review examines the mechanism of action, clinical evidence, and potential role of HOCl in acne management, contextualizing its use relative to current standard therapies.
Methods
A narrative literature review was conducted to identify and synthesize peer-reviewed evidence on the use of HOCl in dermatology, with emphasis on its potential role in acne management. Searches were performed using PubMed and Scopus databases. Search terms included combinations of hypochlorous acid, acne, acne vulgaris, dermatology, antimicrobial, anti-inflammatory, biofilm, and skin barrier. Eligible publications included original research articles, randomized controlled trials, retrospective studies, preclinical in vitro and in vivo studies, and systematic reviews published in English between January 2000 and December 2024. Titles and abstracts were screened for relevance, and the final selection included 16 peer-reviewed articles that met the inclusion criteria.
Results
Hypochlorous acid exhibits rapid, broad-spectrum antimicrobial activity against gram-positive and gram-negative bacteria and fungi. In vitro time-kill assays demonstrated that stabilized HOCl was bactericidal against a variety of pathogens, including methicillin-resistant Staphylococcus aureus, methicillin-sensitive S aureus, Staphylococcus epidermidis, Corynebacterium species, Streptococcus pyogenes, Pseudomonas aeruginosa, Candida albicans, and C acnes. Specifically, HOCl achieved 99.99% or greater kill within 2 minutes.3 Moreover, HOCl’s antimicrobial efficacy against this panel of organisms was found to be comparable to or greater than that of commonly used antiseptics, including povidone-iodine, chlorhexidine gluconate, and isopropyl alcohol.3 An additional study using HOCl stabilized in 0.9% saline (pH, 3.5-4.0) confirmed its rapid activity across gram-positive, gram-negative, and fungal species, again demonstrating 99.99 % or greater reduction within 1 to 2 minutes of exposure.4
Hypochlorous acid also has demonstrated substantial biofilm-disruptive properties. In vitro studies demonstrated that HOCl can penetrate and disrupt early-stage biofilms by oxidizing extracellular polymeric substances and damaging bacterial membranes; however, while HOCl was effective at destroying immature biofilms and preventing biofilm formation, its efficacy against mature, fully established biofilms was more limited.5 Thus, topical HOCl may be most effective during the early colonization phase of acne, helping to prevent biofilm maturation and subsequent inflammatory lesion formation. Unlike traditional topical and oral antibiotics, HOCl’s nonspecific oxidative mechanism of action is less likely to contribute to microbial resistance. These findings highlight HOCl as a rapid, broad-spectrum antimicrobial with additional biofilm-disruptive activity, supporting its potential role as an early-intervention therapeutic in acne treatment.
In addition to its antimicrobial effects, HOCl is a potent anti-inflammatory molecule that exerts its anti-inflammatory effects through several mechanisms. HOCl acts as a mast cell membrane stabilizer, inhibiting degranulation. Hypochlorous acid also has been demonstrated to reduce levels of leukotriene B4 and interleukin (IL) 2, which supports that HOCl has both antipruritic and anti-inflammatory properties.6 In keratinocytes and immune cells, HOCl has been shown to suppress the transcription of multiple proinflammatory cytokines by oxidizing IκB kinase β, which then prevents the activation of the nuclear factor kappa B (NF-κB) signaling pathway.7 Additionally, in a murine model of atopic dermatitis, treatment with HOCl resulted in a downregulation of key proinflammatory and Th2-associated cytokines, including IL-1β, IL-4, IL-6, IL-13, tumor necrosis factor α, thymus and activation-regulated chemokine, thymic stromal lymphopoietin, and IL-31. Parallel in vitro assays revealed that HOCl inhibited phosphorylation of mitogen-activated protein kinase (MAPK) and inhibitor of κB, which inhibits the downstream proinflammatory pathways, thereby elucidating a mechanistic basis for its anti-inflammatory effects.8 C acnes has been shown to activate the toll-like receptor 2 pathway on keratinocytes and macrophages, triggering NF-κB–dependent release of IL-1β and tumor necrosis factor α.9
By inhibiting these same signaling pathways, HOCl may attenuate the inflammatory response associated with acne lesions while simultaneously reducing microbial load. These combined anti-inflammatory and antimicrobial effects also may contribute to improved healing outcomes. Emerging clinical evidence supports HOCl’s benefit in minimizing scarring and postinflammatory sequelae. A comparative study evaluating a silicone-based scar gel containing HOCl vs silicone gel alone found that the HOCl-containing formulation produced greater improvement in hypertrophic and keloid scar appearance and overall scar texture.10 These findings suggest that HOCl may have beneficial effects on wound healing and scar remodeling.
In murine models of acute radiation dermatitis, topical HOCl reduced NF-κB–dependent gene expression, decreased epidermal ulceration, and promoted re-epithelialization to near-normal histologic appearance.7 A double-blind, randomized controlled trial evaluating topical sodium hypochlorite 0.005%, which is a compound in equilibrium with HOCl under physiologic pH, demonstrated a statistically significant reduction in papules among patients with mild to moderate acne after 1 month of treatment (P<.0001). Female participants exhibited greater lesion improvement, suggesting possible hormonal or immunologic modulation of response.11 Although limited in scale, this literature review provides preliminary clinical support for the therapeutic potential of HOCl in the treatment of acne. Collectively, these findings highlight the potential of HOCl as an emerging treatment in acne and other dermatologic conditions.
Comment
Traditional acne therapies include topical agents such as benzoyl peroxide, topical retinoids (eg, tretinoin, adapalene), and salicylic acid, as well as systemic agents such as oral antibiotics, spironolactone, and isotretinoin. While these treatments are effective, their use may be limited by irritation, antibiotic resistance, and systemic adverse effects.
Hypochlorous acid is a potential adjunctive option that acts locally with minimal irritation and without hormonal or systemic activity.12 Its antimicrobial and anti-inflammatory mechanisms target key pathogenic pathways in acne while maintaining excellent cutaneous tolerability. In a randomized, double-blind, placebo-controlled trial of 89 patients comparing topical HOCl solution with benzoyl peroxide for mild to moderate acne, HOCl demonstrated comparable improvement in lesion counts.13 Importantly, no local adverse effects were reported in either group and no dose adjustments were needed during the 12-week treatment period. Although both agents were effective, the absence of irritation with HOCl contrasts with the dryness and erythema frequently associated with benzoyl peroxide.
Additionally, a clinical trial comparing HOCl 0.01% with standard antiseptics, including isopropyl alcohol, povidone-iodine, and chlorhexidine gluconate, showed that HOCl achieved comparable antibacterial reductions while remaining well tolerated and free of facial adverse effects.14 Similarly, studies evaluating HOCl’s antimicrobial efficacy have confirmed that it is nontoxic to periocular and facial tissues, further supporting its safety for use on delicate skin regions.3 Importantly, in an experimental model evaluating both healthy skin and skin with experimentally induced irritant contact dermatitis, repeated application of an HOCl-based formulation did not impair skin barrier function, underscoring its excellent cutaneous compatibility even under inflammatory conditions.15 Ultimately, these findings suggest that HOCl offers efficacy comparable to benzoyl peroxide and retinoids while eliminating the irritation and barrier disruption that can limit the use of these first-line agents.
Topical antibiotics such as clindamycin and erythromycin are used widely for their antimicrobial and anti-inflammatory properties but increasingly are undermined by antibiotic resistance. In contrast, HOCl has been shown to reduce bacterial load without altering microbial diversity, supporting its role as a resistance-neutral antimicrobial option for acne management.16 These characteristics position HOCl as a well-tolerated, resistance-neutral adjunctive treatment that warrants further investigation through larger, controlled trials.
Topical HOCl formulations, particularly those available as sprays or misting solutions, have gained attention on social media for their ease of use and versatility. Although formal studies evaluating adherence or outcomes in this context are currently limited, this emerging consumer trend underscores the perceived convenience of HOCl compared with traditional acne therapies. These formulations can be applied throughout the day, including between exercise and work, supporting adherence among patients with active lifestyles. In contrast to many conventional topical agents that require specific application timing, cleansing routines, or avoidance of cosmetic products, HOCl sprays offer flexible use without disrupting daily activities. These characteristics highlight HOCl’s potential as a user-friendly option that may support consistent application and optimize therapeutic outcomes.
Conclusion
The addition of HOCl to acne treatment regimens offers several potential benefits. Its antimicrobial and anti-inflammatory properties may help prevent new papules and pustules, while its favorable tolerability profile minimizes irritation and systemic adverse effects. Preliminary data also suggest efficacy in androgen-mediated acne, though additional studies are needed to confirm these findings.¹¹ Current evidence remains limited by small sample sizes, short follow-up durations, and a lack of comparative studies among available formulations. Accordingly, HOCl should be considered an adjunctive rather than replacement therapy pending larger studies with longer follow-up.
- Vasam M, Korutla S, Bohara RA. Acne vulgaris: a review of the pathophysiology, treatment, and recent nanotechnology based advances. Biochem Biophys Rep. 2023;36:101578.
- Reynolds RV, Yeung H, Cheng CE, et al. Guidelines of care for the management of acne vulgaris. J Am Acad Dermatol. 2024;90:1006.E1-1006.E30.
- Anagnostopoulos AG, Rong A, Miller D, et al. 0.01% hypochlorous acid as an alternative skin antiseptic: an in vitro comparison. Dermatol Surg. 2018;44:1489-1493.
- Wang L, Bassiri M, Najafi R, et al. Hypochlorous acid as a potential wound care agent: part I. stabilized hypochlorous acid: a component of the inorganic armamentarium of innate immunity. J Burns Wounds. 2007;6:E5.
- Ortega-Peña S, Hidalgo-González C, Robson MC, et al. In vitro microbicidal, anti-biofilm and cytotoxic effects of different commercial antiseptics. Int Wound J. 2017;14:470-479.
- Gold MH, Andriessen A, Bhatia AC, et al. Topical stabilized hypochlorous acid: the future gold standard for wound care and scar management in dermatologic and plastic surgery procedures. J Cosmet Dermatol. 2020;19:270-277.
- Leung TH, Zhang LF, Wang J, et al. Topical hypochlorite ameliorates NF-κB–mediated skin diseases in mice. J Clin Invest. 2013;123:5361-5370.
- Fukuyama T, Martel BC, Linder KE, et al. Hypochlorous acid is antipruritic and anti‐inflammatory in a mouse model of atopic dermatitis. Clin Exp Allergy. 2018;48:78-88.
- Lheure C, Grange PA, Ollagnier G, et al. TLR-2 recognizes Propionibacterium acnes CAMP factor 1 from highly inflammatory strains. PLoS ONE. 2016;11:E0167237.
- Gold MH, Andriessen A, Dayan SH, et al. Hypochlorous acid gel technology—its impact on postprocedure treatment and scar prevention. J Cosmet Dermatol. 2017;16:162-167.
- Dorostkar A, Ghahartars M, Namazi MR, et al. Sodium hypochlorite 0.005% versus placebo in the treatment of mild to moderate acne: a double-blind randomized controlled trial. Dermatol Pract Concept. Published online May 20, 2021.
- del Rosso JQ, Bhatia N. Status report on topical hypochlorous acid: clinical relevance of specific formulations, potential modes of action, and study outcomes. J Clin Aesthet Dermatol. 2018;11:36-39.
- Tirado-Sánchez A, Ponce-Olivera RM. Efficacy and tolerance of superoxidized solution in the treatment of mild to moderate inflammatory acne. a double-blinded, placebo- controlled, parallel-group, randomized, clinical trial. J Dermatolog Treat. 2009;20:289-292.
- Tran AQ, Topilow N, Rong A, et al. Comparison of skin antiseptic agents and the role of 0.01% hypochlorous acid. Aesthet Surg J. 2021;41:1170-1175.
- Yüksel YT, Sonne M, Nørreslet LB, et al. Skin barrier response to active chlorine hand disinfectant—an experimental study comparing skin barrier response to active chlorine hand disinfectant and alcohol-based hand rub on healthy skin and eczematous skin. Skin Res Technol. 2022;28:89-97.
- Stroman D, Mintun K, Epstein A, et al. Reduction in bacterial load using hypochlorous acid hygiene solution on ocular skin. OPTH. 2017;11:707-714.
Topical Hypochlorous Acid for Acne Vulgaris: Mechanisms, Clinical Evidence, and Therapeutic Potential
Topical Hypochlorous Acid for Acne Vulgaris: Mechanisms, Clinical Evidence, and Therapeutic Potential
Practice Points
- First-line treatments for acne vulgaris are effective but often limited by local irritation, systemic adverse effects, and antibiotic resistance.
- Hypochlorous acid (HOCl) shows rapid, broad-spectrum antimicrobial and biofilm-disruptive activity against Cutibacterium acnes and other pathogens, with a low propensity for resistance.
- Emerging clinical data indicate HOCl formulations deliver efficacy comparable to standard topical treatments with superior tolerability and no barrier disruption, supporting its use as a well-tolerated adjunct in acne management.
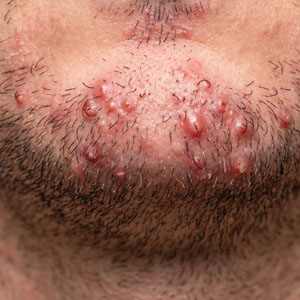
Equity Evaluation: Analysis of the Prescribing Patterns of Isotretinoin Based on Reproductive Potential
Equity Evaluation: Analysis of the Prescribing Patterns of Isotretinoin Based on Reproductive Potential
To the Editor:
Isotretinoin is the most effective treatment option for acne vulgaris and is considered the first-line therapy for severe scarring acne.1-3 Isotretinoin therapy is indicated for moderate acne when other treatments have failed or when the condition causes distress.3 While there are treatment guidelines for moderate to severe acne, there is no gold standard, and most treatment options include a combination of topical and/or oral therapies.4 Isotretinoin is one of the few monotherapy options available, but its use often is limited by concerns for severe internal and external birth defects if taken during pregnancy.
To manage teratogenicity risks associated with isotretinoin, the US Food and Drug Administration implemented the iPLEDGE Risk Evaluation and Mitigation Strategy in 2006.5 The iPLEDGE compliance requirements differ vastly depending on the reproductive potential of the patient, and the process of obtaining an isotretinoin prescription is much more cumbersome for patients who can get pregnant. Previous studies have demonstrated that males are more likely to be prescribed isotretinoin compared to females, even though females attended more acne-related office visits than males.6,7 Additionally, the administrative burden of iPLEDGE may influence the prescribing patterns of isotretinoin. In a survey of 510 dermatologists, approximately 30% reported that they have at times chosen not to prescribe isotretinoin to patients with severe acne due to the administrative burden of iPLEDGE.8 In this study, we sought to further analyze the prescribing patterns of isotretinoin based on a patient’s reproductive potential.
In this single-center, retrospective cohort study, electronic medical records from 3292 patients diagnosed with acne vulgaris at the Department of Dermatology at Rush University Medical Center (Chicago, Illinois) between January 2013 and December 2019 were reviewed. A total of 188 patients who were prescribed isotretinoin for acne were identified, but only 171 met the study criteria. Eligible patients were aged 12 to 25 years and were prescribed oral isotretinoin for acne vulgaris during the study period. Patients younger than 12 or older than 25 years, those who were prescribed isotretinoin for indications other than acne vulgaris, and those who had previously received isotretinoin and either initiated an additional course or continued treatment at our institution were excluded. Eligible patients then were grouped by reproductive potential: patients who can get pregnant (positive reproductive potential [RP+]) and patients who cannot get pregnant (negative reproductive potential [RP–]). The number of months from initial acne visit, total number of office visits attended, and number of alternative medications that failed before isotretinoin therapy was discussed and initiated were compared between the 2 groups. To standardize between groups, the office visit at which patients were enrolled in iPLEDGE served as the date that isotretinoin therapy was initiated. Alternative medication type and sex of the prescriber were evaluated as secondary end points.
Eighty-nine RP+ patients and 82 RP– patients were prescribed isotretinoin for acne, including 85 females, 2 transgender males with female reproductive organs, 2 females with a history of tubal ligation, and 82 males. Of note, the iPLEDGE program considers tubal ligation as a primary form of contraception and classifies these patients as RP+. Patient demographics are summarized in eTable 1. There was a higher proportion of RP– patients aged 10 to 20 years compared to RP+ patients, for whom there was a higher number of patients aged 21 to 30 years. Most RP+ patients were White, while most RP– patients were Hispanic/Latino.
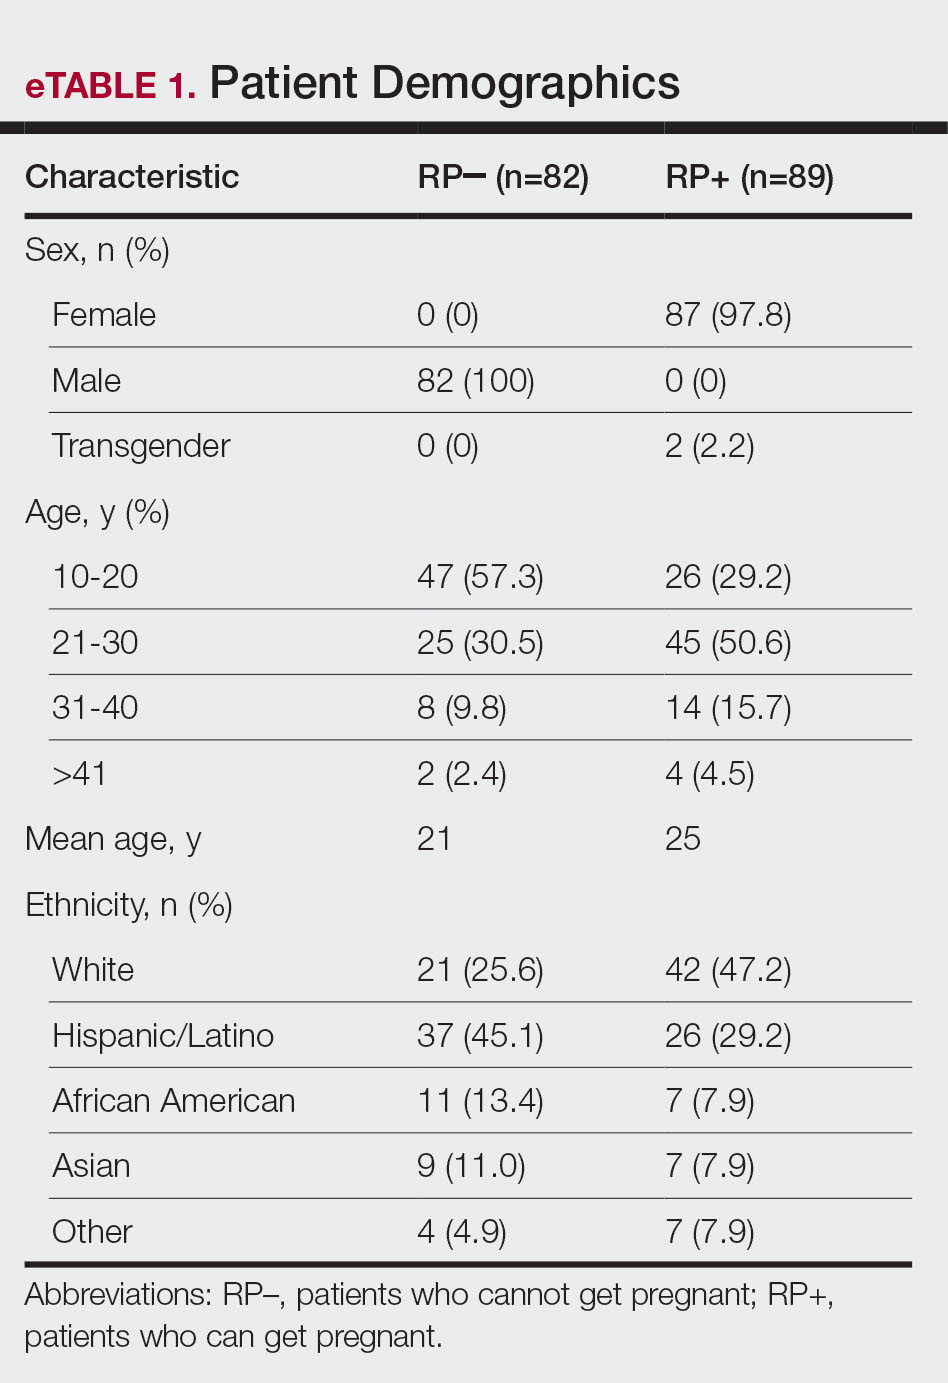
Overall isotretinoin prescribing patterns as well as prescribing patterns stratified by reproductive potential are presented in eTable 2. Overall, the average number of months before isotretinoin was discussed as a treatment option was 11.5 months and before isotretinoin therapy was initiated was 15 months. There was no significant difference between the number of months before isotretinoin was discussed (P=.83) or initiated (P=.56) between RP+ and RP– patients. On average, patients attended 2 office visits before isotretinoin was discussed as a treatment option and 3 office visits before isotretinoin therapy was initiated. The difference between the number of office visits patients attended before isotretinoin was discussed (P=.44) and before isotretinoin therapy was initiated (P=.11) was not significant between RP+ and RP– patients. The number of alternative medications that failed before initiation of isotretinoin therapy was comparable between groups. Patients in the RP– group experienced failure with an average of 5 alternative medications compared with 6 alternative medications in the RP+ group (P=.48).
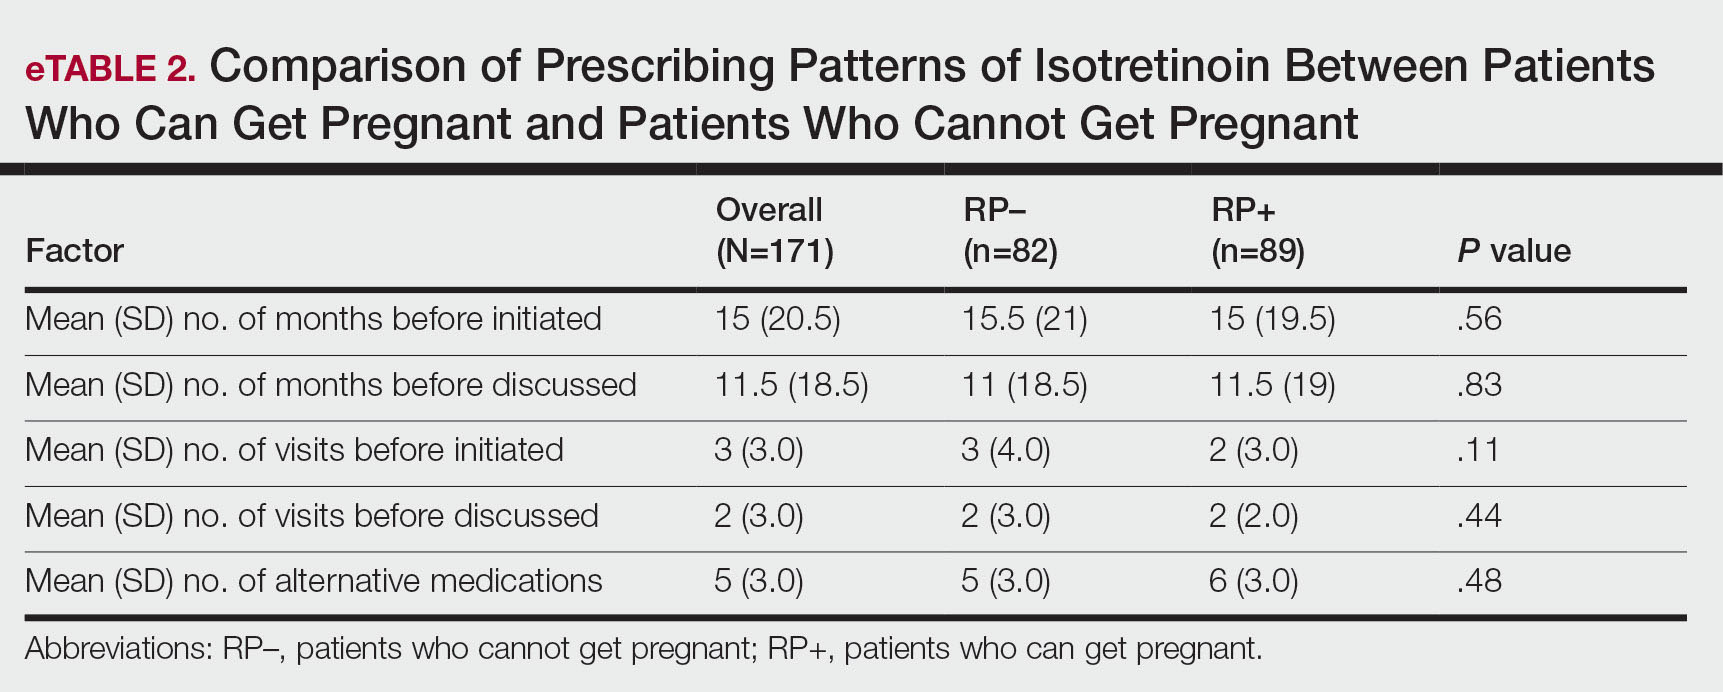
As shown in eTable 3, oral antibiotic therapy commonly was prescribed prior to isotretinoin in both groups, with doxycycline being prescribed most often. Hormonal therapy, including oral contraceptives and spironolactone, was trialed in 55 of 87 (63.2%) RP+ patients. Most patients experienced failure with other oral antiacne medications before isotretinoin therapy, with only 6 (6.7%) RP+ and 5 (6.1%) RP– patients trying topical therapy only. Prior isotretinoin therapy was documented in 13 (14.6%) RP+ patients compared with only 5 (6.1%) RP– patients. Interestingly, isotretinoin was initiated at the patient’s first office visit more often in the RP+ group.
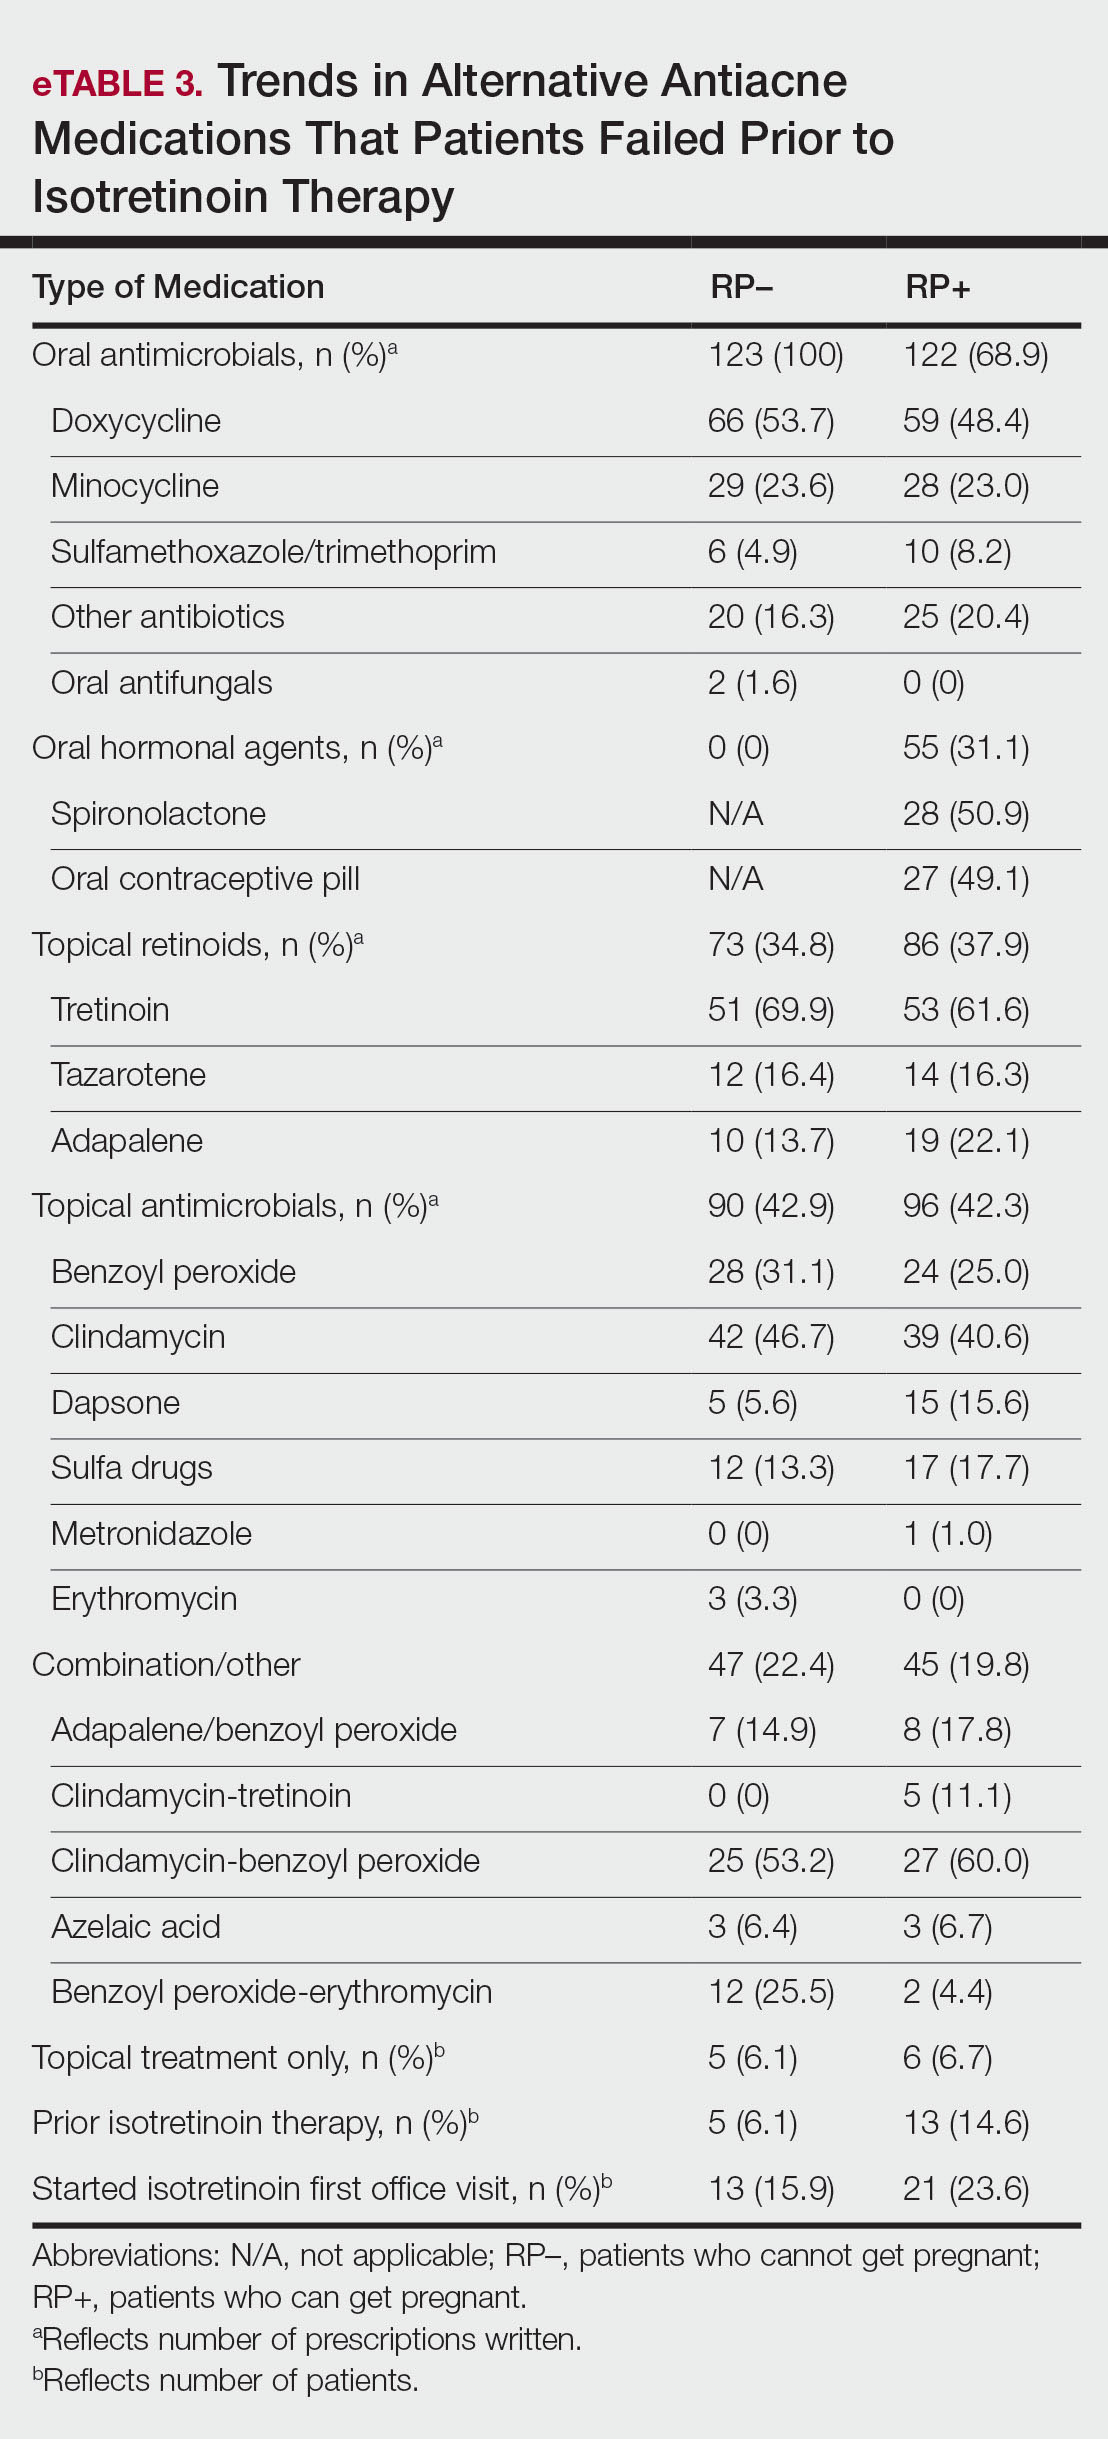
At the time isotretinoin therapy was initiated, the sex of the prescribing provider was similar within the RP+ group, with 52% (46/89) of female and 48% (43/89) of male prescribers. In the RP– group, there was a slightly higher proportion of male prescribers, with 57% (47/82) male compared to 43% (35/82) female prescribers.
iPLEDGE (https://ipledgeprogram.com) is an online system mandated by the US Food and Drug Administration to be used by patients, physicians, and pharmacists for the duration of isotretinoin therapy to prevent and track isotretinoin-associated pregnancies.9 At its inception, the iPLEDGE program categorized patients as females of child-bearing potential, females not of child-bearing potential, or males. The program recently moved toward transgender-inclusive categorization of patients based on reproductive potential.10 Patients who can get pregnant include cisgender females and transgender males, and patients who cannot get pregnant include cisgender males, transgender females, and females and transgender males who have undergone a hysterectomy or bilateral oophorectomy or who are postmenopausal.9
The iPLEDGE compliance requirements for patients who can get pregnant are extensive. Patients with reproductive potential must obtain a negative baseline pregnancy test, enroll in iPLEDGE, undergo a 30-day waiting period, and obtain a second negative pregnancy test before they can start the medication. Each month thereafter, patients must obtain a negative pregnancy test, demonstrate risk comprehension, and report their methods of contraception on iPLEDGE before they can pick up their prescription. In addition, physicians and pharmacists must confirm patient counseling and obtain authorization codes from iPLEDGE to dispense the medication. If any of these steps are not completed by the patient, physician, or pharmacist within 7 days of the patient’s negative pregnancy test, all steps must be repeated by all parties.9,11
The efficacy and utility of iPLEDGE have been criticized and debated in the literature. Although there has been a general decrease in the number of fetal exposures to isotretinoin since the implementation of iPLEDGE in 2006, the average number of fetal exposures only decreased for 2 years until it plateaued in 2008.5 Some physicians have argued that the decrease in the number of fetal exposures is not attributed to the efficacy of iPLEDGE but rather because the program has made it difficult for patients who can get pregnant to obtain necessary isotretinoin prescriptions.12 Other physicians have reported that they have chosen not to prescribe isotretinoin due to the administrative burden of iPLEDGE.8 Although we expected to observe similar trends in our study, we ultimately had more eligible patients with reproductive potential than patients who could not get pregnant. Additionally, there was no difference in the number of months from initial acne visit, total number of office visits, and number of alternative medications that failed before isotretinoin initiation between patients who could and could not get pregnant. These findings suggest that iPLEDGE requirements did not dissuade prescribers from treating acne with isotretinoin in patients who could get pregnant and that the prescribing patterns of isotretinoin were similar regardless of reproductive potential.
Across all primary outcomes, the standard deviation was high in the overall dataset and in the RP– and RP+ subsets, indicating substantial variability in number of months from initial acne visit, total number of visits, and number of alternative medications that failed prior to initiation of isotretinoin. This implies that the prescribing patterns of isotretinoin may be patient and prescriber dependent, and other variables may influence these outcomes aside from the reproductive potential of the patient. Although there was a marginally higher percentage of male prescribers in the RP– group, the sex of the prescriber did not seem to have a major impact on the prescribing patterns of isotretinoin. Further research is indicated to investigate the impact of other factors that may influence the prescribing patterns of isotretinoin, including insurance coverage, access to contraception, and patient concerns about adverse effects.
The types of alternative medications that patients tried prior to isotretinoin were similar among patients who could get pregnant and patients who could not get pregnant. Hormonal therapy, including oral contraception pills and spironolactone, can be very effective in treating acne in patients with reproductive potential,13 as evidenced by the 55 (31.1%) prescriptions written for hormonal therapy in the RP+ group. Spironolactone for acne is contraindicated in male patients due to its antiandrogenic properties and risk for gynecomastia.14 As such, males have fewer alternative medication options for acne, and this may contribute to the higher prevalence of isotretinoin therapy in males that has been demonstrated in prior studies.6,7 Of note, patients obtained more than 100 prescriptions for oral antimicrobials in both groups. Although patients can see benefit with oral antimicrobials for acne, the volume of antimicrobial prescriptions seen in our cohort raises concerns about antibiotic stewardship.15 Whether isotretinoin is a safer therapeutic option compared to antibiotics is up for debate.2,16
Our study included a small sample size at a single institution, which may limit the external validity of our results. Additionally, our study focused on patients who were prescribed isotretinoin prior to 2020 to control for the influence of the COVID-19 pandemic on prescribing patterns. With this, our data may not reflect postpandemic prescribing trends. Further multi-institution studies that include postpandemic patient cohorts can be conducted to validate our findings.
There were no significant differences in the number of months from initial acne visit, total number of office visits, and number of alternative medications that failed prior to discussing isotretinoin as a treatment option or initiating isotretinoin therapy between patients who can get pregnant and those who cannot get pregnant. We observed substantial variability in these outcomes across datasets, indicating that the prescribing patterns of isotretinoin may be patient and prescriber dependent regardless of the reproductive potential of the patient. Follow-up studies are warranted to further investigate the specific influence of iPLEDGE on the utilization of isotretinoin.
- Aslam I, Fleischer A, Feldman S. Emerging drugs for the treatment of acne. Expert Opin Emerg Drugs. 2015;20:91-101. doi:10.1517/14728214.2015.990373
- Huang CY, Chang IJ, Bolick N, et al. Comparative efficacy of pharmacological treatments for acne vulgaris: a network meta-analysis of 221 randomized controlled trials. Ann Fam Med. 2023;21:358-369. doi:10.1370/afm.2995
- Hauk L. Acne vulgaris: treatment guidelines from the AAD. Am Fam Physician. 2017;95:740-741.
- Habeshian KA, Cohen BA. Current issues in the treatment of acne vulgaris. Pediatrics. 2020;145(suppl 2):S225-S230. doi:10.1542/peds.2019-2056L
- Tkachenko E, Singer S, Sharma P, et al. US Food and Drug Administration reports of pregnancy and pregnancy-related adverse events associated with isotretinoin. JAMA Dermatol. 2019;155:1175-1179. doi:10.1001/jamadermatol.2019.1388
- Fleischer AB Jr, Simpson JK, McMichael A, et al. Are there racial and sex differences in the use of oral isotretinoin for acne management in the United States? J Am Acad Dermatol. 2003;49:662-666. doi:10.1067/s0190-9622(03)01584-6
- Barbieri JS, Shin DB, Wang S, et al. Association of race/ethnicity and sex with differences in health care use and treatment for acne. JAMA Dermatol. 2020;156:312-319. doi:10.1001/jamadermatol.2019.4818
- Lee G, Wolf JR, Somers KE. Administrative burden of iPLEDGE deters isotretinoin prescriptions: results from a survey of dermatologists. Cutis. 2022;110:44-47. doi:10.12788/cutis.0558
- The iPLEDGE REMS Prescriber Guide. iPLEDGE. Updated March 2023. https://ipledgeprogram.com/ResourceDownloadRaw/GuideBestPractices
- Boos MD, Ginsberg BA, Peebles JK. Prescribing isotretinoin for transgender youth: a pledge for more inclusive care. Pediatr Dermatol. 2019;36:169-171. doi:10.1111/pde.13694
- iPLEDGE REMS Guide for Patients Who Can Get Pregnant: The Importance of Avoiding Pregnancy on Isotretinoin. iPLEDGE Program. Updated March 2023. https://ipledgeprogram.com/#Main/Resources
- Nagler AR. Early strides for necessary data-driven improvement in iPLEDGE. JAMA Dermatol. 2019;155:1111-1112. doi:10.1001/jamadermatol.2019.1247
- Reynolds RV, Yeung H, Cheng CE, et al. Guidelines of care for the management of acne vulgaris. J Am Acad Dermatol. 2024;90:1006.E1-1006.E30. doi:10.1016/j.jaad.2023.12.017
- Sato K, Matsumoto D, Iizuka F, et al. Anti-androgenic therapy using oral spironolactone for acne vulgaris in Asians. Aesthetic Plast Surg. 2006;30:689-694. doi:10.1007/s00266-006-0081-0
- Issa NT, Kircik LH. Antibiotic stewardship in acne: 2023 update. J Drugs Dermatol. 2024;23:SF37896s4-SF378969s10. doi:10.36849/JDD.SF378969
- Vallerand IA, Lewinson RT, Farris MS, et al. Efficacy and adverse events of oral isotretinoin for acne: a systematic review. Br J Dermatol. 2018;178:76-85. doi:10.1111/bjd.15668
To the Editor:
Isotretinoin is the most effective treatment option for acne vulgaris and is considered the first-line therapy for severe scarring acne.1-3 Isotretinoin therapy is indicated for moderate acne when other treatments have failed or when the condition causes distress.3 While there are treatment guidelines for moderate to severe acne, there is no gold standard, and most treatment options include a combination of topical and/or oral therapies.4 Isotretinoin is one of the few monotherapy options available, but its use often is limited by concerns for severe internal and external birth defects if taken during pregnancy.
To manage teratogenicity risks associated with isotretinoin, the US Food and Drug Administration implemented the iPLEDGE Risk Evaluation and Mitigation Strategy in 2006.5 The iPLEDGE compliance requirements differ vastly depending on the reproductive potential of the patient, and the process of obtaining an isotretinoin prescription is much more cumbersome for patients who can get pregnant. Previous studies have demonstrated that males are more likely to be prescribed isotretinoin compared to females, even though females attended more acne-related office visits than males.6,7 Additionally, the administrative burden of iPLEDGE may influence the prescribing patterns of isotretinoin. In a survey of 510 dermatologists, approximately 30% reported that they have at times chosen not to prescribe isotretinoin to patients with severe acne due to the administrative burden of iPLEDGE.8 In this study, we sought to further analyze the prescribing patterns of isotretinoin based on a patient’s reproductive potential.
In this single-center, retrospective cohort study, electronic medical records from 3292 patients diagnosed with acne vulgaris at the Department of Dermatology at Rush University Medical Center (Chicago, Illinois) between January 2013 and December 2019 were reviewed. A total of 188 patients who were prescribed isotretinoin for acne were identified, but only 171 met the study criteria. Eligible patients were aged 12 to 25 years and were prescribed oral isotretinoin for acne vulgaris during the study period. Patients younger than 12 or older than 25 years, those who were prescribed isotretinoin for indications other than acne vulgaris, and those who had previously received isotretinoin and either initiated an additional course or continued treatment at our institution were excluded. Eligible patients then were grouped by reproductive potential: patients who can get pregnant (positive reproductive potential [RP+]) and patients who cannot get pregnant (negative reproductive potential [RP–]). The number of months from initial acne visit, total number of office visits attended, and number of alternative medications that failed before isotretinoin therapy was discussed and initiated were compared between the 2 groups. To standardize between groups, the office visit at which patients were enrolled in iPLEDGE served as the date that isotretinoin therapy was initiated. Alternative medication type and sex of the prescriber were evaluated as secondary end points.
Eighty-nine RP+ patients and 82 RP– patients were prescribed isotretinoin for acne, including 85 females, 2 transgender males with female reproductive organs, 2 females with a history of tubal ligation, and 82 males. Of note, the iPLEDGE program considers tubal ligation as a primary form of contraception and classifies these patients as RP+. Patient demographics are summarized in eTable 1. There was a higher proportion of RP– patients aged 10 to 20 years compared to RP+ patients, for whom there was a higher number of patients aged 21 to 30 years. Most RP+ patients were White, while most RP– patients were Hispanic/Latino.
Overall isotretinoin prescribing patterns as well as prescribing patterns stratified by reproductive potential are presented in eTable 2. Overall, the average number of months before isotretinoin was discussed as a treatment option was 11.5 months and before isotretinoin therapy was initiated was 15 months. There was no significant difference between the number of months before isotretinoin was discussed (P=.83) or initiated (P=.56) between RP+ and RP– patients. On average, patients attended 2 office visits before isotretinoin was discussed as a treatment option and 3 office visits before isotretinoin therapy was initiated. The difference between the number of office visits patients attended before isotretinoin was discussed (P=.44) and before isotretinoin therapy was initiated (P=.11) was not significant between RP+ and RP– patients. The number of alternative medications that failed before initiation of isotretinoin therapy was comparable between groups. Patients in the RP– group experienced failure with an average of 5 alternative medications compared with 6 alternative medications in the RP+ group (P=.48).
As shown in eTable 3, oral antibiotic therapy commonly was prescribed prior to isotretinoin in both groups, with doxycycline being prescribed most often. Hormonal therapy, including oral contraceptives and spironolactone, was trialed in 55 of 87 (63.2%) RP+ patients. Most patients experienced failure with other oral antiacne medications before isotretinoin therapy, with only 6 (6.7%) RP+ and 5 (6.1%) RP– patients trying topical therapy only. Prior isotretinoin therapy was documented in 13 (14.6%) RP+ patients compared with only 5 (6.1%) RP– patients. Interestingly, isotretinoin was initiated at the patient’s first office visit more often in the RP+ group.
At the time isotretinoin therapy was initiated, the sex of the prescribing provider was similar within the RP+ group, with 52% (46/89) of female and 48% (43/89) of male prescribers. In the RP– group, there was a slightly higher proportion of male prescribers, with 57% (47/82) male compared to 43% (35/82) female prescribers.
iPLEDGE (https://ipledgeprogram.com) is an online system mandated by the US Food and Drug Administration to be used by patients, physicians, and pharmacists for the duration of isotretinoin therapy to prevent and track isotretinoin-associated pregnancies.9 At its inception, the iPLEDGE program categorized patients as females of child-bearing potential, females not of child-bearing potential, or males. The program recently moved toward transgender-inclusive categorization of patients based on reproductive potential.10 Patients who can get pregnant include cisgender females and transgender males, and patients who cannot get pregnant include cisgender males, transgender females, and females and transgender males who have undergone a hysterectomy or bilateral oophorectomy or who are postmenopausal.9
The iPLEDGE compliance requirements for patients who can get pregnant are extensive. Patients with reproductive potential must obtain a negative baseline pregnancy test, enroll in iPLEDGE, undergo a 30-day waiting period, and obtain a second negative pregnancy test before they can start the medication. Each month thereafter, patients must obtain a negative pregnancy test, demonstrate risk comprehension, and report their methods of contraception on iPLEDGE before they can pick up their prescription. In addition, physicians and pharmacists must confirm patient counseling and obtain authorization codes from iPLEDGE to dispense the medication. If any of these steps are not completed by the patient, physician, or pharmacist within 7 days of the patient’s negative pregnancy test, all steps must be repeated by all parties.9,11
The efficacy and utility of iPLEDGE have been criticized and debated in the literature. Although there has been a general decrease in the number of fetal exposures to isotretinoin since the implementation of iPLEDGE in 2006, the average number of fetal exposures only decreased for 2 years until it plateaued in 2008.5 Some physicians have argued that the decrease in the number of fetal exposures is not attributed to the efficacy of iPLEDGE but rather because the program has made it difficult for patients who can get pregnant to obtain necessary isotretinoin prescriptions.12 Other physicians have reported that they have chosen not to prescribe isotretinoin due to the administrative burden of iPLEDGE.8 Although we expected to observe similar trends in our study, we ultimately had more eligible patients with reproductive potential than patients who could not get pregnant. Additionally, there was no difference in the number of months from initial acne visit, total number of office visits, and number of alternative medications that failed before isotretinoin initiation between patients who could and could not get pregnant. These findings suggest that iPLEDGE requirements did not dissuade prescribers from treating acne with isotretinoin in patients who could get pregnant and that the prescribing patterns of isotretinoin were similar regardless of reproductive potential.
Across all primary outcomes, the standard deviation was high in the overall dataset and in the RP– and RP+ subsets, indicating substantial variability in number of months from initial acne visit, total number of visits, and number of alternative medications that failed prior to initiation of isotretinoin. This implies that the prescribing patterns of isotretinoin may be patient and prescriber dependent, and other variables may influence these outcomes aside from the reproductive potential of the patient. Although there was a marginally higher percentage of male prescribers in the RP– group, the sex of the prescriber did not seem to have a major impact on the prescribing patterns of isotretinoin. Further research is indicated to investigate the impact of other factors that may influence the prescribing patterns of isotretinoin, including insurance coverage, access to contraception, and patient concerns about adverse effects.
The types of alternative medications that patients tried prior to isotretinoin were similar among patients who could get pregnant and patients who could not get pregnant. Hormonal therapy, including oral contraception pills and spironolactone, can be very effective in treating acne in patients with reproductive potential,13 as evidenced by the 55 (31.1%) prescriptions written for hormonal therapy in the RP+ group. Spironolactone for acne is contraindicated in male patients due to its antiandrogenic properties and risk for gynecomastia.14 As such, males have fewer alternative medication options for acne, and this may contribute to the higher prevalence of isotretinoin therapy in males that has been demonstrated in prior studies.6,7 Of note, patients obtained more than 100 prescriptions for oral antimicrobials in both groups. Although patients can see benefit with oral antimicrobials for acne, the volume of antimicrobial prescriptions seen in our cohort raises concerns about antibiotic stewardship.15 Whether isotretinoin is a safer therapeutic option compared to antibiotics is up for debate.2,16
Our study included a small sample size at a single institution, which may limit the external validity of our results. Additionally, our study focused on patients who were prescribed isotretinoin prior to 2020 to control for the influence of the COVID-19 pandemic on prescribing patterns. With this, our data may not reflect postpandemic prescribing trends. Further multi-institution studies that include postpandemic patient cohorts can be conducted to validate our findings.
There were no significant differences in the number of months from initial acne visit, total number of office visits, and number of alternative medications that failed prior to discussing isotretinoin as a treatment option or initiating isotretinoin therapy between patients who can get pregnant and those who cannot get pregnant. We observed substantial variability in these outcomes across datasets, indicating that the prescribing patterns of isotretinoin may be patient and prescriber dependent regardless of the reproductive potential of the patient. Follow-up studies are warranted to further investigate the specific influence of iPLEDGE on the utilization of isotretinoin.
- Aslam I, Fleischer A, Feldman S. Emerging drugs for the treatment of acne. Expert Opin Emerg Drugs. 2015;20:91-101. doi:10.1517/14728214.2015.990373
- Huang CY, Chang IJ, Bolick N, et al. Comparative efficacy of pharmacological treatments for acne vulgaris: a network meta-analysis of 221 randomized controlled trials. Ann Fam Med. 2023;21:358-369. doi:10.1370/afm.2995
- Hauk L. Acne vulgaris: treatment guidelines from the AAD. Am Fam Physician. 2017;95:740-741.
- Habeshian KA, Cohen BA. Current issues in the treatment of acne vulgaris. Pediatrics. 2020;145(suppl 2):S225-S230. doi:10.1542/peds.2019-2056L
- Tkachenko E, Singer S, Sharma P, et al. US Food and Drug Administration reports of pregnancy and pregnancy-related adverse events associated with isotretinoin. JAMA Dermatol. 2019;155:1175-1179. doi:10.1001/jamadermatol.2019.1388
- Fleischer AB Jr, Simpson JK, McMichael A, et al. Are there racial and sex differences in the use of oral isotretinoin for acne management in the United States? J Am Acad Dermatol. 2003;49:662-666. doi:10.1067/s0190-9622(03)01584-6
- Barbieri JS, Shin DB, Wang S, et al. Association of race/ethnicity and sex with differences in health care use and treatment for acne. JAMA Dermatol. 2020;156:312-319. doi:10.1001/jamadermatol.2019.4818
- Lee G, Wolf JR, Somers KE. Administrative burden of iPLEDGE deters isotretinoin prescriptions: results from a survey of dermatologists. Cutis. 2022;110:44-47. doi:10.12788/cutis.0558
- The iPLEDGE REMS Prescriber Guide. iPLEDGE. Updated March 2023. https://ipledgeprogram.com/ResourceDownloadRaw/GuideBestPractices
- Boos MD, Ginsberg BA, Peebles JK. Prescribing isotretinoin for transgender youth: a pledge for more inclusive care. Pediatr Dermatol. 2019;36:169-171. doi:10.1111/pde.13694
- iPLEDGE REMS Guide for Patients Who Can Get Pregnant: The Importance of Avoiding Pregnancy on Isotretinoin. iPLEDGE Program. Updated March 2023. https://ipledgeprogram.com/#Main/Resources
- Nagler AR. Early strides for necessary data-driven improvement in iPLEDGE. JAMA Dermatol. 2019;155:1111-1112. doi:10.1001/jamadermatol.2019.1247
- Reynolds RV, Yeung H, Cheng CE, et al. Guidelines of care for the management of acne vulgaris. J Am Acad Dermatol. 2024;90:1006.E1-1006.E30. doi:10.1016/j.jaad.2023.12.017
- Sato K, Matsumoto D, Iizuka F, et al. Anti-androgenic therapy using oral spironolactone for acne vulgaris in Asians. Aesthetic Plast Surg. 2006;30:689-694. doi:10.1007/s00266-006-0081-0
- Issa NT, Kircik LH. Antibiotic stewardship in acne: 2023 update. J Drugs Dermatol. 2024;23:SF37896s4-SF378969s10. doi:10.36849/JDD.SF378969
- Vallerand IA, Lewinson RT, Farris MS, et al. Efficacy and adverse events of oral isotretinoin for acne: a systematic review. Br J Dermatol. 2018;178:76-85. doi:10.1111/bjd.15668
Equity Evaluation: Analysis of the Prescribing Patterns of Isotretinoin Based on Reproductive Potential
Equity Evaluation: Analysis of the Prescribing Patterns of Isotretinoin Based on Reproductive Potential
Practice Points
- Isotretinoin is one of the few monotherapy options available for acne, but its use often is limited by concerns for severe internal and external birth defects if taken during pregnancy.
- The number of office visits attended, alternative acne medications used, and duration of acne treatment prior to isotretinoin therapy were similar between patients who can become pregnant and patients who cannot become pregnant.
- The reproductive potential of the patient did not appear to have a major impact on the prescribing patterns of isotretinoin; rather, the utilization of isotretinoin likely is dependent on individual prescriber preferences and other patient factors.

Asymptomatic Enlarging Lobulated Mass on the Lower Leg
Asymptomatic Enlarging Lobulated Mass on the Lower Leg
THE DIAGNOSIS: Dermatofibroma
Histopathologic examination of the shave biopsy revealed fascicles of plump fibroblasts and histiocytes interposed between thick collagen bundles within the dermis, consistent with a diagnosis of dermatofibroma (DF). Dermatofibroma is a common benign skin tumor that classically manifests as brownish or reddish-brown firm papules or nodules that dimple when compressed. While the exact etiology of DF remains uncertain, it is believed to arise from a combined neoplastic and reactive fibroblastic proliferation process in response to stimuli, such as minor trauma or insect bites (as in our patient).1
On histopathology, the most common findings associated with DF are dermal proliferation of spindle-shaped fibroblasts arranged in a storiform or whorled pattern.2 In this patient, fascicles of plump fibroblasts and histiocytes were observed interspersed among thick collagen bundles within the dermis (Figure). Other histologic variants of DF include cellular, histiocytic, lipidized, angiomatous, aneurysmal, clear cell, monster cell, myxoid, keloidal, palisading, osteoclastic, and epithelioid.
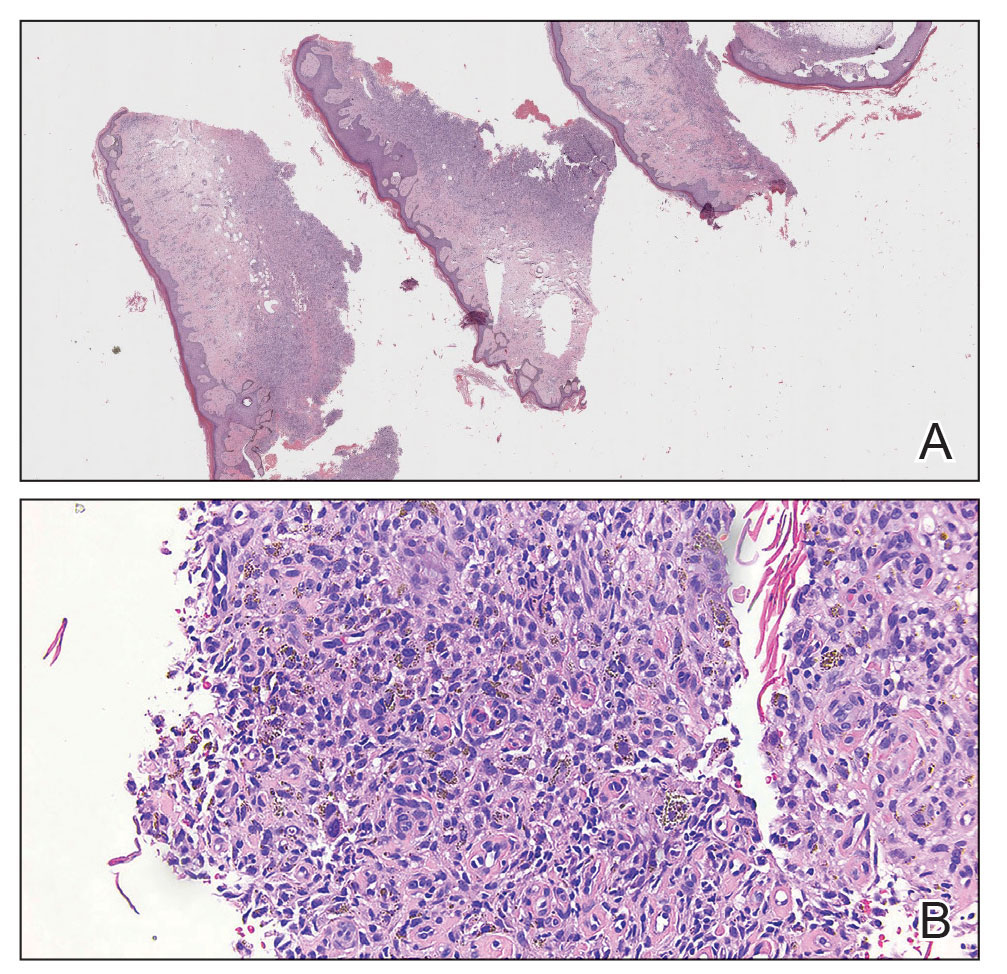
On dermatoscopic examination, a pigment network is the most common feature, followed by a white scarlike patch, brown dots and globules, and vascular structures.2 Atypical DF variants can manifest with diverse clinical morphologies; one example is giant DF, which exceeds 5 cm and may exhibit an ulcerated or pedunculated appearance, as seen in our case.3 In such cases, a thorough clinical examination coupled with histopathologic analysis becomes paramount for accurate diagnosis.
Most cases of DF do not require intervention unless there are cosmetic concerns or the lesions are symptomatic. Surgical excision is a common and effective treatment method but results in scarring. Intralesional steroid injection and cryotherapy are less aggressive treatment options but have limited efficacy. Lasers, including carbon dioxide and pulsed dye lasers, are infrequently used; however, recurrence is possible with any treatment modality.4 Local recurrence is common, occurring in 26% to 50% of cases, particularly in atypical dermatofibroma variants after treatment.5 Recurrence is more likely with primary lesions larger than 1 cm.5
Several conditions share clinical features with DF, necessitating a thorough differential diagnosis. Dermatofibrosarcoma protuberans (DFSP) is a rare, locally aggressive, malignant tumor with a propensity for recurrence. It manifests as a slow-growing, red-brown, indurated plaque with irregular nodularity. Immunohistochemical staining can be used to differentiate DF from DFSP, with DF typically expressing factor XIIIa and lacking CD34, whereas DFSP exhibits CD34 positivity and lacks factor XIIIa expression.6 Another diagnosis in the differential is fibrosarcoma, a malignant tumor of fibroblasts that manifests as a painless, enlarging, poorly defined mass on the lower extremities. Histopathologic features include atypical fibroblasts and collagen with proliferation of atypical spindle-shaped cells.
Other benign lesions to consider include neurofibroma, which may manifest as a firm nodule but is derived from nerve tissue. Clinically, neurofibromas can be differentiated by their association with neurofibromatosis and softer texture. Cutaneous squamous cell carcinoma also should be considered, as it is a malignant proliferation of cutaneous epithelium that clinically manifests as a hyperkeratotic papule or plaque.5
- Hui P, J. Glusac E, Sinard JH, et al. Clonal analysis of cutaneous fibrous histiocytoma (dermatofibroma). J Cutan Pathol. 2002;29:385-389.
- Şenel E, Yuyucu Karabulut Y, Doğruer Şenel S. Clinical, histopathological, dermatoscopic and digital microscopic features of dermatofibroma: a retrospective analysis of 200 lesions. J Eur Acad Derm Venereol. 2015;29:1958-1966.
- Requena L, Fariña MC, Fuente C, et al. Giant dermatofibroma: a little-known clinical variant of dermatofibroma. J Am Acad Dermatol. 1994;30:714-718.
- Alonso-Castro L, Boixeda P, Segura-Palacios JM, et al. Dermatofibromas treated with pulsed dye laser: clinical and dermoscopic outcomes. J Cosmet Laser Ther. 2012;14:98-101.
- Gaufin M, Michaelis T, Duffy K. Cellular dermatofibroma: clinicopathologic review of 218 cases of cellular dermatofibroma to determine the clinical recurrence rate. Dermatol Surg. 2019;45:1359-1364.
- West KL, Cardona DM, Su Z, et al. Immunohistochemical markers in fibrohistiocytic lesions: factor XIIIa, CD34, S-100 and p75. Am J Dermatopathol. 2014;36:414-419.
THE DIAGNOSIS: Dermatofibroma
Histopathologic examination of the shave biopsy revealed fascicles of plump fibroblasts and histiocytes interposed between thick collagen bundles within the dermis, consistent with a diagnosis of dermatofibroma (DF). Dermatofibroma is a common benign skin tumor that classically manifests as brownish or reddish-brown firm papules or nodules that dimple when compressed. While the exact etiology of DF remains uncertain, it is believed to arise from a combined neoplastic and reactive fibroblastic proliferation process in response to stimuli, such as minor trauma or insect bites (as in our patient).1
On histopathology, the most common findings associated with DF are dermal proliferation of spindle-shaped fibroblasts arranged in a storiform or whorled pattern.2 In this patient, fascicles of plump fibroblasts and histiocytes were observed interspersed among thick collagen bundles within the dermis (Figure). Other histologic variants of DF include cellular, histiocytic, lipidized, angiomatous, aneurysmal, clear cell, monster cell, myxoid, keloidal, palisading, osteoclastic, and epithelioid.
On dermatoscopic examination, a pigment network is the most common feature, followed by a white scarlike patch, brown dots and globules, and vascular structures.2 Atypical DF variants can manifest with diverse clinical morphologies; one example is giant DF, which exceeds 5 cm and may exhibit an ulcerated or pedunculated appearance, as seen in our case.3 In such cases, a thorough clinical examination coupled with histopathologic analysis becomes paramount for accurate diagnosis.
Most cases of DF do not require intervention unless there are cosmetic concerns or the lesions are symptomatic. Surgical excision is a common and effective treatment method but results in scarring. Intralesional steroid injection and cryotherapy are less aggressive treatment options but have limited efficacy. Lasers, including carbon dioxide and pulsed dye lasers, are infrequently used; however, recurrence is possible with any treatment modality.4 Local recurrence is common, occurring in 26% to 50% of cases, particularly in atypical dermatofibroma variants after treatment.5 Recurrence is more likely with primary lesions larger than 1 cm.5
Several conditions share clinical features with DF, necessitating a thorough differential diagnosis. Dermatofibrosarcoma protuberans (DFSP) is a rare, locally aggressive, malignant tumor with a propensity for recurrence. It manifests as a slow-growing, red-brown, indurated plaque with irregular nodularity. Immunohistochemical staining can be used to differentiate DF from DFSP, with DF typically expressing factor XIIIa and lacking CD34, whereas DFSP exhibits CD34 positivity and lacks factor XIIIa expression.6 Another diagnosis in the differential is fibrosarcoma, a malignant tumor of fibroblasts that manifests as a painless, enlarging, poorly defined mass on the lower extremities. Histopathologic features include atypical fibroblasts and collagen with proliferation of atypical spindle-shaped cells.
Other benign lesions to consider include neurofibroma, which may manifest as a firm nodule but is derived from nerve tissue. Clinically, neurofibromas can be differentiated by their association with neurofibromatosis and softer texture. Cutaneous squamous cell carcinoma also should be considered, as it is a malignant proliferation of cutaneous epithelium that clinically manifests as a hyperkeratotic papule or plaque.5
- Hui P, J. Glusac E, Sinard JH, et al. Clonal analysis of cutaneous fibrous histiocytoma (dermatofibroma). J Cutan Pathol. 2002;29:385-389.
- Şenel E, Yuyucu Karabulut Y, Doğruer Şenel S. Clinical, histopathological, dermatoscopic and digital microscopic features of dermatofibroma: a retrospective analysis of 200 lesions. J Eur Acad Derm Venereol. 2015;29:1958-1966.
- Requena L, Fariña MC, Fuente C, et al. Giant dermatofibroma: a little-known clinical variant of dermatofibroma. J Am Acad Dermatol. 1994;30:714-718.
- Alonso-Castro L, Boixeda P, Segura-Palacios JM, et al. Dermatofibromas treated with pulsed dye laser: clinical and dermoscopic outcomes. J Cosmet Laser Ther. 2012;14:98-101.
- Gaufin M, Michaelis T, Duffy K. Cellular dermatofibroma: clinicopathologic review of 218 cases of cellular dermatofibroma to determine the clinical recurrence rate. Dermatol Surg. 2019;45:1359-1364.
- West KL, Cardona DM, Su Z, et al. Immunohistochemical markers in fibrohistiocytic lesions: factor XIIIa, CD34, S-100 and p75. Am J Dermatopathol. 2014;36:414-419.
Asymptomatic Enlarging Lobulated Mass on the Lower Leg
Asymptomatic Enlarging Lobulated Mass on the Lower Leg
A 69-year-old woman presented to the dermatology clinic with enlarging nodules on the bilateral lower legs of several years’ duration. Cutaneous examination of the legs revealed a brown, pedunculated, lobulated nodule on the lateral right lower leg measuring 5.0×1.9 cm. The patient reported that the lesion first appeared after a mosquito bite and then slowly grew over several years. A shave biopsy of the lesion was performed.
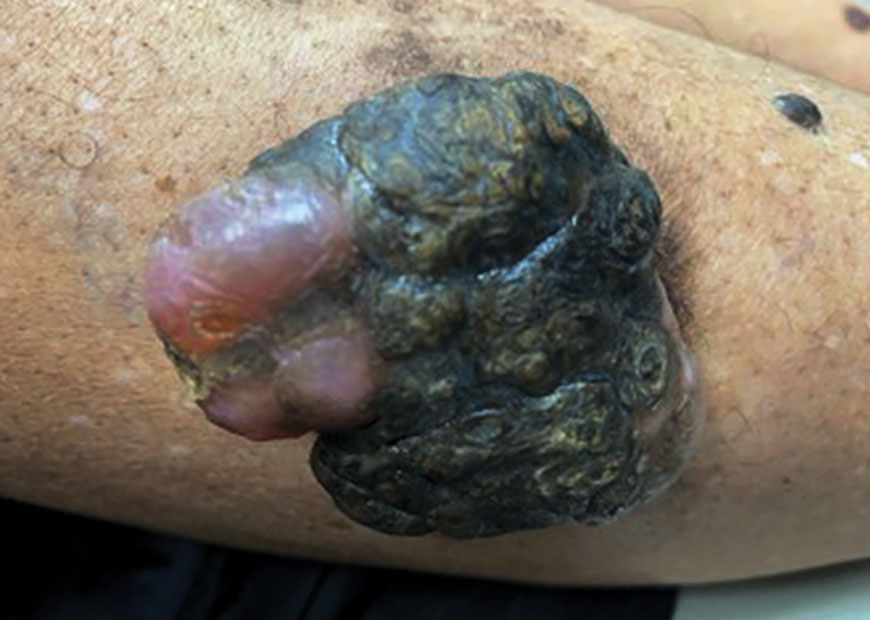
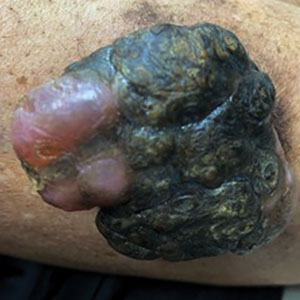
Optimizing Clinical Teams in Dermatology: A Strategic Framework for Recruitment, Onboarding, and Retention
Optimizing Clinical Teams in Dermatology: A Strategic Framework for Recruitment, Onboarding, and Retention
Effective staffing is central to delivering high-quality, efficient dermatologic care. In the current landscape of American medicine, dermatologists manage complex medical conditions, perform surgical procedures, and in some cases expand into elective aesthetic services. The ability to offer advanced clinical services is dependent on the performance of those who operate equipment and sustain daily operations.
The “perfect” hire is therefore not a luxury but a necessity for practice survival: with shrinking reimbursements and rising administrative burden, staff capability influences clinic efficiency, medicolegal risk, and patient experience and outcomes. A dysfunctional team can contribute to physician burnout, whereas a high‑functioning one enables dermatologists to practice at the top of their license by focusing on diagnosis and complex interventions while the office functions efficiently. In this article, we examine the anatomy of modern dermatology hiring and highlight the benefits of shifting from reactive staffing to proactive talent acquisition.
PHASE 1: THE PHILOSOPHY OF THE DERMATOLOGY-SPECIFIC PROFILE
Before drafting a job description, it is important to have an idea of what the ideal candidate embodies. A medical assistant in a high-volume Mohs surgery suite requires a vastly different temperament and skill set than an aesthetic coordinator in a boutique cosmetic practice. Here are some factors to consider when approaching your ideal hire.
The Hybridity of the Specialty
Dermatology is unique in that the same patient can be treated for a life-threatening melanoma and a bothersome wrinkle within the same afternoon. This requires staff who can pivot emotionally and technically. When looking for a new employee, prioritize the 4 pillars of the ideal dermatology assistant: clinical competency, a hospitality mindset, digital agility, and a “get it done” mindset.
Clinical Competency—A basic understanding of skin anatomy and common pathologies is vital, even for nonclinical roles. A front-desk employee who understands the urgency of a changing mole in a patient with melanoma vs a new acne cyst is a vital triage asset.
Hospitality Mindset—When operating a dermatology clinic with offerings in the elective space (ie, aesthetics), be aware that patients increasingly are viewing themselves as consumers in these spaces. Dermatologists should look for candidates who have experience in high-end service industries such as retail, hospitality, or concierge services. These individuals understand that the patient experience begins in the parking lot and ends with the follow-up call.
Digital Agility—We are in the midst of a technological revolution. Between AI-driven diagnostic assistance, teledermatology platforms, and integrated electronic medical record/billing systems, the modern employee has to be more than just computer literate—they must be digitally native (eg, able to troubleshoot a tablet-based consent form or explain a patient portal with ease).
“Get It Done” Mindset—In a fast-paced dermatology clinic, it is important to find someone who looks for work instead of waiting for orders; otherwise, you might find yourself spending more time directing your employees than getting your actual work done.
The Culture Fit vs Culture Add
Traditionally, practices have prioritized hiring for “culture fit”—that is, looking for individuals who think and behave like existing staff. Contemporary management theory, however, favors hiring for “culture add,” recruiting candidates who contribute perspectives and skills absent from the current team. For practices expanding into aesthetics or focusing on a specific aspect of dermatology, the practice needs employees who bring perspectives it lacks. Perhaps the candidate has a background in hospitality, or they are involved in community health initiatives. These “adds” broaden the practice’s reach and depth.
PHASE 2: THE STRATEGIC RECRUITMENT PROCESS
The days of putting up “Help Wanted” signs are over. To find elite talent, dermatologists must treat recruitment like a diagnostic workup: thorough, methodical, and evidence based. Follow these steps for a thoughtful progression in finding the right candidate for your practice.
Step 1: Crafting a Magnetic Job Description
Most job postings read like a dry list of tasks: Take vitals, room patients, call in prescriptions. These descriptions attract clock-punchers. To attract careerists, the vision must be sold. An effective job description should include 2 main components: the vision statement and the growth path.
The Vision Statement—Start by stating your practice’s mission. If you’re focused on building a practice that values concierge-style care with long visit times, say so: “Join a team dedicated to patient care, slowing down, and personalized services.”
The Growth Path—High-quality candidates want to focus on their career trajectory. During the interview, mention opportunities for laser certification, scribe training, or management tracks. For those on a path toward higher education, describe the breadth of clinical training and experience.
Step 2: The Tiered Interview Protocol
We recommend a 3-tiered approach to the interview process to ensure multiple data points are collected before an offer is made: a behavior screen, a “shadow day,” and a “no doctor” zone.
Tier 1: The Behavioral Screen (Remote)—Conduct a 20-minute video call focused purely on soft skills using questions from the STAR method (Situation, Task, Action, Result). For example, ask something like, “Tell me about a time you may have faced an unsatisfied client. How did you de-escalate the situation?” Pay attention to whether the candidate takes responsibility or places blame.
Tier 2: The Shadow Day (Working Interview)—This can be an important part of the hiring process. We recommend inviting top candidates for a paid half- or full-day trial to assess how they perform in a real-world clinical setting. For medical assistant candidates, evaluate their ability to remain task focused and efficient and observe how they handle situations such as the sight of blood or interactions with needle-phobic patients. For front-desk candidates, pay attention to how they prioritize competing responsibilities and their openness to learning and feedback. For all positions, observing interactions with both patients and team members can provide valuable insight into professionalism, communication skills, and overall fit within the practice.
Tier 3: The “No-Doctor” Zone (Optional)—Leave the candidate alone with the current staff, if only for a few minutes. This allows the employer to gauge not only the candidate’s behavior with a senior member of staff but also with other members of the team, allowing for demonstration of character. Ask the team to assess if this is someone they would want to spend a workday with. If the staff says no, that may affect your choice of hire as well.
PHASE 3: THE OFFER AND THE LEGAL GUARDRAILS
After finding the unicorn candidate, the closing process must be professional and legally sound. Here are the steps we have found most helpful to take once a decision for a hire is made.
The Offer Letter as a Blueprint
An offer letter is more than a salary statement; it is a document of expectations. It should include the following components:
- Clear Compensation Structure: Base pay plus any performance-based incentives (eg, bonuses for retail skin care sales or conversion rates on cosmetic consultations).
- Specific Benefit Clauses: Paid time off, benefits such as health insurance and 401(k) matching if you are offering, and professional perks such as discounted treatments or skin care stipends.
- At-Will Statement: Ensure your legal counsel has reviewed your at-will employment clauses to protect the practice. This allows the employer to terminate an employee without legal liability and conversely gives the employee flexibility to leave the position if it does not fit their needs.
- Employee Manual: Once formally hired, make sure you have an employee handbook with your expectations and regulations—ranging from dress code and safety regulations to paid time off—clearly written. Be more specific than you think is necessary, which will prevent potential discrepancies down the road.
Onboarding: The First 90 Days
The first 90 days of employment are the most volatile. Statistics show that the majority of staff turnover happens in this window.1 To mitigate this, use the following 90-day success map:
- The Immersion Period (Days 1-30): The new hire should not be expected to produce. They are there to learn the culture of the clinic: the protocols for rooming, the vernacular for explaining procedures, and the standards for documentation.
- The Guided Execution Period (Days 31-60): They begin performing tasks under the direct supervision of a senior lead.
- The Independent Integration Period (Days 61-90): They take on a full load, with weekly check-ins to address friction points.
PHASE 4: RETENTION THROUGH PROFESSIONAL DEVELOPMENT
In dermatology practices, staff members frequently are approached by competitors, medical spas, and industry representatives to work for them. Retention is not just about the paycheck; it’s about the “professional home.” Staff members want to feel valued and have a responsible role in the workplace.
As dermatologists, we often are seen as the captain of the ship; however, the most successful practices operate as high-reliability organizations. In this type of practice, everyone from the janitorial staff to the senior associate is encouraged to speak up if there is a safety issue or an efficiency gap. Here are some techniques to foster this culture.
The Weekly Huddle—For practices that are just starting to expand, this is a great way to make sure that friction points and difficulties are addressed before becoming a larger issue. Gathering the staff for just 15 minutes in the morning before clinic begins can be a great way to address housekeeping issues, encourage staff to speak up about problems they may have identified, and provide a chance for everyone to feel heard.
The Educational Bend—Encourage staff to grow their wealth of knowledge, whether from industry-sponsored educational product events to formal certifications. A front desk assistant who then moves on to get their advanced degree may return to the practice as a nurse and become a valuable partner and asset.
PHASE 5: LOOKING TOWARD THE FUTURE
As we look toward 2027 and beyond, the employee of the future may not be entirely human. We already are seeing the integration of AI scribes and automated billing auditors. Practices should look for candidates who aren’t afraid of AI but are excited by it. A medical assistant who can oversee an AI scribe while still maintaining eye contact and holding a patient’s hand during a painful injection is the gold standard.
Final Thoughts
Our medical school training prepares us for the “what” of dermatology, but it rarely prepares us for the “who.” As practice managers, we are thrust into the role of CEO, human resources director, and culture architect without a formal syllabus. By applying the same clinical rigor to the hiring process that we do to a complex diagnostic case, we can build teams that don’t just work for us but build with us. The goal is a practice where the physician can focus on the art and science of the skin, confident that every other aspect of the patient journey is being handled by a team that is as dedicated, ethical, and clinical as they are. Hiring is one of the most difficult procedures you will likely perform in your practice; it also is the one with the highest long-term success rate if performed with thoughtfulness, precision, and above all, kindness.
- 2026 NSI National Health Care Retention & RN Staffing Report. NSI Nursing Solutions. Published March, 2026. Accessed June 17, 2026. https://www.google.com/url?q=https://www.nsinursingsolutions.com/Documents/Library/NSI_National_Health_Care_Retention_Report.pdf
Effective staffing is central to delivering high-quality, efficient dermatologic care. In the current landscape of American medicine, dermatologists manage complex medical conditions, perform surgical procedures, and in some cases expand into elective aesthetic services. The ability to offer advanced clinical services is dependent on the performance of those who operate equipment and sustain daily operations.
The “perfect” hire is therefore not a luxury but a necessity for practice survival: with shrinking reimbursements and rising administrative burden, staff capability influences clinic efficiency, medicolegal risk, and patient experience and outcomes. A dysfunctional team can contribute to physician burnout, whereas a high‑functioning one enables dermatologists to practice at the top of their license by focusing on diagnosis and complex interventions while the office functions efficiently. In this article, we examine the anatomy of modern dermatology hiring and highlight the benefits of shifting from reactive staffing to proactive talent acquisition.
PHASE 1: THE PHILOSOPHY OF THE DERMATOLOGY-SPECIFIC PROFILE
Before drafting a job description, it is important to have an idea of what the ideal candidate embodies. A medical assistant in a high-volume Mohs surgery suite requires a vastly different temperament and skill set than an aesthetic coordinator in a boutique cosmetic practice. Here are some factors to consider when approaching your ideal hire.
The Hybridity of the Specialty
Dermatology is unique in that the same patient can be treated for a life-threatening melanoma and a bothersome wrinkle within the same afternoon. This requires staff who can pivot emotionally and technically. When looking for a new employee, prioritize the 4 pillars of the ideal dermatology assistant: clinical competency, a hospitality mindset, digital agility, and a “get it done” mindset.
Clinical Competency—A basic understanding of skin anatomy and common pathologies is vital, even for nonclinical roles. A front-desk employee who understands the urgency of a changing mole in a patient with melanoma vs a new acne cyst is a vital triage asset.
Hospitality Mindset—When operating a dermatology clinic with offerings in the elective space (ie, aesthetics), be aware that patients increasingly are viewing themselves as consumers in these spaces. Dermatologists should look for candidates who have experience in high-end service industries such as retail, hospitality, or concierge services. These individuals understand that the patient experience begins in the parking lot and ends with the follow-up call.
Digital Agility—We are in the midst of a technological revolution. Between AI-driven diagnostic assistance, teledermatology platforms, and integrated electronic medical record/billing systems, the modern employee has to be more than just computer literate—they must be digitally native (eg, able to troubleshoot a tablet-based consent form or explain a patient portal with ease).
“Get It Done” Mindset—In a fast-paced dermatology clinic, it is important to find someone who looks for work instead of waiting for orders; otherwise, you might find yourself spending more time directing your employees than getting your actual work done.
The Culture Fit vs Culture Add
Traditionally, practices have prioritized hiring for “culture fit”—that is, looking for individuals who think and behave like existing staff. Contemporary management theory, however, favors hiring for “culture add,” recruiting candidates who contribute perspectives and skills absent from the current team. For practices expanding into aesthetics or focusing on a specific aspect of dermatology, the practice needs employees who bring perspectives it lacks. Perhaps the candidate has a background in hospitality, or they are involved in community health initiatives. These “adds” broaden the practice’s reach and depth.
PHASE 2: THE STRATEGIC RECRUITMENT PROCESS
The days of putting up “Help Wanted” signs are over. To find elite talent, dermatologists must treat recruitment like a diagnostic workup: thorough, methodical, and evidence based. Follow these steps for a thoughtful progression in finding the right candidate for your practice.
Step 1: Crafting a Magnetic Job Description
Most job postings read like a dry list of tasks: Take vitals, room patients, call in prescriptions. These descriptions attract clock-punchers. To attract careerists, the vision must be sold. An effective job description should include 2 main components: the vision statement and the growth path.
The Vision Statement—Start by stating your practice’s mission. If you’re focused on building a practice that values concierge-style care with long visit times, say so: “Join a team dedicated to patient care, slowing down, and personalized services.”
The Growth Path—High-quality candidates want to focus on their career trajectory. During the interview, mention opportunities for laser certification, scribe training, or management tracks. For those on a path toward higher education, describe the breadth of clinical training and experience.
Step 2: The Tiered Interview Protocol
We recommend a 3-tiered approach to the interview process to ensure multiple data points are collected before an offer is made: a behavior screen, a “shadow day,” and a “no doctor” zone.
Tier 1: The Behavioral Screen (Remote)—Conduct a 20-minute video call focused purely on soft skills using questions from the STAR method (Situation, Task, Action, Result). For example, ask something like, “Tell me about a time you may have faced an unsatisfied client. How did you de-escalate the situation?” Pay attention to whether the candidate takes responsibility or places blame.
Tier 2: The Shadow Day (Working Interview)—This can be an important part of the hiring process. We recommend inviting top candidates for a paid half- or full-day trial to assess how they perform in a real-world clinical setting. For medical assistant candidates, evaluate their ability to remain task focused and efficient and observe how they handle situations such as the sight of blood or interactions with needle-phobic patients. For front-desk candidates, pay attention to how they prioritize competing responsibilities and their openness to learning and feedback. For all positions, observing interactions with both patients and team members can provide valuable insight into professionalism, communication skills, and overall fit within the practice.
Tier 3: The “No-Doctor” Zone (Optional)—Leave the candidate alone with the current staff, if only for a few minutes. This allows the employer to gauge not only the candidate’s behavior with a senior member of staff but also with other members of the team, allowing for demonstration of character. Ask the team to assess if this is someone they would want to spend a workday with. If the staff says no, that may affect your choice of hire as well.
PHASE 3: THE OFFER AND THE LEGAL GUARDRAILS
After finding the unicorn candidate, the closing process must be professional and legally sound. Here are the steps we have found most helpful to take once a decision for a hire is made.
The Offer Letter as a Blueprint
An offer letter is more than a salary statement; it is a document of expectations. It should include the following components:
- Clear Compensation Structure: Base pay plus any performance-based incentives (eg, bonuses for retail skin care sales or conversion rates on cosmetic consultations).
- Specific Benefit Clauses: Paid time off, benefits such as health insurance and 401(k) matching if you are offering, and professional perks such as discounted treatments or skin care stipends.
- At-Will Statement: Ensure your legal counsel has reviewed your at-will employment clauses to protect the practice. This allows the employer to terminate an employee without legal liability and conversely gives the employee flexibility to leave the position if it does not fit their needs.
- Employee Manual: Once formally hired, make sure you have an employee handbook with your expectations and regulations—ranging from dress code and safety regulations to paid time off—clearly written. Be more specific than you think is necessary, which will prevent potential discrepancies down the road.
Onboarding: The First 90 Days
The first 90 days of employment are the most volatile. Statistics show that the majority of staff turnover happens in this window.1 To mitigate this, use the following 90-day success map:
- The Immersion Period (Days 1-30): The new hire should not be expected to produce. They are there to learn the culture of the clinic: the protocols for rooming, the vernacular for explaining procedures, and the standards for documentation.
- The Guided Execution Period (Days 31-60): They begin performing tasks under the direct supervision of a senior lead.
- The Independent Integration Period (Days 61-90): They take on a full load, with weekly check-ins to address friction points.
PHASE 4: RETENTION THROUGH PROFESSIONAL DEVELOPMENT
In dermatology practices, staff members frequently are approached by competitors, medical spas, and industry representatives to work for them. Retention is not just about the paycheck; it’s about the “professional home.” Staff members want to feel valued and have a responsible role in the workplace.
As dermatologists, we often are seen as the captain of the ship; however, the most successful practices operate as high-reliability organizations. In this type of practice, everyone from the janitorial staff to the senior associate is encouraged to speak up if there is a safety issue or an efficiency gap. Here are some techniques to foster this culture.
The Weekly Huddle—For practices that are just starting to expand, this is a great way to make sure that friction points and difficulties are addressed before becoming a larger issue. Gathering the staff for just 15 minutes in the morning before clinic begins can be a great way to address housekeeping issues, encourage staff to speak up about problems they may have identified, and provide a chance for everyone to feel heard.
The Educational Bend—Encourage staff to grow their wealth of knowledge, whether from industry-sponsored educational product events to formal certifications. A front desk assistant who then moves on to get their advanced degree may return to the practice as a nurse and become a valuable partner and asset.
PHASE 5: LOOKING TOWARD THE FUTURE
As we look toward 2027 and beyond, the employee of the future may not be entirely human. We already are seeing the integration of AI scribes and automated billing auditors. Practices should look for candidates who aren’t afraid of AI but are excited by it. A medical assistant who can oversee an AI scribe while still maintaining eye contact and holding a patient’s hand during a painful injection is the gold standard.
Final Thoughts
Our medical school training prepares us for the “what” of dermatology, but it rarely prepares us for the “who.” As practice managers, we are thrust into the role of CEO, human resources director, and culture architect without a formal syllabus. By applying the same clinical rigor to the hiring process that we do to a complex diagnostic case, we can build teams that don’t just work for us but build with us. The goal is a practice where the physician can focus on the art and science of the skin, confident that every other aspect of the patient journey is being handled by a team that is as dedicated, ethical, and clinical as they are. Hiring is one of the most difficult procedures you will likely perform in your practice; it also is the one with the highest long-term success rate if performed with thoughtfulness, precision, and above all, kindness.
- 2026 NSI National Health Care Retention & RN Staffing Report. NSI Nursing Solutions. Published March, 2026. Accessed June 17, 2026. https://www.google.com/url?q=https://www.nsinursingsolutions.com/Documents/Library/NSI_National_Health_Care_Retention_Report.pdf
- 2026 NSI National Health Care Retention & RN Staffing Report. NSI Nursing Solutions. Published March, 2026. Accessed June 17, 2026. https://www.google.com/url?q=https://www.nsinursingsolutions.com/Documents/Library/NSI_National_Health_Care_Retention_Report.pdf
Optimizing Clinical Teams in Dermatology: A Strategic Framework for Recruitment, Onboarding, and Retention
Optimizing Clinical Teams in Dermatology: A Strategic Framework for Recruitment, Onboarding, and Retention
Practice Points
- Dermatology requires a unique workforce that can balance clinical knowledge, customer service, technology use, and adaptability across medical and cosmetic settings.
- Effective hiring is a strategic process that relies on clearly defined candidate profiles, structured recruitment, and thoughtful onboarding.
- Practice success depends on retention and growth, with strong workplace culture, professional development, and readiness for AI-driven changes playing key roles.

Managing Acne Relapse After Isotretinoin: Tips from John Barbieri, MD, MBA
Managing Acne Relapse After Isotretinoin: Tips from John Barbieri, MD, MBA
Recent data suggest that approximately 20% to 40% of patients treated with isotretinoin have recurrence of acne. How should dermatologists interpret these findings?
DR. BARBIERI: While isotretinoin is highly effective and capable of delivering long-term remission, we should be careful to avoid describing it as a “cure” when counseling patients. Importantly, when acne does recur, it is often milder, and about half of those who have acne recurrence can be managed with topicals alone. For those who do require a subsequent course of isotretinoin, we should view this as an outcome that can be expected to happen in about 1 in 10 treated with isotretinoin rather than a treatment failure.
How important is cumulative dose in preventing relapse, and should we be rethinking traditional dosing targets?
DR. BARBIERI: Cumulative dose is one of the most important factors in preventing recurrence. Multiple studies support that higher cumulative dose is a strong predictor of long-term clearance. In contrast, daily dose does not seem to be as important a factor. However, higher cumulative dose also means longer courses and more potential for adverse effects, including long-term skin and eye dryness. For this reason, I prefer to treat to clinical endpoints of clear skin for 2 to 3 months and at least 120 to 150 mg/kg cumulative dose to balance achieving high cumulative doses with potential adverse effects and risks. For those with fewer adverse effects or who prioritize long-term clearance, we might go a little longer and for those with more adverse effects, we might use a shorter course and accept a higher risk for recurrence. By taking this approach, we can individualize our dosing approach to each patient.
What factors most strongly predict relapse after a completed isotretinoin course?
DR. BARBIERI: Some demographic factors that have been associated with higher rates of recurrence include greater baseline severity and younger age at treatment. Women with a strong hormonal component to their acne, such as those with polyendocrine metabolic ovarian syndrome (formerly polycystic ovary syndrome), also may be more likely to have recurrence. With respect to clinical factors, increasing cumulative dose has been associated with reduced risk for recurrence in multiple studies, and treating until a clinical endpoint of clear skin for 2 to 3 months also may be predictive of long-term clearance.
When a patient relapses, how do you decide between topical therapy, hormonal treatment, or a second isotretinoin course?
DR. BARBIERI: It depends on relapse severity and patient goals. Mild recurrence often responds well to topical therapies such as retinoids, benzoyl peroxide, antibiotics, and clascoterone. About half of those with recurrence will be able to manage it with topical therapies alone. For those with more severe acne requiring systemic therapy, about half will decide on a repeat course of isotretinoin, which I often find works faster and better than the first course. For second courses, I will typically try to use micronized isotretinoin due to the more consistent pharmacokinetics. For women—especially those with signs of hyperandrogenism such as hirsutism, irregular periods, or flaring with menstrual cycle—hormonal therapy such as combined oral contraceptives or spironolactone can be a great option. Oral antibiotics also can be a consideration for those with recurrence, though we need to be thoughtful about antimicrobial stewardship and risks of long-term antibiotic use.
Are low-dose or shorter-course regimens contributing to higher relapse rates?
DR. BARBIERI: While there is some evidence that higher daily doses may be associated with lower risk for recurrence, when you control for cumulative dose, it doesn’t seem like daily dose has much influence. In contrast, cumulative dose has a large effect on frequency of long-term clearance. While I don’t think low-dose regimens are inherently problematic, if they result in shorter cumulative dose courses, that could increase the risk for recurrence.
How does hormonal acne influence long-term outcomes after isotretinoin?
DR. BARBIERI: While all acne is “hormonal,” those with a stronger hormonal pathogenesis, such as women with polyendocrine metabolic ovarian syndrome or other signs of hyperandrogenism, may have a higher likelihood of recurrence after treatment. In these patients, I often find hormonal therapy such as combined oral contraceptives or spironolactone to be highly effective, even if they haven't worked before.
Should maintenance therapy be routine after isotretinoin, and if so, what strategies are most effective?
DR. BARBIERI: Since many patients have a goal of long-term clearance after isotretinoin, I do not routinely recommend maintenance therapy, as this seems antithetical to this goal. However, for those who are very concerned about recurrence or who would like to be on a topical retinoid for other reasons, I will sometimes start a topical retinoid after treatment with isotretinoin.
How should dermatologists counsel patients about expectations with respect to relapse before starting isotretinoin?
DR. BARBIERI: We should be careful to set appropriate expectations with isotretinoin. I counsel patients that isotretinoin is an incredibly effective therapy for severe acne, with a high likelihood of long-term remission, but not a guaranteed permanent cure. Setting this expectation upfront reduces disappointment if acne does recur and improves shared decision-making.
Managing Acne Relapse After Isotretinoin: Tips from John Barbieri, MD, MBA
Managing Acne Relapse After Isotretinoin: Tips from John Barbieri, MD, MBA

What They Want and What They Need: The End-of-Life Conflict
What They Want and What They Need: The End-of-Life Conflict
When contemplating the state of ethical dialogue in our modern world, the philosopher Alasdair MacIntyre had this to say: “I can only answer the question, ‘What am I to do?’ If I can answer the prior question ‘Of what story or stories do I find myself a part?’”1 That is, our ethics must proceed from our understanding of ourselves, others, and the world. David Hume might scoff, but we do need an “is” to appreciate and grasp our “ought.” This is just as true for medical ethics as it is for the rest of life. Questions about what we should do in medicine should draw us to deeper questions about identity and purpose.
In this issue, Ruskin et al present a tragic case of a man who spent his later years walking the line between life and a self-chosen death.2 After enduring the chronic decline of Parkinson disease, he faced a final diagnosis of glioblastoma. The patient enrolled in hospice while considering how he might move elsewhere to avail himself of assisted suicide. Before he had a chance to do that, he was admitted to an inpatient hospice unit where he weakened further. In the throes of what may have been delirium or a last effort to enact his wish of a hastened death, he attempted suicide on the hospice unit. He survived only to die days later from the cancer.
The authors reflect on the complexities of this case, including the distress of a clinician who may want to satisfy a veteran’s wish but cannot due to legal constraints, and the challenges of identifying pathologic suicidal ideation from an earnest and rational desire for a hastened death. How should they handle these conversations? They conclude by suggesting ways clinicians may assess and respond to requests for a hastened death, recognizing that assisted suicide remains illegal within the Veterans Health Administration (VHA).
Clinicians can return to the foundation of our profession to better consider these questions. The case report authors acknowledge this but avoid learning from what the conflict might teach us: “The inability to help veterans achieve their care preferences [to receive a hastened death] conflicts with the core mission of palliative care to reduce suffering and respect end-of-life wishes.” Before feeling like they have failed the veteran, a clinician must ask if it is really within their scope of practice to end someone’s life. While it is true that “the mission of VHA’s [Palliative and Hospice Care] program is to honor veterans’ preferences for care,” this mission exists within a greater context of appreciating that not all preferences can or should be honored.3 An obvious example is when a veteran requests an intervention that is not clinically indicated (eg, antibiotics for a viral infection). Clinicians are not bound to honor this preference; not because there is a law directing the clinicians’ decision making (there is not) but because there is a standard of care that accounts for but can supersede the veteran’s preference.
Is assisted suicide ever clinically indicated? While the answer shifts depending on the jurisdiction, the case report authors acknowledge why the preference for assisted suicide cannot be honored in a VHA facility: it is against the law.4 However, as they explain, this is insufficient to assuage the moral distress that might arise for some clinicians who want to fulfill a veteran’s request. They recommend several different strategies for clinicians to consider when receiving a request for assisted suicide. Distress in the form of cognitive dissonance may also arise from the tension that exists between stopping some forms of suicide while assisting in others.
While it is important to assess whether the request for a hastened death is driven by an untreated symptom or mental illness, this will only get a clinician so far when the request is made in earnest with no remediable drivers. While I cannot argue the point here, I accept that there are forms of suicide which are rational. However, that alone is insufficient to justify the act or assist someone with it; we must assess the good that the rational choice seeks to realize.5 If suicide can be rational, clinicians should ask whether it is within the goals of medicine to assist in suicide. The authors seem to take it for granted that the distressed clinician in the case hopes to hasten this veteran’s death or at least refer him to someone who could. Perhaps his suicide attempt on the hospice unit was, in part, a consequence of being incapable of offering such assistance. These presuppositions should be considered explicitly to better align one’s practice both with the mission of VHA and with the goals of medicine.
One way to do this is to consider whether we can cast assisted suicide as a medical therapy. Sulmasy proposes the provisional “canons of therapy” which might guide clinicians in assessing medical therapies.6 This article distinguishes 3 types of clinically and ethically distinct practices. I have split his first canon (proportionality) into 2 for the sake of clarity.
Priority: Do the benefits outweigh the burdens of the intervention?
The challenge of assessing priority when considering assisted suicide is that we cannot explain any benefits or burdens that might accrue after death; it is beyond our knowledge and informed consent is impossible. While there is always some uncertainty in discerning the benefits and burdens of an intervention, death presents an insurmountable procedural problem for informed consent to assisted suicide.
Fit: Are the means appropriate for the outcome of interest?
The outcomes of interest when considering assisted suicide are many—many—they range from symptom relief or avoidance to reclaiming dignity. In the case described by Ruskin et al, the interdisciplinary team offered the veteran a number of interventions to assuage his symptoms. Dignity therapy may have been employed as a meaningful, useful way of bringing closure to a life.7,8 Ultimately, however, some distress, particularly existential distress, may be intractable and clinicians must commit, as they did in this case, to doing what they can to remedy other symptoms and not abandon the veteran. Suicide is a tempting option because it may eliminate some of these concerns, but one must first grapple with the ethical question of whether suicide is ever an appropriate way to pursue any of these outcomes. Addressing that question is beyond the scope of this commentary, but both clinicians and patients should consider whether and why suicide should be considered appropriate and whether it is appropriate for the medical profession to assist with it.
Parsimony: Is this the least invasive, least burdensome intervention available?
In US jurisdictions where it is legal, assisted suicide is considered an intervention of last resort. Assisted suicide seems to be neither invasive (it involves taking medications) nor burdensome: the medications usually work quickly and without adverse effects, although there are risks (eg, vomiting). Broadening our view beyond the individual reveals something different.
In a cultural sense, assisted suicide is invasive. It changes how clinicians and patients consider health and medical care. We no longer have the profession of medicine with another intervention in the toolbox; we have a totally different profession which now intends death instead of health for its patients. It changes medicine and society at large profoundly. This makes it culturally invasive.
Furthermore, although the veteran in the case recurrently grappled with the choice of suicide, most people do not. They live by default. Offering assisted suicide, even in broad, general terms, may still leave them deciding to live, but the offer has also taken from them the possibility of living by default. They must justify their choice if only to themselves, considering the reasons they continue to pursue life-prolonging treatment and incur financial, emotional, and physical costs for their family. This is a dangerous cultural burden ironically imposed by the offer of more choices.9 Clinicians, by offering assisted suicide even if a patient declines it, also affirm the reasonableness of ending one’s life given the circumstances. That affirmation may be burdensome (eg, “They see my life as not worth living”) rather than validating.10
Restoration: Will this intervention help to restore the patient overall (even if not immediately)?
It would seem restoration is impossible for someone who is dying. Dying is terrible and so one possibility would be to hasten the process with assisted suicide. If health is in view, though, clinicians could recognize that restoration is always possible as long as someone is alive.
For someone dying, restoration may look like symptom relief (restoring bodily distress) which in turn may restore one’s capacity to sleep or to converse with loved ones. Assisted suicide does not fit in this paradigm. Is it intended to help patients sustain and restore their health, whatever amount they have (this is what the hospice and psychiatric services attempted to do in the case). Or is it intended to help patients pursue whatever goals seem good to the patient even those goals which conflict with health? Happily, most patients want their health sustained or restored so there is usually no conflict. As medical technology advances, though, conflicts arise: Should a clinician prescribe stimulants to enhance a healthy student’s wakefulness during final exams? Should a clinician engineer embryos to provide parents with a particular kind of child? Should a clinician end a patient’s life? Assisted suicide is obviously not aimed at restoration. It is a concession to the intractability of one’s disease and disability and one’s impending death. Without clarity and agreement on the goal of medicine, the default provision of care centers instead on satisfying patient preferences whatever they are.
Holism: Does the intervention prioritize the whole patient (vs prioritizing a part for the sake of the whole)?
Clinicians offering assisted suicide suggest that providing a death on a patient’s own terms restores autonomy and brings coherence to a life narrative that, at its end, is fraught with tragedy. This is what it looks like to honor “the whole patient.” A clinician must scrutinize that judgment to determine whether the patient meets statutory criteria for assisted suicide. The impulse underlying the moral distress described by Ruskin et al and many other clinicians is that a patient’s judgment, once determined to be sound, should trump a clinician’s judgment about what is best for the patient’s health and whether there are limits on what the clinician can do to satisfy a patient’s preferences. Ironically, assisted suicide prioritizes a patient’s judgment about how their life should end above other considerations, namely, that medicine has traditionally sought the patient’s good by sustaining and restoring their health, not by intending and causing their death. Notably, there was no lack of holism in the care provided the veteran in the case both before and after his suicide attempt.
Discretion: What are the limits of the intervention itself? What is the scope of medicine in general? What is the limit of one’s own individual knowledge and skill?
Assisted suicide has a substantial limit: it does not offer relief from suffering because there will be no one left alive to experience relief. Assisted suicide cannot achieve anything for the patient because they are dead by the time they fully receive what has been given. This profound limit makes assisted suicide unlike anything else offered in medicine and should give clinicians pause before adopting it, prompting them to grapple with whether causing a patient’s death is within the scope of medicine. If so, how did this come to be after thousands of years to the contrary across cultures and traditions, and what justifies this change? Finally, clinicians must contend with the limits of informed consent.
This brief reflection on how clinicians should consider medical therapies brings us back to MacIntyre’s exhortation: We cannot decide what to do until we have discerned the story to which we belong. One way of telling the story of medicine is to tell it with the techniques front and center: we prescribe, we operate, we irradiate, make the numbers go in the right direction, cure infections, and shrink masses. We can also tell that story by rejoicing that technology is giving us increasing control over our bodies and we can put that power to whatever use we desire. Often that will align with health, but it may not and that is for many patients increasingly acceptable. There is another, better story to tell: the profession of medicine exists to help people sustain and restore health, whatever bit of it they have and even as they lay dying. All those things just listed may help clinicians in that pursuit or they may not, given the specific context.
Ruskin et al tell a story of clinicians living in the tension of wanting to satisfy the desires their patients bring to them but must settle for the best that medicine can provide. Medical intervention as preference satisfaction is a story we have been living and practicing for 50 years since Beauchamp and Childress described the 4-principle framework for biomedical ethics: respect for autonomy, justice, nonmaleficence, beneficence.
Medicine-as-preference-satisfaction conflicts with the VHA mission to “honor America’s veterans by providing exceptional health care that improves their health and well-being.” VHA does not owe veterans whatever they request. VHA owes them exceptional health care. When a patient comes to a clinician, a clinician owes them a bounded set of things in service to their health. The dissonance a clinician might experience in trying to discern whether a patient’s death can serve that patient’s own health should signal a need to step back and reflect on how they understand the foundations of medical practice.
I do not disagree with the authors in their general approach to how clinicians might discuss this with patients who request a hastened death. I also seek to assuage symptoms, validate emotions, and remain steadfast through someone’s dying. I also affirm my commitment as a physician to care for a person’s health which, while someone is dying, usually entails managing symptoms. It never entails ending someone’s life. The clinicians in the case did an excellent job caring for this veteran and could not have done better by helping him end his life.
- MacIntyre A. After Virtue: A Study in Moral Theory. 3rd ed. 2007.
- Ruskin A, Bauer M, Alrojolah L. Managing requests for medical aid in dying within the US Department of Veterans Affairs Health Care System. Fed Pract. 2026;43:238-242. doi:10.12788/fp.0739
- VHA Directive 1139: Palliative care consult teams and Veterans Integrated Service Network Leads. September 9, 2022. https://www.va.gov/vhapublications/ViewPublication.asp?pub_ID=9930
- Assisted Suicide Funding Restriction Act of 1997. 42 USC § 14401.
- Safranek JP. Autonomy and assisted suicide the execution of freedom. Hastings Cent Rep. 1998;28:32-36. doi:10.2307/3528611
- Sulmasy DP. The last low whispers of our dead: when is it ethically justifiable to render a patient unconscious until death? Theor Med Bioeth. 2018;39:233-263. doi:10.1007/s11017-018-9459-7
- Chochinov HM. Dying, Dignity, and new horizons in palliative end-of-life care. CA Cancer J Clin. 2006;56:84-103. doi:10.3322/canjclin.56.2.84
- Chochinov HM. Intensive caring: reminding families they matter. J Palliat Med. 2024;27:152-155.
- Velleman JD. Against the right to die. J Med Philos. 1992;17:665-681.
- Peace WJ. Comfort Care as Denial of Personhood. Hastings Cent Rep. 2012;42:14-17. doi:10.1002/hast.38
When contemplating the state of ethical dialogue in our modern world, the philosopher Alasdair MacIntyre had this to say: “I can only answer the question, ‘What am I to do?’ If I can answer the prior question ‘Of what story or stories do I find myself a part?’”1 That is, our ethics must proceed from our understanding of ourselves, others, and the world. David Hume might scoff, but we do need an “is” to appreciate and grasp our “ought.” This is just as true for medical ethics as it is for the rest of life. Questions about what we should do in medicine should draw us to deeper questions about identity and purpose.
In this issue, Ruskin et al present a tragic case of a man who spent his later years walking the line between life and a self-chosen death.2 After enduring the chronic decline of Parkinson disease, he faced a final diagnosis of glioblastoma. The patient enrolled in hospice while considering how he might move elsewhere to avail himself of assisted suicide. Before he had a chance to do that, he was admitted to an inpatient hospice unit where he weakened further. In the throes of what may have been delirium or a last effort to enact his wish of a hastened death, he attempted suicide on the hospice unit. He survived only to die days later from the cancer.
The authors reflect on the complexities of this case, including the distress of a clinician who may want to satisfy a veteran’s wish but cannot due to legal constraints, and the challenges of identifying pathologic suicidal ideation from an earnest and rational desire for a hastened death. How should they handle these conversations? They conclude by suggesting ways clinicians may assess and respond to requests for a hastened death, recognizing that assisted suicide remains illegal within the Veterans Health Administration (VHA).
Clinicians can return to the foundation of our profession to better consider these questions. The case report authors acknowledge this but avoid learning from what the conflict might teach us: “The inability to help veterans achieve their care preferences [to receive a hastened death] conflicts with the core mission of palliative care to reduce suffering and respect end-of-life wishes.” Before feeling like they have failed the veteran, a clinician must ask if it is really within their scope of practice to end someone’s life. While it is true that “the mission of VHA’s [Palliative and Hospice Care] program is to honor veterans’ preferences for care,” this mission exists within a greater context of appreciating that not all preferences can or should be honored.3 An obvious example is when a veteran requests an intervention that is not clinically indicated (eg, antibiotics for a viral infection). Clinicians are not bound to honor this preference; not because there is a law directing the clinicians’ decision making (there is not) but because there is a standard of care that accounts for but can supersede the veteran’s preference.
Is assisted suicide ever clinically indicated? While the answer shifts depending on the jurisdiction, the case report authors acknowledge why the preference for assisted suicide cannot be honored in a VHA facility: it is against the law.4 However, as they explain, this is insufficient to assuage the moral distress that might arise for some clinicians who want to fulfill a veteran’s request. They recommend several different strategies for clinicians to consider when receiving a request for assisted suicide. Distress in the form of cognitive dissonance may also arise from the tension that exists between stopping some forms of suicide while assisting in others.
While it is important to assess whether the request for a hastened death is driven by an untreated symptom or mental illness, this will only get a clinician so far when the request is made in earnest with no remediable drivers. While I cannot argue the point here, I accept that there are forms of suicide which are rational. However, that alone is insufficient to justify the act or assist someone with it; we must assess the good that the rational choice seeks to realize.5 If suicide can be rational, clinicians should ask whether it is within the goals of medicine to assist in suicide. The authors seem to take it for granted that the distressed clinician in the case hopes to hasten this veteran’s death or at least refer him to someone who could. Perhaps his suicide attempt on the hospice unit was, in part, a consequence of being incapable of offering such assistance. These presuppositions should be considered explicitly to better align one’s practice both with the mission of VHA and with the goals of medicine.
One way to do this is to consider whether we can cast assisted suicide as a medical therapy. Sulmasy proposes the provisional “canons of therapy” which might guide clinicians in assessing medical therapies.6 This article distinguishes 3 types of clinically and ethically distinct practices. I have split his first canon (proportionality) into 2 for the sake of clarity.
Priority: Do the benefits outweigh the burdens of the intervention?
The challenge of assessing priority when considering assisted suicide is that we cannot explain any benefits or burdens that might accrue after death; it is beyond our knowledge and informed consent is impossible. While there is always some uncertainty in discerning the benefits and burdens of an intervention, death presents an insurmountable procedural problem for informed consent to assisted suicide.
Fit: Are the means appropriate for the outcome of interest?
The outcomes of interest when considering assisted suicide are many—many—they range from symptom relief or avoidance to reclaiming dignity. In the case described by Ruskin et al, the interdisciplinary team offered the veteran a number of interventions to assuage his symptoms. Dignity therapy may have been employed as a meaningful, useful way of bringing closure to a life.7,8 Ultimately, however, some distress, particularly existential distress, may be intractable and clinicians must commit, as they did in this case, to doing what they can to remedy other symptoms and not abandon the veteran. Suicide is a tempting option because it may eliminate some of these concerns, but one must first grapple with the ethical question of whether suicide is ever an appropriate way to pursue any of these outcomes. Addressing that question is beyond the scope of this commentary, but both clinicians and patients should consider whether and why suicide should be considered appropriate and whether it is appropriate for the medical profession to assist with it.
Parsimony: Is this the least invasive, least burdensome intervention available?
In US jurisdictions where it is legal, assisted suicide is considered an intervention of last resort. Assisted suicide seems to be neither invasive (it involves taking medications) nor burdensome: the medications usually work quickly and without adverse effects, although there are risks (eg, vomiting). Broadening our view beyond the individual reveals something different.
In a cultural sense, assisted suicide is invasive. It changes how clinicians and patients consider health and medical care. We no longer have the profession of medicine with another intervention in the toolbox; we have a totally different profession which now intends death instead of health for its patients. It changes medicine and society at large profoundly. This makes it culturally invasive.
Furthermore, although the veteran in the case recurrently grappled with the choice of suicide, most people do not. They live by default. Offering assisted suicide, even in broad, general terms, may still leave them deciding to live, but the offer has also taken from them the possibility of living by default. They must justify their choice if only to themselves, considering the reasons they continue to pursue life-prolonging treatment and incur financial, emotional, and physical costs for their family. This is a dangerous cultural burden ironically imposed by the offer of more choices.9 Clinicians, by offering assisted suicide even if a patient declines it, also affirm the reasonableness of ending one’s life given the circumstances. That affirmation may be burdensome (eg, “They see my life as not worth living”) rather than validating.10
Restoration: Will this intervention help to restore the patient overall (even if not immediately)?
It would seem restoration is impossible for someone who is dying. Dying is terrible and so one possibility would be to hasten the process with assisted suicide. If health is in view, though, clinicians could recognize that restoration is always possible as long as someone is alive.
For someone dying, restoration may look like symptom relief (restoring bodily distress) which in turn may restore one’s capacity to sleep or to converse with loved ones. Assisted suicide does not fit in this paradigm. Is it intended to help patients sustain and restore their health, whatever amount they have (this is what the hospice and psychiatric services attempted to do in the case). Or is it intended to help patients pursue whatever goals seem good to the patient even those goals which conflict with health? Happily, most patients want their health sustained or restored so there is usually no conflict. As medical technology advances, though, conflicts arise: Should a clinician prescribe stimulants to enhance a healthy student’s wakefulness during final exams? Should a clinician engineer embryos to provide parents with a particular kind of child? Should a clinician end a patient’s life? Assisted suicide is obviously not aimed at restoration. It is a concession to the intractability of one’s disease and disability and one’s impending death. Without clarity and agreement on the goal of medicine, the default provision of care centers instead on satisfying patient preferences whatever they are.
Holism: Does the intervention prioritize the whole patient (vs prioritizing a part for the sake of the whole)?
Clinicians offering assisted suicide suggest that providing a death on a patient’s own terms restores autonomy and brings coherence to a life narrative that, at its end, is fraught with tragedy. This is what it looks like to honor “the whole patient.” A clinician must scrutinize that judgment to determine whether the patient meets statutory criteria for assisted suicide. The impulse underlying the moral distress described by Ruskin et al and many other clinicians is that a patient’s judgment, once determined to be sound, should trump a clinician’s judgment about what is best for the patient’s health and whether there are limits on what the clinician can do to satisfy a patient’s preferences. Ironically, assisted suicide prioritizes a patient’s judgment about how their life should end above other considerations, namely, that medicine has traditionally sought the patient’s good by sustaining and restoring their health, not by intending and causing their death. Notably, there was no lack of holism in the care provided the veteran in the case both before and after his suicide attempt.
Discretion: What are the limits of the intervention itself? What is the scope of medicine in general? What is the limit of one’s own individual knowledge and skill?
Assisted suicide has a substantial limit: it does not offer relief from suffering because there will be no one left alive to experience relief. Assisted suicide cannot achieve anything for the patient because they are dead by the time they fully receive what has been given. This profound limit makes assisted suicide unlike anything else offered in medicine and should give clinicians pause before adopting it, prompting them to grapple with whether causing a patient’s death is within the scope of medicine. If so, how did this come to be after thousands of years to the contrary across cultures and traditions, and what justifies this change? Finally, clinicians must contend with the limits of informed consent.
This brief reflection on how clinicians should consider medical therapies brings us back to MacIntyre’s exhortation: We cannot decide what to do until we have discerned the story to which we belong. One way of telling the story of medicine is to tell it with the techniques front and center: we prescribe, we operate, we irradiate, make the numbers go in the right direction, cure infections, and shrink masses. We can also tell that story by rejoicing that technology is giving us increasing control over our bodies and we can put that power to whatever use we desire. Often that will align with health, but it may not and that is for many patients increasingly acceptable. There is another, better story to tell: the profession of medicine exists to help people sustain and restore health, whatever bit of it they have and even as they lay dying. All those things just listed may help clinicians in that pursuit or they may not, given the specific context.
Ruskin et al tell a story of clinicians living in the tension of wanting to satisfy the desires their patients bring to them but must settle for the best that medicine can provide. Medical intervention as preference satisfaction is a story we have been living and practicing for 50 years since Beauchamp and Childress described the 4-principle framework for biomedical ethics: respect for autonomy, justice, nonmaleficence, beneficence.
Medicine-as-preference-satisfaction conflicts with the VHA mission to “honor America’s veterans by providing exceptional health care that improves their health and well-being.” VHA does not owe veterans whatever they request. VHA owes them exceptional health care. When a patient comes to a clinician, a clinician owes them a bounded set of things in service to their health. The dissonance a clinician might experience in trying to discern whether a patient’s death can serve that patient’s own health should signal a need to step back and reflect on how they understand the foundations of medical practice.
I do not disagree with the authors in their general approach to how clinicians might discuss this with patients who request a hastened death. I also seek to assuage symptoms, validate emotions, and remain steadfast through someone’s dying. I also affirm my commitment as a physician to care for a person’s health which, while someone is dying, usually entails managing symptoms. It never entails ending someone’s life. The clinicians in the case did an excellent job caring for this veteran and could not have done better by helping him end his life.
- MacIntyre A. After Virtue: A Study in Moral Theory. 3rd ed. 2007.
- Ruskin A, Bauer M, Alrojolah L. Managing requests for medical aid in dying within the US Department of Veterans Affairs Health Care System. Fed Pract. 2026;43:238-242. doi:10.12788/fp.0739
- VHA Directive 1139: Palliative care consult teams and Veterans Integrated Service Network Leads. September 9, 2022. https://www.va.gov/vhapublications/ViewPublication.asp?pub_ID=9930
- Assisted Suicide Funding Restriction Act of 1997. 42 USC § 14401.
- Safranek JP. Autonomy and assisted suicide the execution of freedom. Hastings Cent Rep. 1998;28:32-36. doi:10.2307/3528611
- Sulmasy DP. The last low whispers of our dead: when is it ethically justifiable to render a patient unconscious until death? Theor Med Bioeth. 2018;39:233-263. doi:10.1007/s11017-018-9459-7
- Chochinov HM. Dying, Dignity, and new horizons in palliative end-of-life care. CA Cancer J Clin. 2006;56:84-103. doi:10.3322/canjclin.56.2.84
- Chochinov HM. Intensive caring: reminding families they matter. J Palliat Med. 2024;27:152-155.
- Velleman JD. Against the right to die. J Med Philos. 1992;17:665-681.
- Peace WJ. Comfort Care as Denial of Personhood. Hastings Cent Rep. 2012;42:14-17. doi:10.1002/hast.38
What They Want and What They Need: The End-of-Life Conflict
What They Want and What They Need: The End-of-Life Conflict
Impact of a Pharmacist ICS Deprescribing Intervention on COPD Exacerbations and Adverse Events
Impact of a Pharmacist ICS Deprescribing Intervention on COPD Exacerbations and Adverse Events
Chronic obstructive pulmonary disease (COPD) affects about 25% of the veteran population and is the third-leading cause of death globally.1,2 In patients with COPD, cigarette smoking leads to increased respiratory symptoms, a greater annual rate of decline in forced expiratory volume in 1 second (FEV1), and an increase in COPD mortality rate vs nonsmokers.3 Veterans are at a higher risk of COPD due to increased prevalence of smoking within this population as well as military activities leading to environmental and occupational exposure.4
According to the 2024 Global Initiative for Chronic Obstructive Lung Disease (GOLD) guidelines, the primary treatment goals of COPD therapy are to reduce symptoms and future risk of exacerbations.3 Bronchodilators are recommended for initial COPD pharmacotherapy, including long-acting muscarinic antagonists (LAMAs) and/or long-acting Β2-agonists (LABAs). In some cases, treatment may include inhaled corticosteroids (ICS). Evidence supports ICS therapy in patients with COPD experiencing hospitalizations for exacerbations, ≥ 2 moderate exacerbations per year, blood eosinophil count ≥ 300 cells/μL or concomitant asthma.3
While the 2024 GOLD guidelines caution against the use of ICS outside of certain patient groups, previous GOLD guidelines recommended the use of ICS more broadly.5 Due to these changes, many patients may be using ICS therapy unnecessarily. At the Sioux Falls Veterans Affairs Health Care System (SFVAHCS), ICS overuse was identified as a driver of increased medication burden and potential adverse effects (AEs). To help reduce unnecessary ICS use, a data dashboard was created to identify potential candidates for ICS deprescribing. SFVAHCS clinical pharmacy practitioners are licensed pharmacists who work as independent practitioners with a scope of practice that allows them to initiate, modify, or discontinue medication therapy within medication management clinics. Pharmacists contacted dashboard patients to de-escalate ICS therapy when appropriate.
The SUNSET trial directly compared the continuation of triple therapy (tiotropium + salmeterol/fluticasone propionate) vs deprescribing to LABA/LAMA (indacaterol/ glycopyrronium) in patients with COPD.6 It evaluated whether LABA/LAMA was noninferior to LABA/LAMA/ICS therapy when comparing COPD exacerbations in patients whose COPD exacerbations were infrequent. Participants were randomized to triple therapy continuation or indacaterol/glycopyrronium and followed for 26 weeks. Patients on indacaterol/glycopyrronium did not have a significant difference in exacerbations than patients utilizing triple therapy.
The Implementation of a Targeted ICS De-Escalation in Patients with COPD in the Primary Care Setting trial evaluated the success of pharmacist-led ICS deprescribing in appropriate patients with COPD.7 Pharmacists followed GOLD guidelines to recommend ICS deprescribing and have risk vs benefit discussions with certain patients. Patients were considered for ICS deprescribing if they had a history of recurrent pneumonia or had no exacerbations within the previous year and eosinophils < 300 cells/μL (risk-benefit discussion if no eosinophil count available). This study found that 19.6% of patients were unable to tolerate ICS withdrawal and resumed either a standard or reduced dose of ICS therapy.7
Current guidelines and evidence recommend deprescribing ICS for appropriate patients. There is no current literature defining the impact of pharmacists on ICS deprescribing within the US Department of Veterans Affairs (VA) system. This study will allow for a quantifiable measure of pharmacists’ impact on reducing AEs associated with unnecessary ICS use.
Methods
This retrospective, single-center study was conducted at the SFVAHCS. Data were collected through manual chart review of SFVAHCS electronic health records. Veterans aged ≥ 18 years with a COPD diagnosis who underwent ICS deprescribing by a SFVAHCS pharmacist between February 2022 and December 2023 were included. Records were examined for 52 weeks prior to ICS withdrawal (baseline) and 52 weeks following withdrawal. Patients were excluded from the study if they had a history of asthma or ICS was used for < 52 weeks before deprescribing. Baseline characteristics were collected, including age, race, sex, current tobacco use, eosinophil count, COPD maintenance therapy, FEV1/forced vital capacity (FVC) ratio, and mean postbronchodilator FEV1 improvement.
The primary endpoint was number of COPD exacerbations at 52 weeks before vs after deprescribing. Secondary endpoints included the number of patients restarted on an ICS within 52 weeks of deprescribing, as well as ICS AEs, including pneumonia, oral candidiasis, and throat hoarseness.
Statistical Analysis
The primary endpoint was analyzed using the Wilcoxon signed rank test and secondary endpoints were analyzed using the McNemar exact test. Results with P < .05 were considered statistically significant for both tests.
Results
Seventy-six patients were included. Patients had a mean age of 75 years and 91% identified as White, which is representative of the SFVAHCS patient population (Table 1). Twenty-nine (38%) patients were current tobacco users and 55 patients (72%) used LAMA/LABA therapy (after ICS deprescribing) with an eosinophil count < 300 cells/μL. There was no significant difference in exacerbations before vs after ICS deprescribing (P = .78) (Table 2). There were 7 AEs reported before ICS deprescribing vs 0 following ICS deprescribing (P < .001). Five patients (7%) reported throat hoarseness, 1 (1%) reported pneumonia, and 1 (1%) reported oral candidiasis. Eighteen patients were reinitiated on ICS (24%). ICS reinitiation was most commonly due to patients reporting worsening symptoms (56%) (Table 3).
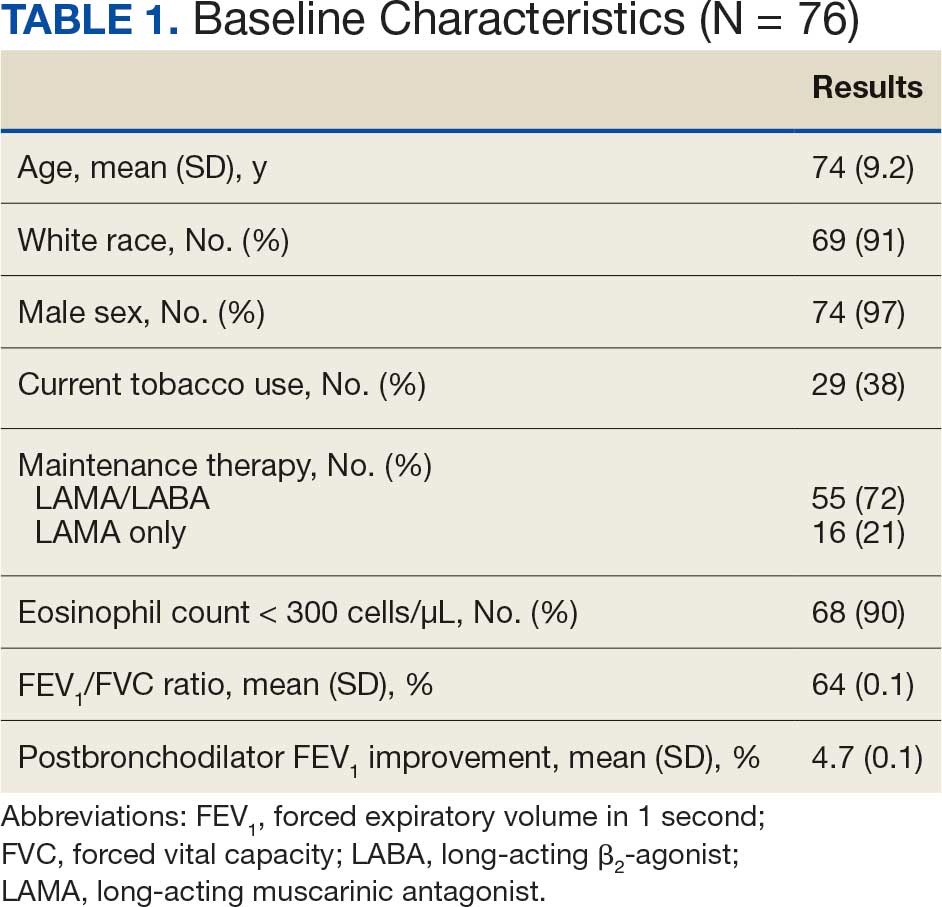
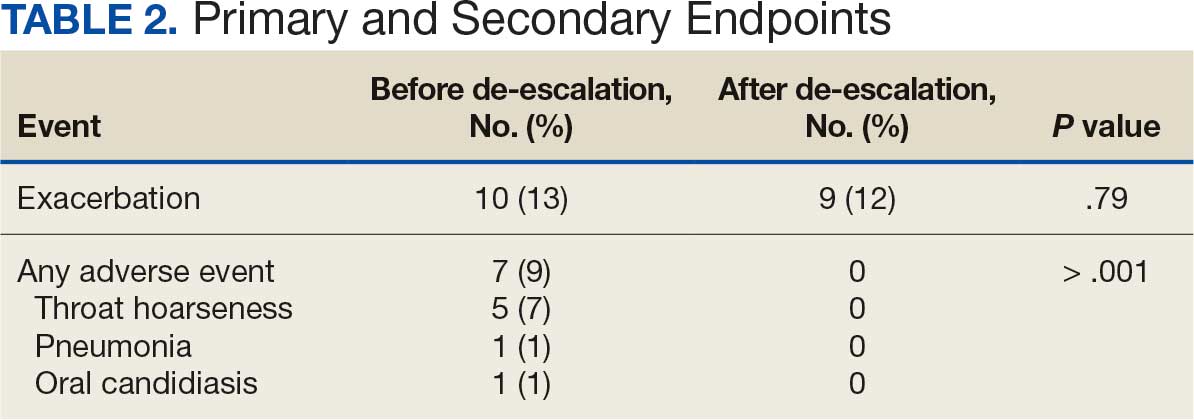
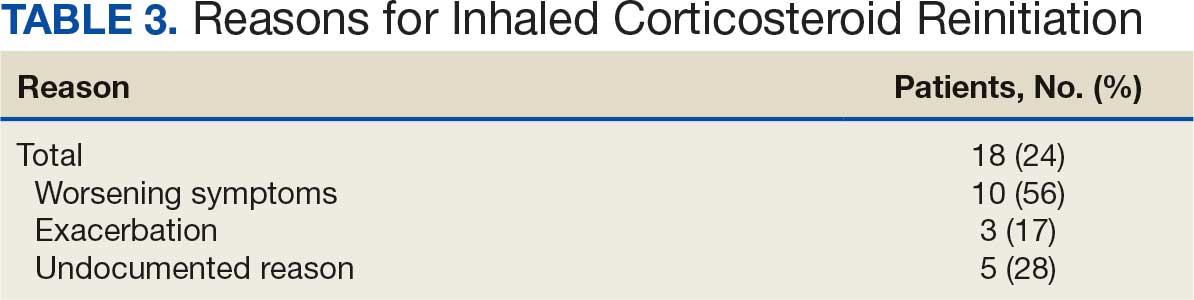
Discussion
This study sought to determine the impact of pharmacist-led ICS deprescribing on AEs and exacerbations experienced by patients with COPD. COPD exacerbations were not significantly different before vs after ICS deprescribing. The pharmacist-led ICS deprescribing program did not lead to increased COPD exacerbations. Similar to the SUNSET trial, the results of this study showed exacerbations did not significantly increase upon ICS deprescribing; however, this study differed by specifying pharmacist- led intervention.6
There was a decrease in ICS-related AEs following ICS deprescribing. Several patients were reinitiated on an ICS. As expected with deprescribing, some patients were not able to tolerate ICS withdrawal or had clinical indications to resume therapy (ie, an exacerbation). Similar results were found in another study where 8.9% of patients were restarted on ICS and 10.9% were de-escalated to a lower dose but were unable to stop completely.7 A 2024 systematic review by Georgiou et al found a wide range of patients resumed ICS therapy following withdrawal (21%-74%). Of note, only 2 of the randomized controlled trials and 3 observational studies included this meta-analysis included data on ICS reinitiation. Georgiou et al concluded there was insufficient evidence to determine the proportion of patients reinitiated on ICS but patients were commonly resumed on ICS therapy due to worsening symptoms, experiencing an exacerbation or decline in FEV1.8 Although the rate of ICS reinitiation was unclear in the Georgiou et al meta-analysis, reasons for re-initiation were similar to what was found in our study.8
Strengths and Limitations
The retrospective nature of this study and its small sample size of 76 patients limit its findings. The retrospective nature of the study required researchers to rely on proper chart documentation, which is not always accurate or up to date. Lack of documentation of COPD exacerbations or patients who received care outside the VA following initial deprescribing could have biased study results. This patient population is representative of the veteran population in South Dakota but is not representative of the female or non-White patient population which may be more prevalent at other VA Health Care Systems as well as nonveteran patient populations. Additionally, this study was limited to a review of 52 weeks pre- and post-ICS deprescribing which may have impacted results. Patients may have had a COPD exacerbation or were restarted on ICS therapy beyond 52 weeks. Finally, the retrospective nature and small sample size limited the findings for the primary endpoint which could have been improved with a larger sample size and a randomized controlled design.
The comparison of patients with themselves before and after ICS deprescribing reduced the potential for bias seen in retrospective studies. This method did not require a second control group which would potentially introduce confounding factors.
Conclusions
This study found that in a small population of veterans with COPD, pharmacist-led ICS deprescribing did not lead to an increase in COPD exacerbations and decreased the risk of AEs related to ICS therapy. Some patients were reinitiated on ICS therapy; however, reinitiation was rarely attributable to a COPD exacerbation. This study suggests that pharmacists were able to appropriately identify candidates for ICS deprescribing without increasing their risk of exacerbations. By de-escalating ICS therapy, pharmacists decreased medication burden and potential AEs caused by ICS therapy. These findings support expanding the role of clinical pharmacists in COPD management, particularly in identifying candidates for safe ICS deprescribing.
- Li HY, Gao TY, Fang W, et al. Global, regional and national burden of chronic obstructive pulmonary disease over a 30-year period: estimates from the 1990 to 2019 Global Burden of Disease Study. Respirology. 2023;28:29-36. doi:10.1111/resp.14349/
- Anderson E, Wiener RS, Resnick K, et al. Care coordination for veterans with COPD: a positive deviance study. Am J Manag Care. 2020;26:63-68. doi:10.37765/ajmc.2020.42394
- Global Initiative for Chronic Obstructive Lung Disease. 2024 GOLD Report. November 12, 2023. Accessed April 1, 2026. https://goldcopd.org/2023-gold-report-2/
- US Department of Veterans Affairs, Department of Defense. VA/DoD clinical practice guideline for the management of chronic obstructive pulmonary disease. April 2021. Accessed April 1, 2026. https://www.healthquality.va.gov /guidelines/cd/copd/
- Gruffydd-Jones K. GOLD guidelines 2011: what are the implications for primary care? Prim Care Respir J. 2012;21:437-441. doi:10.4104/pcrj.2012.00058
- Chapman KR, Hurst JR, Frent SM, et al. Long-term triple therapy de-escalation to indacaterol/glycopyrronium in patients with chronic obstructive pulmonary disease (SUNSET): a randomized, double-blind, triple-dummy clinical trial. Am J Respir Crit Care Med. 2018;198:329-339. doi:10.1164/rccm.201803-0405OC
- Hahn NM, Nagy MW. Implementation of a targeted inhaled corticosteroid de-escalation process in patients with chronic obstructive pulmonary disease in the primary care setting. Innov Pharm. 2022;13:10.24926/iip.v13i1.4349. doi:10.24926/iip.v13i1.4349
- Georgiou A, Ramesh R, Schofield P, et al. Withdrawal of inhaled corticosteroids from patients with COPD; effect on exacerbation frequency and lung function: a systematic review. Int J Chron Obstruct Pulmon Dis. 2024;19:1403- 1419. doi:10.2147/COPD.S436525
Chronic obstructive pulmonary disease (COPD) affects about 25% of the veteran population and is the third-leading cause of death globally.1,2 In patients with COPD, cigarette smoking leads to increased respiratory symptoms, a greater annual rate of decline in forced expiratory volume in 1 second (FEV1), and an increase in COPD mortality rate vs nonsmokers.3 Veterans are at a higher risk of COPD due to increased prevalence of smoking within this population as well as military activities leading to environmental and occupational exposure.4
According to the 2024 Global Initiative for Chronic Obstructive Lung Disease (GOLD) guidelines, the primary treatment goals of COPD therapy are to reduce symptoms and future risk of exacerbations.3 Bronchodilators are recommended for initial COPD pharmacotherapy, including long-acting muscarinic antagonists (LAMAs) and/or long-acting Β2-agonists (LABAs). In some cases, treatment may include inhaled corticosteroids (ICS). Evidence supports ICS therapy in patients with COPD experiencing hospitalizations for exacerbations, ≥ 2 moderate exacerbations per year, blood eosinophil count ≥ 300 cells/μL or concomitant asthma.3
While the 2024 GOLD guidelines caution against the use of ICS outside of certain patient groups, previous GOLD guidelines recommended the use of ICS more broadly.5 Due to these changes, many patients may be using ICS therapy unnecessarily. At the Sioux Falls Veterans Affairs Health Care System (SFVAHCS), ICS overuse was identified as a driver of increased medication burden and potential adverse effects (AEs). To help reduce unnecessary ICS use, a data dashboard was created to identify potential candidates for ICS deprescribing. SFVAHCS clinical pharmacy practitioners are licensed pharmacists who work as independent practitioners with a scope of practice that allows them to initiate, modify, or discontinue medication therapy within medication management clinics. Pharmacists contacted dashboard patients to de-escalate ICS therapy when appropriate.
The SUNSET trial directly compared the continuation of triple therapy (tiotropium + salmeterol/fluticasone propionate) vs deprescribing to LABA/LAMA (indacaterol/ glycopyrronium) in patients with COPD.6 It evaluated whether LABA/LAMA was noninferior to LABA/LAMA/ICS therapy when comparing COPD exacerbations in patients whose COPD exacerbations were infrequent. Participants were randomized to triple therapy continuation or indacaterol/glycopyrronium and followed for 26 weeks. Patients on indacaterol/glycopyrronium did not have a significant difference in exacerbations than patients utilizing triple therapy.
The Implementation of a Targeted ICS De-Escalation in Patients with COPD in the Primary Care Setting trial evaluated the success of pharmacist-led ICS deprescribing in appropriate patients with COPD.7 Pharmacists followed GOLD guidelines to recommend ICS deprescribing and have risk vs benefit discussions with certain patients. Patients were considered for ICS deprescribing if they had a history of recurrent pneumonia or had no exacerbations within the previous year and eosinophils < 300 cells/μL (risk-benefit discussion if no eosinophil count available). This study found that 19.6% of patients were unable to tolerate ICS withdrawal and resumed either a standard or reduced dose of ICS therapy.7
Current guidelines and evidence recommend deprescribing ICS for appropriate patients. There is no current literature defining the impact of pharmacists on ICS deprescribing within the US Department of Veterans Affairs (VA) system. This study will allow for a quantifiable measure of pharmacists’ impact on reducing AEs associated with unnecessary ICS use.
Methods
This retrospective, single-center study was conducted at the SFVAHCS. Data were collected through manual chart review of SFVAHCS electronic health records. Veterans aged ≥ 18 years with a COPD diagnosis who underwent ICS deprescribing by a SFVAHCS pharmacist between February 2022 and December 2023 were included. Records were examined for 52 weeks prior to ICS withdrawal (baseline) and 52 weeks following withdrawal. Patients were excluded from the study if they had a history of asthma or ICS was used for < 52 weeks before deprescribing. Baseline characteristics were collected, including age, race, sex, current tobacco use, eosinophil count, COPD maintenance therapy, FEV1/forced vital capacity (FVC) ratio, and mean postbronchodilator FEV1 improvement.
The primary endpoint was number of COPD exacerbations at 52 weeks before vs after deprescribing. Secondary endpoints included the number of patients restarted on an ICS within 52 weeks of deprescribing, as well as ICS AEs, including pneumonia, oral candidiasis, and throat hoarseness.
Statistical Analysis
The primary endpoint was analyzed using the Wilcoxon signed rank test and secondary endpoints were analyzed using the McNemar exact test. Results with P < .05 were considered statistically significant for both tests.
Results
Seventy-six patients were included. Patients had a mean age of 75 years and 91% identified as White, which is representative of the SFVAHCS patient population (Table 1). Twenty-nine (38%) patients were current tobacco users and 55 patients (72%) used LAMA/LABA therapy (after ICS deprescribing) with an eosinophil count < 300 cells/μL. There was no significant difference in exacerbations before vs after ICS deprescribing (P = .78) (Table 2). There were 7 AEs reported before ICS deprescribing vs 0 following ICS deprescribing (P < .001). Five patients (7%) reported throat hoarseness, 1 (1%) reported pneumonia, and 1 (1%) reported oral candidiasis. Eighteen patients were reinitiated on ICS (24%). ICS reinitiation was most commonly due to patients reporting worsening symptoms (56%) (Table 3).
Discussion
This study sought to determine the impact of pharmacist-led ICS deprescribing on AEs and exacerbations experienced by patients with COPD. COPD exacerbations were not significantly different before vs after ICS deprescribing. The pharmacist-led ICS deprescribing program did not lead to increased COPD exacerbations. Similar to the SUNSET trial, the results of this study showed exacerbations did not significantly increase upon ICS deprescribing; however, this study differed by specifying pharmacist- led intervention.6
There was a decrease in ICS-related AEs following ICS deprescribing. Several patients were reinitiated on an ICS. As expected with deprescribing, some patients were not able to tolerate ICS withdrawal or had clinical indications to resume therapy (ie, an exacerbation). Similar results were found in another study where 8.9% of patients were restarted on ICS and 10.9% were de-escalated to a lower dose but were unable to stop completely.7 A 2024 systematic review by Georgiou et al found a wide range of patients resumed ICS therapy following withdrawal (21%-74%). Of note, only 2 of the randomized controlled trials and 3 observational studies included this meta-analysis included data on ICS reinitiation. Georgiou et al concluded there was insufficient evidence to determine the proportion of patients reinitiated on ICS but patients were commonly resumed on ICS therapy due to worsening symptoms, experiencing an exacerbation or decline in FEV1.8 Although the rate of ICS reinitiation was unclear in the Georgiou et al meta-analysis, reasons for re-initiation were similar to what was found in our study.8
Strengths and Limitations
The retrospective nature of this study and its small sample size of 76 patients limit its findings. The retrospective nature of the study required researchers to rely on proper chart documentation, which is not always accurate or up to date. Lack of documentation of COPD exacerbations or patients who received care outside the VA following initial deprescribing could have biased study results. This patient population is representative of the veteran population in South Dakota but is not representative of the female or non-White patient population which may be more prevalent at other VA Health Care Systems as well as nonveteran patient populations. Additionally, this study was limited to a review of 52 weeks pre- and post-ICS deprescribing which may have impacted results. Patients may have had a COPD exacerbation or were restarted on ICS therapy beyond 52 weeks. Finally, the retrospective nature and small sample size limited the findings for the primary endpoint which could have been improved with a larger sample size and a randomized controlled design.
The comparison of patients with themselves before and after ICS deprescribing reduced the potential for bias seen in retrospective studies. This method did not require a second control group which would potentially introduce confounding factors.
Conclusions
This study found that in a small population of veterans with COPD, pharmacist-led ICS deprescribing did not lead to an increase in COPD exacerbations and decreased the risk of AEs related to ICS therapy. Some patients were reinitiated on ICS therapy; however, reinitiation was rarely attributable to a COPD exacerbation. This study suggests that pharmacists were able to appropriately identify candidates for ICS deprescribing without increasing their risk of exacerbations. By de-escalating ICS therapy, pharmacists decreased medication burden and potential AEs caused by ICS therapy. These findings support expanding the role of clinical pharmacists in COPD management, particularly in identifying candidates for safe ICS deprescribing.
- Li HY, Gao TY, Fang W, et al. Global, regional and national burden of chronic obstructive pulmonary disease over a 30-year period: estimates from the 1990 to 2019 Global Burden of Disease Study. Respirology. 2023;28:29-36. doi:10.1111/resp.14349/
- Anderson E, Wiener RS, Resnick K, et al. Care coordination for veterans with COPD: a positive deviance study. Am J Manag Care. 2020;26:63-68. doi:10.37765/ajmc.2020.42394
- Global Initiative for Chronic Obstructive Lung Disease. 2024 GOLD Report. November 12, 2023. Accessed April 1, 2026. https://goldcopd.org/2023-gold-report-2/
- US Department of Veterans Affairs, Department of Defense. VA/DoD clinical practice guideline for the management of chronic obstructive pulmonary disease. April 2021. Accessed April 1, 2026. https://www.healthquality.va.gov /guidelines/cd/copd/
- Gruffydd-Jones K. GOLD guidelines 2011: what are the implications for primary care? Prim Care Respir J. 2012;21:437-441. doi:10.4104/pcrj.2012.00058
- Chapman KR, Hurst JR, Frent SM, et al. Long-term triple therapy de-escalation to indacaterol/glycopyrronium in patients with chronic obstructive pulmonary disease (SUNSET): a randomized, double-blind, triple-dummy clinical trial. Am J Respir Crit Care Med. 2018;198:329-339. doi:10.1164/rccm.201803-0405OC
- Hahn NM, Nagy MW. Implementation of a targeted inhaled corticosteroid de-escalation process in patients with chronic obstructive pulmonary disease in the primary care setting. Innov Pharm. 2022;13:10.24926/iip.v13i1.4349. doi:10.24926/iip.v13i1.4349
- Georgiou A, Ramesh R, Schofield P, et al. Withdrawal of inhaled corticosteroids from patients with COPD; effect on exacerbation frequency and lung function: a systematic review. Int J Chron Obstruct Pulmon Dis. 2024;19:1403- 1419. doi:10.2147/COPD.S436525
Impact of a Pharmacist ICS Deprescribing Intervention on COPD Exacerbations and Adverse Events
Impact of a Pharmacist ICS Deprescribing Intervention on COPD Exacerbations and Adverse Events
Pembrolizumab-Induced Bullous Pemphigoid: Navigating Diagnostic Challenges and Treatment Resistance
Pembrolizumab-Induced Bullous Pemphigoid: Navigating Diagnostic Challenges and Treatment Resistance
Bullous pemphigoid (BP) is an autoimmune blistering disorder characterized by the development of tense subepidermal blisters and erosions primarily on the skin, commonly affecting the elderly.1 It is attributed to autoantibodies targeting 2 hemidesmosomal components within the dermoepidermal junction—transmembrane collagen XVII (BP180/BPAG2) and plakin family protein BP230 (BPAG1)—resulting in blister formation due to loss of structural integrity.2 Typically, patients present with pruritic urticarial plaques and tense bullae localized on flexural areas, but cutaneous manifestations vary and can be nonspecific. Histologically, a subepidermal blister with eosinophilic infiltration is characteristic, and detection of circulating autoantibodies against BP180 and BP230 antigens aids in diagnosis.3,4
Drug-induced BP (DIBP) is a subset triggered by medications, including immune checkpoint inhibitors (ICIs) targeting programmed cell death protein-1 (PD-1) or its ligand, programmed death ligand-1 (PD-L1).5,6 Often overexpressed in malignant tumors, PD-L1 inhibits host lymphocytic and apoptotic immune responses. Anti‒PD-1 and anti‒PD-L1 agents, designed to enhance the immune system’s ability to recognize and eliminate cancer cells,7,8 have improved oncologic outcomes for various cancers, including urothelial cancer.9-11 Before 2016, platinum-based chemotherapy was the mainstay for metastatic urothelial cancer management, but US Food and Drug Administration approval of 5 ICIs—nivolumab, pembrolizumab, avelumab, atezolizumab, and durvalumab—transformed treatment options.12Despite robust antitumor responses to ICIs, these medications are increasingly associated with immune-related adverse events (IRAEs), including DIBP, due to inhibition of negative regulators of immunity crucial for maintaining immunologic homeostasis.13,14 Up to 30% to 40% of patients treated with PD-1 inhibitors experience dermatologic complications, such as lichenoid reactions, eczema, vitiligo, and pruritus,15 and patients undergoing treatment with the PD-1 inhibitor pembrolizumab are estimated to be 2.6 times more likely to develop a rash than those receiving standard chemotherapy.16,17 The pathogenesis of DIBP involves autoreactive T-cell activation and subsequent autoantibody production against BP antigens.18 We present the case of DIBP secondary to pembrolizumab immunotherapy in a man with PD-L1–negative metastatic bladder cancer.
Case Report
An 81-year-old man with metastatic urothelial carcinoma presented to dermatology with a pruritic rash characterized by blisters of 5 months’ duration following treatment with pembrolizumab. He had a history of non–muscle invasive urothelial carcinoma and underwent intravesical bacillus Calmette-Guerin treatment. Thirty years later, after surveillance cystoscopies, the patient developed hematuria, which prompted pelvic ultrasonography and cystoscopy that revealed a tumor. Transurethral resection of the bladder tumor confirmed invasive, high-grade papillary urothelial carcinoma with vascular and muscle invasion (clinical stage T2NxMx). Due to elevated creatinine levels, neoadjuvant chemotherapy was contraindicated. Instead, the patient underwent cystoprostatectomy with ureteroileal conduit creation and pelvic lymphadenectomy one month later; final pathology revealed pT2aN0M0 disease with multifocal carcinoma in situ. At that time, there was no evidence of distant metastasis. Surveillance 5 months later identified pulmonary nodules that were confirmed as metastatic urothelial cancer by positron emission tomography/computed tomography (CT). The patient received 6 cycles of paclitaxel (175 mg/m² on day 1) and gemcitabine (1000 mg/m² on days 1 and 8 every 21 days), with progressive disease 16 months later. Despite 0% PD-L1 expression, pembrolizumab 400 mg intravenous (IV) treatment every 6 weeks was initiated 2 months later, and subsequent positron emission tomography/CT showed a positive response at 3 and 7 months after treatment initiation. After the patient’s sixth cycle of pembrolizumab, a generalized maculopapular rash involving approximately 50% of the body surface area led to discontinuation of pembrolizumab, initiation of multiple courses of prednisone and prednisolone, and a dermatology referral.
At the current presentation, the patient exhibited excoriated red patches on the abdomen, wrists, arms, upper chest, and legs (Figure 1). Tense blisters were observed on various areas, including the ear and arms. The provisional diagnosis was pembrolizumab-induced BP, supported by the clinical history, presentation, and an initial positive response to steroids. Treatment included topical triamcinolone 0.1% ointment and prednisone 40 mg daily. Biopsies revealed subepidermal blisters with underlying eosinophils on histopathology (Figure 2). Direct immunofluorescence showed strong linear basement membrane zone staining with IgG and C3, consistent with a diagnosis of BP.
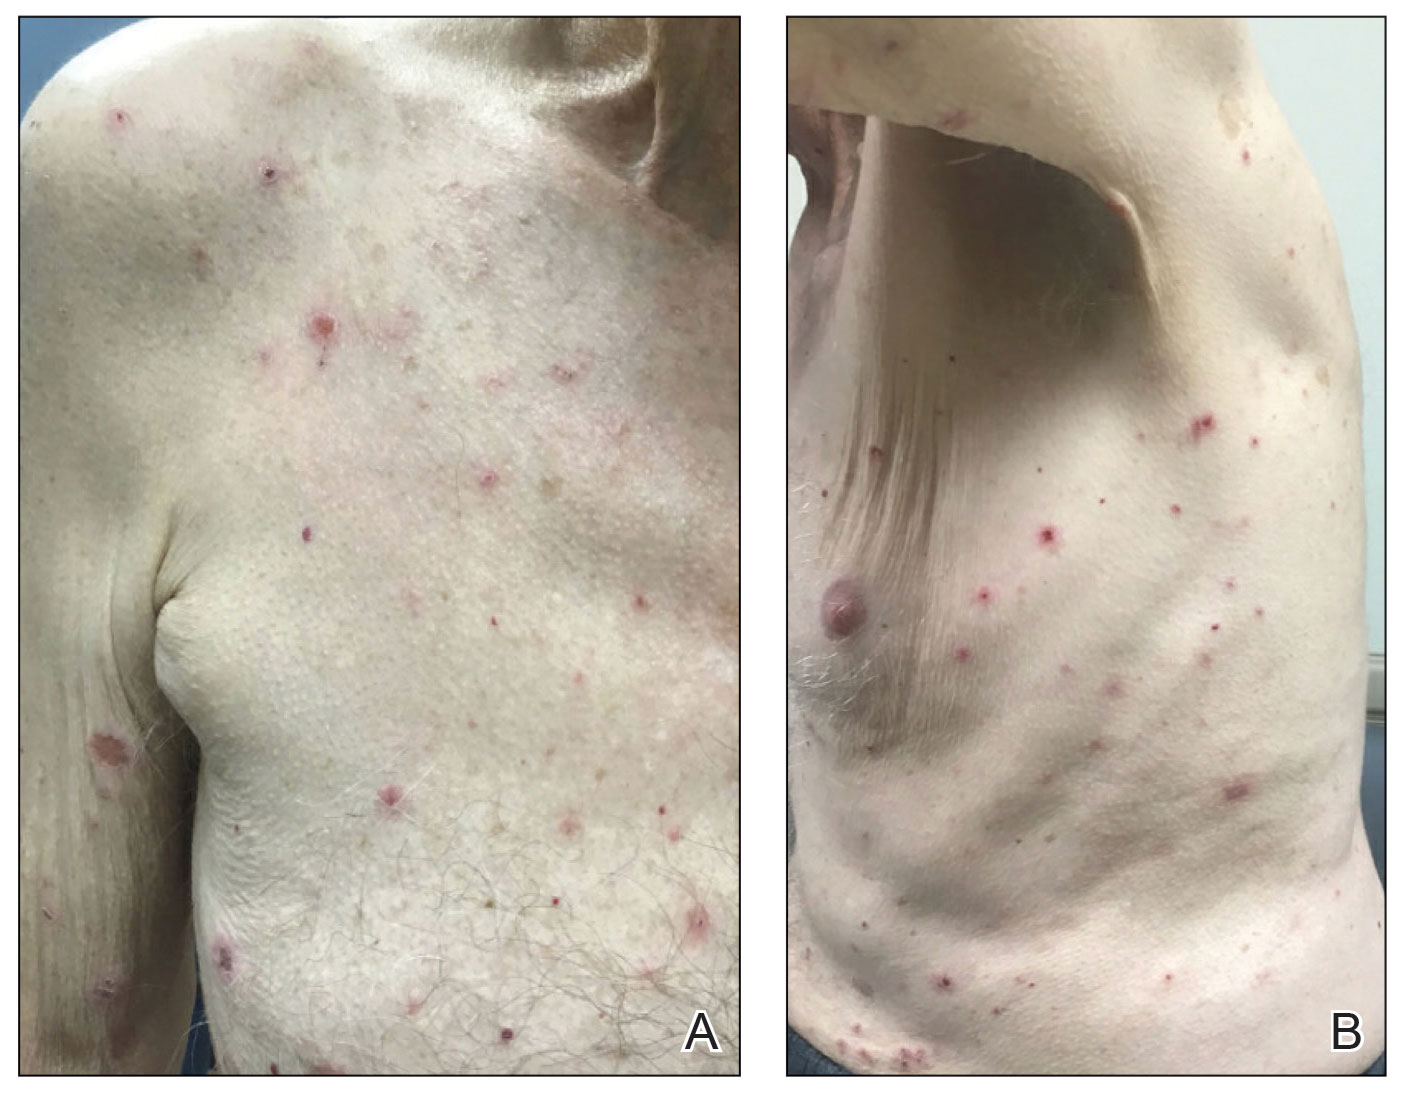
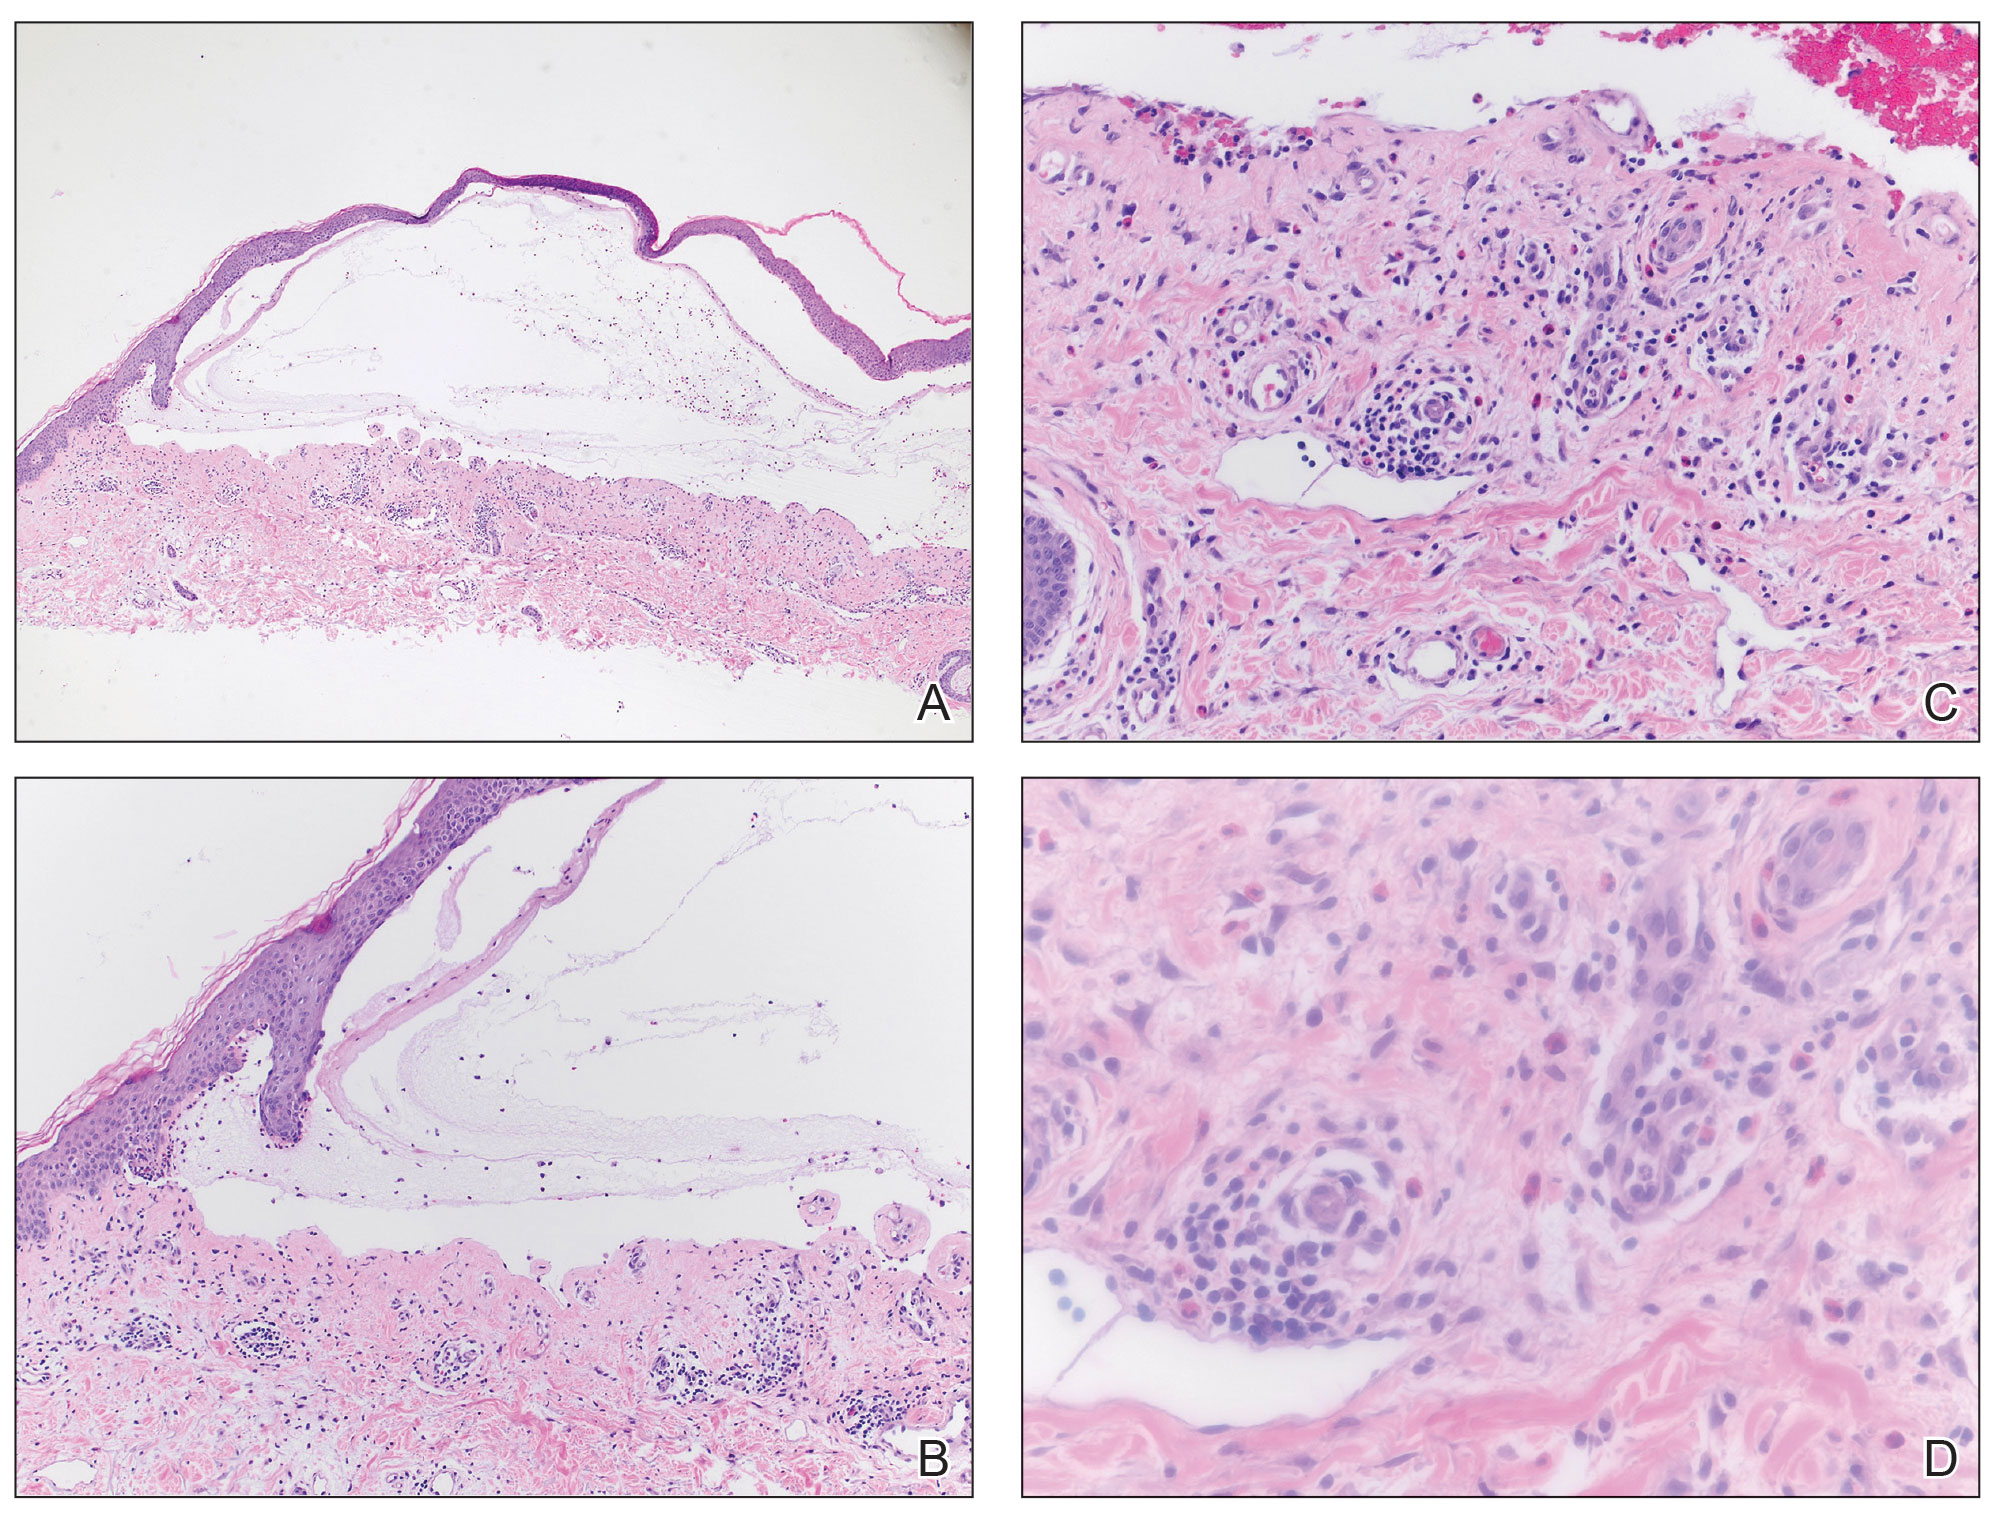
One month later, the patient was given the first of two 1-g doses of rituximab, chosen as a treatment due to metastatic cancer history and ongoing severity of the DIBP. In addition, a slow prednisone taper was initiated. Atovaquone 1500 mg daily was ordered for Pneumocystis jirovecii prophylaxis. Following the first rituximab dose, the patient became clear of DIBP but required treatment for a chronic urinary tract infection, delaying the second rituximab dose. The prednisone taper continued, however, and the patient reported re-emergence of several blisters, followed by resolution of pruritus following the second rituximab dose. Bilateral pulmonary embolisms were noted on a restaging CT, attributed to the underlying malignancy and inflammation from DIBP. Doxycycline was initiated at 100 mg twice daily, and prednisone was slowly tapered (as tolerated by the patient’s symptoms) down to 2.5 mg daily approximately 6 months after rituximab initiation. The patient remains in clinical remission at last follow-up; however, considerations for further treatments have included intravenous immunoglobulin.
Comment
This case highlights major clinical challenges in the diagnosis and management of DIBP in a patient with metastatic urothelial carcinoma receiving ICI therapy. Our patient’s clinical course offers several high-yield lessons regarding diagnostic latency, treatment resistance, and a multidisciplinary approach to management.
Pruritus as a Precursor—Since an initial report in 2015, the emergence of DIBP postpembrolizumab has been well described in the literature.19-22 Pruritus is frequently the earliest symptom, preceding bullous eruption. Similar to our case—in which DIBP developed 30 weeks after pembrolizumab initiation—the classic clinical presentation and formation of bullae often are delayed, typically occurring 28 and 39 weeks.
Beyond Corticosteroids to Manage Refractory DIBP—Our patient’s DIBP persisted despite multiple interventions, including pembrolizumab discontinuation, corticosteroid therapy, and rituximab administration. Although cases of DIBP in pembrolizumab-treated metastatic urothelial carcinoma patients have been reported, they did not exhibit similar treatment resistance.23-25 As observed in our patient, immunotherapy discontinuation has been reported in at least 40% of all ICI-mediated cases of BP.14 Subsequent management involves low-dose oral corticosteroids and potent topical corticosteroids; the duration of steroid treatment varies widely, ranging from a few weeks to longer than 12 months, with no standardized approach.26 In cases where ICI withdrawal and corticosteroids fail to produce a complete response, monoclonal antibodies such as rituximab, dupilumab, and omalizumab have been used as alternative treatments, with dupilumab recently receiving US Food and Drug Administration approval for moderate to severe BP.27-31 These biologics selectively inhibit autoantibody formation and the inflammatory cascade, and research has pointed toward them as safe and effective options for refractory BP. Although robust randomized, controlled clinical trials on rituximab for DIBP still are lacking, prospective and retrospective cohort studies have shown promising results, including complete remission rates of 67% to 90%, along with a decline in circulating BP180-specific B lymphocytes, anti-BP180 IgG, and the expression of proinflammatory IL-15 and IL-6.32
Despite receiving 2 doses of rituximab, our patient experienced recurrence of blisters when prednisone was tapered, prompting discussions about alternative tapering timelines and additional therapies such as doxycycline33 or intravenous immunoglobulin,34 which have emerged as steroid-sparing agents for BP following initial steroid therapy.
Systemic Barriers and the Need for Multidisciplinary Care—This case underscores systemic barriers within the health care system that impede prompt diagnosis and management of conditions such as DIBP. The 5-month delay between the patient’s referral to dermatology and the actual consultation, potentially due to shortages of dermatologists, highlights the need for more systematic urgent dermatologic referrals and streamlined diagnostic pathways in suspected cases of IRAEs. Diagnosis requires comprehensive evaluation, including skin biopsy for histopathologic examination and immunofluorescence studies. Ruling out alternative blistering disorders, such as epidermolysis bullosa acquisita, is crucial before confirming a BP diagnosis. Encouraging direct communication between referring physicians and consultants often can expedite the process, as a call from the referring physician can alert the consultant and speed up scheduling. Notably, the patient’s daughter, who was a patient of the dermatologist herself, played a crucial role in advocating for the dermatology referral. Although this should not be necessary, it highlights the pivotal role families can play in ensuring timely access to specialized care for challenging conditions such as BP.
Lastly, the refractory nature of the patient’s condition, coupled with concurrent chronic urinary tract infection and bilateral pulmonary embolisms, emphasizes the necessity of multidisciplinary collaboration among oncology, dermatology, and primary care in managing DIBP. Consulting experts on IRAEs and coordinating with the oncologist were essential for making informed treatment decisions and facilitating the timely exchange of clinical information.
Conclusion
This case underscores the importance of timely recognition and diagnosis of DIBP in patients undergoing ICI therapy but also highlights the need for individualized treatment approaches and multidisciplinary collaboration when managing adverse cutaneous reactions.
- Schmidt E, Zillikens D. Pemphigoid diseases. Lancet. 2013;381:320-332.
- Nishie W. Update on the pathogenesis of bullous pemphigoid: an autoantibody-mediated blistering disease targeting collagen XVII. J Dermatol Sci. 2014;73:179-186.
- Sárdy M, Kostaki D, Varga R, et al. Comparative study of direct and indirect immunofluorescence and of bullous pemphigoid 180 and 230 enzyme-linked immunosorbent assays for diagnosis of bullous pemphigoid. J Am Acad Dermatol. 2013;69:748-753.
- Smith EP, Taylor TB, Meyer LJ, et al. Antigen identification in drug-induced bullous pemphigoid. J Am Acad Dermatol. 1993;29(5 Pt 2):879-882.
- Siegel J, Totonchy M, Damsky W, et al. Bullous disorders associated with anti-PD-1 and anti-PD-L1 therapy: a retrospective analysis evaluating the clinical and histopathologic features, frequency, and impact on cancer therapy. J Am Acad Dermatol. 2018;79:1081-1088.
- Asdourian MS, Shah N, Jacoby TV, et al. Association of bullous pemphigoid with immune checkpoint inhibitor therapy in patients with cancer: a systematic review. JAMA Dermatol. 2022;158:933-941.
- Pardoll DM. The blockade of immune checkpoints in cancer immunotherapy. Nat Rev Cancer. 2012;12:252-264.
- Dunn GP, Bruce AT, Ikeda H, et al. Cancer immunoediting: from immunosurveillance to tumor escape. Nat Immunol. 2002;3:991-998.
- Powles T, Eder JP, Fine GD, et al. MPDL3280A (anti-PD-L1) treatment leads to clinical activity in metastatic bladder cancer. Nature. 2014;515:558-562.
- Bellmunt J, de Wit R, Vaughn DJ, et al. Pembrolizumab as second-line therapy for advanced urothelial carcinoma. N Engl J Med. 2017;376:1015-1026.
- Fradet Y, Bellmunt J, Vaughn DJ, et al. Randomized phase III KEYNOTE-045 trial of pembrolizumab versus paclitaxel, docetaxel, or vinflunine in recurrent advanced urothelial cancer: results of >2 years of follow-up. Ann Oncol. 2019;30:970-976.
- Felsenstein KM, Theodorescu D. Precision medicine for urothelial bladder cancer: update on tumour genomics and immunotherapy. Nat Rev Urol. 2018;15:92-111.
- Sibaud V. Dermatologic reactions to immune checkpoint inhibitors: skin toxicities and immunotherapy. Am J Clin Dermatol. 2018;19:345-361.
- Lopez AT, Khanna T, Antonov N, et al. A review of bullous pemphigoid associated with PD-1 and PD-L1 inhibitors. Int J Dermatol. 2018;57:664-669.
- Hwang SJE, Carlos G, Wakade D, et al. Cutaneous adverse events (AEs) of anti-programmed cell death (PD)-1 therapy in patients with metastatic melanoma: a single-institution cohort. J Am Acad Dermatol. 2016;74:455-461.e1.
- Belum VR, Benhuri B, Postow MA, et al. Characterisation and management of dermatologic adverse events to agents targeting the PD-1 receptor. Eur J Cancer. 2016;60:12-25.
- Naidoo J, Page DB, Li BT, et al. Toxicities of the anti-PD-1 and anti-PD-L1 immune checkpoint antibodies. Ann Oncol. 2015;26:2375-2391.
- Weber JS, Yang JC, Atkins MB, et al. Toxicities of immunotherapy for the practitioner. J Clin Oncol. 2015;33:2092-2099.
- Carlos G, Anforth R, Chou S, et al. A case of bullous pemphigoid in a patient with metastatic melanoma treated with pembrolizumab. Melanoma Res. 2015;25:265-268.
- Adachi E, Honda T, Nonoyama S, al. Severe bullous pemphigoid in a metastatic lung cancer patient treated with pembrolizumab. J Dermatol. 2019;46:E232-E233.
- Cardona AF, Ruiz-Patiño A, Zatarain-Barron ZL, et al. Refractory bullous pemphigoid in a patient with metastatic lung adenocarcinoma treated with pembrolizumab. Case Rep Oncol. 2021;14:386-390.
- Sun CW, Grossman SK, Aphale A, et al. Pembrolizumab-induced bullous pemphigoid. JAAD Case Rep. 2019;5:362-364.
- Correia C, Fernandes S, Soares-de-Almeida L, et al. Bullous pemphigoid probably associated with pembrolizumab: a case of delayed toxicity. Int J Dermatol. 2022;61:E129-E131.
- Shalata W, Weissmann S, Itzhaki Gabay S, et al. A retrospective, single-institution experience of bullous pemphigoid as an adverse effect of immune checkpoint inhibitors. Cancers. 2022;14:5451. doi:10.3390/cancers14215451
- Garje R, Chau JJ, Chung J, et al. Acute flare of bullous pemphigus with pembrolizumab used for treatment of metastatic urothelial cancer. J Immunother. 2018;41:42-44.
- Wang J, Hu X, Jiang W, et al. Analysis of the clinical characteristics of pembrolizumab-induced bullous pemphigoid. Front Oncol. 2023;13:1095694.
- Thomas RM, Colon A, Motaparthi K. Rituximab in autoimmune pemphigoid diseases: indications, optimized regimens, and practice gaps. Clin Dermatol. 2020;38:384-396.
- Sowerby L, Dewan AK, Granter S, et al. Rituximab treatment of nivolumab-induced bullous pemphigoid. JAMA Dermatol. 2017;153:603-605.
- Sharma P, Barnes M, Nabeel S, et al. Pembrolizumab-induced bullous pemphigoid treated with rituximab. JCO Oncol Pract. 2020;16:764-766.
- Abdat R, Waldman RA, de Bedout V, et al. Dupilumab as a novel therapy for bullous pemphigoid: a multicenter case series. J Am Acad Dermatol. 2020;83:46-52.
- Cao P, Xu W, Zhang L. Rituximab, omalizumab, and dupilumab treatment outcomes in bullous pemphigoid: a systematic review. Front Immunol. 2022;13:928621.
- Karakioulaki M, Eyerich K, Patsatsi A. Advancements in bullous pemphigoid treatment: a comprehensive pipeline update. Am J Clin Dermatol. 2024;25:195-212.
- Jin XX, Wang X, Shan Y, et al. Efficacy and safety of tetracyclines for pemphigoid: a systematic review and meta-analysis. Arch Dermatol Res. 2022;314:191-201.
- Kianfar N, Dasdar S, Daneshpazhooh M, et al. A systematic review on efficacy, safety and treatment durability of intravenous immunoglobulin in autoimmune bullous dermatoses: special focus on indication and combination therapy. Exp Dermatol. 2023;32:934-944.
Bullous pemphigoid (BP) is an autoimmune blistering disorder characterized by the development of tense subepidermal blisters and erosions primarily on the skin, commonly affecting the elderly.1 It is attributed to autoantibodies targeting 2 hemidesmosomal components within the dermoepidermal junction—transmembrane collagen XVII (BP180/BPAG2) and plakin family protein BP230 (BPAG1)—resulting in blister formation due to loss of structural integrity.2 Typically, patients present with pruritic urticarial plaques and tense bullae localized on flexural areas, but cutaneous manifestations vary and can be nonspecific. Histologically, a subepidermal blister with eosinophilic infiltration is characteristic, and detection of circulating autoantibodies against BP180 and BP230 antigens aids in diagnosis.3,4
Drug-induced BP (DIBP) is a subset triggered by medications, including immune checkpoint inhibitors (ICIs) targeting programmed cell death protein-1 (PD-1) or its ligand, programmed death ligand-1 (PD-L1).5,6 Often overexpressed in malignant tumors, PD-L1 inhibits host lymphocytic and apoptotic immune responses. Anti‒PD-1 and anti‒PD-L1 agents, designed to enhance the immune system’s ability to recognize and eliminate cancer cells,7,8 have improved oncologic outcomes for various cancers, including urothelial cancer.9-11 Before 2016, platinum-based chemotherapy was the mainstay for metastatic urothelial cancer management, but US Food and Drug Administration approval of 5 ICIs—nivolumab, pembrolizumab, avelumab, atezolizumab, and durvalumab—transformed treatment options.12Despite robust antitumor responses to ICIs, these medications are increasingly associated with immune-related adverse events (IRAEs), including DIBP, due to inhibition of negative regulators of immunity crucial for maintaining immunologic homeostasis.13,14 Up to 30% to 40% of patients treated with PD-1 inhibitors experience dermatologic complications, such as lichenoid reactions, eczema, vitiligo, and pruritus,15 and patients undergoing treatment with the PD-1 inhibitor pembrolizumab are estimated to be 2.6 times more likely to develop a rash than those receiving standard chemotherapy.16,17 The pathogenesis of DIBP involves autoreactive T-cell activation and subsequent autoantibody production against BP antigens.18 We present the case of DIBP secondary to pembrolizumab immunotherapy in a man with PD-L1–negative metastatic bladder cancer.
Case Report
An 81-year-old man with metastatic urothelial carcinoma presented to dermatology with a pruritic rash characterized by blisters of 5 months’ duration following treatment with pembrolizumab. He had a history of non–muscle invasive urothelial carcinoma and underwent intravesical bacillus Calmette-Guerin treatment. Thirty years later, after surveillance cystoscopies, the patient developed hematuria, which prompted pelvic ultrasonography and cystoscopy that revealed a tumor. Transurethral resection of the bladder tumor confirmed invasive, high-grade papillary urothelial carcinoma with vascular and muscle invasion (clinical stage T2NxMx). Due to elevated creatinine levels, neoadjuvant chemotherapy was contraindicated. Instead, the patient underwent cystoprostatectomy with ureteroileal conduit creation and pelvic lymphadenectomy one month later; final pathology revealed pT2aN0M0 disease with multifocal carcinoma in situ. At that time, there was no evidence of distant metastasis. Surveillance 5 months later identified pulmonary nodules that were confirmed as metastatic urothelial cancer by positron emission tomography/computed tomography (CT). The patient received 6 cycles of paclitaxel (175 mg/m² on day 1) and gemcitabine (1000 mg/m² on days 1 and 8 every 21 days), with progressive disease 16 months later. Despite 0% PD-L1 expression, pembrolizumab 400 mg intravenous (IV) treatment every 6 weeks was initiated 2 months later, and subsequent positron emission tomography/CT showed a positive response at 3 and 7 months after treatment initiation. After the patient’s sixth cycle of pembrolizumab, a generalized maculopapular rash involving approximately 50% of the body surface area led to discontinuation of pembrolizumab, initiation of multiple courses of prednisone and prednisolone, and a dermatology referral.
At the current presentation, the patient exhibited excoriated red patches on the abdomen, wrists, arms, upper chest, and legs (Figure 1). Tense blisters were observed on various areas, including the ear and arms. The provisional diagnosis was pembrolizumab-induced BP, supported by the clinical history, presentation, and an initial positive response to steroids. Treatment included topical triamcinolone 0.1% ointment and prednisone 40 mg daily. Biopsies revealed subepidermal blisters with underlying eosinophils on histopathology (Figure 2). Direct immunofluorescence showed strong linear basement membrane zone staining with IgG and C3, consistent with a diagnosis of BP.
One month later, the patient was given the first of two 1-g doses of rituximab, chosen as a treatment due to metastatic cancer history and ongoing severity of the DIBP. In addition, a slow prednisone taper was initiated. Atovaquone 1500 mg daily was ordered for Pneumocystis jirovecii prophylaxis. Following the first rituximab dose, the patient became clear of DIBP but required treatment for a chronic urinary tract infection, delaying the second rituximab dose. The prednisone taper continued, however, and the patient reported re-emergence of several blisters, followed by resolution of pruritus following the second rituximab dose. Bilateral pulmonary embolisms were noted on a restaging CT, attributed to the underlying malignancy and inflammation from DIBP. Doxycycline was initiated at 100 mg twice daily, and prednisone was slowly tapered (as tolerated by the patient’s symptoms) down to 2.5 mg daily approximately 6 months after rituximab initiation. The patient remains in clinical remission at last follow-up; however, considerations for further treatments have included intravenous immunoglobulin.
Comment
This case highlights major clinical challenges in the diagnosis and management of DIBP in a patient with metastatic urothelial carcinoma receiving ICI therapy. Our patient’s clinical course offers several high-yield lessons regarding diagnostic latency, treatment resistance, and a multidisciplinary approach to management.
Pruritus as a Precursor—Since an initial report in 2015, the emergence of DIBP postpembrolizumab has been well described in the literature.19-22 Pruritus is frequently the earliest symptom, preceding bullous eruption. Similar to our case—in which DIBP developed 30 weeks after pembrolizumab initiation—the classic clinical presentation and formation of bullae often are delayed, typically occurring 28 and 39 weeks.
Beyond Corticosteroids to Manage Refractory DIBP—Our patient’s DIBP persisted despite multiple interventions, including pembrolizumab discontinuation, corticosteroid therapy, and rituximab administration. Although cases of DIBP in pembrolizumab-treated metastatic urothelial carcinoma patients have been reported, they did not exhibit similar treatment resistance.23-25 As observed in our patient, immunotherapy discontinuation has been reported in at least 40% of all ICI-mediated cases of BP.14 Subsequent management involves low-dose oral corticosteroids and potent topical corticosteroids; the duration of steroid treatment varies widely, ranging from a few weeks to longer than 12 months, with no standardized approach.26 In cases where ICI withdrawal and corticosteroids fail to produce a complete response, monoclonal antibodies such as rituximab, dupilumab, and omalizumab have been used as alternative treatments, with dupilumab recently receiving US Food and Drug Administration approval for moderate to severe BP.27-31 These biologics selectively inhibit autoantibody formation and the inflammatory cascade, and research has pointed toward them as safe and effective options for refractory BP. Although robust randomized, controlled clinical trials on rituximab for DIBP still are lacking, prospective and retrospective cohort studies have shown promising results, including complete remission rates of 67% to 90%, along with a decline in circulating BP180-specific B lymphocytes, anti-BP180 IgG, and the expression of proinflammatory IL-15 and IL-6.32
Despite receiving 2 doses of rituximab, our patient experienced recurrence of blisters when prednisone was tapered, prompting discussions about alternative tapering timelines and additional therapies such as doxycycline33 or intravenous immunoglobulin,34 which have emerged as steroid-sparing agents for BP following initial steroid therapy.
Systemic Barriers and the Need for Multidisciplinary Care—This case underscores systemic barriers within the health care system that impede prompt diagnosis and management of conditions such as DIBP. The 5-month delay between the patient’s referral to dermatology and the actual consultation, potentially due to shortages of dermatologists, highlights the need for more systematic urgent dermatologic referrals and streamlined diagnostic pathways in suspected cases of IRAEs. Diagnosis requires comprehensive evaluation, including skin biopsy for histopathologic examination and immunofluorescence studies. Ruling out alternative blistering disorders, such as epidermolysis bullosa acquisita, is crucial before confirming a BP diagnosis. Encouraging direct communication between referring physicians and consultants often can expedite the process, as a call from the referring physician can alert the consultant and speed up scheduling. Notably, the patient’s daughter, who was a patient of the dermatologist herself, played a crucial role in advocating for the dermatology referral. Although this should not be necessary, it highlights the pivotal role families can play in ensuring timely access to specialized care for challenging conditions such as BP.
Lastly, the refractory nature of the patient’s condition, coupled with concurrent chronic urinary tract infection and bilateral pulmonary embolisms, emphasizes the necessity of multidisciplinary collaboration among oncology, dermatology, and primary care in managing DIBP. Consulting experts on IRAEs and coordinating with the oncologist were essential for making informed treatment decisions and facilitating the timely exchange of clinical information.
Conclusion
This case underscores the importance of timely recognition and diagnosis of DIBP in patients undergoing ICI therapy but also highlights the need for individualized treatment approaches and multidisciplinary collaboration when managing adverse cutaneous reactions.
- Schmidt E, Zillikens D. Pemphigoid diseases. Lancet. 2013;381:320-332.
- Nishie W. Update on the pathogenesis of bullous pemphigoid: an autoantibody-mediated blistering disease targeting collagen XVII. J Dermatol Sci. 2014;73:179-186.
- Sárdy M, Kostaki D, Varga R, et al. Comparative study of direct and indirect immunofluorescence and of bullous pemphigoid 180 and 230 enzyme-linked immunosorbent assays for diagnosis of bullous pemphigoid. J Am Acad Dermatol. 2013;69:748-753.
- Smith EP, Taylor TB, Meyer LJ, et al. Antigen identification in drug-induced bullous pemphigoid. J Am Acad Dermatol. 1993;29(5 Pt 2):879-882.
- Siegel J, Totonchy M, Damsky W, et al. Bullous disorders associated with anti-PD-1 and anti-PD-L1 therapy: a retrospective analysis evaluating the clinical and histopathologic features, frequency, and impact on cancer therapy. J Am Acad Dermatol. 2018;79:1081-1088.
- Asdourian MS, Shah N, Jacoby TV, et al. Association of bullous pemphigoid with immune checkpoint inhibitor therapy in patients with cancer: a systematic review. JAMA Dermatol. 2022;158:933-941.
- Pardoll DM. The blockade of immune checkpoints in cancer immunotherapy. Nat Rev Cancer. 2012;12:252-264.
- Dunn GP, Bruce AT, Ikeda H, et al. Cancer immunoediting: from immunosurveillance to tumor escape. Nat Immunol. 2002;3:991-998.
- Powles T, Eder JP, Fine GD, et al. MPDL3280A (anti-PD-L1) treatment leads to clinical activity in metastatic bladder cancer. Nature. 2014;515:558-562.
- Bellmunt J, de Wit R, Vaughn DJ, et al. Pembrolizumab as second-line therapy for advanced urothelial carcinoma. N Engl J Med. 2017;376:1015-1026.
- Fradet Y, Bellmunt J, Vaughn DJ, et al. Randomized phase III KEYNOTE-045 trial of pembrolizumab versus paclitaxel, docetaxel, or vinflunine in recurrent advanced urothelial cancer: results of >2 years of follow-up. Ann Oncol. 2019;30:970-976.
- Felsenstein KM, Theodorescu D. Precision medicine for urothelial bladder cancer: update on tumour genomics and immunotherapy. Nat Rev Urol. 2018;15:92-111.
- Sibaud V. Dermatologic reactions to immune checkpoint inhibitors: skin toxicities and immunotherapy. Am J Clin Dermatol. 2018;19:345-361.
- Lopez AT, Khanna T, Antonov N, et al. A review of bullous pemphigoid associated with PD-1 and PD-L1 inhibitors. Int J Dermatol. 2018;57:664-669.
- Hwang SJE, Carlos G, Wakade D, et al. Cutaneous adverse events (AEs) of anti-programmed cell death (PD)-1 therapy in patients with metastatic melanoma: a single-institution cohort. J Am Acad Dermatol. 2016;74:455-461.e1.
- Belum VR, Benhuri B, Postow MA, et al. Characterisation and management of dermatologic adverse events to agents targeting the PD-1 receptor. Eur J Cancer. 2016;60:12-25.
- Naidoo J, Page DB, Li BT, et al. Toxicities of the anti-PD-1 and anti-PD-L1 immune checkpoint antibodies. Ann Oncol. 2015;26:2375-2391.
- Weber JS, Yang JC, Atkins MB, et al. Toxicities of immunotherapy for the practitioner. J Clin Oncol. 2015;33:2092-2099.
- Carlos G, Anforth R, Chou S, et al. A case of bullous pemphigoid in a patient with metastatic melanoma treated with pembrolizumab. Melanoma Res. 2015;25:265-268.
- Adachi E, Honda T, Nonoyama S, al. Severe bullous pemphigoid in a metastatic lung cancer patient treated with pembrolizumab. J Dermatol. 2019;46:E232-E233.
- Cardona AF, Ruiz-Patiño A, Zatarain-Barron ZL, et al. Refractory bullous pemphigoid in a patient with metastatic lung adenocarcinoma treated with pembrolizumab. Case Rep Oncol. 2021;14:386-390.
- Sun CW, Grossman SK, Aphale A, et al. Pembrolizumab-induced bullous pemphigoid. JAAD Case Rep. 2019;5:362-364.
- Correia C, Fernandes S, Soares-de-Almeida L, et al. Bullous pemphigoid probably associated with pembrolizumab: a case of delayed toxicity. Int J Dermatol. 2022;61:E129-E131.
- Shalata W, Weissmann S, Itzhaki Gabay S, et al. A retrospective, single-institution experience of bullous pemphigoid as an adverse effect of immune checkpoint inhibitors. Cancers. 2022;14:5451. doi:10.3390/cancers14215451
- Garje R, Chau JJ, Chung J, et al. Acute flare of bullous pemphigus with pembrolizumab used for treatment of metastatic urothelial cancer. J Immunother. 2018;41:42-44.
- Wang J, Hu X, Jiang W, et al. Analysis of the clinical characteristics of pembrolizumab-induced bullous pemphigoid. Front Oncol. 2023;13:1095694.
- Thomas RM, Colon A, Motaparthi K. Rituximab in autoimmune pemphigoid diseases: indications, optimized regimens, and practice gaps. Clin Dermatol. 2020;38:384-396.
- Sowerby L, Dewan AK, Granter S, et al. Rituximab treatment of nivolumab-induced bullous pemphigoid. JAMA Dermatol. 2017;153:603-605.
- Sharma P, Barnes M, Nabeel S, et al. Pembrolizumab-induced bullous pemphigoid treated with rituximab. JCO Oncol Pract. 2020;16:764-766.
- Abdat R, Waldman RA, de Bedout V, et al. Dupilumab as a novel therapy for bullous pemphigoid: a multicenter case series. J Am Acad Dermatol. 2020;83:46-52.
- Cao P, Xu W, Zhang L. Rituximab, omalizumab, and dupilumab treatment outcomes in bullous pemphigoid: a systematic review. Front Immunol. 2022;13:928621.
- Karakioulaki M, Eyerich K, Patsatsi A. Advancements in bullous pemphigoid treatment: a comprehensive pipeline update. Am J Clin Dermatol. 2024;25:195-212.
- Jin XX, Wang X, Shan Y, et al. Efficacy and safety of tetracyclines for pemphigoid: a systematic review and meta-analysis. Arch Dermatol Res. 2022;314:191-201.
- Kianfar N, Dasdar S, Daneshpazhooh M, et al. A systematic review on efficacy, safety and treatment durability of intravenous immunoglobulin in autoimmune bullous dermatoses: special focus on indication and combination therapy. Exp Dermatol. 2023;32:934-944.
Pembrolizumab-Induced Bullous Pemphigoid: Navigating Diagnostic Challenges and Treatment Resistance
Pembrolizumab-Induced Bullous Pemphigoid: Navigating Diagnostic Challenges and Treatment Resistance
Practice Points
- Suspect bullous pemphigoid (BP) in patients receiving immune checkpoint inhibitors (ICIs) with new-onset pruritus or dermatologic lesions; blisters may be delayed for months.
- Treatment-resistant cases of drug-induced BP warrant consideration of alternative therapies, including rituximab, doxycycline, or intravenous immunoglobulin.
- Multidisciplinary management with dermatology and oncology is essential, as immune-related effects may persist even after ICI discontinuation.
- Encourage patients to report new skin changes promptly to their primary care physician to allow for early intervention.