User login
WASHINGTON – The number of uninsured grew in 2018 as the rate of health care spending grew, according to data from the Centers for Medicare & Medicaid Services.
A total of 30.7 million people in the United States were uninsured in 2018 – up 1 million from 2017. It was the second year in a row that the number of uninsured grew by that amount.
The newly uninsured came from the private insurance sector, which saw the number of insured decrease to 200.5 million in 2018 from 202.1 million in the previous year, partially offset by increases in Americans covered by Medicare and Medicaid.
The increase in uninsured people comes as the growth rate in health care spending rose to 4.6% in 2018 from 4.2% in 2017, though much of that growth in the rate of spending was attributed to the application of a health insurance tax in 2018 that Congress put a moratorium on in the previous year. The tax was part of the Affordable Care Act and was enacted in 2014.
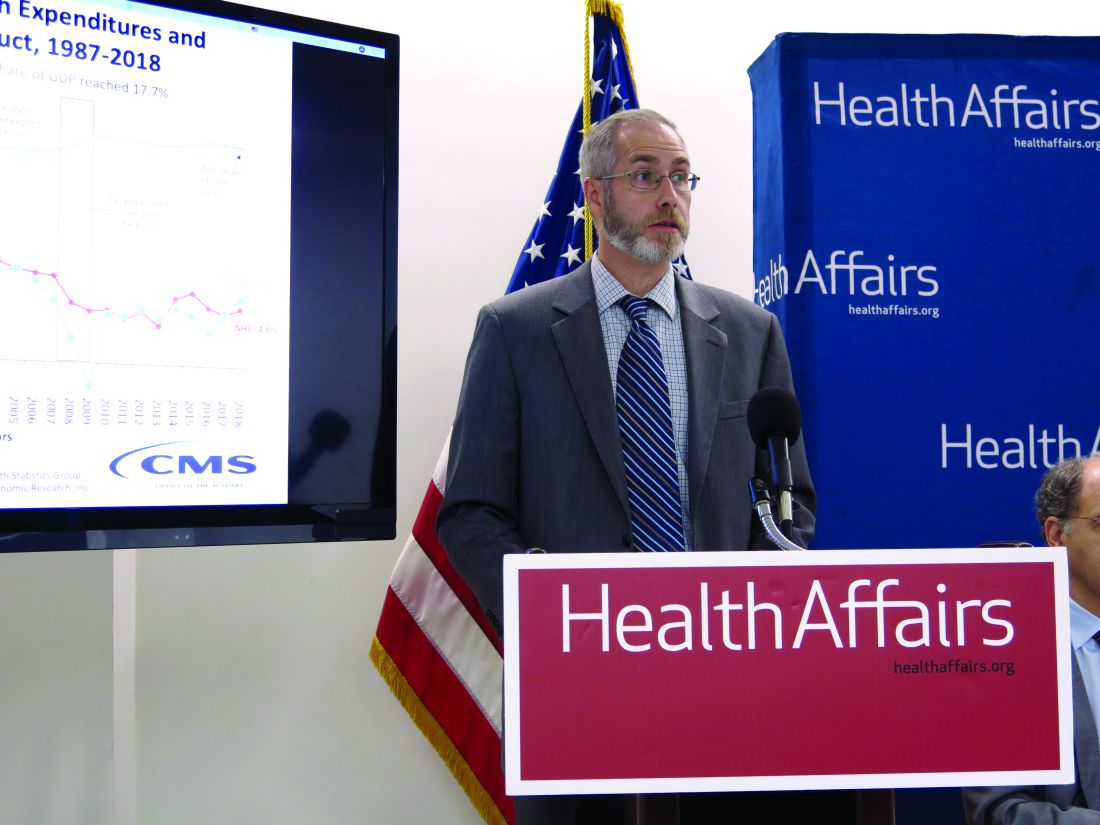
“We see that health care spending reached $3.6 trillion, or $11,172 per person, and spending was faster,” Micah Hartman, statistician in the National Health Statistics Group in the CMS Office of the Actuary, said during a press conference to review the national health expenditure results. “The main reason for the acceleration was faster growth in the net cost of insurance, and that was particularly the case for private health insurance and also for Medicare.”
The net cost of insurance includes nonmedical expenses such as administration, taxes, and fees, as well as gains or losses for private health insurers. The ACA’s health insurance tax generated $14.3 billion in spending, according to Internal Revenue Service data.
Also contributing to the rise in the rate of growth was faster growth in medical prices, “and that was due to underlying economy-wide inflation, as well as the impacts of the tax,” Mr. Hartman said.
Despite this growth in the rate of spending, health care spending as a percentage of GDP fell slightly from 17.9% in 2017 in 17.7%, as the GDP grew faster than health care spending in 2018.
The faster growth in prices more than offset the slightly slower growth in the use and intensity of medical services, CMS reported.
The growth rate on spending on physician and clinical services slowed to 4.1% in 2018 from 4.7% in 2017. Overall spending on physician and clinical services in 2018 reached $725.6 billion and accounted for 20% of overall health care spending.
Spending on hospital services also slowed, but only slightly, dropping to a growth rate of 4.5% from 4.7% during this period. Hospital spending in 2018, at $1.2 trillion, accounted for 33% of overall health care spending.
On a personal level, overall growth in personal health care spending held steady with growth rate of 4.1% in 2018, the same as 2017, though individual components that feed into the figure varied. For example, growth rate in the spending on retail pharmaceuticals rose to 2.5% from 1.4% during this period. Spending on retail pharmaceuticals reached $335 billion and accounted for 9% of overall health care spending.
Another factor in the rising growth rate in spending came from employer-sponsored insurance.
“Growth in health spending by private business was due to faster growth in employer contributions to private health insurance premiums,” Anne B. Martin, economist in the National Health Statistics Group, said during the press conference. There also was faster growth in spending by the federal government, “driven mainly by faster growth in the federally funded portions of Medicare and Medicaid.”
Spending by private health insurance grew at a rate of 5.8% and reached $1.2 trillion in 2018. Medicare spending grew by 6.4% and reached $750.2 billion, while Medicaid spending grew 3.0%, reaching $597.4 billion.
SOURCE: Hartman M et al. Health Affairs. 2019. doi: 10.1377/hlthaff.2019.00451


