User login
Recognition and Management of Nighttime Reflux Symptoms
A supplement to Internal Medicine News supported by Santarus, Inc. The supplement is based on a faculty interview.

To view the supplement, click the image above.
FACULTY
Colin W. Howden, MD
Professor, Division of Gastroenterology
Northwestern University Feinberg School of Medicine
A supplement to Internal Medicine News supported by Santarus, Inc. The supplement is based on a faculty interview.
To view the supplement, click the image above.
FACULTY
Colin W. Howden, MD
Professor, Division of Gastroenterology
Northwestern University Feinberg School of Medicine
A supplement to Internal Medicine News supported by Santarus, Inc. The supplement is based on a faculty interview.
To view the supplement, click the image above.
FACULTY
Colin W. Howden, MD
Professor, Division of Gastroenterology
Northwestern University Feinberg School of Medicine
ONLINE EXCLUSIVE: Audio interview with HM10 Course Director
ONLINE EXCLUSIVE: Training in Two Cultures: Medicine and Soldiering
Undergrads who choose the military and attend USUHS receive free tuition, books and other supplies; hand-held devices and related subscriptions, and basic medical equipment such as stethoscopes. In addition, USUHS medical students are paid as an active-duty second lieutenant (the going rate for the U.S. Army is about $1,900 per month).
Once they graduate, military residents work in uniform at military facilities and are afforded housing allowances. The government also covers the cost of medical malpractice insurance and supports them in any litigation while they are on active service. If they complete 20 years in active service, military physicians receive a generous retirement package, including a retained 40% to 50% pension for the rest of their lives, and they can seek work in the civilian sector after their military career.
For those who choose the military from the outset, the Department of Defense offers sign-on bonuses of $20,000 and a Health Service Professional Scholarship (HPSP) program for qualified applicants. It covers all medical school costs at a civilian medical school of the student’s choice. (Recent studies show the typical medical school grad has $120,000 of school load debt; $160,000 if they attended a private school.) The caveat is that after graduation, whether from USUHS or a civilian medical school, the physician works in uniform as a military physician for a pre-determined payback period (e.g., the Army obligation is one year of service for every year of scholarship).
The military offers training programs in medical, dental, optometry, veterinary, psychiatric nurse practitioner, and clinical and counseling psychology. Training at USUHS or with an HPSP requires each student before matriculation to choose his or her preferred branch of military service for the payback period. Whichever route a student takes, USUHS or HPSP, the student will end up as a doctor and a trained service member knowledgeable about areas including rank structure, military administration, and personal physical fitness.
Preventing venous thromboembolism in long-term care residents: Cautious advice based on limited data
Randomized trials that included more than 20,000 medical patients have shown that anticoagulant therapy is safe and effective in preventing venous thromboembolism (VTE), ie, deep vein thrombosis and pulmonary embolism.
However, these trials were done in hospitalized patients, who typically had an acute medical illness and who, if eligible, received a short (7- to 10-day) course of anticoagulant prophylaxis.
Little attention has been given to VTE prophylaxis in residents of long-term care facilities. These patients have risk profiles similar to those of hospitalized medical patients. Some of them may have been transferred from an acute care hospital. In addition, most are elderly, and many have reduced mobility and are at risk for illnesses such as stroke and cardiorespiratory insufficiency, which increase the risk of VTE.
VTE in residents of long-term care facilities is a growing concern. By some estimates, by the year 2030 more than 20% of the US population (70.2 million people) will be over 65 years of age.1 Of those who reached age 65 in 1990, an estimated 43% will enter a nursing home at least once before they die—32% for 3 months, 24% for at least a year, and 9% for at least 5 years.2
Against this background, the objectives of this review are to consider:
- The scope of the problem of VTE in long-term care residents
- Why VTE prophylaxis is often overlooked in medical patients
- Evidence—or lack of evidence—for the safety and efficacy of VTE prophylaxis in long-term care residents and other medical patients
- Available options for VTE prophylaxis
- Which long-term care residents should or should not be considered for prophylaxis.
THE TRUE SCOPE OF THE PROBLEM IS UNKNOWN
The incidence of acute VTE among nursing home residents is reported to be 1.3 events per 100 person-years.3 About 8% of cases of pulmonary embolism and 10% of cases of deep venous thrombosis in the elderly are in nursing home residents.4
However, only 20% of patients with VTE have typical symptoms such as leg pain and swelling or acute dyspnea and chest pain, while 80% have no symptoms.5
Furthermore, deep venous thrombosis is more likely to be clinically silent in patients whose mobility is impaired, such as nursing home residents, as the symptoms arising from obstruction of venous flow are more pronounced with walking.
Pulmonary embolism is also underdiagnosed in this group. An autopsy study of 234 nursing home residents found undiagnosed pulmonary embolism to be the cause of death in 8%, and 40% of cases of pulmonary embolism were not suspected before the patient died.6 Yet pulmonary embolism has a higher case-fatality rate in the elderly than in younger patients, particularly when elderly patients have comorbidities.7
A reason why the diagnosis is so often missed is that pulmonary embolism can present atypically in the elderly, with syncope being more common and tachycardia being less common than in younger patients.8
Since so many cases of VTE are clinically silent and most long-term care residents who die do not undergo autopsy, the true scope of VTE as a clinical problem in these patients is unknown. Consequently, the best way to diagnose, prevent, and treat VTE is also unclear.
WHY IS VTE PREVENTION SO OFTEN OVERLOOKED IN MEDICAL PATIENTS?
In general, nonsurgical patients receive suboptimal thromboprophylaxis. National and international chart audits and cross-sectional studies show that only 16% to 33% of hospitalized medical patients at risk for VTE receive appropriate anticoagulant prophylaxis.9 Though no audits in long-term care facilities have been published, the rate of appropriate prophylaxis is likely comparable to or possibly less than that in medical patients in the hospital. In contrast, in surgical patients the rate is much higher—up to 90%.10,11
Why is VTE prophylaxis so underused in medical patients?
One reason is that we do not really know the baseline risk of VTE in medical patients, particularly in those with chronic illness who require long-term care.12 This is relevant because, in the absence of data about patients’ baseline risk, anticoagulant prophylaxis should be ordered selectively, as it poses known risks of bleeding. The risk is greater in elderly people with comorbidities, as are the associated costs.
In addition, relatively few studies have assessed thromboprophylaxis in medical patients, especially in residents of long-term care facilities.
Another reason is that we lack practice guidelines for patients who need long-term care. The well-accepted guidelines from the American College of Chest Physicians (ACCP) cite advanced age and immobility as risk factors for VTE and strongly recommend prophylaxis in acutely ill medical patients who have limited mobility and an additional risk factor such as infection or cancer.13 Though elderly residents of long-term care facilities may share some of these risk factors, the ACCP guidelines make no specific recommendations for this group.
The attitudes of health care professionals may also pose a barrier. Lloyd et al (unpublished data, 2009) surveyed 1,601 health care professionals in Ontario, Canada, in 2007, to assess potential barriers to anticoagulant prophylaxis in hospitalized medical patients. Respondents cited concerns about the risk of bleeding from anticoagulants, lack of clear indications and contraindications for anticoagulant prophylaxis, and lack of time to consider VTE prophylaxis in every patient. (They did not, however, cite disagreement with guidelines or patient discomfort from subcutaneous anticoagulant injections as barriers.) It is reasonable to assume that these attitudes may also pose a problem in long-term care residents.
Finally, no randomized trials have evaluated the efficacy and safety of anticoagulant drugs or mechanical methods of prophylaxis in long-term care residents. Studies have shown that a short course (7–10 days) of an anticoagulant drug effectively prevents VTE in acutely ill patients, but the efficacy of an extended course in patients with chronic illness who require long-term care is not clear. Therefore, recommendations about thromboprophylaxis in long-term care residents should be made with the caveat that they are based on indirect evidence from other patient groups. This is a considerable limitation.
OPTIONS FOR THROMBOPROPHYLAXIS IN LONG-TERM CARE RESIDENTS
Options for thromboprophylaxis fall into two broad categories: anticoagulant drugs and mechanical devices.
Anticoagulant prophylactic drugs
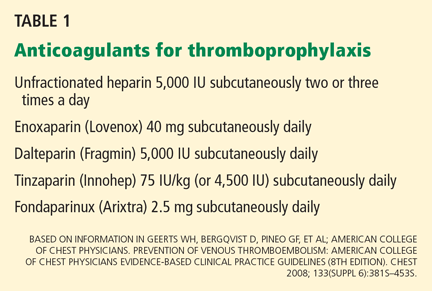
These agents have been assessed in randomized trials in surgical or acutely ill medical patients, although fondaparinux and tinzaparin are not approved for use in medical patients. Furthermore, none of them has been evaluated in residents of long-term care facilities.
The choice of anticoagulant for prophylaxis is determined largely by clinical factors.
Low-molecular-weight heparins are popular both in and out of the hospital because they have predictable pharmacokinetic properties, they come in convenient prefilled syringes, and they can be given once daily. However, some of them may bioaccumulate in patients with impaired renal function, as they are cleared primarily by the kidney.
Unfractionated heparin is likely to be safer in patients with severe renal insufficiency (creatinine clearance < 30 mL/min), as it is cleared via nonrenal mechanisms.
However, a recent single-arm trial of dalteparin 5,000 IU once daily in critically ill patients with severe renal insufficiency found no evidence of an excessive anticoagulant effect or of drug bioaccumulation.15 Dalteparin may thus be an alternative to unfractionated heparin in medical patients with impaired renal function.
Fondaparinux, a newer anticoagulant, is also given once daily. It is the anticoagulant of choice in patients who have had heparin-induced thrombocytopenia because it is not derived from heparin and likely does not cross-react with heparin-induced thrombocytopenia antibodies.16,17
Limited data on benefit of prophylactic anticoagulant drugs
As mentioned, the trials that confirmed the efficacy and safety of anticoagulant prophylaxis were in surgical patients and hospitalized medical patients, not elderly long-term care residents. The poor evidence for anticoagulant prophylaxis in these patients may be strengthened if extended-duration, out-of-hospital prophylaxis were shown to be effective in medical patients. Long-term care residents could more reasonably be compared with medical patients discharged home with a chronic or resolving illness than with those who are hospitalized.
There is some evidence, although with caveats, that extended anticoagulant prophylaxis, started after an acute illness has resolved, confers a benefit. A recent randomized trial compared extended-duration and short-duration prophylaxis (5 weeks vs 10 days) with enoxaparin 40 mg once daily in 4,726 medical patients with impaired mobility.18 The risk of any VTE event was 44% lower with extended-duration prophylaxis (2.8% vs 4.9%; P = .001) and the risk of symptomatic VTE was 73% lower (0.3% vs 1.1%; P = .004), and this benefit persisted 2 months after treatment was stopped (3.0% vs 5.2%; P = .0015). However, extended treatment conferred a fourfold higher risk of major bleeding (0.6% vs 0.15%; P = .019).
These findings should also be considered in terms of absolute benefit and harm. Treating 1,000 patients for 5 weeks instead of 10 days would prevent eight episodes of symptomatic VTE (absolute risk reduction = 0.8%, number needed to treat = 125) at the cost of four to five episodes of major bleeding (absolute risk increase = 0.45%, number needed to harm = 222). This is a modest net therapeutic benefit.
The therapeutic benefit would be greater if we consider all episodes of VTE, both symptomatic and asymptomatic. Treating 1,000 patients for 5 weeks would prevent 20 episodes of symptomatic or asymptomatic VTE (absolute risk reduction = 2.1%, number needed to treat = 48). However, the clinical importance of asymptomatic VTE is questionable.
Given these considerations, if extended-duration anticoagulant prophylaxis is considered, it should be for patients at highest risk to optimize both its net therapeutic benefits and its cost-effectiveness.
Mechanical prophylaxis
Mechanical thromboprophylactic devices—graduated or elastic compression stockings and intermittent pneumatic compression devices—are effective when used by themselves in surgical patients.13 However, in a randomized controlled trial in patients with ischemic stroke, the rate of VTE was 10.0% with graduated compression stockings in addition to “usual care VTE prophylaxis” vs 10.5% with usual care alone, and patients in the stocking group had a fourfold higher risk of developing skin breaks, ulcers, blisters, or necrosis (5% vs 1%; odds ratio 4.18; 95% CI 2.4–7.3).19 Furthermore, improperly fitted stockings, especially those that are thigh-length, can be uncomfortable to wear and difficult to apply.
Overall, the role of mechanical thromboprophylaxis in long-term care facilities is not clear. If it is considered, there should be a compelling reason to use it—for example, for patients at high risk in whom anticoagulants are contraindicated because of ongoing bleeding or a higher risk of bleeding (eg, recent gastrointestinal bleeding, hemorrhagic stroke, coagulopathy, or thrombocytopenia). Furthermore, if stockings are used, they should be properly fitted and routinely monitored for adverse effects, since elderly patients are likely to be most susceptible to skin breakdown.
WHICH LONG-TERM CARE RESIDENTS SHOULD RECEIVE VTE PROPHYLAXIS?
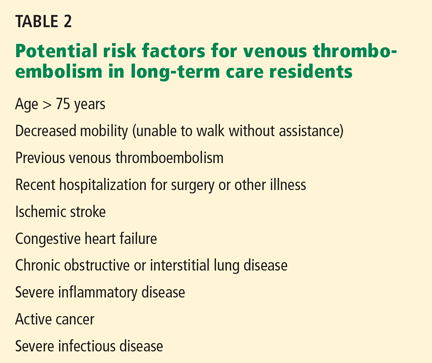
Old age and immobility are not the only risk factors
The current ACCP guidelines suggest considering thromboprophylaxis for hospitalized medical patients over age 75 who cannot walk without assistance.13 However, we lack evidence to suggest a similar strategy in long-term care residents.
The ACCP guidelines are based on data on risk. Nearly 25% of elderly patients with confirmed pulmonary embolism had been immobile prior to their diagnosis.8 In addition, prolonged bed rest (> 14 days) has been reported to be the strongest independent risk factor for symptomatic deep venous thrombosis, increasing the risk more than fivefold.20 Advanced age is also considered a risk factor for VTE, as risk starts to increase at age 40 and doubles each decade of life thereafter.18
No study has assessed the impact of these factors on the risk of VTE in long-term care residents. Since most of such patients are elderly and have impaired mobility, we believe a more selective approach should be used in assigning VTE risk status, one that does not use advanced age and immobility as the only criteria for starting thromboprophylaxis.
Residents of long-term care facilities may be immobile because of underlying illness or disability, such as cognitive impairment, sensory impairment (eg, poor access to corrective lenses and hearing aids), or poor access to assist devices (eg, walkers, canes). In addition, iatrogenic factors that decrease mobility such as indwelling bladder catheters and physical restraints are also common in such patients.
Efforts to improve mobility should be encouraged. However, we recommend that thromboprophylaxis be considered only in patients who have both impaired mobility and an intercurrent acute medical illness such as an acute infection or acute inflammatory disease.13
A related issue is the difference between long-term care residents with a chronic but stable disease and those with acute disease. Patients with acute exacerbations of congestive heart failure or chronic obstructive lung disease may be considered for thromboprophylaxis, as they become more comparable to acutely ill medical patients in whom clinical trials have shown the effectiveness of anticoagulant prophylaxis. On the other hand, patients with these diseases who remain stable may not need prophylaxis.
This approach avoids giving long-term anticoagulant prophylaxis to patients who have irreversible diseases and limits the use of these drugs and devices to higher-risk periods.
Consider thromboprophylaxis if…
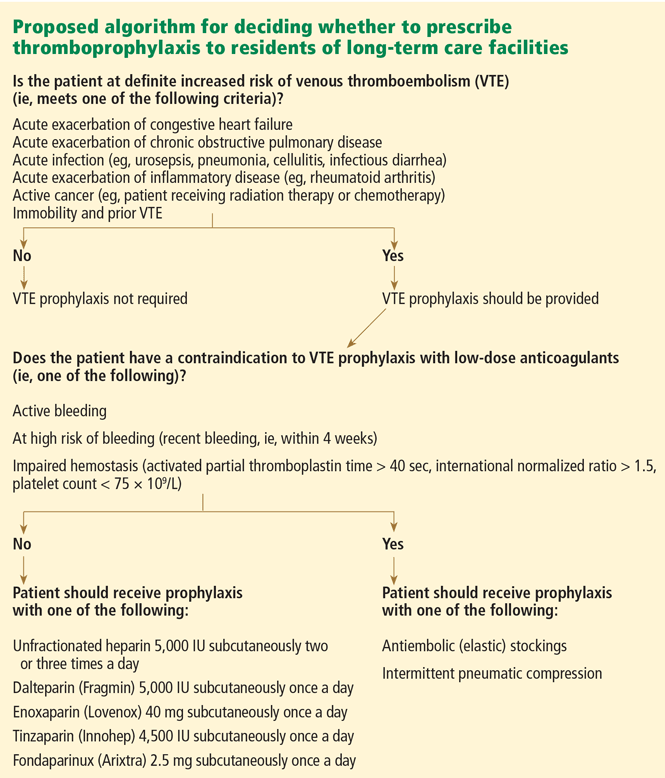
- An acute exacerbation of congestive heart failure or chronic obstructive pulmonary disease
- Acute infection (eg, urosepsis, pneumonia, cellulitis, infectious diarrhea)
- An acute exacerbation of an inflammatory disease (eg, rheumatoid arthritis)
- Active cancer (eg, patient receiving radiation therapy or chemotherapy)
- Immobility and prior VTE.
Do not routinely consider prophylaxis if…
We also believe patients should not be routinely considered for anticoagulant VTE prophylaxis if they have:
- Chronic but stable cardiorespiratory disease
- Chronic but stable infectious or inflammatory disease
- Terminal cancer with very limited life expectancy
- Any contraindication to anticoagulants (eg, active bleeding, recent bleeding, coagulopathy, thrombocytopenia).
ANTICOAGULANT PROPHYLAXIS POSES RISKS IN LONG-TERM CARE RESIDENTS
Bleeding is the principal risk
The incidence of clinically important bleeding associated with anticoagulant prophylaxis is 0.2% to 5.6%, and the risk of fatal bleeding is 0.02% to 0.5%.21–24
As no randomized trial has examined anticoagulant prophylaxis in elderly long-term care residents, their bleeding risk with this therapy is unclear. However, older patients are likely to be at higher risk than younger patients because they have more comorbidities, take more drugs that could interact with heparin and potentiate bleeding, and have fragile skin, predisposing to injury from subcutaneous injections.
Also, renal function tends to decline with age. In a retrospective study of 854 outpatients over age 65, 29% had moderate renal insufficiency (creatinine clearance 30–50 mL/min), and 6% had severe renal insufficiency (creatinine clearance < 30 mL/min).25 Recent evidence suggests that some low-molecular-weight heparins (dalteparin and tinzaparin) do not bioaccumulate in patients with impaired renal function. However, enoxaparin and fondaparinux should be used with caution in patients with moderate to severe renal impairment.
Though much attention has recently been paid to increasing anticoagulant doses if the patient is obese, residents of long-term care facilities are more likely to be underweight. Dose adjustment should be considered when a low-molecular-weight heparin or fondaparinux is given to patients weighing less than 50 kg.
Heparin-induced thrombocytopenia
The other major risk of anticoagulant prophylaxis is heparin-induced thrombocytopenia, an infrequent but life-threatening complication caused by the formation of antibodies to the heparin-derived anticoagulant and a platelet surface antigen. It is associated with moderate thrombocytopenia and an incidence of venous or arterial thrombosis that is over 50%.26
No study has assessed the incidence of heparin-induced thrombocytopenia in long-term care residents. A meta-analysis reported that the risk with anticoagulant prophylaxis was 1.6% with unfractionated heparin (95% confidence interval [CI] 1.2%–2.1%) and 0.6% with low-molecular-weight heparin (95% CI 0.4%–0.9%), and that this risk increased with the duration of prophylaxis.27 If anticoagulant prophylaxis were given to all long-term care residents for extended durations (eg, for the duration of reduced mobility), the incidence and prevalence of heparin-induced thrombocytopenia would likely become a major concern.
Whenever anticoagulant prophylaxis is considered, the risks of both thrombosis and bleeding should be considered. Patients who are receiving anticoagulant prophylaxis should also be monitored for bleeding and heparin-induced thrombocytopenia. This is particularly true in long-term care residents, in whom the risks and benefits of anticoagulant prophylaxis are extrapolated from data from other populations.
MORE RESEARCH IS NEEDED
To date, we lack audits of thromboprophylaxis, clinical practice guidelines, and clear indications and contraindications for anticoagulant prophylaxis in long-term care residents. In the absence of such data, extrapolating the efficacy and safety of thromboprophylaxis from hospitalized patients to long-term care residents is difficult.
Clearly, additional research is needed to identify which long-term care residents would benefit most from thromboprophylaxis. In the meantime, a selective approach to identifying patients who should be considered for thromboprophylaxis should be adopted.
- Cornman JM. Questions for societies with “third age” populations. The Extension-of-Life Working Group, The Gerontological Society of America. Acad Med 1997; 72:856–862.
- Kemper P, Murtaugh CM. Lifetime use of nursing home care. N Engl J Med 1991; 324:595–600.
- Gomes JP, Shaheen WH, Truong SV, Brown EF, Beasley BW, Gajewski BJ. Incidence of venous thromboembolic events among nursing home residents. J Gen Intern Med 2003; 18:934–936.
- Kniffin WD, Baron JA, Barrett J, Birkmeyer JD, Anderson FA. The epidemiology of diagnosed pulmonary embolism and deep venous thrombosis in the elderly. Arch Intern Med 1994; 154:861–866.
- Bounameaux H. Integrating pharmacologic and mechanical prophylaxis of venous thromboembolism. Thromb Haemost 1999; 82:931–937.
- Gross JS, Neufeld RR, Libow LS, Gerber I, Rodstein M. Autopsy study of the elderly institutionalized patient. Review of 234 autopsies. Arch Intern Med 1988; 148:173–176.
- Spyropoulos AC, Merli G. Management of venous thromboembolism in the elderly. Drugs Aging 2006; 23:651–671.
- Punukollu H, Khan IA, Punukollu G, Gowda RM, Mendoza C, Sacchi TJ. Acute pulmonary embolism in elderly: clinical characteristics and outcome. Int J Cardiol 2005; 99:213–216.
- Douketis JD. Prevention of venous thromboembolism in hospitalized medical patients: addressing some practical questions. Curr Opin Pulm Med 2008; 14:381–388.
- Cohen AT, Tapson VF, Bergmann JF, et al; ENDORSE Investigators. Venous thromboembolism risk and prophylaxis in the acute hospital care setting (ENDORSE study): a multinational cross-sectional study. Lancet 2008; 371:387–394.
- Kahn SR, Panju A, Geerts W, et al; CURVE study investigators. Multicenter evaluation of the use of venous thromboembolism prophylaxis in acutely ill medical patients in Canada. Thromb Res 2007; 119:145–155.
- Haas S, Spyropoulos AC. Primary prevention of venous thromboembolism in long-term care: identifying and managing the risk. Clin Appl Thromb Hemost 2008; 14:149–158.
- Geerts WH, Bergqvist D, Pineo GF, et al; American College of Chest Physicians. Prevention of venous thromboembolism: American College of Chest Physicians Evidence-Based Clinical Practice Guidelines (8th Edition). Chest 2008; 133( suppl 6):381S–453S.
- Francis CW. Clinical practice. Prophylaxis for thromboembolism in hospitalized medical patients. N Engl J Med 2007; 356:1438–1444.
- Douketis J, Cook D, Meade M, et al; Canadian Critical Care Trials Group. Prophylaxis against deep vein thrombosis in critically ill patients with severe renal insufficiency with the low-molecular-weight heparin dalteparin: an assessment of safety and pharmacodynamics: the DIRECT study. Arch Intern Med 2008; 168:1805–1812.
- Lobo B, Finch C, Howard A, Minhas S. Fondaparinux for the treatment of patients with acute heparin-induced thrombocytopenia. Thromb Haemost 2008; 99:208–214.
- Spinler SA. New concepts in heparin-induced thrombocytopenia: diagnosis and management. J Thromb Thrombolysis 2006; 21:17–21.
- Hull RD, Schellong SM, Tapson VF, et al. Extended-duration thromboprophylaxis in acutely ill medical patients with recent reduced mobility: methodology for the EXCLAIM study. J Thromb Thrombolysis 2006; 22:31–38.
- Dennis M, Sandercock PA, Reid J, et al; CLOTS Trials Collaboration Effectiveness of thigh-length graduated compression stockings to reduce the risk of deep vein thrombosis after stroke (CLOTS trial 1): a multicentre, randomised controlled trial. Lancet 2009; 373:1958–1965.
- Weill-Engerer S, Meaume S, Lahlou A, et al. Risk factors for deep vein thrombosis in inpatients aged 65 and older: a case-control multicenter study. J Am Geriatr Soc 2004; 52:1299–1304.
- Dentali F, Douketis JD, Gianni M, Lim W, Crowther MA. Meta-analysis: anticoagulant prophylaxis to prevent symptomatic venous thromboembolism in hospitalized medical patients. Ann Intern Med 2007; 146:278–288.
- Douketis JD, Arneklev K, Goldhaber SZ, Spandorfer J, Halperin F, Horrow J. Comparison of bleeding in patients with nonvalvular atrial fibrillation treated with ximelagatran or warfarin: assessment of incidence, case-fatality rate, time course and sites of bleeding, and risk factors for bleeding. Arch Intern Med 2006; 166:853–859.
- Linkins LA, Choi PT, Douketis JD. Clinical impact of bleeding in patients taking oral anticoagulant therapy for venous thromboembolism: a meta-analysis. Ann Intern Med 2003; 139:893–900.
- Lloyd NS, Douketis JD, Moinuddin I, Lim W, Crowther MA. Anticoagulant prophylaxis to prevent asymptomatic deep vein thrombosis in hospitalized medical patients: a systematic review and meta-analysis. J Thromb Haemost 2008; 6:405–414.
- Swedko PJ, Clark HD, Paramsothy K, Akbari A. Serum creatinine is an inadequate screening test for renal failure in elderly patients. Arch Intern Med 2003; 163:356–360.
- Martel N, Lee J, Wells PS. Risk for heparin-induced thrombocytopenia with unfractionated and low-molecular-weight heparin thromboprophylaxis: a meta-analysis. Blood 2005; 106:2710–2715.
- Stein PD, Hull RD, Matta F, Yaekoub AY, Liang J. Incidence of thrombocytopenia in hospitalized patients with venous thromboembolism. Am J Med 2009; 122:919–930.
Randomized trials that included more than 20,000 medical patients have shown that anticoagulant therapy is safe and effective in preventing venous thromboembolism (VTE), ie, deep vein thrombosis and pulmonary embolism.
However, these trials were done in hospitalized patients, who typically had an acute medical illness and who, if eligible, received a short (7- to 10-day) course of anticoagulant prophylaxis.
Little attention has been given to VTE prophylaxis in residents of long-term care facilities. These patients have risk profiles similar to those of hospitalized medical patients. Some of them may have been transferred from an acute care hospital. In addition, most are elderly, and many have reduced mobility and are at risk for illnesses such as stroke and cardiorespiratory insufficiency, which increase the risk of VTE.
VTE in residents of long-term care facilities is a growing concern. By some estimates, by the year 2030 more than 20% of the US population (70.2 million people) will be over 65 years of age.1 Of those who reached age 65 in 1990, an estimated 43% will enter a nursing home at least once before they die—32% for 3 months, 24% for at least a year, and 9% for at least 5 years.2
Against this background, the objectives of this review are to consider:
- The scope of the problem of VTE in long-term care residents
- Why VTE prophylaxis is often overlooked in medical patients
- Evidence—or lack of evidence—for the safety and efficacy of VTE prophylaxis in long-term care residents and other medical patients
- Available options for VTE prophylaxis
- Which long-term care residents should or should not be considered for prophylaxis.
THE TRUE SCOPE OF THE PROBLEM IS UNKNOWN
The incidence of acute VTE among nursing home residents is reported to be 1.3 events per 100 person-years.3 About 8% of cases of pulmonary embolism and 10% of cases of deep venous thrombosis in the elderly are in nursing home residents.4
However, only 20% of patients with VTE have typical symptoms such as leg pain and swelling or acute dyspnea and chest pain, while 80% have no symptoms.5
Furthermore, deep venous thrombosis is more likely to be clinically silent in patients whose mobility is impaired, such as nursing home residents, as the symptoms arising from obstruction of venous flow are more pronounced with walking.
Pulmonary embolism is also underdiagnosed in this group. An autopsy study of 234 nursing home residents found undiagnosed pulmonary embolism to be the cause of death in 8%, and 40% of cases of pulmonary embolism were not suspected before the patient died.6 Yet pulmonary embolism has a higher case-fatality rate in the elderly than in younger patients, particularly when elderly patients have comorbidities.7
A reason why the diagnosis is so often missed is that pulmonary embolism can present atypically in the elderly, with syncope being more common and tachycardia being less common than in younger patients.8
Since so many cases of VTE are clinically silent and most long-term care residents who die do not undergo autopsy, the true scope of VTE as a clinical problem in these patients is unknown. Consequently, the best way to diagnose, prevent, and treat VTE is also unclear.
WHY IS VTE PREVENTION SO OFTEN OVERLOOKED IN MEDICAL PATIENTS?
In general, nonsurgical patients receive suboptimal thromboprophylaxis. National and international chart audits and cross-sectional studies show that only 16% to 33% of hospitalized medical patients at risk for VTE receive appropriate anticoagulant prophylaxis.9 Though no audits in long-term care facilities have been published, the rate of appropriate prophylaxis is likely comparable to or possibly less than that in medical patients in the hospital. In contrast, in surgical patients the rate is much higher—up to 90%.10,11
Why is VTE prophylaxis so underused in medical patients?
One reason is that we do not really know the baseline risk of VTE in medical patients, particularly in those with chronic illness who require long-term care.12 This is relevant because, in the absence of data about patients’ baseline risk, anticoagulant prophylaxis should be ordered selectively, as it poses known risks of bleeding. The risk is greater in elderly people with comorbidities, as are the associated costs.
In addition, relatively few studies have assessed thromboprophylaxis in medical patients, especially in residents of long-term care facilities.
Another reason is that we lack practice guidelines for patients who need long-term care. The well-accepted guidelines from the American College of Chest Physicians (ACCP) cite advanced age and immobility as risk factors for VTE and strongly recommend prophylaxis in acutely ill medical patients who have limited mobility and an additional risk factor such as infection or cancer.13 Though elderly residents of long-term care facilities may share some of these risk factors, the ACCP guidelines make no specific recommendations for this group.
The attitudes of health care professionals may also pose a barrier. Lloyd et al (unpublished data, 2009) surveyed 1,601 health care professionals in Ontario, Canada, in 2007, to assess potential barriers to anticoagulant prophylaxis in hospitalized medical patients. Respondents cited concerns about the risk of bleeding from anticoagulants, lack of clear indications and contraindications for anticoagulant prophylaxis, and lack of time to consider VTE prophylaxis in every patient. (They did not, however, cite disagreement with guidelines or patient discomfort from subcutaneous anticoagulant injections as barriers.) It is reasonable to assume that these attitudes may also pose a problem in long-term care residents.
Finally, no randomized trials have evaluated the efficacy and safety of anticoagulant drugs or mechanical methods of prophylaxis in long-term care residents. Studies have shown that a short course (7–10 days) of an anticoagulant drug effectively prevents VTE in acutely ill patients, but the efficacy of an extended course in patients with chronic illness who require long-term care is not clear. Therefore, recommendations about thromboprophylaxis in long-term care residents should be made with the caveat that they are based on indirect evidence from other patient groups. This is a considerable limitation.
OPTIONS FOR THROMBOPROPHYLAXIS IN LONG-TERM CARE RESIDENTS
Options for thromboprophylaxis fall into two broad categories: anticoagulant drugs and mechanical devices.
Anticoagulant prophylactic drugs
These agents have been assessed in randomized trials in surgical or acutely ill medical patients, although fondaparinux and tinzaparin are not approved for use in medical patients. Furthermore, none of them has been evaluated in residents of long-term care facilities.
The choice of anticoagulant for prophylaxis is determined largely by clinical factors.
Low-molecular-weight heparins are popular both in and out of the hospital because they have predictable pharmacokinetic properties, they come in convenient prefilled syringes, and they can be given once daily. However, some of them may bioaccumulate in patients with impaired renal function, as they are cleared primarily by the kidney.
Unfractionated heparin is likely to be safer in patients with severe renal insufficiency (creatinine clearance < 30 mL/min), as it is cleared via nonrenal mechanisms.
However, a recent single-arm trial of dalteparin 5,000 IU once daily in critically ill patients with severe renal insufficiency found no evidence of an excessive anticoagulant effect or of drug bioaccumulation.15 Dalteparin may thus be an alternative to unfractionated heparin in medical patients with impaired renal function.
Fondaparinux, a newer anticoagulant, is also given once daily. It is the anticoagulant of choice in patients who have had heparin-induced thrombocytopenia because it is not derived from heparin and likely does not cross-react with heparin-induced thrombocytopenia antibodies.16,17
Limited data on benefit of prophylactic anticoagulant drugs
As mentioned, the trials that confirmed the efficacy and safety of anticoagulant prophylaxis were in surgical patients and hospitalized medical patients, not elderly long-term care residents. The poor evidence for anticoagulant prophylaxis in these patients may be strengthened if extended-duration, out-of-hospital prophylaxis were shown to be effective in medical patients. Long-term care residents could more reasonably be compared with medical patients discharged home with a chronic or resolving illness than with those who are hospitalized.
There is some evidence, although with caveats, that extended anticoagulant prophylaxis, started after an acute illness has resolved, confers a benefit. A recent randomized trial compared extended-duration and short-duration prophylaxis (5 weeks vs 10 days) with enoxaparin 40 mg once daily in 4,726 medical patients with impaired mobility.18 The risk of any VTE event was 44% lower with extended-duration prophylaxis (2.8% vs 4.9%; P = .001) and the risk of symptomatic VTE was 73% lower (0.3% vs 1.1%; P = .004), and this benefit persisted 2 months after treatment was stopped (3.0% vs 5.2%; P = .0015). However, extended treatment conferred a fourfold higher risk of major bleeding (0.6% vs 0.15%; P = .019).
These findings should also be considered in terms of absolute benefit and harm. Treating 1,000 patients for 5 weeks instead of 10 days would prevent eight episodes of symptomatic VTE (absolute risk reduction = 0.8%, number needed to treat = 125) at the cost of four to five episodes of major bleeding (absolute risk increase = 0.45%, number needed to harm = 222). This is a modest net therapeutic benefit.
The therapeutic benefit would be greater if we consider all episodes of VTE, both symptomatic and asymptomatic. Treating 1,000 patients for 5 weeks would prevent 20 episodes of symptomatic or asymptomatic VTE (absolute risk reduction = 2.1%, number needed to treat = 48). However, the clinical importance of asymptomatic VTE is questionable.
Given these considerations, if extended-duration anticoagulant prophylaxis is considered, it should be for patients at highest risk to optimize both its net therapeutic benefits and its cost-effectiveness.
Mechanical prophylaxis
Mechanical thromboprophylactic devices—graduated or elastic compression stockings and intermittent pneumatic compression devices—are effective when used by themselves in surgical patients.13 However, in a randomized controlled trial in patients with ischemic stroke, the rate of VTE was 10.0% with graduated compression stockings in addition to “usual care VTE prophylaxis” vs 10.5% with usual care alone, and patients in the stocking group had a fourfold higher risk of developing skin breaks, ulcers, blisters, or necrosis (5% vs 1%; odds ratio 4.18; 95% CI 2.4–7.3).19 Furthermore, improperly fitted stockings, especially those that are thigh-length, can be uncomfortable to wear and difficult to apply.
Overall, the role of mechanical thromboprophylaxis in long-term care facilities is not clear. If it is considered, there should be a compelling reason to use it—for example, for patients at high risk in whom anticoagulants are contraindicated because of ongoing bleeding or a higher risk of bleeding (eg, recent gastrointestinal bleeding, hemorrhagic stroke, coagulopathy, or thrombocytopenia). Furthermore, if stockings are used, they should be properly fitted and routinely monitored for adverse effects, since elderly patients are likely to be most susceptible to skin breakdown.
WHICH LONG-TERM CARE RESIDENTS SHOULD RECEIVE VTE PROPHYLAXIS?
Old age and immobility are not the only risk factors
The current ACCP guidelines suggest considering thromboprophylaxis for hospitalized medical patients over age 75 who cannot walk without assistance.13 However, we lack evidence to suggest a similar strategy in long-term care residents.
The ACCP guidelines are based on data on risk. Nearly 25% of elderly patients with confirmed pulmonary embolism had been immobile prior to their diagnosis.8 In addition, prolonged bed rest (> 14 days) has been reported to be the strongest independent risk factor for symptomatic deep venous thrombosis, increasing the risk more than fivefold.20 Advanced age is also considered a risk factor for VTE, as risk starts to increase at age 40 and doubles each decade of life thereafter.18
No study has assessed the impact of these factors on the risk of VTE in long-term care residents. Since most of such patients are elderly and have impaired mobility, we believe a more selective approach should be used in assigning VTE risk status, one that does not use advanced age and immobility as the only criteria for starting thromboprophylaxis.
Residents of long-term care facilities may be immobile because of underlying illness or disability, such as cognitive impairment, sensory impairment (eg, poor access to corrective lenses and hearing aids), or poor access to assist devices (eg, walkers, canes). In addition, iatrogenic factors that decrease mobility such as indwelling bladder catheters and physical restraints are also common in such patients.
Efforts to improve mobility should be encouraged. However, we recommend that thromboprophylaxis be considered only in patients who have both impaired mobility and an intercurrent acute medical illness such as an acute infection or acute inflammatory disease.13
A related issue is the difference between long-term care residents with a chronic but stable disease and those with acute disease. Patients with acute exacerbations of congestive heart failure or chronic obstructive lung disease may be considered for thromboprophylaxis, as they become more comparable to acutely ill medical patients in whom clinical trials have shown the effectiveness of anticoagulant prophylaxis. On the other hand, patients with these diseases who remain stable may not need prophylaxis.
This approach avoids giving long-term anticoagulant prophylaxis to patients who have irreversible diseases and limits the use of these drugs and devices to higher-risk periods.
Consider thromboprophylaxis if…
- An acute exacerbation of congestive heart failure or chronic obstructive pulmonary disease
- Acute infection (eg, urosepsis, pneumonia, cellulitis, infectious diarrhea)
- An acute exacerbation of an inflammatory disease (eg, rheumatoid arthritis)
- Active cancer (eg, patient receiving radiation therapy or chemotherapy)
- Immobility and prior VTE.
Do not routinely consider prophylaxis if…
We also believe patients should not be routinely considered for anticoagulant VTE prophylaxis if they have:
- Chronic but stable cardiorespiratory disease
- Chronic but stable infectious or inflammatory disease
- Terminal cancer with very limited life expectancy
- Any contraindication to anticoagulants (eg, active bleeding, recent bleeding, coagulopathy, thrombocytopenia).
ANTICOAGULANT PROPHYLAXIS POSES RISKS IN LONG-TERM CARE RESIDENTS
Bleeding is the principal risk
The incidence of clinically important bleeding associated with anticoagulant prophylaxis is 0.2% to 5.6%, and the risk of fatal bleeding is 0.02% to 0.5%.21–24
As no randomized trial has examined anticoagulant prophylaxis in elderly long-term care residents, their bleeding risk with this therapy is unclear. However, older patients are likely to be at higher risk than younger patients because they have more comorbidities, take more drugs that could interact with heparin and potentiate bleeding, and have fragile skin, predisposing to injury from subcutaneous injections.
Also, renal function tends to decline with age. In a retrospective study of 854 outpatients over age 65, 29% had moderate renal insufficiency (creatinine clearance 30–50 mL/min), and 6% had severe renal insufficiency (creatinine clearance < 30 mL/min).25 Recent evidence suggests that some low-molecular-weight heparins (dalteparin and tinzaparin) do not bioaccumulate in patients with impaired renal function. However, enoxaparin and fondaparinux should be used with caution in patients with moderate to severe renal impairment.
Though much attention has recently been paid to increasing anticoagulant doses if the patient is obese, residents of long-term care facilities are more likely to be underweight. Dose adjustment should be considered when a low-molecular-weight heparin or fondaparinux is given to patients weighing less than 50 kg.
Heparin-induced thrombocytopenia
The other major risk of anticoagulant prophylaxis is heparin-induced thrombocytopenia, an infrequent but life-threatening complication caused by the formation of antibodies to the heparin-derived anticoagulant and a platelet surface antigen. It is associated with moderate thrombocytopenia and an incidence of venous or arterial thrombosis that is over 50%.26
No study has assessed the incidence of heparin-induced thrombocytopenia in long-term care residents. A meta-analysis reported that the risk with anticoagulant prophylaxis was 1.6% with unfractionated heparin (95% confidence interval [CI] 1.2%–2.1%) and 0.6% with low-molecular-weight heparin (95% CI 0.4%–0.9%), and that this risk increased with the duration of prophylaxis.27 If anticoagulant prophylaxis were given to all long-term care residents for extended durations (eg, for the duration of reduced mobility), the incidence and prevalence of heparin-induced thrombocytopenia would likely become a major concern.
Whenever anticoagulant prophylaxis is considered, the risks of both thrombosis and bleeding should be considered. Patients who are receiving anticoagulant prophylaxis should also be monitored for bleeding and heparin-induced thrombocytopenia. This is particularly true in long-term care residents, in whom the risks and benefits of anticoagulant prophylaxis are extrapolated from data from other populations.
MORE RESEARCH IS NEEDED
To date, we lack audits of thromboprophylaxis, clinical practice guidelines, and clear indications and contraindications for anticoagulant prophylaxis in long-term care residents. In the absence of such data, extrapolating the efficacy and safety of thromboprophylaxis from hospitalized patients to long-term care residents is difficult.
Clearly, additional research is needed to identify which long-term care residents would benefit most from thromboprophylaxis. In the meantime, a selective approach to identifying patients who should be considered for thromboprophylaxis should be adopted.
- Cornman JM. Questions for societies with “third age” populations. The Extension-of-Life Working Group, The Gerontological Society of America. Acad Med 1997; 72:856–862.
- Kemper P, Murtaugh CM. Lifetime use of nursing home care. N Engl J Med 1991; 324:595–600.
- Gomes JP, Shaheen WH, Truong SV, Brown EF, Beasley BW, Gajewski BJ. Incidence of venous thromboembolic events among nursing home residents. J Gen Intern Med 2003; 18:934–936.
- Kniffin WD, Baron JA, Barrett J, Birkmeyer JD, Anderson FA. The epidemiology of diagnosed pulmonary embolism and deep venous thrombosis in the elderly. Arch Intern Med 1994; 154:861–866.
- Bounameaux H. Integrating pharmacologic and mechanical prophylaxis of venous thromboembolism. Thromb Haemost 1999; 82:931–937.
- Gross JS, Neufeld RR, Libow LS, Gerber I, Rodstein M. Autopsy study of the elderly institutionalized patient. Review of 234 autopsies. Arch Intern Med 1988; 148:173–176.
- Spyropoulos AC, Merli G. Management of venous thromboembolism in the elderly. Drugs Aging 2006; 23:651–671.
- Punukollu H, Khan IA, Punukollu G, Gowda RM, Mendoza C, Sacchi TJ. Acute pulmonary embolism in elderly: clinical characteristics and outcome. Int J Cardiol 2005; 99:213–216.
- Douketis JD. Prevention of venous thromboembolism in hospitalized medical patients: addressing some practical questions. Curr Opin Pulm Med 2008; 14:381–388.
- Cohen AT, Tapson VF, Bergmann JF, et al; ENDORSE Investigators. Venous thromboembolism risk and prophylaxis in the acute hospital care setting (ENDORSE study): a multinational cross-sectional study. Lancet 2008; 371:387–394.
- Kahn SR, Panju A, Geerts W, et al; CURVE study investigators. Multicenter evaluation of the use of venous thromboembolism prophylaxis in acutely ill medical patients in Canada. Thromb Res 2007; 119:145–155.
- Haas S, Spyropoulos AC. Primary prevention of venous thromboembolism in long-term care: identifying and managing the risk. Clin Appl Thromb Hemost 2008; 14:149–158.
- Geerts WH, Bergqvist D, Pineo GF, et al; American College of Chest Physicians. Prevention of venous thromboembolism: American College of Chest Physicians Evidence-Based Clinical Practice Guidelines (8th Edition). Chest 2008; 133( suppl 6):381S–453S.
- Francis CW. Clinical practice. Prophylaxis for thromboembolism in hospitalized medical patients. N Engl J Med 2007; 356:1438–1444.
- Douketis J, Cook D, Meade M, et al; Canadian Critical Care Trials Group. Prophylaxis against deep vein thrombosis in critically ill patients with severe renal insufficiency with the low-molecular-weight heparin dalteparin: an assessment of safety and pharmacodynamics: the DIRECT study. Arch Intern Med 2008; 168:1805–1812.
- Lobo B, Finch C, Howard A, Minhas S. Fondaparinux for the treatment of patients with acute heparin-induced thrombocytopenia. Thromb Haemost 2008; 99:208–214.
- Spinler SA. New concepts in heparin-induced thrombocytopenia: diagnosis and management. J Thromb Thrombolysis 2006; 21:17–21.
- Hull RD, Schellong SM, Tapson VF, et al. Extended-duration thromboprophylaxis in acutely ill medical patients with recent reduced mobility: methodology for the EXCLAIM study. J Thromb Thrombolysis 2006; 22:31–38.
- Dennis M, Sandercock PA, Reid J, et al; CLOTS Trials Collaboration Effectiveness of thigh-length graduated compression stockings to reduce the risk of deep vein thrombosis after stroke (CLOTS trial 1): a multicentre, randomised controlled trial. Lancet 2009; 373:1958–1965.
- Weill-Engerer S, Meaume S, Lahlou A, et al. Risk factors for deep vein thrombosis in inpatients aged 65 and older: a case-control multicenter study. J Am Geriatr Soc 2004; 52:1299–1304.
- Dentali F, Douketis JD, Gianni M, Lim W, Crowther MA. Meta-analysis: anticoagulant prophylaxis to prevent symptomatic venous thromboembolism in hospitalized medical patients. Ann Intern Med 2007; 146:278–288.
- Douketis JD, Arneklev K, Goldhaber SZ, Spandorfer J, Halperin F, Horrow J. Comparison of bleeding in patients with nonvalvular atrial fibrillation treated with ximelagatran or warfarin: assessment of incidence, case-fatality rate, time course and sites of bleeding, and risk factors for bleeding. Arch Intern Med 2006; 166:853–859.
- Linkins LA, Choi PT, Douketis JD. Clinical impact of bleeding in patients taking oral anticoagulant therapy for venous thromboembolism: a meta-analysis. Ann Intern Med 2003; 139:893–900.
- Lloyd NS, Douketis JD, Moinuddin I, Lim W, Crowther MA. Anticoagulant prophylaxis to prevent asymptomatic deep vein thrombosis in hospitalized medical patients: a systematic review and meta-analysis. J Thromb Haemost 2008; 6:405–414.
- Swedko PJ, Clark HD, Paramsothy K, Akbari A. Serum creatinine is an inadequate screening test for renal failure in elderly patients. Arch Intern Med 2003; 163:356–360.
- Martel N, Lee J, Wells PS. Risk for heparin-induced thrombocytopenia with unfractionated and low-molecular-weight heparin thromboprophylaxis: a meta-analysis. Blood 2005; 106:2710–2715.
- Stein PD, Hull RD, Matta F, Yaekoub AY, Liang J. Incidence of thrombocytopenia in hospitalized patients with venous thromboembolism. Am J Med 2009; 122:919–930.
KEY POINTS
- Assessment of VTE risk and consideration of need for anticoagulant prophylaxis in long-term care residents are based on indirect data, derived primarily from studies of acutely ill hospitalized medical patients.
- Drugs and devices for thromboprophylaxis have been studied in medical and surgical populations, but issues of efficacy and safety are likely to also pertain to long-term care residents.
- Thromboprophylaxis should be considered for long-term care residents if they are definitely at increased risk of VTE—ie, if they have an acute exacerbation of congestive heart failure or chronic obstructive pulmonary disease; acute inflammatory disease; acute infection; active cancer; or immobility and prior VTE.
A 40-year-old man with spells of generalized weakness and paresthesias
A 40-year-old man who works as a roofer began, 1 week ago, to experience episodes of generalized weakness, perioral numbness, and diffuse paresthesias. In the past he has had recurring nosebleeds but no history of other medical conditions.
His recent “spells” come on abruptly and spontaneously, without warning, and last about 15 minutes. He never loses consciousness, but he reports a feeling of derealization or an out-of-body experience—he can hear the people around him talking during the spells, but he feels that everything is far away. He has been having about three episodes per day. They typically occur after mild exertion or heavy lifting, and each episode resolves with complete rest. He has had no nausea, vomiting, loss of bowel or bladder control, fever, chills, or traumatic brain injury.
The patient first reported to the emergency department of a local hospital for evaluation. There, he underwent computed tomography (CT) of the head without contrast, which showed nothing abnormal. However, he had an episode while in the emergency department, which prompted his physician to admit him to the hospital.
In the hospital, he underwent an extensive medical evaluation. CT angiography revealed no evidence of vasculitis or occlusive disease. Results of electroencephalography during these spells were normal. Results of magnetic resonance imaging of the cervical and lumbar spine were also normal.
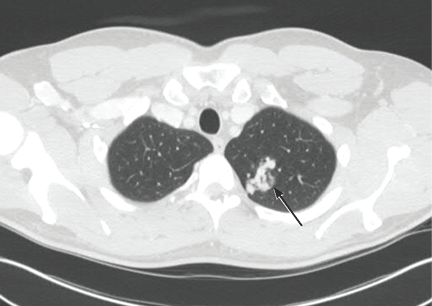
A neurologist was consulted. Concerned that the spells were due to paradoxical emboli coming through a patent foramen ovale, the neurologist recommended transthoracic echocardiography with agitated saline. This study showed a normal ejection fraction and a right-to-left shunt through a left pulmonary arteriovenous malformation (AVM). Unfortunately, the shunt fraction could not be estimated because the patient had another episode during the procedure, and so the procedure was cut short. CT of the chest confirmed a large AVM in the upper lobe of the left lung (Figure 1).
The patient is transferred
The patient’s physician requested that he be transferred to Mayo Clinic for further evaluation.

When he arrived, we performed a complete physical examination, in which we noted scattered erythematous maculopapular telangiectases in the lower lips and significant digital clubbing (Figure 2). He could not recall any family members having rheumatologic or cardiovascular diseases, but he recalled that his father has oral telangiectases and recurrent epistaxis.
His examination was interrupted by yet another spell, during which his oxygen saturation fell to 85%. We immediately started giving him oxygen by nasal cannula, which raised his oxygen saturation to 96%, and the spell promptly ended.
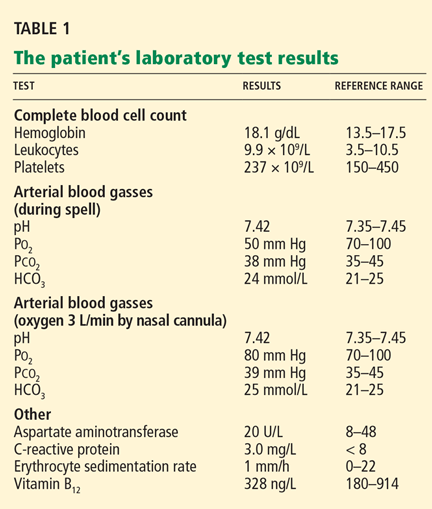
After his physical examination was completed and his records from the other hospital were reviewed, a diagnosis was made. No further diagnostic studies were pursued.
WHICH IS THE MOST LIKELY DIAGNOSIS?
1. Based on the information available, which of the following is the most likely diagnosis?
- Generalized tonic-clonic seizures
- Osler-Weber-Rendu disease
- Subarachnoid hemorrhage
- Conversion disorder
- Atrial septal defect
Generalized tonic-clonic seizures begin with abrupt loss of consciousness, followed by stiffening of the body and extremities. This is the tonic phase, which may last for 1 minute. The clonic phase follows, characterized by abnormal jerking and teeth-clenching (raising the concern that the patient will bite his or her tongue). The clonic phase lasts 1 to 2 minutes. After a seizure, confusion and headache are common. On electroencephalography, epileptiform abnormalities are documented in about 23% of patients with a first documented seizure.1
Our patient’s history of remaining fully conscious and of having normal electroencephalographic findings during his spells does not suggest generalized tonic-clonic seizures.
Osler-Weber-Rendu disease is also known as hereditary hemorrhagic telangiectasia (HHT). Its pathophysiology is complex, and it is believed to be related to mutations in an endothelial protein2 that lead to abnormal vascular structures. The estimated prevalence in European studies is 1 in 5,000; in Japanese studies it is 1 in 8,000.3–4
The diagnosis of HHT is based on four clinical criteria:
- Spontaneous and recurrent epistaxis
- Multiple mucocutaneous telangiectases
- Pulmonary, cerebral, or gastrointestinal AVMs
- A first-degree relative with the disease.
The presence of three or four of these criteria establishes a “definite” diagnosis, while fewer than two makes it “unlikely.”5 Since the spectrum of this disease is wide, varying from mild epistaxis to iron-deficiency anemia, its diagnosis is often missed.6
Our patient meets at least three of the criteria—recurrent epistaxis, oral telangiectases, and a CT-documented pulmonary AVM. His father has a history of oral telangiectases and epistaxis but was never formally diagnosed with HHT. The patient presented with spells of weakness and paresthesias from worsening hypoxemia due to an enlarged pulmonary AVM. Thus, based on these features, HHT is the most likely diagnosis.
Subarachnoid hemorrhage is commonly from a ruptured cerebral aneurysm. Common symptoms include sudden, severe headaches with focal neurologic deficits, a stiff neck, brief loss of consciousness, nausea, and vomiting.7
Our patient’s CT scan showed no intracranial bleeding, and CT angiography showed no evidence of aneurysm. Thus, he has neither clinical nor radiographic features of subarachnoid hemorrhage.
Conversion disorder is typically associated with psychological stressors.8 It is characterized by the sudden onset of neurologic deficits such as blindness, paralysis, and numbness that cannot be explained by a general medical condition.
Our patient has a known pulmonary AVM with clinical and laboratory findings of hypoxemia that explain his spells. Therefore, the diagnosis of conversion disorder cannot be made.
A right-to-left intracardiac shunt can be present in patients with patent foramen ovale, atrial septal defects with shunt reversal, Eisenmenger syndrome, or tetralogy of Fallot (even in adults). It can present with hypoxemia and neurologic weakness.
Our patient’s echocardiogram ruled out these conditions.
MANIFESTATIONS OF HEREDITARY HEMORRHAGIC TELANGIECTASIA
2. Which is the most common clinical manifestation of HHT?
- Epistaxis
- Mucocutaneous telangiectases
- Hematochezia
- Dyspnea
Epistaxis is the most common presentation, occurring in more than 90% of patients.9 Many patients experience only mild occasional nosebleeds that are not frequent or severe enough to cause anemia or to lead to medical treatment or consultation. Others, however, have heavy, frequent bleeding that requires invasive interventions.10
Mucocutaneous telangiectases are the second most common clinical manifestation, documented in about 75% of patients. They are cosmetically unpleasant but rarely bleed. They occur most commonly on the face, lips, tongue, and fingertips, and they increase in size and number with age.11
Gastrointestinal bleeding, sometimes manifesting as hematochezia, occurs in one-third of people with HHT. It most commonly presents with iron-deficiency anemia in patients over age 40.12
Dyspnea. Pulmonary AVMs occur in 30% to 50% of affected people, but interestingly, most patients with pulmonary AVMs have no respiratory symptoms, including dyspnea.
In pulmonary AVMs, abnormal vessels replace normal capillary beds, creating a capillary-free communication between the pulmonary and systemic circulations. This abnormal connection prevents blood from the pulmonary arterial system from being oxygenated, resulting in hypoxemia and secondary polycythemia, as in our patient. One-third of patients have evidence of right-to-left shunting, such as the clubbing in our patient.9,13
Other, less common complications of HHT include seizures or hemorrhage from cerebral AVMs and stroke and brain abscesses from paradoxical embolization due to the loss of the capillary filter in the pulmonary vascular bed. Hepatic involvement may result in portal hypertension and hepatic encephalopathy.14
Back to our patient
As mentioned above, during one of the patient’s spells of paresthesia and weakness, we noted his oxygen saturation by oximetry was 85%. At that time, his arterial Po2 was also low at 50 mm Hg (normal 70–100). With oxygen supplementation, his spell completely resolved and his Po2 improved to 80 mm Hg. Though the shunt fraction of his pulmonary AVM was never measured, it was likely less than 30% of the cardiac output, as his hypoxemia improved with oxygen supplementation alone.15 When he was taken off oxygen supplementation, his spells recurred, but with oxygen support he remained clinically stable.
MANAGEMENT
3. Which is the next logical step in our patient’s management?
- Consult a surgeon for lobectomy
- Consult an interventional radiologist for embolization therapy
- Transfer to the intensive care unit for elective intubation
- Observe with close follow-up
Untreated pulmonary AVMs enlarge at an estimated rate of 0.3 mm/year. The estimated death rate is up to 15.8% per year, with most deaths resulting from stroke, cerebral abscess, hemoptysis, and hemothorax.16–18 Common indications for treatment are progressively enlarging lesions, symptomatic hypoxemia, and paradoxical embolization.19 Pulmonary AVMs in which the feeding artery is 3 mm or more in diameter require treatment.
Embolization therapy, in which the AVM is occluded angiographically, is considered a first-line treatment for pulmonary AVM, with a procedural success rate (defined as involution of the AVM) of 97%.20 Embolization therapy allows patients to avoid major surgery, with its potential complications, and it has a shorter recovery time.
Surgical procedures such as excision, vascular ligation, or lobectomy can be considered if the lesion cannot be treated by embolization or if the patient has an anaphylactic allergy to contrast dyes.
This patient had no clinical signs of impending respiratory failure requiring elective intubation.
Since he was experiencing symptoms, there is no role for observation in this case.
Back to our patient
An interventional radiologist was consulted, and the patient underwent bilateral pulmonary artery angiography with successful coil embolization of his large left-upper-lobe AVM. He was weaned off oxygen and had no further spells of generalized weakness and paresthesias.
Given his father’s history of recurrent epistaxis and oral telangiectases, the patient asks about the risk of his children acquiring this disease.
GENETICS OF HEREDITARY HEMORRHAGIC TELANGIECTASIA
4. Which of the following is the inheritance pattern for HHT?
- Autosomal dominant
- Autosomal recessive
- Maternal inheritance
- X-linked recessive
The inheritance pattern is autosomal dominant with variable expression and penetrance. At least four different mutations have been identified in genes on chromosomes 9 and 12 that result in abnormal vascular malformations.21–24 The other modes of inheritance have not been described in HHT.
RECOMMENDATIONS FOR OUR PATIENT
5. Which of the following is not recommended for our patient?
- Consideration of genetic testing
- Consideration of screening of first-degree relatives
- Dental prophylaxis
- Scuba diving
Genetic testing. The molecular diagnosis of HHT is primarily based on sequencing of the entire coding regions of the ENG and ALK1 genes on chromosomes 9 and 12, respectively. The interpretation of these results is quite complex. The clinical genetics laboratories in North America that currently offer molecular diagnostic testing for HHT recommend that testing be coordinated and ordered through a center that specializes in this disease or by a genetics professional. Testing of the index case is performed to confirm the clinical diagnosis and also to determine if genetic testing will be possible in at-risk relatives. Further genetic testing should be pursued in at-risk family members only if the index case has a positive result.25
Screening of relatives. Given that HHT is an autosomal dominant disease, the current practice is to offer molecular genetic screening early in life for first-degree relatives.25,26 The external signs such as telangiectases and nosebleeds may not manifest until the second or third decade of life. However, AVMs in the brain, spinal cord, lungs, and liver are usually congenital and may present suddenly and with serious complications, even in childhood.
Dental prophylaxis. People with HHT and a pulmonary AVM are at risk of bacteremia and consequent brain abscesses after dental procedures. Antibiotic prophylaxis is therefore highly recommended.27
One sport to avoid. There have been several case reports of paradoxical air emboli occurring in patients with HHT complicated by a pulmonary AVM. Hsu et al28 reported a 31-year-old man with an undiagnosed large pulmonary AVM and HHT who became comatose with diffuse bilateral hemispheric brain swelling on head CT after scuba diving, due to air embolism.
The HHT Foundation International recommends that people with this disease avoid scuba diving (the only sport to be avoided) owing to the risk of air emboli from small lung AVMs. It also recommends that patients alert health care providers about their risk of air embolism whenever intravenous access is being established.
Back to our patient
The patient met with a geneticist, and blood was collected for genetic testing before he was sent home. Additionally, the need to screen his first-degree relatives was thoroughly discussed. Four days after discharge he returned to work, and his spells have not recurred. He has a follow-up appointment scheduled with a pulmonologist specializing in this disease for the results of genetic testing and for continued management.
TAKE-HOME POINTS
- The diagnosis of HHT is based on the following four clinical criteria: spontaneous or recurrent epistaxis, multiple mucocutaneous telangiectases, visceral involvement (eg, cerebral, pulmonary, or gastrointestinal AVM), and a first-degree relative with this disease.
- The diagnosis may be confirmed with genetic testing.
- The diagnosis may be underreported, given the wide spectrum of disease presentation, from inconsequential epistaxis to massive gastrointestinal bleeding.
- HHT is autosomal dominant, and therefore all first-degree relatives should be screened.
- Krumholz A, Wiebe S, Gronseth G, et al. Practice parameter: evaluating an apparent unprovoked first seizure in adults (an evidence-based review): report of the Quality Standards Subcommittee of the American Academy of Neurology and the American Epilepsy Society. Neurology 2007; 69:1996–2007.
- Bourdeau A, Dumont DJ, Letarte M. A murine model of hereditary hemorrhagic telangiectasia. J Clin Invest 1999; 104:1343–1351.
- Dakeishi M, Shioya T, Wada Y, et al. Genetic epidemiology of hereditary hemorrhagic telangiectasia in a local community in the northern part of Japan. Hum Mutat 2002; 19:140–148.
- Guttmacher AE, Marchuk DA, White RI. Hereditary hemorrhagic telangiectasia. N Engl J Med 1995; 333:918–924.
- Shovlin CL, Guttmacher AE, Buscarini E, et al. Diagnostic criteria for hereditary hemorrhagic telangiectasia (Rendu-Osler-Weber syndrome). Am J Med Genet 2000; 91:66–67.
- Gallitelli M, Pasculli G, Fiore T, Carella A, Sabbà C. Emergencies in hereditary haemorrhagic telangiectasia. QJM 2006; 99:15–22.
- Gorelick PB, Hier DB, Caplan LR, Langenberg P. Headache in acute cerebrovascular disease. Neurology 1986; 36:1445–1450.
- Stonnington CM, Barry JJ, Fisher RS. Conversion disorder. Am J Psychiatry 2006; 163:1510–1517.
- Shovlin CL, Letarte M. Hereditary hemorrhagic telangiectasia and pulmonary arteriovenous malformations: issues in clinical management and review of pathogenic mechanisms. Thorax 1999; 54:714–729.
- AAssar OS, Friedman CM, White RI. The natural history of epistaxis in hereditary hemorrhagic telangiectasia. Laryngoscope 1991; 101:977–980.
- McAllister KA, Lennon F, Bowles-Biesecker B, et al. Genetic heterogenicity in hereditary haemorrhagic telangiectasia: possible correlation with clinical phenotype. J Med Genet 1994; 31:927–932.
- Plauchu H, de Chadarevian JP, Bideau A, Robert JM. Age-related clinical profile of hereditary hemorrhagic telangiectasia in an epidemiologically recruited population. Am J Med Genet 1989; 32:291–297.
- Shovlin CL, Jaskson JE, Bamford KB, et al. Primary determinants of ischaemic stroke/brain abscess risks are independent of severity of pulmonary arteriovenous malformations in hereditary haemorrhagic telangiectasia. Thorax 2008; 63:259–266.
- Garcia-Tsao G, Korzenik JR, Young L, et al. Liver disease in patients with hereditary hemorrhagic telangiectasia. N Engl J Med 2000; 343:931–936.
- Kolleft MH, Micek ST. Critical care. In:Cooper DH, Krainik AJ, Lubner SJ, Reno HEL, editors. Washington Manual of Medical Therapeutics. 32nd ed. Philadelphia: Lippincott Williams & Wilkins, 2007:224–230.
- Swanson KL, Prakash UB, Stanson AW. Pulmonary arteriovenous fistulas: Mayo Clinic experience: 1872–1997. Mayo Clin Proc 1999; 74:671–680.
- Dines DE, Arms RA, Bernatz PE, Gomes MR. Pulmonary arteriovenous fistulas. Mayo Clinic Proc 1974; 49:460–465.
- Sluiter-Eringa H, Orie NG, Sluiter HJ. Pulmonary arteriovenous fistula: diagnosis and prognosis in noncompliant patients. Am Rev Respir Dis 1969; 100:177–188.
- Dines DE, Seward JB, Bernatz PE. Pulmonary arteriovenous fistula. Mayo Clin Proc 1983; 58:176–181.
- Pollak JS, Saluja S, Thabet A, Henderson KJ, Denbow N, White RI. Clinical and anatomic outcomes after embolotherapy of pulmonary arteriovenous malformations. J Vasc Interv Radio 2006; 17:35–44.
- Berg JN, Gallion CJ, Stenzel TT, et al. The activin receptor-like kinase 1 gene: genomic structure and mutations in hereditary hemorrhagic telangiectasia type 2. Am J Hum Genet 1997; 61:60–67.
- McAllister KA, Grogg KM, Johnson DW, et al. Endoglin, a TGF-beta binding protein of endothelial cells, is the gene for hereditary hemorrhagic telangiectasias type 1. Nat Genet 1994; 8:345–351.
- Johnson DW, Berg JN, Baldwin MA, et al. Mutations in the activin receptor-like kinase gene in hereditary haemorrhagic telangeictasia type 2. Nat Genet 1996; 13:189–195.
- Abdalla SA, Letarte M. Hereditary haemorrhagic telangiectasia: current views on genetics and mechanisms of disease. J Med Genet 2006; 43:97–110.
- Bayrak-Toydemir P, Mao R, Lewin S, McDonald J. Hereditary hemorrhagic telangiectasia: an overview of diagnosis and management in the molecular era for clinicians. Genet Med 2004; 6:175–191.
- Cohen JH, Faughnan ME, Letarte M, Vandezande K, Kennedy SJ, Krahn MD. Cost comparison of genetic and clinical screening in families with hereditary hemorrhagic telangiectasia. Am J Med Genet A 2005; 137:153–160.
- Shovlin C, Bamfort K, Wray D. Post-NICE 2008: Antibiotic prophylaxis prior to dental procedures for patients with pulmonary arteriovenous malformations (PAVMs) and hereditary haemorrhagic telangiectasia. Br Dent J 2008; 205:531–533.
- Hsu YL, Wang HC, Yang PC. Desbaric air embolism during diving: an unusual complication of Osler-Weber-Rendu disease. Br J Sports Med 2004; 38:E6.
A 40-year-old man who works as a roofer began, 1 week ago, to experience episodes of generalized weakness, perioral numbness, and diffuse paresthesias. In the past he has had recurring nosebleeds but no history of other medical conditions.
His recent “spells” come on abruptly and spontaneously, without warning, and last about 15 minutes. He never loses consciousness, but he reports a feeling of derealization or an out-of-body experience—he can hear the people around him talking during the spells, but he feels that everything is far away. He has been having about three episodes per day. They typically occur after mild exertion or heavy lifting, and each episode resolves with complete rest. He has had no nausea, vomiting, loss of bowel or bladder control, fever, chills, or traumatic brain injury.
The patient first reported to the emergency department of a local hospital for evaluation. There, he underwent computed tomography (CT) of the head without contrast, which showed nothing abnormal. However, he had an episode while in the emergency department, which prompted his physician to admit him to the hospital.
In the hospital, he underwent an extensive medical evaluation. CT angiography revealed no evidence of vasculitis or occlusive disease. Results of electroencephalography during these spells were normal. Results of magnetic resonance imaging of the cervical and lumbar spine were also normal.
A neurologist was consulted. Concerned that the spells were due to paradoxical emboli coming through a patent foramen ovale, the neurologist recommended transthoracic echocardiography with agitated saline. This study showed a normal ejection fraction and a right-to-left shunt through a left pulmonary arteriovenous malformation (AVM). Unfortunately, the shunt fraction could not be estimated because the patient had another episode during the procedure, and so the procedure was cut short. CT of the chest confirmed a large AVM in the upper lobe of the left lung (Figure 1).
The patient is transferred
The patient’s physician requested that he be transferred to Mayo Clinic for further evaluation.
When he arrived, we performed a complete physical examination, in which we noted scattered erythematous maculopapular telangiectases in the lower lips and significant digital clubbing (Figure 2). He could not recall any family members having rheumatologic or cardiovascular diseases, but he recalled that his father has oral telangiectases and recurrent epistaxis.
His examination was interrupted by yet another spell, during which his oxygen saturation fell to 85%. We immediately started giving him oxygen by nasal cannula, which raised his oxygen saturation to 96%, and the spell promptly ended.
After his physical examination was completed and his records from the other hospital were reviewed, a diagnosis was made. No further diagnostic studies were pursued.
WHICH IS THE MOST LIKELY DIAGNOSIS?
1. Based on the information available, which of the following is the most likely diagnosis?
- Generalized tonic-clonic seizures
- Osler-Weber-Rendu disease
- Subarachnoid hemorrhage
- Conversion disorder
- Atrial septal defect
Generalized tonic-clonic seizures begin with abrupt loss of consciousness, followed by stiffening of the body and extremities. This is the tonic phase, which may last for 1 minute. The clonic phase follows, characterized by abnormal jerking and teeth-clenching (raising the concern that the patient will bite his or her tongue). The clonic phase lasts 1 to 2 minutes. After a seizure, confusion and headache are common. On electroencephalography, epileptiform abnormalities are documented in about 23% of patients with a first documented seizure.1
Our patient’s history of remaining fully conscious and of having normal electroencephalographic findings during his spells does not suggest generalized tonic-clonic seizures.
Osler-Weber-Rendu disease is also known as hereditary hemorrhagic telangiectasia (HHT). Its pathophysiology is complex, and it is believed to be related to mutations in an endothelial protein2 that lead to abnormal vascular structures. The estimated prevalence in European studies is 1 in 5,000; in Japanese studies it is 1 in 8,000.3–4
The diagnosis of HHT is based on four clinical criteria:
- Spontaneous and recurrent epistaxis
- Multiple mucocutaneous telangiectases
- Pulmonary, cerebral, or gastrointestinal AVMs
- A first-degree relative with the disease.
The presence of three or four of these criteria establishes a “definite” diagnosis, while fewer than two makes it “unlikely.”5 Since the spectrum of this disease is wide, varying from mild epistaxis to iron-deficiency anemia, its diagnosis is often missed.6
Our patient meets at least three of the criteria—recurrent epistaxis, oral telangiectases, and a CT-documented pulmonary AVM. His father has a history of oral telangiectases and epistaxis but was never formally diagnosed with HHT. The patient presented with spells of weakness and paresthesias from worsening hypoxemia due to an enlarged pulmonary AVM. Thus, based on these features, HHT is the most likely diagnosis.
Subarachnoid hemorrhage is commonly from a ruptured cerebral aneurysm. Common symptoms include sudden, severe headaches with focal neurologic deficits, a stiff neck, brief loss of consciousness, nausea, and vomiting.7
Our patient’s CT scan showed no intracranial bleeding, and CT angiography showed no evidence of aneurysm. Thus, he has neither clinical nor radiographic features of subarachnoid hemorrhage.
Conversion disorder is typically associated with psychological stressors.8 It is characterized by the sudden onset of neurologic deficits such as blindness, paralysis, and numbness that cannot be explained by a general medical condition.
Our patient has a known pulmonary AVM with clinical and laboratory findings of hypoxemia that explain his spells. Therefore, the diagnosis of conversion disorder cannot be made.
A right-to-left intracardiac shunt can be present in patients with patent foramen ovale, atrial septal defects with shunt reversal, Eisenmenger syndrome, or tetralogy of Fallot (even in adults). It can present with hypoxemia and neurologic weakness.
Our patient’s echocardiogram ruled out these conditions.
MANIFESTATIONS OF HEREDITARY HEMORRHAGIC TELANGIECTASIA
2. Which is the most common clinical manifestation of HHT?
- Epistaxis
- Mucocutaneous telangiectases
- Hematochezia
- Dyspnea
Epistaxis is the most common presentation, occurring in more than 90% of patients.9 Many patients experience only mild occasional nosebleeds that are not frequent or severe enough to cause anemia or to lead to medical treatment or consultation. Others, however, have heavy, frequent bleeding that requires invasive interventions.10
Mucocutaneous telangiectases are the second most common clinical manifestation, documented in about 75% of patients. They are cosmetically unpleasant but rarely bleed. They occur most commonly on the face, lips, tongue, and fingertips, and they increase in size and number with age.11
Gastrointestinal bleeding, sometimes manifesting as hematochezia, occurs in one-third of people with HHT. It most commonly presents with iron-deficiency anemia in patients over age 40.12
Dyspnea. Pulmonary AVMs occur in 30% to 50% of affected people, but interestingly, most patients with pulmonary AVMs have no respiratory symptoms, including dyspnea.
In pulmonary AVMs, abnormal vessels replace normal capillary beds, creating a capillary-free communication between the pulmonary and systemic circulations. This abnormal connection prevents blood from the pulmonary arterial system from being oxygenated, resulting in hypoxemia and secondary polycythemia, as in our patient. One-third of patients have evidence of right-to-left shunting, such as the clubbing in our patient.9,13
Other, less common complications of HHT include seizures or hemorrhage from cerebral AVMs and stroke and brain abscesses from paradoxical embolization due to the loss of the capillary filter in the pulmonary vascular bed. Hepatic involvement may result in portal hypertension and hepatic encephalopathy.14
Back to our patient
As mentioned above, during one of the patient’s spells of paresthesia and weakness, we noted his oxygen saturation by oximetry was 85%. At that time, his arterial Po2 was also low at 50 mm Hg (normal 70–100). With oxygen supplementation, his spell completely resolved and his Po2 improved to 80 mm Hg. Though the shunt fraction of his pulmonary AVM was never measured, it was likely less than 30% of the cardiac output, as his hypoxemia improved with oxygen supplementation alone.15 When he was taken off oxygen supplementation, his spells recurred, but with oxygen support he remained clinically stable.
MANAGEMENT
3. Which is the next logical step in our patient’s management?
- Consult a surgeon for lobectomy
- Consult an interventional radiologist for embolization therapy
- Transfer to the intensive care unit for elective intubation
- Observe with close follow-up
Untreated pulmonary AVMs enlarge at an estimated rate of 0.3 mm/year. The estimated death rate is up to 15.8% per year, with most deaths resulting from stroke, cerebral abscess, hemoptysis, and hemothorax.16–18 Common indications for treatment are progressively enlarging lesions, symptomatic hypoxemia, and paradoxical embolization.19 Pulmonary AVMs in which the feeding artery is 3 mm or more in diameter require treatment.
Embolization therapy, in which the AVM is occluded angiographically, is considered a first-line treatment for pulmonary AVM, with a procedural success rate (defined as involution of the AVM) of 97%.20 Embolization therapy allows patients to avoid major surgery, with its potential complications, and it has a shorter recovery time.
Surgical procedures such as excision, vascular ligation, or lobectomy can be considered if the lesion cannot be treated by embolization or if the patient has an anaphylactic allergy to contrast dyes.
This patient had no clinical signs of impending respiratory failure requiring elective intubation.
Since he was experiencing symptoms, there is no role for observation in this case.
Back to our patient
An interventional radiologist was consulted, and the patient underwent bilateral pulmonary artery angiography with successful coil embolization of his large left-upper-lobe AVM. He was weaned off oxygen and had no further spells of generalized weakness and paresthesias.
Given his father’s history of recurrent epistaxis and oral telangiectases, the patient asks about the risk of his children acquiring this disease.
GENETICS OF HEREDITARY HEMORRHAGIC TELANGIECTASIA
4. Which of the following is the inheritance pattern for HHT?
- Autosomal dominant
- Autosomal recessive
- Maternal inheritance
- X-linked recessive
The inheritance pattern is autosomal dominant with variable expression and penetrance. At least four different mutations have been identified in genes on chromosomes 9 and 12 that result in abnormal vascular malformations.21–24 The other modes of inheritance have not been described in HHT.
RECOMMENDATIONS FOR OUR PATIENT
5. Which of the following is not recommended for our patient?
- Consideration of genetic testing
- Consideration of screening of first-degree relatives
- Dental prophylaxis
- Scuba diving
Genetic testing. The molecular diagnosis of HHT is primarily based on sequencing of the entire coding regions of the ENG and ALK1 genes on chromosomes 9 and 12, respectively. The interpretation of these results is quite complex. The clinical genetics laboratories in North America that currently offer molecular diagnostic testing for HHT recommend that testing be coordinated and ordered through a center that specializes in this disease or by a genetics professional. Testing of the index case is performed to confirm the clinical diagnosis and also to determine if genetic testing will be possible in at-risk relatives. Further genetic testing should be pursued in at-risk family members only if the index case has a positive result.25
Screening of relatives. Given that HHT is an autosomal dominant disease, the current practice is to offer molecular genetic screening early in life for first-degree relatives.25,26 The external signs such as telangiectases and nosebleeds may not manifest until the second or third decade of life. However, AVMs in the brain, spinal cord, lungs, and liver are usually congenital and may present suddenly and with serious complications, even in childhood.
Dental prophylaxis. People with HHT and a pulmonary AVM are at risk of bacteremia and consequent brain abscesses after dental procedures. Antibiotic prophylaxis is therefore highly recommended.27
One sport to avoid. There have been several case reports of paradoxical air emboli occurring in patients with HHT complicated by a pulmonary AVM. Hsu et al28 reported a 31-year-old man with an undiagnosed large pulmonary AVM and HHT who became comatose with diffuse bilateral hemispheric brain swelling on head CT after scuba diving, due to air embolism.
The HHT Foundation International recommends that people with this disease avoid scuba diving (the only sport to be avoided) owing to the risk of air emboli from small lung AVMs. It also recommends that patients alert health care providers about their risk of air embolism whenever intravenous access is being established.
Back to our patient
The patient met with a geneticist, and blood was collected for genetic testing before he was sent home. Additionally, the need to screen his first-degree relatives was thoroughly discussed. Four days after discharge he returned to work, and his spells have not recurred. He has a follow-up appointment scheduled with a pulmonologist specializing in this disease for the results of genetic testing and for continued management.
TAKE-HOME POINTS
- The diagnosis of HHT is based on the following four clinical criteria: spontaneous or recurrent epistaxis, multiple mucocutaneous telangiectases, visceral involvement (eg, cerebral, pulmonary, or gastrointestinal AVM), and a first-degree relative with this disease.
- The diagnosis may be confirmed with genetic testing.
- The diagnosis may be underreported, given the wide spectrum of disease presentation, from inconsequential epistaxis to massive gastrointestinal bleeding.
- HHT is autosomal dominant, and therefore all first-degree relatives should be screened.
- Krumholz A, Wiebe S, Gronseth G, et al. Practice parameter: evaluating an apparent unprovoked first seizure in adults (an evidence-based review): report of the Quality Standards Subcommittee of the American Academy of Neurology and the American Epilepsy Society. Neurology 2007; 69:1996–2007.
- Bourdeau A, Dumont DJ, Letarte M. A murine model of hereditary hemorrhagic telangiectasia. J Clin Invest 1999; 104:1343–1351.
- Dakeishi M, Shioya T, Wada Y, et al. Genetic epidemiology of hereditary hemorrhagic telangiectasia in a local community in the northern part of Japan. Hum Mutat 2002; 19:140–148.
- Guttmacher AE, Marchuk DA, White RI. Hereditary hemorrhagic telangiectasia. N Engl J Med 1995; 333:918–924.
- Shovlin CL, Guttmacher AE, Buscarini E, et al. Diagnostic criteria for hereditary hemorrhagic telangiectasia (Rendu-Osler-Weber syndrome). Am J Med Genet 2000; 91:66–67.
- Gallitelli M, Pasculli G, Fiore T, Carella A, Sabbà C. Emergencies in hereditary haemorrhagic telangiectasia. QJM 2006; 99:15–22.
- Gorelick PB, Hier DB, Caplan LR, Langenberg P. Headache in acute cerebrovascular disease. Neurology 1986; 36:1445–1450.
- Stonnington CM, Barry JJ, Fisher RS. Conversion disorder. Am J Psychiatry 2006; 163:1510–1517.
- Shovlin CL, Letarte M. Hereditary hemorrhagic telangiectasia and pulmonary arteriovenous malformations: issues in clinical management and review of pathogenic mechanisms. Thorax 1999; 54:714–729.
- AAssar OS, Friedman CM, White RI. The natural history of epistaxis in hereditary hemorrhagic telangiectasia. Laryngoscope 1991; 101:977–980.
- McAllister KA, Lennon F, Bowles-Biesecker B, et al. Genetic heterogenicity in hereditary haemorrhagic telangiectasia: possible correlation with clinical phenotype. J Med Genet 1994; 31:927–932.
- Plauchu H, de Chadarevian JP, Bideau A, Robert JM. Age-related clinical profile of hereditary hemorrhagic telangiectasia in an epidemiologically recruited population. Am J Med Genet 1989; 32:291–297.
- Shovlin CL, Jaskson JE, Bamford KB, et al. Primary determinants of ischaemic stroke/brain abscess risks are independent of severity of pulmonary arteriovenous malformations in hereditary haemorrhagic telangiectasia. Thorax 2008; 63:259–266.
- Garcia-Tsao G, Korzenik JR, Young L, et al. Liver disease in patients with hereditary hemorrhagic telangiectasia. N Engl J Med 2000; 343:931–936.
- Kolleft MH, Micek ST. Critical care. In:Cooper DH, Krainik AJ, Lubner SJ, Reno HEL, editors. Washington Manual of Medical Therapeutics. 32nd ed. Philadelphia: Lippincott Williams & Wilkins, 2007:224–230.
- Swanson KL, Prakash UB, Stanson AW. Pulmonary arteriovenous fistulas: Mayo Clinic experience: 1872–1997. Mayo Clin Proc 1999; 74:671–680.
- Dines DE, Arms RA, Bernatz PE, Gomes MR. Pulmonary arteriovenous fistulas. Mayo Clinic Proc 1974; 49:460–465.
- Sluiter-Eringa H, Orie NG, Sluiter HJ. Pulmonary arteriovenous fistula: diagnosis and prognosis in noncompliant patients. Am Rev Respir Dis 1969; 100:177–188.
- Dines DE, Seward JB, Bernatz PE. Pulmonary arteriovenous fistula. Mayo Clin Proc 1983; 58:176–181.
- Pollak JS, Saluja S, Thabet A, Henderson KJ, Denbow N, White RI. Clinical and anatomic outcomes after embolotherapy of pulmonary arteriovenous malformations. J Vasc Interv Radio 2006; 17:35–44.
- Berg JN, Gallion CJ, Stenzel TT, et al. The activin receptor-like kinase 1 gene: genomic structure and mutations in hereditary hemorrhagic telangiectasia type 2. Am J Hum Genet 1997; 61:60–67.
- McAllister KA, Grogg KM, Johnson DW, et al. Endoglin, a TGF-beta binding protein of endothelial cells, is the gene for hereditary hemorrhagic telangiectasias type 1. Nat Genet 1994; 8:345–351.
- Johnson DW, Berg JN, Baldwin MA, et al. Mutations in the activin receptor-like kinase gene in hereditary haemorrhagic telangeictasia type 2. Nat Genet 1996; 13:189–195.
- Abdalla SA, Letarte M. Hereditary haemorrhagic telangiectasia: current views on genetics and mechanisms of disease. J Med Genet 2006; 43:97–110.
- Bayrak-Toydemir P, Mao R, Lewin S, McDonald J. Hereditary hemorrhagic telangiectasia: an overview of diagnosis and management in the molecular era for clinicians. Genet Med 2004; 6:175–191.
- Cohen JH, Faughnan ME, Letarte M, Vandezande K, Kennedy SJ, Krahn MD. Cost comparison of genetic and clinical screening in families with hereditary hemorrhagic telangiectasia. Am J Med Genet A 2005; 137:153–160.
- Shovlin C, Bamfort K, Wray D. Post-NICE 2008: Antibiotic prophylaxis prior to dental procedures for patients with pulmonary arteriovenous malformations (PAVMs) and hereditary haemorrhagic telangiectasia. Br Dent J 2008; 205:531–533.
- Hsu YL, Wang HC, Yang PC. Desbaric air embolism during diving: an unusual complication of Osler-Weber-Rendu disease. Br J Sports Med 2004; 38:E6.
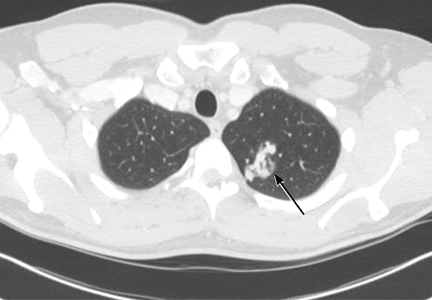
Omeprazole and clopidogrel: Should clinicians be worried?
Many clinicians are concerned about a possible interaction between the proton pump inhibitor omeprazole (Prilosec) and the antiplatelet drug clopidogrel (Plavix), which is often given to patients as part of dual antiplatelet therapy after an acute coronary syndrome or a percutaneous coronary intervention. Indeed, the US Food and Drug Administration (FDA) has warned that omeprazole reduces the antiplatelet effect of clopidogrel.
Although we should not take such warnings lightly, we also should not be alarmed. The data on which the FDA warning was based came mostly from laboratory assays of platelet function. Preliminary results from a randomized, controlled clinical trial with hard end points show that, for the time being, we should not change the way we manage patients.
PROTON PUMP INHIBITORS DECREASE GASTROINTESTINAL BLEEDING
Dual antiplatelet therapy with aspirin and clopidogrel decreases the risk of major adverse cardiac events after an acute coronary syndrome or a percutaneous coronary intervention compared with aspirin alone.1 However, it also increases the risk of gastrointestinal bleeding. A recent analysis determined that dual antiplatelet therapy was the most significant risk factor associated with serious or fatal gastrointestinal bleeding in high-risk survivors of myocardial infarction.2
Given the risks of significant morbidity and death in patients on dual antiplatelet therapy who develop gastrointestinal bleeding, an expert consensus panel recommended the use of proton pump inhibitors in patients on dual antiplatelet therapy who have risk factors for gastrointestinal bleeding.3 Accordingly, these drugs are commonly used for gastrointestinal protection in patients requiring dual antiplatelet therapy.
A POSSIBLE CYP450 INTERACTION
Clopidogrel is metabolized from a prodrug to its active metabolite by the cytochrome P450 (CYP450) system. Proton pump inhibitors also are metabolized by the CYP450 system.4 Proton pump inhibitors are thought to diminish the activity of clopidogrel via inhibition of the CYP2C19 isoenzyme. However, the clinical significance of this inhibition is not clear. Different drugs of this class inhibit the CYP450 system to varying degrees.
The potential interaction between proton pump inhibitors and clopidogrel is worrisome for many physicians, since adverse cardiovascular outcomes are more common in patients in whom the antiplatelet response to clopidogrel is impaired.1 This interaction led to the publication of numerous articles, and prompted the FDA to carefully analyze the potential clinical implications.
In several randomized trials, omeprazole diminished the response to clopidogrel (measured via platelet function assays).5,6 It is unclear if this is a class effect, as proton pump inhibitors other than omeprazole have not consistently been shown to have this effect.6,7 Observational studies of the effect of co-administration of a proton pump inhibitor and clopidogrel on cardiovascular outcomes following acute coronary syndromes have had conflicting findings.8–11
THE FDA ISSUES AN ADVISORY
Given the reports of an impaired platelet response to clopidogrel with omeprazole, the FDA asked the manufacturer for data on this potential interaction. The data showed diminished platelet inhibition when clopidogrel was co-administered with omeprazole or when the two were taken 12 hours apart.
On November 17, 2009, the FDA issued a patient advisory and updated the patient safety information on the package insert for clopidogrel about this drug interaction.12 Specifically, the FDA warns that omeprazole reduces the antiplatelet effect of clopidogrel by about 50%. The FDA warning sparked debate in the medical community, as the decision was based in part on ex vivo data.
POST HOC ANALYSES FROM RANDOMIZED CONTROLLED TRIALS
Several post hoc analyses of large randomized clinical trials have studied the potential interaction between proton pump inhibitors and clopidogrel.
In the Clopidogrel for the Reduction of Events During Observation (CREDO) trial, clopidogrel reduced the incidence of death, myocardial infarction, or stroke to a similar extent regardless of baseline use of a proton pump inhibitor.13
In patients undergoing percutaneous coronary intervention, the Prasugrel in Comparison to Clopidogrel for Inhibition of Platelet Activation and Aggregation—Thrombolysis in Myocardial Infarction 44 (PRINCIPLE-TIMI 44) trial found that those taking a proton pump inhibitor had significantly less platelet inhibition with clopidogrel compared with those not on one.14 However, patients taking prasugrel (Effient) and a proton pump inhibitor only had a slight trend towards diminished platelet inhibition.14
The Trial to Assess Improvement in Therapeutic Outcomes by Optimizing Platelet Inhibition With Prasugrel—Thrombolysis in Myocardial Infarction 38 (TRITON-TIMI 38) found that proton pump inhibitors did not influence the long-term outcome of cardiovascular death, myocardial infarction, or stroke for patients on clopidogrel or prasugrel after an acute coronary syndrome.14 A subanalysis did not reveal any differences between omeprazole or other drugs of this class as to an effect on the primary outcome.
Though informative, the results of these post hoc analyses need to be validated with data from randomized clinical trials.
‘COGENT’ TRIAL HALTED EARLY, BUT PRELIMINARY RESULTS AVAILABLE
The Clopidogrel and the Optimization of Gastrointestinal Events (COGENT) trial was the first randomized clinical study of the effect of the interaction between clopidogrel and omeprazole on cardiovascular and gastrointestinal outcomes.15 In a double-blind fashion, patients with acute coronary syndromes or undergoing percutaneous coronary interventions were randomized to receive a fixed-dose combination pill containing either clopidogrel and delayed-release omeprazole or clopidogrel alone. All patients also received aspirin.
Unfortunately, the trial was stopped early because the sponsor declared bankruptcy. However, preliminary results revealed no significant difference in cardiovascular outcomes for patients on clopidogrel and omeprazole compared with clopidogrel alone.15 Furthermore, adverse gastrointestinal events were significantly fewer in patients on clopidogrel and omeprazole.
Thus, omeprazole appears to be safe and may offer gastrointestinal protection to patients on dual antiplatelet therapy, though we need to await publication of the full results.
‘SPICE ’ TRIAL TO EVALUATE POSSIBLE MECHANISMS OF INTERACTION
The Evaluation of the Influence of Statins and Proton Pump Inhibitors on Clopidogrel Antiplatelet Effects (SPICE) trial is a mechanistic study that will evaluate platelet function and genetic polymorphisms in patients on clopidogrel and aspirin after a percutaneous coronary intervention. They will be randomized to statin therapy plus different proton pump inhibitors.16 Prior concerns about an ex vivo interaction between clopidogrel and certain statins were not validated by clinical data.17
OUR RECOMMENDATIONS
Based on the current evidence, patients on aspirin and clopidogrel who have an indication for a proton pump inhibitor or who are at risk of gastrointestinal bleeding can continue or start taking a proton pump inhibitor, including omeprazole.
Switching to another proton pump inhibitor is not currently supported by any randomized clinical trial, nor is changing to a histamine H2-receptor antagonist. The effect of proton pump inhibitors other than omeprazole on clopidogrel is unclear, and it is not known if the interaction with clopidogrel is a class effect or specific to certain drugs of this class.18 On the other hand, we still have no compelling evidence of any major clinical interaction between alternative proton pump inhibitors and clopidogrel.18
Also, separating the dosing times of clopidogrel and omeprazole by 12 hours is not supported by any randomized clinical trial, and runs contrary to at least some ex vivo data.
It is important that all physicians assess the need for a proton pump inhibitor in their patients, as overuse of these drugs has been documented in certain settings.19
Clopidogrel and omeprazole share a common metabolic link via CYP2C19. Omeprazole, along with some other proton pump inhibitors, interacts with clopidogrel at the level of the CYP450 system. Platelet function studies show that platelet inhibition by clopidogrel is impaired, though the astute clinician should be aware of the wide variability associated with platelet function assays and clopidogrel.1,20 However, what may appear to be an interaction at the enzymatic level does not necessarily translate into worse clinical outcomes. Additionally, reliance on nonrandomized studies rather than on randomized clinical trials can be misleading.
- Depta JP, Bhatt DL. Aspirin and platelet adenosine diphosphate receptor antagonists in acute coronary syndromes and percutaneous coronary intervention: role in therapy and strategies to overcome resistance. Am J Cardiovasc Drugs 2008; 8:91–112.
- Moukarbel GV, Signorovitch JE, Pfeffer MA, et al. Gastrointestinal bleeding in high risk survivors of myocardial infarction: the VALIANT trial. Eur Heart J 2009; 30:2226–2232.
- Bhatt DL, Scheiman J, Abraham NS, et al; American College of Cardiology Foundation Task Force on Clinical Expert Consensus Documents. ACCF/ACG/AHA 2008 expert consensus document on reducing the gastrointestinal risks of antiplatelet therapy and NSAID use: a report of the American College of Cardiology Foundation Task Force on Clinical Expert Consensus Documents. J Am Coll Cardiol 2008; 52:1502–1517.
- Li XQ, Andersson TB, Ahlström M, Weidolf L. Comparison of inhibitory effects of the proton pump-inhibiting drugs omeprazole, esomeprazole, lansoprazole, pantoprazole, and rabeprazole on human cytochrome P450 activities. Drug Metab Dispos 2004; 32:821–827.
- Gilard M, Arnaud B, Cornily JC, et al. Influence of omeprazole on the antiplatelet action of clopidogrel associated with aspirin: the randomized, double-blind OCLA (Omeprazole CLopidogrel Aspirin) study. J Am Coll Cardiol 2008; 51:256–260.
- Cuisset T, Frere C, Quilici J, et al. Comparison of omeprazole and pantoprazole influence on a high 150-mg clopidogrel maintenance dose. The PACA (Proton Pump Inhibitors and Clopidogrel Association) prospective randomized study. J Am Coll Cardiol 2009; 54:1149–1153.
- Siller-Matula JM, Spiel AO, Lang IM, Kreiner G, Christ G, Jilma B. Effects of pantoprazole and esomeprazole on platelet inhibition by clopidogrel. Am Heart J 2009; 157:148.e1–148.e5.
- Aubert RE, Epstein RS, Teagarden JR, et al. Proton pump inhibitors effect on clopidogrel effectiveness: the Clopidogrel Medco Outcomes Study [abstract]. Circulation 2008; 118( suppl):S28–10–2008.
- Ho PM, Maddox TM, Wang L, et al. Risk of adverse outcomes associated with concomitant use of clopidogrel and proton pump inhibitors following acute coronary syndrome. JAMA 2009; 301:937–944.
- Juurlink DN, Gomes T, Ko DT, et al. A population-based study of the drug interaction between proton pump inhibitors and clopidogrel. CMAJ 2009; 180:713–718.
- Rassen JA, Choudhry NK, Avorn J, Schneeweiss S. Cardiovascular outcomes and mortality in patients using clopidogrel with proton pump inhibitors after percutaneous coronary intervention or acute coronary syndrome. Circulation 2009; 120:2322–2329.
- US Food and Drug Administration. Public health advisory: updated safety information about a drug interaction between clopidogrel bisulfate (marketed as Plavix) and omeprazole (marketed as Prilosec and Prilosec OTC). www.fda.gov/Drugs/DrugSafety/PublicHealthAdvisories/ucm190825.htm. Accessed 1/6/2010.
- Dunn SP, Macaulay TE, Brennan DM, et al. Baseline proton pump inhibitor use associated with increased cardiovascular events with and without the use of clopidogrel in the CREDO trial. Circulation 2008; 118:S_815. Abstract 3999.
- O‘Donoghue ML, Braunwald E, Antman EM, et al. Pharmacodynamic effect and clinical efficacy of clopidogrel and prasugrel with or without a proton-pump inhibitor: an analysis of two randomised trials. Lancet 2009; 374:989–997.
- Bhatt DL. COGENT: A prospective, randomized, placebo-controlled trial of omeprazole in patients receiving aspirin and clopidogrel. Presented at Transcatheter Cardiovascular Therapeutics; September 24, 2009; San Francisco, Calif.
- National Institutes of Health. Evaluation of the Influence of Statins and Proton Pump Inhibitors on Clopidogrel Antiplatelet Effects (SPICE). http://clinicaltrials.gov/ct2/show/NCT00930670. Accessed 1/6/2010.
- Saw J, Brennan DM, Steinhubl SR, et al. Lack of evidence of clopidogrel-statin interaction in the CHARISMA trial. J Am Coll Cardiol 2007; 50:291–295.
- Laine L, Hennekens C. Proton pump inhibitor and clopidogrel interaction: fact or fiction? Am J Gastroenterol 2009 Nov 10. [Epub ahead of print].
- Forgacs I, Loganayagam A. Overprescribing proton pump inhibitors. BMJ 2008; 336:2–3.
- Serebruany VL, Steinhubl SR, Berger PB, Malinin AI, Bhatt DL, Topol EJ. Variability in platelet responsiveness to clopidogrel among 544 individuals. J Am Coll Cardiol 2005; 45:246–251.
Many clinicians are concerned about a possible interaction between the proton pump inhibitor omeprazole (Prilosec) and the antiplatelet drug clopidogrel (Plavix), which is often given to patients as part of dual antiplatelet therapy after an acute coronary syndrome or a percutaneous coronary intervention. Indeed, the US Food and Drug Administration (FDA) has warned that omeprazole reduces the antiplatelet effect of clopidogrel.
Although we should not take such warnings lightly, we also should not be alarmed. The data on which the FDA warning was based came mostly from laboratory assays of platelet function. Preliminary results from a randomized, controlled clinical trial with hard end points show that, for the time being, we should not change the way we manage patients.
PROTON PUMP INHIBITORS DECREASE GASTROINTESTINAL BLEEDING
Dual antiplatelet therapy with aspirin and clopidogrel decreases the risk of major adverse cardiac events after an acute coronary syndrome or a percutaneous coronary intervention compared with aspirin alone.1 However, it also increases the risk of gastrointestinal bleeding. A recent analysis determined that dual antiplatelet therapy was the most significant risk factor associated with serious or fatal gastrointestinal bleeding in high-risk survivors of myocardial infarction.2
Given the risks of significant morbidity and death in patients on dual antiplatelet therapy who develop gastrointestinal bleeding, an expert consensus panel recommended the use of proton pump inhibitors in patients on dual antiplatelet therapy who have risk factors for gastrointestinal bleeding.3 Accordingly, these drugs are commonly used for gastrointestinal protection in patients requiring dual antiplatelet therapy.
A POSSIBLE CYP450 INTERACTION
Clopidogrel is metabolized from a prodrug to its active metabolite by the cytochrome P450 (CYP450) system. Proton pump inhibitors also are metabolized by the CYP450 system.4 Proton pump inhibitors are thought to diminish the activity of clopidogrel via inhibition of the CYP2C19 isoenzyme. However, the clinical significance of this inhibition is not clear. Different drugs of this class inhibit the CYP450 system to varying degrees.
The potential interaction between proton pump inhibitors and clopidogrel is worrisome for many physicians, since adverse cardiovascular outcomes are more common in patients in whom the antiplatelet response to clopidogrel is impaired.1 This interaction led to the publication of numerous articles, and prompted the FDA to carefully analyze the potential clinical implications.
In several randomized trials, omeprazole diminished the response to clopidogrel (measured via platelet function assays).5,6 It is unclear if this is a class effect, as proton pump inhibitors other than omeprazole have not consistently been shown to have this effect.6,7 Observational studies of the effect of co-administration of a proton pump inhibitor and clopidogrel on cardiovascular outcomes following acute coronary syndromes have had conflicting findings.8–11
THE FDA ISSUES AN ADVISORY
Given the reports of an impaired platelet response to clopidogrel with omeprazole, the FDA asked the manufacturer for data on this potential interaction. The data showed diminished platelet inhibition when clopidogrel was co-administered with omeprazole or when the two were taken 12 hours apart.
On November 17, 2009, the FDA issued a patient advisory and updated the patient safety information on the package insert for clopidogrel about this drug interaction.12 Specifically, the FDA warns that omeprazole reduces the antiplatelet effect of clopidogrel by about 50%. The FDA warning sparked debate in the medical community, as the decision was based in part on ex vivo data.
POST HOC ANALYSES FROM RANDOMIZED CONTROLLED TRIALS
Several post hoc analyses of large randomized clinical trials have studied the potential interaction between proton pump inhibitors and clopidogrel.
In the Clopidogrel for the Reduction of Events During Observation (CREDO) trial, clopidogrel reduced the incidence of death, myocardial infarction, or stroke to a similar extent regardless of baseline use of a proton pump inhibitor.13
In patients undergoing percutaneous coronary intervention, the Prasugrel in Comparison to Clopidogrel for Inhibition of Platelet Activation and Aggregation—Thrombolysis in Myocardial Infarction 44 (PRINCIPLE-TIMI 44) trial found that those taking a proton pump inhibitor had significantly less platelet inhibition with clopidogrel compared with those not on one.14 However, patients taking prasugrel (Effient) and a proton pump inhibitor only had a slight trend towards diminished platelet inhibition.14
The Trial to Assess Improvement in Therapeutic Outcomes by Optimizing Platelet Inhibition With Prasugrel—Thrombolysis in Myocardial Infarction 38 (TRITON-TIMI 38) found that proton pump inhibitors did not influence the long-term outcome of cardiovascular death, myocardial infarction, or stroke for patients on clopidogrel or prasugrel after an acute coronary syndrome.14 A subanalysis did not reveal any differences between omeprazole or other drugs of this class as to an effect on the primary outcome.
Though informative, the results of these post hoc analyses need to be validated with data from randomized clinical trials.
‘COGENT’ TRIAL HALTED EARLY, BUT PRELIMINARY RESULTS AVAILABLE
The Clopidogrel and the Optimization of Gastrointestinal Events (COGENT) trial was the first randomized clinical study of the effect of the interaction between clopidogrel and omeprazole on cardiovascular and gastrointestinal outcomes.15 In a double-blind fashion, patients with acute coronary syndromes or undergoing percutaneous coronary interventions were randomized to receive a fixed-dose combination pill containing either clopidogrel and delayed-release omeprazole or clopidogrel alone. All patients also received aspirin.
Unfortunately, the trial was stopped early because the sponsor declared bankruptcy. However, preliminary results revealed no significant difference in cardiovascular outcomes for patients on clopidogrel and omeprazole compared with clopidogrel alone.15 Furthermore, adverse gastrointestinal events were significantly fewer in patients on clopidogrel and omeprazole.
Thus, omeprazole appears to be safe and may offer gastrointestinal protection to patients on dual antiplatelet therapy, though we need to await publication of the full results.
‘SPICE ’ TRIAL TO EVALUATE POSSIBLE MECHANISMS OF INTERACTION
The Evaluation of the Influence of Statins and Proton Pump Inhibitors on Clopidogrel Antiplatelet Effects (SPICE) trial is a mechanistic study that will evaluate platelet function and genetic polymorphisms in patients on clopidogrel and aspirin after a percutaneous coronary intervention. They will be randomized to statin therapy plus different proton pump inhibitors.16 Prior concerns about an ex vivo interaction between clopidogrel and certain statins were not validated by clinical data.17
OUR RECOMMENDATIONS
Based on the current evidence, patients on aspirin and clopidogrel who have an indication for a proton pump inhibitor or who are at risk of gastrointestinal bleeding can continue or start taking a proton pump inhibitor, including omeprazole.
Switching to another proton pump inhibitor is not currently supported by any randomized clinical trial, nor is changing to a histamine H2-receptor antagonist. The effect of proton pump inhibitors other than omeprazole on clopidogrel is unclear, and it is not known if the interaction with clopidogrel is a class effect or specific to certain drugs of this class.18 On the other hand, we still have no compelling evidence of any major clinical interaction between alternative proton pump inhibitors and clopidogrel.18
Also, separating the dosing times of clopidogrel and omeprazole by 12 hours is not supported by any randomized clinical trial, and runs contrary to at least some ex vivo data.
It is important that all physicians assess the need for a proton pump inhibitor in their patients, as overuse of these drugs has been documented in certain settings.19
Clopidogrel and omeprazole share a common metabolic link via CYP2C19. Omeprazole, along with some other proton pump inhibitors, interacts with clopidogrel at the level of the CYP450 system. Platelet function studies show that platelet inhibition by clopidogrel is impaired, though the astute clinician should be aware of the wide variability associated with platelet function assays and clopidogrel.1,20 However, what may appear to be an interaction at the enzymatic level does not necessarily translate into worse clinical outcomes. Additionally, reliance on nonrandomized studies rather than on randomized clinical trials can be misleading.
- Depta JP, Bhatt DL. Aspirin and platelet adenosine diphosphate receptor antagonists in acute coronary syndromes and percutaneous coronary intervention: role in therapy and strategies to overcome resistance. Am J Cardiovasc Drugs 2008; 8:91–112.
- Moukarbel GV, Signorovitch JE, Pfeffer MA, et al. Gastrointestinal bleeding in high risk survivors of myocardial infarction: the VALIANT trial. Eur Heart J 2009; 30:2226–2232.
- Bhatt DL, Scheiman J, Abraham NS, et al; American College of Cardiology Foundation Task Force on Clinical Expert Consensus Documents. ACCF/ACG/AHA 2008 expert consensus document on reducing the gastrointestinal risks of antiplatelet therapy and NSAID use: a report of the American College of Cardiology Foundation Task Force on Clinical Expert Consensus Documents. J Am Coll Cardiol 2008; 52:1502–1517.
- Li XQ, Andersson TB, Ahlström M, Weidolf L. Comparison of inhibitory effects of the proton pump-inhibiting drugs omeprazole, esomeprazole, lansoprazole, pantoprazole, and rabeprazole on human cytochrome P450 activities. Drug Metab Dispos 2004; 32:821–827.
- Gilard M, Arnaud B, Cornily JC, et al. Influence of omeprazole on the antiplatelet action of clopidogrel associated with aspirin: the randomized, double-blind OCLA (Omeprazole CLopidogrel Aspirin) study. J Am Coll Cardiol 2008; 51:256–260.
- Cuisset T, Frere C, Quilici J, et al. Comparison of omeprazole and pantoprazole influence on a high 150-mg clopidogrel maintenance dose. The PACA (Proton Pump Inhibitors and Clopidogrel Association) prospective randomized study. J Am Coll Cardiol 2009; 54:1149–1153.
- Siller-Matula JM, Spiel AO, Lang IM, Kreiner G, Christ G, Jilma B. Effects of pantoprazole and esomeprazole on platelet inhibition by clopidogrel. Am Heart J 2009; 157:148.e1–148.e5.
- Aubert RE, Epstein RS, Teagarden JR, et al. Proton pump inhibitors effect on clopidogrel effectiveness: the Clopidogrel Medco Outcomes Study [abstract]. Circulation 2008; 118( suppl):S28–10–2008.
- Ho PM, Maddox TM, Wang L, et al. Risk of adverse outcomes associated with concomitant use of clopidogrel and proton pump inhibitors following acute coronary syndrome. JAMA 2009; 301:937–944.
- Juurlink DN, Gomes T, Ko DT, et al. A population-based study of the drug interaction between proton pump inhibitors and clopidogrel. CMAJ 2009; 180:713–718.
- Rassen JA, Choudhry NK, Avorn J, Schneeweiss S. Cardiovascular outcomes and mortality in patients using clopidogrel with proton pump inhibitors after percutaneous coronary intervention or acute coronary syndrome. Circulation 2009; 120:2322–2329.
- US Food and Drug Administration. Public health advisory: updated safety information about a drug interaction between clopidogrel bisulfate (marketed as Plavix) and omeprazole (marketed as Prilosec and Prilosec OTC). www.fda.gov/Drugs/DrugSafety/PublicHealthAdvisories/ucm190825.htm. Accessed 1/6/2010.
- Dunn SP, Macaulay TE, Brennan DM, et al. Baseline proton pump inhibitor use associated with increased cardiovascular events with and without the use of clopidogrel in the CREDO trial. Circulation 2008; 118:S_815. Abstract 3999.
- O‘Donoghue ML, Braunwald E, Antman EM, et al. Pharmacodynamic effect and clinical efficacy of clopidogrel and prasugrel with or without a proton-pump inhibitor: an analysis of two randomised trials. Lancet 2009; 374:989–997.
- Bhatt DL. COGENT: A prospective, randomized, placebo-controlled trial of omeprazole in patients receiving aspirin and clopidogrel. Presented at Transcatheter Cardiovascular Therapeutics; September 24, 2009; San Francisco, Calif.
- National Institutes of Health. Evaluation of the Influence of Statins and Proton Pump Inhibitors on Clopidogrel Antiplatelet Effects (SPICE). http://clinicaltrials.gov/ct2/show/NCT00930670. Accessed 1/6/2010.
- Saw J, Brennan DM, Steinhubl SR, et al. Lack of evidence of clopidogrel-statin interaction in the CHARISMA trial. J Am Coll Cardiol 2007; 50:291–295.
- Laine L, Hennekens C. Proton pump inhibitor and clopidogrel interaction: fact or fiction? Am J Gastroenterol 2009 Nov 10. [Epub ahead of print].
- Forgacs I, Loganayagam A. Overprescribing proton pump inhibitors. BMJ 2008; 336:2–3.
- Serebruany VL, Steinhubl SR, Berger PB, Malinin AI, Bhatt DL, Topol EJ. Variability in platelet responsiveness to clopidogrel among 544 individuals. J Am Coll Cardiol 2005; 45:246–251.
KEY POINTS
- Proton pump inhibitors such as omeprazole reduce the risk of gastrointestinal bleeding in patients on antiplatelet therapy after an acute coronary syndrome or percutaneous coronary intervention.
- Omeprazole diminishes the antiplatelet activity of clopidogrel by inhibiting the CYP2C19 isoenzyme.
- Although the interaction between omeprazole and clopidogrel can be demonstrated on platelet function studies, the clinical significance of this interaction is not clear.
Controversies in non-ST-elevation acute coronary syndromes and percutaneous coronary interventions
Despite all the attention paid to ST-segment-elevation myocardial infarction (MI), in terms of sheer numbers, non-ST-elevation MI and unstable angina are where the action is. Acute coronary syndromes account for 2.43 million hospital discharges per year. Of these, 0.46 million are for ST-elevation MI and 1.97 million are for non-ST-elevation MI and unstable angina.1,2
A number of recent studies have begun to answer some of the pressing questions about treating these types of acute coronary syndromes. In this article, I update the reader on these studies, along with recent findings regarding stenting and antiplatelet agents. As you will see, they are all interconnected.
TO CATHETERIZE IS BETTER THAN NOT TO CATHETERIZE
In the 1990s, a topic of debate was whether patients presenting with unstable angina or non-ST-elevation MI should routinely undergo catheterization or whether they would do just as well with a conservative approach, ie, undergoing catheterization only if they developed recurrent, spontaneous, or stress-induced ischemia. Now, the data are reasonably clear and favor an aggressive strategy.3
Mehta et al4 performed a meta-analysis of seven randomized controlled trials (N = 9,212 patients) of aggressive vs conservative angiography and revascularization for non-ST-elevation MI or unstable angina. The results favored the aggressive strategy. At 17 months of follow-up, death or MI had occurred in 7.4% of patients who received the aggressive therapy compared with 11.0% of those who received the conservative therapy, for an odds ratio of 0.82 (P = .001).
The CRUSADE (Can Rapid Risk Stratification of Unstable Angina Patients Suppress Adverse Outcomes With Early Implemention of the ACC/AHA Guidelines?) Quality Improvement Initiative5 analyzed data from a registry of 17,926 patients with non-ST-elevation acute coronary syndrome who were at high risk because of positive cardiac markers or ischemic electrocardiographic changes. Overall, 2.0% of patients who received early invasive care (catheterization within the first 48 hours) died in the hospital compared with 6.2% of those who got no early invasive care, for an adjusted odds ratio of 0.63 (95% confidence interval [CI] 0.52–0.77).
The investigators also stratified the patients into those at low, medium, and high risk, using the criteria of the PURSUIT (Platelet Glycoprotein IIb/IIIa in Unstable Angina: Receptor Suppression Using Integrilin [eptifibatide] Therapy) risk score. There were fewer deaths with early invasive therapy in each risk group, and the risk reduction was greatest in the high-risk group.5
Bavry et al6 performed an updated meta-analysis of randomized trials. At a mean follow-up of 24 months, the relative risk of death from any cause was 0.75 in patients who received early invasive therapy.
In another meta-analysis, O’Donoghue et al7 found that the odds ratio of death, MI, or rehospitalization with acute coronary syndromes was 0.73 (95% CI 0.55–0.98) in men who received invasive vs conservative therapy; in women it was 0.81 (95% CI 0.65–1.01). In women, the benefit was statistically significant in those who had elevations of creatine kinase MB or troponin but not in those who did not, though the benefit in men appeared to be less dependent on the presence of biomarker abnormalities.
MUST ANGIOGRAPHY BE DONE IN THE FIRST 24 HOURS?
Although a number of trials showed that a routine invasive strategy leads to better outcomes than a conservative strategy, until recently we had no information as to whether the catheterization needed to be done early (eg, within the first 24 hours) or if it could be delayed a day or two while the patient received medical therapy.
Mehta et al8 conducted a trial to find out: the Timing of Intervention in Acute Coronary Syndrome (TIMACS) trial. Patients were included if they had unstable angina or non-ST-elevation MI, presented to a hospital within 24 hours of the onset of symptoms, and had two of three high-risk features: age 60 years or older, elevated cardiac biomarkers, or electrocardiographic findings compatible with ischemia. All received standard medical therapy, and 3,031 were randomly assigned to undergo angiography either within 24 hours after randomization or 36 or more hours after randomization.
At 6 months, the primary outcome of death, new MI, or stroke had occurred in 9.6% of the patients in the early-intervention group and in 11.3% of those in the delayed-intervention group, but the difference was not statistically significant. However, the difference in the rate of a secondary end point, death, MI, or refractory ischemia, was statistically significant: 9.5% vs 12.9%, P = .003, owing mainly to less refractory ischemia with early intervention.
The patients were also stratified into two groups by baseline risk. The rate of the primary outcome was significantly lower with early intervention in high-risk patients, but not in those at intermediate or low risk. Thus, early intervention may be beneficial in patients at high risk, such as those with ongoing chest pain, but not necessarily in those at low risk.
LEAVE NO LESION BEHIND?
Coronary artery disease often affects more than one segment. Until recently, it was not known whether we should stent all stenotic segments in patients presenting with non-ST-elevation MI or unstable angina, or only the “culprit lesion.”
Shishehbor et al9 examined data from a Cleveland Clinic registry of 1,240 patients with acute coronary syndrome and multivessel coronary artery disease who underwent bare-metal stenting. The median follow-up was 2.3 years. Using a propensity model to match patients in the two groups with similar baseline characteristics, they found that the rate of repeat revascularization was less with multivessel intervention than with culprit-only stenting, as was the rate of the combined end point of death, MI, or revascularization, but not that of all-cause mortality or the composite of death or MI.
BARE-METAL VS DRUG-ELUTING STENTS: BALANCING THE RISKS AND BENEFITS
After a patient receives a stent, two bad things can happen: the artery can close up again either gradually, in a process called restenosis, or suddenly, via thrombosis.
Drug-eluting stents were invented to solve the problem of restenosis, and they work very well. Stone et al10 pooled the data from four double-blind trials of sirolimus (Rapamune) stents and five double-blind trials of paclitaxel (Taxol) stents and found that, at 4 years, the rates of target-lesion revascularization (for restenosis) were 7.8% with sirolimus stents vs 23.6% with bare-metal stents (P < .001), and 10.1% with paclitaxel stents vs 20.0% with bare-metal stents (P < .001).
Thrombosis was much less common in these studies, occurring in 1.2% of the sirolimus stent groups vs 0.6% of the bare-metal stent groups (P = .20), and in 1.3% of the paclitaxel stent groups vs 0.9% of the bare-metal stent groups (P = .30).10
However, drug-eluting stents appear to increase the risk of thrombosis later on, ie, after 1 year. Bavry et al,11 in a meta-analysis, calculated that when stent thrombosis occurred, the median time after implantation was 15.5 months with sirolimus stents vs 4 months with bare-metal stents (P = .0052), and 18 months with paclitaxel stents vs 3.5 months with bare-metal stents (P = .04). The absolute risk of very late stent thrombosis after 1 year was very low, with five events per 1,000 patients with drug-eluting stents vs no events with bare-metal stents (P = .02). Nevertheless, this finding has practical implications. How long must patients continue dual antiplatelet therapy? And what if a patient needs surgery a year later?
Restenosis is not always so gradual
Although stent thrombosis is serious and often fatal, bare-metal stent restenosis is not always benign either, despite the classic view that stent restenosis is a gradual process that results in exertional angina. Reviewing 1,186 cases of bare-metal stent restenosis in 984 patients at Cleveland Clinic, Chen et al12 reported that 9.5% of cases presented as acute MI (2.2% as ST-elevation MI and 7.3% as non-ST-elevation MI), and 26.4% as unstable angina requiring hospitalization.
A Mayo Clinic study13 corroborated these findings. The 10-year incidence of clinical bare-metal stent restenosis was 18.1%, and the incidence of MI was 2.1%. The 10-year rate of bare-metal stent thrombosis was 2%. Off-label use, primarily in saphenous vein grafts, increased the incidence; other correlates were prior MI, peripheral arterial disease, and ulcerated lesions.
Furthermore, bare-metal stent thrombosis can also occur later. We saw a case that occurred 13 years after the procedure, 3 days after the patient stopped taking aspirin because he was experiencing flu-like symptoms, ran out of aspirin, and felt too sick to go out and buy more. The presentation was with ST-elevation MI. The patient recovered after treatment with intracoronary abciximab (ReoPro), percutaneous thrombectomy, balloon angioplasty, and, eventually, bypass surgery.14
No difference in risk of death with drug-eluting vs bare-metal stents
Even though drug-eluting stents pose a slightly higher risk of thrombosis than bare-metal stents, the risk of death is no higher.15
I believe the reason is that there are competing risks, and that the higher risk of thrombosis with first-generation drug-eluting stents and the higher risk of restenosis with bare-metal stents essentially cancel each other out. For most patients, there is an absolute benefit with drug-eluting stents, which reduce the need for revascularization with no effect in terms of either increasing or decreasing the risk of MI or death. Second-generation drug-eluting stents may have advantages in reducing rates of death or MI compared with first-generation drug-eluting stents, though this remains to be proven conclusively.
The right revascularization for the right patient
Bavry and I16 developed an algorithm for deciding on revascularization, posing a series of questions:
- Does the patient need any form of revascularization?
- Is he or she at higher risk of both stent thrombosis and restenosis, as in patients with diabetes, diffuse multivessel disease with bifurcation lesions, or chronic total occlusions? If so, coronary artery bypass grafting remains an excellent option.
- Does he or she have a low risk of restenosis, as in patients without diabetes with focal lesions in large vessels? If so, one could consider a bare-metal stent, which would probably be more cost-effective than a drug-eluting stent in this situation.
- Does the patient have relative contraindications to drug-eluting stents? Examples are a history of noncompliance with medical therapy, financial issues such as lack of insurance that would make buying clopidogrel (Plavix) a problem, long-term anticoagulation, or anticipated need for surgery in the next few years.
If a drug-eluting stent is used, certain measures can help ensure that it is used optimally. It should often be placed under high pressure with a noncompliant balloon so that it achieves contact with the artery wall all around. One should consider intravascular ultrasonographic guidance to make sure the stent is well opposed if it is in a very calcified lesion. Dual antiplatelet therapy with clopidogrel and aspirin should be given for at least 1 year, and if there is no bleeding, perhaps longer, pending further data.16
LEAVE NO PLATELET ACTIVATED?
Platelets have several types of receptors that, when bound by their respective ligands, lead to platelet activation and aggregation and, ultimately, thrombus formation. Antagonists to some of these receptors are available or are being developed.17
For long-term therapy, blocking the process “upstream,” ie, preventing platelet activation, is better than blocking it “downstream,” ie, preventing aggregation. For example, clopidogrel, ticlopipine (Ticlid), and prasugrel (Effient) have active metabolites that bind to a subtype of the adenosine diphosphate receptor and prevent platelet activation, whereas the glycoprotein IIb/IIIa inhibitors such as abciximab work downstream, binding to a different receptor and preventing aggregation.18
Dual therapy for 1 year is the standard of care after acute coronary syndromes
The evidence for using dual antiplatelet therapy (ie, aspirin plus clopidogrel) in patients with acute coronary syndromes without ST-elevation is very well established.
The Clopidogrel in Unstable Angina to Prevent Recurrent Events (CURE) trial,19 published in 2001, found a 20% relative risk reduction and a 2% absolute risk reduction in the incidence of MI, stroke, or cardiovascular death in patients randomly assigned to receive clopidogrel plus aspirin for 1 year vs aspirin alone for 1 year (P < .001). In the subgroup of patients who underwent percutaneous coronary intervention, the relative risk reduction in the incidence of MI or cardiovascular death at 1 year of follow-up was 31% (P = .002).20
As a result of these findings, the cardiology society guidelines21 recommend a year of dual antiplatelet therapy after acute coronary syndromes, regardless of whether the patient is treated medically, percutaneously, or surgically.
But what happens after clopidogrel is withdrawn? Ho et al22 retrospectively analyzed data from Veterans Affairs hospitals and found a spike in the incidence of death or MI in the first 90 days after stopping clopidogrel treatment. This was true in medically treated patients as well as in those treated with percutaneous coronary interventions, in those with or without diabetes mellitus, in those who received a drug-eluting stent or a bare-metal stent, and in those treated longer than 9 months.
The investigators concluded that there might be a “clopidogrel rebound effect.” However, I believe that a true rebound effect, such as after withdrawal of heparin or warfarin, is biologically unlikely with clopidogrel, since clopidogrel irreversibly binds to its receptor for the 7- to 10-day life span of the platelet. Rather, I believe the phenomenon must be due to withdrawal of protection in patients at risk.
In stable patients, dual therapy is not as beneficial
Would dual antiplatelet therapy with clopidogrel and aspirin also benefit patients at risk of atherothrombotic events but without acute coronary syndromes?
The Clopidogrel for High Atherothrombotic Risk and Ischemic Stabilization, Management, and Avoidance (CHARISMA) trial23 included 15,603 patients with either clinically evident but stable cardiovascular disease or multiple risk factors for athero-thrombosis. They were randomly assigned to receive either clopidogrel 75 mg/day plus aspirin 75 to 162 mg/day or placebo plus aspirin. At a median of 28 months, the groups did not differ significantly in the rate of MI, stroke, or death from cardiovascular causes.
However, the subgroup of patients who had documented prior MI, ischemic stroke, or symptomatic peripheral arterial disease did appear to derive significant benefit from dual therapy.24 In this subgroup, the rate of MI, stroke, or cardiovascular death at a median follow-up of 27.6 months was 8.8% with placebo plus aspirin compared with 7.3% with clopidogrel plus aspirin, for a hazard ratio of 0.83 (95% CI 0.72–0.96, P = .01). Unstented patients with stable coronary artery disease but without prior MI derived no benefit.
Bleeding and thrombosis: The Scylla and Charybdis of antiplatelet therapy
However, with dual antiplatelet therapy, we steer between the Scylla of bleeding and the Charybdis of thrombosis.25
In the CHARISMA subgroup who had prior MI, ischemic stroke, or symptomatic peripheral arterial disease, the incidence of moderate or severe bleeding was higher with dual therapy than with aspirin alone, but the rates converged after about 1 year of treatment.24 Further, there was no difference in fatal bleeding or intracranial bleeding, although the rate of moderate bleeding (defined as the need for transfusion) was higher with dual therapy (2.0% vs 1.3%, P = .004).
I believe the data indicate that if a patient can tolerate dual antiplatelet therapy for 9 to 12 months without any bleeding issues, he or she is unlikely to have a major bleeding episode if dual therapy is continued beyond this time.
About half of bleeding events in patients on chronic antiplatelet therapy are gastrointestinal. To address this risk, in 2008 an expert committee from the American College of Cardiology, American College of Gastroenterology, and American Heart Association issued a consensus document26 in which they recommended assessing gastrointestinal risk factors in patients on antiplatelet therapy, such as history of ulcers (and testing for and treating Helicobacter pylori infection if present), history of gastrointestinal bleeding, concomitant anticoagulant therapy, and dual antiplatelet therapy. If any of these were present, the committee recommended considering a proton pump inhibitor. The committee also recommended a proton pump inhibitor for patients on antiplatelet therapy who have more than one of the following: age 60 years or more, corticosteroid use, or dyspepsia or gastroesophageal reflux symptoms.
Some ex vivo platelet studies and observational analyses have suggested that there might be an adverse interaction between clopidogrel and proton pump inhibitors due to a blunting of clopidogrel’s antiplatelet effect. A large randomized clinical trial was designed and launched to determine if a single-pill combination of the proton pump inhibitor omeprazole (Prilosec) and clopidogrel would be safer than clopidogrel alone when added to aspirin. Called COGENT-1 (Clopidogrel and the Optimization of GI Events Trial), it was halted early in 2009 when it lost its funding. However, preliminary data did not show an adverse interaction between clopidogrel and omeprazole.
What is the right dose of aspirin?
Steinhubl et al27 performed a post hoc observational analysis of data from the CHARISMA trial. Their findings suggested that higher doses of aspirin are not more effective than lower doses for chronic therapy. Furthermore, in the group receiving clopidogrel plus aspirin, the incidence of severe or life-threatening bleeding was significantly greater with aspirin doses higher than 100 mg than with doses lower than 100 mg, 2.6% vs 1.7%, P = .040.
A randomized, controlled trial called Clopidogrel Optimal Loading Dose Usage to Reduce Recurrent Events/Optimal Antiplatelet Strategy for Interventions (CURRENT/OASIS 7)28 recently reported that higher-dose aspirin (ie, 325 mg) may be better than lower dose aspirin (ie, 81 mg) in patients with acute coronary syndromes undergoing percutaneous coronary intervention and receiving clopidogrel. During this 30-day study, there was no increase in overall bleeding with the higher dose of aspirin, though gastrointestinal bleeding was slightly increased.29 In a factorial design, the second part of this trial found that a higher-dose clopidogrel regimen reduced stent thrombosis.29
Should nonresponders get higher doses of clopidogrel?
In vitro, response to clopidogrel shows a normal bell-shaped distribution.30 In theory, therefore, patients who are hyperresponders may be at higher risk of bleeding, and those who are hyporesponders may be at risk of ischemic events.
A clinical trial is under way to examine whether hyporesponders should get higher doses. Called GRAVITAS (Gauging Responsiveness With a VerifyNow Assay Impact on Thrombosis and Safety), it will use a point-of-care platelet assay and then allocate patients to receive either standard therapy or double the dose of clopidogrel. The primary end point will be the rate of cardiovascular death, nonfatal MI, or stent thrombosis at 6 months.
Is prasugrel better than clopidogrel?
Prasugrel (Effient) is a new drug of the same class as clopidogrel, ie, a thienopyridine, with its active metabolite binding to the same platelet receptor as clopidogrel and inhibiting platelet aggregation more rapidly, more consistently, and to a greater extent than clopidogrel. Prasugrel was recently approved by the Food and Drug Administration. But is it better?31
The Trial to Assess Improvement in Therapeutic Outcomes by Optimizing Platelet Inhibition With Prasugrel–Thrombolysis in Myocardial Infarction (TRITON-TIMI 38) compared prasugrel and clopidogrel in 13,608 patients with moderate- to high-risk acute coronary syndromes who were scheduled to undergo percutaneous coronary intervention.32
Overall, prasugrel was better. At 15 months, the incidence of the primary end point (death from cardiovascular causes, nonfatal MI, or nonfatal stroke) was significantly lower with prasugrel therapy than with clopidogrel in the entire cohort (9.9% vs 12.1%, hazard ratio 0.81, 95% CI 0.73–0.90, P < .001), in the subgroup with ST-segment elevation MI, and in the subgroup with unstable angina or non-ST-elevation MI.
However, there was a price to pay. The rate of major bleeding was higher with prasugrel (2.4% vs 1.8%, hazard ratio 1.32, 95% CI 1.03–1.68, P = .03). Assessing the balance between the risk and the benefit, the investigators identified three subgroups who did not derive a net clinical benefit from prasugrel: patients who had had a previous stroke or transient ischemic attack (this group actually had a net harm from prasugrel), patients 75 years of age or older, and patients weighing less than 60 kg (132 pounds).
More work is needed to determine which patients are best served by standard-dose clopidogrel, higher doses of clopidogrel, platelet-assay-guided dosing of clopidogrel, or prasugrel.24
Short-acting, potent intravenous platelet blockade with an agent such as cangrelor is theoretically appealing, but further research is necessary.33,34 Ticagrelor, a reversible adenosine diphosphate receptor antagonist, provides yet another potential option in antiplatelet therapy for acute coronary syndromes. In the recent PLATO trial (Study of Platelet Inhibition and Patient Outcomes), compared with clopidogrel, ticagrelor reduced the risk of ischemic events, including death.35,36 Here, too, there was more major bleeding (unrelated to coronary artery bypass grafting) with ticagrelor.
Thus, clinical assessment of an individual patient’s ischemic and bleeding risks will continue to be critical as therapeutic strategies evolve.
- Wiviott SD, Morrow DA, Giugliano RP, et al. Performance of the Thrombolysis In Myocardial Infarction risk index for early acute coronary syndrome in the National Registry of Myocardial Infarction: a simple risk index predicts mortality in both ST and non-ST elevation myocardial infarction [abstract]. J Am Coll Cardiol 2003; 43( suppl 2):365A–366A.
- Thom T, Haase N, Rosamond W, et al; American Heart Association Statistics Committee and Stroke Statistics Subcommittee. Circulation 2006; 113:e85–e151. Errata in Circulation 2006; 113:e696 and Circulation 2006 114:e630.
- Bhatt DL. To cath or not to cath. That is no longer the question. JAMA 2005; 293:2935–2937.
- Mehta SR, Cannon CP, Fox KA, et al. Routine vs selective invasive strategies in patients with acute coronary syndromes: a collaborative meta-analysis of randomized trials. JAMA 2005; 293:2908–2917.
- Bhatt DL, Roe MT, Peterson ED, et al; for the CRUSADE Investigators. Utilization of early invasive management strategies for high-risk patients with non-ST-segment elevation acute coronary syndromes: results from the CRUSADE Quality Improvement Initiative. JAMA 2004; 292:2096–2104.
- Bavry AA, Kumbhani DJ, Rassi AN, Bhatt DL, Askari AT. Benefit of early invasive therapy in acute coronary syndromes: a meta-analysis of contemporary randomized clinical trials. J Am Coll Cardiol 2006; 48:1319–1325.
- O’Donoghue MO, Boden WE, Braunwald E, et al. Early invasive vs conservative treatment strategies in women and men with unstable angina and non-ST segment elevation myocardial infarction: a meta-analysis. JAMA 2008; 300:71–80.
- Mehta SR, Granger CB, Boden WE, et al; TIMACS Investigators. Early versus delayed invasive intervention in acute coronary syndromes. N Engl J Med 2009; 360:2165–2175.
- Shishehbor MH, Lauer MS, Singh IM, et al. In unstable angina or non-ST-segment acute coronary syndrome, should patients with multivessel coronary artery disease undergo multivessel or culpritonly stenting? J Am Coll Cardiol 2007; 49:849–854.
- Stone GW, Moses JW, Ellis SG, et al. Safety and efficacy of sirolimus- and paclitaxel-eluting coronary stents. N Engl J Med 2007; 356:998–1008.
- Bavry AA, Kumbhani DJ, Helton TJ, Borek PP, Mood GR, Bhatt DL. Late thrombosis of drug-eluting stents: a meta-analysis of randomized clinical trials. Am J Med 2006; 119:1056–1061.
- Chen MS, John JM, Chew DP, Lee DS, Ellis SG, Bhatt DL. Bare metal stent restenosis is not a benign clinical entity. Am Heart J 2006; 151:1260–1264.
- Doyle B, Rihal CS, O’Sullivan CJ, et al. Outcomes of stent thrombosis and restenosis during extended follow-up of patients treated with bare-metal coronary stents. Circulation 2007; 116:2391–2398.
- Sarkees ML, Bavry AA, Galla JM, Bhatt DL. Bare metal stent thrombosis 13 years after implantation. Cardiovasc Revasc Med 2009; 10:58–91.
- Bavry AA, Bhatt DL. Appropriate use of drug-eluting stents: balancing the reduction in restenosis with the concern of late thrombosis. Lancet 2008; 371:2134–2143.
- Bavry AA, Bhatt DL. Drug-eluting stents: dual antiplatelet therapy for every survivor? Circulation 2007; 116:696–699.
- Meadows TA, Bhatt DL. Clinical aspects of platelet inhibitors and thrombus formation. Circ Res 2007; 100:1261–1275.
- Bhatt DL, Topol EJ. Scientific and therapeutic advances in antiplatelet therapy. Nat Rev Drug Discov 2003; 2:15–28.
- Yusuf S, Zhao F, Mehta SR, Chrolavicius S, Tognoni G, Fox KK; Clopidogrel in Unstable Angina to Prevent Recurrent Events Trial Investigators. Effects of clopidogrel in addition to aspirin in patients with acute coronary syndromes without ST-segment elevation. N Engl J Med 2001; 345:494–502. Errata in N Engl J Med 2001; 345:1506 and N Engl J Med 2001; 345:1716.
- Mehta SR, Yusuf S, Peters RJ, et al; Clopidogrel in Unstable angina to prevent Recurrent Events trial (CURE) Investigators. Effects of pretreatment with clopidogrel and aspirin followed by long-term therapy in patients undergoing percutaneous coronary intervention: the PCI-CURE study. Lancet 2001; 358:527–533.
- Anderson JL, Adams CD, Antman EM, et al; American College of Cardiology; American Heart Association Task Force on Practice Guidelines (Writing Committee to Revise the 2002 Guidelines for the management of Patients With Unstable Angina/Non-ST-Elevation Myocardial Infarction); american College of Emergency Physicians; Society for Cardiovascular Angiography and Interventions; Society of Thoracic Surgeons; American Association of Cardiovascular and Pulmonary Rehabilitation; Society for Academic Emergency Medicine. ACC/AHA 2007 guidelines for the management of patients with unstable angina/non-ST-Elevation myocardial infarction: a report of the American College of Cardiology/American Heart Association Task Force on Practice Guidelines (Writing Committee to Revise the 2002 Guidelines for the Management of Patients With Unstable Angina/Non-ST-Elevation Myocardial Infarction) developed in collaboration with the American College of Emergency Physicians, the Society for Cardiovascular Angiography and Interventions, and the Society of Thoracic Surgeons endorsed by the American Association of Cardiovascular and Pulmonary Rehabilitation and the Society for Academic Emergency Medicine. J Am Coll Cardiol 2007; 50:e1–e157.
- Ho PM, Peterson ED, Wang L, et al. Incidence of death and acute myocardial infarction associated with stopping clopidogrel after acute coronary syndrome. JAMA 2008; 299:532–539. Erratum in JAMA 2008; 299:2390.
- Bhatt DL, Fox KA, Hacke W, et al; CHARISMA Investigators. Clopidogrel and aspirin versus aspirin alone for the prevention of atherothrombotic events. N Engl J Med 2006; 354:1706–1717.
- Bhatt DL, Flather MD, Hacke W, et al; CHARISMA Investigators. Patients with prior myocardial infarction, stroke, or symptomatic peripheral arterial disease in the CHARISMA trial. J Am Coll Cardiol 2007; 49:1982–1988.
- Bhatt DL. Intensifying platelet inhibition—navigating between Scylla and Charybdis. N Engl J Med 2007; 357:2078–2081.
- Bhatt DL, Scheiman J, Abraham NS, et al; American College of Cardiology Foundation Task Force on Clinical Expert Consensus Documents. ACCF/ACG/AHA 2008 expert consensus document on reducing the gastrointestinal risks of antiplatelet therapy and NSAID use: a report of the American College of Cardiology Foundation Task Force on Clinical Expert Consensus Documents. Circulation 2008; 118:1894–1909.
- Steinhubl SR, Bhatt DL, Brennan DM, et al; CHARISMA Investigators. Aspirin to prevent cardiovascular disease: the association of aspirin dose and clopidogrel with thrombosis and bleeding. Ann Intern Med 2009; 150:379–386.
- Mehta SR, Bassand JP, Chrolavicius S, et al; CURRENT-OASIS 7 Steering Committee. Design and rationale of CURRENT-OASIS 7: a randomized, 2 x 2 factorial trial evaluating optimal dosing strategies for clopidogrel and aspirin in patients with ST and non-ST-elevation acute coronary syndromes managed with an early invasive strategy. Am Heart J 2008; 156:1080–1088.
- Mehta SR, Van de Werf F. A randomized comparison of a clopidogrel high loading and maintenance dose regimen versus standard dose and high versus low dose aspirin in 25,000 patients with acute coronary syndromes: results of the CURRENT OASIS 7 trial. Paper presented at the European Society of Cardiology Congress; August 30, 2009; Barcelona, Spain. Also available online at www.Escardio.org/congresses/esc-2009/congress-reports. Accessed December 12, 2009.
- Serebruany VL, Steinhubl SR, Berger PB, Malinin AT, Bhatt DL, Topol EJ. Variability in platelet responsiveness to clopidogrel among 544 individuals. J Am Coll Cardiol 2005; 45:246–251.
- Bhatt DL. Prasugrel in clinical practice [perspective]. N Engl J Med 2009; 361:940–942.
- Wiviott SD, Braunwald E, McCabe CH, et al; TRITON-TIMI 38 Investigators. Prasugrel versus clopidogrel in patients with acute coronary syndromes. N Engl J Med 2007; 357:2001–2015.
- Bhatt DL, Lincoff AM, Gibson CM, et al; for the CHAMPION PLATFORM Investigators. Intravenous platelet blockade with cangrelor during PCI. N Engl J Med 2009 Nov 15(epub ahead of print).
- Harrington RA, Stone GW, McNulty S, et al. Platelet inhibition with cangrelor in patient sundergoing PCI. N Engl J Med 2009 Nov 17(epub ahead of print).
- Wallentin L, Becker RC, Budaj A, et al; PLATO Investigators. Ticagrelor versus clopidogrel in patients with acute coronary syndromes. N Engl J Med 2009; 361:1045–1057.
- Bhatt DL. Ticagrelor in ACS—what does PLATO teach us? Nat Rev Cardiol 2009; 6:737–738.
Despite all the attention paid to ST-segment-elevation myocardial infarction (MI), in terms of sheer numbers, non-ST-elevation MI and unstable angina are where the action is. Acute coronary syndromes account for 2.43 million hospital discharges per year. Of these, 0.46 million are for ST-elevation MI and 1.97 million are for non-ST-elevation MI and unstable angina.1,2
A number of recent studies have begun to answer some of the pressing questions about treating these types of acute coronary syndromes. In this article, I update the reader on these studies, along with recent findings regarding stenting and antiplatelet agents. As you will see, they are all interconnected.
TO CATHETERIZE IS BETTER THAN NOT TO CATHETERIZE
In the 1990s, a topic of debate was whether patients presenting with unstable angina or non-ST-elevation MI should routinely undergo catheterization or whether they would do just as well with a conservative approach, ie, undergoing catheterization only if they developed recurrent, spontaneous, or stress-induced ischemia. Now, the data are reasonably clear and favor an aggressive strategy.3
Mehta et al4 performed a meta-analysis of seven randomized controlled trials (N = 9,212 patients) of aggressive vs conservative angiography and revascularization for non-ST-elevation MI or unstable angina. The results favored the aggressive strategy. At 17 months of follow-up, death or MI had occurred in 7.4% of patients who received the aggressive therapy compared with 11.0% of those who received the conservative therapy, for an odds ratio of 0.82 (P = .001).
The CRUSADE (Can Rapid Risk Stratification of Unstable Angina Patients Suppress Adverse Outcomes With Early Implemention of the ACC/AHA Guidelines?) Quality Improvement Initiative5 analyzed data from a registry of 17,926 patients with non-ST-elevation acute coronary syndrome who were at high risk because of positive cardiac markers or ischemic electrocardiographic changes. Overall, 2.0% of patients who received early invasive care (catheterization within the first 48 hours) died in the hospital compared with 6.2% of those who got no early invasive care, for an adjusted odds ratio of 0.63 (95% confidence interval [CI] 0.52–0.77).
The investigators also stratified the patients into those at low, medium, and high risk, using the criteria of the PURSUIT (Platelet Glycoprotein IIb/IIIa in Unstable Angina: Receptor Suppression Using Integrilin [eptifibatide] Therapy) risk score. There were fewer deaths with early invasive therapy in each risk group, and the risk reduction was greatest in the high-risk group.5
Bavry et al6 performed an updated meta-analysis of randomized trials. At a mean follow-up of 24 months, the relative risk of death from any cause was 0.75 in patients who received early invasive therapy.
In another meta-analysis, O’Donoghue et al7 found that the odds ratio of death, MI, or rehospitalization with acute coronary syndromes was 0.73 (95% CI 0.55–0.98) in men who received invasive vs conservative therapy; in women it was 0.81 (95% CI 0.65–1.01). In women, the benefit was statistically significant in those who had elevations of creatine kinase MB or troponin but not in those who did not, though the benefit in men appeared to be less dependent on the presence of biomarker abnormalities.
MUST ANGIOGRAPHY BE DONE IN THE FIRST 24 HOURS?
Although a number of trials showed that a routine invasive strategy leads to better outcomes than a conservative strategy, until recently we had no information as to whether the catheterization needed to be done early (eg, within the first 24 hours) or if it could be delayed a day or two while the patient received medical therapy.
Mehta et al8 conducted a trial to find out: the Timing of Intervention in Acute Coronary Syndrome (TIMACS) trial. Patients were included if they had unstable angina or non-ST-elevation MI, presented to a hospital within 24 hours of the onset of symptoms, and had two of three high-risk features: age 60 years or older, elevated cardiac biomarkers, or electrocardiographic findings compatible with ischemia. All received standard medical therapy, and 3,031 were randomly assigned to undergo angiography either within 24 hours after randomization or 36 or more hours after randomization.
At 6 months, the primary outcome of death, new MI, or stroke had occurred in 9.6% of the patients in the early-intervention group and in 11.3% of those in the delayed-intervention group, but the difference was not statistically significant. However, the difference in the rate of a secondary end point, death, MI, or refractory ischemia, was statistically significant: 9.5% vs 12.9%, P = .003, owing mainly to less refractory ischemia with early intervention.
The patients were also stratified into two groups by baseline risk. The rate of the primary outcome was significantly lower with early intervention in high-risk patients, but not in those at intermediate or low risk. Thus, early intervention may be beneficial in patients at high risk, such as those with ongoing chest pain, but not necessarily in those at low risk.
LEAVE NO LESION BEHIND?
Coronary artery disease often affects more than one segment. Until recently, it was not known whether we should stent all stenotic segments in patients presenting with non-ST-elevation MI or unstable angina, or only the “culprit lesion.”
Shishehbor et al9 examined data from a Cleveland Clinic registry of 1,240 patients with acute coronary syndrome and multivessel coronary artery disease who underwent bare-metal stenting. The median follow-up was 2.3 years. Using a propensity model to match patients in the two groups with similar baseline characteristics, they found that the rate of repeat revascularization was less with multivessel intervention than with culprit-only stenting, as was the rate of the combined end point of death, MI, or revascularization, but not that of all-cause mortality or the composite of death or MI.
BARE-METAL VS DRUG-ELUTING STENTS: BALANCING THE RISKS AND BENEFITS
After a patient receives a stent, two bad things can happen: the artery can close up again either gradually, in a process called restenosis, or suddenly, via thrombosis.
Drug-eluting stents were invented to solve the problem of restenosis, and they work very well. Stone et al10 pooled the data from four double-blind trials of sirolimus (Rapamune) stents and five double-blind trials of paclitaxel (Taxol) stents and found that, at 4 years, the rates of target-lesion revascularization (for restenosis) were 7.8% with sirolimus stents vs 23.6% with bare-metal stents (P < .001), and 10.1% with paclitaxel stents vs 20.0% with bare-metal stents (P < .001).
Thrombosis was much less common in these studies, occurring in 1.2% of the sirolimus stent groups vs 0.6% of the bare-metal stent groups (P = .20), and in 1.3% of the paclitaxel stent groups vs 0.9% of the bare-metal stent groups (P = .30).10
However, drug-eluting stents appear to increase the risk of thrombosis later on, ie, after 1 year. Bavry et al,11 in a meta-analysis, calculated that when stent thrombosis occurred, the median time after implantation was 15.5 months with sirolimus stents vs 4 months with bare-metal stents (P = .0052), and 18 months with paclitaxel stents vs 3.5 months with bare-metal stents (P = .04). The absolute risk of very late stent thrombosis after 1 year was very low, with five events per 1,000 patients with drug-eluting stents vs no events with bare-metal stents (P = .02). Nevertheless, this finding has practical implications. How long must patients continue dual antiplatelet therapy? And what if a patient needs surgery a year later?
Restenosis is not always so gradual
Although stent thrombosis is serious and often fatal, bare-metal stent restenosis is not always benign either, despite the classic view that stent restenosis is a gradual process that results in exertional angina. Reviewing 1,186 cases of bare-metal stent restenosis in 984 patients at Cleveland Clinic, Chen et al12 reported that 9.5% of cases presented as acute MI (2.2% as ST-elevation MI and 7.3% as non-ST-elevation MI), and 26.4% as unstable angina requiring hospitalization.
A Mayo Clinic study13 corroborated these findings. The 10-year incidence of clinical bare-metal stent restenosis was 18.1%, and the incidence of MI was 2.1%. The 10-year rate of bare-metal stent thrombosis was 2%. Off-label use, primarily in saphenous vein grafts, increased the incidence; other correlates were prior MI, peripheral arterial disease, and ulcerated lesions.
Furthermore, bare-metal stent thrombosis can also occur later. We saw a case that occurred 13 years after the procedure, 3 days after the patient stopped taking aspirin because he was experiencing flu-like symptoms, ran out of aspirin, and felt too sick to go out and buy more. The presentation was with ST-elevation MI. The patient recovered after treatment with intracoronary abciximab (ReoPro), percutaneous thrombectomy, balloon angioplasty, and, eventually, bypass surgery.14
No difference in risk of death with drug-eluting vs bare-metal stents
Even though drug-eluting stents pose a slightly higher risk of thrombosis than bare-metal stents, the risk of death is no higher.15
I believe the reason is that there are competing risks, and that the higher risk of thrombosis with first-generation drug-eluting stents and the higher risk of restenosis with bare-metal stents essentially cancel each other out. For most patients, there is an absolute benefit with drug-eluting stents, which reduce the need for revascularization with no effect in terms of either increasing or decreasing the risk of MI or death. Second-generation drug-eluting stents may have advantages in reducing rates of death or MI compared with first-generation drug-eluting stents, though this remains to be proven conclusively.
The right revascularization for the right patient
Bavry and I16 developed an algorithm for deciding on revascularization, posing a series of questions:
- Does the patient need any form of revascularization?
- Is he or she at higher risk of both stent thrombosis and restenosis, as in patients with diabetes, diffuse multivessel disease with bifurcation lesions, or chronic total occlusions? If so, coronary artery bypass grafting remains an excellent option.
- Does he or she have a low risk of restenosis, as in patients without diabetes with focal lesions in large vessels? If so, one could consider a bare-metal stent, which would probably be more cost-effective than a drug-eluting stent in this situation.
- Does the patient have relative contraindications to drug-eluting stents? Examples are a history of noncompliance with medical therapy, financial issues such as lack of insurance that would make buying clopidogrel (Plavix) a problem, long-term anticoagulation, or anticipated need for surgery in the next few years.
If a drug-eluting stent is used, certain measures can help ensure that it is used optimally. It should often be placed under high pressure with a noncompliant balloon so that it achieves contact with the artery wall all around. One should consider intravascular ultrasonographic guidance to make sure the stent is well opposed if it is in a very calcified lesion. Dual antiplatelet therapy with clopidogrel and aspirin should be given for at least 1 year, and if there is no bleeding, perhaps longer, pending further data.16
LEAVE NO PLATELET ACTIVATED?
Platelets have several types of receptors that, when bound by their respective ligands, lead to platelet activation and aggregation and, ultimately, thrombus formation. Antagonists to some of these receptors are available or are being developed.17
For long-term therapy, blocking the process “upstream,” ie, preventing platelet activation, is better than blocking it “downstream,” ie, preventing aggregation. For example, clopidogrel, ticlopipine (Ticlid), and prasugrel (Effient) have active metabolites that bind to a subtype of the adenosine diphosphate receptor and prevent platelet activation, whereas the glycoprotein IIb/IIIa inhibitors such as abciximab work downstream, binding to a different receptor and preventing aggregation.18
Dual therapy for 1 year is the standard of care after acute coronary syndromes
The evidence for using dual antiplatelet therapy (ie, aspirin plus clopidogrel) in patients with acute coronary syndromes without ST-elevation is very well established.
The Clopidogrel in Unstable Angina to Prevent Recurrent Events (CURE) trial,19 published in 2001, found a 20% relative risk reduction and a 2% absolute risk reduction in the incidence of MI, stroke, or cardiovascular death in patients randomly assigned to receive clopidogrel plus aspirin for 1 year vs aspirin alone for 1 year (P < .001). In the subgroup of patients who underwent percutaneous coronary intervention, the relative risk reduction in the incidence of MI or cardiovascular death at 1 year of follow-up was 31% (P = .002).20
As a result of these findings, the cardiology society guidelines21 recommend a year of dual antiplatelet therapy after acute coronary syndromes, regardless of whether the patient is treated medically, percutaneously, or surgically.
But what happens after clopidogrel is withdrawn? Ho et al22 retrospectively analyzed data from Veterans Affairs hospitals and found a spike in the incidence of death or MI in the first 90 days after stopping clopidogrel treatment. This was true in medically treated patients as well as in those treated with percutaneous coronary interventions, in those with or without diabetes mellitus, in those who received a drug-eluting stent or a bare-metal stent, and in those treated longer than 9 months.
The investigators concluded that there might be a “clopidogrel rebound effect.” However, I believe that a true rebound effect, such as after withdrawal of heparin or warfarin, is biologically unlikely with clopidogrel, since clopidogrel irreversibly binds to its receptor for the 7- to 10-day life span of the platelet. Rather, I believe the phenomenon must be due to withdrawal of protection in patients at risk.
In stable patients, dual therapy is not as beneficial
Would dual antiplatelet therapy with clopidogrel and aspirin also benefit patients at risk of atherothrombotic events but without acute coronary syndromes?
The Clopidogrel for High Atherothrombotic Risk and Ischemic Stabilization, Management, and Avoidance (CHARISMA) trial23 included 15,603 patients with either clinically evident but stable cardiovascular disease or multiple risk factors for athero-thrombosis. They were randomly assigned to receive either clopidogrel 75 mg/day plus aspirin 75 to 162 mg/day or placebo plus aspirin. At a median of 28 months, the groups did not differ significantly in the rate of MI, stroke, or death from cardiovascular causes.
However, the subgroup of patients who had documented prior MI, ischemic stroke, or symptomatic peripheral arterial disease did appear to derive significant benefit from dual therapy.24 In this subgroup, the rate of MI, stroke, or cardiovascular death at a median follow-up of 27.6 months was 8.8% with placebo plus aspirin compared with 7.3% with clopidogrel plus aspirin, for a hazard ratio of 0.83 (95% CI 0.72–0.96, P = .01). Unstented patients with stable coronary artery disease but without prior MI derived no benefit.
Bleeding and thrombosis: The Scylla and Charybdis of antiplatelet therapy
However, with dual antiplatelet therapy, we steer between the Scylla of bleeding and the Charybdis of thrombosis.25
In the CHARISMA subgroup who had prior MI, ischemic stroke, or symptomatic peripheral arterial disease, the incidence of moderate or severe bleeding was higher with dual therapy than with aspirin alone, but the rates converged after about 1 year of treatment.24 Further, there was no difference in fatal bleeding or intracranial bleeding, although the rate of moderate bleeding (defined as the need for transfusion) was higher with dual therapy (2.0% vs 1.3%, P = .004).
I believe the data indicate that if a patient can tolerate dual antiplatelet therapy for 9 to 12 months without any bleeding issues, he or she is unlikely to have a major bleeding episode if dual therapy is continued beyond this time.
About half of bleeding events in patients on chronic antiplatelet therapy are gastrointestinal. To address this risk, in 2008 an expert committee from the American College of Cardiology, American College of Gastroenterology, and American Heart Association issued a consensus document26 in which they recommended assessing gastrointestinal risk factors in patients on antiplatelet therapy, such as history of ulcers (and testing for and treating Helicobacter pylori infection if present), history of gastrointestinal bleeding, concomitant anticoagulant therapy, and dual antiplatelet therapy. If any of these were present, the committee recommended considering a proton pump inhibitor. The committee also recommended a proton pump inhibitor for patients on antiplatelet therapy who have more than one of the following: age 60 years or more, corticosteroid use, or dyspepsia or gastroesophageal reflux symptoms.
Some ex vivo platelet studies and observational analyses have suggested that there might be an adverse interaction between clopidogrel and proton pump inhibitors due to a blunting of clopidogrel’s antiplatelet effect. A large randomized clinical trial was designed and launched to determine if a single-pill combination of the proton pump inhibitor omeprazole (Prilosec) and clopidogrel would be safer than clopidogrel alone when added to aspirin. Called COGENT-1 (Clopidogrel and the Optimization of GI Events Trial), it was halted early in 2009 when it lost its funding. However, preliminary data did not show an adverse interaction between clopidogrel and omeprazole.
What is the right dose of aspirin?
Steinhubl et al27 performed a post hoc observational analysis of data from the CHARISMA trial. Their findings suggested that higher doses of aspirin are not more effective than lower doses for chronic therapy. Furthermore, in the group receiving clopidogrel plus aspirin, the incidence of severe or life-threatening bleeding was significantly greater with aspirin doses higher than 100 mg than with doses lower than 100 mg, 2.6% vs 1.7%, P = .040.
A randomized, controlled trial called Clopidogrel Optimal Loading Dose Usage to Reduce Recurrent Events/Optimal Antiplatelet Strategy for Interventions (CURRENT/OASIS 7)28 recently reported that higher-dose aspirin (ie, 325 mg) may be better than lower dose aspirin (ie, 81 mg) in patients with acute coronary syndromes undergoing percutaneous coronary intervention and receiving clopidogrel. During this 30-day study, there was no increase in overall bleeding with the higher dose of aspirin, though gastrointestinal bleeding was slightly increased.29 In a factorial design, the second part of this trial found that a higher-dose clopidogrel regimen reduced stent thrombosis.29
Should nonresponders get higher doses of clopidogrel?
In vitro, response to clopidogrel shows a normal bell-shaped distribution.30 In theory, therefore, patients who are hyperresponders may be at higher risk of bleeding, and those who are hyporesponders may be at risk of ischemic events.
A clinical trial is under way to examine whether hyporesponders should get higher doses. Called GRAVITAS (Gauging Responsiveness With a VerifyNow Assay Impact on Thrombosis and Safety), it will use a point-of-care platelet assay and then allocate patients to receive either standard therapy or double the dose of clopidogrel. The primary end point will be the rate of cardiovascular death, nonfatal MI, or stent thrombosis at 6 months.
Is prasugrel better than clopidogrel?
Prasugrel (Effient) is a new drug of the same class as clopidogrel, ie, a thienopyridine, with its active metabolite binding to the same platelet receptor as clopidogrel and inhibiting platelet aggregation more rapidly, more consistently, and to a greater extent than clopidogrel. Prasugrel was recently approved by the Food and Drug Administration. But is it better?31
The Trial to Assess Improvement in Therapeutic Outcomes by Optimizing Platelet Inhibition With Prasugrel–Thrombolysis in Myocardial Infarction (TRITON-TIMI 38) compared prasugrel and clopidogrel in 13,608 patients with moderate- to high-risk acute coronary syndromes who were scheduled to undergo percutaneous coronary intervention.32
Overall, prasugrel was better. At 15 months, the incidence of the primary end point (death from cardiovascular causes, nonfatal MI, or nonfatal stroke) was significantly lower with prasugrel therapy than with clopidogrel in the entire cohort (9.9% vs 12.1%, hazard ratio 0.81, 95% CI 0.73–0.90, P < .001), in the subgroup with ST-segment elevation MI, and in the subgroup with unstable angina or non-ST-elevation MI.
However, there was a price to pay. The rate of major bleeding was higher with prasugrel (2.4% vs 1.8%, hazard ratio 1.32, 95% CI 1.03–1.68, P = .03). Assessing the balance between the risk and the benefit, the investigators identified three subgroups who did not derive a net clinical benefit from prasugrel: patients who had had a previous stroke or transient ischemic attack (this group actually had a net harm from prasugrel), patients 75 years of age or older, and patients weighing less than 60 kg (132 pounds).
More work is needed to determine which patients are best served by standard-dose clopidogrel, higher doses of clopidogrel, platelet-assay-guided dosing of clopidogrel, or prasugrel.24
Short-acting, potent intravenous platelet blockade with an agent such as cangrelor is theoretically appealing, but further research is necessary.33,34 Ticagrelor, a reversible adenosine diphosphate receptor antagonist, provides yet another potential option in antiplatelet therapy for acute coronary syndromes. In the recent PLATO trial (Study of Platelet Inhibition and Patient Outcomes), compared with clopidogrel, ticagrelor reduced the risk of ischemic events, including death.35,36 Here, too, there was more major bleeding (unrelated to coronary artery bypass grafting) with ticagrelor.
Thus, clinical assessment of an individual patient’s ischemic and bleeding risks will continue to be critical as therapeutic strategies evolve.
- Wiviott SD, Morrow DA, Giugliano RP, et al. Performance of the Thrombolysis In Myocardial Infarction risk index for early acute coronary syndrome in the National Registry of Myocardial Infarction: a simple risk index predicts mortality in both ST and non-ST elevation myocardial infarction [abstract]. J Am Coll Cardiol 2003; 43( suppl 2):365A–366A.
- Thom T, Haase N, Rosamond W, et al; American Heart Association Statistics Committee and Stroke Statistics Subcommittee. Circulation 2006; 113:e85–e151. Errata in Circulation 2006; 113:e696 and Circulation 2006 114:e630.
- Bhatt DL. To cath or not to cath. That is no longer the question. JAMA 2005; 293:2935–2937.
- Mehta SR, Cannon CP, Fox KA, et al. Routine vs selective invasive strategies in patients with acute coronary syndromes: a collaborative meta-analysis of randomized trials. JAMA 2005; 293:2908–2917.
- Bhatt DL, Roe MT, Peterson ED, et al; for the CRUSADE Investigators. Utilization of early invasive management strategies for high-risk patients with non-ST-segment elevation acute coronary syndromes: results from the CRUSADE Quality Improvement Initiative. JAMA 2004; 292:2096–2104.
- Bavry AA, Kumbhani DJ, Rassi AN, Bhatt DL, Askari AT. Benefit of early invasive therapy in acute coronary syndromes: a meta-analysis of contemporary randomized clinical trials. J Am Coll Cardiol 2006; 48:1319–1325.
- O’Donoghue MO, Boden WE, Braunwald E, et al. Early invasive vs conservative treatment strategies in women and men with unstable angina and non-ST segment elevation myocardial infarction: a meta-analysis. JAMA 2008; 300:71–80.
- Mehta SR, Granger CB, Boden WE, et al; TIMACS Investigators. Early versus delayed invasive intervention in acute coronary syndromes. N Engl J Med 2009; 360:2165–2175.
- Shishehbor MH, Lauer MS, Singh IM, et al. In unstable angina or non-ST-segment acute coronary syndrome, should patients with multivessel coronary artery disease undergo multivessel or culpritonly stenting? J Am Coll Cardiol 2007; 49:849–854.
- Stone GW, Moses JW, Ellis SG, et al. Safety and efficacy of sirolimus- and paclitaxel-eluting coronary stents. N Engl J Med 2007; 356:998–1008.
- Bavry AA, Kumbhani DJ, Helton TJ, Borek PP, Mood GR, Bhatt DL. Late thrombosis of drug-eluting stents: a meta-analysis of randomized clinical trials. Am J Med 2006; 119:1056–1061.
- Chen MS, John JM, Chew DP, Lee DS, Ellis SG, Bhatt DL. Bare metal stent restenosis is not a benign clinical entity. Am Heart J 2006; 151:1260–1264.
- Doyle B, Rihal CS, O’Sullivan CJ, et al. Outcomes of stent thrombosis and restenosis during extended follow-up of patients treated with bare-metal coronary stents. Circulation 2007; 116:2391–2398.
- Sarkees ML, Bavry AA, Galla JM, Bhatt DL. Bare metal stent thrombosis 13 years after implantation. Cardiovasc Revasc Med 2009; 10:58–91.
- Bavry AA, Bhatt DL. Appropriate use of drug-eluting stents: balancing the reduction in restenosis with the concern of late thrombosis. Lancet 2008; 371:2134–2143.
- Bavry AA, Bhatt DL. Drug-eluting stents: dual antiplatelet therapy for every survivor? Circulation 2007; 116:696–699.
- Meadows TA, Bhatt DL. Clinical aspects of platelet inhibitors and thrombus formation. Circ Res 2007; 100:1261–1275.
- Bhatt DL, Topol EJ. Scientific and therapeutic advances in antiplatelet therapy. Nat Rev Drug Discov 2003; 2:15–28.
- Yusuf S, Zhao F, Mehta SR, Chrolavicius S, Tognoni G, Fox KK; Clopidogrel in Unstable Angina to Prevent Recurrent Events Trial Investigators. Effects of clopidogrel in addition to aspirin in patients with acute coronary syndromes without ST-segment elevation. N Engl J Med 2001; 345:494–502. Errata in N Engl J Med 2001; 345:1506 and N Engl J Med 2001; 345:1716.
- Mehta SR, Yusuf S, Peters RJ, et al; Clopidogrel in Unstable angina to prevent Recurrent Events trial (CURE) Investigators. Effects of pretreatment with clopidogrel and aspirin followed by long-term therapy in patients undergoing percutaneous coronary intervention: the PCI-CURE study. Lancet 2001; 358:527–533.
- Anderson JL, Adams CD, Antman EM, et al; American College of Cardiology; American Heart Association Task Force on Practice Guidelines (Writing Committee to Revise the 2002 Guidelines for the management of Patients With Unstable Angina/Non-ST-Elevation Myocardial Infarction); american College of Emergency Physicians; Society for Cardiovascular Angiography and Interventions; Society of Thoracic Surgeons; American Association of Cardiovascular and Pulmonary Rehabilitation; Society for Academic Emergency Medicine. ACC/AHA 2007 guidelines for the management of patients with unstable angina/non-ST-Elevation myocardial infarction: a report of the American College of Cardiology/American Heart Association Task Force on Practice Guidelines (Writing Committee to Revise the 2002 Guidelines for the Management of Patients With Unstable Angina/Non-ST-Elevation Myocardial Infarction) developed in collaboration with the American College of Emergency Physicians, the Society for Cardiovascular Angiography and Interventions, and the Society of Thoracic Surgeons endorsed by the American Association of Cardiovascular and Pulmonary Rehabilitation and the Society for Academic Emergency Medicine. J Am Coll Cardiol 2007; 50:e1–e157.
- Ho PM, Peterson ED, Wang L, et al. Incidence of death and acute myocardial infarction associated with stopping clopidogrel after acute coronary syndrome. JAMA 2008; 299:532–539. Erratum in JAMA 2008; 299:2390.
- Bhatt DL, Fox KA, Hacke W, et al; CHARISMA Investigators. Clopidogrel and aspirin versus aspirin alone for the prevention of atherothrombotic events. N Engl J Med 2006; 354:1706–1717.
- Bhatt DL, Flather MD, Hacke W, et al; CHARISMA Investigators. Patients with prior myocardial infarction, stroke, or symptomatic peripheral arterial disease in the CHARISMA trial. J Am Coll Cardiol 2007; 49:1982–1988.
- Bhatt DL. Intensifying platelet inhibition—navigating between Scylla and Charybdis. N Engl J Med 2007; 357:2078–2081.
- Bhatt DL, Scheiman J, Abraham NS, et al; American College of Cardiology Foundation Task Force on Clinical Expert Consensus Documents. ACCF/ACG/AHA 2008 expert consensus document on reducing the gastrointestinal risks of antiplatelet therapy and NSAID use: a report of the American College of Cardiology Foundation Task Force on Clinical Expert Consensus Documents. Circulation 2008; 118:1894–1909.
- Steinhubl SR, Bhatt DL, Brennan DM, et al; CHARISMA Investigators. Aspirin to prevent cardiovascular disease: the association of aspirin dose and clopidogrel with thrombosis and bleeding. Ann Intern Med 2009; 150:379–386.
- Mehta SR, Bassand JP, Chrolavicius S, et al; CURRENT-OASIS 7 Steering Committee. Design and rationale of CURRENT-OASIS 7: a randomized, 2 x 2 factorial trial evaluating optimal dosing strategies for clopidogrel and aspirin in patients with ST and non-ST-elevation acute coronary syndromes managed with an early invasive strategy. Am Heart J 2008; 156:1080–1088.
- Mehta SR, Van de Werf F. A randomized comparison of a clopidogrel high loading and maintenance dose regimen versus standard dose and high versus low dose aspirin in 25,000 patients with acute coronary syndromes: results of the CURRENT OASIS 7 trial. Paper presented at the European Society of Cardiology Congress; August 30, 2009; Barcelona, Spain. Also available online at www.Escardio.org/congresses/esc-2009/congress-reports. Accessed December 12, 2009.
- Serebruany VL, Steinhubl SR, Berger PB, Malinin AT, Bhatt DL, Topol EJ. Variability in platelet responsiveness to clopidogrel among 544 individuals. J Am Coll Cardiol 2005; 45:246–251.
- Bhatt DL. Prasugrel in clinical practice [perspective]. N Engl J Med 2009; 361:940–942.
- Wiviott SD, Braunwald E, McCabe CH, et al; TRITON-TIMI 38 Investigators. Prasugrel versus clopidogrel in patients with acute coronary syndromes. N Engl J Med 2007; 357:2001–2015.
- Bhatt DL, Lincoff AM, Gibson CM, et al; for the CHAMPION PLATFORM Investigators. Intravenous platelet blockade with cangrelor during PCI. N Engl J Med 2009 Nov 15(epub ahead of print).
- Harrington RA, Stone GW, McNulty S, et al. Platelet inhibition with cangrelor in patient sundergoing PCI. N Engl J Med 2009 Nov 17(epub ahead of print).
- Wallentin L, Becker RC, Budaj A, et al; PLATO Investigators. Ticagrelor versus clopidogrel in patients with acute coronary syndromes. N Engl J Med 2009; 361:1045–1057.
- Bhatt DL. Ticagrelor in ACS—what does PLATO teach us? Nat Rev Cardiol 2009; 6:737–738.
KEY POINTS
- The data favor an aggressive strategy of routine catheterization, rather than a conservative strategy of catheterization only if a patient develops recurrent, spontaneous, or stress-induced ischemia.
- Early percutaneous intervention (within 24 hours) may be beneficial in patients at higher risk, but not necessarily in those at lower risk.
- Drug-eluting stents appear safe, assuming dual antiplatelet therapy is used. It is unclear how long this therapy needs to be continued.
- The choice of revascularization strategy—bypass surgery, bare-metal stent, or drug-eluting stent—should be individualized based on the risk of restenosis, thrombosis, and other factors.
Thick skin on the back

Q: Which is the correct diagnosis?
- Scleroderma (systemic sclerosis)
- Scleredema diabeticorum
- Amyloidosis
- Cutaneous sarcoidosis
- Porphyria cutanea tarda
A: The correct answer is scleredema diabeticorum, a common, underdiagnosed skin manifestation of uncontrolled diabetes mellitus seen in 2.5% to 14% of diabetic patients.1,2 It most often presents with the insidious onset of painless induration and nonpitting thickening of the skin, predominantly on the upper back and neck. Biopsy of the skin usually reveals thickening of the dermis with deposition of collagen and hyaluronic acid without an inflammatory infiltrate.3
Of note, patients may present with similar skin changes acutely in conditions such as postinfectious scleredema (scleredema of Buschke) and paraproteinemias.
Treatment of scleredema is usually difficult, but options include radiotherapy, ultraviolet light therapy, low-dose methotrexate, psoralen, and extracorporeal photopheresis.4–7
- Cole GW, Headley J, Skowsky R. Scleredema diabeticorum: a common and distinct cutaneous manifestation of diabetes mellitus. Diabetes Care 1983; 6:189–192.
- Sattar MA, Diab S, Sugathan TN, Sivanandasingham P, Fenech FF. Scleroedema diabeticorum: a minor but often unrecognized complication of diabetes mellitus. Diabet Med 1988; 5:465–468.
- Varga J, Gotta S, Li L, Sollberg S, Di Leonardo M. Scleredema adultorum: case report and demonstration of abnormal expression of extracellular matrix genes in skin fibroblasts in vivo and in vitro. Br J Dermatol 1995; 132:992–999.
- Seyger MM, van den Hoogen FH, de Mare S, van Haelst U, de Jong EM. A patient with a severe scleroedema diabeticorum, partially responding to low-dose methotrexate. Dermatology 1999; 198:177–179.
- Lee MW, Choi JH, Sung KJ, Moon KC, Koh JK. Electron beam therapy in patients with scleredema. Acta Derm Venereol 2000; 80:307–308.
- Bowen AR, Smith L, Zone JJ. Scleredema adultorum of Buschke treated with radiation. Arch Dermatol 2003; 139:780–784.
- Beers WH, Ince A, Moore TL. Scleredema adultorum of Buschke: a case report and review of the literature. Semin Arthritis Rheum 2006; 35:355–359.
Q: Which is the correct diagnosis?
- Scleroderma (systemic sclerosis)
- Scleredema diabeticorum
- Amyloidosis
- Cutaneous sarcoidosis
- Porphyria cutanea tarda
A: The correct answer is scleredema diabeticorum, a common, underdiagnosed skin manifestation of uncontrolled diabetes mellitus seen in 2.5% to 14% of diabetic patients.1,2 It most often presents with the insidious onset of painless induration and nonpitting thickening of the skin, predominantly on the upper back and neck. Biopsy of the skin usually reveals thickening of the dermis with deposition of collagen and hyaluronic acid without an inflammatory infiltrate.3
Of note, patients may present with similar skin changes acutely in conditions such as postinfectious scleredema (scleredema of Buschke) and paraproteinemias.
Treatment of scleredema is usually difficult, but options include radiotherapy, ultraviolet light therapy, low-dose methotrexate, psoralen, and extracorporeal photopheresis.4–7
- Cole GW, Headley J, Skowsky R. Scleredema diabeticorum: a common and distinct cutaneous manifestation of diabetes mellitus. Diabetes Care 1983; 6:189–192.
- Sattar MA, Diab S, Sugathan TN, Sivanandasingham P, Fenech FF. Scleroedema diabeticorum: a minor but often unrecognized complication of diabetes mellitus. Diabet Med 1988; 5:465–468.
- Varga J, Gotta S, Li L, Sollberg S, Di Leonardo M. Scleredema adultorum: case report and demonstration of abnormal expression of extracellular matrix genes in skin fibroblasts in vivo and in vitro. Br J Dermatol 1995; 132:992–999.
- Seyger MM, van den Hoogen FH, de Mare S, van Haelst U, de Jong EM. A patient with a severe scleroedema diabeticorum, partially responding to low-dose methotrexate. Dermatology 1999; 198:177–179.
- Lee MW, Choi JH, Sung KJ, Moon KC, Koh JK. Electron beam therapy in patients with scleredema. Acta Derm Venereol 2000; 80:307–308.
- Bowen AR, Smith L, Zone JJ. Scleredema adultorum of Buschke treated with radiation. Arch Dermatol 2003; 139:780–784.
- Beers WH, Ince A, Moore TL. Scleredema adultorum of Buschke: a case report and review of the literature. Semin Arthritis Rheum 2006; 35:355–359.

Important changes to our CME program

For 16 years, we have offered CME based on a collection of articles in each issue (usually four). Many of you have complained that the maximum 1.5 credits for reading the articles and taking the test did not reflect the time you put into the activity.
Starting with this issue, all CME activities are based on individual articles, and you can receive up to 1 credit for each article read and test completed. The change gives you the flexibility to take a CME test for a specific article that interests you. If you want to receive credits for all CME-certified articles in one issue, it will mean extra effort to take separate tests, but you will be able to claim considerably more credit than in the past.
By offering CME for individual articles, we will also be able to offer it to those of you who read CCJM online rather than in print. Because the rules governing CME differ for print activities vs online-only activities, there will be two similar but separate pathways.
Print readers can identify CME-certified articles by the CME logo on the print issue table of contents or on the title page of each article. Those who wish to take the test for a CME-certified article can continue to our home page and click on the CME link. One more click on the appropriate link for print readers will take the reader directly to the test.
Online-only readers will find a link to the CME activity on the online table of contents or in the links next to the full-text version of the online article. They will be required to read the article online before taking the test.
We have tried to make this system as straightforward as possible, while still conforming to all the regulations governing CME.
We are also adding two innovations to our Web site. First, for those into social networking, there is now a social bookmarking feature. You can easily post a link to a CCJM article to a scholarly networking site such as CiteULike, or to a general social networking site such as Facebook, Twitter, or Digg. And second, we will soon add the ability for you to download some of our figures as PowerPoint slides.
Let us know what you think of our latest changes.