User login
Thumb: Scaling with Pitted Nail Plate
ANSWER
The most likely diagnosis is psoriasis (choice “d”), which can manifest with localized involvement (see discussion below).
Fungal infection (choice “a”) is unlikely, given the negative results of the KOH prep and total lack of response to treatment for that diagnosis.
Eczema (choice “b”) does not manifest as such thick, adherent scale. If any nail changes were involved, they would likely consist of transverse nail ridges.
A variant of squamous cell carcinoma (SCC; choice “c”)—caused by human papillomavirus (HPV), for example—can produce somewhat similar changes in the skin. But it would be unlikely to lead to nail changes, and it would not be intermittent, as this rash was in apparent response to OTC cream.
DISCUSSION
A punch biopsy is sometimes required to confirm the diagnosis of psoriasis, but this combination of skin and nail changes is quite suggestive of that entity. In this case, the confirmation was made by a different route: The rheumatologist judged that the patient’s arthritis was psoriatic in nature. The arthritis was treated with methotrexate, which soon cleared the skin disease without any help from dermatology.
This case serves to reinforce the possible mind-body role of stress in the genesis of this disease; however, at least 30% of the time, there is a positive family history. It also demonstrates the seemingly contradictory fact that the severity of the psoriasis doesn’t always correlate with the presence or absence of psoriatic arthritis.
Adding to the difficulty of making the diagnosis of psoriasis is the localized distribution of the scales, since it can usually be corroborated by finding lesions in their usual haunts—such as the extensor surfaces of arms, legs, on the trunk, or in the scalp. Cases such as this one force the provider to carefully consider the differential, which includes fungal infection. But the dermatophytes that cause ordinary fungal infections have to come from predictable sources (eg, children, pets, or farm animals), all missing from this patient’s history.
Had the rash been “fixed” (unchanging), the diagnosis of SCC would have to be considered more carefully. Superficial SCC is called Bowen’s disease, which, in cases such as this, is usually caused by HPV, not by the more typical overexposure to UV light. Though superficial, Bowen’s disease can become focally invasive and can even metastasize.
Had this patient not been treated with methotrexate, we would probably have used topical class 1 corticosteroid creams, which would have had a good chance to improve his skin but not his nail. The patient was also counseled regarding the role of stress and increased alcohol intake in the worsening of his disease. His prognosis for skin and joint disease is decent, though he will probably experience recurrences.

About a year ago, this 40-year-old man developed scaling on the distal one-third of his thumbnail. After an ini-tial apparent response to OTC hydrocortisone 1% cream, the condition began to worsen, spreading to more of the thumb. The patient’s primary care provider diagnosed fungal infection and prescribed a combination clotrima-zole/betamethasone cream, which had no effect. A subsequent four-month course of terbinafine (250 mg/d) also yielded no improvement. The patient then requested referral to dermatology. The patient considers himself “quite healthy,” aside from having moderately severe arthritis, for which he takes nabumetone (750 mg bid). His arthritis recently worsened, and he is scheduled to see a rheumatologist in two months. He admits to being under a great deal of stress shortly before his skin condition developed. As a result, he in-creased his alcohol intake for a few months, but he quit drinking altogether soon afterward. He denies any family history of skin disease and has no children or contact with animals. On examination, most of his thumb is covered by thick adherent white scales on a pinkish base. The margins are sharply defined. A KOH prep is performed, but no fungal elements are seen. The adjacent thumbnail has focal areas of pitting in the nail plate, as well as yellowish discoloration on the dis-tal edge. No such changes are seen on his other nails, and examination of his elbows, knees, trunk, and scalp fails to reveal any significant abnormalities.

Board Certification Requirements Changes
In 2005, we conducted a study of the prevalence of board certification requirements for hospital privileging of pediatricians.[1] Since that time, there have been many changes in the landscape of both physician and healthcare‐system quality assessment. New developments include greater utilization of physician quality‐of‐care assessment tools, a change from recertification for time‐limited board certification to Maintenance of Certification (MOC) in 2010, and an increasing commitment on the part of hospitals and state licensing officials to patient safety and quality‐of‐care issues, due in part to the continued interest by governmental and private payors and the public on external measurement of healthcare quality.[2, 3, 4, 5, 6]
MOC is an ongoing process of lifelong learning and self‐assessment to continuously improve knowledge and clinical performance. It has been adopted by all 24 member boards of the American Boards of Medical Specialties. MOC is focused on the 6 core competencies of quality medical care as outlined by the Accreditation Council for Graduate Medical Education (ACGME): (1) patient care, (2) medical knowledge, (3) practice‐based learning, (4) systems‐based practice, (5) professionalism, and (6) interpersonal and communication skills. To address, these competencies, MOC involves a 4‐part process for continuous learning that is required to keep certification current: (1) licensure and professional standing, (2) lifelong learning and self‐assessment, (3) cognitive expertise, and (4) practice performance assessment.[7, 8]
Our previous study found that many hospitals utilize specialty certification as a marker of quality for privileging.[1] To explore changes in the policies of hospitals regarding requirements for board certification and the incorporation of MOC into those requirements, we conducted a 5‐year follow‐up study of a national random sample of hospitals in 2010.
METHODS
Sample
All hospitals identified in the American Hospital Association's 2009 Annual Survey of Hospitals as providing care to pediatric patients were included in the sampling frame (N=2136). We then selected a stratified random sample of 10% of the total (N=220) hospitals weighted to provide nationally representative estimates. The sample was stratified by Council of Teaching Hospitals (COTH) designation (teaching vs nonteaching) and National Association of Children's Hospitals and Related Institutions (NACHRI) membership. In contrast to our previous study, in this study we did not stratify according to the designation of freestanding children's hospital (vs part of a hospital system) or metropolitan statistical area size (urban vs rural), as comparisons across these designations were not found to be significant in 2005.
Hospitals were sampled with varying probabilities from each stratum. Weights were applied to create a representative sample of the overall hospital population. The total sampling weight (TSW) calculated for each hospital was based on the probability of selection into the study (P) and the response rate (RR). The following formula was used: TSW: (1/P) (1/RR).
Survey Instrument
In collaboration with the American Board of Pediatrics Research Advisory Committee, we developed a 24‐item, fixed‐choice, structured questionnaire to be administered by phone. The survey was designed to be completed in 15 minutes or less and focused on board certification requirements at initial privileging, recredentialing, and MOC requirements.
The survey focused on the following descriptive research questions: Do hospitals require board certification for pediatricians at the time of initial privileging? Do they ever require board certification for privileging? Are there different certification requirements for generalists vs subspecialists? Are pediatricians with permanent certificates required to enroll in MOC?
Other questions focused on such issues such as whether the hospital was familiar with the requirements of MOC, whether MOC was required of all pediatricians, and whether the institution of MOC changed certification requirements at the hospital.
The instrument was pilot tested for clarity and ease of use with representatives from a convenience sample of hospitals within the state of Michigan and revised to clarify potentially ambiguous questions. Pilot surveys were not included in the analyses.
Questionnaire Administration
Data collection took place between April 2010 and June 2010. Interviewers requested to speak with the department responsible for credentialing or privileging at the hospital, typically the Medical Staff Office, the Office of Clinical Affairs, or the Credentialing or Privileging Department. When the appropriate person was identified and located, interviewers explained the purpose of the study and obtained verbal consent to participate.
Data Analysis
Initially, frequency distributions were calculated for all survey items to create descriptive statistics. Next, we performed a cross‐tabulation of responses by the specific hospital classifications listed above (COTH and NACHRI status) and computed the 2 statistics. Finally, we conducted bivariate analyses on the 2005 and 2010 results. SAS version 9.1 (SAS Institute Inc., Cary, NC) was used for all statistical analyses. P<0.05 was considered statistically significant.
Although this study is similar to the study that was completed in 2005,[1] we have reanalyzed those data to more specifically assess certification policy. All results are now weighted in contrast to the 2005 study, which only weighted the results by hospital classification. Thus, the numbers in some cases may be slightly different from those reported in 2006. We believe that this has resulted in a more robust analysis of hospital use of board certification in privileging.
Comparisons
Where possible, results were compared with those found in a 2005 study of hospital privileging.[1] The sampling frame for that study was identical to the current study, but the specific hospitals may or may not be included in the current study.
The study was approved by the University of Michigan Medical School Institutional Review Board.
RESULTS
Response Rate and Respondent Demographics
Of the 220 hospitals surveyed, 23 were ineligible because they did not have at least 1 pediatrician on staff. Of the remaining 197 hospitals, 154 completed the survey, resulting in a 78% participation rate.
Response rates did not differ significantly by NACHRI or COTH hospital status; therefore, there was no impact on the analytic power of the weighting. Approximately half (54%, n=82) of the respondents were NACHRI member hospitals, and 49% (n=75) were COTH hospitals.
Because not every hospital responded to every question, the total number for each question response may differ slightly.
2005 VS 2010 COMPARISONS
Board Certification Requirements
Compared with our findings in 2005, in 2010 a greater proportion of hospitals now require board certification for general pediatricians (80% vs 67%, P=0.141). Among these hospitals, a much larger proportion (24% vs 4%) now require board certification for all pediatricians at the point of initial privileging (Table 1). Similarly, a greater proportion of hospitals now require board certification for pediatric subspecialists (86% vs 71%, P=0.048). The percentage of hospitals that require subspecialists to be board certified at the point of initial privileging also increased from 10% in 2005 to 34% in 2010.
| General Pediatricians | Pediatric Subspecialists | |||
|---|---|---|---|---|
| 2005 (N=159) | 2010 (N=154) | 2005 (N=153) | 2010 (N=147) | |
| ||||
| Certification never required | 33%a | 20%a | 29%b | 14%b |
| Certification ever required | 67%a | 80%a | 71%b | 86%b |
| At time of initial privileging for all pediatricians | 4% | 24% | 10% | 34% |
| Within a specified time frame of initial privileging | 50% | 29% | 41% | 32% |
| At time of initial privileging but only for some pediatricians | 11% | 24% | 16% | 17% |
| Only recertification required | 2% | 3% | 4% | 3% |
The proportion of teaching (COTH) hospitals that require general pediatricians to be board certified at some point in time increased from 63% in 2005 to 89% in 2010 (P=0.001), and the percentage that require board certification for all pediatricians at initial privileging increased from 2% in 2005 to 25% in 2010. Similarly, the proportion of teaching hospitals that require pediatric subspecialists to be board certified increased from 66% in 2005 to 89% in 2010 (P=0.003).
There were small changes between 2005 and 2010 in the proportion of nonteaching (68% vs 79%, P=0.231), NACHRI‐member (76% vs 82%, P=0.366), and non‐NACHRI member (67% vs 80%, P=0.156) hospitals that require pediatricians to be board certified at some point in time. The proportion of nonteaching (4% vs 24%), NACHRI‐member (5% vs 32%), and non‐NACHRI (4% vs 23%) hospitals that require board certification at the point of initial privileging also increased between 2005 and 2010.
Certification Policies at Initial Privileging
Although in 2010, a greater proportion of hospitals reported that they require board certification for general pediatricians and pediatric subspecialists at the point of initial privileging, a much larger proportion of hospitals reported that they make exceptions to their board certification policies for both general pediatricians (99% vs 41%) (Table 2) and pediatric subspecialists (98% vs 14%) (Table 3). Among hospitals that do not require board certification at the point of initial privileging, only small differences were seen in requirements around completion of residency or fellowship training and time frame after which certification must be achieved (Tables 2 and 3).
| 2005 (N=159) | 2010 (N=154) | |
|---|---|---|
| Certification required at initial privileging | ||
| Yes | 4% | 24% |
| Mixed policy | 11% | 24% |
| No | 85% | 52% |
| If hospital required certification at initial privileging: | ||
| Allowed exceptions to policy at initial privileging | 41% | 99% |
| Required certification to be current | 99% | 99% |
| If hospital did not require certification at initial privileging: | ||
| Required to complete residency | 85% | 84% |
| Established time frame after which certification must be achieved | 48% | 51% |
| 2005 (N=153) | 2010 (N=147) | |
|---|---|---|
| Certification required at initial privileging | ||
| Yes | 10% | 34% |
| Mixed policy | 5% | 17% |
| No | 85% | 49% |
| If hospital required certification at initial privileging: | ||
| Allowed exceptions to policy at initial privileging | 14% | 98% |
| Required certification to be current | 83% | 100% |
| If hospital did not require certification at initial privileging: | ||
| Required to complete fellowship | 86% | 86% |
| Established time frame after which certification must be achieved | 47% | 52% |
There were no meaningful differences between board certification policies for general pediatricians and pediatric subspecialists in 2010.
Comparing Recertification and MOC Policies
Few hospitals required permanent certificate holders to recertify (2005) or enroll in MOC (2010) in 2005 (5%) or 2010 (6%). The proportion of hospitals that required recertification or MOC enrollment for general pediatricians increased from 33% in 2005 to 42% in 2010. Similarly, the percentage of hospitals that required recertification or MOC enrollment for pediatric subspecialists increased from 25% in 2005 to 35% in 2010.
Between 2005 and 2010, there was no significant change in the proportion of hospitals that reported revoking or denying privileges to a pediatrician due to failure to recertify or enroll in MOC (3% vs 6%).
SPECIFIC MAINTENANCE OF CERTIFICATION POLICIES IN 2010
Board Certification Requirements
Respondents from 29% of hospitals reported that they were not at all familiar with the American Board of Pediatrics' (ABP) MOC program. Most respondents (58%) were familiar with MOC, with 37% reporting that they were somewhat familiar, and 12% reporting that they were very familiar with the program.
Three‐fourths of hospitals (76%) reported that their MOC requirements do not differ from their recertification requirements held prior to the institution of MOC, and 14% reported that their hospital had not yet established specific MOC requirements.
The majority of respondents (62%) had verified the board certification of some physicians since the institution of the ABP's MOC program on January 1, 2010. A majority (53%) of hospitals track MOC data for all pediatricians, whereas 3% of respondents track MOC data only for those pediatricians whose initial certification was time limited.
Of those hospitals that require pediatricians with permanent certificates to enroll in MOC, 9% allow them to retain their privileges for a period of time if they are not meeting the requirements for MOC. Among hospitals that require pediatricians with time‐limited certificates to enroll in MOC, fewer than half allow general pediatricians (37%) and pediatric subspecialists (40%) to retain their privileges if they are not meeting the requirements for MOC.
The majority of respondents (89%) reported that the initiation of MOC had not changed board certification requirements at their hospital. However, respondents from over one‐quarter of hospitals (27%) reported that they expect changes in their hospital's certification or MOC requirements in the next 2 years. Those hospitals that reported changes moved to more stringent requirements for certification at initial privileging and requirements for permanent certificate holders to meet MOC requirements.
DISCUSSION
In the 5 years since our previous study, a larger proportion of hospitals now require pediatricians to become board certified to obtain hospital privileges. Of note is that a larger proportion of hospitals also now require board certification at the time of initial privileging for both generalist and subspecialist pediatricians.
Hospitals face increasing pressure to differentiate themselves from their peers through better patient outcomes.[9, 10] The increase from 67% to 80% of hospitals requiring board certification may be a result of hospitals utilizing certification as a proxy for assessment of physician quality or as a way to engage physicians in quality improvement through the MOC program.[11] Hospitals may also be responding to greater interest in MOC from regulatory agencies such as the Centers for Medicare and Medicaid Services Maintenance of Certification Program Incentive, which rewards physicians with an additional incentive payment beyond the Physician Quality Reporting System incentive for their participation in the MOC program.[12]
Interestingly, although a greater proportion of hospitals reported that they require certification, a much larger proportion of hospitals make exceptions to the policy. The exceptions could include grandfathering physicians who had hospital privileges prior to the policy change, or giving recent graduates additional time to obtain board certification. It is unknown whether or not all of these physicians would be required to obtain board certification or participate in MOC after some provisional time frame.
Hospitals in our study appear to be incorporating the MOC program into their policies. However, fewer than half of the hospitals studied require pediatricians with time‐limited certificates to enroll in MOC if their certificates have expired. In addition, some hospitals are still establishing their MOC requirements for those pediatricians with time‐limited and permanent certificates. It is likely that the majority of hospitals retained their previous board certification requirements, and that the current flux in hospital requirements is not unique to pediatrics, as all American Board of Medical Specialties' specialties have recently implemented MOC requirements.[13] Hospitals will likely adjust their credentialing policies as their familiarity and experience with MOC grows.
The primary purpose of the specialty certification process is to provide to the public, which includes both individual consumers and regulatory agencies, an assessment of the competency of individual physicians. Self‐regulation through certification is a privilege of trust granted to the medical profession by the public. This is an essential concept that underlies the concept of specialty certification.[14] As the public has continued to adopt a greater focus, and additional demands, on safety and quality assessment in healthcare, the medical profession must in turn be responsive.[13, 15, 16, 17] Failure in this regard would run the risk of losing that trust with the public, with the resultant loss of the ability to self‐regulate.
Studies have indicated a positive relationship between board certification and quality of care, yet this area remains hampered by a paucity of data.[18, 19, 20, 21, 22] Pham et al. found that board certified physicians were more likely to provide preventative care services to Medicare patients.[22] In 2008, Turchin et al. showed that recertification made a small, yet meaningful, difference in physician treatment of hypertension.[18] This area of research is especially important, as the MOC program is more comprehensive and utilizes an ongoing system of assessment and physician engagement. As such, it has been criticized by some for being complicated, burdensome, and irrelevant to the manner in which physicians actually practice.[23, 24] However, previous methods of certification were limited to assessing physicians at 1 point in time during their entire careers (eg, permanent certification) or at specific intervals (eg, time‐limited certification). With recent increased attention to improving the quality of patient care, these methods were unable to assure the public that physicians maintained their knowledge and skills over time in an environment of increasing rapid incorporation of new knowledge into clinical practice. Recent reports have also shown that (years of) practice does not make perfect with regard to physician performance. In fact, there may be deterioration of performance over long periods of practice.[25] Furthermore, although physicians commonly believe they are able to assess their own performance, available evidence does not support that contention.[26, 27] Thus, there is a need for an objective ongoing assessment of physician performance that also has the capacity to continuously improve the quality of care provided.
The comprehensive nature of the MOC program is a result of efforts to meaningfully incorporate the 6 competencies defined by the ACGME into the certification process. Although MOC is still relatively new and maturing, a growing body of evidence is demonstrating effectiveness of specific components of the program.[28, 29, 30, 31] In the field of pediatrics, several programs approved for MOC credit have already demonstrated their effectiveness in improving the quality of care in clinical practice.[32, 33, 34, 35, 36] However, additional efforts are needed to evaluate more of the part 4 (Assessment of Practice Performance) modules to assess their impact on patient care. The continued commitment to quality of care and quality improvement in hospitals will likely result in a further adoption of MOC requirements as the process matures and demonstrable impacts on patient outcomes are assessed. Furthermore, greater coordination of MOC with quality assessments in health plans and in the changes taking place in the process of licensure will likely help to streamline the paperwork and documentation burden placed on physicians by multiple assessment efforts.
This study has several limitations. Because the MOC program was initiated by the ABP in January 2010, there may be a lag in uptake of this particular requirement by hospitals. In some cases, this may have been the first time that members of the credentialing staff had considered the MOC program. It is probable that staff awareness will increase over time, as hospital policies are further developed and greater exposure to the specifics of the MOC program occurs. Additionally, although we compared stratified random samples of hospitals in 2005 and 2010, we did not follow the same group of hospitals over time.
As with all changes to the certification program over the years, there is a period of time required for new requirements to be understood and accepted by both those in regulatory positions and those in the medical profession. The demands of the public for increasingly comprehensive assessments of healthcare quality will continue into the future.
Acknowledgments
Disclosures: Funding was provided by a grant from the American Board of Pediatrics Foundation. The authors have no other disclosures or conflicts of interest to report.
- , , , , , . Policies and practices related to the role of board certification and recertification of pediatricians in hospital privileging. JAMA. 2006;295(8):905–912.
- American Board of Pediatrics. Maintenance of Certification: MOC requirements. 2011. Available at: https://www.abp.org/ABPWeb Static/#murl%3D%2FABPWebStatic%2Fmoc.html%26surl%3D%2 Fabpwebsite%2Fmoc%2Fphysicianrequirements%2Fphysreq.htm. Accessed May 23, 2011.
- , , , , , . Maintenance of licensure: protecting the public, promoting quality health care. J Med Regul. 2010;96(2):13–20.
- , , , , . Setting a fair performance standard for physicians' quality of patient care. J Gen Intern Med. 2011;26(5):467–473.
- , . Payer trend: “tiering” physicians and “steering” patients. Fam Pract Manag. 2007;14(10):24–26.
- , , , et al. Association between maintenance of certification examination scores and quality of care for medicare beneficiaries. Arch Intern Med. 2008;168(13):1396–1403.
- American Board of Medical Specialties. ABMS Maintenance of Certification. Available at: http://www.abms.org/Maintenance_of_Certification/ABMS_MOC.aspx. Accessed January 23, 2012.
- American Board of Medical Specialties. ABMS Maintenance of Certification. Available at: http://www.abms.org/maintenance_of_certification/MOC_competencies.aspx. Accessed January 24, 2012.
- , , . Hospital performance reports: impact on quality, market share, and reputation. Health Aff (Millwood). 2005;24(4):1150–1160.
- , , , et al. Impact of public reporting of coronary artery bypass graft surgery performance data on market share, mortality, and patient selection. Med Care. 2011;49(12):1118–1125.
- , , . Hospital strategies to engage physicians in quality improvement. Available at: www.hschange.org/CONTENT/1087. Accessed June 4, 2012.
- The Physician Quality Reporting System Maintenance of Certification Program Incentive Requirements of Self‐Nomination for 2012. http://www.cms.gov/Medicare/Quality‐Initiatives‐Patient‐Assessment‐Instru ments/PQRS/downloads/2012_MaintenanceofCertificationProgram_ mmrvsd01162012.pdf. Accessed June 4, 2012.
- , , . Maintenance of Certification, maintenance of public trust. Plast Reconstr Surg. 2011;127(2):967–973.
- , . Credentialing and public accountability: a central role for board certification. JAMA. 2006;295(8):939–940.
- , , , . Perspectives and preferences among the general public regarding physician selection and board certification. J Pediatr. 2010;156(5):841–845, 845.e1.
- , . Public perceptions of quality care and provider profiling in New York: implications for improving quality care and public health. J Public Health Manag Pract. 2004;10(3):241–250.
- . Future of board certification in a new era of public accountability. J Am Board Fam Med. 2010;23(suppl 1):S32–S39.
- , , , , . Effect of board certification on antihypertensive treatment intensification in patients with diabetes mellitus. Circulation. 2008;117(5):623–628.
- , , , , . Physician board certification and the care and outcomes of elderly patients with acute myocardial infarction. J Gen Intern Med. 2006;21(3):238–244.
- , , . Certifying examination performance and patient outcomes following acute myocardial infarction. Med Educ. 2002;36(9):853–859.
- , , , , . Specialty board certification and clinical outcomes: the missing link. Acad Med. 2002;77(6):534–542.
- , , , . Delivery of preventive services to older adults by primary care physicians. JAMA. 2005;294(4):473–481.
- . Are you ready for maintenance of certification? Fam Pract Manag. 2005;12(1):42–48.
- , , , , . Clinical decisions. American Board of Internal Medicine maintenance of certification program. N Engl J Med. 2010;362(10):948–952.
- . As doctors age, worries about their abilities grow. New York Times. January 24, 2011:D.1.
- , , . Systematic review: the relationship between clinical experience and quality of health care. Ann Intern Med. 2005;142(4):260–273.
- , , , , , . Accuracy of physician self‐assessment compared with observed measures of competence: a systematic review. JAMA. 2006;296(9):1094–1102.
- , , . The impact of a preventive cardiology quality improvement intervention on residents and clinics: a qualitative exploration. Am J Med Qual. 2009;24(2):99–107.
- , , , , , . Promoting physicians' self‐assessment and quality improvement: the ABIM diabetes practice improvement module. J Contin Educ Health Prof. 2006;26(2):109–119.
- , , , et al. Self‐assessment of practice performance: development of the ABIM Practice Improvement Module (PIM). J Contin Educ Health Prof. 2008;28(1):38–46.
- , , , , , . Variation in internal medicine residency clinic practices: assessing practice environments and quality of care. J Gen Intern Med. 2008;23(7):914–920.
- , , , et al. Statewide NICU central‐line‐associated bloodstream infection rates decline after bundles and checklists. Pediatrics. 2011;127(3):436–444.
- , , , et al. ImproveCareNow: the development of a pediatric inflammatory bowel disease improvement network. Inflamm Bowel Dis. 2011;17(1):450–457.
- , . Pay for performance alone cannot drive quality. Arch Pediatr Adolesc Med. 2007;161(7):650–655.
- , , , et al. National pediatric cardiology quality improvement collaborative: lessons learned from development and early years. Prog Pediatr Cardiol. 2011;32(2):103–109.
- , , , et al. Reducing PICU central line‐associated bloodstream infections: 3‐year results. Pediatrics. 2011;128(5):e1077–e1083.
In 2005, we conducted a study of the prevalence of board certification requirements for hospital privileging of pediatricians.[1] Since that time, there have been many changes in the landscape of both physician and healthcare‐system quality assessment. New developments include greater utilization of physician quality‐of‐care assessment tools, a change from recertification for time‐limited board certification to Maintenance of Certification (MOC) in 2010, and an increasing commitment on the part of hospitals and state licensing officials to patient safety and quality‐of‐care issues, due in part to the continued interest by governmental and private payors and the public on external measurement of healthcare quality.[2, 3, 4, 5, 6]
MOC is an ongoing process of lifelong learning and self‐assessment to continuously improve knowledge and clinical performance. It has been adopted by all 24 member boards of the American Boards of Medical Specialties. MOC is focused on the 6 core competencies of quality medical care as outlined by the Accreditation Council for Graduate Medical Education (ACGME): (1) patient care, (2) medical knowledge, (3) practice‐based learning, (4) systems‐based practice, (5) professionalism, and (6) interpersonal and communication skills. To address, these competencies, MOC involves a 4‐part process for continuous learning that is required to keep certification current: (1) licensure and professional standing, (2) lifelong learning and self‐assessment, (3) cognitive expertise, and (4) practice performance assessment.[7, 8]
Our previous study found that many hospitals utilize specialty certification as a marker of quality for privileging.[1] To explore changes in the policies of hospitals regarding requirements for board certification and the incorporation of MOC into those requirements, we conducted a 5‐year follow‐up study of a national random sample of hospitals in 2010.
METHODS
Sample
All hospitals identified in the American Hospital Association's 2009 Annual Survey of Hospitals as providing care to pediatric patients were included in the sampling frame (N=2136). We then selected a stratified random sample of 10% of the total (N=220) hospitals weighted to provide nationally representative estimates. The sample was stratified by Council of Teaching Hospitals (COTH) designation (teaching vs nonteaching) and National Association of Children's Hospitals and Related Institutions (NACHRI) membership. In contrast to our previous study, in this study we did not stratify according to the designation of freestanding children's hospital (vs part of a hospital system) or metropolitan statistical area size (urban vs rural), as comparisons across these designations were not found to be significant in 2005.
Hospitals were sampled with varying probabilities from each stratum. Weights were applied to create a representative sample of the overall hospital population. The total sampling weight (TSW) calculated for each hospital was based on the probability of selection into the study (P) and the response rate (RR). The following formula was used: TSW: (1/P) (1/RR).
Survey Instrument
In collaboration with the American Board of Pediatrics Research Advisory Committee, we developed a 24‐item, fixed‐choice, structured questionnaire to be administered by phone. The survey was designed to be completed in 15 minutes or less and focused on board certification requirements at initial privileging, recredentialing, and MOC requirements.
The survey focused on the following descriptive research questions: Do hospitals require board certification for pediatricians at the time of initial privileging? Do they ever require board certification for privileging? Are there different certification requirements for generalists vs subspecialists? Are pediatricians with permanent certificates required to enroll in MOC?
Other questions focused on such issues such as whether the hospital was familiar with the requirements of MOC, whether MOC was required of all pediatricians, and whether the institution of MOC changed certification requirements at the hospital.
The instrument was pilot tested for clarity and ease of use with representatives from a convenience sample of hospitals within the state of Michigan and revised to clarify potentially ambiguous questions. Pilot surveys were not included in the analyses.
Questionnaire Administration
Data collection took place between April 2010 and June 2010. Interviewers requested to speak with the department responsible for credentialing or privileging at the hospital, typically the Medical Staff Office, the Office of Clinical Affairs, or the Credentialing or Privileging Department. When the appropriate person was identified and located, interviewers explained the purpose of the study and obtained verbal consent to participate.
Data Analysis
Initially, frequency distributions were calculated for all survey items to create descriptive statistics. Next, we performed a cross‐tabulation of responses by the specific hospital classifications listed above (COTH and NACHRI status) and computed the 2 statistics. Finally, we conducted bivariate analyses on the 2005 and 2010 results. SAS version 9.1 (SAS Institute Inc., Cary, NC) was used for all statistical analyses. P<0.05 was considered statistically significant.
Although this study is similar to the study that was completed in 2005,[1] we have reanalyzed those data to more specifically assess certification policy. All results are now weighted in contrast to the 2005 study, which only weighted the results by hospital classification. Thus, the numbers in some cases may be slightly different from those reported in 2006. We believe that this has resulted in a more robust analysis of hospital use of board certification in privileging.
Comparisons
Where possible, results were compared with those found in a 2005 study of hospital privileging.[1] The sampling frame for that study was identical to the current study, but the specific hospitals may or may not be included in the current study.
The study was approved by the University of Michigan Medical School Institutional Review Board.
RESULTS
Response Rate and Respondent Demographics
Of the 220 hospitals surveyed, 23 were ineligible because they did not have at least 1 pediatrician on staff. Of the remaining 197 hospitals, 154 completed the survey, resulting in a 78% participation rate.
Response rates did not differ significantly by NACHRI or COTH hospital status; therefore, there was no impact on the analytic power of the weighting. Approximately half (54%, n=82) of the respondents were NACHRI member hospitals, and 49% (n=75) were COTH hospitals.
Because not every hospital responded to every question, the total number for each question response may differ slightly.
2005 VS 2010 COMPARISONS
Board Certification Requirements
Compared with our findings in 2005, in 2010 a greater proportion of hospitals now require board certification for general pediatricians (80% vs 67%, P=0.141). Among these hospitals, a much larger proportion (24% vs 4%) now require board certification for all pediatricians at the point of initial privileging (Table 1). Similarly, a greater proportion of hospitals now require board certification for pediatric subspecialists (86% vs 71%, P=0.048). The percentage of hospitals that require subspecialists to be board certified at the point of initial privileging also increased from 10% in 2005 to 34% in 2010.
| General Pediatricians | Pediatric Subspecialists | |||
|---|---|---|---|---|
| 2005 (N=159) | 2010 (N=154) | 2005 (N=153) | 2010 (N=147) | |
| ||||
| Certification never required | 33%a | 20%a | 29%b | 14%b |
| Certification ever required | 67%a | 80%a | 71%b | 86%b |
| At time of initial privileging for all pediatricians | 4% | 24% | 10% | 34% |
| Within a specified time frame of initial privileging | 50% | 29% | 41% | 32% |
| At time of initial privileging but only for some pediatricians | 11% | 24% | 16% | 17% |
| Only recertification required | 2% | 3% | 4% | 3% |
The proportion of teaching (COTH) hospitals that require general pediatricians to be board certified at some point in time increased from 63% in 2005 to 89% in 2010 (P=0.001), and the percentage that require board certification for all pediatricians at initial privileging increased from 2% in 2005 to 25% in 2010. Similarly, the proportion of teaching hospitals that require pediatric subspecialists to be board certified increased from 66% in 2005 to 89% in 2010 (P=0.003).
There were small changes between 2005 and 2010 in the proportion of nonteaching (68% vs 79%, P=0.231), NACHRI‐member (76% vs 82%, P=0.366), and non‐NACHRI member (67% vs 80%, P=0.156) hospitals that require pediatricians to be board certified at some point in time. The proportion of nonteaching (4% vs 24%), NACHRI‐member (5% vs 32%), and non‐NACHRI (4% vs 23%) hospitals that require board certification at the point of initial privileging also increased between 2005 and 2010.
Certification Policies at Initial Privileging
Although in 2010, a greater proportion of hospitals reported that they require board certification for general pediatricians and pediatric subspecialists at the point of initial privileging, a much larger proportion of hospitals reported that they make exceptions to their board certification policies for both general pediatricians (99% vs 41%) (Table 2) and pediatric subspecialists (98% vs 14%) (Table 3). Among hospitals that do not require board certification at the point of initial privileging, only small differences were seen in requirements around completion of residency or fellowship training and time frame after which certification must be achieved (Tables 2 and 3).
| 2005 (N=159) | 2010 (N=154) | |
|---|---|---|
| Certification required at initial privileging | ||
| Yes | 4% | 24% |
| Mixed policy | 11% | 24% |
| No | 85% | 52% |
| If hospital required certification at initial privileging: | ||
| Allowed exceptions to policy at initial privileging | 41% | 99% |
| Required certification to be current | 99% | 99% |
| If hospital did not require certification at initial privileging: | ||
| Required to complete residency | 85% | 84% |
| Established time frame after which certification must be achieved | 48% | 51% |
| 2005 (N=153) | 2010 (N=147) | |
|---|---|---|
| Certification required at initial privileging | ||
| Yes | 10% | 34% |
| Mixed policy | 5% | 17% |
| No | 85% | 49% |
| If hospital required certification at initial privileging: | ||
| Allowed exceptions to policy at initial privileging | 14% | 98% |
| Required certification to be current | 83% | 100% |
| If hospital did not require certification at initial privileging: | ||
| Required to complete fellowship | 86% | 86% |
| Established time frame after which certification must be achieved | 47% | 52% |
There were no meaningful differences between board certification policies for general pediatricians and pediatric subspecialists in 2010.
Comparing Recertification and MOC Policies
Few hospitals required permanent certificate holders to recertify (2005) or enroll in MOC (2010) in 2005 (5%) or 2010 (6%). The proportion of hospitals that required recertification or MOC enrollment for general pediatricians increased from 33% in 2005 to 42% in 2010. Similarly, the percentage of hospitals that required recertification or MOC enrollment for pediatric subspecialists increased from 25% in 2005 to 35% in 2010.
Between 2005 and 2010, there was no significant change in the proportion of hospitals that reported revoking or denying privileges to a pediatrician due to failure to recertify or enroll in MOC (3% vs 6%).
SPECIFIC MAINTENANCE OF CERTIFICATION POLICIES IN 2010
Board Certification Requirements
Respondents from 29% of hospitals reported that they were not at all familiar with the American Board of Pediatrics' (ABP) MOC program. Most respondents (58%) were familiar with MOC, with 37% reporting that they were somewhat familiar, and 12% reporting that they were very familiar with the program.
Three‐fourths of hospitals (76%) reported that their MOC requirements do not differ from their recertification requirements held prior to the institution of MOC, and 14% reported that their hospital had not yet established specific MOC requirements.
The majority of respondents (62%) had verified the board certification of some physicians since the institution of the ABP's MOC program on January 1, 2010. A majority (53%) of hospitals track MOC data for all pediatricians, whereas 3% of respondents track MOC data only for those pediatricians whose initial certification was time limited.
Of those hospitals that require pediatricians with permanent certificates to enroll in MOC, 9% allow them to retain their privileges for a period of time if they are not meeting the requirements for MOC. Among hospitals that require pediatricians with time‐limited certificates to enroll in MOC, fewer than half allow general pediatricians (37%) and pediatric subspecialists (40%) to retain their privileges if they are not meeting the requirements for MOC.
The majority of respondents (89%) reported that the initiation of MOC had not changed board certification requirements at their hospital. However, respondents from over one‐quarter of hospitals (27%) reported that they expect changes in their hospital's certification or MOC requirements in the next 2 years. Those hospitals that reported changes moved to more stringent requirements for certification at initial privileging and requirements for permanent certificate holders to meet MOC requirements.
DISCUSSION
In the 5 years since our previous study, a larger proportion of hospitals now require pediatricians to become board certified to obtain hospital privileges. Of note is that a larger proportion of hospitals also now require board certification at the time of initial privileging for both generalist and subspecialist pediatricians.
Hospitals face increasing pressure to differentiate themselves from their peers through better patient outcomes.[9, 10] The increase from 67% to 80% of hospitals requiring board certification may be a result of hospitals utilizing certification as a proxy for assessment of physician quality or as a way to engage physicians in quality improvement through the MOC program.[11] Hospitals may also be responding to greater interest in MOC from regulatory agencies such as the Centers for Medicare and Medicaid Services Maintenance of Certification Program Incentive, which rewards physicians with an additional incentive payment beyond the Physician Quality Reporting System incentive for their participation in the MOC program.[12]
Interestingly, although a greater proportion of hospitals reported that they require certification, a much larger proportion of hospitals make exceptions to the policy. The exceptions could include grandfathering physicians who had hospital privileges prior to the policy change, or giving recent graduates additional time to obtain board certification. It is unknown whether or not all of these physicians would be required to obtain board certification or participate in MOC after some provisional time frame.
Hospitals in our study appear to be incorporating the MOC program into their policies. However, fewer than half of the hospitals studied require pediatricians with time‐limited certificates to enroll in MOC if their certificates have expired. In addition, some hospitals are still establishing their MOC requirements for those pediatricians with time‐limited and permanent certificates. It is likely that the majority of hospitals retained their previous board certification requirements, and that the current flux in hospital requirements is not unique to pediatrics, as all American Board of Medical Specialties' specialties have recently implemented MOC requirements.[13] Hospitals will likely adjust their credentialing policies as their familiarity and experience with MOC grows.
The primary purpose of the specialty certification process is to provide to the public, which includes both individual consumers and regulatory agencies, an assessment of the competency of individual physicians. Self‐regulation through certification is a privilege of trust granted to the medical profession by the public. This is an essential concept that underlies the concept of specialty certification.[14] As the public has continued to adopt a greater focus, and additional demands, on safety and quality assessment in healthcare, the medical profession must in turn be responsive.[13, 15, 16, 17] Failure in this regard would run the risk of losing that trust with the public, with the resultant loss of the ability to self‐regulate.
Studies have indicated a positive relationship between board certification and quality of care, yet this area remains hampered by a paucity of data.[18, 19, 20, 21, 22] Pham et al. found that board certified physicians were more likely to provide preventative care services to Medicare patients.[22] In 2008, Turchin et al. showed that recertification made a small, yet meaningful, difference in physician treatment of hypertension.[18] This area of research is especially important, as the MOC program is more comprehensive and utilizes an ongoing system of assessment and physician engagement. As such, it has been criticized by some for being complicated, burdensome, and irrelevant to the manner in which physicians actually practice.[23, 24] However, previous methods of certification were limited to assessing physicians at 1 point in time during their entire careers (eg, permanent certification) or at specific intervals (eg, time‐limited certification). With recent increased attention to improving the quality of patient care, these methods were unable to assure the public that physicians maintained their knowledge and skills over time in an environment of increasing rapid incorporation of new knowledge into clinical practice. Recent reports have also shown that (years of) practice does not make perfect with regard to physician performance. In fact, there may be deterioration of performance over long periods of practice.[25] Furthermore, although physicians commonly believe they are able to assess their own performance, available evidence does not support that contention.[26, 27] Thus, there is a need for an objective ongoing assessment of physician performance that also has the capacity to continuously improve the quality of care provided.
The comprehensive nature of the MOC program is a result of efforts to meaningfully incorporate the 6 competencies defined by the ACGME into the certification process. Although MOC is still relatively new and maturing, a growing body of evidence is demonstrating effectiveness of specific components of the program.[28, 29, 30, 31] In the field of pediatrics, several programs approved for MOC credit have already demonstrated their effectiveness in improving the quality of care in clinical practice.[32, 33, 34, 35, 36] However, additional efforts are needed to evaluate more of the part 4 (Assessment of Practice Performance) modules to assess their impact on patient care. The continued commitment to quality of care and quality improvement in hospitals will likely result in a further adoption of MOC requirements as the process matures and demonstrable impacts on patient outcomes are assessed. Furthermore, greater coordination of MOC with quality assessments in health plans and in the changes taking place in the process of licensure will likely help to streamline the paperwork and documentation burden placed on physicians by multiple assessment efforts.
This study has several limitations. Because the MOC program was initiated by the ABP in January 2010, there may be a lag in uptake of this particular requirement by hospitals. In some cases, this may have been the first time that members of the credentialing staff had considered the MOC program. It is probable that staff awareness will increase over time, as hospital policies are further developed and greater exposure to the specifics of the MOC program occurs. Additionally, although we compared stratified random samples of hospitals in 2005 and 2010, we did not follow the same group of hospitals over time.
As with all changes to the certification program over the years, there is a period of time required for new requirements to be understood and accepted by both those in regulatory positions and those in the medical profession. The demands of the public for increasingly comprehensive assessments of healthcare quality will continue into the future.
Acknowledgments
Disclosures: Funding was provided by a grant from the American Board of Pediatrics Foundation. The authors have no other disclosures or conflicts of interest to report.
- , , , , , . Policies and practices related to the role of board certification and recertification of pediatricians in hospital privileging. JAMA. 2006;295(8):905–912.
- American Board of Pediatrics. Maintenance of Certification: MOC requirements. 2011. Available at: https://www.abp.org/ABPWeb Static/#murl%3D%2FABPWebStatic%2Fmoc.html%26surl%3D%2 Fabpwebsite%2Fmoc%2Fphysicianrequirements%2Fphysreq.htm. Accessed May 23, 2011.
- , , , , , . Maintenance of licensure: protecting the public, promoting quality health care. J Med Regul. 2010;96(2):13–20.
- , , , , . Setting a fair performance standard for physicians' quality of patient care. J Gen Intern Med. 2011;26(5):467–473.
- , . Payer trend: “tiering” physicians and “steering” patients. Fam Pract Manag. 2007;14(10):24–26.
- , , , et al. Association between maintenance of certification examination scores and quality of care for medicare beneficiaries. Arch Intern Med. 2008;168(13):1396–1403.
- American Board of Medical Specialties. ABMS Maintenance of Certification. Available at: http://www.abms.org/Maintenance_of_Certification/ABMS_MOC.aspx. Accessed January 23, 2012.
- American Board of Medical Specialties. ABMS Maintenance of Certification. Available at: http://www.abms.org/maintenance_of_certification/MOC_competencies.aspx. Accessed January 24, 2012.
- , , . Hospital performance reports: impact on quality, market share, and reputation. Health Aff (Millwood). 2005;24(4):1150–1160.
- , , , et al. Impact of public reporting of coronary artery bypass graft surgery performance data on market share, mortality, and patient selection. Med Care. 2011;49(12):1118–1125.
- , , . Hospital strategies to engage physicians in quality improvement. Available at: www.hschange.org/CONTENT/1087. Accessed June 4, 2012.
- The Physician Quality Reporting System Maintenance of Certification Program Incentive Requirements of Self‐Nomination for 2012. http://www.cms.gov/Medicare/Quality‐Initiatives‐Patient‐Assessment‐Instru ments/PQRS/downloads/2012_MaintenanceofCertificationProgram_ mmrvsd01162012.pdf. Accessed June 4, 2012.
- , , . Maintenance of Certification, maintenance of public trust. Plast Reconstr Surg. 2011;127(2):967–973.
- , . Credentialing and public accountability: a central role for board certification. JAMA. 2006;295(8):939–940.
- , , , . Perspectives and preferences among the general public regarding physician selection and board certification. J Pediatr. 2010;156(5):841–845, 845.e1.
- , . Public perceptions of quality care and provider profiling in New York: implications for improving quality care and public health. J Public Health Manag Pract. 2004;10(3):241–250.
- . Future of board certification in a new era of public accountability. J Am Board Fam Med. 2010;23(suppl 1):S32–S39.
- , , , , . Effect of board certification on antihypertensive treatment intensification in patients with diabetes mellitus. Circulation. 2008;117(5):623–628.
- , , , , . Physician board certification and the care and outcomes of elderly patients with acute myocardial infarction. J Gen Intern Med. 2006;21(3):238–244.
- , , . Certifying examination performance and patient outcomes following acute myocardial infarction. Med Educ. 2002;36(9):853–859.
- , , , , . Specialty board certification and clinical outcomes: the missing link. Acad Med. 2002;77(6):534–542.
- , , , . Delivery of preventive services to older adults by primary care physicians. JAMA. 2005;294(4):473–481.
- . Are you ready for maintenance of certification? Fam Pract Manag. 2005;12(1):42–48.
- , , , , . Clinical decisions. American Board of Internal Medicine maintenance of certification program. N Engl J Med. 2010;362(10):948–952.
- . As doctors age, worries about their abilities grow. New York Times. January 24, 2011:D.1.
- , , . Systematic review: the relationship between clinical experience and quality of health care. Ann Intern Med. 2005;142(4):260–273.
- , , , , , . Accuracy of physician self‐assessment compared with observed measures of competence: a systematic review. JAMA. 2006;296(9):1094–1102.
- , , . The impact of a preventive cardiology quality improvement intervention on residents and clinics: a qualitative exploration. Am J Med Qual. 2009;24(2):99–107.
- , , , , , . Promoting physicians' self‐assessment and quality improvement: the ABIM diabetes practice improvement module. J Contin Educ Health Prof. 2006;26(2):109–119.
- , , , et al. Self‐assessment of practice performance: development of the ABIM Practice Improvement Module (PIM). J Contin Educ Health Prof. 2008;28(1):38–46.
- , , , , , . Variation in internal medicine residency clinic practices: assessing practice environments and quality of care. J Gen Intern Med. 2008;23(7):914–920.
- , , , et al. Statewide NICU central‐line‐associated bloodstream infection rates decline after bundles and checklists. Pediatrics. 2011;127(3):436–444.
- , , , et al. ImproveCareNow: the development of a pediatric inflammatory bowel disease improvement network. Inflamm Bowel Dis. 2011;17(1):450–457.
- , . Pay for performance alone cannot drive quality. Arch Pediatr Adolesc Med. 2007;161(7):650–655.
- , , , et al. National pediatric cardiology quality improvement collaborative: lessons learned from development and early years. Prog Pediatr Cardiol. 2011;32(2):103–109.
- , , , et al. Reducing PICU central line‐associated bloodstream infections: 3‐year results. Pediatrics. 2011;128(5):e1077–e1083.
Copyright © 2013 Society of Hospital Medicine
Improvement Is Independent of Dementia
Loss of functional independence is a serious complication of delirium,[1, 2] with functional consequences often persisting long after the index hospital admission.[3] Preexisting dementia is a major risk factor for delirium in hospitalized older patients,[4, 5] and the occurrence of delirium may alter the clinical course of an underlying dementia with negative prognostic implications, including further functional and cognitive decline,[3] increased rehospitalization rates,[6] institutionalization,[3] and death.[7] Despite the adverse functional outcomes of delirium, there remains a scarcity of well‐designed intervention trials for the rehabilitation of older patients recovering from delirium.
Studies investigating the influence of cognitive impairment on rehabilitation outcomes have yielded conflicting results. Landi and colleagues identified cognitive impairment as a negative predictor of functional recovery among older patients in a rehabilitation unit.[8] Yet, other studies had reported functional improvements with rehabilitation regardless of cognition.[9, 10, 11] However, it is not possible to determine if cognitive impairment in the earlier studies had been consequent to delirium, dementia, or both. Although there has been emerging evidence for the impact of delirium on disease trajectory among patients with dementia, it is less clear whether interventions for delirium prevention and management will yield comparable outcomes with the presence of preexisting dementia.
The geriatric monitoring unit (GMU) is a specialized 5‐bed unit developed for the care of delirious older patients and is modeled after the delirium room,[12] with adoption of core interventions from the Hospital Elder Life Program[13] and use of evening bright light therapy to consolidate circadian rhythm and improve sleep in older inpatients.[14] The core interventions in this multicomponent delirium management program focused on early mobilization and rehabilitation, occurring concurrently with medical management, to address all precipitating and predisposing factors for delirium.[15] As functional decline in an older patient can develop as early as 2 days into a hospital admission,[16] early intervention once the patient has been admitted is essential to prevent the cascade to irreversible functional loss. Hence, we sought to determine the functional progress of delirious older patients exposed to a multicomponent delirium management program and whether the presence of underlying dementia impacted the functional recovery of older patients with delirium. The secondary objective was to identify predictors of functional recovery in older hospitalized patients with delirium.
METHODS
Setting and Participants
This prospective cohort study recruited patients who had been admitted to the GMU of Tan Tock Seng Hospital, Singapore, during the period of November 2010 to November 2011. The admission criteria for the GMU included patients aged 65 years and older who were admitted to the geriatric medicine department and assessed to have delirium, either on admission to the general ward or incident delirium that developed during the hospital stay. The diagnosis of delirium was established in accordance with the Confusion Assessment Method (CAM) diagnostic criteria.[17] Patients were excluded if they met any of the following criteria: (1) presence of medical illnesses that required special monitoring (eg, telemetry for arrhythmias or acute myocardial infarction); (2) critically ill, in coma, or with terminal illness; (3) uncommunicative or with severe aphasia; (4) severely combative behavior with high risk of harm to self, staff, or other patients; (5) contraindications to bright light therapy (manic disorders, severe eye disorders, photosensitive skin disorders, or use of photosensitizing medications); (6) being on respiratory or contact precautions; and (7) refusal of GMU admission by patient, family, or physician‐in‐charge.[15]
The core interventions adopted in the GMU facilitate early mobilization through strict avoidance of mechanical restraints (and refraining from pharmacological restraints where possible), encouraging patients to mobilize early with the support of therapists and trained nurses, and daily review of the continued need for intravenous drip, urinary catheter, or supplemental oxygen to minimize immobilizing equipment. There is a strong emphasis on rehabilitation as part of the multicomponent delirium program; patients participate in daily orientation 3 times a day by a trained nurse using a reality orientation board, engage in therapeutic activities 3 times a day for cognitive stimulation and socialization, and attend daily physiotherapy and occupational therapy sessions. Additionally, we actively seek to correct any sensory impairment with visual aids (such as eye glasses), earwax disimpaction where necessary, and provision of hearing aids or portable audio amplifier. Nonpharmacological measures implemented to improve sleep at night for delirious older patients include evening bright light therapy and a sleep enhancement protocol of warm milk and relaxation music. These interventions are practiced for all patients through their stay in the GMU, with compliance ensured via a structured protocol in the daily nursing workflow and documentation sheet.
All patients fulfilling CAM criteria for delirium and admitted to the GMU were eligible for this study. However, patients who were prematurely transferred out of the GMU (for reasons such as instability of medical conditions requiring intensive monitoring or patients requiring contact precautions) were excluded from subsequent analysis. Patients with repeated GMU admissions had only their first admission included for analysis.
Ethics approval for conduct of this study was obtained from the National Healthcare Group Domain Specific Review Board.
Assessments
All patients underwent a detailed cognitive evaluation by the consultant geriatrician on admission to the GMU. A family member or other designated caregiver was routinely interviewed to establish the patient's baseline cognitive functioning prior to the current admission. The medical records of all patients were reviewed to ascertain whether a diagnosis of dementia had been previously established. In patients yet to be diagnosed, a diagnosis of dementia was made in the current admission if the corroborative history suggested presence of cognitive symptoms consistent with Diagnostic and Statistical Manual of Mental Disorders, 4th Edition (DSM‐IV) criteria for dementia[18] of at least 6 months' duration, in accordance with the standardized process for cognitive evaluation.[19]
Delirium subtypehyperactive, hypoactive, or mixed deliriumwas determined by the consultant geriatrician at admission to the GMU based on clinical assessment of the patient's mental state and behavior. All patients underwent baseline and daily cognitive status assessment using the locally validated 10‐point Abbreviated Mental Test (AMT) and 28‐point Chinese Mini‐Mental State Examination (CMMSE), with higher scores reflective of better cognitive performance.[20] Delirium severity was assessed daily and scored on the Delirium Rating Scale‐98 (DRS‐sev, maximum severity score of 39 points)[21] and CAM severity (CAM‐sev).[17] The cognitive tests and delirium severity scoring were administered by a trained assessor from the time of admission to the GMU until patient's discharge from the GMU. A comprehensive history taking (including medication reconciliation), detailed physical examination, and review of all laboratory/emmaging investigations were performed routinely at admission to identify all potential precipitating factors for delirium, and the Charlson's co‐morbidity[22] and modified Severity of Illness Index scored.[23] The modified Barthel Index (MBI),[24] which measures activities of daily living (ADL), was used to monitor functional progress from time of admission until discharge from the GMU, and was rated by an occupational therapist observing the patient at ADL tasks. A patient was deemed to have recovered from delirium if the CAM criteria for delirium was no longer met, with diagnosis of recovery being supported by improvement in cognitive and/or delirium severity scores as well as input from the multidisciplinary team. Patients were discharged from the GMU once assessed to have recovered from delirium, but may continue inpatient treatment in a general ward for other outstanding medical issues (such as continuation of intravenous antibiotics) or while awaiting transfer to a post‐acute care facility for continued rehabilitation.
Primary Outcome
The primary outcome was recovery of physical function and the difference in total MBI score of each patient at the GMU discharge from that at the GMU admission provided an estimate of the extent of functional recovery achieved. To define clinically meaningful functional improvement, we categorized MBI scores into the following: (1) total MBI score 0 to 20 indicates total dependence, (2) 21 to 60 severe dependence, (3) 61 to 90 moderate dependence, (4) 91 to 99 slight dependence, and (5) 100 full independence.[24] The total MBI gain at discharge was considered clinically meaningful if accompanied by patient transcending into a less dependent category.
Statistical Analysis
Summary measures of baseline characteristics are presented as means ( standard deviations) and proportions. The difference between admission and discharge AMT, CMMSE, and MBI scores was calculated for each patient and represented the extent of cognitive and functional recovery achieved at the time of discharge from the GMU. Paired sample t test was used to evaluate differences between admission and discharge cognitive and functional scores, as well as changes in delirium severity as measured on CAM‐sev and DRS‐sev, for the entire cohort of GMU patients.
To determine whether preexisting dementia impacts on cognitive and functional recovery of delirious patients, independent sample t test was performed to compare mean changes in AMT, CMMSE, and MBI scores for the demented vs nondemented groups. The proportion of patients achieving clinically meaningful MBI gain in each group was compared using Pearson 2 test.
To identify predictors of functional recovery, univariate analyses were first performed to examine the relationship between predictor variables and MBI gain. The candidate predictors were defined a priori and included (1) age, (2) gender, (3) Charlson's comorbidity score, (4) Severity of Illness Index, (5) number of precipitating causes of delirium (categoricalsingle, 2 or >2 precipitating causes), (6) presentation of delirium (categoricalhypoactive, hyperactive, mixed), (7) delirium severity on admission (CAM‐sev and DRS‐sev scores), (8) duration of delirium, and (9) presence of underlying dementia. Predictors with a univariate P value <0.20 were entered into a multiple linear regression model, with the dependent variable being change in MBI score. Only significant predictors (P0.05) were retained in the final model. All models controlled for admission MBI score.
Statistical analyses were performed using SPSS software (version 16.0; IBM, Armonk, NY). All statistical tests were 2‐tailed, with P value0.05 considered statistically significant.
RESULTS
Patient Characteristics
One hundred forty‐six elderly patients with delirium were admitted to the GMU during the 1‐year study period. One hundred twenty‐two patients were analyzed after excluding 24 patients (17 patients [mean age 83.28.7 years, 47.1% females] were transferred out prematurely due to infection control precautions or were critically ill requiring intensive monitoring; 7 were repeat admissions). The mean age of patients admitted to the GMU was 84.17.6 years, with a predominance of females (60.7%). Most patients presented with either hyperactive (49.2%) or mixed (35.2%) delirium, with hypoactive delirium being the least common presentation (15.6%). Sepsis, notably urinary tract infection or pneumonia, was the predominant principal precipitating cause, contributing to 68.0% of delirium cases within the GMU. At admission, the GMU cohort had a mean CMMSE score of 5.305.53, and mean MBI score of 31.6126.61. Eighty‐two patients (67.2%) had delirium superimposed on dementia, whereas 40 patients (32.8%) did not have underlying dementia.
Baseline characteristics of patients with and without underlying dementia are shown in Table 1. There were no significant differences in age, gender, ethnicity, and illness severity between groups with and without dementia, although patients with dementia had higher comorbidity (Charlson's comorbidity score 2.27 vs 1.75, P=0.054). The presentation and severity of delirium at admission to the GMU was similar in both groups.
| Underlying Dementia | P Value | ||
|---|---|---|---|
| Absent (n=40) | Present (n=82) | ||
| |||
| Demographics | |||
| Age, meanSD, y | 84.08.1 | 84.27.4 | 0.88 |
| Male gender, n (%) | 18 (45.0) | 29 (35.4) | 0.45 |
| Chinese, n (%) | 34 (85.0) | 70 (85.4) | 0.67 |
| Presentation of delirium | 0.99 | ||
| Hyperactive, n (%) | 20 (50.0) | 40 (48.8) | |
| Hypoactive, n (%) | 6 (15.0) | 13 (15.9) | |
| Mixed, n (%) | 14 (35.0) | 29 (35.4) | |
| Delirium severity on admissiona | |||
| CAM‐sev, meanSD | 5.231.17 | 4.74 1.47 | 0.07 |
| DRS‐sev, meanSD | 27.306.37 | 26.326.70 | 0.43 |
| Cognitive status on admissiona | |||
| AMT, meanSD | 2.051.97 | 1.682.22 | 0.38 |
| CMMSE, meanSD | 5.185.13 | 5.355.75 | 0.87 |
| Functional status on admission, MBI score, meanSDa | 29.4825.90 | 32.6627.04 | 0.54 |
| Comorbidities | |||
| Charlson score, meanSD | 1.751.63 | 2.271.25 | 0.054 |
| Severity of Illness, meanSD | 2.000.32 | 2.100.40 | 0.15 |
| Precipitating causes of delirium | |||
| Number of precipitants, n (%) | 0.41 | ||
| Single precipitating cause | 12 (30.0) | 31 (37.8) | |
| 2 precipitating causes | 12 (30.0) | 28 (34.1) | |
| >2 precipitating causes | 16 (40.0) | 23 (28.1) | |
| Principal precipitating cause, n (%) | 0.050 | ||
| UTI | 17 (42.5) | 27 (32.9) | |
| Pneumonia | 3 (7.5) | 23 (28.0) | |
| Combined UTI and pneumonia or sepsis from >1 source | 3 (7.5) | 9 (11.0) | |
| Stroke | 0 (0) | 3 (3.7) | |
| Biochemical abnormalities | 2 (5.0) | 4 (4.9) | |
| Intracranial hemorrhage | 3 (7.5) | 1(1.2) | |
| Fracture | 3 (7.5) | 2 (2.4) | |
| Postoperative state | 2 (5.0) | 3 (3.7) | |
| Others | 7 (17.5) | 10 (12.2) | |
Patients without underlying dementia more often required multiple insults to precipitate delirium compared with patients with dementia, although this difference did not fulfill statistical significance. Although sepsis remained the primary precipitating cause of delirium in patients with and without dementia, urinary tract infection was more common among patients without dementia, whereas pneumonia was a more common precipitant in patients with dementia (P=0.050). The cognitive performance and functional status were similar at GMU admission for both groups.
Cognitive and Functional Outcomes on Discharge
The average duration of delirium for the GMU cohort was 8.2 days, with the mean length of total hospital stay being 17.0 days. The length of GMU stay for each patient was equivalent to the duration of delirium as patients were transferred out of the GMU once assessed to have recovered from delirium. Significant cognitive improvement was observed with recovery from delirium, with AMT and CMMSE scores improving by a mean of 1.442.38 and 3.545.61, respectively (paired t test, P<0.001). Patients demonstrated significant functional recovery at discharge from the GMU compared with their functional performance at admission to the GMU, with a mean MBI gain of 19.4217.11 (P<0.001), and 59 patients (48.4%) had progressed to a less‐dependent category.
Table 2 compares the cognitive and functional progress of patients with and without dementia. There was no difference in duration of delirium or length of total hospital stay between the demented and nondemented groups. Within‐group comparison showed patients with and without dementia managing significant improvement in cognitive scores at GMU discharge compared with GMU admission, although the magnitude of improvement was greater for nondemented patients (CMMSE improvement +6.73 vs +1.99, P<0.001). The mean MBI gain at GMU discharge compared with GMU admission was 20.4316.99 (P<0.001) for patients with dementia and 17.3517.39 (P<0.001) for patients without underlying dementia. There was no significant difference in the extent of functional improvement achieved between the demented and nondemented groups. Nineteen patients (47.5%) without dementia and 40 patients (48.8%) with preexisting dementia were in a less‐dependent category at GMU discharge compared with GMU admission.
| Overall GMU Cohort (n=122) | Underlying Dementia | P Value | ||
|---|---|---|---|---|
| Absent (n=40) | Present (n=82) | |||
| ||||
| Duration of delirium, meanSD, d | 8.2 | 7.47.6 | 8.65.7 | 0.35 |
| Length of hospital stay, meanSD, da | 17.0 | 18.69.7 | 16.38.7 | 0.18 |
| Cognitive scores on dischargeb | ||||
| AMT, mean (SD) | 3.25 (3.00) | 5.20 (2.88) | 2.29 (2.58) | <0.001 |
| CMMSE, mean (SD) | 8.84 (6.81) | 11.90 (6.16) | 7.34 (6.64) | <0.001 |
| Improvement in cognitive scores | ||||
| AMT, mean (SD)c | +1.44 (2.38) | +3.15 (2.68) | +0.61 (1.70) | <0.001 |
| CMMSE, mean (SD)c | +3.54 (5.61) | +6.73 (5.74) | +1.99 (4.87) | <0.001 |
| Delirium severity on discharge | ||||
| CAM‐sev, mean (SD) | 2.43 (1.44) | 2.15 (1.46) | 2.57 (1.42) | 0.13 |
| DRS‐sev, mean (SD) | 16.83 (6.97) | 14.45 (6.90) | 18.00 (6.74) | 0.008 |
| Change in delirium severity scores | ||||
| CAM‐sev, mean (SD)c | 2.47 (1.73) | 3.08 (1.67) | 2.17 (1.68) | 0.006 |
| DRS‐sev, mean (SD)c | 9.72 (7.30) | 12.85 (6.43) | 8.17 (7.25) | 0.001 |
| Functional status | ||||
| MBI discharge, mean (SD) | 51.03 (26.20) | 46.83 (24.09) | 53.09 (27.07) | 0.22 |
| MBI, mean (SD)c | +19.42 (17.11) | +17.35 (17.39) | +20.43 (16.99) | 0.35 |
| Progress to less‐dependent category at discharge, n (%)b | 59 (48.4%) | 19 (47.5%) | 40 (48.8%) | 1.00 |
Seventy‐nine patients (64.8% of the GMU cohort) were discharged back to their own home following the index hospitalization, 22 patients (18.0%) required further rehabilitation in a community hospital or subacute ward before returning home, and 19 patients (15.6%) were admitted to long‐term care. There was no significant difference in discharge destination between patients with and without dementia (Table 3).
| Overall GMU Cohort (n=122) | Underlying Dementia | P Value | ||
|---|---|---|---|---|
| Absent (n=40) | Present (n=82) | |||
| ||||
| Discharge destination, n (%) | 0.14 | |||
| Own home | 79 (64.8) | 24 (60.0) | 55 (67.9) | |
| Community hospital or subacute ward (with eventual discharge home after rehabilitation) | 22 (18.0) | 10 (25.0) | 12 (14.6) | |
| Long‐term care | 19 (15.6) | 6 (15.0) | 13 (16.0) | |
| Inpatient hospice | 1 (0.8) | 0 (0) | 1 (1.2) | |
Predictors of Functional Recovery on Discharge
Age, gender, number of precipitating causes, severity of illness, and type of delirium had a univariate P value <0.20 and were entered into the multiple regression model. After controlling for admission MBI score in multivariate analysis, gender, presentation of delirium, and severity of illness remained independent factors for improvement in MBI score (Table 4). Female patients exhibited greater functional recovery than males. Hypoactive delirium was associated with the worst prognosis for functional recovery, with improvement in MBI score being 14.47 points lower than that achieved by patients with hyperactive delirium. Severity of illness at admission was another negative predictor of functional recovery, with each unit increase in Severity of Illness Index (higher score indicating more severe illness) associated with 10.59 points lower gain in MBI.
| Predictor | Model 1 | Final Model | ||
|---|---|---|---|---|
| B | P Value | B | P Value | |
| ||||
| Age | 0.245 | 0.184 | ||
| Female (vs male) | 6.421 | 0.023 | 7.393 | 0.009 |
| Number of precipitating causes | 2.044 | 0.229 | ||
| Hypoactive delirium (vs hyperactive delirium) | 15.383 | <0.001 | 14.472 | 0.001 |
| Severity of illness | 10.596 | 0.003 | 10.591 | 0.003 |
DISCUSSION
Our results support a delirium management unit focused on geriatric nursing care and rehabilitation in promoting positive cognitive and functional gains in older patients with delirium. In addition, we have documented that patients with dementia and recovering from delirium have comparable potential for functional recovery as their cognitively intact counterparts, despite there being less improvement in cognitive test scores and higher comorbidity compared with patients without dementia.
Persistent delirium and failure to recognize the condition have been associated with poor functional recovery.[25, 26] Early recognition of delirium and actively addressing all predisposing and precipitating factors, along with emphasis on rehabilitation in a multidisciplinary unit, appear to be important factors contributing to the positive functional outcomes in our patients. In addition, none of the patients admitted to the GMU had been subject to physical restraint, and this, along with the higher nursing ratio, facilitated early mobilization essential to prevent functional decline. The overall length of hospital stay, averaging 17.0 days, compared favorably with a pre‐GMU cohort, where the average length of hospital stay for delirious patients was 20.9 days. The length of stay in an acute hospital ward included waiting time for transfer to appropriate postacute facility (community hospital, subacute ward, or nursing home).
In a study of older hospital inpatients, delirium independent of dementia was predictive of sustained poor cognitive and functional status in the year following hospitalization.[3] Thus, although delirium has been generally regarded as a transient and reversible condition, it is also increasingly recognized that recovery may not always be complete. This is a likely explanation for the low cognitive test scores at discharge from the GMU, albeit improved compared with admission, even among patients without dementia. The present study lacks data on longer‐term cognitive outcomes following delirium resolution. However, delirium is reportedly a risk factor for subsequent development of dementia,[27] and contributes to accelerated cognitive decline in patients with existing dementia.[28]
Despite reports of adverse outcomes of delirium superimposed on dementia, few intervention studies have specifically examined the management of delirium in older adults with dementia. In our study, preexisting dementia did not preclude delirious patients from functional improvement, adding to the still‐limited literature reporting positive rehabilitation outcomes in patients with cognitive impairment.[10, 29] In addition, patients with dementia did not take longer to recover from delirium than those without dementia, nor did they appear to require a longer duration for making similar functional gains given that length of hospital stay did not differ between the 2 groups. Illness severity and presentation of delirium, rather than preexisting dementia, predicted poor functional recovery. The complex etiology of delirium, representing an interaction between baseline patient vulnerability (predisposing factors) and exposure to noxious insults or precipitating factors, suggests that highly vulnerable patients (eg, dementia) may develop delirium with a relatively innocuous insult, as opposed to the multiple noxious insults anticipated in nonvulnerable patients.[30] Although Severity of Illness Index was similar, patients without dementia had a trend for more than 1 precipitating factor, and serious medical conditions, such as intracranial hemorrhage, fracture, and need for surgical intervention were more likely to be present, factors that can expectedly influence functional recovery. Patients with hypoactive delirium had the worst functional outcome, consistent with previously observed poor prognosis in hypoactive delirium.[31, 32] Our findings, if corroborated by future studies, may offer a means to attenuate the trajectory of functional decline observed in patients with delirium superimposed on dementia. This will be of particular relevance as earlier studies had observed a high risk of institutionalization in patients with delirium superimposed on dementia compared with dementia alone.[3, 33]
One limitation of this study was the failure to adjust for premorbid functional status due to the lack of information on baseline function prior to the current hospital admission. Even though we demonstrated functional improvement at discharge compared with admitting functional status, we were not able to ascertain if the patients had returned to their premorbid level of cognitive and physical functioning when discharged from the GMU. This study was also limited by its observational nature, the small sample size, and short‐term outcomes. However, the beneficial impact of the GMU on functional improvement in patients with delirium was supported by observed higher MBI gain compared with a pre‐GMU cohort (mean MBI gain, 7.511.2; discharge MBI, 45.832.9). Data collection for 6‐month and 1‐year outcomes is presently in progress to determine sustainability of any improvement achieved. Our exclusion criteria limits generalizability of the benefits of the GMU to patients considered medically unstable, in whom delirium is prevalent. However, such patients are likely too ill to participate in the intense rehabilitation practiced in the GMU.
We have shown that patients with delirium can engage and benefit from a rehabilitation program, their low cognitive test scores at admission notwithstanding, suggesting that early initiation of rehabilitation should be encouraged regardless of the cognitive and functional performance at presentation. In addition, we found that patients with delirium superimposed on dementia benefit from a multicomponent delirium treatment program to the same extent as delirious patients without dementia, which may contribute to improved quality of life and reduction in burden of care. As delirium is a complex medical problem with multiple predisposing and precipitating factors, a multicomponent intervention program as practiced in the GMU is likely to yield more consistent outcomes than a single intervention strategy. With the widely reported poor prognostic significance of delirium superimposed on dementia, more well‐designed controlled trials are urgently needed to identify intervention strategies that will aid the management of this group of hospitalized elders.
Acknowledgments
Disclosures: This work was supported by FY2010 Ministry of Health Quality Improvement Funding (MOH HQIF) Optimising Acute Delirium Care in Tan Tock Seng Hospital (Reference: HQIF 2010/17). The authors report no conflicts of interest.
- , , , et al. Acute delirium and functional decline in the hospitalized elderly patient. J Gerontol. 1993;48:M181–M186.
- , , , , . Does delirium contribute to poor hospital outcomes? A three‐site epidemiologic study. J Gen Intern Med. 1998;13:234–242.
- , , , , . Delirium in older medical inpatients and subsequent cognitive and functional status: a prospective study. CMAJ. 2001;165(5):575–583.
- , , , . Delirium risk factors in elderly hospitalized patients. J General Intern Med. 1998;13:204–212.
- , , . Delirium superimposed on dementia: a systematic review. J Am Geriatr Soc. 2002;50:1723–1732.
- , . Consequences of not recognizing delirium superimposed on dementia in hospitalized elderly individuals. J Gerontol Nurs. 2000;26:30–40.
- , , , , . Delirium predicts 12‐month mortality. Arch Intern Med. 2002;162:457–463.
- , , , et al. Predictors of rehabilitation outcomes in frail patients treated in a geriatric hospital. J Am Geriatr Soc. 2002;50:679–684.
- , , , , . Effect of cognitive impairment on rehabilitation outcome. Am J Phys Med Rehabil. 1996;75:40–43.
- , , , , . Rehabilitation outcomes in cognitively impaired patients admitted to skilled nursing facilities from the community. Arch Phys Med Rehabil. 2004;85:1602–1607.
- , , , . Does cognitive impairment affect rehabilitation outcome? J Am Geriatr Soc. 2011;59:2108–2111.
- , , , , , . A model for managing delirious older inpatients. J Am Geriatr Soc. 2003;51:1031–1035.
- , , , , . The Hospital Elder Life Program: a model of care to prevent cognitive and functional decline in older hospitalized patients. J Am Geriatr Soc. 2000;48:1697–1706.
- . Light therapy for insomnia in older adults. Clin Geriatr Med. 2008;24(1):139–149.
- , , , , , . A new model of delirium care in the acute geriatric setting: geriatric monitoring unit. BMC Geriatr. 2011;11:41.
- , , , , . The natural history of functional morbidity in hospitalized older patients. J Am Geriatr Soc. 1990;38:1296–1303.
- , , , , , . Clarifying confusion: The Confusion Assessment Method. A new method for detecting delirium. Ann Intern Med. 1990;113:941–948.
- American Psychiatric Association. Diagnostic and Statistical Manual of Mental Disorders. 4th ed. Washington, DC: American Psychiatric Association; 1994.
- , . An evidence‐based clinical approach to the diagnosis of dementia. Ann Acad Med Singapore. 2003;32:740–748.
- , , , . Diagnostic performance of two mental status tests in the older Chinese: influence of education and age on cut‐off values. Int J Geriatr Psychiatry. 2000;15:234–241.
- , , , , , . Validation of the Delirium Rating Scale‐revised‐98: comparison with the delirium rating scale and the cognitive test for delirium. J Neuropsychiatry Clin Neurosci. 2001;13:229–242.
- , , , . A new method of classifying prognositic comorbidity in longitudinal studies: development and validation. J Chronic Dis. 1987;40(5):373–383.
- , , , , . Resource consumption in hospitalised, frail older patients. Ann Acad Med Singapore. 2010;39(11):830–836.
- , , . Improving the sensitivity of the Barthel Index for stroke rehabilitation. J Clin Epidemiol. 1989;42(8):703–709.
- , , . Incomplete functional recovery after delirium in elderly people: a prospective cohort study. BMC Geriatr. 2005;5:5.
- , , , , , . Association between delirium resolution and functional recovery among newly admitted postacute facility patients. J Gerontol A Biol Sci Med Sci. 2006;61(2):204–208.
- , , , , . The association between delirium and cognitive decline: a review of the empirical literature. Neuropsychol Rev. 2004;14(2):87–98.
- , , , et al. Delirium accelerates cognitive decline in Alzheimer disease. Neurology. 2009;72:1570–1575.
- , , , , . Randomised, clinically controlled trial of intensive geriatric rehabilitation in patients with hip fracture: subgroup analysis of patients with dementia. BMJ. 2000;321:1107–1111.
- . Delirium in hospitalized older patients. Clin Geriatr Med. 1998;14(4):745–764.
- , . Clinical significance of delirium subtypes in older people. Age Ageing. 1999;28:115–119.
- , , , , , . Severity and course of delirium in medically hospitalised nursing facility residents. Am J Geriatr Psychiatry. 2001;9:72–77.
- , , , , , . Delirium in elderly patients and the risk of postdischarge mortality, institutionalization and dementia. A meta‐analysis. JAMA. 2010;304(4):443–451.
Loss of functional independence is a serious complication of delirium,[1, 2] with functional consequences often persisting long after the index hospital admission.[3] Preexisting dementia is a major risk factor for delirium in hospitalized older patients,[4, 5] and the occurrence of delirium may alter the clinical course of an underlying dementia with negative prognostic implications, including further functional and cognitive decline,[3] increased rehospitalization rates,[6] institutionalization,[3] and death.[7] Despite the adverse functional outcomes of delirium, there remains a scarcity of well‐designed intervention trials for the rehabilitation of older patients recovering from delirium.
Studies investigating the influence of cognitive impairment on rehabilitation outcomes have yielded conflicting results. Landi and colleagues identified cognitive impairment as a negative predictor of functional recovery among older patients in a rehabilitation unit.[8] Yet, other studies had reported functional improvements with rehabilitation regardless of cognition.[9, 10, 11] However, it is not possible to determine if cognitive impairment in the earlier studies had been consequent to delirium, dementia, or both. Although there has been emerging evidence for the impact of delirium on disease trajectory among patients with dementia, it is less clear whether interventions for delirium prevention and management will yield comparable outcomes with the presence of preexisting dementia.
The geriatric monitoring unit (GMU) is a specialized 5‐bed unit developed for the care of delirious older patients and is modeled after the delirium room,[12] with adoption of core interventions from the Hospital Elder Life Program[13] and use of evening bright light therapy to consolidate circadian rhythm and improve sleep in older inpatients.[14] The core interventions in this multicomponent delirium management program focused on early mobilization and rehabilitation, occurring concurrently with medical management, to address all precipitating and predisposing factors for delirium.[15] As functional decline in an older patient can develop as early as 2 days into a hospital admission,[16] early intervention once the patient has been admitted is essential to prevent the cascade to irreversible functional loss. Hence, we sought to determine the functional progress of delirious older patients exposed to a multicomponent delirium management program and whether the presence of underlying dementia impacted the functional recovery of older patients with delirium. The secondary objective was to identify predictors of functional recovery in older hospitalized patients with delirium.
METHODS
Setting and Participants
This prospective cohort study recruited patients who had been admitted to the GMU of Tan Tock Seng Hospital, Singapore, during the period of November 2010 to November 2011. The admission criteria for the GMU included patients aged 65 years and older who were admitted to the geriatric medicine department and assessed to have delirium, either on admission to the general ward or incident delirium that developed during the hospital stay. The diagnosis of delirium was established in accordance with the Confusion Assessment Method (CAM) diagnostic criteria.[17] Patients were excluded if they met any of the following criteria: (1) presence of medical illnesses that required special monitoring (eg, telemetry for arrhythmias or acute myocardial infarction); (2) critically ill, in coma, or with terminal illness; (3) uncommunicative or with severe aphasia; (4) severely combative behavior with high risk of harm to self, staff, or other patients; (5) contraindications to bright light therapy (manic disorders, severe eye disorders, photosensitive skin disorders, or use of photosensitizing medications); (6) being on respiratory or contact precautions; and (7) refusal of GMU admission by patient, family, or physician‐in‐charge.[15]
The core interventions adopted in the GMU facilitate early mobilization through strict avoidance of mechanical restraints (and refraining from pharmacological restraints where possible), encouraging patients to mobilize early with the support of therapists and trained nurses, and daily review of the continued need for intravenous drip, urinary catheter, or supplemental oxygen to minimize immobilizing equipment. There is a strong emphasis on rehabilitation as part of the multicomponent delirium program; patients participate in daily orientation 3 times a day by a trained nurse using a reality orientation board, engage in therapeutic activities 3 times a day for cognitive stimulation and socialization, and attend daily physiotherapy and occupational therapy sessions. Additionally, we actively seek to correct any sensory impairment with visual aids (such as eye glasses), earwax disimpaction where necessary, and provision of hearing aids or portable audio amplifier. Nonpharmacological measures implemented to improve sleep at night for delirious older patients include evening bright light therapy and a sleep enhancement protocol of warm milk and relaxation music. These interventions are practiced for all patients through their stay in the GMU, with compliance ensured via a structured protocol in the daily nursing workflow and documentation sheet.
All patients fulfilling CAM criteria for delirium and admitted to the GMU were eligible for this study. However, patients who were prematurely transferred out of the GMU (for reasons such as instability of medical conditions requiring intensive monitoring or patients requiring contact precautions) were excluded from subsequent analysis. Patients with repeated GMU admissions had only their first admission included for analysis.
Ethics approval for conduct of this study was obtained from the National Healthcare Group Domain Specific Review Board.
Assessments
All patients underwent a detailed cognitive evaluation by the consultant geriatrician on admission to the GMU. A family member or other designated caregiver was routinely interviewed to establish the patient's baseline cognitive functioning prior to the current admission. The medical records of all patients were reviewed to ascertain whether a diagnosis of dementia had been previously established. In patients yet to be diagnosed, a diagnosis of dementia was made in the current admission if the corroborative history suggested presence of cognitive symptoms consistent with Diagnostic and Statistical Manual of Mental Disorders, 4th Edition (DSM‐IV) criteria for dementia[18] of at least 6 months' duration, in accordance with the standardized process for cognitive evaluation.[19]
Delirium subtypehyperactive, hypoactive, or mixed deliriumwas determined by the consultant geriatrician at admission to the GMU based on clinical assessment of the patient's mental state and behavior. All patients underwent baseline and daily cognitive status assessment using the locally validated 10‐point Abbreviated Mental Test (AMT) and 28‐point Chinese Mini‐Mental State Examination (CMMSE), with higher scores reflective of better cognitive performance.[20] Delirium severity was assessed daily and scored on the Delirium Rating Scale‐98 (DRS‐sev, maximum severity score of 39 points)[21] and CAM severity (CAM‐sev).[17] The cognitive tests and delirium severity scoring were administered by a trained assessor from the time of admission to the GMU until patient's discharge from the GMU. A comprehensive history taking (including medication reconciliation), detailed physical examination, and review of all laboratory/emmaging investigations were performed routinely at admission to identify all potential precipitating factors for delirium, and the Charlson's co‐morbidity[22] and modified Severity of Illness Index scored.[23] The modified Barthel Index (MBI),[24] which measures activities of daily living (ADL), was used to monitor functional progress from time of admission until discharge from the GMU, and was rated by an occupational therapist observing the patient at ADL tasks. A patient was deemed to have recovered from delirium if the CAM criteria for delirium was no longer met, with diagnosis of recovery being supported by improvement in cognitive and/or delirium severity scores as well as input from the multidisciplinary team. Patients were discharged from the GMU once assessed to have recovered from delirium, but may continue inpatient treatment in a general ward for other outstanding medical issues (such as continuation of intravenous antibiotics) or while awaiting transfer to a post‐acute care facility for continued rehabilitation.
Primary Outcome
The primary outcome was recovery of physical function and the difference in total MBI score of each patient at the GMU discharge from that at the GMU admission provided an estimate of the extent of functional recovery achieved. To define clinically meaningful functional improvement, we categorized MBI scores into the following: (1) total MBI score 0 to 20 indicates total dependence, (2) 21 to 60 severe dependence, (3) 61 to 90 moderate dependence, (4) 91 to 99 slight dependence, and (5) 100 full independence.[24] The total MBI gain at discharge was considered clinically meaningful if accompanied by patient transcending into a less dependent category.
Statistical Analysis
Summary measures of baseline characteristics are presented as means ( standard deviations) and proportions. The difference between admission and discharge AMT, CMMSE, and MBI scores was calculated for each patient and represented the extent of cognitive and functional recovery achieved at the time of discharge from the GMU. Paired sample t test was used to evaluate differences between admission and discharge cognitive and functional scores, as well as changes in delirium severity as measured on CAM‐sev and DRS‐sev, for the entire cohort of GMU patients.
To determine whether preexisting dementia impacts on cognitive and functional recovery of delirious patients, independent sample t test was performed to compare mean changes in AMT, CMMSE, and MBI scores for the demented vs nondemented groups. The proportion of patients achieving clinically meaningful MBI gain in each group was compared using Pearson 2 test.
To identify predictors of functional recovery, univariate analyses were first performed to examine the relationship between predictor variables and MBI gain. The candidate predictors were defined a priori and included (1) age, (2) gender, (3) Charlson's comorbidity score, (4) Severity of Illness Index, (5) number of precipitating causes of delirium (categoricalsingle, 2 or >2 precipitating causes), (6) presentation of delirium (categoricalhypoactive, hyperactive, mixed), (7) delirium severity on admission (CAM‐sev and DRS‐sev scores), (8) duration of delirium, and (9) presence of underlying dementia. Predictors with a univariate P value <0.20 were entered into a multiple linear regression model, with the dependent variable being change in MBI score. Only significant predictors (P0.05) were retained in the final model. All models controlled for admission MBI score.
Statistical analyses were performed using SPSS software (version 16.0; IBM, Armonk, NY). All statistical tests were 2‐tailed, with P value0.05 considered statistically significant.
RESULTS
Patient Characteristics
One hundred forty‐six elderly patients with delirium were admitted to the GMU during the 1‐year study period. One hundred twenty‐two patients were analyzed after excluding 24 patients (17 patients [mean age 83.28.7 years, 47.1% females] were transferred out prematurely due to infection control precautions or were critically ill requiring intensive monitoring; 7 were repeat admissions). The mean age of patients admitted to the GMU was 84.17.6 years, with a predominance of females (60.7%). Most patients presented with either hyperactive (49.2%) or mixed (35.2%) delirium, with hypoactive delirium being the least common presentation (15.6%). Sepsis, notably urinary tract infection or pneumonia, was the predominant principal precipitating cause, contributing to 68.0% of delirium cases within the GMU. At admission, the GMU cohort had a mean CMMSE score of 5.305.53, and mean MBI score of 31.6126.61. Eighty‐two patients (67.2%) had delirium superimposed on dementia, whereas 40 patients (32.8%) did not have underlying dementia.
Baseline characteristics of patients with and without underlying dementia are shown in Table 1. There were no significant differences in age, gender, ethnicity, and illness severity between groups with and without dementia, although patients with dementia had higher comorbidity (Charlson's comorbidity score 2.27 vs 1.75, P=0.054). The presentation and severity of delirium at admission to the GMU was similar in both groups.
| Underlying Dementia | P Value | ||
|---|---|---|---|
| Absent (n=40) | Present (n=82) | ||
| |||
| Demographics | |||
| Age, meanSD, y | 84.08.1 | 84.27.4 | 0.88 |
| Male gender, n (%) | 18 (45.0) | 29 (35.4) | 0.45 |
| Chinese, n (%) | 34 (85.0) | 70 (85.4) | 0.67 |
| Presentation of delirium | 0.99 | ||
| Hyperactive, n (%) | 20 (50.0) | 40 (48.8) | |
| Hypoactive, n (%) | 6 (15.0) | 13 (15.9) | |
| Mixed, n (%) | 14 (35.0) | 29 (35.4) | |
| Delirium severity on admissiona | |||
| CAM‐sev, meanSD | 5.231.17 | 4.74 1.47 | 0.07 |
| DRS‐sev, meanSD | 27.306.37 | 26.326.70 | 0.43 |
| Cognitive status on admissiona | |||
| AMT, meanSD | 2.051.97 | 1.682.22 | 0.38 |
| CMMSE, meanSD | 5.185.13 | 5.355.75 | 0.87 |
| Functional status on admission, MBI score, meanSDa | 29.4825.90 | 32.6627.04 | 0.54 |
| Comorbidities | |||
| Charlson score, meanSD | 1.751.63 | 2.271.25 | 0.054 |
| Severity of Illness, meanSD | 2.000.32 | 2.100.40 | 0.15 |
| Precipitating causes of delirium | |||
| Number of precipitants, n (%) | 0.41 | ||
| Single precipitating cause | 12 (30.0) | 31 (37.8) | |
| 2 precipitating causes | 12 (30.0) | 28 (34.1) | |
| >2 precipitating causes | 16 (40.0) | 23 (28.1) | |
| Principal precipitating cause, n (%) | 0.050 | ||
| UTI | 17 (42.5) | 27 (32.9) | |
| Pneumonia | 3 (7.5) | 23 (28.0) | |
| Combined UTI and pneumonia or sepsis from >1 source | 3 (7.5) | 9 (11.0) | |
| Stroke | 0 (0) | 3 (3.7) | |
| Biochemical abnormalities | 2 (5.0) | 4 (4.9) | |
| Intracranial hemorrhage | 3 (7.5) | 1(1.2) | |
| Fracture | 3 (7.5) | 2 (2.4) | |
| Postoperative state | 2 (5.0) | 3 (3.7) | |
| Others | 7 (17.5) | 10 (12.2) | |
Patients without underlying dementia more often required multiple insults to precipitate delirium compared with patients with dementia, although this difference did not fulfill statistical significance. Although sepsis remained the primary precipitating cause of delirium in patients with and without dementia, urinary tract infection was more common among patients without dementia, whereas pneumonia was a more common precipitant in patients with dementia (P=0.050). The cognitive performance and functional status were similar at GMU admission for both groups.
Cognitive and Functional Outcomes on Discharge
The average duration of delirium for the GMU cohort was 8.2 days, with the mean length of total hospital stay being 17.0 days. The length of GMU stay for each patient was equivalent to the duration of delirium as patients were transferred out of the GMU once assessed to have recovered from delirium. Significant cognitive improvement was observed with recovery from delirium, with AMT and CMMSE scores improving by a mean of 1.442.38 and 3.545.61, respectively (paired t test, P<0.001). Patients demonstrated significant functional recovery at discharge from the GMU compared with their functional performance at admission to the GMU, with a mean MBI gain of 19.4217.11 (P<0.001), and 59 patients (48.4%) had progressed to a less‐dependent category.
Table 2 compares the cognitive and functional progress of patients with and without dementia. There was no difference in duration of delirium or length of total hospital stay between the demented and nondemented groups. Within‐group comparison showed patients with and without dementia managing significant improvement in cognitive scores at GMU discharge compared with GMU admission, although the magnitude of improvement was greater for nondemented patients (CMMSE improvement +6.73 vs +1.99, P<0.001). The mean MBI gain at GMU discharge compared with GMU admission was 20.4316.99 (P<0.001) for patients with dementia and 17.3517.39 (P<0.001) for patients without underlying dementia. There was no significant difference in the extent of functional improvement achieved between the demented and nondemented groups. Nineteen patients (47.5%) without dementia and 40 patients (48.8%) with preexisting dementia were in a less‐dependent category at GMU discharge compared with GMU admission.
| Overall GMU Cohort (n=122) | Underlying Dementia | P Value | ||
|---|---|---|---|---|
| Absent (n=40) | Present (n=82) | |||
| ||||
| Duration of delirium, meanSD, d | 8.2 | 7.47.6 | 8.65.7 | 0.35 |
| Length of hospital stay, meanSD, da | 17.0 | 18.69.7 | 16.38.7 | 0.18 |
| Cognitive scores on dischargeb | ||||
| AMT, mean (SD) | 3.25 (3.00) | 5.20 (2.88) | 2.29 (2.58) | <0.001 |
| CMMSE, mean (SD) | 8.84 (6.81) | 11.90 (6.16) | 7.34 (6.64) | <0.001 |
| Improvement in cognitive scores | ||||
| AMT, mean (SD)c | +1.44 (2.38) | +3.15 (2.68) | +0.61 (1.70) | <0.001 |
| CMMSE, mean (SD)c | +3.54 (5.61) | +6.73 (5.74) | +1.99 (4.87) | <0.001 |
| Delirium severity on discharge | ||||
| CAM‐sev, mean (SD) | 2.43 (1.44) | 2.15 (1.46) | 2.57 (1.42) | 0.13 |
| DRS‐sev, mean (SD) | 16.83 (6.97) | 14.45 (6.90) | 18.00 (6.74) | 0.008 |
| Change in delirium severity scores | ||||
| CAM‐sev, mean (SD)c | 2.47 (1.73) | 3.08 (1.67) | 2.17 (1.68) | 0.006 |
| DRS‐sev, mean (SD)c | 9.72 (7.30) | 12.85 (6.43) | 8.17 (7.25) | 0.001 |
| Functional status | ||||
| MBI discharge, mean (SD) | 51.03 (26.20) | 46.83 (24.09) | 53.09 (27.07) | 0.22 |
| MBI, mean (SD)c | +19.42 (17.11) | +17.35 (17.39) | +20.43 (16.99) | 0.35 |
| Progress to less‐dependent category at discharge, n (%)b | 59 (48.4%) | 19 (47.5%) | 40 (48.8%) | 1.00 |
Seventy‐nine patients (64.8% of the GMU cohort) were discharged back to their own home following the index hospitalization, 22 patients (18.0%) required further rehabilitation in a community hospital or subacute ward before returning home, and 19 patients (15.6%) were admitted to long‐term care. There was no significant difference in discharge destination between patients with and without dementia (Table 3).
| Overall GMU Cohort (n=122) | Underlying Dementia | P Value | ||
|---|---|---|---|---|
| Absent (n=40) | Present (n=82) | |||
| ||||
| Discharge destination, n (%) | 0.14 | |||
| Own home | 79 (64.8) | 24 (60.0) | 55 (67.9) | |
| Community hospital or subacute ward (with eventual discharge home after rehabilitation) | 22 (18.0) | 10 (25.0) | 12 (14.6) | |
| Long‐term care | 19 (15.6) | 6 (15.0) | 13 (16.0) | |
| Inpatient hospice | 1 (0.8) | 0 (0) | 1 (1.2) | |
Predictors of Functional Recovery on Discharge
Age, gender, number of precipitating causes, severity of illness, and type of delirium had a univariate P value <0.20 and were entered into the multiple regression model. After controlling for admission MBI score in multivariate analysis, gender, presentation of delirium, and severity of illness remained independent factors for improvement in MBI score (Table 4). Female patients exhibited greater functional recovery than males. Hypoactive delirium was associated with the worst prognosis for functional recovery, with improvement in MBI score being 14.47 points lower than that achieved by patients with hyperactive delirium. Severity of illness at admission was another negative predictor of functional recovery, with each unit increase in Severity of Illness Index (higher score indicating more severe illness) associated with 10.59 points lower gain in MBI.
| Predictor | Model 1 | Final Model | ||
|---|---|---|---|---|
| B | P Value | B | P Value | |
| ||||
| Age | 0.245 | 0.184 | ||
| Female (vs male) | 6.421 | 0.023 | 7.393 | 0.009 |
| Number of precipitating causes | 2.044 | 0.229 | ||
| Hypoactive delirium (vs hyperactive delirium) | 15.383 | <0.001 | 14.472 | 0.001 |
| Severity of illness | 10.596 | 0.003 | 10.591 | 0.003 |
DISCUSSION
Our results support a delirium management unit focused on geriatric nursing care and rehabilitation in promoting positive cognitive and functional gains in older patients with delirium. In addition, we have documented that patients with dementia and recovering from delirium have comparable potential for functional recovery as their cognitively intact counterparts, despite there being less improvement in cognitive test scores and higher comorbidity compared with patients without dementia.
Persistent delirium and failure to recognize the condition have been associated with poor functional recovery.[25, 26] Early recognition of delirium and actively addressing all predisposing and precipitating factors, along with emphasis on rehabilitation in a multidisciplinary unit, appear to be important factors contributing to the positive functional outcomes in our patients. In addition, none of the patients admitted to the GMU had been subject to physical restraint, and this, along with the higher nursing ratio, facilitated early mobilization essential to prevent functional decline. The overall length of hospital stay, averaging 17.0 days, compared favorably with a pre‐GMU cohort, where the average length of hospital stay for delirious patients was 20.9 days. The length of stay in an acute hospital ward included waiting time for transfer to appropriate postacute facility (community hospital, subacute ward, or nursing home).
In a study of older hospital inpatients, delirium independent of dementia was predictive of sustained poor cognitive and functional status in the year following hospitalization.[3] Thus, although delirium has been generally regarded as a transient and reversible condition, it is also increasingly recognized that recovery may not always be complete. This is a likely explanation for the low cognitive test scores at discharge from the GMU, albeit improved compared with admission, even among patients without dementia. The present study lacks data on longer‐term cognitive outcomes following delirium resolution. However, delirium is reportedly a risk factor for subsequent development of dementia,[27] and contributes to accelerated cognitive decline in patients with existing dementia.[28]
Despite reports of adverse outcomes of delirium superimposed on dementia, few intervention studies have specifically examined the management of delirium in older adults with dementia. In our study, preexisting dementia did not preclude delirious patients from functional improvement, adding to the still‐limited literature reporting positive rehabilitation outcomes in patients with cognitive impairment.[10, 29] In addition, patients with dementia did not take longer to recover from delirium than those without dementia, nor did they appear to require a longer duration for making similar functional gains given that length of hospital stay did not differ between the 2 groups. Illness severity and presentation of delirium, rather than preexisting dementia, predicted poor functional recovery. The complex etiology of delirium, representing an interaction between baseline patient vulnerability (predisposing factors) and exposure to noxious insults or precipitating factors, suggests that highly vulnerable patients (eg, dementia) may develop delirium with a relatively innocuous insult, as opposed to the multiple noxious insults anticipated in nonvulnerable patients.[30] Although Severity of Illness Index was similar, patients without dementia had a trend for more than 1 precipitating factor, and serious medical conditions, such as intracranial hemorrhage, fracture, and need for surgical intervention were more likely to be present, factors that can expectedly influence functional recovery. Patients with hypoactive delirium had the worst functional outcome, consistent with previously observed poor prognosis in hypoactive delirium.[31, 32] Our findings, if corroborated by future studies, may offer a means to attenuate the trajectory of functional decline observed in patients with delirium superimposed on dementia. This will be of particular relevance as earlier studies had observed a high risk of institutionalization in patients with delirium superimposed on dementia compared with dementia alone.[3, 33]
One limitation of this study was the failure to adjust for premorbid functional status due to the lack of information on baseline function prior to the current hospital admission. Even though we demonstrated functional improvement at discharge compared with admitting functional status, we were not able to ascertain if the patients had returned to their premorbid level of cognitive and physical functioning when discharged from the GMU. This study was also limited by its observational nature, the small sample size, and short‐term outcomes. However, the beneficial impact of the GMU on functional improvement in patients with delirium was supported by observed higher MBI gain compared with a pre‐GMU cohort (mean MBI gain, 7.511.2; discharge MBI, 45.832.9). Data collection for 6‐month and 1‐year outcomes is presently in progress to determine sustainability of any improvement achieved. Our exclusion criteria limits generalizability of the benefits of the GMU to patients considered medically unstable, in whom delirium is prevalent. However, such patients are likely too ill to participate in the intense rehabilitation practiced in the GMU.
We have shown that patients with delirium can engage and benefit from a rehabilitation program, their low cognitive test scores at admission notwithstanding, suggesting that early initiation of rehabilitation should be encouraged regardless of the cognitive and functional performance at presentation. In addition, we found that patients with delirium superimposed on dementia benefit from a multicomponent delirium treatment program to the same extent as delirious patients without dementia, which may contribute to improved quality of life and reduction in burden of care. As delirium is a complex medical problem with multiple predisposing and precipitating factors, a multicomponent intervention program as practiced in the GMU is likely to yield more consistent outcomes than a single intervention strategy. With the widely reported poor prognostic significance of delirium superimposed on dementia, more well‐designed controlled trials are urgently needed to identify intervention strategies that will aid the management of this group of hospitalized elders.
Acknowledgments
Disclosures: This work was supported by FY2010 Ministry of Health Quality Improvement Funding (MOH HQIF) Optimising Acute Delirium Care in Tan Tock Seng Hospital (Reference: HQIF 2010/17). The authors report no conflicts of interest.
- , , , et al. Acute delirium and functional decline in the hospitalized elderly patient. J Gerontol. 1993;48:M181–M186.
- , , , , . Does delirium contribute to poor hospital outcomes? A three‐site epidemiologic study. J Gen Intern Med. 1998;13:234–242.
- , , , , . Delirium in older medical inpatients and subsequent cognitive and functional status: a prospective study. CMAJ. 2001;165(5):575–583.
- , , , . Delirium risk factors in elderly hospitalized patients. J General Intern Med. 1998;13:204–212.
- , , . Delirium superimposed on dementia: a systematic review. J Am Geriatr Soc. 2002;50:1723–1732.
- , . Consequences of not recognizing delirium superimposed on dementia in hospitalized elderly individuals. J Gerontol Nurs. 2000;26:30–40.
- , , , , . Delirium predicts 12‐month mortality. Arch Intern Med. 2002;162:457–463.
- , , , et al. Predictors of rehabilitation outcomes in frail patients treated in a geriatric hospital. J Am Geriatr Soc. 2002;50:679–684.
- , , , , . Effect of cognitive impairment on rehabilitation outcome. Am J Phys Med Rehabil. 1996;75:40–43.
- , , , , . Rehabilitation outcomes in cognitively impaired patients admitted to skilled nursing facilities from the community. Arch Phys Med Rehabil. 2004;85:1602–1607.
- , , , . Does cognitive impairment affect rehabilitation outcome? J Am Geriatr Soc. 2011;59:2108–2111.
- , , , , , . A model for managing delirious older inpatients. J Am Geriatr Soc. 2003;51:1031–1035.
- , , , , . The Hospital Elder Life Program: a model of care to prevent cognitive and functional decline in older hospitalized patients. J Am Geriatr Soc. 2000;48:1697–1706.
- . Light therapy for insomnia in older adults. Clin Geriatr Med. 2008;24(1):139–149.
- , , , , , . A new model of delirium care in the acute geriatric setting: geriatric monitoring unit. BMC Geriatr. 2011;11:41.
- , , , , . The natural history of functional morbidity in hospitalized older patients. J Am Geriatr Soc. 1990;38:1296–1303.
- , , , , , . Clarifying confusion: The Confusion Assessment Method. A new method for detecting delirium. Ann Intern Med. 1990;113:941–948.
- American Psychiatric Association. Diagnostic and Statistical Manual of Mental Disorders. 4th ed. Washington, DC: American Psychiatric Association; 1994.
- , . An evidence‐based clinical approach to the diagnosis of dementia. Ann Acad Med Singapore. 2003;32:740–748.
- , , , . Diagnostic performance of two mental status tests in the older Chinese: influence of education and age on cut‐off values. Int J Geriatr Psychiatry. 2000;15:234–241.
- , , , , , . Validation of the Delirium Rating Scale‐revised‐98: comparison with the delirium rating scale and the cognitive test for delirium. J Neuropsychiatry Clin Neurosci. 2001;13:229–242.
- , , , . A new method of classifying prognositic comorbidity in longitudinal studies: development and validation. J Chronic Dis. 1987;40(5):373–383.
- , , , , . Resource consumption in hospitalised, frail older patients. Ann Acad Med Singapore. 2010;39(11):830–836.
- , , . Improving the sensitivity of the Barthel Index for stroke rehabilitation. J Clin Epidemiol. 1989;42(8):703–709.
- , , . Incomplete functional recovery after delirium in elderly people: a prospective cohort study. BMC Geriatr. 2005;5:5.
- , , , , , . Association between delirium resolution and functional recovery among newly admitted postacute facility patients. J Gerontol A Biol Sci Med Sci. 2006;61(2):204–208.
- , , , , . The association between delirium and cognitive decline: a review of the empirical literature. Neuropsychol Rev. 2004;14(2):87–98.
- , , , et al. Delirium accelerates cognitive decline in Alzheimer disease. Neurology. 2009;72:1570–1575.
- , , , , . Randomised, clinically controlled trial of intensive geriatric rehabilitation in patients with hip fracture: subgroup analysis of patients with dementia. BMJ. 2000;321:1107–1111.
- . Delirium in hospitalized older patients. Clin Geriatr Med. 1998;14(4):745–764.
- , . Clinical significance of delirium subtypes in older people. Age Ageing. 1999;28:115–119.
- , , , , , . Severity and course of delirium in medically hospitalised nursing facility residents. Am J Geriatr Psychiatry. 2001;9:72–77.
- , , , , , . Delirium in elderly patients and the risk of postdischarge mortality, institutionalization and dementia. A meta‐analysis. JAMA. 2010;304(4):443–451.
Copyright © 2013 Society of Hospital Medicine
Checklist of Safe Discharge Practices
The transition from hospital to home can expose patients to adverse events during the postdischarge period.[1, 2] Deficits in communication at hospital discharge are common,[3] and accurate information on important hospital events is often inadequately transmitted to outpatient providers, which may adversely affect patient outcomes.[4, 5, 6] Discharge bundles (multifaceted interventions including patient education, structured discharge planning, medication reconciliation, and follow‐up visits or phone calls) are strategies that provide support to patients returning home and facilitate transfer of information to primary‐care providers (PCPs).[7, 8, 9] These interventions collectively may improve patient satisfaction and possibly reduce rehospitalization.[10]
Beginning in 2012, the Centers for Medicare and Medicaid Services will be reducing payments to facilities with high rates of readmissions.[11] Thus, improving care transitions and thereby reducing avoidable readmissions are now priorities in many jurisdictions in the United States. There is a similar focus on readmission rates in the province of Ontario.[12] The Ontario Ministry of Health and Long‐Term Care convened an expert advisory panel with a mandate to provide guidance on evidence‐based practices that ensure efficient, effective, safe, and patient‐centered care transitions.[13] The objective of this study is to describe a structured panel approach to safe discharge practices, including a checklist of a recommended sequence of steps that can be followed throughout the hospital stay. This tool can aid efforts to optimize patient discharge from the hospital and improve outcomes.
METHODS
Literature Review
The research team reviewed the literature to determine the nature and format of the core information to be contained in a discharge checklist for hospitalized patients. We searched Medline (through January 2011) for relevant articles. We used combined Medical Subject Headings and keywords using patient discharge, transition, and medication reconciliation. Bibliographies of all relevant articles were reviewed to identify additional studies. In addition, we conducted a focused study of select resources, such as the systematic review examining interventions to reduce rehospitalization by Hansen and colleagues,[10] the Transitional Care Initiative for heart failure patients,[14] the Care Transitions Intervention,[15] Project RED (Re‐Engineered Hospital Discharge),[7] Project BOOST (Better Outcomes by Optimizing Safe Transitions),[16] and The King's Fund report on avoiding hospital admissions.[17] Available toolkit resources including those developed by the Commonwealth Fund in partnership with the Institute for Healthcare Improvement,[18] the World Health Organization,[19] and the Safer Healthcare Now![20] were examined in detail.
Consultation With Experts
The panel was composed of expert members from multiple disciplines and across several healthcare sectors, including PCPs, hospitalists, rehabilitation clinicians, nurses, researchers, pharmacists, academics, and hospital administrators. The aim was to create a discharge checklist to aid in transition planning based on best practices.
Checklist‐Development Process
An improvement consultant (N.Z.) facilitated the process (Figure 1). The results of the literature review were circulated prior to the first meeting. The panel met 3 times in person over a period of 3 months, from January 2011 to March 2011. At the first meeting, the panel reviewed existing toolkits and evidence‐based recommendations around best discharge practices. During the meeting, panel members were assigned to 1 of 6 groups (based on specialty area) and instructed to review toolkits and literature using a context‐specific lens (primary care, home care, follow‐up plans, communication to providers and caregivers, medication, and education). The goal of this exercise was to ensure that elements necessary for a successful discharge were viewed through the perspectives of interprofessional groups involved in the care of a patient. For example, PCPs in group 1 were asked to consider an ideal discharge from the perspective of primary care. Following the meeting, each group communicated via e‐mail to generate a list of evidence‐based items necessary for a safe discharge within the context of the group's assigned lens. Every group reached consensus on items specific to its context. A preliminary draft checklist was produced based on input from all groups. The checklist was created using recommended human‐factors engineering concepts.[21] The second meeting provided the opportunity for individual comments and feedback on the draft checklist. Three cycles of checklist revision followed by comments and feedback were conducted after the meeting, through e‐mail exchange. A final meeting provided consensus of the panel on every element of the Safe Discharge Practices Checklist.
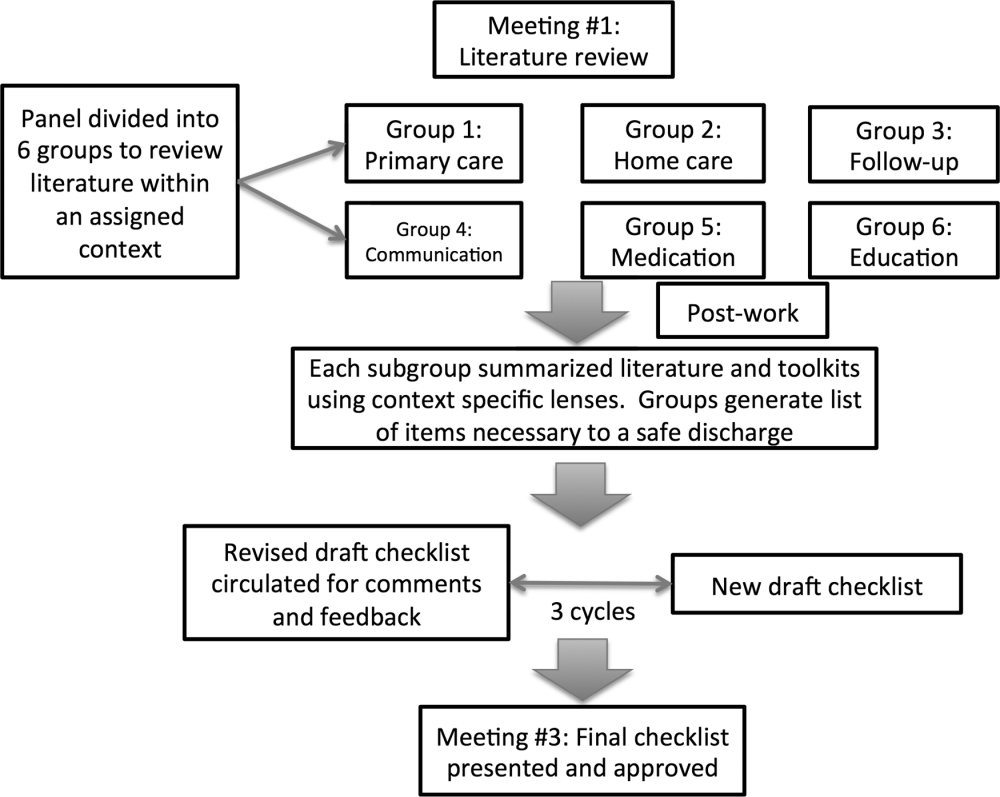
RESULTS
Evidence‐based interventions pre‐, post‐, and bridging discharge were categorized into 7 domains: (1) indication for hospitalization, (2) primary care, (3) medication safety, (4) follow‐up plans, (5) home‐care referral, (6) communication with outpatient providers, and (7) patient education (Table 1). The panel reached 100% agreement on the recommended timeline to implement elements of the discharge checklist. Given the diverse interprofessional membership of the panel, it was felt that a daily reminder of tasks to be performed would provide the best format and have the highest likelihood of engaging team members in patient care coordination. It was also felt that daily interdisciplinary (ie, bullet) rounds would serve as the most appropriate venue to utilize the checklist tool.
| Day of Admission | Subsequent Hospital Days | Discharge Day | Discharge Day +3 | |
|---|---|---|---|---|
| ||||
| 1. Hospital | ||||
| a. Assess patient to see if hospitalization is still required. | ||||
| 2. Primary care | ||||
| a. Identify and/or confirm patient has an active PCP; alert care team if no PCP and/or begin PCP search. | ||||
| b. Contact PCP and notify of patient's admission, diagnosis, and predicted discharge date. | ||||
| c. Book postdischarge PCP follow‐up appointment within 714 days of discharge (according to patient/caregiver availability and transportation needs). | ||||
| 3. Medication safety | ||||
| a. Develop BPMH and reconcile this to admission's medication orders. | ||||
| b. Teach patient how to properly use discharge medications and how these relate to the medications patient was taking prior to admission. | ||||
| c. Reconcile discharge medication order/prescription with BPMH and medications prescribed while in hospital. | ||||
| 4. Follow‐up | ||||
| a.Perform postdischarge follow‐up phone call to patient (for patients with high LACE scoresa). During call, ask: | ||||
| Has patient received new meds (if any)? | ||||
| Has patient received home care? | ||||
| Remind patient of upcoming appointments. | ||||
| If necessary, schedule patient and caregiver to come back to facility for education and training. | ||||
| b. If necessary, arrange outpatient investigations (laboratory, radiology, etc.). | ||||
| c. If necessary, book specialty‐clinic follow‐up appointment. | ||||
| 5. Home care | ||||
| a. Home‐care agency shares information, where available, about patient's existing community services. | ||||
| b. Engage home‐care agencies (eg, interdisciplinary rounds). | ||||
| c. If necessary, schedule postdischarge care. | ||||
| 6. Communication | ||||
| a. Provide patient, community pharmacy, PCP, and formal caregiver (family, LTC, home‐care agency) with copy of Discharge Summary Plan/Note and the Medication Reconciliation Form, and contact information of attending hospital physician and inpatient unit. | ||||
| 7. Patient education | ||||
| a. Clinical team performs teach‐back to patient.b | ||||
| b. Explain to patient how new medications relate to diagnosis. | ||||
| c. Thoroughly explain discharge summary to patient (use teach‐back if needed). | ||||
| d. Explain potential symptoms, what to expect while at home, and under what circumstances patient should visit ED. | ||||
The panel chose daily reminders to perform patient education around medications and clinical care for several reasons. Daily teaching provides an opportunity to assess information carried over and accurate understanding of treatment plans, as well as to review changes in care plans that may be evolving during a hospitalization. Although education starting on day 1 of admission may seem premature, we felt there was merit in addressing issues early. For example, patients admitted with heart failure can benefit from daily inpatient education around self‐monitoring, diet, and lifestyle counseling.[22]
The literature review identified communication with PCPs as an important focus to prevent adverse events when patients transition from hospital to home.[3] The expert panel agreed on admission notification, follow‐up appointment scheduling, and transfer of a high‐quality discharge summary to the patient's PCP, such as one described by Maslove and colleagues.[23] For example, summaries containing structured sections such as relevant inpatient provider contacts, diagnoses, course in hospital, results of investigations (including pending results), discharge instructions and follow‐up, and medication reconciliation have been recommended to improve communication to outpatient providers.[3] Use of validated scores such as the LACE index (a score calculated based on 4 factors: [L] length of hospital stay, [A] acuity on admission, [C] comorbidity, and [E] emergency department visits) to identify patients at high risk of readmission and targeting these individuals when arranging postdischarge follow‐up is encouraged.[24, 25] Patients with high LACE scores (10) would benefit from postdischarge follow‐up phone calls within the first 3 days of returning home. In addition, high‐risk patients may require an earlier follow‐up appointment with the PCP, and the panel supports attempts to arrange follow‐up within 7 days for at‐risk individuals. For those without a PCP, it was recommended that a search should be initiated to assist the patient in obtaining a PCP.
Medication safety is a significant source of adverse events for patients returning home from the hospital.[2, 26, 27, 28] The discharge checklist provides prompts to reconcile medications on admission and discharge, in addition to daily patient education on proper use of medications. Formal medication reconciliation programs should be tailored to the individual hospital's own resources and requirements.[29, 30]
Postdischarge care plays an important role in supporting the patient upon discharge and when part of a multifaceted discharge plan can result in decreased readmission rates and hospital utilization.[7, 9, 15, 31] The panel incorporated these elements by recommending performing postdischarge phone calls, arranging outpatient follow‐up if necessary, and coordinating home‐care services through local agencies.
To facilitate transfer of information, patients, caregivers, outpatient providers, and community pharmacies are to be provided copies of a comprehensive discharge summary, medication reconciliation, and contact information of the inpatient team under the category of Communication. Finally, as the teach‐back method is an effective tool to ensure patient understanding of their health issues, the panel recommended its use when educating patients on medication use, plan of care, and discharge instructions.[32, 33] Examples of scenarios where teach‐back would be of benefit include changes in medications with a high risk of adverse events, such as warfarin or furosemide, to ensure patients understand the dosing, frequency, and monitoring required; and self‐management skills (eg, daily weights and dietary changes) in patients with heart failure.
Finally, the panel noted that it was important to link the checklist items with relevant measures, audit, and feedback to determine associations between process and outcomes. The group avoided specific detailed recommendations to allow each institution to locally tailor appropriate process and outcome measures to assess fidelity of each component of the checklist.
DISCUSSION
A standardized, evidence‐based discharge process is critical to safe transitions for the hospitalized patient. We have used a consensus process of stakeholders to develop a Checklist of Safe Discharge Practices for Hospital Patients that details the steps of events that need to be completed for every day of a typical hospitalization. The day of discharge is often a confusing and chaotic time, with patients receiving an overwhelming volume of information on their last day in the hospital. We believe that discharge planning starts from the day of admission with daily patient education and a coordinated interdisciplinary team approach. The components of the discharge checklist should be completed throughout a patient's hospitalization to ensure a successful discharge and transmission of knowledge.
Discharge checklists have been described previously. Halasyamani and colleagues developed a checklist for elderly inpatients created through a process of literature and peer review followed by a panel discussion at the Society of Hospital Medicine Annual Meeting.[34] The resultant tool described important data elements necessary for a successful discharge and which processes were most appropriate to facilitate the transfer of information. This differs significantly from our discharge checklist, which provides specific recommendations on methods and processes to effect a safe discharge in addition to an expected timeline of when to complete each step. Kripalani et al reviewed the literature for suggested methods of promoting effective transitions of care at discharge, and their results are consistent with those summarized in our discharge checklist.[29] In contrast to both efforts, our group was multidisciplinary and had broad representation from the acute care, chronic care, home care, rehabilitation medicine, and long‐term care sectors, thereby incorporating all possible aspects of the transition process. Coordinating discharge care requires significant teamwork; our tool extends beyond a checklist of tasks to be performed, and rather serves as a platform to facilitate interprofessional collaboration. In addition, this checklist was designed to integrate discharge planning into interprofessional care rounds occurring throughout a hospital admission. As well, our paper follows an explicit and defined consensus process. Finally, our proposed tool better follows a recommended checklist format.[21]
The discharge process occurring during a patient's hospitalization is a complex, multifaceted care‐coordination plan that must begin on the first day of admission. Often, transfer of important information and medication review take place only hours before a patient leaves the hospital, a suboptimal time for patient education.[28, 35] Just as standardized treatment protocols and care plans can improve outcomes,[36] a similar approach for discharge processes may facilitate safe transition from hospital to home. Our discharge checklist prompts hospital providers to initiate steps necessary for a successful discharge while allowing for local adaptation in how each element is performed. We suggest using the checklist during daily interprofessional team rounds to ensure each task is completed, if appropriate. Institutions may consider measuring process measures such as adherence and completion of checklist, audits of discharge summaries for completion and transmission rates to PCPs (by fax or through health record departments), and documentation of patient education or medication reconciliation. Example outcome measures, if feasible, include Care Transitions Measure (CTM) scores, patient satisfaction surveys, and readmission rates.
Several limitations of this study should be considered. First, current literature on safe discharge practices is limited by low study‐design quality, with a paucity of randomized controlled trials. However, a recent systematic review found that bundled discharge interventions are likely to be most effective.[10] Individual items of the checklist may not have had an extensive evidence base; however, some of these suggested elements (eg, contact home care) have clinical face validity. Second, the heterogeneity of interventions studied pose challenges in determining generalizable best practices without considering local factors. To mitigate this, we suggest adapting the checklist to local contexts and resource availability. Third, the checklist has not been tested. The next step of this project is to pilot checklist use through small‐scale Plan‐Do‐Study‐Act (PDSA) cycles followed by large‐scale implementation. We plan to collect baseline, process, and outcome measures before and after implementation of the checklist at multiple institutions to determine utility.
Standardization of discharge practices is critical to safe transitions and preventing avoidable admissions to hospital. Our discharge checklist is an expanded tool that provides explicit guidance for each day of hospitalization and can be adapted for any hospital admission to aid interdisciplinary efforts toward a successful discharge. Future studies to evaluate the checklist in improving care‐transition processes are required to determine association with outcomes.
Disclosures
Nothing to report.
- , , , , . The incidence and severity of adverse events affecting patients after discharge from the hospital. Ann Intern Med. 2003;138(3):161–167.
- , , , et al. Patient safety concerns arising from test results that return after hospital discharge. Ann Intern Med. 2005;143(2):121–128.
- , , , , , . Deficits in communication and information transfer between hospital‐based and primary care physicians: implications for patient safety and continuity of care. JAMA. 2007;297(8):831–841.
- , , , , , . “I wish I had seen this test result earlier!”: dissatisfaction with test result management systems in primary care. Arch Intern Med. 2004;164(20):2223–2228.
- , . Lost in transition: challenges and opportunities for improving the quality of transitional care. Ann Intern Med. 2004;141(7):533–536.
- , , , . Continuity of care and patient outcomes after hospital discharge. J Gen Intern Med. 2004;19(6):624–631.
- , , , et al. A reengineered hospital discharge program to decrease rehospitalization: a randomized trial. Ann Intern Med. 2009;150(3):178–187.
- , , , et al. A Quality improvement intervention to facilitate the transition of older adults from three hospitals back to their homes. J Am Geriatr Soc. 57(9):1540–1546.
- , , , et al. Reduction of 30‐day postdischarge hospital readmission or emergency department (ED) visit rates in high‐risk elderly medical patients through delivery of a targeted care bundle. J Hosp Med. 2009;4(4):211–218.
- , , , , . Interventions to reduce 30‐day rehospitalization: a systematic review. Ann Intern Med. 2011;155(8):520–528.
- Centers for Medicare and Medicaid Services. Readmissions reduction program. Available at: http://cms.gov/Medicare/Medicare‐Fee‐for‐Service‐Payment/AcuteInpatientPPS/Readmissions‐Reduction‐Program.html.Accessed September 5, 2012.
- Ontario Ministry of Health and Long‐Term Care. The Excellent Care for All Act, 2010. Available at: http://health.gov.on.ca/en/public/programs/ecfa/default.aspx/. Accessed February 28, 2013.
- Ontario Ministry of Health and Long‐Term Care; Baker GR, ed. Enhancing the Continuum of Care: Report of the Avoidable Hospitalization Advisory Panel, November 2011. Available at: http://www.health.gov.on.ca/en/common/ministry/publications/reports/baker_2011/baker_2011.pdf. Accessed August 8, 2012.
- , , , , , . Transitional care of older adults hospitalized with heart failure: a randomized, controlled trial [published correction appears in J Am Geriatr Soc. 2004;52(7):1228]. J Am Geriatr Soc. 2004;52(5):675–684.
- , , , . The care transitions intervention: results of a randomized controlled trial. Arch Intern Med. 2006;166(17):1822–1828.
- Society of Hospital Medicine. Project BOOST: Better Outcomes by Optimizing Safe Transitions. Available at: http://www.hospitalmedicine.org/BOOST/. Accessed October 31, 2012.
- The King's Fund; , , . Avoiding Hospital Admissions: Lessons From Evidence and Experience. Available at: http://www.kingsfund.org.uk/publications/articles/avoiding‐hospital‐admissions‐lessons‐evidence. Published October 28, 2010. Accessed September 4, 2012.
- Nielsen GA, Rutherford P, Taylor J, eds. How‐To Guide: Creating an Ideal Transition Home. Cambridge, MA: Institute for Healthcare Improvement; 2009. Available at: http://www.ihi.org or http://ah.cms‐plus.com/files/IHI_How_to_Guide_Creating_an_Ideal_Transition_Home.pdf. Accessed August 8, 2012.
- World Health Organization. Action on Patient Safety—High 5s. Available at: http://www.who.int/patientsafety/implementation/solutions/high5s/en/index.html. Accessed October 29, 2012.
- Safer Healthcare Now! Medication Reconciliation in Acute Care: Getting Started Kit. Available at: http://www.ismp‐canada.org/download/MedRec/Medrec_AC_English_GSK_V3.pdf. Accessed October 29, 2012.
- US Agency for Healthcare Research and Quality. PSNet: Patient‐safety primers, checklists. Available at: http://www.psnet.ahrq.gov/primer.aspx?primerID=14. Accessed November 1, 2012.
- , , , . Benefits of comprehensive inpatient education and discharge planning combined with outpatient support in elderly patients with congestive heart failure. Congest Heart Fail. 2005;11(6):315–321.
- , , , et al. Electronic versus dictated hospital discharge summaries: a randomized controlled trial. J Gen Intern Med. 2009;24(9):995–1001.
- , , , et al. Unplanned readmissions after hospital discharge among patients identified as being at high risk for readmission using a validated predictive algorithm. Open Med. 2011;5(2):e104–e111.
- , , , et al. Derivation and validation of an index to predict early death or unplanned readmission after discharge from hospital to the community. CMAJ. 2010;182(6):551–557.
- . Will, ideas, and execution: their role in reducing adverse medication events. J Pediatr. 2005;147(6):727–728.
- , , , . Pharmacists on rounding teams reduce preventable adverse drug events in hospital general medicine units. Arch Intern Med. 2003;163(17):2014–2018.
- , , , et al. Role of pharmacist counseling in preventing adverse drug events after hospitalization. Arch Intern Med. 2006;166(5):565–571.
- , , , . Promoting effective transitions of care at hospital discharge: a review of key issues for hospitalists. J Hosp Med. 2007;2(5):314–323.
- , . Medication reconciliation in the hospital. Healthc Q. 2012;15:42–49.
- , , , , , . Comprehensive discharge planning for the hospitalized elderly: a randomized clinical trial. Ann Intern Med. 1994;120(12):999–1006.
- , , , et al. Closing the loop: physician communication with diabetic patients who have low health literacy. Arch Intern Med. 2003;163(1):83–90.
- , , . The effects of patient communication skills training on compliance. Arch Fam Med. 2000;9(1):57–64.
- , , , et al. Transition of care for hospitalized elderly patients—development of a discharge checklist for hospitalists. J Hosp Med. 2006;1(6):354–360.
- , , , , . Influence of a “discharge interview” on patient knowledge, compliance, and functional status after hospitalization. Med Care. 1983;21(8):755–767.
- , , , , . Critical pathways intervention to reduce length of hospital stay. Am J Med. 2001;110(3):175–180.
The transition from hospital to home can expose patients to adverse events during the postdischarge period.[1, 2] Deficits in communication at hospital discharge are common,[3] and accurate information on important hospital events is often inadequately transmitted to outpatient providers, which may adversely affect patient outcomes.[4, 5, 6] Discharge bundles (multifaceted interventions including patient education, structured discharge planning, medication reconciliation, and follow‐up visits or phone calls) are strategies that provide support to patients returning home and facilitate transfer of information to primary‐care providers (PCPs).[7, 8, 9] These interventions collectively may improve patient satisfaction and possibly reduce rehospitalization.[10]
Beginning in 2012, the Centers for Medicare and Medicaid Services will be reducing payments to facilities with high rates of readmissions.[11] Thus, improving care transitions and thereby reducing avoidable readmissions are now priorities in many jurisdictions in the United States. There is a similar focus on readmission rates in the province of Ontario.[12] The Ontario Ministry of Health and Long‐Term Care convened an expert advisory panel with a mandate to provide guidance on evidence‐based practices that ensure efficient, effective, safe, and patient‐centered care transitions.[13] The objective of this study is to describe a structured panel approach to safe discharge practices, including a checklist of a recommended sequence of steps that can be followed throughout the hospital stay. This tool can aid efforts to optimize patient discharge from the hospital and improve outcomes.
METHODS
Literature Review
The research team reviewed the literature to determine the nature and format of the core information to be contained in a discharge checklist for hospitalized patients. We searched Medline (through January 2011) for relevant articles. We used combined Medical Subject Headings and keywords using patient discharge, transition, and medication reconciliation. Bibliographies of all relevant articles were reviewed to identify additional studies. In addition, we conducted a focused study of select resources, such as the systematic review examining interventions to reduce rehospitalization by Hansen and colleagues,[10] the Transitional Care Initiative for heart failure patients,[14] the Care Transitions Intervention,[15] Project RED (Re‐Engineered Hospital Discharge),[7] Project BOOST (Better Outcomes by Optimizing Safe Transitions),[16] and The King's Fund report on avoiding hospital admissions.[17] Available toolkit resources including those developed by the Commonwealth Fund in partnership with the Institute for Healthcare Improvement,[18] the World Health Organization,[19] and the Safer Healthcare Now![20] were examined in detail.
Consultation With Experts
The panel was composed of expert members from multiple disciplines and across several healthcare sectors, including PCPs, hospitalists, rehabilitation clinicians, nurses, researchers, pharmacists, academics, and hospital administrators. The aim was to create a discharge checklist to aid in transition planning based on best practices.
Checklist‐Development Process
An improvement consultant (N.Z.) facilitated the process (Figure 1). The results of the literature review were circulated prior to the first meeting. The panel met 3 times in person over a period of 3 months, from January 2011 to March 2011. At the first meeting, the panel reviewed existing toolkits and evidence‐based recommendations around best discharge practices. During the meeting, panel members were assigned to 1 of 6 groups (based on specialty area) and instructed to review toolkits and literature using a context‐specific lens (primary care, home care, follow‐up plans, communication to providers and caregivers, medication, and education). The goal of this exercise was to ensure that elements necessary for a successful discharge were viewed through the perspectives of interprofessional groups involved in the care of a patient. For example, PCPs in group 1 were asked to consider an ideal discharge from the perspective of primary care. Following the meeting, each group communicated via e‐mail to generate a list of evidence‐based items necessary for a safe discharge within the context of the group's assigned lens. Every group reached consensus on items specific to its context. A preliminary draft checklist was produced based on input from all groups. The checklist was created using recommended human‐factors engineering concepts.[21] The second meeting provided the opportunity for individual comments and feedback on the draft checklist. Three cycles of checklist revision followed by comments and feedback were conducted after the meeting, through e‐mail exchange. A final meeting provided consensus of the panel on every element of the Safe Discharge Practices Checklist.
RESULTS
Evidence‐based interventions pre‐, post‐, and bridging discharge were categorized into 7 domains: (1) indication for hospitalization, (2) primary care, (3) medication safety, (4) follow‐up plans, (5) home‐care referral, (6) communication with outpatient providers, and (7) patient education (Table 1). The panel reached 100% agreement on the recommended timeline to implement elements of the discharge checklist. Given the diverse interprofessional membership of the panel, it was felt that a daily reminder of tasks to be performed would provide the best format and have the highest likelihood of engaging team members in patient care coordination. It was also felt that daily interdisciplinary (ie, bullet) rounds would serve as the most appropriate venue to utilize the checklist tool.
| Day of Admission | Subsequent Hospital Days | Discharge Day | Discharge Day +3 | |
|---|---|---|---|---|
| ||||
| 1. Hospital | ||||
| a. Assess patient to see if hospitalization is still required. | ||||
| 2. Primary care | ||||
| a. Identify and/or confirm patient has an active PCP; alert care team if no PCP and/or begin PCP search. | ||||
| b. Contact PCP and notify of patient's admission, diagnosis, and predicted discharge date. | ||||
| c. Book postdischarge PCP follow‐up appointment within 714 days of discharge (according to patient/caregiver availability and transportation needs). | ||||
| 3. Medication safety | ||||
| a. Develop BPMH and reconcile this to admission's medication orders. | ||||
| b. Teach patient how to properly use discharge medications and how these relate to the medications patient was taking prior to admission. | ||||
| c. Reconcile discharge medication order/prescription with BPMH and medications prescribed while in hospital. | ||||
| 4. Follow‐up | ||||
| a.Perform postdischarge follow‐up phone call to patient (for patients with high LACE scoresa). During call, ask: | ||||
| Has patient received new meds (if any)? | ||||
| Has patient received home care? | ||||
| Remind patient of upcoming appointments. | ||||
| If necessary, schedule patient and caregiver to come back to facility for education and training. | ||||
| b. If necessary, arrange outpatient investigations (laboratory, radiology, etc.). | ||||
| c. If necessary, book specialty‐clinic follow‐up appointment. | ||||
| 5. Home care | ||||
| a. Home‐care agency shares information, where available, about patient's existing community services. | ||||
| b. Engage home‐care agencies (eg, interdisciplinary rounds). | ||||
| c. If necessary, schedule postdischarge care. | ||||
| 6. Communication | ||||
| a. Provide patient, community pharmacy, PCP, and formal caregiver (family, LTC, home‐care agency) with copy of Discharge Summary Plan/Note and the Medication Reconciliation Form, and contact information of attending hospital physician and inpatient unit. | ||||
| 7. Patient education | ||||
| a. Clinical team performs teach‐back to patient.b | ||||
| b. Explain to patient how new medications relate to diagnosis. | ||||
| c. Thoroughly explain discharge summary to patient (use teach‐back if needed). | ||||
| d. Explain potential symptoms, what to expect while at home, and under what circumstances patient should visit ED. | ||||
The panel chose daily reminders to perform patient education around medications and clinical care for several reasons. Daily teaching provides an opportunity to assess information carried over and accurate understanding of treatment plans, as well as to review changes in care plans that may be evolving during a hospitalization. Although education starting on day 1 of admission may seem premature, we felt there was merit in addressing issues early. For example, patients admitted with heart failure can benefit from daily inpatient education around self‐monitoring, diet, and lifestyle counseling.[22]
The literature review identified communication with PCPs as an important focus to prevent adverse events when patients transition from hospital to home.[3] The expert panel agreed on admission notification, follow‐up appointment scheduling, and transfer of a high‐quality discharge summary to the patient's PCP, such as one described by Maslove and colleagues.[23] For example, summaries containing structured sections such as relevant inpatient provider contacts, diagnoses, course in hospital, results of investigations (including pending results), discharge instructions and follow‐up, and medication reconciliation have been recommended to improve communication to outpatient providers.[3] Use of validated scores such as the LACE index (a score calculated based on 4 factors: [L] length of hospital stay, [A] acuity on admission, [C] comorbidity, and [E] emergency department visits) to identify patients at high risk of readmission and targeting these individuals when arranging postdischarge follow‐up is encouraged.[24, 25] Patients with high LACE scores (10) would benefit from postdischarge follow‐up phone calls within the first 3 days of returning home. In addition, high‐risk patients may require an earlier follow‐up appointment with the PCP, and the panel supports attempts to arrange follow‐up within 7 days for at‐risk individuals. For those without a PCP, it was recommended that a search should be initiated to assist the patient in obtaining a PCP.
Medication safety is a significant source of adverse events for patients returning home from the hospital.[2, 26, 27, 28] The discharge checklist provides prompts to reconcile medications on admission and discharge, in addition to daily patient education on proper use of medications. Formal medication reconciliation programs should be tailored to the individual hospital's own resources and requirements.[29, 30]
Postdischarge care plays an important role in supporting the patient upon discharge and when part of a multifaceted discharge plan can result in decreased readmission rates and hospital utilization.[7, 9, 15, 31] The panel incorporated these elements by recommending performing postdischarge phone calls, arranging outpatient follow‐up if necessary, and coordinating home‐care services through local agencies.
To facilitate transfer of information, patients, caregivers, outpatient providers, and community pharmacies are to be provided copies of a comprehensive discharge summary, medication reconciliation, and contact information of the inpatient team under the category of Communication. Finally, as the teach‐back method is an effective tool to ensure patient understanding of their health issues, the panel recommended its use when educating patients on medication use, plan of care, and discharge instructions.[32, 33] Examples of scenarios where teach‐back would be of benefit include changes in medications with a high risk of adverse events, such as warfarin or furosemide, to ensure patients understand the dosing, frequency, and monitoring required; and self‐management skills (eg, daily weights and dietary changes) in patients with heart failure.
Finally, the panel noted that it was important to link the checklist items with relevant measures, audit, and feedback to determine associations between process and outcomes. The group avoided specific detailed recommendations to allow each institution to locally tailor appropriate process and outcome measures to assess fidelity of each component of the checklist.
DISCUSSION
A standardized, evidence‐based discharge process is critical to safe transitions for the hospitalized patient. We have used a consensus process of stakeholders to develop a Checklist of Safe Discharge Practices for Hospital Patients that details the steps of events that need to be completed for every day of a typical hospitalization. The day of discharge is often a confusing and chaotic time, with patients receiving an overwhelming volume of information on their last day in the hospital. We believe that discharge planning starts from the day of admission with daily patient education and a coordinated interdisciplinary team approach. The components of the discharge checklist should be completed throughout a patient's hospitalization to ensure a successful discharge and transmission of knowledge.
Discharge checklists have been described previously. Halasyamani and colleagues developed a checklist for elderly inpatients created through a process of literature and peer review followed by a panel discussion at the Society of Hospital Medicine Annual Meeting.[34] The resultant tool described important data elements necessary for a successful discharge and which processes were most appropriate to facilitate the transfer of information. This differs significantly from our discharge checklist, which provides specific recommendations on methods and processes to effect a safe discharge in addition to an expected timeline of when to complete each step. Kripalani et al reviewed the literature for suggested methods of promoting effective transitions of care at discharge, and their results are consistent with those summarized in our discharge checklist.[29] In contrast to both efforts, our group was multidisciplinary and had broad representation from the acute care, chronic care, home care, rehabilitation medicine, and long‐term care sectors, thereby incorporating all possible aspects of the transition process. Coordinating discharge care requires significant teamwork; our tool extends beyond a checklist of tasks to be performed, and rather serves as a platform to facilitate interprofessional collaboration. In addition, this checklist was designed to integrate discharge planning into interprofessional care rounds occurring throughout a hospital admission. As well, our paper follows an explicit and defined consensus process. Finally, our proposed tool better follows a recommended checklist format.[21]
The discharge process occurring during a patient's hospitalization is a complex, multifaceted care‐coordination plan that must begin on the first day of admission. Often, transfer of important information and medication review take place only hours before a patient leaves the hospital, a suboptimal time for patient education.[28, 35] Just as standardized treatment protocols and care plans can improve outcomes,[36] a similar approach for discharge processes may facilitate safe transition from hospital to home. Our discharge checklist prompts hospital providers to initiate steps necessary for a successful discharge while allowing for local adaptation in how each element is performed. We suggest using the checklist during daily interprofessional team rounds to ensure each task is completed, if appropriate. Institutions may consider measuring process measures such as adherence and completion of checklist, audits of discharge summaries for completion and transmission rates to PCPs (by fax or through health record departments), and documentation of patient education or medication reconciliation. Example outcome measures, if feasible, include Care Transitions Measure (CTM) scores, patient satisfaction surveys, and readmission rates.
Several limitations of this study should be considered. First, current literature on safe discharge practices is limited by low study‐design quality, with a paucity of randomized controlled trials. However, a recent systematic review found that bundled discharge interventions are likely to be most effective.[10] Individual items of the checklist may not have had an extensive evidence base; however, some of these suggested elements (eg, contact home care) have clinical face validity. Second, the heterogeneity of interventions studied pose challenges in determining generalizable best practices without considering local factors. To mitigate this, we suggest adapting the checklist to local contexts and resource availability. Third, the checklist has not been tested. The next step of this project is to pilot checklist use through small‐scale Plan‐Do‐Study‐Act (PDSA) cycles followed by large‐scale implementation. We plan to collect baseline, process, and outcome measures before and after implementation of the checklist at multiple institutions to determine utility.
Standardization of discharge practices is critical to safe transitions and preventing avoidable admissions to hospital. Our discharge checklist is an expanded tool that provides explicit guidance for each day of hospitalization and can be adapted for any hospital admission to aid interdisciplinary efforts toward a successful discharge. Future studies to evaluate the checklist in improving care‐transition processes are required to determine association with outcomes.
Disclosures
Nothing to report.
- , , , , . The incidence and severity of adverse events affecting patients after discharge from the hospital. Ann Intern Med. 2003;138(3):161–167.
- , , , et al. Patient safety concerns arising from test results that return after hospital discharge. Ann Intern Med. 2005;143(2):121–128.
- , , , , , . Deficits in communication and information transfer between hospital‐based and primary care physicians: implications for patient safety and continuity of care. JAMA. 2007;297(8):831–841.
- , , , , , . “I wish I had seen this test result earlier!”: dissatisfaction with test result management systems in primary care. Arch Intern Med. 2004;164(20):2223–2228.
- , . Lost in transition: challenges and opportunities for improving the quality of transitional care. Ann Intern Med. 2004;141(7):533–536.
- , , , . Continuity of care and patient outcomes after hospital discharge. J Gen Intern Med. 2004;19(6):624–631.
- , , , et al. A reengineered hospital discharge program to decrease rehospitalization: a randomized trial. Ann Intern Med. 2009;150(3):178–187.
- , , , et al. A Quality improvement intervention to facilitate the transition of older adults from three hospitals back to their homes. J Am Geriatr Soc. 57(9):1540–1546.
- , , , et al. Reduction of 30‐day postdischarge hospital readmission or emergency department (ED) visit rates in high‐risk elderly medical patients through delivery of a targeted care bundle. J Hosp Med. 2009;4(4):211–218.
- , , , , . Interventions to reduce 30‐day rehospitalization: a systematic review. Ann Intern Med. 2011;155(8):520–528.
- Centers for Medicare and Medicaid Services. Readmissions reduction program. Available at: http://cms.gov/Medicare/Medicare‐Fee‐for‐Service‐Payment/AcuteInpatientPPS/Readmissions‐Reduction‐Program.html.Accessed September 5, 2012.
- Ontario Ministry of Health and Long‐Term Care. The Excellent Care for All Act, 2010. Available at: http://health.gov.on.ca/en/public/programs/ecfa/default.aspx/. Accessed February 28, 2013.
- Ontario Ministry of Health and Long‐Term Care; Baker GR, ed. Enhancing the Continuum of Care: Report of the Avoidable Hospitalization Advisory Panel, November 2011. Available at: http://www.health.gov.on.ca/en/common/ministry/publications/reports/baker_2011/baker_2011.pdf. Accessed August 8, 2012.
- , , , , , . Transitional care of older adults hospitalized with heart failure: a randomized, controlled trial [published correction appears in J Am Geriatr Soc. 2004;52(7):1228]. J Am Geriatr Soc. 2004;52(5):675–684.
- , , , . The care transitions intervention: results of a randomized controlled trial. Arch Intern Med. 2006;166(17):1822–1828.
- Society of Hospital Medicine. Project BOOST: Better Outcomes by Optimizing Safe Transitions. Available at: http://www.hospitalmedicine.org/BOOST/. Accessed October 31, 2012.
- The King's Fund; , , . Avoiding Hospital Admissions: Lessons From Evidence and Experience. Available at: http://www.kingsfund.org.uk/publications/articles/avoiding‐hospital‐admissions‐lessons‐evidence. Published October 28, 2010. Accessed September 4, 2012.
- Nielsen GA, Rutherford P, Taylor J, eds. How‐To Guide: Creating an Ideal Transition Home. Cambridge, MA: Institute for Healthcare Improvement; 2009. Available at: http://www.ihi.org or http://ah.cms‐plus.com/files/IHI_How_to_Guide_Creating_an_Ideal_Transition_Home.pdf. Accessed August 8, 2012.
- World Health Organization. Action on Patient Safety—High 5s. Available at: http://www.who.int/patientsafety/implementation/solutions/high5s/en/index.html. Accessed October 29, 2012.
- Safer Healthcare Now! Medication Reconciliation in Acute Care: Getting Started Kit. Available at: http://www.ismp‐canada.org/download/MedRec/Medrec_AC_English_GSK_V3.pdf. Accessed October 29, 2012.
- US Agency for Healthcare Research and Quality. PSNet: Patient‐safety primers, checklists. Available at: http://www.psnet.ahrq.gov/primer.aspx?primerID=14. Accessed November 1, 2012.
- , , , . Benefits of comprehensive inpatient education and discharge planning combined with outpatient support in elderly patients with congestive heart failure. Congest Heart Fail. 2005;11(6):315–321.
- , , , et al. Electronic versus dictated hospital discharge summaries: a randomized controlled trial. J Gen Intern Med. 2009;24(9):995–1001.
- , , , et al. Unplanned readmissions after hospital discharge among patients identified as being at high risk for readmission using a validated predictive algorithm. Open Med. 2011;5(2):e104–e111.
- , , , et al. Derivation and validation of an index to predict early death or unplanned readmission after discharge from hospital to the community. CMAJ. 2010;182(6):551–557.
- . Will, ideas, and execution: their role in reducing adverse medication events. J Pediatr. 2005;147(6):727–728.
- , , , . Pharmacists on rounding teams reduce preventable adverse drug events in hospital general medicine units. Arch Intern Med. 2003;163(17):2014–2018.
- , , , et al. Role of pharmacist counseling in preventing adverse drug events after hospitalization. Arch Intern Med. 2006;166(5):565–571.
- , , , . Promoting effective transitions of care at hospital discharge: a review of key issues for hospitalists. J Hosp Med. 2007;2(5):314–323.
- , . Medication reconciliation in the hospital. Healthc Q. 2012;15:42–49.
- , , , , , . Comprehensive discharge planning for the hospitalized elderly: a randomized clinical trial. Ann Intern Med. 1994;120(12):999–1006.
- , , , et al. Closing the loop: physician communication with diabetic patients who have low health literacy. Arch Intern Med. 2003;163(1):83–90.
- , , . The effects of patient communication skills training on compliance. Arch Fam Med. 2000;9(1):57–64.
- , , , et al. Transition of care for hospitalized elderly patients—development of a discharge checklist for hospitalists. J Hosp Med. 2006;1(6):354–360.
- , , , , . Influence of a “discharge interview” on patient knowledge, compliance, and functional status after hospitalization. Med Care. 1983;21(8):755–767.
- , , , , . Critical pathways intervention to reduce length of hospital stay. Am J Med. 2001;110(3):175–180.
Copyright © 2013 Society of Hospital Medicine

New State Law Advances Malpractice Liability Reform
A new Oregon state law that creates a process to keep frivolous medical malpractice lawsuits out of the courts is a step in the right direction, says one hospitalist.
But uncertainty remains.
Jay Ham, MD, a hospitalist at Providence Newberg Medical Center in Newberg, Ore., says many hospitalists are still learning the ins and outs of the new law, which includes a definition for adverse healthcare incidents and establishes a procedure for providers and patients to discuss those incidents outside of court. The new law also provides for a mediation process.
The lawsuit mediation bill, signed into law earlier this month by Gov. John Kitzhaber, makes discussions between health care providers and patients "confidential and inadmissible with exception." The law does not preclude patients from later filing negligence claims.
"Allowing apologies and admission of guilt in this to be inadmissible at any later civil proceedings seems a nice touch," says Dr. Ham. "Deducting any awards given in the mediation process from civil court damages, while preventing knowledge of the initial award amount, also seems fair."
But there are areas of concern, he says. While most proceedings under the process "appear protected from disclosure if a civil case does go forward," there are caveats that might discourage some physicians from using the process, such as using discussions during the private process that contradict statements made in a court case. Also, there are questions about what types of cases will qualify for discussion outside the court system.
Still, the new law brings medical malpractice liability reform a bit closer, even if it doesn't reduce liability costs, Dr. Ham says. "Changing the cost of medicine doesn't need to be the defining impetus to implement reasonable [liability] reform," Dr. Ham says.
Read SHM's position statement on medical liability reform or visit our website for more information on medical malpractice liability.
In the Literature: Research You Need to Know
Clinical question: Does the use of steroids and/or antivirals improve recovery in patients with newly diagnosed Bell's palsy?
Background: The American Academy of Neurology's last recommendation in 2001 stated that steroids were probably effective and antivirals possibly effective. The current review and recommendations looked at additional studies published since 2000.
Study design: Systematic review of MEDLINE and Cochrane Database of Systematic Reviews data published since June 2000.
Setting: Prospective controlled studies from Germany, Sweden, Scotland, Italy, South Korea, Japan, and Bangladesh.
Synopsis: The authors identified nine studies that fulfilled inclusion criteria. Two of these studies examined treatment with steroids alone and were judged to have the lowest risk for bias. Both studies enrolled patients within three days of symptom onset, continued treatment for 10 days, and demonstrated a significant increase in the probability of complete recovery in patients randomized to steroids (NNT 6-8). Two high-quality studies were identified that looked at the addition of antivirals to steroids. Neither study showed a statistically significant benefit.
Of note, the studies did not quantify the risk of harm from steroid use in patients with comorbidities, such as diabetes. Thus, the authors concluded that in some patients, it would be reasonable to consider limiting steroid use.
Bottom line: For patients with new-onset Bell’s palsy, steroids increase the probability of recovery of facial nerve function. Patients offered antivirals should be counseled that a benefit from antivirals has not been established and, if there is a benefit, it is modest at best.
Citation: Gronseth GS, Paduga R. Evidence-based guideline update: steroids and antivirals for Bell palsy: report of the Guideline Development Subcommittee of the American Academy of Neurology. Neurology. 2012;79(22):2209-2213.
Visit our website for more physician reviews of recent HM-relevant literature.
Small study finds miravirsen effective in HCV-1
The microRNA inhibitor miravirsen induced a dose-dependent drop in hepatitis C virus RNA levels, according to a phase IIa clinical trial reported online March 28 in the New England Journal of Medicine.
The treatment reduced HCV RNA to undetectable levels in five patients. And there was no evidence of the virus developing resistance to miravirsen during the 18-week study, said Dr. Harry L. A. Janssen of Erasmus MC University Hospital, Rotterdam, the Netherlands, and his associates (N. Engl. J. Med. 2013 March 28 [doi:10.1056/NEJMoa1209026]).
MicroRNAs are small, endogenous RNA that are thought to regulate a wide variety of biologic processes, including cell growth and differentiation, apoptosis, and modulation of the host response to viral infection. Miravirsen inhibits microRNA-122, which is expressed at high levels in the liver "and is essential to the stability and propagation of HCV RNA," the investigators explained.
In primate studies, miravirsen induced long-lasting HCV suppression, with no evidence of viral mutations conferring resistance to the agent. In phase I human studies, no adverse events were reported in healthy volunteers who took miravirsen.
For the phase IIa study, 36 patients with treatment-naive, genotype 1chronic HCV infection were followed at seven international sites. They were randomly assigned in a double-blind fashion to receive 3-mg, 5-mg, or 7-mg/kg doses of miravirsen, or a matching placebo, injected subcutaneously in five weekly doses over 29 days.
The study patients were allowed to initiate therapy with pegylated interferon and ribavirin after completing the course of miravirsen, at the discretion of the study investigators. Twelve of the 36 patients did so.
At all three dosages, miravirsen induced declines in HCV RNA levels from baseline for the study’s 14 weeks beyond the initial 4-week treatment period.
The reduction was dose dependent: The mean maximum decrease in HCV RNA levels was 1.2 log for patients receiving 3 mg/kg, 2.9 log for those receiving 5 mg/kg, and 3.0 log for those receiving 7 mg/kg. In contrast, patients receiving placebo showed a decline of only 0.4 log.
In five patients, miravirsen decreased HCV RNA to undetectable levels. That suggests that miravirsen eventually might be appropriate as monotherapy in some patients, Dr. Janssen and his colleagues said.
However, four of those five patients showed a rebound in viral levels at the conclusion of the study, which indicates that five weekly injections were not sufficient to induce a sustained virologic response.
"It is not clear whether regimens of miravirsen of longer duration could achieve a sustained virologic response; we are currently testing the effect of a 12-week regimen," the investigators noted.
Overall, HCV RNA levels rebounded after miravirsen was discontinued in nine patients who had not begun receiving interferon plus ribavirin. That included one patient given the 3-mg dose, five patients given the 5-mg dose, and three patients given the 7-mg dose of miravirsen.
The study subjects were assessed for resistance-associated mutations in HCV RNA at week 5 and at the time of viral rebound. No such mutations were found.
"There were no dose-limiting toxic effects or treatment discontinuations because of adverse events" or laboratory abnormalities, Dr. Janssen and his associates said.
No systemic allergic reactions occurred. Five patients given miravirsen and two patients given placebo reported transient, moderately severe adverse events that may not have been related to the study drug. Those included headache, otitis, flulike symptoms, and syncope.
There was one serious adverse event: One patient fell, lost consciousness, and injured a pelvic bone 9 weeks after receiving the last 7-mg dose of miravirsen.
Lab studies showed a sustained reduction in serum alanine aminotransferase, aspartate aminotransferase, and gamma-glutamyl transpeptidase levels with miravirsen. There were no clinically significant changes in hemoglobin levels, total white-cell counts, prothrombin time, or activated partial thromboplastin time.
A "side benefit" of the treatment was a prolonged decrease in serum total cholesterol, which was expected because inhibition of microRNA-122 is known to disrupt cholesterol homeostasis.
The findings indicate that miravirsen should be considered a potential treatment for HCV infection, the study authors said. The injections can be given as infrequently as once a month, which encourages patient compliance. And unlike protease inhibitors, miravirsen "is not a substrate for cytochrome P-450 and is therefore not expected to have significant drug-drug interactions," the researchers said.
They added that antisense therapy "may also be relevant for diseases other than chronic HCV infection," including nonalcoholic fatty liver disease. Cancer, cardiovascular diseases, and autoimmune disorders also may respond to a strategy of inhibiting microRNAs that are associated with those diseases.
Santaris Pharma funded the study. Dr. Janssen and his associates reported ties to numerous industry sources.
The findings by Janssen et al. show that "antagonizing microRNA-122, alone or in conjunction with other antiviral agents already approved or in development, could provide curative therapy for a large proportion of patients infected with all HCV strains without danger of drug resistance," said Dr. Judy Lieberman and Peter Sarnow, Ph.D.
The strategy "could also shorten the treatment time to achieve viral elimination, reduce the rate of relapse, and offer the possibility of interferon-free regimens," they noted.
Further clinical trials are needed to determine whether those possibilities are realized. Trials also are crucial to definitively establish whether inhibition of microRNA-122 in particular is safe in the long term, because microRNA-122 suppresses hepatocellular carcinoma, Dr. Lieberman and Dr. Sarnow noted.
Dr. Judy Lieberman is in the program in cellular and molecular medicine at Boston Children’s Hospital and in the department of pediatrics at Harvard Medical School, Boston. Dr. Sarnow is in the department of microbiology and immunology at Stanford (Calif.) University. Dr. Lieberman reported ties to Alnylam Pharmaceuticals. These remarks were taken from their editorial accompanying Dr. Janssen’s report (N. Engl. J. Med. 2013 March 28 [doi:10.1056/NEJMe1301348]).
The microRNA inhibitor miravirsen induced a dose-dependent drop in hepatitis C virus RNA levels, according to a phase IIa clinical trial reported online March 28 in the New England Journal of Medicine.
The treatment reduced HCV RNA to undetectable levels in five patients. And there was no evidence of the virus developing resistance to miravirsen during the 18-week study, said Dr. Harry L. A. Janssen of Erasmus MC University Hospital, Rotterdam, the Netherlands, and his associates (N. Engl. J. Med. 2013 March 28 [doi:10.1056/NEJMoa1209026]).
MicroRNAs are small, endogenous RNA that are thought to regulate a wide variety of biologic processes, including cell growth and differentiation, apoptosis, and modulation of the host response to viral infection. Miravirsen inhibits microRNA-122, which is expressed at high levels in the liver "and is essential to the stability and propagation of HCV RNA," the investigators explained.
In primate studies, miravirsen induced long-lasting HCV suppression, with no evidence of viral mutations conferring resistance to the agent. In phase I human studies, no adverse events were reported in healthy volunteers who took miravirsen.
For the phase IIa study, 36 patients with treatment-naive, genotype 1chronic HCV infection were followed at seven international sites. They were randomly assigned in a double-blind fashion to receive 3-mg, 5-mg, or 7-mg/kg doses of miravirsen, or a matching placebo, injected subcutaneously in five weekly doses over 29 days.
The study patients were allowed to initiate therapy with pegylated interferon and ribavirin after completing the course of miravirsen, at the discretion of the study investigators. Twelve of the 36 patients did so.
At all three dosages, miravirsen induced declines in HCV RNA levels from baseline for the study’s 14 weeks beyond the initial 4-week treatment period.
The reduction was dose dependent: The mean maximum decrease in HCV RNA levels was 1.2 log for patients receiving 3 mg/kg, 2.9 log for those receiving 5 mg/kg, and 3.0 log for those receiving 7 mg/kg. In contrast, patients receiving placebo showed a decline of only 0.4 log.
In five patients, miravirsen decreased HCV RNA to undetectable levels. That suggests that miravirsen eventually might be appropriate as monotherapy in some patients, Dr. Janssen and his colleagues said.
However, four of those five patients showed a rebound in viral levels at the conclusion of the study, which indicates that five weekly injections were not sufficient to induce a sustained virologic response.
"It is not clear whether regimens of miravirsen of longer duration could achieve a sustained virologic response; we are currently testing the effect of a 12-week regimen," the investigators noted.
Overall, HCV RNA levels rebounded after miravirsen was discontinued in nine patients who had not begun receiving interferon plus ribavirin. That included one patient given the 3-mg dose, five patients given the 5-mg dose, and three patients given the 7-mg dose of miravirsen.
The study subjects were assessed for resistance-associated mutations in HCV RNA at week 5 and at the time of viral rebound. No such mutations were found.
"There were no dose-limiting toxic effects or treatment discontinuations because of adverse events" or laboratory abnormalities, Dr. Janssen and his associates said.
No systemic allergic reactions occurred. Five patients given miravirsen and two patients given placebo reported transient, moderately severe adverse events that may not have been related to the study drug. Those included headache, otitis, flulike symptoms, and syncope.
There was one serious adverse event: One patient fell, lost consciousness, and injured a pelvic bone 9 weeks after receiving the last 7-mg dose of miravirsen.
Lab studies showed a sustained reduction in serum alanine aminotransferase, aspartate aminotransferase, and gamma-glutamyl transpeptidase levels with miravirsen. There were no clinically significant changes in hemoglobin levels, total white-cell counts, prothrombin time, or activated partial thromboplastin time.
A "side benefit" of the treatment was a prolonged decrease in serum total cholesterol, which was expected because inhibition of microRNA-122 is known to disrupt cholesterol homeostasis.
The findings indicate that miravirsen should be considered a potential treatment for HCV infection, the study authors said. The injections can be given as infrequently as once a month, which encourages patient compliance. And unlike protease inhibitors, miravirsen "is not a substrate for cytochrome P-450 and is therefore not expected to have significant drug-drug interactions," the researchers said.
They added that antisense therapy "may also be relevant for diseases other than chronic HCV infection," including nonalcoholic fatty liver disease. Cancer, cardiovascular diseases, and autoimmune disorders also may respond to a strategy of inhibiting microRNAs that are associated with those diseases.
Santaris Pharma funded the study. Dr. Janssen and his associates reported ties to numerous industry sources.
FROM THE NEW ENGLAND JOURNAL OF MEDICINE
Major Finding: Miravirsen cut HCV RNA levels 1.2 log at the 3-mg/kg dose, 2.9 log at the 5-mg/kg dose, and 3.0 log at the 7-mg/kg dose.
Data Source: An18-week international phase IIa clinical trial assessing the safety and activity of miravirsen in 36 patients with treatment-naive chronic HCV infection.
Disclosures: Santaris Pharma funded the study. Dr. Janssen and his associates reported ties to numerous industry sources.
Bariatric surgery advancement spurs guideline update
Weight loss surgery patients should get routine copper supplements along with other vitamins and minerals, according to newly updated bariatric surgery guidelines from the American Association of Clinical Endocrinologists, the Obesity Society, and the American Society for Metabolic and Bariatric Surgery.
The groups call for 2 mg/day to offset the potential for surgery to cause a deficiency. Although routine copper screening isn’t necessary after the procedure, copper levels should be assessed and treated as needed in patients with anemia, neutropenia, myeloneuropathy, and impaired wound healing.
The copper recommendations are new since the guidelines were last published in 2008. Other recommendations – there are 74 in all – have been revised to incorporate new advances in weight loss surgery and an improved evidence base. Changes are pointed out where they’ve been made, and the level of evidence cited for each assertion. Pre- and postoperative bariatric surgery checklists have been added as well, to help avoid errors.
"This is actually a very unique collaboration among the internists represented by the endocrinologists and the obesity people and the surgeons. We actually agreed on all these things. The main intent is to assist with clinical decision making," including selecting patients and procedures and perioperative management, said lead author Dr. Jeffrey Mechanick, president-elect of the American Association of Clinical Endocrinologists and director of metabolic support at the Mt. Sinai School of Medicine in New York.
"We scrutinized every recommendation one by one in the context of the new data. In many cases the recommendations changed," he said in an interview.
Another new recommendation is for patients to be followed by their primary care physicians and screened for cancer prior to surgery, as appropriate for age and risk. Dr. Mechanick and his colleagues have also given more attention to consent, behavioral, and psychiatric issues as well as weight loss surgery in patients with type 2 diabetes.
There’s more information on sleeve gastrectomy, as well. Considered experimental in 2008, it’s now "approved and being done more widely. There are some very nice data about its metabolic effects, independent from just the weight loss effect, effects on glycemic control, and cardiovascular risk. It was very important to devote a fair amount of time" to the procedure, he said.
The guidelines note that "sleeve gastrectomy has demonstrated benefits comparable to other bariatric procedures. ... A national risk-adjusted database positions [it] between the laparoscopic adjustable gastric band and laparoscopic Roux-en-Y gastric bypass in terms of weight loss, co-morbidity resolution, and complications."
"We [also] addressed two issues which were quite controversial, and are still rather unsettled. The first is the use of the lap band for mild obesity. The second is the use of these weight loss procedures specifically for patients with type 2 diabetes for glycemic control. Since 2008, there’ve been a lot more data" about the issues, he said, just as there’ve been more data about the need for copper supplementation.
As in 2008, the guidelines do not recommend bariatric surgery solely for glycemic control. "We still don’t have an absolute indication for ‘diabetes surgery,’ but we do recognize the existence of the salutary effects on glycemic control when these procedures are done for weight loss. It was important for the reader to be exposed to this information," Dr. Mechanick said.
Regarding surgery in the mildly obese, the guidelines note that patients with a body mass index of 30-34.9 kg/m2 with diabetes or metabolic syndrome "may also be offered a bariatric procedure, although current evidence is limited by the number of subjects studied and lack of long-term data demonstrating net benefit."
The guidelines will be published in the March/April 2013 issue of Endocrine Practice and March 2013 issue of Surgery for Obesity and Related Diseases.
Dr. Mechanick disclosed compensation from Abbott Nutrition for lectures and program development.
From preoperative evaluation through bariatric
surgery and onward through long-term postoperative health management, weight
loss surgery and the medical care associated with it is, obligatorily, a
thoroughly interdisciplinary effort. Endocrinologists and internists on the
bariatrics team spearhead lifestyle management, medical weight loss, and
long-term postoperative care and efforts to maintain durable weight loss.
Surgeons, endocrinologists, and internists work together to select patients
appropriate for bariatric surgery, to choose the weight-loss surgery best
suited to each individual patient, and to provide the proper preoperative
evaluation. Surgeons perform the appropriate bariatric operation and oversee
immediate postoperative and short-term perioperative care, and, frequently in
concert with gastroenterologists, internists, and endocrinologists, manage
complications that can result from bariatric surgery. Finally, long-term
continuity of medical care and durable maintenance of weight loss is again
directed by the endocrinologist and internist.
Thus, given that the entire bariatric care schema is
such an interdisciplinary effort, clinical practice guidelines for the
management of bariatric surgical patients must also be the product of an
analogous interdisciplinary effort. It is with this aim and in this spirit that
the American Association of Clinical Endocrinologists (AACE), The Obesity
Society (TOS), and American Society for Metabolic and Bariatric Surgery (AAMBS)
published their initial Medical Guidelines for Clinical Practice for the Perioperative
Nutritional, Metabolic, and Nonsurgical Support of the Bariatric Surgery
Patient in 2008. The same cooperating societies have just published their
sequel with numerous substantive additions, changes, and refinements. The
Clinical Practice Guidelines for the Perioperative Nutritional, Metabolic, and
Nonsurgical Support of the Bariatric Surgery Patient – 2013 Update: Cosponsored
by American Association of Clinical Endocrinologists, The Obesity Society, and
American Society for Metabolic & Bariatric Surgery was published jointly in
the March issue of Surgery for Obesity and Related Disease, and in the
March/April issue of Endocrine Practice.
Clearly, much has changed in the bariatric landscape
in the intervening half-decade. Laparoscopic gastric band surgery has declined,
while sleeve gastrectomy has gained traction as a restrictive bariatric
operation with more robust weight loss and glycemic effects. The
increasingly recognized impact of Roux-en-Y gastric bypass surgery not only on
weight loss, but also on glycemic control and other endocrinologic endpoints
has prompted studies to determine if such benefits might also result from
restrictive-only bariatric surgeries such as sleeve gastrectomy, and initial
results appear encouraging. The arrival of more and higher-quality data with
longer-term follow up of a greater variety of endpoints has led to the ability
of these updated guidelines to provide an increasing number of more specific,
data-driven recommendations related to the broader spectrum of bariatric
surgical procedures and anatomies managed by clinicians today. They cover every
aspect of the bariatric surgical patient, from preoperative evaluation through
surgery, to postoperative management, all with more solidly outcomes-based
recommendations from over 400 references, with user-friendly and more
error-proof preoperative and postoperative care checklists, while still
arriving at such expert guidelines through interdisciplinary study and
agreement in this timely update.
John A. Martin, M.D., is associate
professor of medicine and surgery and director of endoscopy, Northwestern
University Feinberg School of Medicine, Chicago.
Weight loss surgery patients should get routine copper supplements along with other vitamins and minerals, according to newly updated bariatric surgery guidelines from the American Association of Clinical Endocrinologists, the Obesity Society, and the American Society for Metabolic and Bariatric Surgery.
The groups call for 2 mg/day to offset the potential for surgery to cause a deficiency. Although routine copper screening isn’t necessary after the procedure, copper levels should be assessed and treated as needed in patients with anemia, neutropenia, myeloneuropathy, and impaired wound healing.
The copper recommendations are new since the guidelines were last published in 2008. Other recommendations – there are 74 in all – have been revised to incorporate new advances in weight loss surgery and an improved evidence base. Changes are pointed out where they’ve been made, and the level of evidence cited for each assertion. Pre- and postoperative bariatric surgery checklists have been added as well, to help avoid errors.
"This is actually a very unique collaboration among the internists represented by the endocrinologists and the obesity people and the surgeons. We actually agreed on all these things. The main intent is to assist with clinical decision making," including selecting patients and procedures and perioperative management, said lead author Dr. Jeffrey Mechanick, president-elect of the American Association of Clinical Endocrinologists and director of metabolic support at the Mt. Sinai School of Medicine in New York.
"We scrutinized every recommendation one by one in the context of the new data. In many cases the recommendations changed," he said in an interview.
Another new recommendation is for patients to be followed by their primary care physicians and screened for cancer prior to surgery, as appropriate for age and risk. Dr. Mechanick and his colleagues have also given more attention to consent, behavioral, and psychiatric issues as well as weight loss surgery in patients with type 2 diabetes.
There’s more information on sleeve gastrectomy, as well. Considered experimental in 2008, it’s now "approved and being done more widely. There are some very nice data about its metabolic effects, independent from just the weight loss effect, effects on glycemic control, and cardiovascular risk. It was very important to devote a fair amount of time" to the procedure, he said.
The guidelines note that "sleeve gastrectomy has demonstrated benefits comparable to other bariatric procedures. ... A national risk-adjusted database positions [it] between the laparoscopic adjustable gastric band and laparoscopic Roux-en-Y gastric bypass in terms of weight loss, co-morbidity resolution, and complications."
"We [also] addressed two issues which were quite controversial, and are still rather unsettled. The first is the use of the lap band for mild obesity. The second is the use of these weight loss procedures specifically for patients with type 2 diabetes for glycemic control. Since 2008, there’ve been a lot more data" about the issues, he said, just as there’ve been more data about the need for copper supplementation.
As in 2008, the guidelines do not recommend bariatric surgery solely for glycemic control. "We still don’t have an absolute indication for ‘diabetes surgery,’ but we do recognize the existence of the salutary effects on glycemic control when these procedures are done for weight loss. It was important for the reader to be exposed to this information," Dr. Mechanick said.
Regarding surgery in the mildly obese, the guidelines note that patients with a body mass index of 30-34.9 kg/m2 with diabetes or metabolic syndrome "may also be offered a bariatric procedure, although current evidence is limited by the number of subjects studied and lack of long-term data demonstrating net benefit."
The guidelines will be published in the March/April 2013 issue of Endocrine Practice and March 2013 issue of Surgery for Obesity and Related Diseases.
Dr. Mechanick disclosed compensation from Abbott Nutrition for lectures and program development.
Veith's Viewpoint: Good doctor, good medical care: priceless
Today all we hear about is the high cost of U.S. health care, and how for our country to survive economically, it must cut doctors’ payments and spend less for health care, drugs, and medical devices. Certainly there is waste in the system and some physicians perform procedures that are unnecessary. But when one really needs good medical care and a good doctor, they are priceless.

Two recent dramatic examples in my own family made this clear to me. In one, a loved one developed a staphylococcal infection at an epidural injection site. Within 24 hours, she was desperately ill with a temperature of 104º, shaking chills, and excruciating back pain. She was expeditiously admitted to the ICU of an excellent community hospital and started on massive IV antibiotics. She underwent an urgent MRI, which revealed a paravertebral phlegmon. Blood cultures grew Staphyloccus aureus. She was seen repeatedly by her intensive care specialist and her orthopedic surgeon. When she did not improve, her orthopedic surgeon obtained a second MRI 36 hours after the first one. This, unlike the first, revealed an epidural collection, and she promptly underwent a three segment laminectomy to drain the abscess.
Although she required a second drainage procedure and careful adjustment of her IV antibiotics, she survived without any neurologic or cardiac damage. During her complicated and onerous 2½ weeks in the ICU, she was seen 2-3 times a day by both her intensivist and orthopedic surgeon, as well as by a variety of other specialists when they were needed. All made essential contributions to her recovery from this life-threatening illness. The skill and commitment of all these doctors, especially the orthopedic surgeon and the intensivist, made the difference in saving this young life. The care she received was priceless.
The second instance involved the cure of a life-threatening ventricular arrhythmia in a relatively young, productive individual. Although asymptomatic, this individual was having over 40,000 ventricular premature beats with runs of ventricular tachycardia in a 24-hour period. A highly skilled team of super-specialists in cardiac radiofrequency ablation procedures successfully eliminated the focus of these arrhythmias. However, the procedure was difficult and complicated. It took 7 hours and required both left and right heart catheterizations and crossing of the atrial septum and the aortic valve. Despite this, the individual was back at his usual work in 3 days, completely arrhythmia free. He has required no further subsequent treatment.
In both instances, the good care required by these skilled specialists and their colleagues was complicated and demanding but successful. It required enormous expertise and, more importantly, the commitment and dedication of those providing it. Sure, this care was expensive, but it was worth every penny. It was priceless, because the outcomes were life-saving and perfect. These priceless treatments restored two young, productive people to full health.
So in this rush to cut health care costs, let us remember that we in the United States have the best physicians and surgeons, the best hospitals, the best drugs, and medical devices in the world. Let us preserve these assets and not kill the goose that is laying the golden eggs of health care. Let us preserve and reward the priceless individuals and priceless care that can allow many of us in the United States to lead better, more productive lives than we otherwise would.
Dr. Veith is Professor of Surgery at New York University Medical Center and the Cleveland Clinic. He is an associate medical editor for Vascular Specialist.
The ideas and opinions expressed in Vascular Specialist do not necessarily reflect those of the Society or Publisher.
This months "Veith’s Viewpoint" tells two stories of patients whose lives were saved by doctors acting individually and together using the best that American medicine can offer. It brings to mind Theodore Roosevelt’s apt comment that "no one cares how much you know until they know how much you care." Nowhere did questions of work hours, EMRs, ASOs, or the subject of our "health care system" come up. Just doctors committed to patients. Over the last two decades, as the cost of heath care has made our country more insolvent and consumed more of our GDP, our so-called "system" has become increasingly fragmented. And less and less universal. What once bore at least some semblance of a system is now little more than a tattered patchwork composed of unfettered for-profit insurance companies, an under-funded Medicaid, an over-committed Medicare, a Veterans Administration system that is both vitally essential and full of redundancy, city and county hospitals that are bankrupting their communities, a workman’s compensation program that sets workers against employers, and not-for-profit hospitals that are by most important criteria no different than the for-profit ones. And the hospitals have all become "medical centers" while we doctors are "health care providers."
If all of that doesn’t make you grateful for the doctors’ professionalism and humanity that Frank Veith writes about, then I don’t know what will.
Dr. George Andros is the medical editor of Vascular Specialist.
Today all we hear about is the high cost of U.S. health care, and how for our country to survive economically, it must cut doctors’ payments and spend less for health care, drugs, and medical devices. Certainly there is waste in the system and some physicians perform procedures that are unnecessary. But when one really needs good medical care and a good doctor, they are priceless.
Two recent dramatic examples in my own family made this clear to me. In one, a loved one developed a staphylococcal infection at an epidural injection site. Within 24 hours, she was desperately ill with a temperature of 104º, shaking chills, and excruciating back pain. She was expeditiously admitted to the ICU of an excellent community hospital and started on massive IV antibiotics. She underwent an urgent MRI, which revealed a paravertebral phlegmon. Blood cultures grew Staphyloccus aureus. She was seen repeatedly by her intensive care specialist and her orthopedic surgeon. When she did not improve, her orthopedic surgeon obtained a second MRI 36 hours after the first one. This, unlike the first, revealed an epidural collection, and she promptly underwent a three segment laminectomy to drain the abscess.
Although she required a second drainage procedure and careful adjustment of her IV antibiotics, she survived without any neurologic or cardiac damage. During her complicated and onerous 2½ weeks in the ICU, she was seen 2-3 times a day by both her intensivist and orthopedic surgeon, as well as by a variety of other specialists when they were needed. All made essential contributions to her recovery from this life-threatening illness. The skill and commitment of all these doctors, especially the orthopedic surgeon and the intensivist, made the difference in saving this young life. The care she received was priceless.
The second instance involved the cure of a life-threatening ventricular arrhythmia in a relatively young, productive individual. Although asymptomatic, this individual was having over 40,000 ventricular premature beats with runs of ventricular tachycardia in a 24-hour period. A highly skilled team of super-specialists in cardiac radiofrequency ablation procedures successfully eliminated the focus of these arrhythmias. However, the procedure was difficult and complicated. It took 7 hours and required both left and right heart catheterizations and crossing of the atrial septum and the aortic valve. Despite this, the individual was back at his usual work in 3 days, completely arrhythmia free. He has required no further subsequent treatment.
In both instances, the good care required by these skilled specialists and their colleagues was complicated and demanding but successful. It required enormous expertise and, more importantly, the commitment and dedication of those providing it. Sure, this care was expensive, but it was worth every penny. It was priceless, because the outcomes were life-saving and perfect. These priceless treatments restored two young, productive people to full health.
So in this rush to cut health care costs, let us remember that we in the United States have the best physicians and surgeons, the best hospitals, the best drugs, and medical devices in the world. Let us preserve these assets and not kill the goose that is laying the golden eggs of health care. Let us preserve and reward the priceless individuals and priceless care that can allow many of us in the United States to lead better, more productive lives than we otherwise would.
Dr. Veith is Professor of Surgery at New York University Medical Center and the Cleveland Clinic. He is an associate medical editor for Vascular Specialist.
The ideas and opinions expressed in Vascular Specialist do not necessarily reflect those of the Society or Publisher.

New stroke guidelines stress rtPA
Expanded use of clot-busting therapy is strongly endorsed for patients with acute ischemic stroke, while mechanical thrombectomy devices garner only lukewarm support in updated acute ischemic stroke guidelines from the American Heart Association and the American Stroke Association.
The "door-to-needle time" for intravenous administration of recombinant tissue plasminogen activator (rtPA) should be within 60 minutes from hospital arrival, according to a new class I, evidence level A recommendation.
Clinicians are advised to consider a noncontrast brain CT or MRI and a series of blood tests in all patients with suspected ischemic stroke before administering rtPA, but ultimately, the guidelines state that, "The only laboratory result required in all patients before fibrinolytics therapy is initiated is a glucose determination; use of finger-stick measurement devices is acceptable"(Stroke 2013 [doi:10.1161/STR.0b013e318284056a]).
The treatment window for rtPA therapy is also extended from 3 hours to 4.5 hours after stroke onset – as recommended in the AHA/ASA 2009 update on the extended time window for administration of fibrinolytic agents (Stroke 2009;40:2945-8).
"It’s clear that time is brain," lead guideline author Dr. Edward Jauch, director of emergency medicine at the Medical University of South Carolina in Charleston, said in an interview. "We are making a much greater emphasis that patients should be evaluated as quickly as possible and get treated as quickly as possible to give them the maximum opportunity for benefit."
Dr. Jauch acknowledges that the recommendations could reignite the long-standing controversy over the use of rtPA in stroke patients, particularly in light of the Food and Drug Administration’s recent decision not to expand approval of rtPA to include treatment up to 4.5 hours, as the European Medicines Agency has done.
"The FDA makes decisions largely based on American data, and we make guidelines based on all available data," he said, noting that safety data were also obtained from Genentech, maker of the rtPA activase (Alteplase).
Two European trials – the third International Stroke Trial (Lancet 2012;379:2352-63) and a British meta-analysis (Lancet 2012;379:2364-72) – reported last year that rtPA therapy within 6 hours of symptom onset increased the proportion of people who were alive and independent on follow-up.
Dr. Patrick Lyden, director of the stroke program at Cedars-Sinai Medical Center in Los Angeles, said reducing the battery of blood tests prior to rtPA administration is particularly important and pointed out that when the FDA first approved rtPA to treat stroke on the basis of a National Institutes of Health study, it "took the research protocol and turned it into a package insert.
"It’s taken the intervening 16 years for people to do studies and realize that you don’t need to do all the things in the package insert," he said. "So the American Heart Association, for the first time, is endorsing a much more practical, a much more optimal use of tPA for stroke."
The arrival of new classes of anticoagulants has prompted the AHA/ASA to add a new recommendation that the use of intravenous or intra-arterial rtPA in patients taking direct thrombin inhibitors like dabigatran (Pradaxa) or direct factor Xa inhibitors like rivaroxaban (Xarelto) "may be harmful" and is not recommended unless specialized testing is normal, or the patient has been off the drug for more than 2 days.
"I think that’s overreaching; I don’t think the data support that," said Dr. Lyden, who was not a member of the guidelines writing committee. He added that his team has had "no safety issues whatsoever" when administering the anticoagulant argatroban in patients on rtPA.
Dr. Jauch counters that data are lacking to support the safety of rtPA in patients on the new anticoagulants. Common blood tests – such as the international normalized ratio used for warfarin – do not register the anticoagulant effects of these drugs and reversal strategies are not yet known.
"As a community, we have a ways to go to figure out the optimal way to manage stroke in patients who come in on these drugs," he said.
When mechanical thrombectomy is pursued, stent retrievers are generally preferred to coil retrievers. The guidelines acknowledge that the Merci embolus retrieval system, Penumbra System, Solitaire FR, and TREVO thrombectomy devices "can be useful" in achieving recanalization alone or in combination with fibrinolytics in carefully selected patients, but that "their ability to improve patient outcomes has not been established" and continued study in randomized trials is warranted.
While these devices can restore blood flow very quickly, part of the problem in evaluating them is that the time from when the patient develops their stroke to when they get to the catheterization lab continues to increase, Dr. Jauch said.
"One of the challenges we have is, yes, we have a great device and if you happen to have your stroke on the cath table, you’re in great luck," he said.
"But if you transfer multiple times or there’s a delay in getting the patient evaluated sufficiently, then it diminishes the chance of getting a good outcome."
If feasible, patients should be transported to the closest available certified primary care stroke center or comprehensive stroke center, which in some cases may involve air transport or hospital bypass.
An estimated 40% of Americans, however, live in remote or rural areas without direct access to a comprehensive stroke center. For these patients, the updated guidelines emphasize the use of telemedicine to extend expert stroke care and optimize the use of intravenous rtPA, said guideline coauthor Dr. Bart M. Demaerschalk, professor of neurology at Mayo Clinic in Phoenix, which serves as a hub for 12 hospitals across Arizona with limited or no neurologic support.
"Even if air transport is available, the patients generally arrive when the respective treatment window is already closed," he said. "So telemedicine often means the difference between no treatment whatsoever, which is the usual case, and treatment."
The guidelines recommend tele-radiology systems approved by the FDA or "an equivalent organization" for sites without in-house imaging expertise for prompt review of brain CT and MRI scans in patients with suspected acute stroke.
Many guidelines committee members had financial ties with drug manufacturers and device makers.
Carotid endarterectomy is the most commonly performed open arterial procedure in the US and the most effective treatment available for appropriate stroke/TIA patients. It is accepted, however, that extracranial arterial disease accounts for less than half of all stroke/TIA patients. Three stories in this month's issue dealing with stroke and TIA and their accompanying comments by our editors underscore the need for all treating doctors, including vascular surgeons, to be alert for nonextracranial causes of neuro-ischemic events, both acute and chronic. Likewise, a proper work-up should not overlook evaluation of the cervical extracranial arteries which could deny the effectiveness of CEA to those who stand to benefit from it.
Dr. George Andros is Medical Editor of Vascular Specialist.
Expanded use of clot-busting therapy is strongly endorsed for patients with acute ischemic stroke, while mechanical thrombectomy devices garner only lukewarm support in updated acute ischemic stroke guidelines from the American Heart Association and the American Stroke Association.
The "door-to-needle time" for intravenous administration of recombinant tissue plasminogen activator (rtPA) should be within 60 minutes from hospital arrival, according to a new class I, evidence level A recommendation.
Clinicians are advised to consider a noncontrast brain CT or MRI and a series of blood tests in all patients with suspected ischemic stroke before administering rtPA, but ultimately, the guidelines state that, "The only laboratory result required in all patients before fibrinolytics therapy is initiated is a glucose determination; use of finger-stick measurement devices is acceptable"(Stroke 2013 [doi:10.1161/STR.0b013e318284056a]).
The treatment window for rtPA therapy is also extended from 3 hours to 4.5 hours after stroke onset – as recommended in the AHA/ASA 2009 update on the extended time window for administration of fibrinolytic agents (Stroke 2009;40:2945-8).
"It’s clear that time is brain," lead guideline author Dr. Edward Jauch, director of emergency medicine at the Medical University of South Carolina in Charleston, said in an interview. "We are making a much greater emphasis that patients should be evaluated as quickly as possible and get treated as quickly as possible to give them the maximum opportunity for benefit."
Dr. Jauch acknowledges that the recommendations could reignite the long-standing controversy over the use of rtPA in stroke patients, particularly in light of the Food and Drug Administration’s recent decision not to expand approval of rtPA to include treatment up to 4.5 hours, as the European Medicines Agency has done.
"The FDA makes decisions largely based on American data, and we make guidelines based on all available data," he said, noting that safety data were also obtained from Genentech, maker of the rtPA activase (Alteplase).
Two European trials – the third International Stroke Trial (Lancet 2012;379:2352-63) and a British meta-analysis (Lancet 2012;379:2364-72) – reported last year that rtPA therapy within 6 hours of symptom onset increased the proportion of people who were alive and independent on follow-up.
Dr. Patrick Lyden, director of the stroke program at Cedars-Sinai Medical Center in Los Angeles, said reducing the battery of blood tests prior to rtPA administration is particularly important and pointed out that when the FDA first approved rtPA to treat stroke on the basis of a National Institutes of Health study, it "took the research protocol and turned it into a package insert.
"It’s taken the intervening 16 years for people to do studies and realize that you don’t need to do all the things in the package insert," he said. "So the American Heart Association, for the first time, is endorsing a much more practical, a much more optimal use of tPA for stroke."
The arrival of new classes of anticoagulants has prompted the AHA/ASA to add a new recommendation that the use of intravenous or intra-arterial rtPA in patients taking direct thrombin inhibitors like dabigatran (Pradaxa) or direct factor Xa inhibitors like rivaroxaban (Xarelto) "may be harmful" and is not recommended unless specialized testing is normal, or the patient has been off the drug for more than 2 days.
"I think that’s overreaching; I don’t think the data support that," said Dr. Lyden, who was not a member of the guidelines writing committee. He added that his team has had "no safety issues whatsoever" when administering the anticoagulant argatroban in patients on rtPA.
Dr. Jauch counters that data are lacking to support the safety of rtPA in patients on the new anticoagulants. Common blood tests – such as the international normalized ratio used for warfarin – do not register the anticoagulant effects of these drugs and reversal strategies are not yet known.
"As a community, we have a ways to go to figure out the optimal way to manage stroke in patients who come in on these drugs," he said.
When mechanical thrombectomy is pursued, stent retrievers are generally preferred to coil retrievers. The guidelines acknowledge that the Merci embolus retrieval system, Penumbra System, Solitaire FR, and TREVO thrombectomy devices "can be useful" in achieving recanalization alone or in combination with fibrinolytics in carefully selected patients, but that "their ability to improve patient outcomes has not been established" and continued study in randomized trials is warranted.
While these devices can restore blood flow very quickly, part of the problem in evaluating them is that the time from when the patient develops their stroke to when they get to the catheterization lab continues to increase, Dr. Jauch said.
"One of the challenges we have is, yes, we have a great device and if you happen to have your stroke on the cath table, you’re in great luck," he said.
"But if you transfer multiple times or there’s a delay in getting the patient evaluated sufficiently, then it diminishes the chance of getting a good outcome."
If feasible, patients should be transported to the closest available certified primary care stroke center or comprehensive stroke center, which in some cases may involve air transport or hospital bypass.
An estimated 40% of Americans, however, live in remote or rural areas without direct access to a comprehensive stroke center. For these patients, the updated guidelines emphasize the use of telemedicine to extend expert stroke care and optimize the use of intravenous rtPA, said guideline coauthor Dr. Bart M. Demaerschalk, professor of neurology at Mayo Clinic in Phoenix, which serves as a hub for 12 hospitals across Arizona with limited or no neurologic support.
"Even if air transport is available, the patients generally arrive when the respective treatment window is already closed," he said. "So telemedicine often means the difference between no treatment whatsoever, which is the usual case, and treatment."
The guidelines recommend tele-radiology systems approved by the FDA or "an equivalent organization" for sites without in-house imaging expertise for prompt review of brain CT and MRI scans in patients with suspected acute stroke.
Many guidelines committee members had financial ties with drug manufacturers and device makers.