User login
Dr. Peter Pronovost to Speak to Hospitalists About Healthcare Quality at HM15
Type the name Peter Pronovost into Google and try to make it past the “n” before the word “checklist” pops up. That’s because Peter Pronovost, MD, PhD, FCCM, senior vice president for patient safety and quality at Johns Hopkins Medicine in Baltimore, is the “checklist doctor,” widely known for a five-step checklist designed to reduce the incidence of central-line infections and credited by SHM with saving thousands of lives. He was named one of the 100 Most Influential People in the World by Time magazine, and he co-authored a book, “Safe Patients, Smart Hospitals: How One Doctor’s Checklist Can Help Us Change Health Care from the Inside Out.”
Dr. Pronovost is one of three keynote speakers slated to offer their wisdom and insights to thousands of hospitalists attending HM15, scheduled for March 29-April 1 at the Gaylord National Resort and Convention Center in National Harbor, Md.
And before you ask—yes, he smiles when people call him the “checklist guy.”
“These catheter infections, just to give you an example, they used to kill as many people as breast or prostate cancer in the U.S. This isn’t some trivial public health problem,” Dr. Pronovost says. “This is a public health problem the size of breast or prostate cancer. And we virtually eliminated it, [which is] pretty remarkable about what the potential of this approach is in healthcare. That is just one harm. We have a lot of other things to go still.”
Dr. Pronovost, director of the Armstrong Institute for Patient Safety and Quality at Johns Hopkins, has titled his HM15 talk, “Taking Quality to the Next Level.” One of his main beliefs is that intrinsically motivated efforts are much more successful than payment carrots or sticks wielded by the Centers for Medicare and Medicaid Services (CMS).

—Dr. Pronovost
“We tap into this incredibly rich and passionate juice of improvement work,” he says of intrinsic motivation. “Whether it’s through a church or through a club, all of us have felt that when you connect to a community, the energy and the passion that that unleashes. Hospitalists have the wisdom to know what to do and how to do it right, and it’s just so much more effective when you tap into intrinsic motivation.”
His famed checklist was a great start to that, but he says more needs to be done. That work looked at eliminating a single hospital-acquired condition. Now, Dr. Pronovost has reframed the question: Can we eliminate all harms? What if hospitals listed out all harms and then gave each a checklist?
“It quickly gets to well beyond the potential of human memory, because there are about 150 things we have to do,” he says. “So I’m going to be showcasing a new app that we made that gives you real-time compliance with all those checklists. If I’m missing any one of those 150 things, there’s a red box next to the patient’s name, and all I have to go do is click on the red box and see what I’m missing.”
Dr. Pronovost sees that approach as a fundamental shift in how safety is viewed. It can’t be based on “heroism,” when someone remembers to remember something; rather, it needs to be rooted in properly designed systems that leverage technology to achieve desired results.
To look at it another way, consider a conversation Dr. Pronovost had with friends in engineering who previously worked on missions launching satellites into space.
“They said to me, ‘Peter, you guys are thinking about this backwards in healthcare. If we had to put a mission up…it can blow up for 12 reasons. It didn’t blow up for reason No. 1—call it a bloodstream infection—but it did blow up for reasons 2 through 12, do you think we’d be patting ourselves on the back [because] that No. 1 reason didn’t get us?”
In that vein, Dr. Pronovost believes that hospitalists can be a lynchpin in what he calls “change leadership.”
“Hospitalists have an essential role in improving the quality and safety of care for hospitalized patients and for transitions,” he says. “I would say that between quality and safety, and the patient experience as a core competency of a hospitalist role, healthcare organizations need to actively engage them, including providing support for their time to lead these efforts.”
Richard Quinn is a freelance writer in New Jersey.
Type the name Peter Pronovost into Google and try to make it past the “n” before the word “checklist” pops up. That’s because Peter Pronovost, MD, PhD, FCCM, senior vice president for patient safety and quality at Johns Hopkins Medicine in Baltimore, is the “checklist doctor,” widely known for a five-step checklist designed to reduce the incidence of central-line infections and credited by SHM with saving thousands of lives. He was named one of the 100 Most Influential People in the World by Time magazine, and he co-authored a book, “Safe Patients, Smart Hospitals: How One Doctor’s Checklist Can Help Us Change Health Care from the Inside Out.”
Dr. Pronovost is one of three keynote speakers slated to offer their wisdom and insights to thousands of hospitalists attending HM15, scheduled for March 29-April 1 at the Gaylord National Resort and Convention Center in National Harbor, Md.
And before you ask—yes, he smiles when people call him the “checklist guy.”
“These catheter infections, just to give you an example, they used to kill as many people as breast or prostate cancer in the U.S. This isn’t some trivial public health problem,” Dr. Pronovost says. “This is a public health problem the size of breast or prostate cancer. And we virtually eliminated it, [which is] pretty remarkable about what the potential of this approach is in healthcare. That is just one harm. We have a lot of other things to go still.”
Dr. Pronovost, director of the Armstrong Institute for Patient Safety and Quality at Johns Hopkins, has titled his HM15 talk, “Taking Quality to the Next Level.” One of his main beliefs is that intrinsically motivated efforts are much more successful than payment carrots or sticks wielded by the Centers for Medicare and Medicaid Services (CMS).
—Dr. Pronovost
“We tap into this incredibly rich and passionate juice of improvement work,” he says of intrinsic motivation. “Whether it’s through a church or through a club, all of us have felt that when you connect to a community, the energy and the passion that that unleashes. Hospitalists have the wisdom to know what to do and how to do it right, and it’s just so much more effective when you tap into intrinsic motivation.”
His famed checklist was a great start to that, but he says more needs to be done. That work looked at eliminating a single hospital-acquired condition. Now, Dr. Pronovost has reframed the question: Can we eliminate all harms? What if hospitals listed out all harms and then gave each a checklist?
“It quickly gets to well beyond the potential of human memory, because there are about 150 things we have to do,” he says. “So I’m going to be showcasing a new app that we made that gives you real-time compliance with all those checklists. If I’m missing any one of those 150 things, there’s a red box next to the patient’s name, and all I have to go do is click on the red box and see what I’m missing.”
Dr. Pronovost sees that approach as a fundamental shift in how safety is viewed. It can’t be based on “heroism,” when someone remembers to remember something; rather, it needs to be rooted in properly designed systems that leverage technology to achieve desired results.
To look at it another way, consider a conversation Dr. Pronovost had with friends in engineering who previously worked on missions launching satellites into space.
“They said to me, ‘Peter, you guys are thinking about this backwards in healthcare. If we had to put a mission up…it can blow up for 12 reasons. It didn’t blow up for reason No. 1—call it a bloodstream infection—but it did blow up for reasons 2 through 12, do you think we’d be patting ourselves on the back [because] that No. 1 reason didn’t get us?”
In that vein, Dr. Pronovost believes that hospitalists can be a lynchpin in what he calls “change leadership.”
“Hospitalists have an essential role in improving the quality and safety of care for hospitalized patients and for transitions,” he says. “I would say that between quality and safety, and the patient experience as a core competency of a hospitalist role, healthcare organizations need to actively engage them, including providing support for their time to lead these efforts.”
Richard Quinn is a freelance writer in New Jersey.
Type the name Peter Pronovost into Google and try to make it past the “n” before the word “checklist” pops up. That’s because Peter Pronovost, MD, PhD, FCCM, senior vice president for patient safety and quality at Johns Hopkins Medicine in Baltimore, is the “checklist doctor,” widely known for a five-step checklist designed to reduce the incidence of central-line infections and credited by SHM with saving thousands of lives. He was named one of the 100 Most Influential People in the World by Time magazine, and he co-authored a book, “Safe Patients, Smart Hospitals: How One Doctor’s Checklist Can Help Us Change Health Care from the Inside Out.”
Dr. Pronovost is one of three keynote speakers slated to offer their wisdom and insights to thousands of hospitalists attending HM15, scheduled for March 29-April 1 at the Gaylord National Resort and Convention Center in National Harbor, Md.
And before you ask—yes, he smiles when people call him the “checklist guy.”
“These catheter infections, just to give you an example, they used to kill as many people as breast or prostate cancer in the U.S. This isn’t some trivial public health problem,” Dr. Pronovost says. “This is a public health problem the size of breast or prostate cancer. And we virtually eliminated it, [which is] pretty remarkable about what the potential of this approach is in healthcare. That is just one harm. We have a lot of other things to go still.”
Dr. Pronovost, director of the Armstrong Institute for Patient Safety and Quality at Johns Hopkins, has titled his HM15 talk, “Taking Quality to the Next Level.” One of his main beliefs is that intrinsically motivated efforts are much more successful than payment carrots or sticks wielded by the Centers for Medicare and Medicaid Services (CMS).
—Dr. Pronovost
“We tap into this incredibly rich and passionate juice of improvement work,” he says of intrinsic motivation. “Whether it’s through a church or through a club, all of us have felt that when you connect to a community, the energy and the passion that that unleashes. Hospitalists have the wisdom to know what to do and how to do it right, and it’s just so much more effective when you tap into intrinsic motivation.”
His famed checklist was a great start to that, but he says more needs to be done. That work looked at eliminating a single hospital-acquired condition. Now, Dr. Pronovost has reframed the question: Can we eliminate all harms? What if hospitals listed out all harms and then gave each a checklist?
“It quickly gets to well beyond the potential of human memory, because there are about 150 things we have to do,” he says. “So I’m going to be showcasing a new app that we made that gives you real-time compliance with all those checklists. If I’m missing any one of those 150 things, there’s a red box next to the patient’s name, and all I have to go do is click on the red box and see what I’m missing.”
Dr. Pronovost sees that approach as a fundamental shift in how safety is viewed. It can’t be based on “heroism,” when someone remembers to remember something; rather, it needs to be rooted in properly designed systems that leverage technology to achieve desired results.
To look at it another way, consider a conversation Dr. Pronovost had with friends in engineering who previously worked on missions launching satellites into space.
“They said to me, ‘Peter, you guys are thinking about this backwards in healthcare. If we had to put a mission up…it can blow up for 12 reasons. It didn’t blow up for reason No. 1—call it a bloodstream infection—but it did blow up for reasons 2 through 12, do you think we’d be patting ourselves on the back [because] that No. 1 reason didn’t get us?”
In that vein, Dr. Pronovost believes that hospitalists can be a lynchpin in what he calls “change leadership.”
“Hospitalists have an essential role in improving the quality and safety of care for hospitalized patients and for transitions,” he says. “I would say that between quality and safety, and the patient experience as a core competency of a hospitalist role, healthcare organizations need to actively engage them, including providing support for their time to lead these efforts.”
Richard Quinn is a freelance writer in New Jersey.
Tips for Hospitalists Managing Care of High-Profile Patients
Hospitalists around the globe have cared for their share of high profile patients, also known as very important people, or VIPs. Many of us dread the prospect of admitting a VIP to our service, knowing that such patients tend to be demanding and entitled and often want to dictate their care.
The term “VIP syndrome” was coined as early as 1964 by psychiatrist Walter Weintraub, who described how “the treatment of an influential man can be extremely hazardous for both patient and doctor.”1 He found, even back then, that the admission of VIPs to an inpatient setting was “often followed by considerable turmoil within the institution,” which can unfortunately undermine the quality of the care that the patient receives.
Some high profile—and controversial—deaths that have at least partially been attributable to VIP syndrome were those of Michael Jackson and Joan Rivers. In both cases, physicians veered from normal or usual standards to meet the apparent needs of their high profile patients. The Jackson case represented a violation of care standards: Dr. Conrad Murray administered propofol, midazolam, and lorazepam simultaneously without monitoring his patient, and this treatment resulted in cardiac arrest. The death was considered a homicide, and the physician was convicted of involuntary manslaughter and sentenced to two years in prison. In the Rivers case, the entertainer’s private ENT physician was involved in her care at a site in which he was not privileged to practice; it is unclear if the clinic was equipped to handle the complexity of her case, and she died after her airway was lost. Countless other examples of VIP quality care concerns signifying alterations in care standards based on the patient’s social status have resulted in less dramatically poor outcomes.
Some hospitals have carved out wings or floors to cater to VIP crowds. In these cases, the room and board charges are extraordinary and are billed directly “out of pocket” to the patient, bypassing insurance companies or payers. These wards or units are often staffed “ad hoc” by nurses and other care providers at very low staff-to-patient ratios, so that they can be at the beck and call of the VIP. Some of these admitted patients even bring along their private physicians and nurses, practitioners who are not privileged to practice on site but who may try to dictate the care being delivered.
The real issue, when VIP syndrome is in full swing, is that it violates many codes of medical professionalism, including those found in the Physician Charter of the ABIM Foundation, which emphasizes the guiding principles of patient welfare, autonomy, and social justice.2 Because there exists a whole cadre of patients who qualify as “VIPs” (celebrities, politicians, royalty, local board members, community leaders, and fellow physicians or healthcare administrators), it is extremely likely that each of us will be called upon to care for such a population at some point. As such, we need to have a plan for how we will manage the emotions and care of such patients, without violating any care or professionalism standards.
Roller Coaster of Emotions
My hospital recently had a VIP in for a protracted and complex illness. The patient and family became so demanding and time-consuming that we considered “rotating” them to various other units to give the physicians and staff a break. The typical emotions affiliated with such VIP cases are resentment and frustration, even hostility at times, especially when we recognize the fact that the care we are delivering is not better than average, and may actually be worse. The resentment stems from the fact that we all like to think we deliver the best care possible to all patients, regardless of their personal characteristics, because we all want and deserve the best care, regardless of our bank accounts or public popularity.
So, while none of us can or should avoid taking care of a VIP patient or family, we do have to be thoughtful—in advance—about how we will approach their care. An article from the Cleveland Clinic offers advice to clinicians taking care of these VIPs, in the form of nine guiding principles:3
- Don’t bend the rules: Although VIPs can exert immense pressure to change our practices and procedures to meet their needs, we should resist any temptation to bend to their wishes. Often, practices and procedures are in place for operational or safety reasons, and veering from them can put both practitioners and patients in harm’s way. Practitioners should be explicit in their conversations with VIP patients, explaining that they will be treated within the boundaries of all the usual operational and safety safeguards that are built into the system, for their own good.
- Work as a team: It must be made very clear to the VIP that the attending is in charge of all medical decision-making, and all other providers will be consultants in their care.
- Communicate: Structured, regular, and predictable communication is a must for the patient, family, and all other providers involved in the VIP’s care. While this can seem very time-consuming, it will save time in the end if the patient, providers, and community understand how and when communication will occur. Predictable communication can also set boundaries on how and when it is appropriate for the patient’s family to contact the attending (e.g. cell phone, text, pager, and so on).
- Carefully manage communication with media: Just as with any patient, a VIP’s confidentiality is paramount. Any media coverage should be carefully planned with the hospital’s public relations department, and the only information that should be shared is that which the patient agrees to in advance.
- Resist “chairperson’s syndrome”: This happens when the family insists on being assigned the most senior physician on staff, even when that physician might not be the one best suited for the clinical scenario. VIP care should be as close to “business as usual” as possible, including being staffed by the “best fit” attending and trainees (in teaching hospitals).
- Care should occur where it is most appropriate: This includes care in an “open” ICU, if that is the level of care needed. This conversation should also be undertaken early in the hospital stay, to ensure that the patient and family understand the rationale and need for matching their level of care with the appropriate care setting, while being mindful of privacy and security needs.
- Protect the patient’s security: High profile patients often are heavily pursued by the media, and all measures should be taken to ensure their safety, security, and privacy. These patients should be listed under an alias or as a confidential patient, to reduce the risk of HIPAA breaches by hospital staff or visitors.
- Be careful about accepting or declining gifts: Accepting and declining gifts can both be hazardous; it would be best to avoid accepting any gifts during the hospital stay, but you can offer to accept a reasonable and appropriate gift after the stay has concluded.
- Work with the patient’s personal physicians: In the event the VIP patient has personal physician(s), it is best to invite their input and show them that you value their opinion; however, it must be clear that the attending has ultimate responsibility for the care of the patient during the hospital stay and that all ordering of diagnostics and therapeutics will be done solely by the attending.

References
- Weintraub W. The VIP syndrome: A clinical study in hospital psychiatry. J Nerv Ment Dis. 1964;138(2):181-193.
- ABIM Foundation. Physician charter. Available at: http://www.abimfoundation.org/Professionalism/Physician-Charter.aspx. Accessed January 10, 2015.
- Guzman JA, Sasidhar M, Stoller JK. Caring for VIPs: nine principles. February 2011. Available at: http://www.ccjm.org/fileadmin/content_pdf/ccjm/content_2fd90f2_90.pdf. Accessed January 10, 2015.
Hospitalists around the globe have cared for their share of high profile patients, also known as very important people, or VIPs. Many of us dread the prospect of admitting a VIP to our service, knowing that such patients tend to be demanding and entitled and often want to dictate their care.
The term “VIP syndrome” was coined as early as 1964 by psychiatrist Walter Weintraub, who described how “the treatment of an influential man can be extremely hazardous for both patient and doctor.”1 He found, even back then, that the admission of VIPs to an inpatient setting was “often followed by considerable turmoil within the institution,” which can unfortunately undermine the quality of the care that the patient receives.
Some high profile—and controversial—deaths that have at least partially been attributable to VIP syndrome were those of Michael Jackson and Joan Rivers. In both cases, physicians veered from normal or usual standards to meet the apparent needs of their high profile patients. The Jackson case represented a violation of care standards: Dr. Conrad Murray administered propofol, midazolam, and lorazepam simultaneously without monitoring his patient, and this treatment resulted in cardiac arrest. The death was considered a homicide, and the physician was convicted of involuntary manslaughter and sentenced to two years in prison. In the Rivers case, the entertainer’s private ENT physician was involved in her care at a site in which he was not privileged to practice; it is unclear if the clinic was equipped to handle the complexity of her case, and she died after her airway was lost. Countless other examples of VIP quality care concerns signifying alterations in care standards based on the patient’s social status have resulted in less dramatically poor outcomes.
Some hospitals have carved out wings or floors to cater to VIP crowds. In these cases, the room and board charges are extraordinary and are billed directly “out of pocket” to the patient, bypassing insurance companies or payers. These wards or units are often staffed “ad hoc” by nurses and other care providers at very low staff-to-patient ratios, so that they can be at the beck and call of the VIP. Some of these admitted patients even bring along their private physicians and nurses, practitioners who are not privileged to practice on site but who may try to dictate the care being delivered.
The real issue, when VIP syndrome is in full swing, is that it violates many codes of medical professionalism, including those found in the Physician Charter of the ABIM Foundation, which emphasizes the guiding principles of patient welfare, autonomy, and social justice.2 Because there exists a whole cadre of patients who qualify as “VIPs” (celebrities, politicians, royalty, local board members, community leaders, and fellow physicians or healthcare administrators), it is extremely likely that each of us will be called upon to care for such a population at some point. As such, we need to have a plan for how we will manage the emotions and care of such patients, without violating any care or professionalism standards.
Roller Coaster of Emotions
My hospital recently had a VIP in for a protracted and complex illness. The patient and family became so demanding and time-consuming that we considered “rotating” them to various other units to give the physicians and staff a break. The typical emotions affiliated with such VIP cases are resentment and frustration, even hostility at times, especially when we recognize the fact that the care we are delivering is not better than average, and may actually be worse. The resentment stems from the fact that we all like to think we deliver the best care possible to all patients, regardless of their personal characteristics, because we all want and deserve the best care, regardless of our bank accounts or public popularity.
So, while none of us can or should avoid taking care of a VIP patient or family, we do have to be thoughtful—in advance—about how we will approach their care. An article from the Cleveland Clinic offers advice to clinicians taking care of these VIPs, in the form of nine guiding principles:3
- Don’t bend the rules: Although VIPs can exert immense pressure to change our practices and procedures to meet their needs, we should resist any temptation to bend to their wishes. Often, practices and procedures are in place for operational or safety reasons, and veering from them can put both practitioners and patients in harm’s way. Practitioners should be explicit in their conversations with VIP patients, explaining that they will be treated within the boundaries of all the usual operational and safety safeguards that are built into the system, for their own good.
- Work as a team: It must be made very clear to the VIP that the attending is in charge of all medical decision-making, and all other providers will be consultants in their care.
- Communicate: Structured, regular, and predictable communication is a must for the patient, family, and all other providers involved in the VIP’s care. While this can seem very time-consuming, it will save time in the end if the patient, providers, and community understand how and when communication will occur. Predictable communication can also set boundaries on how and when it is appropriate for the patient’s family to contact the attending (e.g. cell phone, text, pager, and so on).
- Carefully manage communication with media: Just as with any patient, a VIP’s confidentiality is paramount. Any media coverage should be carefully planned with the hospital’s public relations department, and the only information that should be shared is that which the patient agrees to in advance.
- Resist “chairperson’s syndrome”: This happens when the family insists on being assigned the most senior physician on staff, even when that physician might not be the one best suited for the clinical scenario. VIP care should be as close to “business as usual” as possible, including being staffed by the “best fit” attending and trainees (in teaching hospitals).
- Care should occur where it is most appropriate: This includes care in an “open” ICU, if that is the level of care needed. This conversation should also be undertaken early in the hospital stay, to ensure that the patient and family understand the rationale and need for matching their level of care with the appropriate care setting, while being mindful of privacy and security needs.
- Protect the patient’s security: High profile patients often are heavily pursued by the media, and all measures should be taken to ensure their safety, security, and privacy. These patients should be listed under an alias or as a confidential patient, to reduce the risk of HIPAA breaches by hospital staff or visitors.
- Be careful about accepting or declining gifts: Accepting and declining gifts can both be hazardous; it would be best to avoid accepting any gifts during the hospital stay, but you can offer to accept a reasonable and appropriate gift after the stay has concluded.
- Work with the patient’s personal physicians: In the event the VIP patient has personal physician(s), it is best to invite their input and show them that you value their opinion; however, it must be clear that the attending has ultimate responsibility for the care of the patient during the hospital stay and that all ordering of diagnostics and therapeutics will be done solely by the attending.
References
- Weintraub W. The VIP syndrome: A clinical study in hospital psychiatry. J Nerv Ment Dis. 1964;138(2):181-193.
- ABIM Foundation. Physician charter. Available at: http://www.abimfoundation.org/Professionalism/Physician-Charter.aspx. Accessed January 10, 2015.
- Guzman JA, Sasidhar M, Stoller JK. Caring for VIPs: nine principles. February 2011. Available at: http://www.ccjm.org/fileadmin/content_pdf/ccjm/content_2fd90f2_90.pdf. Accessed January 10, 2015.
Hospitalists around the globe have cared for their share of high profile patients, also known as very important people, or VIPs. Many of us dread the prospect of admitting a VIP to our service, knowing that such patients tend to be demanding and entitled and often want to dictate their care.
The term “VIP syndrome” was coined as early as 1964 by psychiatrist Walter Weintraub, who described how “the treatment of an influential man can be extremely hazardous for both patient and doctor.”1 He found, even back then, that the admission of VIPs to an inpatient setting was “often followed by considerable turmoil within the institution,” which can unfortunately undermine the quality of the care that the patient receives.
Some high profile—and controversial—deaths that have at least partially been attributable to VIP syndrome were those of Michael Jackson and Joan Rivers. In both cases, physicians veered from normal or usual standards to meet the apparent needs of their high profile patients. The Jackson case represented a violation of care standards: Dr. Conrad Murray administered propofol, midazolam, and lorazepam simultaneously without monitoring his patient, and this treatment resulted in cardiac arrest. The death was considered a homicide, and the physician was convicted of involuntary manslaughter and sentenced to two years in prison. In the Rivers case, the entertainer’s private ENT physician was involved in her care at a site in which he was not privileged to practice; it is unclear if the clinic was equipped to handle the complexity of her case, and she died after her airway was lost. Countless other examples of VIP quality care concerns signifying alterations in care standards based on the patient’s social status have resulted in less dramatically poor outcomes.
Some hospitals have carved out wings or floors to cater to VIP crowds. In these cases, the room and board charges are extraordinary and are billed directly “out of pocket” to the patient, bypassing insurance companies or payers. These wards or units are often staffed “ad hoc” by nurses and other care providers at very low staff-to-patient ratios, so that they can be at the beck and call of the VIP. Some of these admitted patients even bring along their private physicians and nurses, practitioners who are not privileged to practice on site but who may try to dictate the care being delivered.
The real issue, when VIP syndrome is in full swing, is that it violates many codes of medical professionalism, including those found in the Physician Charter of the ABIM Foundation, which emphasizes the guiding principles of patient welfare, autonomy, and social justice.2 Because there exists a whole cadre of patients who qualify as “VIPs” (celebrities, politicians, royalty, local board members, community leaders, and fellow physicians or healthcare administrators), it is extremely likely that each of us will be called upon to care for such a population at some point. As such, we need to have a plan for how we will manage the emotions and care of such patients, without violating any care or professionalism standards.
Roller Coaster of Emotions
My hospital recently had a VIP in for a protracted and complex illness. The patient and family became so demanding and time-consuming that we considered “rotating” them to various other units to give the physicians and staff a break. The typical emotions affiliated with such VIP cases are resentment and frustration, even hostility at times, especially when we recognize the fact that the care we are delivering is not better than average, and may actually be worse. The resentment stems from the fact that we all like to think we deliver the best care possible to all patients, regardless of their personal characteristics, because we all want and deserve the best care, regardless of our bank accounts or public popularity.
So, while none of us can or should avoid taking care of a VIP patient or family, we do have to be thoughtful—in advance—about how we will approach their care. An article from the Cleveland Clinic offers advice to clinicians taking care of these VIPs, in the form of nine guiding principles:3
- Don’t bend the rules: Although VIPs can exert immense pressure to change our practices and procedures to meet their needs, we should resist any temptation to bend to their wishes. Often, practices and procedures are in place for operational or safety reasons, and veering from them can put both practitioners and patients in harm’s way. Practitioners should be explicit in their conversations with VIP patients, explaining that they will be treated within the boundaries of all the usual operational and safety safeguards that are built into the system, for their own good.
- Work as a team: It must be made very clear to the VIP that the attending is in charge of all medical decision-making, and all other providers will be consultants in their care.
- Communicate: Structured, regular, and predictable communication is a must for the patient, family, and all other providers involved in the VIP’s care. While this can seem very time-consuming, it will save time in the end if the patient, providers, and community understand how and when communication will occur. Predictable communication can also set boundaries on how and when it is appropriate for the patient’s family to contact the attending (e.g. cell phone, text, pager, and so on).
- Carefully manage communication with media: Just as with any patient, a VIP’s confidentiality is paramount. Any media coverage should be carefully planned with the hospital’s public relations department, and the only information that should be shared is that which the patient agrees to in advance.
- Resist “chairperson’s syndrome”: This happens when the family insists on being assigned the most senior physician on staff, even when that physician might not be the one best suited for the clinical scenario. VIP care should be as close to “business as usual” as possible, including being staffed by the “best fit” attending and trainees (in teaching hospitals).
- Care should occur where it is most appropriate: This includes care in an “open” ICU, if that is the level of care needed. This conversation should also be undertaken early in the hospital stay, to ensure that the patient and family understand the rationale and need for matching their level of care with the appropriate care setting, while being mindful of privacy and security needs.
- Protect the patient’s security: High profile patients often are heavily pursued by the media, and all measures should be taken to ensure their safety, security, and privacy. These patients should be listed under an alias or as a confidential patient, to reduce the risk of HIPAA breaches by hospital staff or visitors.
- Be careful about accepting or declining gifts: Accepting and declining gifts can both be hazardous; it would be best to avoid accepting any gifts during the hospital stay, but you can offer to accept a reasonable and appropriate gift after the stay has concluded.
- Work with the patient’s personal physicians: In the event the VIP patient has personal physician(s), it is best to invite their input and show them that you value their opinion; however, it must be clear that the attending has ultimate responsibility for the care of the patient during the hospital stay and that all ordering of diagnostics and therapeutics will be done solely by the attending.
References
- Weintraub W. The VIP syndrome: A clinical study in hospital psychiatry. J Nerv Ment Dis. 1964;138(2):181-193.
- ABIM Foundation. Physician charter. Available at: http://www.abimfoundation.org/Professionalism/Physician-Charter.aspx. Accessed January 10, 2015.
- Guzman JA, Sasidhar M, Stoller JK. Caring for VIPs: nine principles. February 2011. Available at: http://www.ccjm.org/fileadmin/content_pdf/ccjm/content_2fd90f2_90.pdf. Accessed January 10, 2015.
Sightseeing, Activities, Events for Hospitalists, Families Attending HM15
Networking, education, and professional refreshment will keep several thousand hospitalists busy during HM15 workdays next month at the Gaylord National Resort and Conference Center in National Harbor, Md. But what will fill the evenings? And what are families to do while hospitalists attend sessions?
That’s where hospitalist Amit Pahwa, MD, of Johns Hopkins Hospital in Baltimore, can help. He lives in Ellicott City, Md., a bedroom community some 40 miles north of Washington, D.C. Visiting for a day or three at a time is practically a part-time job for him.
First up on his travel itinerary would be the 2015 National Cherry Blossom Festival, which kicks off March 20. In fact, the annual Blossom Kite Festival is set for Saturday, March 28, the day before HM15 pre-courses kick off.
“It’s beautiful,” says Dr. Pahwa, vice president of SHM’s Maryland chapter. “It’s absolutely beautiful. The weather’s getting nicer, everybody’s been inside for a couple of months…it’s really nice.”
While on the National Mall, hospitalists can point at dozens of museums they’d like to visit. Dr. Pahwa’s two young kids often choose for him. Their favorite is the National Museum of Natural History.
“And my son loves the (National) Air and Space Museum,” he says.
For the more adventurous or athletic, he suggests kayaking the Potomac River.
Hospitalists who are a little less adventurous may want to look into Capital Bikeshare, a bike-sharing program that allows visitors to rent a bike at stations around the district and then return them to other stations.
“It’s a cool thing to do to get around the city,” Dr. Pahwa says.
Of course, after all that exercise, even the heartiest hospitalist is bound to be hungry. Dr. Pahwa recommends the following restaurants:
- National Harbor: Rosa Mexicano (guacamole made tableside) and Harrington’s Pub and Kitchen (classic pub grub with a pint of Guinness) are both within walking distance from the convention center.
- Washington: Dukem (1114-1118 U Street NW), an Ethiopian restaurant, is one of his favorites; meats and spices dominate the menu. For Mexican, try Oyamel Cucina Mexicana (401 7th Street NW). Those with a sweeter palate can try Sticky Fingers Sweets & Eats (1370 Park Road NW), a vegan bakery so good Dr. Pahwa almost bought his wedding cake there.
- Old Town Alexandria, Va. Chart House, a national seafood chain whose Old Town location overlooks the Potomac River. “I know it’s a chain, but it’s really good,” he says.
Dr. Pahwa says that hospitalists in Old Town—there’s a water taxi that comes straight from National Harbor—should take the time to walk around. Although national retailers like the Gap have popped up on King Street, the downtown’s main thoroughfare, the area retains its old-time charm.
“There are still a lot of mom and pop areas people can hang out and get some coffee,” he says. “It’s just a nice area to walk around.”
For more visitor information, check out www.washington.org. For information about HM15’s family programs, click here.
Richard Quinn is a freelance writer in New Jersey.
Networking, education, and professional refreshment will keep several thousand hospitalists busy during HM15 workdays next month at the Gaylord National Resort and Conference Center in National Harbor, Md. But what will fill the evenings? And what are families to do while hospitalists attend sessions?
That’s where hospitalist Amit Pahwa, MD, of Johns Hopkins Hospital in Baltimore, can help. He lives in Ellicott City, Md., a bedroom community some 40 miles north of Washington, D.C. Visiting for a day or three at a time is practically a part-time job for him.
First up on his travel itinerary would be the 2015 National Cherry Blossom Festival, which kicks off March 20. In fact, the annual Blossom Kite Festival is set for Saturday, March 28, the day before HM15 pre-courses kick off.
“It’s beautiful,” says Dr. Pahwa, vice president of SHM’s Maryland chapter. “It’s absolutely beautiful. The weather’s getting nicer, everybody’s been inside for a couple of months…it’s really nice.”
While on the National Mall, hospitalists can point at dozens of museums they’d like to visit. Dr. Pahwa’s two young kids often choose for him. Their favorite is the National Museum of Natural History.
“And my son loves the (National) Air and Space Museum,” he says.
For the more adventurous or athletic, he suggests kayaking the Potomac River.
Hospitalists who are a little less adventurous may want to look into Capital Bikeshare, a bike-sharing program that allows visitors to rent a bike at stations around the district and then return them to other stations.
“It’s a cool thing to do to get around the city,” Dr. Pahwa says.
Of course, after all that exercise, even the heartiest hospitalist is bound to be hungry. Dr. Pahwa recommends the following restaurants:
- National Harbor: Rosa Mexicano (guacamole made tableside) and Harrington’s Pub and Kitchen (classic pub grub with a pint of Guinness) are both within walking distance from the convention center.
- Washington: Dukem (1114-1118 U Street NW), an Ethiopian restaurant, is one of his favorites; meats and spices dominate the menu. For Mexican, try Oyamel Cucina Mexicana (401 7th Street NW). Those with a sweeter palate can try Sticky Fingers Sweets & Eats (1370 Park Road NW), a vegan bakery so good Dr. Pahwa almost bought his wedding cake there.
- Old Town Alexandria, Va. Chart House, a national seafood chain whose Old Town location overlooks the Potomac River. “I know it’s a chain, but it’s really good,” he says.
Dr. Pahwa says that hospitalists in Old Town—there’s a water taxi that comes straight from National Harbor—should take the time to walk around. Although national retailers like the Gap have popped up on King Street, the downtown’s main thoroughfare, the area retains its old-time charm.
“There are still a lot of mom and pop areas people can hang out and get some coffee,” he says. “It’s just a nice area to walk around.”
For more visitor information, check out www.washington.org. For information about HM15’s family programs, click here.
Richard Quinn is a freelance writer in New Jersey.
Networking, education, and professional refreshment will keep several thousand hospitalists busy during HM15 workdays next month at the Gaylord National Resort and Conference Center in National Harbor, Md. But what will fill the evenings? And what are families to do while hospitalists attend sessions?
That’s where hospitalist Amit Pahwa, MD, of Johns Hopkins Hospital in Baltimore, can help. He lives in Ellicott City, Md., a bedroom community some 40 miles north of Washington, D.C. Visiting for a day or three at a time is practically a part-time job for him.
First up on his travel itinerary would be the 2015 National Cherry Blossom Festival, which kicks off March 20. In fact, the annual Blossom Kite Festival is set for Saturday, March 28, the day before HM15 pre-courses kick off.
“It’s beautiful,” says Dr. Pahwa, vice president of SHM’s Maryland chapter. “It’s absolutely beautiful. The weather’s getting nicer, everybody’s been inside for a couple of months…it’s really nice.”
While on the National Mall, hospitalists can point at dozens of museums they’d like to visit. Dr. Pahwa’s two young kids often choose for him. Their favorite is the National Museum of Natural History.
“And my son loves the (National) Air and Space Museum,” he says.
For the more adventurous or athletic, he suggests kayaking the Potomac River.
Hospitalists who are a little less adventurous may want to look into Capital Bikeshare, a bike-sharing program that allows visitors to rent a bike at stations around the district and then return them to other stations.
“It’s a cool thing to do to get around the city,” Dr. Pahwa says.
Of course, after all that exercise, even the heartiest hospitalist is bound to be hungry. Dr. Pahwa recommends the following restaurants:
- National Harbor: Rosa Mexicano (guacamole made tableside) and Harrington’s Pub and Kitchen (classic pub grub with a pint of Guinness) are both within walking distance from the convention center.
- Washington: Dukem (1114-1118 U Street NW), an Ethiopian restaurant, is one of his favorites; meats and spices dominate the menu. For Mexican, try Oyamel Cucina Mexicana (401 7th Street NW). Those with a sweeter palate can try Sticky Fingers Sweets & Eats (1370 Park Road NW), a vegan bakery so good Dr. Pahwa almost bought his wedding cake there.
- Old Town Alexandria, Va. Chart House, a national seafood chain whose Old Town location overlooks the Potomac River. “I know it’s a chain, but it’s really good,” he says.
Dr. Pahwa says that hospitalists in Old Town—there’s a water taxi that comes straight from National Harbor—should take the time to walk around. Although national retailers like the Gap have popped up on King Street, the downtown’s main thoroughfare, the area retains its old-time charm.
“There are still a lot of mom and pop areas people can hang out and get some coffee,” he says. “It’s just a nice area to walk around.”
For more visitor information, check out www.washington.org. For information about HM15’s family programs, click here.
Richard Quinn is a freelance writer in New Jersey.
Hospital Medicine Career Perfect Fit for Hands-On Hospitalist Sowmya Kanikkannan

Sowmya Kanikkannan, MD, SFHM, has medicine in her blood. Stories her physician mother told her when she was a child piqued her curiosity. That inquiring mindset led her to volunteer at a hospital, an experience that turned into college studies, which eventually led to a career in hospital medicine.
“It wasn’t until my second year of residency that I started hearing more about hospital medicine,” says Dr. Kanikkannan, one of the newer additions to Team Hospitalist, the volunteer editorial advisory board of The Hospitalist. “By then, I had started to think about what I wanted to do after graduation. The things that I liked about it were the fast pace of hospital work, the higher acuity of medicine that hospitalists practiced, and the collaborative nature of the field.”
The choice is working out just fine.
Last year, Dr. Kanikkannan was named hospitalist medical director for Rowan University School of Osteopathic Medicine in Stratford, N.J. She also is a member of SHM’s national leadership committee and writes for SHM’s blog, “The Hospital Leader”.
Despite her leadership roles, Dr. Kanikkannan believes she must keep direct patient care in her schedule.
“Seeing patients is important to me, since I am a physician at heart,” she says. “As a leader, it is equally important to me to see patients; it keeps me grounded. Being hands on helps me better understand my program and make successful administrative decisions that can be sustained in the long run.”
Question: What do you dislike most about working as a hospitalist?
Answer: There are times when I see frequent fliers get readmitted to the hospital over and over again. Sometimes, this is difficult to deal with and can be frustrating for the hospitalist, because patients either don’t have the resources to take care of themselves when discharged or they don’t take their health seriously enough to make attempts to lead healthier lives. At times like these, I really wish that as hospitalists we could help these patients in some way that is sustainable long-term.
Q: What’s the best advice you ever received?
A: The best advice that I received was from family, and it was to believe in myself and to believe that I can achieve anything that I want to if I put my mind to it and worked hard for it. My high school math teacher also told me that I shouldn’t change because I was so awesome. But then, who wouldn’t like that advice?

Q: What’s the biggest change you’ve seen in hospital medicine in your career?
A: The biggest change would have to be the exponential growth and expansion—not just in the number of hospitalist programs but [also in] the growth of our scope of practice. I have seen the field grow from doctors who practice in the hospital to doctors who are part of the hospital. This is really amazing. I am glad to see that hospitalists are more involved in hospital systems and processes in addition to providing patient care.
Q: What’s the biggest change you would like to see?
A: The biggest change that I would like to see is to solidify hospital medicine as a career and recruit career-hospitalists into our field. As with any new and upcoming field, this is a process that takes some time. I already am starting to see this trend, as residents are entering hospitalist tracks and medical students are beginning to understand the existence of hospital medicine. I’m sure that it’s only a matter of time.
Q: What aspect of patient care is most rewarding?
A: My favorite part is seeing my patients recover quickly. I also enjoy interacting and forming good relationships with my patients and their families, albeit during a short hospital visit. When people are sick, you see them at their most vulnerable. To know that they trust your care during that time is very humbling. Last week, the wife of a patient suddenly hugged me and thanked me for taking care of her husband. It was totally unexpected, but it was also a great feeling that I helped someone get better.
Q: What is your biggest professional challenge?
A: One of my biggest professional challenges is learning how to get diverse and often different groups of medical professionals to come together and collaborate on system changes in the hospital. No matter how many times you do it, each experience is different and presents its own unique challenge.
Q: When you aren’t working, what is important to you?
A: I love spending time with my family and friends. Since I am usually busy during my weeks on service, I catch up with everyone during my weeks off. My husband and I like exploring Philadelphia when we can. We’ve been enjoying the amazing new vegetarian restaurants that have opened in Philly over the last year.
Q: Where do you see yourself in 10 years?
A: I see myself in hospital medicine leadership, since being a leader has given me the opportunity to impact positive change for my hospital, my patients, and the hospitalists in my group.
Q: If you weren’t a doctor, what would you be doing right now?
A: This is a question that I was asked during my medical school interview. I believe that I didn’t have an answer at that time; however, if I really had to pick, I would want to be an artist and a performer in Broadway musicals. I love all forms of dance, especially contemporary dancing, salsa, and bharathnatyam (a classical south Indian dance). I also enjoy singing, although my skills, I’m afraid, have deteriorated due to disuse.
Q: What impact do you feel devices like Apple and Android products have had on your job—and on medicine in a broader sense?
A: I think that the new mobile technology has had a significant and positive impact on healthcare as a whole. The most beneficial is the ease of access to information, both related to patient care and medical resources. The next wave will be the integration of these devices into the actual delivery of patient care.
Richard Quinn is a freelance writer in New Jersey.
Sowmya Kanikkannan, MD, SFHM, has medicine in her blood. Stories her physician mother told her when she was a child piqued her curiosity. That inquiring mindset led her to volunteer at a hospital, an experience that turned into college studies, which eventually led to a career in hospital medicine.
“It wasn’t until my second year of residency that I started hearing more about hospital medicine,” says Dr. Kanikkannan, one of the newer additions to Team Hospitalist, the volunteer editorial advisory board of The Hospitalist. “By then, I had started to think about what I wanted to do after graduation. The things that I liked about it were the fast pace of hospital work, the higher acuity of medicine that hospitalists practiced, and the collaborative nature of the field.”
The choice is working out just fine.
Last year, Dr. Kanikkannan was named hospitalist medical director for Rowan University School of Osteopathic Medicine in Stratford, N.J. She also is a member of SHM’s national leadership committee and writes for SHM’s blog, “The Hospital Leader”.
Despite her leadership roles, Dr. Kanikkannan believes she must keep direct patient care in her schedule.
“Seeing patients is important to me, since I am a physician at heart,” she says. “As a leader, it is equally important to me to see patients; it keeps me grounded. Being hands on helps me better understand my program and make successful administrative decisions that can be sustained in the long run.”
Question: What do you dislike most about working as a hospitalist?
Answer: There are times when I see frequent fliers get readmitted to the hospital over and over again. Sometimes, this is difficult to deal with and can be frustrating for the hospitalist, because patients either don’t have the resources to take care of themselves when discharged or they don’t take their health seriously enough to make attempts to lead healthier lives. At times like these, I really wish that as hospitalists we could help these patients in some way that is sustainable long-term.
Q: What’s the best advice you ever received?
A: The best advice that I received was from family, and it was to believe in myself and to believe that I can achieve anything that I want to if I put my mind to it and worked hard for it. My high school math teacher also told me that I shouldn’t change because I was so awesome. But then, who wouldn’t like that advice?
Q: What’s the biggest change you’ve seen in hospital medicine in your career?
A: The biggest change would have to be the exponential growth and expansion—not just in the number of hospitalist programs but [also in] the growth of our scope of practice. I have seen the field grow from doctors who practice in the hospital to doctors who are part of the hospital. This is really amazing. I am glad to see that hospitalists are more involved in hospital systems and processes in addition to providing patient care.
Q: What’s the biggest change you would like to see?
A: The biggest change that I would like to see is to solidify hospital medicine as a career and recruit career-hospitalists into our field. As with any new and upcoming field, this is a process that takes some time. I already am starting to see this trend, as residents are entering hospitalist tracks and medical students are beginning to understand the existence of hospital medicine. I’m sure that it’s only a matter of time.
Q: What aspect of patient care is most rewarding?
A: My favorite part is seeing my patients recover quickly. I also enjoy interacting and forming good relationships with my patients and their families, albeit during a short hospital visit. When people are sick, you see them at their most vulnerable. To know that they trust your care during that time is very humbling. Last week, the wife of a patient suddenly hugged me and thanked me for taking care of her husband. It was totally unexpected, but it was also a great feeling that I helped someone get better.
Q: What is your biggest professional challenge?
A: One of my biggest professional challenges is learning how to get diverse and often different groups of medical professionals to come together and collaborate on system changes in the hospital. No matter how many times you do it, each experience is different and presents its own unique challenge.
Q: When you aren’t working, what is important to you?
A: I love spending time with my family and friends. Since I am usually busy during my weeks on service, I catch up with everyone during my weeks off. My husband and I like exploring Philadelphia when we can. We’ve been enjoying the amazing new vegetarian restaurants that have opened in Philly over the last year.
Q: Where do you see yourself in 10 years?
A: I see myself in hospital medicine leadership, since being a leader has given me the opportunity to impact positive change for my hospital, my patients, and the hospitalists in my group.
Q: If you weren’t a doctor, what would you be doing right now?
A: This is a question that I was asked during my medical school interview. I believe that I didn’t have an answer at that time; however, if I really had to pick, I would want to be an artist and a performer in Broadway musicals. I love all forms of dance, especially contemporary dancing, salsa, and bharathnatyam (a classical south Indian dance). I also enjoy singing, although my skills, I’m afraid, have deteriorated due to disuse.
Q: What impact do you feel devices like Apple and Android products have had on your job—and on medicine in a broader sense?
A: I think that the new mobile technology has had a significant and positive impact on healthcare as a whole. The most beneficial is the ease of access to information, both related to patient care and medical resources. The next wave will be the integration of these devices into the actual delivery of patient care.
Richard Quinn is a freelance writer in New Jersey.
Sowmya Kanikkannan, MD, SFHM, has medicine in her blood. Stories her physician mother told her when she was a child piqued her curiosity. That inquiring mindset led her to volunteer at a hospital, an experience that turned into college studies, which eventually led to a career in hospital medicine.
“It wasn’t until my second year of residency that I started hearing more about hospital medicine,” says Dr. Kanikkannan, one of the newer additions to Team Hospitalist, the volunteer editorial advisory board of The Hospitalist. “By then, I had started to think about what I wanted to do after graduation. The things that I liked about it were the fast pace of hospital work, the higher acuity of medicine that hospitalists practiced, and the collaborative nature of the field.”
The choice is working out just fine.
Last year, Dr. Kanikkannan was named hospitalist medical director for Rowan University School of Osteopathic Medicine in Stratford, N.J. She also is a member of SHM’s national leadership committee and writes for SHM’s blog, “The Hospital Leader”.
Despite her leadership roles, Dr. Kanikkannan believes she must keep direct patient care in her schedule.
“Seeing patients is important to me, since I am a physician at heart,” she says. “As a leader, it is equally important to me to see patients; it keeps me grounded. Being hands on helps me better understand my program and make successful administrative decisions that can be sustained in the long run.”
Question: What do you dislike most about working as a hospitalist?
Answer: There are times when I see frequent fliers get readmitted to the hospital over and over again. Sometimes, this is difficult to deal with and can be frustrating for the hospitalist, because patients either don’t have the resources to take care of themselves when discharged or they don’t take their health seriously enough to make attempts to lead healthier lives. At times like these, I really wish that as hospitalists we could help these patients in some way that is sustainable long-term.
Q: What’s the best advice you ever received?
A: The best advice that I received was from family, and it was to believe in myself and to believe that I can achieve anything that I want to if I put my mind to it and worked hard for it. My high school math teacher also told me that I shouldn’t change because I was so awesome. But then, who wouldn’t like that advice?
Q: What’s the biggest change you’ve seen in hospital medicine in your career?
A: The biggest change would have to be the exponential growth and expansion—not just in the number of hospitalist programs but [also in] the growth of our scope of practice. I have seen the field grow from doctors who practice in the hospital to doctors who are part of the hospital. This is really amazing. I am glad to see that hospitalists are more involved in hospital systems and processes in addition to providing patient care.
Q: What’s the biggest change you would like to see?
A: The biggest change that I would like to see is to solidify hospital medicine as a career and recruit career-hospitalists into our field. As with any new and upcoming field, this is a process that takes some time. I already am starting to see this trend, as residents are entering hospitalist tracks and medical students are beginning to understand the existence of hospital medicine. I’m sure that it’s only a matter of time.
Q: What aspect of patient care is most rewarding?
A: My favorite part is seeing my patients recover quickly. I also enjoy interacting and forming good relationships with my patients and their families, albeit during a short hospital visit. When people are sick, you see them at their most vulnerable. To know that they trust your care during that time is very humbling. Last week, the wife of a patient suddenly hugged me and thanked me for taking care of her husband. It was totally unexpected, but it was also a great feeling that I helped someone get better.
Q: What is your biggest professional challenge?
A: One of my biggest professional challenges is learning how to get diverse and often different groups of medical professionals to come together and collaborate on system changes in the hospital. No matter how many times you do it, each experience is different and presents its own unique challenge.
Q: When you aren’t working, what is important to you?
A: I love spending time with my family and friends. Since I am usually busy during my weeks on service, I catch up with everyone during my weeks off. My husband and I like exploring Philadelphia when we can. We’ve been enjoying the amazing new vegetarian restaurants that have opened in Philly over the last year.
Q: Where do you see yourself in 10 years?
A: I see myself in hospital medicine leadership, since being a leader has given me the opportunity to impact positive change for my hospital, my patients, and the hospitalists in my group.
Q: If you weren’t a doctor, what would you be doing right now?
A: This is a question that I was asked during my medical school interview. I believe that I didn’t have an answer at that time; however, if I really had to pick, I would want to be an artist and a performer in Broadway musicals. I love all forms of dance, especially contemporary dancing, salsa, and bharathnatyam (a classical south Indian dance). I also enjoy singing, although my skills, I’m afraid, have deteriorated due to disuse.
Q: What impact do you feel devices like Apple and Android products have had on your job—and on medicine in a broader sense?
A: I think that the new mobile technology has had a significant and positive impact on healthcare as a whole. The most beneficial is the ease of access to information, both related to patient care and medical resources. The next wave will be the integration of these devices into the actual delivery of patient care.
Richard Quinn is a freelance writer in New Jersey.

Focused Practice in Hospital Medicine Track Helps Hospitalists Achieve ABIM Recertification
This is the year I complete my second recertification for the American Board of Internal Medicine (ABIM). Prior to 1990, the ABIM issued certificates that were good for life. Beginning in 1990 and through 2013, all certificates were issued for a 10-year duration. All those prior lifetime certificates were honored, so those holding them were deemed “grandfathered” and have not had to recertify. The rest of us are now on the recertification pathway, renewing every 10 years. Although the date has been set at 10 years, the recertification process has become more regimented since January 2014, when the ABIM moved to a continuous program requiring evidence of new learning and maintenance of quality in your practice every two years.
This ratcheting up of requirements and adding increased increments of progress hasn’t come without controversy. Last year a petition was started and signed by 19,000 physicians protesting the changes and arguing the ABIM should go back to the methodology of taking a test every 10 years. Even this was a moderate position; many were clamoring for the abolition of maintenance of certification (MOC) all together.
I represented the Society of Hospital Medicine (SHM) in July 2014 at a summit in Philadelphia called by the ABIM Foundation. Each of the medical subspecialties was given an opportunity to speak to the ABIM leadership and the audience of fellow representatives about the impact of MOC. As members of a relatively youthful field, hospitalists are less focused on how the “grandfathers” are being treated and more concerned about the confusing process and lack of opportunity to incorporate our daily hospitalist-focused work effort easily into the process.
As a result of that petition, many letters written to the board, and the outspoken representatives at the ABIM summit, the ABIM has responded with a plan to make elements of the process more friendly and open, as well as one to further plan and adapt.
Clearly, this is a process in evolution. Hospitalists are committed to lifelong learning. I think we can expect that with more transparency in all aspects of our lives, personal and professional, our patients, our hospitals, and payers…will all be expecting to see just exactly how committed we are to lifelong learning and self-improvement.
It’s our turn…
In 2009, some bold steps were taken with the announcement of the new Focused Practice in Hospital Medicine (FPHM) that, hopefully, will impact hospitalists for many years to come. SHM’s partnership with the ABIM began with work five years prior, creating a focused declaration of hospital medicine competence. Initially, this was set up as a pilot project to be evaluated for success along the way, to see if the concept would become permanent. The work was announced, and the inaugural class of 175 physicians entered the process. Since that time, 555 physicians have earned the FPHM certificate. What’s even more impressive is that we have seen a surge recently in the number of entrants. There are now 3,300 hospitalists enrolled in the pathway.
While this growth is great, we estimate that there are 44,000 hospitalists in the U.S. We know that many are newer hospitalists and not yet up for recertification. Our goal is to get every hospitalist entering the pathway when it is his or her time, just like I’m doing now. It is my time!
As we steadily progress in distinguishing and defining our field, we need as many hospitalists as possible to raise their hands and say that they proudly practice hospital medicine and have taken the steps to learn the special knowledge and gain the special skills needed to succeed in the hospital. The ABIM certification program is still in the pilot phase. One of the key markers of success to determine if it will be continued is the number of participants. I am writing this column as another way to encourage us all to stand up and be counted.
Practical Tips
So, we know things have changed, and we know things will be changing more, but what about now? What do we need to do to navigate the process to gain our FPHM certificate today?
1. Enter the process: You can’t win if you don’t play. Entering FPHM is easier than ever. The requirement for current active ACLS has been removed. Now it is a declaration that you see 1,000 patients a year or that you had 3,000 encounters in the last three years and pay the supplemental fee.
2. Earn 100 “points”: You have five years, with a mix of Part II and Part IV activities at least every two years, and the secure exam. You must have the patient voice and patient safety module credit as part of this every five years block.
2a. Medical Knowledge Self-Assessment (Part II): Show what you know or learn on an ongoing basis. You can do these at home, work, or with a buddy, or, even better, sign up for a group learning session, usually offered as a pre-course at society meetings. HM15 will be offering a pre-course that will offer Part II credit. SHM’s Hospital QI and Patient Safety Medical Knowledge Module is available at www.shmlearningportal.org.
2b. Practice Improvement (Part IV): Show that you are trying to improve your practice. Again, the ABIM website lists many possibilities for improvement activities that count and has a practice improvement module (PIM) selector tool (select “hospital medicine” and “inpatient”). Here are some of my favorite PIMs.
Team PIM. Complete a self-assessment of your team skills, get 10 members of your hospital multidisciplinary team to fill out an evaluation on you, and then review with a trusted colleague. This PIM also satisfies both patient voice and patient safety requirements (10 points).
SHM Project BOOST or SHM’s Glycemic Control Mentored Implementation Program. Do either of these at your hospital to earn 20 points.
Clinical Supervisor PIM. For those of you who work with residents or students. Observe 10 visits by learners, then follow up with a chart look-back, feedback to the learner, and a plan for improving learning (20 points).
3. Take a test! The secure exam is given every 10 years and counts for 20 points. What is great about this FPHM test is that it is focused on all the stuff you do every day in your job. It’s a hospitalist test, not an outpatient clinic doctor test. It focuses on inpatient clinical medicine and palliative care, plus patient safety and quality. You can use the current study materials (MedStudy, MKSAP [Medical Knowledge Self-Assessment Program], and the like); just skip the purely ambulatory material. Focused study materials will be available in the next year. Look for the HM15 exam preparation guide, which will direct you to HM15 sessions that cross over with the ABIM/ABFM [American Board of Family Medicine] Hospital Medicine exam.
If you would like other tools for studying for the consultative co-management and quality and patient safety sections of the exam, check out SHM Learning Portal.
Final Thoughts
It’s complicated, right? But each time I look at it or read one of these articles, it gets a bit simpler. The overall process for internal medicine certification now mirrors this one, with very few differences. Remember, the ABFM process is identical for hospitalists trained in family medicine. Hopefully, this column will help you get off the fence and come down on the side of representing what you do every day at work in the hospital.
Be proud, take the more pertinent path, be a hospitalist! Twenty points.

This is the year I complete my second recertification for the American Board of Internal Medicine (ABIM). Prior to 1990, the ABIM issued certificates that were good for life. Beginning in 1990 and through 2013, all certificates were issued for a 10-year duration. All those prior lifetime certificates were honored, so those holding them were deemed “grandfathered” and have not had to recertify. The rest of us are now on the recertification pathway, renewing every 10 years. Although the date has been set at 10 years, the recertification process has become more regimented since January 2014, when the ABIM moved to a continuous program requiring evidence of new learning and maintenance of quality in your practice every two years.
This ratcheting up of requirements and adding increased increments of progress hasn’t come without controversy. Last year a petition was started and signed by 19,000 physicians protesting the changes and arguing the ABIM should go back to the methodology of taking a test every 10 years. Even this was a moderate position; many were clamoring for the abolition of maintenance of certification (MOC) all together.
I represented the Society of Hospital Medicine (SHM) in July 2014 at a summit in Philadelphia called by the ABIM Foundation. Each of the medical subspecialties was given an opportunity to speak to the ABIM leadership and the audience of fellow representatives about the impact of MOC. As members of a relatively youthful field, hospitalists are less focused on how the “grandfathers” are being treated and more concerned about the confusing process and lack of opportunity to incorporate our daily hospitalist-focused work effort easily into the process.
As a result of that petition, many letters written to the board, and the outspoken representatives at the ABIM summit, the ABIM has responded with a plan to make elements of the process more friendly and open, as well as one to further plan and adapt.
Clearly, this is a process in evolution. Hospitalists are committed to lifelong learning. I think we can expect that with more transparency in all aspects of our lives, personal and professional, our patients, our hospitals, and payers…will all be expecting to see just exactly how committed we are to lifelong learning and self-improvement.
It’s our turn…
In 2009, some bold steps were taken with the announcement of the new Focused Practice in Hospital Medicine (FPHM) that, hopefully, will impact hospitalists for many years to come. SHM’s partnership with the ABIM began with work five years prior, creating a focused declaration of hospital medicine competence. Initially, this was set up as a pilot project to be evaluated for success along the way, to see if the concept would become permanent. The work was announced, and the inaugural class of 175 physicians entered the process. Since that time, 555 physicians have earned the FPHM certificate. What’s even more impressive is that we have seen a surge recently in the number of entrants. There are now 3,300 hospitalists enrolled in the pathway.
While this growth is great, we estimate that there are 44,000 hospitalists in the U.S. We know that many are newer hospitalists and not yet up for recertification. Our goal is to get every hospitalist entering the pathway when it is his or her time, just like I’m doing now. It is my time!
As we steadily progress in distinguishing and defining our field, we need as many hospitalists as possible to raise their hands and say that they proudly practice hospital medicine and have taken the steps to learn the special knowledge and gain the special skills needed to succeed in the hospital. The ABIM certification program is still in the pilot phase. One of the key markers of success to determine if it will be continued is the number of participants. I am writing this column as another way to encourage us all to stand up and be counted.
Practical Tips
So, we know things have changed, and we know things will be changing more, but what about now? What do we need to do to navigate the process to gain our FPHM certificate today?
1. Enter the process: You can’t win if you don’t play. Entering FPHM is easier than ever. The requirement for current active ACLS has been removed. Now it is a declaration that you see 1,000 patients a year or that you had 3,000 encounters in the last three years and pay the supplemental fee.
2. Earn 100 “points”: You have five years, with a mix of Part II and Part IV activities at least every two years, and the secure exam. You must have the patient voice and patient safety module credit as part of this every five years block.
2a. Medical Knowledge Self-Assessment (Part II): Show what you know or learn on an ongoing basis. You can do these at home, work, or with a buddy, or, even better, sign up for a group learning session, usually offered as a pre-course at society meetings. HM15 will be offering a pre-course that will offer Part II credit. SHM’s Hospital QI and Patient Safety Medical Knowledge Module is available at www.shmlearningportal.org.
2b. Practice Improvement (Part IV): Show that you are trying to improve your practice. Again, the ABIM website lists many possibilities for improvement activities that count and has a practice improvement module (PIM) selector tool (select “hospital medicine” and “inpatient”). Here are some of my favorite PIMs.
Team PIM. Complete a self-assessment of your team skills, get 10 members of your hospital multidisciplinary team to fill out an evaluation on you, and then review with a trusted colleague. This PIM also satisfies both patient voice and patient safety requirements (10 points).
SHM Project BOOST or SHM’s Glycemic Control Mentored Implementation Program. Do either of these at your hospital to earn 20 points.
Clinical Supervisor PIM. For those of you who work with residents or students. Observe 10 visits by learners, then follow up with a chart look-back, feedback to the learner, and a plan for improving learning (20 points).
3. Take a test! The secure exam is given every 10 years and counts for 20 points. What is great about this FPHM test is that it is focused on all the stuff you do every day in your job. It’s a hospitalist test, not an outpatient clinic doctor test. It focuses on inpatient clinical medicine and palliative care, plus patient safety and quality. You can use the current study materials (MedStudy, MKSAP [Medical Knowledge Self-Assessment Program], and the like); just skip the purely ambulatory material. Focused study materials will be available in the next year. Look for the HM15 exam preparation guide, which will direct you to HM15 sessions that cross over with the ABIM/ABFM [American Board of Family Medicine] Hospital Medicine exam.
If you would like other tools for studying for the consultative co-management and quality and patient safety sections of the exam, check out SHM Learning Portal.
Final Thoughts
It’s complicated, right? But each time I look at it or read one of these articles, it gets a bit simpler. The overall process for internal medicine certification now mirrors this one, with very few differences. Remember, the ABFM process is identical for hospitalists trained in family medicine. Hopefully, this column will help you get off the fence and come down on the side of representing what you do every day at work in the hospital.
Be proud, take the more pertinent path, be a hospitalist! Twenty points.
This is the year I complete my second recertification for the American Board of Internal Medicine (ABIM). Prior to 1990, the ABIM issued certificates that were good for life. Beginning in 1990 and through 2013, all certificates were issued for a 10-year duration. All those prior lifetime certificates were honored, so those holding them were deemed “grandfathered” and have not had to recertify. The rest of us are now on the recertification pathway, renewing every 10 years. Although the date has been set at 10 years, the recertification process has become more regimented since January 2014, when the ABIM moved to a continuous program requiring evidence of new learning and maintenance of quality in your practice every two years.
This ratcheting up of requirements and adding increased increments of progress hasn’t come without controversy. Last year a petition was started and signed by 19,000 physicians protesting the changes and arguing the ABIM should go back to the methodology of taking a test every 10 years. Even this was a moderate position; many were clamoring for the abolition of maintenance of certification (MOC) all together.
I represented the Society of Hospital Medicine (SHM) in July 2014 at a summit in Philadelphia called by the ABIM Foundation. Each of the medical subspecialties was given an opportunity to speak to the ABIM leadership and the audience of fellow representatives about the impact of MOC. As members of a relatively youthful field, hospitalists are less focused on how the “grandfathers” are being treated and more concerned about the confusing process and lack of opportunity to incorporate our daily hospitalist-focused work effort easily into the process.
As a result of that petition, many letters written to the board, and the outspoken representatives at the ABIM summit, the ABIM has responded with a plan to make elements of the process more friendly and open, as well as one to further plan and adapt.
Clearly, this is a process in evolution. Hospitalists are committed to lifelong learning. I think we can expect that with more transparency in all aspects of our lives, personal and professional, our patients, our hospitals, and payers…will all be expecting to see just exactly how committed we are to lifelong learning and self-improvement.
It’s our turn…
In 2009, some bold steps were taken with the announcement of the new Focused Practice in Hospital Medicine (FPHM) that, hopefully, will impact hospitalists for many years to come. SHM’s partnership with the ABIM began with work five years prior, creating a focused declaration of hospital medicine competence. Initially, this was set up as a pilot project to be evaluated for success along the way, to see if the concept would become permanent. The work was announced, and the inaugural class of 175 physicians entered the process. Since that time, 555 physicians have earned the FPHM certificate. What’s even more impressive is that we have seen a surge recently in the number of entrants. There are now 3,300 hospitalists enrolled in the pathway.
While this growth is great, we estimate that there are 44,000 hospitalists in the U.S. We know that many are newer hospitalists and not yet up for recertification. Our goal is to get every hospitalist entering the pathway when it is his or her time, just like I’m doing now. It is my time!
As we steadily progress in distinguishing and defining our field, we need as many hospitalists as possible to raise their hands and say that they proudly practice hospital medicine and have taken the steps to learn the special knowledge and gain the special skills needed to succeed in the hospital. The ABIM certification program is still in the pilot phase. One of the key markers of success to determine if it will be continued is the number of participants. I am writing this column as another way to encourage us all to stand up and be counted.
Practical Tips
So, we know things have changed, and we know things will be changing more, but what about now? What do we need to do to navigate the process to gain our FPHM certificate today?
1. Enter the process: You can’t win if you don’t play. Entering FPHM is easier than ever. The requirement for current active ACLS has been removed. Now it is a declaration that you see 1,000 patients a year or that you had 3,000 encounters in the last three years and pay the supplemental fee.
2. Earn 100 “points”: You have five years, with a mix of Part II and Part IV activities at least every two years, and the secure exam. You must have the patient voice and patient safety module credit as part of this every five years block.
2a. Medical Knowledge Self-Assessment (Part II): Show what you know or learn on an ongoing basis. You can do these at home, work, or with a buddy, or, even better, sign up for a group learning session, usually offered as a pre-course at society meetings. HM15 will be offering a pre-course that will offer Part II credit. SHM’s Hospital QI and Patient Safety Medical Knowledge Module is available at www.shmlearningportal.org.
2b. Practice Improvement (Part IV): Show that you are trying to improve your practice. Again, the ABIM website lists many possibilities for improvement activities that count and has a practice improvement module (PIM) selector tool (select “hospital medicine” and “inpatient”). Here are some of my favorite PIMs.
Team PIM. Complete a self-assessment of your team skills, get 10 members of your hospital multidisciplinary team to fill out an evaluation on you, and then review with a trusted colleague. This PIM also satisfies both patient voice and patient safety requirements (10 points).
SHM Project BOOST or SHM’s Glycemic Control Mentored Implementation Program. Do either of these at your hospital to earn 20 points.
Clinical Supervisor PIM. For those of you who work with residents or students. Observe 10 visits by learners, then follow up with a chart look-back, feedback to the learner, and a plan for improving learning (20 points).
3. Take a test! The secure exam is given every 10 years and counts for 20 points. What is great about this FPHM test is that it is focused on all the stuff you do every day in your job. It’s a hospitalist test, not an outpatient clinic doctor test. It focuses on inpatient clinical medicine and palliative care, plus patient safety and quality. You can use the current study materials (MedStudy, MKSAP [Medical Knowledge Self-Assessment Program], and the like); just skip the purely ambulatory material. Focused study materials will be available in the next year. Look for the HM15 exam preparation guide, which will direct you to HM15 sessions that cross over with the ABIM/ABFM [American Board of Family Medicine] Hospital Medicine exam.
If you would like other tools for studying for the consultative co-management and quality and patient safety sections of the exam, check out SHM Learning Portal.
Final Thoughts
It’s complicated, right? But each time I look at it or read one of these articles, it gets a bit simpler. The overall process for internal medicine certification now mirrors this one, with very few differences. Remember, the ABFM process is identical for hospitalists trained in family medicine. Hopefully, this column will help you get off the fence and come down on the side of representing what you do every day at work in the hospital.
Be proud, take the more pertinent path, be a hospitalist! Twenty points.
Overtreatment of diabetes
One out of every 10 adults in the United States has diabetes, and the percentage of Americans aged 65 years or older who have diabetes continues to increase. The treatment of diabetes consumes an enormous amount of health care and personal resources. This would palatable if such expenditures did nothing but improve outcomes and reduce morbidity and mortality.
But they don’t.
Compared with young healthy patients with diabetes, older patients with diabetes and complex medical conditions may derive little benefit from intensive management but may incur harm. Hypoglycemia is associated with significant medical costs and adverse health consequences among older patients. Hypoglycemic agents (oral and injectable) are implicated in one-fourth of emergency hospitalizations for adverse drugs events in this population.
Dr. Kasia J. Lipska of Yale University, New Haven, Conn., and her colleagues evaluated the potential overtreatment of diabetes in older patients (at least 65 years) by examining participants in the National Health and Nutrition Examination Survey from 2001 through 2010 who had an HbA1c measurement. Participants were grouped into different health status categories using available data: very complex/poor, complex/intermediate, and relatively healthy (JAMA Intern. Med. 2015 [doi:10.1001/jamainternmed.2014.7345]).
The investigators found that almost two-thirds of this population had an HbA1c less than 7% (i.e., tight control), which did not differ across health status categories. Of the adults with an HbA1c less than 7%, more than one-half were treated with insulin or sulfonylureas, and this was similar across health status categories. During the 10 study years, no changes were observed in the proportion with an HbA1c less than 7% or the proportion of patients with an HbA1c less than 7% who were treated with insulin or a sulfonylurea.
These data tell us we are not racheting our care back when patients reach an age when aggressive care does more harm than good. We may feel hamstrung by quality metrics, a limited ability to manage large populations using health management approach, algorithmic approaches to facilitate appropriate de-escalations in medication management, and lack of time to engage in these discussions with our patients. What we tend to do is decrease these medications after patients have an office or emergency department visit for a hypoglycemic event or complication.
Moving forward, we need to embrace more liberal HbA1c goals for our patients at least 65 years of age. Most important, yet most challenging, we need to have ongoing goals of care discussions with our patients, and comorbidities need to be considered when setting such goals. Decision aids would be helpful tools in this space.
Dr. Ebbert is professor of medicine, a general internist at the Mayo Clinic in Rochester, Minn., and a diplomate of the American Board of Addiction Medicine. The opinions expressed are those of the author and do not necessarily represent the views and opinions of the Mayo Clinic. The opinions expressed in this article should not be used to diagnose or treat any medical condition, nor should they be used as a substitute for medical advice from a qualified, board-certified practicing clinician.
One out of every 10 adults in the United States has diabetes, and the percentage of Americans aged 65 years or older who have diabetes continues to increase. The treatment of diabetes consumes an enormous amount of health care and personal resources. This would palatable if such expenditures did nothing but improve outcomes and reduce morbidity and mortality.
But they don’t.
Compared with young healthy patients with diabetes, older patients with diabetes and complex medical conditions may derive little benefit from intensive management but may incur harm. Hypoglycemia is associated with significant medical costs and adverse health consequences among older patients. Hypoglycemic agents (oral and injectable) are implicated in one-fourth of emergency hospitalizations for adverse drugs events in this population.
Dr. Kasia J. Lipska of Yale University, New Haven, Conn., and her colleagues evaluated the potential overtreatment of diabetes in older patients (at least 65 years) by examining participants in the National Health and Nutrition Examination Survey from 2001 through 2010 who had an HbA1c measurement. Participants were grouped into different health status categories using available data: very complex/poor, complex/intermediate, and relatively healthy (JAMA Intern. Med. 2015 [doi:10.1001/jamainternmed.2014.7345]).
The investigators found that almost two-thirds of this population had an HbA1c less than 7% (i.e., tight control), which did not differ across health status categories. Of the adults with an HbA1c less than 7%, more than one-half were treated with insulin or sulfonylureas, and this was similar across health status categories. During the 10 study years, no changes were observed in the proportion with an HbA1c less than 7% or the proportion of patients with an HbA1c less than 7% who were treated with insulin or a sulfonylurea.
These data tell us we are not racheting our care back when patients reach an age when aggressive care does more harm than good. We may feel hamstrung by quality metrics, a limited ability to manage large populations using health management approach, algorithmic approaches to facilitate appropriate de-escalations in medication management, and lack of time to engage in these discussions with our patients. What we tend to do is decrease these medications after patients have an office or emergency department visit for a hypoglycemic event or complication.
Moving forward, we need to embrace more liberal HbA1c goals for our patients at least 65 years of age. Most important, yet most challenging, we need to have ongoing goals of care discussions with our patients, and comorbidities need to be considered when setting such goals. Decision aids would be helpful tools in this space.
Dr. Ebbert is professor of medicine, a general internist at the Mayo Clinic in Rochester, Minn., and a diplomate of the American Board of Addiction Medicine. The opinions expressed are those of the author and do not necessarily represent the views and opinions of the Mayo Clinic. The opinions expressed in this article should not be used to diagnose or treat any medical condition, nor should they be used as a substitute for medical advice from a qualified, board-certified practicing clinician.
One out of every 10 adults in the United States has diabetes, and the percentage of Americans aged 65 years or older who have diabetes continues to increase. The treatment of diabetes consumes an enormous amount of health care and personal resources. This would palatable if such expenditures did nothing but improve outcomes and reduce morbidity and mortality.
But they don’t.
Compared with young healthy patients with diabetes, older patients with diabetes and complex medical conditions may derive little benefit from intensive management but may incur harm. Hypoglycemia is associated with significant medical costs and adverse health consequences among older patients. Hypoglycemic agents (oral and injectable) are implicated in one-fourth of emergency hospitalizations for adverse drugs events in this population.
Dr. Kasia J. Lipska of Yale University, New Haven, Conn., and her colleagues evaluated the potential overtreatment of diabetes in older patients (at least 65 years) by examining participants in the National Health and Nutrition Examination Survey from 2001 through 2010 who had an HbA1c measurement. Participants were grouped into different health status categories using available data: very complex/poor, complex/intermediate, and relatively healthy (JAMA Intern. Med. 2015 [doi:10.1001/jamainternmed.2014.7345]).
The investigators found that almost two-thirds of this population had an HbA1c less than 7% (i.e., tight control), which did not differ across health status categories. Of the adults with an HbA1c less than 7%, more than one-half were treated with insulin or sulfonylureas, and this was similar across health status categories. During the 10 study years, no changes were observed in the proportion with an HbA1c less than 7% or the proportion of patients with an HbA1c less than 7% who were treated with insulin or a sulfonylurea.
These data tell us we are not racheting our care back when patients reach an age when aggressive care does more harm than good. We may feel hamstrung by quality metrics, a limited ability to manage large populations using health management approach, algorithmic approaches to facilitate appropriate de-escalations in medication management, and lack of time to engage in these discussions with our patients. What we tend to do is decrease these medications after patients have an office or emergency department visit for a hypoglycemic event or complication.
Moving forward, we need to embrace more liberal HbA1c goals for our patients at least 65 years of age. Most important, yet most challenging, we need to have ongoing goals of care discussions with our patients, and comorbidities need to be considered when setting such goals. Decision aids would be helpful tools in this space.
Dr. Ebbert is professor of medicine, a general internist at the Mayo Clinic in Rochester, Minn., and a diplomate of the American Board of Addiction Medicine. The opinions expressed are those of the author and do not necessarily represent the views and opinions of the Mayo Clinic. The opinions expressed in this article should not be used to diagnose or treat any medical condition, nor should they be used as a substitute for medical advice from a qualified, board-certified practicing clinician.
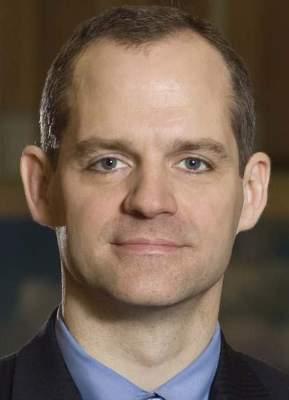
HM15's Top 10 Must-See Sessions

In fact, the issue for those attending HM15 (March 29-April 1 in National Harbor, Md.) won’t be choosing which sessions to soak in. It will be struggling to choose which ones to miss.
Assistant course director Melissa Mattison, MD, SFHM, puts it this way: “The opportunity to learn about faculty development, the opportunity to learn about administrative concerns in running a hospital medicine program, the opportunity to address quality improvement…the opportunity to meet other folks who are doing very similar work and learn from them—all of those things exist.”
So how does one choose the best sessions? Allow us to help. Here’s a list of recommendations from Team Hospitalist, the only reader involvement group of its kind in hospital medicine.
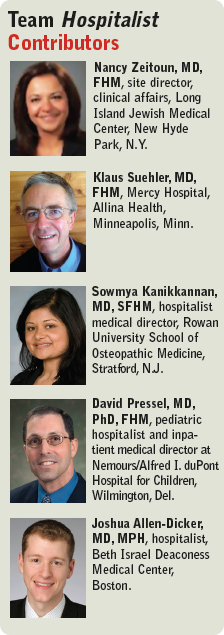
1 “Hospital Management of Patients Presenting with ALTE: An Evidence-Based Approach”
Monday, March 30; 10:35-11:35 a.m.
Dr. Pressel: This is an extremely common problem for pediatric hospitalists—what to do with an infant presenting with a spell. Management can range from just observation to enormous and expensive workups. An authoritative and data-driven paradigm is needed to guide an approach to these children.
2 “Striving for Optimal Care: Updates in Quality, Value, and Patient Satisfaction”
Monday, March 30; 10:35-11:50 a.m.
Dr. Allen-Dicker: Michelle Mourad and Chris Moriates are two dynamic speakers who have been talking about quality (Michelle) and value (Chris) since before they were trendy topics. No hospitalist should be without a proper and up-to-date framework for thinking about these issues; they will make you a better clinician, improve your standing within your hospital medicine group, and enhance your relationships with patients.
3 “Case Studies in Improving Patient Experience”
Monday, March 30; 10:35-11:35 a.m.
Dr. Kanikkannan: Patient experience is such an important focus for many hospitals today. Hospitalists are frontline providers who are asked to work with their hospitals in improving the patient experience. Many hospitals are employing innovative approaches to achieve just this, and this session promises to engage the audience with case studies of improving patient experience. I’m looking forward to learning from these success stories during this session.
4 “Taking the Confusion out of Confusion: Assessment and Management of Delirium”
Monday, March 30; 11:20 a.m.-noon
Dr. Suehler: This is a clinically relevant topic. Hospitalists encounter patients with confusion and delirium, many of them elderly, almost daily. This will be a helpful review to manage these conditions, which are often very disturbing to staff and families, accurately and confidently.
Dr. Zeitoun: Delirium is frequently underdiagnosed and often leads to functional decline, institutionalization, and, ultimately, death. It complicates acute medical care. Hospitalists, in particular, must recognize and regularly assess for both hypoactive and hyperactive delirium early in hospitalized patients.
5 “Broken Heart Going to Surgery? Update in ACC Pre-Op Guidelines”
Tuesday, March 31; 11:45 a.m.-12:25 p.m.
Dr. Kanikkannan: Hospitalists are frequently asked to perform pre-op evaluations in the hospital setting. I’m looking forward to this session because it is a clinically relevant topic that impacts my everyday function as a hospitalist. There is controversy about peri-operative management. Keeping up to date on ACC guidelines is critical to providing evidence-based recommendations to our surgical colleagues when we get back to our institutions.
Dr. Zeitoun: Hospitalists often are asked to provide medical optimization, recommendation, and risk assessment for hospitalized patients requiring surgery during their stay. [We] need to be aware of the 2014 guidelines, as there are major changes to the pre-op protocol, specifically a change from three to two surgical risk categories and an emphasis on functional status, indications for echocardiography/noninvasive stress testing/coronary angiography, and use of beta-blockers. Hospitalists should bring back this information and share with their colleagues to ensure standardization of practice.
6 “Insulin Pumps: Who Should Manage Them Inpatient…You or the Patient”
Tuesday, March 31; 2:50-3:30 p.m.
Dr. Suehler: Insulin pumps have found a much more widespread use in recent years, and many of our patients who present with an unrelated problem will have an insulin pump. Hospitals generally have protocols so patients can use their insulin pumps as inpatients, which is preferred for most patients. Hospitalists need to have, however, a basic knowledge of insulin pumps and their functionality to adequately manage these patients.
7 “It’s Getting Hot in Here–the Management of Febrile Infants”
Tuesday, March 31; 2:50 - 4:05 p.m.
Dr. Pressel: Many protocols for managing febrile infants date from last century and are outdated. Changes in microbacterial epidemiology and patient vaccination status, as well as technological changes in testing, demand a different approach to the traditional academic teaching. Hopefully, this session will be it.
8 “The Scoop on (Gettin’ Them to) Poop: Update in Constipation Management”
Tuesday, March 31; 5:05-5:45 p.m.
Dr. Allen-Dicker: This session is more than just a funny title. [Presenter] Brijen Shah is an accomplished gastroenterologist and medical educator who has recognized the importance of appropriate constipation prevention and management for inpatients. Come to this session to find out how there is more to constipation treatment than just senna and colace.
9 “My Smartphone Went to Medical School—Medical Mobile Resources to Augment Inpatient Practice”
Wednesday, April 1; 7:40-8:35 a.m.
Dr. Kanikkannan: In the era of smartphones and an abundance of apps to download, it would be great to know which of the available resources will add value to my inpatient practice. I frequently use my phone to cross-reference medical topics and drugs. I hope to learn the utility and usefulness of popular apps that are available to the medical professional in this session.
10 “More than Blowing Hot Air: CPAP, BIPAP and Cases to Illustrate Their Use”
Wednesday, April 1; 8:00-9:05 a.m.
Dr. Suehler: As hospitalists, we routinely encounter patients requiring CPAP and BiPAP. We all know the basic principles, but for many of us it is a bit of a “black box.” A great review for hospitalists who want their level of involvement with CPAP and BiPAP to go beyond the order “RT to manage.”
Richard Quinn is a freelance writer in New Jersey.
In fact, the issue for those attending HM15 (March 29-April 1 in National Harbor, Md.) won’t be choosing which sessions to soak in. It will be struggling to choose which ones to miss.
Assistant course director Melissa Mattison, MD, SFHM, puts it this way: “The opportunity to learn about faculty development, the opportunity to learn about administrative concerns in running a hospital medicine program, the opportunity to address quality improvement…the opportunity to meet other folks who are doing very similar work and learn from them—all of those things exist.”
So how does one choose the best sessions? Allow us to help. Here’s a list of recommendations from Team Hospitalist, the only reader involvement group of its kind in hospital medicine.
1 “Hospital Management of Patients Presenting with ALTE: An Evidence-Based Approach”
Monday, March 30; 10:35-11:35 a.m.
Dr. Pressel: This is an extremely common problem for pediatric hospitalists—what to do with an infant presenting with a spell. Management can range from just observation to enormous and expensive workups. An authoritative and data-driven paradigm is needed to guide an approach to these children.
2 “Striving for Optimal Care: Updates in Quality, Value, and Patient Satisfaction”
Monday, March 30; 10:35-11:50 a.m.
Dr. Allen-Dicker: Michelle Mourad and Chris Moriates are two dynamic speakers who have been talking about quality (Michelle) and value (Chris) since before they were trendy topics. No hospitalist should be without a proper and up-to-date framework for thinking about these issues; they will make you a better clinician, improve your standing within your hospital medicine group, and enhance your relationships with patients.
3 “Case Studies in Improving Patient Experience”
Monday, March 30; 10:35-11:35 a.m.
Dr. Kanikkannan: Patient experience is such an important focus for many hospitals today. Hospitalists are frontline providers who are asked to work with their hospitals in improving the patient experience. Many hospitals are employing innovative approaches to achieve just this, and this session promises to engage the audience with case studies of improving patient experience. I’m looking forward to learning from these success stories during this session.
4 “Taking the Confusion out of Confusion: Assessment and Management of Delirium”
Monday, March 30; 11:20 a.m.-noon
Dr. Suehler: This is a clinically relevant topic. Hospitalists encounter patients with confusion and delirium, many of them elderly, almost daily. This will be a helpful review to manage these conditions, which are often very disturbing to staff and families, accurately and confidently.
Dr. Zeitoun: Delirium is frequently underdiagnosed and often leads to functional decline, institutionalization, and, ultimately, death. It complicates acute medical care. Hospitalists, in particular, must recognize and regularly assess for both hypoactive and hyperactive delirium early in hospitalized patients.
5 “Broken Heart Going to Surgery? Update in ACC Pre-Op Guidelines”
Tuesday, March 31; 11:45 a.m.-12:25 p.m.
Dr. Kanikkannan: Hospitalists are frequently asked to perform pre-op evaluations in the hospital setting. I’m looking forward to this session because it is a clinically relevant topic that impacts my everyday function as a hospitalist. There is controversy about peri-operative management. Keeping up to date on ACC guidelines is critical to providing evidence-based recommendations to our surgical colleagues when we get back to our institutions.
Dr. Zeitoun: Hospitalists often are asked to provide medical optimization, recommendation, and risk assessment for hospitalized patients requiring surgery during their stay. [We] need to be aware of the 2014 guidelines, as there are major changes to the pre-op protocol, specifically a change from three to two surgical risk categories and an emphasis on functional status, indications for echocardiography/noninvasive stress testing/coronary angiography, and use of beta-blockers. Hospitalists should bring back this information and share with their colleagues to ensure standardization of practice.
6 “Insulin Pumps: Who Should Manage Them Inpatient…You or the Patient”
Tuesday, March 31; 2:50-3:30 p.m.
Dr. Suehler: Insulin pumps have found a much more widespread use in recent years, and many of our patients who present with an unrelated problem will have an insulin pump. Hospitals generally have protocols so patients can use their insulin pumps as inpatients, which is preferred for most patients. Hospitalists need to have, however, a basic knowledge of insulin pumps and their functionality to adequately manage these patients.
7 “It’s Getting Hot in Here–the Management of Febrile Infants”
Tuesday, March 31; 2:50 - 4:05 p.m.
Dr. Pressel: Many protocols for managing febrile infants date from last century and are outdated. Changes in microbacterial epidemiology and patient vaccination status, as well as technological changes in testing, demand a different approach to the traditional academic teaching. Hopefully, this session will be it.
8 “The Scoop on (Gettin’ Them to) Poop: Update in Constipation Management”
Tuesday, March 31; 5:05-5:45 p.m.
Dr. Allen-Dicker: This session is more than just a funny title. [Presenter] Brijen Shah is an accomplished gastroenterologist and medical educator who has recognized the importance of appropriate constipation prevention and management for inpatients. Come to this session to find out how there is more to constipation treatment than just senna and colace.
9 “My Smartphone Went to Medical School—Medical Mobile Resources to Augment Inpatient Practice”
Wednesday, April 1; 7:40-8:35 a.m.
Dr. Kanikkannan: In the era of smartphones and an abundance of apps to download, it would be great to know which of the available resources will add value to my inpatient practice. I frequently use my phone to cross-reference medical topics and drugs. I hope to learn the utility and usefulness of popular apps that are available to the medical professional in this session.
10 “More than Blowing Hot Air: CPAP, BIPAP and Cases to Illustrate Their Use”
Wednesday, April 1; 8:00-9:05 a.m.
Dr. Suehler: As hospitalists, we routinely encounter patients requiring CPAP and BiPAP. We all know the basic principles, but for many of us it is a bit of a “black box.” A great review for hospitalists who want their level of involvement with CPAP and BiPAP to go beyond the order “RT to manage.”
Richard Quinn is a freelance writer in New Jersey.
In fact, the issue for those attending HM15 (March 29-April 1 in National Harbor, Md.) won’t be choosing which sessions to soak in. It will be struggling to choose which ones to miss.
Assistant course director Melissa Mattison, MD, SFHM, puts it this way: “The opportunity to learn about faculty development, the opportunity to learn about administrative concerns in running a hospital medicine program, the opportunity to address quality improvement…the opportunity to meet other folks who are doing very similar work and learn from them—all of those things exist.”
So how does one choose the best sessions? Allow us to help. Here’s a list of recommendations from Team Hospitalist, the only reader involvement group of its kind in hospital medicine.
1 “Hospital Management of Patients Presenting with ALTE: An Evidence-Based Approach”
Monday, March 30; 10:35-11:35 a.m.
Dr. Pressel: This is an extremely common problem for pediatric hospitalists—what to do with an infant presenting with a spell. Management can range from just observation to enormous and expensive workups. An authoritative and data-driven paradigm is needed to guide an approach to these children.
2 “Striving for Optimal Care: Updates in Quality, Value, and Patient Satisfaction”
Monday, March 30; 10:35-11:50 a.m.
Dr. Allen-Dicker: Michelle Mourad and Chris Moriates are two dynamic speakers who have been talking about quality (Michelle) and value (Chris) since before they were trendy topics. No hospitalist should be without a proper and up-to-date framework for thinking about these issues; they will make you a better clinician, improve your standing within your hospital medicine group, and enhance your relationships with patients.
3 “Case Studies in Improving Patient Experience”
Monday, March 30; 10:35-11:35 a.m.
Dr. Kanikkannan: Patient experience is such an important focus for many hospitals today. Hospitalists are frontline providers who are asked to work with their hospitals in improving the patient experience. Many hospitals are employing innovative approaches to achieve just this, and this session promises to engage the audience with case studies of improving patient experience. I’m looking forward to learning from these success stories during this session.
4 “Taking the Confusion out of Confusion: Assessment and Management of Delirium”
Monday, March 30; 11:20 a.m.-noon
Dr. Suehler: This is a clinically relevant topic. Hospitalists encounter patients with confusion and delirium, many of them elderly, almost daily. This will be a helpful review to manage these conditions, which are often very disturbing to staff and families, accurately and confidently.
Dr. Zeitoun: Delirium is frequently underdiagnosed and often leads to functional decline, institutionalization, and, ultimately, death. It complicates acute medical care. Hospitalists, in particular, must recognize and regularly assess for both hypoactive and hyperactive delirium early in hospitalized patients.
5 “Broken Heart Going to Surgery? Update in ACC Pre-Op Guidelines”
Tuesday, March 31; 11:45 a.m.-12:25 p.m.
Dr. Kanikkannan: Hospitalists are frequently asked to perform pre-op evaluations in the hospital setting. I’m looking forward to this session because it is a clinically relevant topic that impacts my everyday function as a hospitalist. There is controversy about peri-operative management. Keeping up to date on ACC guidelines is critical to providing evidence-based recommendations to our surgical colleagues when we get back to our institutions.
Dr. Zeitoun: Hospitalists often are asked to provide medical optimization, recommendation, and risk assessment for hospitalized patients requiring surgery during their stay. [We] need to be aware of the 2014 guidelines, as there are major changes to the pre-op protocol, specifically a change from three to two surgical risk categories and an emphasis on functional status, indications for echocardiography/noninvasive stress testing/coronary angiography, and use of beta-blockers. Hospitalists should bring back this information and share with their colleagues to ensure standardization of practice.
6 “Insulin Pumps: Who Should Manage Them Inpatient…You or the Patient”
Tuesday, March 31; 2:50-3:30 p.m.
Dr. Suehler: Insulin pumps have found a much more widespread use in recent years, and many of our patients who present with an unrelated problem will have an insulin pump. Hospitals generally have protocols so patients can use their insulin pumps as inpatients, which is preferred for most patients. Hospitalists need to have, however, a basic knowledge of insulin pumps and their functionality to adequately manage these patients.
7 “It’s Getting Hot in Here–the Management of Febrile Infants”
Tuesday, March 31; 2:50 - 4:05 p.m.
Dr. Pressel: Many protocols for managing febrile infants date from last century and are outdated. Changes in microbacterial epidemiology and patient vaccination status, as well as technological changes in testing, demand a different approach to the traditional academic teaching. Hopefully, this session will be it.
8 “The Scoop on (Gettin’ Them to) Poop: Update in Constipation Management”
Tuesday, March 31; 5:05-5:45 p.m.
Dr. Allen-Dicker: This session is more than just a funny title. [Presenter] Brijen Shah is an accomplished gastroenterologist and medical educator who has recognized the importance of appropriate constipation prevention and management for inpatients. Come to this session to find out how there is more to constipation treatment than just senna and colace.
9 “My Smartphone Went to Medical School—Medical Mobile Resources to Augment Inpatient Practice”
Wednesday, April 1; 7:40-8:35 a.m.
Dr. Kanikkannan: In the era of smartphones and an abundance of apps to download, it would be great to know which of the available resources will add value to my inpatient practice. I frequently use my phone to cross-reference medical topics and drugs. I hope to learn the utility and usefulness of popular apps that are available to the medical professional in this session.
10 “More than Blowing Hot Air: CPAP, BIPAP and Cases to Illustrate Their Use”
Wednesday, April 1; 8:00-9:05 a.m.
Dr. Suehler: As hospitalists, we routinely encounter patients requiring CPAP and BiPAP. We all know the basic principles, but for many of us it is a bit of a “black box.” A great review for hospitalists who want their level of involvement with CPAP and BiPAP to go beyond the order “RT to manage.”
Richard Quinn is a freelance writer in New Jersey.

Research, Innovations, Clinical Vignettes Poster Competition Draws Record Number of Abstracts to HM15

As program chair for HM15’s scientific abstract competition—also known as the Research, Innovations, and Clinical Vignettes (RIV) competition—Margaret Fang, MD, MPH, can’t help but think of the future.
RIV is “a chance to hear cutting-edge research or developments in the field, and to look around and say, ‘This is what’s going to show up in your medical journals in a couple of months or next year,’” says Dr. Fang, a hospitalist, researcher, and medical director at the University of California San Francisco. “Sort of like ‘breaking news.’”
This year, the RIV committee encouraged submissions to focus on “the patient experience” and will highlight some of these abstracts as part of the meeting theme, Dr. Fang says. The approach seems to have worked, as a record 1,297 abstracts were submitted for HM15. That figure eclipsed last year’s record high of 1,132 and is double the 634 abstracts submitted for HM10, according to SHM.
“As more and more hospitalists engage in quality improvement and research, I think there’s a big interest in showcasing their efforts and their scholarly works,” Dr. Fang says. “One of the really exciting things about seeing the number of submissions rise year after year is that this not only showcases a breadth of talent in hospital medicine, but also [shows] the engagement and degree of interest in innovations, clinical vignettes, and research.”

As well it should be, says assistant course director Melissa Mattison, MD, FACP, SFHM.
“It’s a really nice opportunity to see firsthand what others are doing and creative ways to address common problems [for] clinical situations. Sometimes they are somewhat unique, but at the same time there are learning points that we can all benefit from,” she adds. “It’s a great opportunity to see good stuff that people are doing all across the country.”

a breadth of talent in hospital medicine, but also [shows] the engagement and degree of interest in innovations, clinical vignettes, and research. —Dr. Fang
In line with Dr. Fang’s point of “breaking news,” this year’s RIV is adding a new feature called “You Heard It Here First,” which will highlight abstracts that were first presented at recent SHM meetings and subsequently were published in noteworthy medical journals. Dr. Fang is proud of the fact that so many abstracts made for colleagues at HM’s annual meeting go on to be important data points for healthcare as a whole.
“The annual meeting is a great venue for that, and RIV especially connects a lot of people who might not have otherwise come into contact with each other,” Dr. Fang says. “During the poster session, we have on-site judges who are groups of senior mentors who go around and get to learn about some of the projects that the presenters are working on. In addition, just the foot traffic, the mingling—you really get to see this fantastic mosaic of what’s going on in the world of hospital medicine.”
Richard Quinn is a freelance writer in New Jersey.
As program chair for HM15’s scientific abstract competition—also known as the Research, Innovations, and Clinical Vignettes (RIV) competition—Margaret Fang, MD, MPH, can’t help but think of the future.
RIV is “a chance to hear cutting-edge research or developments in the field, and to look around and say, ‘This is what’s going to show up in your medical journals in a couple of months or next year,’” says Dr. Fang, a hospitalist, researcher, and medical director at the University of California San Francisco. “Sort of like ‘breaking news.’”
This year, the RIV committee encouraged submissions to focus on “the patient experience” and will highlight some of these abstracts as part of the meeting theme, Dr. Fang says. The approach seems to have worked, as a record 1,297 abstracts were submitted for HM15. That figure eclipsed last year’s record high of 1,132 and is double the 634 abstracts submitted for HM10, according to SHM.
“As more and more hospitalists engage in quality improvement and research, I think there’s a big interest in showcasing their efforts and their scholarly works,” Dr. Fang says. “One of the really exciting things about seeing the number of submissions rise year after year is that this not only showcases a breadth of talent in hospital medicine, but also [shows] the engagement and degree of interest in innovations, clinical vignettes, and research.”
As well it should be, says assistant course director Melissa Mattison, MD, FACP, SFHM.
“It’s a really nice opportunity to see firsthand what others are doing and creative ways to address common problems [for] clinical situations. Sometimes they are somewhat unique, but at the same time there are learning points that we can all benefit from,” she adds. “It’s a great opportunity to see good stuff that people are doing all across the country.”
a breadth of talent in hospital medicine, but also [shows] the engagement and degree of interest in innovations, clinical vignettes, and research. —Dr. Fang
In line with Dr. Fang’s point of “breaking news,” this year’s RIV is adding a new feature called “You Heard It Here First,” which will highlight abstracts that were first presented at recent SHM meetings and subsequently were published in noteworthy medical journals. Dr. Fang is proud of the fact that so many abstracts made for colleagues at HM’s annual meeting go on to be important data points for healthcare as a whole.
“The annual meeting is a great venue for that, and RIV especially connects a lot of people who might not have otherwise come into contact with each other,” Dr. Fang says. “During the poster session, we have on-site judges who are groups of senior mentors who go around and get to learn about some of the projects that the presenters are working on. In addition, just the foot traffic, the mingling—you really get to see this fantastic mosaic of what’s going on in the world of hospital medicine.”
Richard Quinn is a freelance writer in New Jersey.
As program chair for HM15’s scientific abstract competition—also known as the Research, Innovations, and Clinical Vignettes (RIV) competition—Margaret Fang, MD, MPH, can’t help but think of the future.
RIV is “a chance to hear cutting-edge research or developments in the field, and to look around and say, ‘This is what’s going to show up in your medical journals in a couple of months or next year,’” says Dr. Fang, a hospitalist, researcher, and medical director at the University of California San Francisco. “Sort of like ‘breaking news.’”
This year, the RIV committee encouraged submissions to focus on “the patient experience” and will highlight some of these abstracts as part of the meeting theme, Dr. Fang says. The approach seems to have worked, as a record 1,297 abstracts were submitted for HM15. That figure eclipsed last year’s record high of 1,132 and is double the 634 abstracts submitted for HM10, according to SHM.
“As more and more hospitalists engage in quality improvement and research, I think there’s a big interest in showcasing their efforts and their scholarly works,” Dr. Fang says. “One of the really exciting things about seeing the number of submissions rise year after year is that this not only showcases a breadth of talent in hospital medicine, but also [shows] the engagement and degree of interest in innovations, clinical vignettes, and research.”
As well it should be, says assistant course director Melissa Mattison, MD, FACP, SFHM.
“It’s a really nice opportunity to see firsthand what others are doing and creative ways to address common problems [for] clinical situations. Sometimes they are somewhat unique, but at the same time there are learning points that we can all benefit from,” she adds. “It’s a great opportunity to see good stuff that people are doing all across the country.”
a breadth of talent in hospital medicine, but also [shows] the engagement and degree of interest in innovations, clinical vignettes, and research. —Dr. Fang
In line with Dr. Fang’s point of “breaking news,” this year’s RIV is adding a new feature called “You Heard It Here First,” which will highlight abstracts that were first presented at recent SHM meetings and subsequently were published in noteworthy medical journals. Dr. Fang is proud of the fact that so many abstracts made for colleagues at HM’s annual meeting go on to be important data points for healthcare as a whole.
“The annual meeting is a great venue for that, and RIV especially connects a lot of people who might not have otherwise come into contact with each other,” Dr. Fang says. “During the poster session, we have on-site judges who are groups of senior mentors who go around and get to learn about some of the projects that the presenters are working on. In addition, just the foot traffic, the mingling—you really get to see this fantastic mosaic of what’s going on in the world of hospital medicine.”
Richard Quinn is a freelance writer in New Jersey.
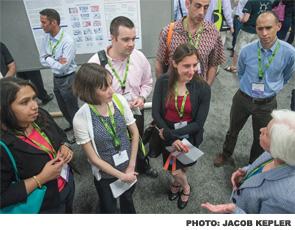
Healthcare Improvement Guru Maureen Bisognano Sees Hospitalists As Agents for Change
Scan HM15’s meeting schedule, and you’ll see that two of the three keynote speakers are names most every hospitalist knows.
Peter Pronovost, MD. He’s also known as the “checklist doctor.”
Robert Wachter, MD, MHM, is as much a meeting tradition as pre-courses and networking. But in the age of generational healthcare reform that focuses on systems and processes, the plenary session between those two titans of talk shouldn’t get lost. That’s when Maureen Bisognano, president and CEO of the Institute for Healthcare Improvement (IHI), will give her presentation, “Leading Transformational Change.”
“These talks certainly are given at a 30,000-foot level and may not be directly applicable to what I’m going to do this afternoon when I’m taking care of a patient, but it sure is nice to hear what great thinkers have to say about some of these concerns, because in the big picture it really does impact clinical care in the country,” says assistant course director Melissa Mattison, MD, FACP, SFHM, of Beth Israel Deaconess Medical Center in Boston. “These are the leading thought leaders in our society, and understanding what their perspective is and what they think is happening and where we should be turning our attention is always interesting.”
HM15’s keynote addresses kick off with Dr. Pronovost’s presentation, “Taking Quality to the Next Level.” The meeting will end, as it always does, with Dr. Wachter’s address, “The Digital Doctor: Hope, Hype, and Harm at the Dawn of Medicine’s Computer Age.”

—Dr. Bisognano
In between will be the perspective of Bisognano, considered an authority on improving healthcare systems. She is an instructor of medicine at Harvard Medical School in Boston and former CEO of the now-shuttered Massachusetts Respiratory Hospital in Braintree.
She “is a very dynamic speaker, and how [much] greater a partner would SHM have than the Institute for Healthcare Improvement, given that innovation and quality improvement is the core competency of SHM,” says HM15 course director Efren Manjarrez, MD, SFHM. “To have her speak at our annual meeting is just huge.”
Bisognano is just as pleased, because she has worked with hospitalists in the past.
“It’s a critical role that they play, because they are there every single day, and they do take responsibility for those handovers,” Bisognano says. “When hospitalist medicine is at its best, we see them being...the captain of the ship and really orchestrating the care and designing it. What I see in many places that don’t have/use hospitalists is individual clinicians coming in to take care of their body part or their symptom, and the patient ends up needing to be the coordinator at a time when they’re most vulnerable.”
Bisognano travels the country frequently and has a list of four questions she always asks when she visits a hospital. First: Do you know how good you are? That gets at whether the institution has data—and whether they review said data to gauge performance.
Next: Do you know where you stand relative to the best?
“Most leaders look internally at the data, but they have no way of knowing where they stand relative to other organizations,” she says. “When they do see that gap, it’s often very provocative for them.”
Her third question is, “Do you know where your variation exists?” The idea is that even if a hospital is measuring and reviewing data—both internally and as a benchmark against comparable institutions—what good is the data if it doesn’t identify weakness?
“The last question is, “Do you know your rate of improvement over time?” And again, most people think that they’re getting better much more quickly than they actually are,” Bisognano says. “Walking them through these four questions is often a provocative assessment for them, and it does help them speed up the velocity of improvement in their organization.”
It’s a checklist that attendees may take back to their institutions, or it may just revitalize them to view things in a different way. Either way works for Bisognano, as she sees hospitalists playing a key role in healthcare reform. In particular, she’s impressed with hospitalists leading multi-disciplinary rounds where they can develop strong relationships with nursing, therapists, and others in the care continuum.
“When clinicians are running, specialists are running in and out and they’re looking at a specific piece of data. What I find is if they don’t get an answer immediately, they often order another test,” Bisognano says. “That kind of perpetual ordering of tests delays discharge, and it oftentimes doesn’t get to a diagnosis. But I think the hospitalist takes this more total view of the patient and often has the time to sit and make a decision that doesn’t involve testing repeatedly, but gets to a diagnosis more quickly.”
Richard Quinn is a freelance writer in New Jersey.
Scan HM15’s meeting schedule, and you’ll see that two of the three keynote speakers are names most every hospitalist knows.
Peter Pronovost, MD. He’s also known as the “checklist doctor.”
Robert Wachter, MD, MHM, is as much a meeting tradition as pre-courses and networking. But in the age of generational healthcare reform that focuses on systems and processes, the plenary session between those two titans of talk shouldn’t get lost. That’s when Maureen Bisognano, president and CEO of the Institute for Healthcare Improvement (IHI), will give her presentation, “Leading Transformational Change.”
“These talks certainly are given at a 30,000-foot level and may not be directly applicable to what I’m going to do this afternoon when I’m taking care of a patient, but it sure is nice to hear what great thinkers have to say about some of these concerns, because in the big picture it really does impact clinical care in the country,” says assistant course director Melissa Mattison, MD, FACP, SFHM, of Beth Israel Deaconess Medical Center in Boston. “These are the leading thought leaders in our society, and understanding what their perspective is and what they think is happening and where we should be turning our attention is always interesting.”
HM15’s keynote addresses kick off with Dr. Pronovost’s presentation, “Taking Quality to the Next Level.” The meeting will end, as it always does, with Dr. Wachter’s address, “The Digital Doctor: Hope, Hype, and Harm at the Dawn of Medicine’s Computer Age.”
—Dr. Bisognano
In between will be the perspective of Bisognano, considered an authority on improving healthcare systems. She is an instructor of medicine at Harvard Medical School in Boston and former CEO of the now-shuttered Massachusetts Respiratory Hospital in Braintree.
She “is a very dynamic speaker, and how [much] greater a partner would SHM have than the Institute for Healthcare Improvement, given that innovation and quality improvement is the core competency of SHM,” says HM15 course director Efren Manjarrez, MD, SFHM. “To have her speak at our annual meeting is just huge.”
Bisognano is just as pleased, because she has worked with hospitalists in the past.
“It’s a critical role that they play, because they are there every single day, and they do take responsibility for those handovers,” Bisognano says. “When hospitalist medicine is at its best, we see them being...the captain of the ship and really orchestrating the care and designing it. What I see in many places that don’t have/use hospitalists is individual clinicians coming in to take care of their body part or their symptom, and the patient ends up needing to be the coordinator at a time when they’re most vulnerable.”
Bisognano travels the country frequently and has a list of four questions she always asks when she visits a hospital. First: Do you know how good you are? That gets at whether the institution has data—and whether they review said data to gauge performance.
Next: Do you know where you stand relative to the best?
“Most leaders look internally at the data, but they have no way of knowing where they stand relative to other organizations,” she says. “When they do see that gap, it’s often very provocative for them.”
Her third question is, “Do you know where your variation exists?” The idea is that even if a hospital is measuring and reviewing data—both internally and as a benchmark against comparable institutions—what good is the data if it doesn’t identify weakness?
“The last question is, “Do you know your rate of improvement over time?” And again, most people think that they’re getting better much more quickly than they actually are,” Bisognano says. “Walking them through these four questions is often a provocative assessment for them, and it does help them speed up the velocity of improvement in their organization.”
It’s a checklist that attendees may take back to their institutions, or it may just revitalize them to view things in a different way. Either way works for Bisognano, as she sees hospitalists playing a key role in healthcare reform. In particular, she’s impressed with hospitalists leading multi-disciplinary rounds where they can develop strong relationships with nursing, therapists, and others in the care continuum.
“When clinicians are running, specialists are running in and out and they’re looking at a specific piece of data. What I find is if they don’t get an answer immediately, they often order another test,” Bisognano says. “That kind of perpetual ordering of tests delays discharge, and it oftentimes doesn’t get to a diagnosis. But I think the hospitalist takes this more total view of the patient and often has the time to sit and make a decision that doesn’t involve testing repeatedly, but gets to a diagnosis more quickly.”
Richard Quinn is a freelance writer in New Jersey.
Scan HM15’s meeting schedule, and you’ll see that two of the three keynote speakers are names most every hospitalist knows.
Peter Pronovost, MD. He’s also known as the “checklist doctor.”
Robert Wachter, MD, MHM, is as much a meeting tradition as pre-courses and networking. But in the age of generational healthcare reform that focuses on systems and processes, the plenary session between those two titans of talk shouldn’t get lost. That’s when Maureen Bisognano, president and CEO of the Institute for Healthcare Improvement (IHI), will give her presentation, “Leading Transformational Change.”
“These talks certainly are given at a 30,000-foot level and may not be directly applicable to what I’m going to do this afternoon when I’m taking care of a patient, but it sure is nice to hear what great thinkers have to say about some of these concerns, because in the big picture it really does impact clinical care in the country,” says assistant course director Melissa Mattison, MD, FACP, SFHM, of Beth Israel Deaconess Medical Center in Boston. “These are the leading thought leaders in our society, and understanding what their perspective is and what they think is happening and where we should be turning our attention is always interesting.”
HM15’s keynote addresses kick off with Dr. Pronovost’s presentation, “Taking Quality to the Next Level.” The meeting will end, as it always does, with Dr. Wachter’s address, “The Digital Doctor: Hope, Hype, and Harm at the Dawn of Medicine’s Computer Age.”
—Dr. Bisognano
In between will be the perspective of Bisognano, considered an authority on improving healthcare systems. She is an instructor of medicine at Harvard Medical School in Boston and former CEO of the now-shuttered Massachusetts Respiratory Hospital in Braintree.
She “is a very dynamic speaker, and how [much] greater a partner would SHM have than the Institute for Healthcare Improvement, given that innovation and quality improvement is the core competency of SHM,” says HM15 course director Efren Manjarrez, MD, SFHM. “To have her speak at our annual meeting is just huge.”
Bisognano is just as pleased, because she has worked with hospitalists in the past.
“It’s a critical role that they play, because they are there every single day, and they do take responsibility for those handovers,” Bisognano says. “When hospitalist medicine is at its best, we see them being...the captain of the ship and really orchestrating the care and designing it. What I see in many places that don’t have/use hospitalists is individual clinicians coming in to take care of their body part or their symptom, and the patient ends up needing to be the coordinator at a time when they’re most vulnerable.”
Bisognano travels the country frequently and has a list of four questions she always asks when she visits a hospital. First: Do you know how good you are? That gets at whether the institution has data—and whether they review said data to gauge performance.
Next: Do you know where you stand relative to the best?
“Most leaders look internally at the data, but they have no way of knowing where they stand relative to other organizations,” she says. “When they do see that gap, it’s often very provocative for them.”
Her third question is, “Do you know where your variation exists?” The idea is that even if a hospital is measuring and reviewing data—both internally and as a benchmark against comparable institutions—what good is the data if it doesn’t identify weakness?
“The last question is, “Do you know your rate of improvement over time?” And again, most people think that they’re getting better much more quickly than they actually are,” Bisognano says. “Walking them through these four questions is often a provocative assessment for them, and it does help them speed up the velocity of improvement in their organization.”
It’s a checklist that attendees may take back to their institutions, or it may just revitalize them to view things in a different way. Either way works for Bisognano, as she sees hospitalists playing a key role in healthcare reform. In particular, she’s impressed with hospitalists leading multi-disciplinary rounds where they can develop strong relationships with nursing, therapists, and others in the care continuum.
“When clinicians are running, specialists are running in and out and they’re looking at a specific piece of data. What I find is if they don’t get an answer immediately, they often order another test,” Bisognano says. “That kind of perpetual ordering of tests delays discharge, and it oftentimes doesn’t get to a diagnosis. But I think the hospitalist takes this more total view of the patient and often has the time to sit and make a decision that doesn’t involve testing repeatedly, but gets to a diagnosis more quickly.”
Richard Quinn is a freelance writer in New Jersey.
Hospitalists on the Hill Day Offers Advocacy-Minded A Voice, Opportunity
“Every [Congressional] district has a hospital in it,” says SHM Public Policy Committee Chair Ron Greeno, MD, FCCP, MHM. “Every congressman has physicians in their community, and they value the opinion of those physicians. Nothing is more effective than having one of our members meet with a representative from their home district about the issues that we care about, or the staff of a member from their home district.
“Those are the most important interactions that we have.”
Welcome to Hill Day, vintage 2015.

Dr. Greeno and Josh Boswell, SHM’s director of government relations, have been hard at work planning this year’s daylong advocacy effort, scheduled for Wednesday, April 1. In 2013, more than 150 hospitalists participated in advocacy training, 113 hospitalists visited Capitol Hill, and dozens more wanted to participate but could not be accommodated. All told, hospitalists held 409 individual meetings with legislators and staff members.
This year, early interest forecasts similar results. Good thing, too, given that last fall’s mid-term Congressional elections means there are a lot of new faces in Washington who may never have met a hospitalist.
“There was a pretty big turnover in this election,” Dr. Greeno says. “There will be a lot of people that we’ll be interacting with for the first time, educating them about hospitalists and what hospitalists are, how we can help, and what the issues are that we care about. It’s particularly important this spring to get to know those new members.”
Part of the success of Hill Day, Dr. Greeno says, is preparation. SHM’s focuses this year will be:
- Clearing up confusion surrounding the two-midnight rule. The Centers for Medicare and Medicaid Services (CMS) changed the rules in 2014 to allow physicians to admit a patient if they reasonably expect and document in the medical record that a beneficiary will need to stay in the hospital for more than two midnights. But uncertainty and confusion call for more clarity.
- Medicaid parity. In 2013, via a regulation included in the Affordable Care Act, CMS increased Medicaid payments for certain primary care services to 100% of Medicare levels through the end of 2014. Bills have been hanging around both houses of Congress to either extend the rule or pass a new one, but no decision has yet been made. SHM supports continuing the 100% level. “When hospitalists are discharging patients with Medicaid, it’s very difficult to get someone to see them in the outpatient world. That was made a lot easier by the outpatient primary care physicians knowing that they were going to get Medicare levels of payment,” Dr. Greeno says.
- Meaningful use for electronic health records (EHR) exemption for hospitalists. SHM helped get an extension passed to exempt hospitalists from penalties in 2014, but not beyond. There are existing exemptions for hospital-based physicians, but that doesn’t help hospitalists who see significant numbers of patients in observation, those who round in skilled nursing or other post-acute facilities, or those who practice in those settings full time.
“The issues that we’re advocating for are really nonpartisan issues,” Dr. Greeno says. “But getting an agreement on an exact solution is just more difficult in this highly partisan atmosphere. It requires an increased level of activity on our part if we want to be successful. Our presence in D.C. has been greater and greater every year, our message has become more clear, and our efforts have paid off.”
But a standing on Capitol Hill is just the first step.

Jairy Hunter III, MD, MBA, SFHM, associate executive medical director for case management and care transitions at the Medical University of South Carolina (MUSC) in Charleston, S.C., attended his first Hill Day in 2013. Since then, he’s been in contact with legislators and staff, sometimes formally and sometimes just running into someone at a football game.
But each time offers a chance to keep up the dialogue.
“I feel like I have a voice, and I feel like if I’m clear about what I need and I can present that in a cogent manner, I think they’ll listen to me,” says Dr. Hunter, a member of Team Hospitalist. “And hopefully along the way I can have that relationship if they need me. Or, if I need them for patient issues or for bigger issues with our university, I can be a resource for them. Frankly, it’s an opportunity to put your money where your mouth is.”
Dr. Hunter says Hill Day allows hospitalists to stop complaining and start making a difference.
“If we have the opportunity…to put ourselves in front of the people who make the decisions,” he says, “why wouldn’t we take advantage of that?”
Richard Quinn is a freelance writer in New Jersey.
“Every [Congressional] district has a hospital in it,” says SHM Public Policy Committee Chair Ron Greeno, MD, FCCP, MHM. “Every congressman has physicians in their community, and they value the opinion of those physicians. Nothing is more effective than having one of our members meet with a representative from their home district about the issues that we care about, or the staff of a member from their home district.
“Those are the most important interactions that we have.”
Welcome to Hill Day, vintage 2015.
Dr. Greeno and Josh Boswell, SHM’s director of government relations, have been hard at work planning this year’s daylong advocacy effort, scheduled for Wednesday, April 1. In 2013, more than 150 hospitalists participated in advocacy training, 113 hospitalists visited Capitol Hill, and dozens more wanted to participate but could not be accommodated. All told, hospitalists held 409 individual meetings with legislators and staff members.
This year, early interest forecasts similar results. Good thing, too, given that last fall’s mid-term Congressional elections means there are a lot of new faces in Washington who may never have met a hospitalist.
“There was a pretty big turnover in this election,” Dr. Greeno says. “There will be a lot of people that we’ll be interacting with for the first time, educating them about hospitalists and what hospitalists are, how we can help, and what the issues are that we care about. It’s particularly important this spring to get to know those new members.”
Part of the success of Hill Day, Dr. Greeno says, is preparation. SHM’s focuses this year will be:
- Clearing up confusion surrounding the two-midnight rule. The Centers for Medicare and Medicaid Services (CMS) changed the rules in 2014 to allow physicians to admit a patient if they reasonably expect and document in the medical record that a beneficiary will need to stay in the hospital for more than two midnights. But uncertainty and confusion call for more clarity.
- Medicaid parity. In 2013, via a regulation included in the Affordable Care Act, CMS increased Medicaid payments for certain primary care services to 100% of Medicare levels through the end of 2014. Bills have been hanging around both houses of Congress to either extend the rule or pass a new one, but no decision has yet been made. SHM supports continuing the 100% level. “When hospitalists are discharging patients with Medicaid, it’s very difficult to get someone to see them in the outpatient world. That was made a lot easier by the outpatient primary care physicians knowing that they were going to get Medicare levels of payment,” Dr. Greeno says.
- Meaningful use for electronic health records (EHR) exemption for hospitalists. SHM helped get an extension passed to exempt hospitalists from penalties in 2014, but not beyond. There are existing exemptions for hospital-based physicians, but that doesn’t help hospitalists who see significant numbers of patients in observation, those who round in skilled nursing or other post-acute facilities, or those who practice in those settings full time.
“The issues that we’re advocating for are really nonpartisan issues,” Dr. Greeno says. “But getting an agreement on an exact solution is just more difficult in this highly partisan atmosphere. It requires an increased level of activity on our part if we want to be successful. Our presence in D.C. has been greater and greater every year, our message has become more clear, and our efforts have paid off.”
But a standing on Capitol Hill is just the first step.
Jairy Hunter III, MD, MBA, SFHM, associate executive medical director for case management and care transitions at the Medical University of South Carolina (MUSC) in Charleston, S.C., attended his first Hill Day in 2013. Since then, he’s been in contact with legislators and staff, sometimes formally and sometimes just running into someone at a football game.
But each time offers a chance to keep up the dialogue.
“I feel like I have a voice, and I feel like if I’m clear about what I need and I can present that in a cogent manner, I think they’ll listen to me,” says Dr. Hunter, a member of Team Hospitalist. “And hopefully along the way I can have that relationship if they need me. Or, if I need them for patient issues or for bigger issues with our university, I can be a resource for them. Frankly, it’s an opportunity to put your money where your mouth is.”
Dr. Hunter says Hill Day allows hospitalists to stop complaining and start making a difference.
“If we have the opportunity…to put ourselves in front of the people who make the decisions,” he says, “why wouldn’t we take advantage of that?”
Richard Quinn is a freelance writer in New Jersey.
“Every [Congressional] district has a hospital in it,” says SHM Public Policy Committee Chair Ron Greeno, MD, FCCP, MHM. “Every congressman has physicians in their community, and they value the opinion of those physicians. Nothing is more effective than having one of our members meet with a representative from their home district about the issues that we care about, or the staff of a member from their home district.
“Those are the most important interactions that we have.”
Welcome to Hill Day, vintage 2015.
Dr. Greeno and Josh Boswell, SHM’s director of government relations, have been hard at work planning this year’s daylong advocacy effort, scheduled for Wednesday, April 1. In 2013, more than 150 hospitalists participated in advocacy training, 113 hospitalists visited Capitol Hill, and dozens more wanted to participate but could not be accommodated. All told, hospitalists held 409 individual meetings with legislators and staff members.
This year, early interest forecasts similar results. Good thing, too, given that last fall’s mid-term Congressional elections means there are a lot of new faces in Washington who may never have met a hospitalist.
“There was a pretty big turnover in this election,” Dr. Greeno says. “There will be a lot of people that we’ll be interacting with for the first time, educating them about hospitalists and what hospitalists are, how we can help, and what the issues are that we care about. It’s particularly important this spring to get to know those new members.”
Part of the success of Hill Day, Dr. Greeno says, is preparation. SHM’s focuses this year will be:
- Clearing up confusion surrounding the two-midnight rule. The Centers for Medicare and Medicaid Services (CMS) changed the rules in 2014 to allow physicians to admit a patient if they reasonably expect and document in the medical record that a beneficiary will need to stay in the hospital for more than two midnights. But uncertainty and confusion call for more clarity.
- Medicaid parity. In 2013, via a regulation included in the Affordable Care Act, CMS increased Medicaid payments for certain primary care services to 100% of Medicare levels through the end of 2014. Bills have been hanging around both houses of Congress to either extend the rule or pass a new one, but no decision has yet been made. SHM supports continuing the 100% level. “When hospitalists are discharging patients with Medicaid, it’s very difficult to get someone to see them in the outpatient world. That was made a lot easier by the outpatient primary care physicians knowing that they were going to get Medicare levels of payment,” Dr. Greeno says.
- Meaningful use for electronic health records (EHR) exemption for hospitalists. SHM helped get an extension passed to exempt hospitalists from penalties in 2014, but not beyond. There are existing exemptions for hospital-based physicians, but that doesn’t help hospitalists who see significant numbers of patients in observation, those who round in skilled nursing or other post-acute facilities, or those who practice in those settings full time.
“The issues that we’re advocating for are really nonpartisan issues,” Dr. Greeno says. “But getting an agreement on an exact solution is just more difficult in this highly partisan atmosphere. It requires an increased level of activity on our part if we want to be successful. Our presence in D.C. has been greater and greater every year, our message has become more clear, and our efforts have paid off.”
But a standing on Capitol Hill is just the first step.
Jairy Hunter III, MD, MBA, SFHM, associate executive medical director for case management and care transitions at the Medical University of South Carolina (MUSC) in Charleston, S.C., attended his first Hill Day in 2013. Since then, he’s been in contact with legislators and staff, sometimes formally and sometimes just running into someone at a football game.
But each time offers a chance to keep up the dialogue.
“I feel like I have a voice, and I feel like if I’m clear about what I need and I can present that in a cogent manner, I think they’ll listen to me,” says Dr. Hunter, a member of Team Hospitalist. “And hopefully along the way I can have that relationship if they need me. Or, if I need them for patient issues or for bigger issues with our university, I can be a resource for them. Frankly, it’s an opportunity to put your money where your mouth is.”
Dr. Hunter says Hill Day allows hospitalists to stop complaining and start making a difference.
“If we have the opportunity…to put ourselves in front of the people who make the decisions,” he says, “why wouldn’t we take advantage of that?”
Richard Quinn is a freelance writer in New Jersey.