User login
Poor COPD management might increase MI risk in HIV
SEATTLE – Chronic obstructive pulmonary disease is independently associated with an increased risk of myocardial infarction in people with HIV, according to a report at the Conference on Retroviruses and Opportunistic Infections.

Chronic obstructive pulmonary disease (COPD) is known to increase the risk of myocardial infarction (MI) in the general population, but hadn’t been shown until now to do the same in HIV. The study raises the question of whether COPD is being managed adequately in patients with the virus, according to study lead Kristina Crothers, MD, associate professor in the division of pulmonary, critical care & sleep medicine at the University of Washington, Seattle.
The investigators reviewed 25,509 HIV patients in the Center for AIDS Research Network of Integrated Clinical Systems cohort, a large electronic database of HIV-infected people. They defined COPD by diagnostic codes and inhaler prescriptions. MIs were adjudicated by review.
The team identified 423 subjects with moderate to severe COPD, and 698 who had MIs, including 339 type 1 MIs (T1MI) from a ruptured plaque (54%), and 294 (46%) type 2 heart attacks (T2MI) from a supply-demand mismatch due to sepsis or some other problem. In general, T2MIs are far more common in people with HIV.
COPD was associated with a greater than twofold increased risk of MI after adjustment for age, sex, viral load, nadir CD4 count, hypertension, and other confounders. The risk dropped slightly when smoking – both current smoking and pack years – was added to the model (adjusted hazard ratio 1.88, 95% confidence interval, 1.34-2.63).
The association was particularly strong for T2MI, especially in the setting of bacteremia and sepsis, and unlike T1MI, it remained significant after adjustment for smoking.
The study establishes a link between COPD and MI in HIV, but it could not answer what’s going on. Chronic inflammation from the virus could be at play, but the team also found hints of inadequate COPD management.
“About 60% of patients were on inhalers ... but only about 25% of them were on long-acting inhalers. 75% were only on short-acting.” That’s a problem because long-acting inhalers are needed to control exacerbations, Dr. Crothers said.
The study didn’t capture exacerbation rates, but increased rates could help explain the MI risk. Increased rates of pneumonia could as well, since pneumonia is a common cause of sepsis.
“We need to better manage complications of COPD in this population. I think optimizing long-term COPD management could have many beneficial effects,” Dr. Crothers said.
The National Institutes of Health funded the work. Dr. Crothers had no disclosures.
SOURCE: Crothers K et al. CROI 2019, Abstract 31.
SEATTLE – Chronic obstructive pulmonary disease is independently associated with an increased risk of myocardial infarction in people with HIV, according to a report at the Conference on Retroviruses and Opportunistic Infections.
Chronic obstructive pulmonary disease (COPD) is known to increase the risk of myocardial infarction (MI) in the general population, but hadn’t been shown until now to do the same in HIV. The study raises the question of whether COPD is being managed adequately in patients with the virus, according to study lead Kristina Crothers, MD, associate professor in the division of pulmonary, critical care & sleep medicine at the University of Washington, Seattle.
The investigators reviewed 25,509 HIV patients in the Center for AIDS Research Network of Integrated Clinical Systems cohort, a large electronic database of HIV-infected people. They defined COPD by diagnostic codes and inhaler prescriptions. MIs were adjudicated by review.
The team identified 423 subjects with moderate to severe COPD, and 698 who had MIs, including 339 type 1 MIs (T1MI) from a ruptured plaque (54%), and 294 (46%) type 2 heart attacks (T2MI) from a supply-demand mismatch due to sepsis or some other problem. In general, T2MIs are far more common in people with HIV.
COPD was associated with a greater than twofold increased risk of MI after adjustment for age, sex, viral load, nadir CD4 count, hypertension, and other confounders. The risk dropped slightly when smoking – both current smoking and pack years – was added to the model (adjusted hazard ratio 1.88, 95% confidence interval, 1.34-2.63).
The association was particularly strong for T2MI, especially in the setting of bacteremia and sepsis, and unlike T1MI, it remained significant after adjustment for smoking.
The study establishes a link between COPD and MI in HIV, but it could not answer what’s going on. Chronic inflammation from the virus could be at play, but the team also found hints of inadequate COPD management.
“About 60% of patients were on inhalers ... but only about 25% of them were on long-acting inhalers. 75% were only on short-acting.” That’s a problem because long-acting inhalers are needed to control exacerbations, Dr. Crothers said.
The study didn’t capture exacerbation rates, but increased rates could help explain the MI risk. Increased rates of pneumonia could as well, since pneumonia is a common cause of sepsis.
“We need to better manage complications of COPD in this population. I think optimizing long-term COPD management could have many beneficial effects,” Dr. Crothers said.
The National Institutes of Health funded the work. Dr. Crothers had no disclosures.
SOURCE: Crothers K et al. CROI 2019, Abstract 31.
REPORTING FROM CROI 2019
Poor asthma control during pregnancy trims live birth rate
SAN FRANCISCO – and among the live births had a significantly increased rate of both preterm delivery and neonatal intensive care admissions, according to a review of insurance claims data for more than 1 million American women during 2011-2015.

On the other hand, asthma severity, which the researchers inferred based on the type and amount of treatment patients received, showed essentially no link with the live birth rate, Jennifer Yland said at the annual meeting of the American Academy of Allergy, Asthma, and Immunology.
“The findings add to the body of evidence that relate poor asthma control to an increased risk for pregnancy complications.” explained Michael X. Schatz, MD, an allergist at Kaiser Permanente of Southern California, in San Diego, and a coauthor of the study.
Results from several prior studies had shown links between asthma and an increased rate of preterm birth, “but the larger, more generalizable population is a strength of the current findings. Results from prior studies have less frequently shown a link between asthma during pregnancy and neonatal ICU admissions,” he added.“The findings strengthen the case for good asthma control during pregnancy.”
For their review, Ms. Yland and her coauthors used insurance claims data from privately-insured American women aged 12-55 years who were pregnant and had drug prescription records during the study period. The database included 996,861 women without an asthma diagnosis and 29,882 women diagnosed with asthma. The analysis excluded women diagnosed with chronic obstructive pulmonary disease at least twice during pregnancy.
To analyze the pregnancy outcomes by asthma severity Ms. Yland and her associates divided the asthma patients into five subgroups based on the drug regimens they were on during pregnancy as a surrogate marker of disease severity. This analysis showed no relationship between disease severity and live birth rate.
The researchers also ran an analysis that divided patients into the quality of their management during pregnancy – either good or poor – based on either of two markers of poor control: filling five or more prescriptions for a short-acting beta-antagonist, or at least one exacerbation episode defined as an asthma-related emergency department visit, hospitalization, or need for oral corticosteroid treatment. By these criteria 7,135 (24%) of the pregnant women with asthma were poorly controlled. The live birth rate was 74% among women without asthma, 71% among those with well-controlled asthma, and 68% among women with poorly-controlled asthma, reported Ms. Yland, a researcher at the Harvard T.H. Chan School of Public Health in Boston.
In a multivariate analysis that adjusted for demographic differences and comorbidities, women with poorly-controlled asthma had preterm delivery a statistically significant 30% more often than did women with well-controlled asthma, and the rate of neonatal ICU admissions was a significant 24% higher in women with poorly-controlled asthma, compared with women who had well-controlled asthma. However, the rates of small-for-gestational-age infants and infants with congenital malformations was not significantly different between the well-controlled and poorly-controlled subgroups.
The finding that almost a quarter of the pregnant women in the study were poorly controlled wasn’t surprising, Dr. Schatz said in an interview. In some studies as many as half the asthma patients have poor control.
The 24% rate of poor asthma control during pregnancy in the studied women is “most likely an underestimate of poor control in the general population” because the study used data from women with commercial health insurance, noted Sonia Hernandez-Diaz, MD, lead investigator for the study and professor of epidemiology at Harvard T.H. Chan School of Public Health. “More disadvantaged populations, such as pregnant women on Medicaid, tend to have worse control.”
Barriers to good asthma control during pregnancy include smoking, weight gain, undertreatment, poor adherence, and viral infection. The overall approach to managing asthma during pregnancy is the same as when women are not pregnant, although certain asthma medications have a better safety record during pregnancy. “The most reassuring data exist for albuterol and inhaled steroids, particularly budesonide and fluticasone. Reassuring data also exist for the long-acting beta agonists salmeterol and formoterol, which are combined with inhaled steroids, and for montelukast,” Dr. Schatz said.
This is the first study to assess the impact of asthma management on pregnancy outcome in such a large population. The large number of women included provided a lot of statistical power and allowed the analyses to control for several potential confounders, Ms. Yland noted in an interview. She plans to expand the analysis with Medicaid data to try to further increase the generalizability and precision of the findings.
The study was funded by GlaxoSmithKline, and a coauthor of the study is a company employee. Ms. Yland had no disclosures. Dr. Schatz has received research funding from ALK, AstraZeneca, Medimmune, GlaxoSmithKline, and Merck. Dr. Hernandez-Diaz has been a consultant to Boehringer Ingelheim, Roche, and UCB, and has received research funding from GlaxoSmithKline, Lilly, and Pfizer.
SOURCE: Yland J et al. J Allergy Clin Immunol. 2019 Feb;143[2]:AB422.
SAN FRANCISCO – and among the live births had a significantly increased rate of both preterm delivery and neonatal intensive care admissions, according to a review of insurance claims data for more than 1 million American women during 2011-2015.
On the other hand, asthma severity, which the researchers inferred based on the type and amount of treatment patients received, showed essentially no link with the live birth rate, Jennifer Yland said at the annual meeting of the American Academy of Allergy, Asthma, and Immunology.
“The findings add to the body of evidence that relate poor asthma control to an increased risk for pregnancy complications.” explained Michael X. Schatz, MD, an allergist at Kaiser Permanente of Southern California, in San Diego, and a coauthor of the study.
Results from several prior studies had shown links between asthma and an increased rate of preterm birth, “but the larger, more generalizable population is a strength of the current findings. Results from prior studies have less frequently shown a link between asthma during pregnancy and neonatal ICU admissions,” he added.“The findings strengthen the case for good asthma control during pregnancy.”
For their review, Ms. Yland and her coauthors used insurance claims data from privately-insured American women aged 12-55 years who were pregnant and had drug prescription records during the study period. The database included 996,861 women without an asthma diagnosis and 29,882 women diagnosed with asthma. The analysis excluded women diagnosed with chronic obstructive pulmonary disease at least twice during pregnancy.
To analyze the pregnancy outcomes by asthma severity Ms. Yland and her associates divided the asthma patients into five subgroups based on the drug regimens they were on during pregnancy as a surrogate marker of disease severity. This analysis showed no relationship between disease severity and live birth rate.
The researchers also ran an analysis that divided patients into the quality of their management during pregnancy – either good or poor – based on either of two markers of poor control: filling five or more prescriptions for a short-acting beta-antagonist, or at least one exacerbation episode defined as an asthma-related emergency department visit, hospitalization, or need for oral corticosteroid treatment. By these criteria 7,135 (24%) of the pregnant women with asthma were poorly controlled. The live birth rate was 74% among women without asthma, 71% among those with well-controlled asthma, and 68% among women with poorly-controlled asthma, reported Ms. Yland, a researcher at the Harvard T.H. Chan School of Public Health in Boston.
In a multivariate analysis that adjusted for demographic differences and comorbidities, women with poorly-controlled asthma had preterm delivery a statistically significant 30% more often than did women with well-controlled asthma, and the rate of neonatal ICU admissions was a significant 24% higher in women with poorly-controlled asthma, compared with women who had well-controlled asthma. However, the rates of small-for-gestational-age infants and infants with congenital malformations was not significantly different between the well-controlled and poorly-controlled subgroups.
The finding that almost a quarter of the pregnant women in the study were poorly controlled wasn’t surprising, Dr. Schatz said in an interview. In some studies as many as half the asthma patients have poor control.
The 24% rate of poor asthma control during pregnancy in the studied women is “most likely an underestimate of poor control in the general population” because the study used data from women with commercial health insurance, noted Sonia Hernandez-Diaz, MD, lead investigator for the study and professor of epidemiology at Harvard T.H. Chan School of Public Health. “More disadvantaged populations, such as pregnant women on Medicaid, tend to have worse control.”
Barriers to good asthma control during pregnancy include smoking, weight gain, undertreatment, poor adherence, and viral infection. The overall approach to managing asthma during pregnancy is the same as when women are not pregnant, although certain asthma medications have a better safety record during pregnancy. “The most reassuring data exist for albuterol and inhaled steroids, particularly budesonide and fluticasone. Reassuring data also exist for the long-acting beta agonists salmeterol and formoterol, which are combined with inhaled steroids, and for montelukast,” Dr. Schatz said.
This is the first study to assess the impact of asthma management on pregnancy outcome in such a large population. The large number of women included provided a lot of statistical power and allowed the analyses to control for several potential confounders, Ms. Yland noted in an interview. She plans to expand the analysis with Medicaid data to try to further increase the generalizability and precision of the findings.
The study was funded by GlaxoSmithKline, and a coauthor of the study is a company employee. Ms. Yland had no disclosures. Dr. Schatz has received research funding from ALK, AstraZeneca, Medimmune, GlaxoSmithKline, and Merck. Dr. Hernandez-Diaz has been a consultant to Boehringer Ingelheim, Roche, and UCB, and has received research funding from GlaxoSmithKline, Lilly, and Pfizer.
SOURCE: Yland J et al. J Allergy Clin Immunol. 2019 Feb;143[2]:AB422.
REPORTING FROM AAAAI 2019
New IPF diagnosis test now covered by Medicare
The Envisia Genomic Classifier, produced by Veracyte, has received final Medicare local coverage determination for the diagnosis of idiopathic pulmonary fibrosis (IPF).

Envisia is a complement to high-resolution CT that can help differentiate IPF from other interstitial lung diseases, as more than half of patients with IPF/interstitial lung disease report being misdiagnosed at least once. The test analyzes samples obtained through transbronchial biopsy, a nonsurgical procedure commonly used in lung evaluation. Envisia has been shown to detect usual interstitial pneumonia, a signature of IPF, with high accuracy.
The new policy was issued through the Palmetto GBA MolDx program and will go into effect on April 1, 2019, making Envisia the first commercially available test of its kind, available to the 55 million people who are currently enrolled in Medicare.
“We are pleased that the evidence supporting the Envisia classifier met the MolDx program’s high standards for coverage. This important milestone will enable us to begin making the Envisia Classifier more widely available to patients with suspected IPF so that they can obtain an accurate, timely diagnosis and, in turn, appropriate treatment,” Bonnie Anderson, chairman and chief executive officer of Veracyte, said in a press release.
Find the full press release on the Veracyte website.
The Envisia Genomic Classifier, produced by Veracyte, has received final Medicare local coverage determination for the diagnosis of idiopathic pulmonary fibrosis (IPF).
Envisia is a complement to high-resolution CT that can help differentiate IPF from other interstitial lung diseases, as more than half of patients with IPF/interstitial lung disease report being misdiagnosed at least once. The test analyzes samples obtained through transbronchial biopsy, a nonsurgical procedure commonly used in lung evaluation. Envisia has been shown to detect usual interstitial pneumonia, a signature of IPF, with high accuracy.
The new policy was issued through the Palmetto GBA MolDx program and will go into effect on April 1, 2019, making Envisia the first commercially available test of its kind, available to the 55 million people who are currently enrolled in Medicare.
“We are pleased that the evidence supporting the Envisia classifier met the MolDx program’s high standards for coverage. This important milestone will enable us to begin making the Envisia Classifier more widely available to patients with suspected IPF so that they can obtain an accurate, timely diagnosis and, in turn, appropriate treatment,” Bonnie Anderson, chairman and chief executive officer of Veracyte, said in a press release.
Find the full press release on the Veracyte website.
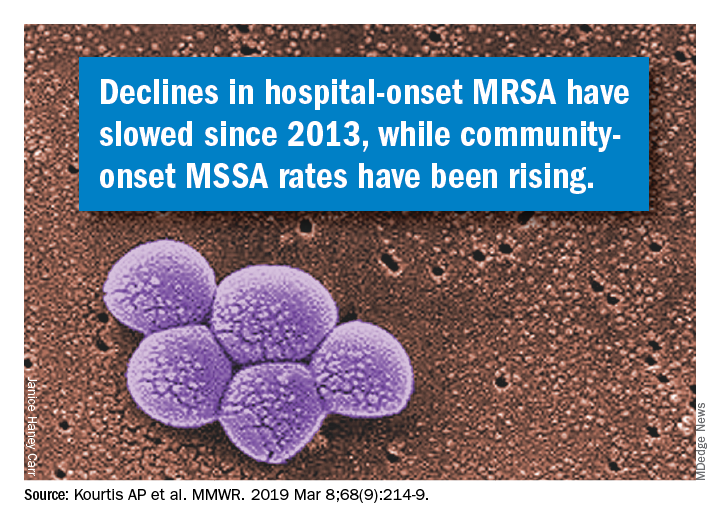
Take stronger steps to prevent staph infections and sepsis
according to data from a Vital Signs report issued by the Centers for Disease Control and Prevention. The data include both methicillin-resistant S. aureus (MRSA) and methicillin-susceptible S. aureus (MSSA).
![]()
Although MRSA infections in health care settings declined by approximately 17% during 2005-2012, rates plateaued during 2012-2017, Anne Schuchat, MD, principal deputy director of the CDC, said in a teleconference March 5 to present the findings. The report emphasizes the potential for serious illness and death with any staph infection and the need for ongoing vigilance on the part of clinicians, she said.
In addition, community-onset MSSA infections increased by 3.9%/year during 2012-2017. Data from previous studies suggest that this increase may be connected to the opioid epidemic, said Dr. Schuchat.
“People who inject drugs are 16% more likely to develop a staph infection” than are those who don’t inject drugs, she said.
Community-onset MRSA declined by 6.9% during 2001-2016, attributed to declines in health care–associated infections, according to Vital Signs author Athena P. Kourtis, MD, of the CDC’s National Center for Emerging and Zoonotic Infectious Diseases, and her colleagues. Rates of hospital-associated MSSA infection remained essentially unchanged (P = .11). The overall unadjusted in-hospital mortality among patients with S. aureus bloodstream infections over the study period was 18%.
The data for the report were collected from electronic health records at more than 400 acute care hospitals, as well as population-based surveillance data from the CDC’s Emerging Infections Program.
Most people carry staph on their skin with no ill effects, but the bacteria become dangerous when they enter the bloodstream, Dr. Schuchat emphasized. “We hope the new data today will refocus the nation’s efforts to protect patients from staph infections,” she said.
Dr. Schuchat advised clinicians and hospital administrators to review their data and step up their safety protocols to prevent staph infections. Precautions include wearing gowns and gloves, following proper hand washing protocols, cautious use of antibiotics, and treating infections rapidly when they occur, she said. Dr. Schuchat noted that lack of adherence to these recommendations may have declined in recent years if clinicians and hospital administrators were wondering whether their protocols have an effect and have value. However, “this is a very serious infection, and we think it is very much worth preventing,” she emphasized.
Other strategies to prevent staph infections in health care settings include reviewing infection data regularly, exploring new approaches to prevent infections, and educating patients about when they may be at increased risk for infection, such as when invasive devices are in place or during surgical procedures. Also, clinicians should be aware of the increased risk for patients who inject drugs, Dr. Schuchat said.
Dr. Schuchat commended the Department of Veterans Affairs Medical Centers (VAMC), which overall reduced their rate of staph infections by 43% during the period from 2005 through 2017 in contrast to the national trend. These findings also appeared in the MMWR on March 5. The VAMC implemented additional interventions and increased their adherence to CDC recommendations during this period, she noted.
The Vital Signs data were published March 5 in the CDC’s Morbidity and Mortality Weekly Report; read the full report here.
The CDC researchers had no financial conflicts to disclose.
SOURCE: Kourtis AP et al. MMWR. 2019 Mar 5; 68:1-6.
FROM THE MORBIDITY AND MORTALITY WEEKLY REPORT
Don’t discount sleep disturbance for children with atopic dermatitis
The itching associated with atopic dermatitis (AD) may interfere with children’s sleep, and sleep studies suggest that children with active disease are more restless at night, wrote Faustine D. Ramirez of the University of California, San Francisco, and her colleagues. Their report is in JAMA Pediatrics.
“Acute and chronic sleep disturbances have been associated with a wide range of cognitive, mood, and behavioral impairments and have been linked to poor educational performance,” the researchers noted.
To determine the impact of active AD on children’s sleep, the researchers reviewed data from 13,988 children followed for a median of 11 years. Of these, 4,938 children met the definition for AD between age 2 and 16 years.
Overall, children with active AD were approximately 50% more likely to experience poor sleep quality than were those without AD (adjusted odds ratio, 1.48). Sleep quality was even worse for children with severe active AD (aOR, 1.68), and active AD plus asthma or allergic rhinitis (aOR 2.15). Sleep quality was significantly worse in children reporting mild AD (aOR, 1.40) or inactive AD (aOR, 1.41), compared with children without AD. Nighttime sleep duration was similar throughout childhood for children with and without AD.
“In addition to increased nighttime awakenings and difficulty falling asleep, we found that children with active atopic dermatitis were more likely to report nightmares and early morning awakenings, which has not been previously studied,” Ms. Ramirez and her associates said.
Total sleep duration was statistically shorter overall for children with AD, compared with those without AD, but the difference was not clinically significant, they noted.
The participants were from a longitudinal study in the United Kingdom in which pregnant women were recruited between 1990 and 1992. For those with children alive at 1 year, their children were followed for approximately 16 years. Sleep quality was assessed at six time points with four standardized questionnaires between ages 2 and 10 years, and sleep duration was assessed at eight time points between ages 2 and 16 years with standardized questionnaires.
The study findings were limited by several factors, including some missing data and patient attrition, as well as possible misclassification bias because of the use of parent and patient self-reports, and a possible lack of generalizability to other populations, the researchers noted.
However, the results support the need for developing clinical outcome measures to address sleep quality in children with AD, they said. “Additional work should investigate interventions to improve sleep quality and examine the association between atopic dermatitis treatment and children’s sleep.”
The study was funded primarily by a grant from the National Eczema Association. Ms. Ramirez disclosed a grant from the National Institutes of Health. Two other investigators received grants, one from NIH and the other Wellcome Senior Clinical Fellowship in Science. One coauthor reported receiving multiple grants, as well as paid consulting for TARGETPharma, a company developing a prospective atopic dermatitis registry.
SOURCE: Ramirez FD al. JAMA Pediatr. 2019 Mar 4. doi: 10.1001/jamapediatrics.2019.0025.
FROM JAMA PEDIATRICS
New SOFA version could streamline outcomes research
SAN DIEGO – The new method replaces some of SOFA’s more subjective criteria with objective measures.

eSOFA relies on electronic health records to reduce reliance on administrative records, which suffer from cross-hospital variability in diagnosis and coding practices, as well as changes in these practices over time. The diagnosis of sepsis itself is also highly subjective. Instead, eSOFA determines dysfunction in six organ systems, indicated by use of vasopressors and mechanical ventilation, and the presence of abnormal laboratory values.
“The SOFA score includes measures like the Glasgow Coma Scale, which undoubtedly at the bedside is a very important clinical sign, but when trying to implement something that is objective for purposes of retrospective case counting and standardization, it can be problematic. The measures we chose [for eSOFA] are concrete, important maneuvers that were initiated by clinicians,” Chanu Rhee, MD, said in an interview.
Dr. Rhee is assistant professor of population medicine at Harvard Medical School and Brigham and Women’s Hospital, Boston. He presented the results of the study at the Critical Care Congress sponsored by the Society of Critical Care Medicine, and the work was simultaneously published online in Critical Care Medicine.
Key elements of SOFA that pose challenges for administrative data include: PaO2/FiO2, which are not routinely measured, and can be difficult to assign to arterial or venous samples; inconsistency in blood pressure and transient increases in vasopressor dose; the subjectivity of the Glasgow Coma Scale, which is also difficult to assess in sedated patients; and inconsistent urine output.
eSOFA introduced new measures for various organ functions, including cardiovascular (vasopressor initiation), pulmonary (mechanical ventilation initiation), renal (doubling of creatinine levels or a 50% or greater decrease in estimated glomerular filtration rate, compared with baseline), hepatic (bilirubin levels greater than or equal to 2.0 mg/dL and at least doubled from baseline), coagulation (platelet count less than 100 cells/mcL and at least a 50% decrease from a baseline of at least 100 cells/mcL), and neurological (lactate greater than or equal to 2.0 mmol/L).
“[eSOFA] opens a window into inter-facility comparisons that has not been possible to do. It’s really critical to ask, ‘How am I doing compared to my peer institutions?’ If you’re doing worse, you can look at the whole spectrum of things to try to drive improvements in care,” said Dr. Rhee.
The new tool isn’t just limited to quality improvement research. Shaeesta Khan, MD, assistant professor of critical care medicine at Geisinger Medical Center,Danville, Pa., has found eSOFA to be useful in her research into how genetic polymorphisms play a role in sepsis outcomes. Geisinger has a large population of patients with completed whole genome sequencing, and Dr. Khan began by trying to glean sepsis outcomes from administrative data.
“I explained SOFA scores to our data broker, and he pulled up 3,000 patients and gave everybody a SOFA score based on the algorithm he created, and it was all over the chart. Once I started doing chart review and phenotype verification, it was just a nightmare,” Dr. Khan said in an interview.
After struggling with the project, one of her mentors put her in touch with one of Dr. Rhee’s colleagues, and she asked the data broker to modify the eSOFA algorithm to fit her specific criteria. “It was a blessing,” she said.
Now, she has data from 5,000 patients with sepsis and sequenced DNA, and can begin comparing outcomes and genetic variants. About 20 candidate genes for sepsis outcomes have been identified to date, but she has a particular interest in PCSK9, which is an innate immune system regulator. She hopes to present results at CCC49 in 2020.
Validating mortality prediction
The researchers compared eSOFA and SOFA in a sample from 111 U.S. acute care hospitals to see if eSOFA had a comparable predictive validity for mortality. The analysis included 942,360 adults seen between 2013 and 2015. A total of 11.1% (104,903) had a presumed serious infection based on a blood culture order and at least 4 consecutive days of antibiotic use.
The analysis showed that 6.1% of those with infections had a sepsis event based on at least a 2-point increase in SOFA score from baseline (Sepsis-3 criteria), compared with 4.4% identified by at least a 1-point increase in eSOFA score. A total of 34,174 patients (3.6%) overlapped between SOFA and eSOFA, which represented good agreement (Cronbach’s alpha, 0.81). Compared with SOFA/Sepsis-3, eSOFA had a sensitivity of 60%, and a positive predictive value of 82%.
Patients identified by eSOFA were slightly more ill, with more requiring ICU admission (41% vs. 35%), and a greater frequency of in-hospital mortality (17% vs. 14%). Those patients who were identified by SOFA/Sepsis-3, but missed by eSOFA, had an overall lower mortality (6%).
There was a similar risk of mortality across deciles between SOFA- and eSOFA-identified sepsis patients. In an independent analysis of four hospitals from the Emory system, the area under the receiver operating characteristics was 0.77 for eSOFA and 0.76 for SOFA (P less than .001).
The Centers for Disease Control and Prevention and the Agency for Healthcare Research and Quality funded the study. Dr. Rhee and Dr. Khan have no relevant financial conflicts.
SOURCE: Rhee C et al. Crit Care Med. 2019;47(3):307-14.
SAN DIEGO – The new method replaces some of SOFA’s more subjective criteria with objective measures.
eSOFA relies on electronic health records to reduce reliance on administrative records, which suffer from cross-hospital variability in diagnosis and coding practices, as well as changes in these practices over time. The diagnosis of sepsis itself is also highly subjective. Instead, eSOFA determines dysfunction in six organ systems, indicated by use of vasopressors and mechanical ventilation, and the presence of abnormal laboratory values.
“The SOFA score includes measures like the Glasgow Coma Scale, which undoubtedly at the bedside is a very important clinical sign, but when trying to implement something that is objective for purposes of retrospective case counting and standardization, it can be problematic. The measures we chose [for eSOFA] are concrete, important maneuvers that were initiated by clinicians,” Chanu Rhee, MD, said in an interview.
Dr. Rhee is assistant professor of population medicine at Harvard Medical School and Brigham and Women’s Hospital, Boston. He presented the results of the study at the Critical Care Congress sponsored by the Society of Critical Care Medicine, and the work was simultaneously published online in Critical Care Medicine.
Key elements of SOFA that pose challenges for administrative data include: PaO2/FiO2, which are not routinely measured, and can be difficult to assign to arterial or venous samples; inconsistency in blood pressure and transient increases in vasopressor dose; the subjectivity of the Glasgow Coma Scale, which is also difficult to assess in sedated patients; and inconsistent urine output.
eSOFA introduced new measures for various organ functions, including cardiovascular (vasopressor initiation), pulmonary (mechanical ventilation initiation), renal (doubling of creatinine levels or a 50% or greater decrease in estimated glomerular filtration rate, compared with baseline), hepatic (bilirubin levels greater than or equal to 2.0 mg/dL and at least doubled from baseline), coagulation (platelet count less than 100 cells/mcL and at least a 50% decrease from a baseline of at least 100 cells/mcL), and neurological (lactate greater than or equal to 2.0 mmol/L).
“[eSOFA] opens a window into inter-facility comparisons that has not been possible to do. It’s really critical to ask, ‘How am I doing compared to my peer institutions?’ If you’re doing worse, you can look at the whole spectrum of things to try to drive improvements in care,” said Dr. Rhee.
The new tool isn’t just limited to quality improvement research. Shaeesta Khan, MD, assistant professor of critical care medicine at Geisinger Medical Center,Danville, Pa., has found eSOFA to be useful in her research into how genetic polymorphisms play a role in sepsis outcomes. Geisinger has a large population of patients with completed whole genome sequencing, and Dr. Khan began by trying to glean sepsis outcomes from administrative data.
“I explained SOFA scores to our data broker, and he pulled up 3,000 patients and gave everybody a SOFA score based on the algorithm he created, and it was all over the chart. Once I started doing chart review and phenotype verification, it was just a nightmare,” Dr. Khan said in an interview.
After struggling with the project, one of her mentors put her in touch with one of Dr. Rhee’s colleagues, and she asked the data broker to modify the eSOFA algorithm to fit her specific criteria. “It was a blessing,” she said.
Now, she has data from 5,000 patients with sepsis and sequenced DNA, and can begin comparing outcomes and genetic variants. About 20 candidate genes for sepsis outcomes have been identified to date, but she has a particular interest in PCSK9, which is an innate immune system regulator. She hopes to present results at CCC49 in 2020.
Validating mortality prediction
The researchers compared eSOFA and SOFA in a sample from 111 U.S. acute care hospitals to see if eSOFA had a comparable predictive validity for mortality. The analysis included 942,360 adults seen between 2013 and 2015. A total of 11.1% (104,903) had a presumed serious infection based on a blood culture order and at least 4 consecutive days of antibiotic use.
The analysis showed that 6.1% of those with infections had a sepsis event based on at least a 2-point increase in SOFA score from baseline (Sepsis-3 criteria), compared with 4.4% identified by at least a 1-point increase in eSOFA score. A total of 34,174 patients (3.6%) overlapped between SOFA and eSOFA, which represented good agreement (Cronbach’s alpha, 0.81). Compared with SOFA/Sepsis-3, eSOFA had a sensitivity of 60%, and a positive predictive value of 82%.
Patients identified by eSOFA were slightly more ill, with more requiring ICU admission (41% vs. 35%), and a greater frequency of in-hospital mortality (17% vs. 14%). Those patients who were identified by SOFA/Sepsis-3, but missed by eSOFA, had an overall lower mortality (6%).
There was a similar risk of mortality across deciles between SOFA- and eSOFA-identified sepsis patients. In an independent analysis of four hospitals from the Emory system, the area under the receiver operating characteristics was 0.77 for eSOFA and 0.76 for SOFA (P less than .001).
The Centers for Disease Control and Prevention and the Agency for Healthcare Research and Quality funded the study. Dr. Rhee and Dr. Khan have no relevant financial conflicts.
SOURCE: Rhee C et al. Crit Care Med. 2019;47(3):307-14.
REPORTING FROM CCC48
Second extubation attempts should be judged on their own merits
SAN DIEGO – When attempting a second extubation, improvements in weaning parameters, compared with the first extubation attempt, do not predict success. Instead, the best predictors were the values of the parameters immediately before the second attempt.
“We hypothesized that the change in parameter values was more important than the actual values right before we tried to re-extubate, and that didn’t turn out to be the case. Because it was a smaller study, we can’t say [change in values] is not useful at all, but we didn’t find a strong association. We showed that the magnitude of the effect with the number measured right before the re-extubation is probably your best bet, but you should obviously evaluate the whole clinical scenario,” commented senior author Michael David Maile, MD, assistant professor of anesthesiology at the University of Michigan, Ann Arbor.
The study was presented at the Critical Care Congress sponsored by the Society of Critical Care Medicine by Suraj Trivedi, MD, who is currently an anesthesiology fellow at Stanford (Calif.) Medicine.
Factors such as rapid shallow breathing index (RSBI), negative inspiratory force (NIF), vital capacity (VC), and partial pressure of arterial carbon dioxide (PaCO2) have been shown to predict success or failure of an initial extubation attempt.
There is currently little available guidance on how to proceed when a first extubation attempt fails. The researchers had anticipated that RSBI, NIF, VC, and PaCO2 levels matching the first attempt would be associated with success the second time around.
But their retrospective study of adult patients at the University of Michigan critical care units found that only the change in RSBI values predicted success on a univariate analysis, and that association became statistically insignificant once they corrected for baseline RSBI previous to the re-extubation attempt.
“I think the biggest take-home message is that we have to figure out each attempt to extubate on its own merits. If you’re trying to extubate a patient in the ICU who has potentially been intubated and extubated multiple times, the clinical gut feeling is always that [the patient has] to be better off than the previous attempt. What we are pointing out is that it really doesn’t matter. If the parameters are all within the overall guidelines, it’s still okay to extubate, even if the absolute change in the variables is not better [than the previous attempt],” Dr. Trivedi said in an interview.
“People put a lot of emphasis on the improvement from the first to the second attempt, and this should temper that enthusiasm to put a lot of weight on the change. But I don’t think our data support that the change means nothing,” added Dr. Maile.
The study included 525 patients (42% female). Comorbidities were common: 72% had cardiac arrhythmias, 58% had hypertension, 33% had renal failure, 39% had a pulmonary disorder, and 25% had liver disease.
Univariate analyses showed associations between values of parameters immediately before the second extubation attempt and success in the second extubation attempt, including RSBI (re-extubation success, mean 53.1 vs failure, mean 68.8; P =.0002) and NIF (success, mean –41.2 vs. failure, mean –38.4; P =.036), and VC (success, mean 1009.8 vs. failure, mean 906.8; P =.017).
When the researchers examined changes in parameters between the first and second attempt, only a change in RSBI predicted success (success, value change of 7.1 vs. failure, value change of 0.05; P less than .031). But when they corrected for the RSBI value immediately before the second attempt, the difference was not statistically significant (P = .892).
The study was not funded. Dr. Maile and Dr. Trivedi have no relevant financial disclosures.
SOURCE: Trivedi S et al. CCC48 2019, Abstract 27.
REPORTING FROM CCC48
Key clinical point: Patient readiness for a second extubation should be judged by current parameters alone.
Major finding: The change in parameter values between first and second extubation attempts was not predictive of success.
Study details: A retrospective analysis of 525 patients.
Disclosures: The study was not funded. Dr. Maile and Dr. Trivedi have no relevant financial disclosures.
Source: Trivedi S et al. CCC48 2019, Abstract 27.
Malpractice suits are less frequent – but more costly
Lawsuits against physicians declined across virtually all specialties by more than a quarter over a 10-year span, but the cost to manage legal challenges went up, a recent analysis finds.
From 2007 to 2016, the rate of claims dropped by 27% per 100 doctors from 5.1 to 3.7, according to a review of 124,000 cases by CRICO Strategies, a division of CRICO, the medical liability insurance provider for the Harvard medical community. CRICO’s database of claims contains about 30% of legal cases filed against health providers across the U.S.
For internists, the rate of lawsuits decreased by 35% between 2007 and 2016, according to CRICO data provided to MDedge News. Ob.gyns. saw a 44% drop in claims over the 10-year period, and surgeons experienced a 23% rate decrease. The analysis did not break down the rate of claims by other single subspecialists. Claims decreased by a combined 29% for cardiologists, dermatologists, endocrinologists, family physicians, gastroenterologists, hematologists/oncologists, hospitalists, infectious disease specialists, internists, nephrologists, neurologists, pulmonologists, and rheumatologists/immunologists, according to the report published in February 2019 on CRICO’s website.
The findings are consistent with prior research on claim trends, said Seth Seabury, PhD, a medical liability researcher and director of the Keck-Schaeffer Initiative for Population Health Policy at the University of Southern California, Los Angeles.
“Malpractice claim frequency has been falling pretty steadily for a while now, reflecting a number of factors including the widespread adoption of tort reform and other measures to shield physicians from malpractice risk,” Dr. Seabury said in an interview. “Interestingly, the decline seems greatest in the claims with lower potential stakes, as you see average indemnity holding flat or rising. Some of this likely reflects the unwillingness of attorneys to take cases with lower potential payouts, because of the high cost of litigating a malpractice case.”
While frequency went down, the cost to manage a legal claim went up, according to CRICO data. The price of defending a malpractice lawsuit rose an average of 3.5% annually over the 10-year period from $36,000 to $46,000. For cases that ended with no payment (indemnity) to plaintiffs, the cost to manage a case rose an average of 5% annually.

The upward trends in case management expenses are striking, particularly since the time to resolve cases has decreased, said Michelle Mello, PhD, a health research and policy professor at Stanford (Calif.) University. From 2007 to 2016, the average time to resolve a case dropped from 29 to 27 months, the CRICO report found.
“CRICO nods to disclosure and apology approaches as perhaps underlying the more encouraging trend in time to resolution, but it was surprising to me that such approaches have not translated into lower defense costs,” Dr. Mello said in an interview. “In particular, a lot is still being spent to manage cases that never result in a payment to the patient. My hope was that, as hospitals got better at communicating with patients about adverse events, including the fact that about three-quarters of them are not due to substandard care, there would be fewer claims involving such events and also less money spent dealing with such claims when they do arise.”
For cases that do end in payment, high payouts are on the rise. Cases that ended in payments of $1 million or more increased 4% over the 10-year time frame, while payments of $3 million to $11 million increased 7% annually, according to the CRICO report. Cases that ended in payment lower than $1 million dropped over the 10-year span.
The reasons behind increasing plaintiff payouts is uncertain, Dr. Seabury said.
“It’s hard to say exactly why high payouts are on the rise, as payout levels reflect a number of factors – [such as] economic damages, clinical severity, pain and suffering – that can be difficult to disentangle,” he said. “But it is probably concerning for doctors in the sense that, while claims are becoming less likely, when they do happen, it could be more catastrophic in the sense of having large damages that exceed the policy limit.”
Lawsuits against physicians declined across virtually all specialties by more than a quarter over a 10-year span, but the cost to manage legal challenges went up, a recent analysis finds.
From 2007 to 2016, the rate of claims dropped by 27% per 100 doctors from 5.1 to 3.7, according to a review of 124,000 cases by CRICO Strategies, a division of CRICO, the medical liability insurance provider for the Harvard medical community. CRICO’s database of claims contains about 30% of legal cases filed against health providers across the U.S.
For internists, the rate of lawsuits decreased by 35% between 2007 and 2016, according to CRICO data provided to MDedge News. Ob.gyns. saw a 44% drop in claims over the 10-year period, and surgeons experienced a 23% rate decrease. The analysis did not break down the rate of claims by other single subspecialists. Claims decreased by a combined 29% for cardiologists, dermatologists, endocrinologists, family physicians, gastroenterologists, hematologists/oncologists, hospitalists, infectious disease specialists, internists, nephrologists, neurologists, pulmonologists, and rheumatologists/immunologists, according to the report published in February 2019 on CRICO’s website.
The findings are consistent with prior research on claim trends, said Seth Seabury, PhD, a medical liability researcher and director of the Keck-Schaeffer Initiative for Population Health Policy at the University of Southern California, Los Angeles.
“Malpractice claim frequency has been falling pretty steadily for a while now, reflecting a number of factors including the widespread adoption of tort reform and other measures to shield physicians from malpractice risk,” Dr. Seabury said in an interview. “Interestingly, the decline seems greatest in the claims with lower potential stakes, as you see average indemnity holding flat or rising. Some of this likely reflects the unwillingness of attorneys to take cases with lower potential payouts, because of the high cost of litigating a malpractice case.”
While frequency went down, the cost to manage a legal claim went up, according to CRICO data. The price of defending a malpractice lawsuit rose an average of 3.5% annually over the 10-year period from $36,000 to $46,000. For cases that ended with no payment (indemnity) to plaintiffs, the cost to manage a case rose an average of 5% annually.
The upward trends in case management expenses are striking, particularly since the time to resolve cases has decreased, said Michelle Mello, PhD, a health research and policy professor at Stanford (Calif.) University. From 2007 to 2016, the average time to resolve a case dropped from 29 to 27 months, the CRICO report found.
“CRICO nods to disclosure and apology approaches as perhaps underlying the more encouraging trend in time to resolution, but it was surprising to me that such approaches have not translated into lower defense costs,” Dr. Mello said in an interview. “In particular, a lot is still being spent to manage cases that never result in a payment to the patient. My hope was that, as hospitals got better at communicating with patients about adverse events, including the fact that about three-quarters of them are not due to substandard care, there would be fewer claims involving such events and also less money spent dealing with such claims when they do arise.”
For cases that do end in payment, high payouts are on the rise. Cases that ended in payments of $1 million or more increased 4% over the 10-year time frame, while payments of $3 million to $11 million increased 7% annually, according to the CRICO report. Cases that ended in payment lower than $1 million dropped over the 10-year span.
The reasons behind increasing plaintiff payouts is uncertain, Dr. Seabury said.
“It’s hard to say exactly why high payouts are on the rise, as payout levels reflect a number of factors – [such as] economic damages, clinical severity, pain and suffering – that can be difficult to disentangle,” he said. “But it is probably concerning for doctors in the sense that, while claims are becoming less likely, when they do happen, it could be more catastrophic in the sense of having large damages that exceed the policy limit.”
Flu season shows signs of peaking
The 2018-2019 flu season may have peaked as the major nationwide measure of influenza activity held steady for the week ending Feb. 23, according to the Centers for Disease Control and Prevention. The proportion of outpatient visits for influenza-like illness (ILI) was 5.0% for the most recent reporting week, the CDC’s influenza division said in its March 1 report. The previous week’s outpatient visit rate, originally reported as 5.1%, was revised this week to 5.0% as well, suggesting that flu activity is no longer increasing.
Activity at the state level was more mixed. The number of states at level 10 on the CDC’s 1-10 scale of ILI activity stayed at 24 as Indiana and North Dakota replaced Tennessee and Wyoming, but the number of states in the high range (8-10) of the activity scale increased from 30 to 33, CDC data show.
The signs of plateauing ILI activity did not, however, extend to flu-related deaths, with 15 reported among children – the highest weekly number for the 2018-2019 season, although 11 actually occurred in previous weeks – during the week ending Feb. 23 and 289 deaths among all ages for the week ending Feb. 16, which is already more than the 268 listed the week before despite less complete reporting (82% vs. 97%), the CDC reported. Total flu-related deaths in children are now up to 56, compared with 138 at the corresponding point in the 2017-2018 season.
A paraneoplastic potassium and acid-base disturbance
NOTE: The scenario presented here is partly based on cases reported elsewhere by Martínez-Valles et al1 and Fernández-Rodríguez et al.2
A 55-year-old man is admitted to the hospital with generalized malaise, paresthesias, and severe hypertension. He says he had experienced agitation along with weakness on exertion 24 hours before presentation to the emergency department, with subsequent onset of paresthesias in his lower extremities and perioral area.
He is already known to have mild chronic obstructive pulmonary disease, with a ratio of forced expiratory volume in 1 second (FEV1)to forced vital capacity (FVC) of less than 70% and an FEV1 85% of predicted. In addition, he was recently diagnosed with diabetes, resistant hypertension requiring maximum doses of 3 agents (a calcium channel blocker, an angiotensin-converting enzyme inhibitor, and a loop diuretic), and hyperlipidemia.
He is a current smoker with a 30-pack-year smoking history. He does not use alcohol. His family history is noncontributory.

ASSESSING ACID-BASE DISORDERS
1. What type of acid-base disorder does this patient have?
- Metabolic acidosis
- Respiratory acidosis
- Metabolic alkalosis
- Respiratory alkalosis
The patient has metabolic alkalosis.
A 5-step approach

1. Acidosis or alkalosis? The patient’s arterial pH is 7.5, which is alkalemic because it is higher than 7.44.
2. Metabolic or respiratory? The primary process in our patient is overwhelmingly metabolic, as his partial pressure of carbon dioxide (Pco2) is slightly elevated, a direction that would cause acidosis, not alkalosis.
3. The anion gap (the serum sodium concentration minus the sum of the chloride and bicarbonate concentrations) is normal at 8 mmol/L (DRG:HYBRiD-XL Immunoassay and Clinical Chemistry Analyzer, reference range 8–16).
4. Is the disturbance compensated? We have determined that this patient has a metabolic alkalemia; the question now is whether there is any compensation for the primary disturbance.
In metabolic alkalosis, the Pco2 may increase by approximately 0.6 mm Hg (range 0.5–0.8) above the nominal normal level of 40 mm Hg for each 1-mmol/L increase in bicarbonate above the nominal normal level of 25 mmol/L.4 If the patient requires oxygen, the calculation may be unreliable, however, as hypoxemia may have an overriding influence on respiratory drive.
Patients with chronically high Pco2 levels such as those with chronic obstructive pulmonary disease can become accustomed to high carbon dioxide levels and lose their hyper-
capnic respiratory drive. Giving oxygen supplementation is thought to decrease respiratory drive in these patients, so that they will breathe slower and retain more carbon dioxide. There is some degree of respiratory compensation for metabolic alkalosis that occurs by breathing less, though it is limited overall—even in very alkalotic patients, breathing less results in CO2 retention, which, by displacing O2 molecules in the alveoli, will in turn result in hypoxia. The brain then senses the hypoxia and makes one breathe faster, thereby limiting this compensation.
This patient’s serum bicarbonate level is 40 mmol/L, or 15 mmol/L higher than the nominal normal level. If he is compensating, his Pco2 should be 40 + (15 × 0.6) = 49 mm Hg, and in fact it is 51 mm Hg, which is within the normal range of expected compensation (47.5–52 mm Hg). Therefore, yes, he is compensating for the primary disturbance.
5. In metabolic acidosis, is there a delta gap? As our patient has metabolic alkalosis, not acidosis, this question does not apply in this case.
WHICH TEST TO FIND THE CAUSE?
2. Which is the best test to order next to determine the cause of this patient’s hypokalemic metabolic alkalosis?
- Serum magnesium level
- Spot urine chloride
- Renal ultrasonography
- 24-hour urine collection for sodium, potassium, and chloride

The patient’s loop diuretic is withheld for 12 hours and a spot urine chloride is obtained, which is reported as 44 mmol/L. This high value suggests that a volume-independent hypokalemic metabolic alkalosis is present with potassium depletion.
As for the other answer choices:
Serum magnesium. Though hypomagnesemia can cause hypokalemia due to lack of inhibition of renal outer medullary potassium channels and subsequent increased excretion of potassium in the apical tubular membrane, it is not independently associated with acid-base disturbances.5
Renal ultrasonography gives information about structural kidney disease but is of limited utility in identifying the cause of hypokalemic metabolic alkalosis.
A 24-hour urine collection is unnecessary in this setting and would ultimately result in delay in diagnosis, as spot urine chloride is a more efficient means of rapidly distinguishing volume-responsive vs volume-independent causes of hypokalemic metabolic alkalosis.6
IS HIS HYPERTENSION SECONDARY? IF SO, WHAT IS THE CAUSE?
Several features of this case suggest that the patient’s hypertension is secondary rather than primary. It is of recent onset. The patient’s family history is noncontributory, and his hypertension is resistant to the use of maximum doses of 3 antihypertensive agents.
3. Which of the following causes of secondary hypertension is not commonly associated with hypokalemia and metabolic alkalosis?
- Hyperaldosteronism
- Liddle syndrome
- Cushing syndrome
- Renal parenchymal disease
- Chronic licorice ingestion
Renal parenchymal disease is a cause of resistant hypertension, but it is not characterized by metabolic alkalosis, hypokalemia, and elevated urine chloride,7 while the others listed here—hyperaldosteronism, Liddle syndrome, Cushing syndrome, and chronic licorice ingestion—are. Other common causes of resistant hypertension without these metabolic abnormalities include obstructive sleep apnea, alcohol abuse, and nonadherence to treatment.
While treatment of hypertension with loop diuretics can result in hypokalemia and metabolic alkalosis due to the effect of these drugs on potassium reabsorption in the loop of Henle, the patient’s hypokalemia persisted after this agent was withdrawn.8
Causes of hypokalemic metabolic alkalosis with and without hypertension are further delineated in Figure 1.
Additional diagnostic testing: Plasma renin and plasma aldosterone
At this juncture, the differential diagnosis for this patient’s potassium depletion, metabolic alkalosis, high urine chloride, and hypertension has been narrowed to primary or secondary hyperaldosteronism, surreptitious mineralocorticoid ingestion, Cushing syndrome, licorice ingestion, Liddle syndrome, or one of the 3 hydroxylase deficiencies (11-, 17-, and 21-) (Figure 1).

Although clues in the history, physical examination, and imaging may suggest a specific cause of his abnormal laboratory values, the next step in the diagnostic workup is to measure the plasma renin and aldosterone levels (Table 3).
HYPERALDOSTERONISM
4. Hyperaldosteronism is associated with which of the following patterns of renin and aldosterone values?
- High renin, high aldosterone, normal ratio of plasma aldosterone concentration (PAC) to plasma renin activity (PRA)
- Low renin, low aldosterone, normal PAC–PRA ratio
- Low renin, high aldosterone, high PAC–PRA ratio
- High renin, low aldosterone, low PAC–PRA ratio
The pattern of low renin, high aldosterone, and high PAC–PRA ratio is associated with hyperaldosteronism.
Primary hyperaldosteronism
Primary hyperaldosteronism is one of the most common causes of resistant hypertension and is underappreciated, being diagnosed in up to 20% of patients referred to hypertension specialty clinics.7 Potassium levels may be normal, likely contributing to its lack of recognition in this target population.
Primary hyperaldosteronism should be suspected in patients who have a plasma aldosterone PAC–PRA ratio greater than 20 with elevated plasma aldosterone concentrations
(> 15 ng/dL).
Persistently elevated aldosterone levels in the setting of elevated plasma volume is proof that aldosterone secretion is independent of the renin-angiotensin-aldosterone axis, and therefore is autonomous (secondary to adrenal tumor or hyperplasia). Further testing in the form of oral salt loading, saline infusion, or fludrocortisone (a sodium-retaining steroid) administration is thus required to confirm inappropriate, autonomous aldosterone secretion.9
After establishing the diagnosis of primary hyperaldosteronism, one should determine the subtype (ie, due to an adrenal carcinoma, unilateral hypersecreting adenoma, or unilateral or bilateral hyperplasia). Further testing includes adrenal computed tomography (CT) to rule out adrenal carcinomas, which are suspected with adenomas larger than 4 cm. Though part of the diagnostic workup, CT as a means of confirmational testing alone does not preclude the possibility of bilateral adrenal hyperplasia in some patients, even in the presence of an adrenal adenoma. For this reason, adrenal venous sampling is required to definitively determine whether the condition is due to a hypersecreting adrenal adenoma or unilateral or bilateral hyperplasia.9,10
Treatment of primary hyperaldosteronism depends on the subtype of the disease and involves salt restriction in addition to an aldosterone antagonist (spironolactone or eplerenone in the case of bilateral disease) or surgery (unilateral disease).9,11,12
Secondary hyperaldosteronism
Secondary hyperaldosteronism should be suspected when plasma renin and aldosterone levels are both elevated with a PAC–PRA ratio less than 10.
This pattern is most commonly seen with diuretic use but can also be a consequence of renal artery stenosis or, rarely, a renin-secreting tumor.13 Renal artery stenosis is a common finding in patients with hypertension undergoing cardiac catheterization, which is not surprising as more than 90% of such stenoses are atherosclerotic.7 Renin-secreting tumors are exceedingly rare, with fewer than 100 cases reported in the literature, and are more common in younger individuals.13
Our patient has low-normal aldosterone and plasma renin
On further testing, this patient’s plasma aldosterone level is 2.55 ng/dL (normal < 15 ng/dL), his plasma renin activity is 0.53 ng/mL/hour (normal 0.2–2.8 ng/mL/hour), and his PAC–PRA ratio is therefore 4.81.
The categories discussed thus far have included primary and secondary hyperaldosteronism, which typically do not present with low to normal levels of both renin and aldosterone. Surreptitious mineralocorticoid use could present in this manner, but is unlikely in this patient, whose medications do not include fludrocortisone.
The low-normal values thus lead to consideration of a third category: apparent mineralocorticoid excess. Diseases in this category such as Cushing disease or adrenocorticotropic hormone (ACTH) excess are characterized by increases in corticosteroids so that the potassium depletion, metabolic alkalosis, and hypertension are not a consequence of renin and aldosterone but rather the excess corticosteroids.14
Causes of apparent mineralocorticoid excess
There are several possible causes of mineralocorticoid excess associated with hypertension and hypokalemic metabolic alkalosis not due to renin and aldosterone.
Chronic licorice ingestion in high volumes is one such cause and is thought to result in inhibition of 11B-hydroxysteroid dehydrogenase or possibly cortisol oxidase by licorice’s active component, glycyrrhetinic acid. This inhibition results in an inability to convert cortisol to cortisone. The cortisol excess binds to mineralocorticoid receptors, and acting like aldosterone, results in hypertension and hypokalemic metabolic alkalosis as well as feedback inhibition of renin and aldosterone levels.15
Partial hydroxylase deficiencies, though rare, should also be considered as a cause of hypokalemic metabolic alkalosis, hypertension, and, potentially, hirsutism and clitoromegaly in women. They can be diagnosed with elevated levels of 17-ketosteroids and dehydroepiandrosterone sulfate, both of which, in excess, may act on aldosterone receptors in a manner similar to cortisol.16
Liddle syndrome, a rare autosomal dominant condition, may also present with suppressed levels of both renin and aldosterone. In contrast to the disorders of nonaldosterone mineralocorticoid excess, however, the sodium channel defect in Liddle syndrome is characterized by a primary increase in sodium reabsorption in the collecting tubule and potassium wasting. The resultant volume expansion leads to suppressed renin and aldosterone levels and hypertension with low potassium and elevated bicarbonate concentrations.17
Liddle syndrome is commonly diagnosed in childhood but may go unrecognized due to occasional absence of hypokalemia at presentation. Potassium-sparing diuretics such as amiloride or triamterene are the mainstays of treatment.18


Rates of cardiovascular and all-cause mortality are increased in patients with long-term hypercortisolism, even after plasma concentrations of cortisol are normalized.21
Figure 2 shows the cascade of the hypothalamic-pituitary-adrenal axis.
TESTING FOR HYPERCORTISOLISM IN OUR PATIENT
Given the patient’s clinical presentation and laboratory and imaging findings with normal plasma renin and aldosterone levels, a workup for suspected hypercortisolism is initiated.
Initial diagnostic testing for hypercortisolism depends on the degree of clinical suspicion. In those with low probability of the disease, testing should consist of 1 of the following, as a single negative test may be sufficient to rule out the disease:
- 24-hour urinary cortisol levels
- Overnight dexamethasone suppression testing
- Late-night salivary cortisol measurements.
In those with a high index of suspicion, 2 of the aforementioned tests should be performed, as 1 normal result may not be sufficient to exclude the diagnosis.22,23
A 24-hour urinary cortisol collection and overnight dexamethasone suppression test are obtained. His 24-hour urinary free cortisol level is elevated at 6,600 µg (normal 4–100), and suppression testing with 8 mg of dexamethasone (a form of “high-dose” testing)demonstrates only an 8% decline in serum cortisol levels. Cortisol should generally drop more than 90%.
Morning serum cortisol concentration is less than 5 µg/dL (140 nmol/L) in most patients with Cushing disease (ie, a pituitary tumor), and is usually undetectable in normal subjects. Only about 50% of neuroendocrine ACTH-secreting tumors will suppress with this test.
The patient’s clinical presentation, in conjunction with his diagnostic testing, are thus consistent with Cushing syndrome.
CUSHING SYNDROME
Cushing syndrome is most often exogenous or iatrogenic, ie, a result of supraphysiologic doses of glucocorticoids used to treat a variety of inflammatory, autoimmune, and neoplastic conditions.
Endogenous Cushing syndrome, on the other hand, is rare, with an estimated prevalence of 0.7 to 2.4 cases per million per year. ACTH-dependent causes account for 80% of endogenous Cushing syndrome cases, with ACTH-secreting pituitary adenomas (Cushing disease) accounting for 75% to 80% and ectopic ACTH secretion accounting for 15% to 20%. Less than 1% of cases are due to tumors that produce corticotropin-releasing hormone (CRH).
ACTH-independent Cushing syndrome is diagnosed in 20% of endogenous cases and is most commonly caused by a unilateral adrenal tumor. Rare causes of ACTH-independent disease include adrenal carcinoma, McCune-Albright syndrome, and adrenal hyperplasia.24
The patient’s ACTH is high
To determine whether this is an ACTH-dependent or independent process, the next step is to order an ACTH level. His ACTH level is high at 107 pg/mL (normal < 46 pg/mL), confirming the diagnosis of ACTH-dependent Cushing syndrome.
To find out if this ACTH-dependent process is due to a pituitary adenoma, magnetic resonance imaging (MRI) of the pituitary is obtained but is normal.
Large masses (> 6 mm) strongly suggest Cushing disease, but these tumors are often small and may be missed even with more advanced imaging techniques. Corticotropin-secreting adenomas arising from normal cells in the pituitary retain some sensitivity to glucocorticoid negative feedback and CRH stimulation, and thus high-dose dexamethasone suppression testing in conjunction with CRH stimulation testing can be used to differentiate Cushing disease from ectopic ACTH secretion.24,25 Both of these tests have poor diagnostic accuracy, however, and thus inferior petrosal sampling remains the gold standard for the diagnosis of Cushing disease.

ACTH-SECRETING TUMORS
5. Cushing syndrome due to ectopic ACTH secretion is most commonly attributed to which of the following tumors?
- Small-cell lung carcinoma
- Pancreatic carcinoma
- Medullary thyroid carcinoma
- Gastrinoma
Severe cases of Cushing syndrome are often attributable to ectopic ACTH secretion due to an underlying malignancy, most commonly small-cell lung carcinoma or neuroendocrine tumors of pulmonary origin. Other causes include pancreatic and thymic neuroendocrine tumors, gastrinomas, and medullary thyroid carcinoma.25,26
Because most ACTH-producing tumors are intrathoracic, initial imaging in cases of suspected ectopic ACTH secretion should focus on the chest, with CT the usual first choice. Octreotide scintigraphy can also be useful in localizing disease, as many neuroendocrine tumors express somatostatin receptors. Specialized positron-emission tomography scans may also be helpful in tumor identification.24
TREATMENT OF CUSHING SYNDROME DUE TO ECTOPIC ACTH SECRETION
6. Which of the following is most appropriate medical therapy for suppression of cortisol secretion in Cushing syndrome due to ectopic ACTH secretion?
- Spironolactone
- Dexamethasone
- Somatostatin
- Estrogen
- Ketoconazole
Hyperglycemia, hypokalemia, hypertension, psychiatric disturbances, venous thromboembolism, and systemic infections appear to be common in ectopic ACTH syndrome and often correlate with the degree of hypercortisolemia. Severe Cushing syndrome due to ectopic ACTH secretion is an emergency requiring prompt control of cortisol secretion.
First-line treatments include steroidogenesis inhibitors (ketoconazole, metyrapone, etomidate, mitotane) and glucocorticoid receptor antagonists (mifepristone). High-dose spironolactone and eplerenone can also be used to treat the hypertension and hypokalemia associated with mineralocorticoid receptor stimulation. Definitive treatment involves surgical resection, chemotherapy, or radiotherapy when applicable.24,25
After confirmation of the diagnosis, the patient is prescribed ketoconazole and spironolactone, with substantial improvement. He subsequently is started on combination chemotherapy and radiation therapy for his small-cell lung carcinoma.
DISCUSSION
The differential diagnosis for hypokalemia is broad and relies on information obtained during the history and physical examination, followed by interpretation of selected laboratory results. Myriad pathologies in diverse organ systems, eg, diarrhea, renal tubular acidosis, and adrenal disease, may be responsible for a low serum potassium. Further categorizing potassium depletion on the basis of an associated acid-base disturbance, such as metabolic alkalosis, allows one to use an algorithmic approach that can identify specific etiologies responsible for both the potassium and the acid-base disturbances.
Using the spot urine chloride in the setting of hypokalemic metabolic alkalosis with or without hypertension can narrow the differential diagnosis and allow additional clinical findings to guide clinical problem-solving and decision-making, even for conditions not commonly encountered in routine medical practice.
Obtaining renin and aldosterone measurements in patients with potassium depletion, metabolic alkalosis, high urine chloride excretion, and hypertension permits further categorization into 3 clinical groups: elevated aldosterone and renin (secondary hyperaldosteronism), elevated aldosterone and low renin (primary hyperaldosteronism), or apparent mineralocorticoid excess wherein neither renin nor aldosterone are responsible for the syndrome.
The patient in our case had apparent mineralocorticoid excess as a consequence of an ACTH-producing small-cell carcinoma.
- Martínez-Valles MA, Palafox-Cazarez A, Paredes-Avina JA. Severe hypokalemia, metabolic alkalosis and hypertension in a 54 year old male with ectopic ACTH syndrome: a case report. Cases J 2009; 2:6174. doi:10.4076/1757-1626-2-6174
- Fernández-Rodríguez E, Villar-Taibo R, Pinal-Osorio I, et al. Severe hypertension and hypokalemia as first clinical manifestations in ectopic Cushing’s syndrome. Arq Bras Endocrinol Metabol 2008; 52(6):1066–1070. pmid:18820819
- Mani S, Rutecki GW. A patient with altered mental status and an acid-base disturbance. Cleve Clin J Med 2017; 84(1):27–34. doi:10.3949/ccjm.84a.16042
- Adrogué HJ, Madias NE. Secondary responses to altered acid-base status: the rules of engagement. J Am Soc Nephrol 2010; 21(6):920–923. doi:10.1681/ASN.2009121211
- Huang CL, Kuo E. Mechanism of hypokalemia in magnesium deficiency. J Am Soc Nephrol 2007; 18(10):2649–2652. doi:10.1681/ASN.2007070792
- Rose BD. Metabolic alkalosis. In: Clinical Physiology of Acid-Base and Electrolyte Disorders. 4th ed. New York, NY: McGraw-Hill, Health Professions Division; 1994:515.
- Calhoun DA, Jones D, Textor S, et al; American Heart Association Professional Education Committee. Resistant hypertension: diagnosis, evaluation, and treatment: a scientific statement from the American Heart Association Professional Education Committee of the Council for High Blood Pressure Research. Circulation 2008; 117(25):e510–e526. doi:10.1161/CIRCULATIONAHA.108.189141
- Koeppen BM, Stanton BA. Physiology of diuretic action. In: Renal Physiology. 5th ed. Philadelphia, PA: Elsevier Inc; 2013:167–178.
- Blumenfeld JD, Sealey JE, Schlussel Y, et al. Diagnosis and treatment of primary hyperaldosteronism. Ann Intern Med 1994; 121(11):877–885. pmid:7978702
- Kempers MJ, Lenders JW, van Outheusden L, et al. Systematic review: diagnostic procedures to differentiate unilateral from bilateral adrenal abnormality in primary aldosteronism. Ann Intern Med 2009; 151(5):329–337. pmid:19721021
- Karagiannis A, Tziomalos K, Papageorgiou A, et al. Spironolactone versus eplerenone for the treatment of idiopathic hyperaldosteronism. Expert Opin Pharmacother 2008; 9(4):509–515. doi:10.1517/14656566.9.4.509
- Sawka AM, Young WF, Thompson GB, et al. Primary aldosteronism: factors associated with normalization of blood pressure after surgery. Ann Intern Med 2001; 135(4):258–261. pmid:11511140
- Haab F, Duclos JM, Guyenne T, Plouin PF, Corvol P. Renin secreting tumors: diagnosis, conservative surgical approach and long-term results. J Urol 1995; 153(6):1781–1784. pmid:7752315
- Sabbadin C, Armanini D. Syndromes that mimic an excess of mineralocorticoids. High Blood Press Cardiovasc Prev 2016; 23(3):231–235. doi:10.1007/s40292-016-0160-5
- Apostolakos JM, Caines LC. Apparent mineralocorticoid excess syndrome: a case of resistant hypertension from licorice tea consumption. J Clin Hypertens (Greenwich) 2016; 18(10):991–993. doi:10.1111/jch.12841
- Glatt K, Garzon DL, Popovic J. Congenital adrenal hyperplasia due to 21-hydroxylase deficiency. J Spec Pediatr Nurs 2005; 10(3):104–114. doi:10.1111/j.1744-6155.2005.00022.x
- Findling JW, Raff H, Hansson JH, Lifton RP. Liddle’s syndrome: prospective genetic screening and suppressed aldosterone secretion in an extended kindred. J Clin Endocrinol Metab 1997; 82(4):1071–1074. doi:10.1210/jcem.82.4.3862
- Wang C, Chan TK, Yeung RT, Coghlan JP, Scoggins BA, Stockigt JR. The effect of triamterene and sodium intake on renin, aldosterone, and erythrocyte sodium transport in Liddle’s syndrome. J Clin Endocrinol Metab 1981; 52(5):1027–1032. doi:10.1210/jcem-52-5-1027
- Torpy DJ, Mullen N, Ilias I, Nieman LK. Association of hypertension and hypokalemia with Cushing’s syndrome caused by ectopic ACTH secretion: a series of 58 cases. Ann N Y Acad Sci 2002; 970:134–144. pmid:12381548
- Saruta T, Suzuki H, Handa M, Igarashi Y, Kondo K, Senba S. Multiple factors contribute to the pathogenesis of hypertension in Cushing’s syndrome. J Clin Endocrinol Metab 1986; 62(2):275–279. doi:10.1210/jcem-62-2-275
- Clayton RN, Jones PW, Reulen RC, et al. Mortality in patients with Cushing’s disease more than 10 years after remission: a multicentre, multinational, retrospective cohort study. Lancet Diabetes Endocrinol 2016; 4(7):569–576. doi:10.1016/S2213-8587(16)30005-5
- Baid SK, Rubino D, Sinaii N, Ramsey S, Frank A, Nieman LK. Specificity of screening tests for Cushing’s syndrome in an overweight and obese population. J Clin Endocrinol Metab 2009; 94(10):3857–3864. doi:10.1210/jc.2008-2766
- Nieman LK, Biller BM, Findling JW, et al. The diagnosis of Cushing’s syndrome: an Endocrine Society Clinical Practice Guideline. J Clin Endocrinol Metab 2008; 93(5):1526–1540. doi:10.1210/jc.2008-0125
- Sharma ST, Nieman LK, Feelders RA. Cushing’s syndrome: epidemiology and developments in disease management. Clin Epidemiol 2015; 7:281–293. doi:10.2147/CLEP.S44336
- Tavares Bello C, van der Poest Clement E, Feelders R. Severe Cushing’s syndrome and bilateral pulmonary nodules: beyond ectopic ACTH. Endocrinol Diabetes Metab Case Rep 2017; pii:17–0100. doi:10.1530/EDM-17-0100
- Sathyakumar S, Paul TV, Asha HS, et al. Ectopic Cushing syndrome: a 10-year experience from a tertiary care center in southern India. Endocr Pract 2017; 23(8):907–914. doi:10.4158/EP161677.OR
NOTE: The scenario presented here is partly based on cases reported elsewhere by Martínez-Valles et al1 and Fernández-Rodríguez et al.2
A 55-year-old man is admitted to the hospital with generalized malaise, paresthesias, and severe hypertension. He says he had experienced agitation along with weakness on exertion 24 hours before presentation to the emergency department, with subsequent onset of paresthesias in his lower extremities and perioral area.
He is already known to have mild chronic obstructive pulmonary disease, with a ratio of forced expiratory volume in 1 second (FEV1)to forced vital capacity (FVC) of less than 70% and an FEV1 85% of predicted. In addition, he was recently diagnosed with diabetes, resistant hypertension requiring maximum doses of 3 agents (a calcium channel blocker, an angiotensin-converting enzyme inhibitor, and a loop diuretic), and hyperlipidemia.
He is a current smoker with a 30-pack-year smoking history. He does not use alcohol. His family history is noncontributory.
ASSESSING ACID-BASE DISORDERS
1. What type of acid-base disorder does this patient have?
- Metabolic acidosis
- Respiratory acidosis
- Metabolic alkalosis
- Respiratory alkalosis
The patient has metabolic alkalosis.
A 5-step approach
1. Acidosis or alkalosis? The patient’s arterial pH is 7.5, which is alkalemic because it is higher than 7.44.
2. Metabolic or respiratory? The primary process in our patient is overwhelmingly metabolic, as his partial pressure of carbon dioxide (Pco2) is slightly elevated, a direction that would cause acidosis, not alkalosis.
3. The anion gap (the serum sodium concentration minus the sum of the chloride and bicarbonate concentrations) is normal at 8 mmol/L (DRG:HYBRiD-XL Immunoassay and Clinical Chemistry Analyzer, reference range 8–16).
4. Is the disturbance compensated? We have determined that this patient has a metabolic alkalemia; the question now is whether there is any compensation for the primary disturbance.
In metabolic alkalosis, the Pco2 may increase by approximately 0.6 mm Hg (range 0.5–0.8) above the nominal normal level of 40 mm Hg for each 1-mmol/L increase in bicarbonate above the nominal normal level of 25 mmol/L.4 If the patient requires oxygen, the calculation may be unreliable, however, as hypoxemia may have an overriding influence on respiratory drive.
Patients with chronically high Pco2 levels such as those with chronic obstructive pulmonary disease can become accustomed to high carbon dioxide levels and lose their hyper-
capnic respiratory drive. Giving oxygen supplementation is thought to decrease respiratory drive in these patients, so that they will breathe slower and retain more carbon dioxide. There is some degree of respiratory compensation for metabolic alkalosis that occurs by breathing less, though it is limited overall—even in very alkalotic patients, breathing less results in CO2 retention, which, by displacing O2 molecules in the alveoli, will in turn result in hypoxia. The brain then senses the hypoxia and makes one breathe faster, thereby limiting this compensation.
This patient’s serum bicarbonate level is 40 mmol/L, or 15 mmol/L higher than the nominal normal level. If he is compensating, his Pco2 should be 40 + (15 × 0.6) = 49 mm Hg, and in fact it is 51 mm Hg, which is within the normal range of expected compensation (47.5–52 mm Hg). Therefore, yes, he is compensating for the primary disturbance.
5. In metabolic acidosis, is there a delta gap? As our patient has metabolic alkalosis, not acidosis, this question does not apply in this case.
WHICH TEST TO FIND THE CAUSE?
2. Which is the best test to order next to determine the cause of this patient’s hypokalemic metabolic alkalosis?
- Serum magnesium level
- Spot urine chloride
- Renal ultrasonography
- 24-hour urine collection for sodium, potassium, and chloride
The patient’s loop diuretic is withheld for 12 hours and a spot urine chloride is obtained, which is reported as 44 mmol/L. This high value suggests that a volume-independent hypokalemic metabolic alkalosis is present with potassium depletion.
As for the other answer choices:
Serum magnesium. Though hypomagnesemia can cause hypokalemia due to lack of inhibition of renal outer medullary potassium channels and subsequent increased excretion of potassium in the apical tubular membrane, it is not independently associated with acid-base disturbances.5
Renal ultrasonography gives information about structural kidney disease but is of limited utility in identifying the cause of hypokalemic metabolic alkalosis.
A 24-hour urine collection is unnecessary in this setting and would ultimately result in delay in diagnosis, as spot urine chloride is a more efficient means of rapidly distinguishing volume-responsive vs volume-independent causes of hypokalemic metabolic alkalosis.6
IS HIS HYPERTENSION SECONDARY? IF SO, WHAT IS THE CAUSE?
Several features of this case suggest that the patient’s hypertension is secondary rather than primary. It is of recent onset. The patient’s family history is noncontributory, and his hypertension is resistant to the use of maximum doses of 3 antihypertensive agents.
3. Which of the following causes of secondary hypertension is not commonly associated with hypokalemia and metabolic alkalosis?
- Hyperaldosteronism
- Liddle syndrome
- Cushing syndrome
- Renal parenchymal disease
- Chronic licorice ingestion
Renal parenchymal disease is a cause of resistant hypertension, but it is not characterized by metabolic alkalosis, hypokalemia, and elevated urine chloride,7 while the others listed here—hyperaldosteronism, Liddle syndrome, Cushing syndrome, and chronic licorice ingestion—are. Other common causes of resistant hypertension without these metabolic abnormalities include obstructive sleep apnea, alcohol abuse, and nonadherence to treatment.
While treatment of hypertension with loop diuretics can result in hypokalemia and metabolic alkalosis due to the effect of these drugs on potassium reabsorption in the loop of Henle, the patient’s hypokalemia persisted after this agent was withdrawn.8
Causes of hypokalemic metabolic alkalosis with and without hypertension are further delineated in Figure 1.
Additional diagnostic testing: Plasma renin and plasma aldosterone
At this juncture, the differential diagnosis for this patient’s potassium depletion, metabolic alkalosis, high urine chloride, and hypertension has been narrowed to primary or secondary hyperaldosteronism, surreptitious mineralocorticoid ingestion, Cushing syndrome, licorice ingestion, Liddle syndrome, or one of the 3 hydroxylase deficiencies (11-, 17-, and 21-) (Figure 1).
Although clues in the history, physical examination, and imaging may suggest a specific cause of his abnormal laboratory values, the next step in the diagnostic workup is to measure the plasma renin and aldosterone levels (Table 3).
HYPERALDOSTERONISM
4. Hyperaldosteronism is associated with which of the following patterns of renin and aldosterone values?
- High renin, high aldosterone, normal ratio of plasma aldosterone concentration (PAC) to plasma renin activity (PRA)
- Low renin, low aldosterone, normal PAC–PRA ratio
- Low renin, high aldosterone, high PAC–PRA ratio
- High renin, low aldosterone, low PAC–PRA ratio
The pattern of low renin, high aldosterone, and high PAC–PRA ratio is associated with hyperaldosteronism.
Primary hyperaldosteronism
Primary hyperaldosteronism is one of the most common causes of resistant hypertension and is underappreciated, being diagnosed in up to 20% of patients referred to hypertension specialty clinics.7 Potassium levels may be normal, likely contributing to its lack of recognition in this target population.
Primary hyperaldosteronism should be suspected in patients who have a plasma aldosterone PAC–PRA ratio greater than 20 with elevated plasma aldosterone concentrations
(> 15 ng/dL).
Persistently elevated aldosterone levels in the setting of elevated plasma volume is proof that aldosterone secretion is independent of the renin-angiotensin-aldosterone axis, and therefore is autonomous (secondary to adrenal tumor or hyperplasia). Further testing in the form of oral salt loading, saline infusion, or fludrocortisone (a sodium-retaining steroid) administration is thus required to confirm inappropriate, autonomous aldosterone secretion.9
After establishing the diagnosis of primary hyperaldosteronism, one should determine the subtype (ie, due to an adrenal carcinoma, unilateral hypersecreting adenoma, or unilateral or bilateral hyperplasia). Further testing includes adrenal computed tomography (CT) to rule out adrenal carcinomas, which are suspected with adenomas larger than 4 cm. Though part of the diagnostic workup, CT as a means of confirmational testing alone does not preclude the possibility of bilateral adrenal hyperplasia in some patients, even in the presence of an adrenal adenoma. For this reason, adrenal venous sampling is required to definitively determine whether the condition is due to a hypersecreting adrenal adenoma or unilateral or bilateral hyperplasia.9,10
Treatment of primary hyperaldosteronism depends on the subtype of the disease and involves salt restriction in addition to an aldosterone antagonist (spironolactone or eplerenone in the case of bilateral disease) or surgery (unilateral disease).9,11,12
Secondary hyperaldosteronism
Secondary hyperaldosteronism should be suspected when plasma renin and aldosterone levels are both elevated with a PAC–PRA ratio less than 10.
This pattern is most commonly seen with diuretic use but can also be a consequence of renal artery stenosis or, rarely, a renin-secreting tumor.13 Renal artery stenosis is a common finding in patients with hypertension undergoing cardiac catheterization, which is not surprising as more than 90% of such stenoses are atherosclerotic.7 Renin-secreting tumors are exceedingly rare, with fewer than 100 cases reported in the literature, and are more common in younger individuals.13
Our patient has low-normal aldosterone and plasma renin
On further testing, this patient’s plasma aldosterone level is 2.55 ng/dL (normal < 15 ng/dL), his plasma renin activity is 0.53 ng/mL/hour (normal 0.2–2.8 ng/mL/hour), and his PAC–PRA ratio is therefore 4.81.
The categories discussed thus far have included primary and secondary hyperaldosteronism, which typically do not present with low to normal levels of both renin and aldosterone. Surreptitious mineralocorticoid use could present in this manner, but is unlikely in this patient, whose medications do not include fludrocortisone.
The low-normal values thus lead to consideration of a third category: apparent mineralocorticoid excess. Diseases in this category such as Cushing disease or adrenocorticotropic hormone (ACTH) excess are characterized by increases in corticosteroids so that the potassium depletion, metabolic alkalosis, and hypertension are not a consequence of renin and aldosterone but rather the excess corticosteroids.14
Causes of apparent mineralocorticoid excess
There are several possible causes of mineralocorticoid excess associated with hypertension and hypokalemic metabolic alkalosis not due to renin and aldosterone.
Chronic licorice ingestion in high volumes is one such cause and is thought to result in inhibition of 11B-hydroxysteroid dehydrogenase or possibly cortisol oxidase by licorice’s active component, glycyrrhetinic acid. This inhibition results in an inability to convert cortisol to cortisone. The cortisol excess binds to mineralocorticoid receptors, and acting like aldosterone, results in hypertension and hypokalemic metabolic alkalosis as well as feedback inhibition of renin and aldosterone levels.15
Partial hydroxylase deficiencies, though rare, should also be considered as a cause of hypokalemic metabolic alkalosis, hypertension, and, potentially, hirsutism and clitoromegaly in women. They can be diagnosed with elevated levels of 17-ketosteroids and dehydroepiandrosterone sulfate, both of which, in excess, may act on aldosterone receptors in a manner similar to cortisol.16
Liddle syndrome, a rare autosomal dominant condition, may also present with suppressed levels of both renin and aldosterone. In contrast to the disorders of nonaldosterone mineralocorticoid excess, however, the sodium channel defect in Liddle syndrome is characterized by a primary increase in sodium reabsorption in the collecting tubule and potassium wasting. The resultant volume expansion leads to suppressed renin and aldosterone levels and hypertension with low potassium and elevated bicarbonate concentrations.17
Liddle syndrome is commonly diagnosed in childhood but may go unrecognized due to occasional absence of hypokalemia at presentation. Potassium-sparing diuretics such as amiloride or triamterene are the mainstays of treatment.18
Rates of cardiovascular and all-cause mortality are increased in patients with long-term hypercortisolism, even after plasma concentrations of cortisol are normalized.21
Figure 2 shows the cascade of the hypothalamic-pituitary-adrenal axis.
TESTING FOR HYPERCORTISOLISM IN OUR PATIENT
Given the patient’s clinical presentation and laboratory and imaging findings with normal plasma renin and aldosterone levels, a workup for suspected hypercortisolism is initiated.
Initial diagnostic testing for hypercortisolism depends on the degree of clinical suspicion. In those with low probability of the disease, testing should consist of 1 of the following, as a single negative test may be sufficient to rule out the disease:
- 24-hour urinary cortisol levels
- Overnight dexamethasone suppression testing
- Late-night salivary cortisol measurements.
In those with a high index of suspicion, 2 of the aforementioned tests should be performed, as 1 normal result may not be sufficient to exclude the diagnosis.22,23
A 24-hour urinary cortisol collection and overnight dexamethasone suppression test are obtained. His 24-hour urinary free cortisol level is elevated at 6,600 µg (normal 4–100), and suppression testing with 8 mg of dexamethasone (a form of “high-dose” testing)demonstrates only an 8% decline in serum cortisol levels. Cortisol should generally drop more than 90%.
Morning serum cortisol concentration is less than 5 µg/dL (140 nmol/L) in most patients with Cushing disease (ie, a pituitary tumor), and is usually undetectable in normal subjects. Only about 50% of neuroendocrine ACTH-secreting tumors will suppress with this test.
The patient’s clinical presentation, in conjunction with his diagnostic testing, are thus consistent with Cushing syndrome.
CUSHING SYNDROME
Cushing syndrome is most often exogenous or iatrogenic, ie, a result of supraphysiologic doses of glucocorticoids used to treat a variety of inflammatory, autoimmune, and neoplastic conditions.
Endogenous Cushing syndrome, on the other hand, is rare, with an estimated prevalence of 0.7 to 2.4 cases per million per year. ACTH-dependent causes account for 80% of endogenous Cushing syndrome cases, with ACTH-secreting pituitary adenomas (Cushing disease) accounting for 75% to 80% and ectopic ACTH secretion accounting for 15% to 20%. Less than 1% of cases are due to tumors that produce corticotropin-releasing hormone (CRH).
ACTH-independent Cushing syndrome is diagnosed in 20% of endogenous cases and is most commonly caused by a unilateral adrenal tumor. Rare causes of ACTH-independent disease include adrenal carcinoma, McCune-Albright syndrome, and adrenal hyperplasia.24
The patient’s ACTH is high
To determine whether this is an ACTH-dependent or independent process, the next step is to order an ACTH level. His ACTH level is high at 107 pg/mL (normal < 46 pg/mL), confirming the diagnosis of ACTH-dependent Cushing syndrome.
To find out if this ACTH-dependent process is due to a pituitary adenoma, magnetic resonance imaging (MRI) of the pituitary is obtained but is normal.
Large masses (> 6 mm) strongly suggest Cushing disease, but these tumors are often small and may be missed even with more advanced imaging techniques. Corticotropin-secreting adenomas arising from normal cells in the pituitary retain some sensitivity to glucocorticoid negative feedback and CRH stimulation, and thus high-dose dexamethasone suppression testing in conjunction with CRH stimulation testing can be used to differentiate Cushing disease from ectopic ACTH secretion.24,25 Both of these tests have poor diagnostic accuracy, however, and thus inferior petrosal sampling remains the gold standard for the diagnosis of Cushing disease.
ACTH-SECRETING TUMORS
5. Cushing syndrome due to ectopic ACTH secretion is most commonly attributed to which of the following tumors?
- Small-cell lung carcinoma
- Pancreatic carcinoma
- Medullary thyroid carcinoma
- Gastrinoma
Severe cases of Cushing syndrome are often attributable to ectopic ACTH secretion due to an underlying malignancy, most commonly small-cell lung carcinoma or neuroendocrine tumors of pulmonary origin. Other causes include pancreatic and thymic neuroendocrine tumors, gastrinomas, and medullary thyroid carcinoma.25,26
Because most ACTH-producing tumors are intrathoracic, initial imaging in cases of suspected ectopic ACTH secretion should focus on the chest, with CT the usual first choice. Octreotide scintigraphy can also be useful in localizing disease, as many neuroendocrine tumors express somatostatin receptors. Specialized positron-emission tomography scans may also be helpful in tumor identification.24
TREATMENT OF CUSHING SYNDROME DUE TO ECTOPIC ACTH SECRETION
6. Which of the following is most appropriate medical therapy for suppression of cortisol secretion in Cushing syndrome due to ectopic ACTH secretion?
- Spironolactone
- Dexamethasone
- Somatostatin
- Estrogen
- Ketoconazole
Hyperglycemia, hypokalemia, hypertension, psychiatric disturbances, venous thromboembolism, and systemic infections appear to be common in ectopic ACTH syndrome and often correlate with the degree of hypercortisolemia. Severe Cushing syndrome due to ectopic ACTH secretion is an emergency requiring prompt control of cortisol secretion.
First-line treatments include steroidogenesis inhibitors (ketoconazole, metyrapone, etomidate, mitotane) and glucocorticoid receptor antagonists (mifepristone). High-dose spironolactone and eplerenone can also be used to treat the hypertension and hypokalemia associated with mineralocorticoid receptor stimulation. Definitive treatment involves surgical resection, chemotherapy, or radiotherapy when applicable.24,25
After confirmation of the diagnosis, the patient is prescribed ketoconazole and spironolactone, with substantial improvement. He subsequently is started on combination chemotherapy and radiation therapy for his small-cell lung carcinoma.
DISCUSSION
The differential diagnosis for hypokalemia is broad and relies on information obtained during the history and physical examination, followed by interpretation of selected laboratory results. Myriad pathologies in diverse organ systems, eg, diarrhea, renal tubular acidosis, and adrenal disease, may be responsible for a low serum potassium. Further categorizing potassium depletion on the basis of an associated acid-base disturbance, such as metabolic alkalosis, allows one to use an algorithmic approach that can identify specific etiologies responsible for both the potassium and the acid-base disturbances.
Using the spot urine chloride in the setting of hypokalemic metabolic alkalosis with or without hypertension can narrow the differential diagnosis and allow additional clinical findings to guide clinical problem-solving and decision-making, even for conditions not commonly encountered in routine medical practice.
Obtaining renin and aldosterone measurements in patients with potassium depletion, metabolic alkalosis, high urine chloride excretion, and hypertension permits further categorization into 3 clinical groups: elevated aldosterone and renin (secondary hyperaldosteronism), elevated aldosterone and low renin (primary hyperaldosteronism), or apparent mineralocorticoid excess wherein neither renin nor aldosterone are responsible for the syndrome.
The patient in our case had apparent mineralocorticoid excess as a consequence of an ACTH-producing small-cell carcinoma.
- Martínez-Valles MA, Palafox-Cazarez A, Paredes-Avina JA. Severe hypokalemia, metabolic alkalosis and hypertension in a 54 year old male with ectopic ACTH syndrome: a case report. Cases J 2009; 2:6174. doi:10.4076/1757-1626-2-6174
- Fernández-Rodríguez E, Villar-Taibo R, Pinal-Osorio I, et al. Severe hypertension and hypokalemia as first clinical manifestations in ectopic Cushing’s syndrome. Arq Bras Endocrinol Metabol 2008; 52(6):1066–1070. pmid:18820819
- Mani S, Rutecki GW. A patient with altered mental status and an acid-base disturbance. Cleve Clin J Med 2017; 84(1):27–34. doi:10.3949/ccjm.84a.16042
- Adrogué HJ, Madias NE. Secondary responses to altered acid-base status: the rules of engagement. J Am Soc Nephrol 2010; 21(6):920–923. doi:10.1681/ASN.2009121211
- Huang CL, Kuo E. Mechanism of hypokalemia in magnesium deficiency. J Am Soc Nephrol 2007; 18(10):2649–2652. doi:10.1681/ASN.2007070792
- Rose BD. Metabolic alkalosis. In: Clinical Physiology of Acid-Base and Electrolyte Disorders. 4th ed. New York, NY: McGraw-Hill, Health Professions Division; 1994:515.
- Calhoun DA, Jones D, Textor S, et al; American Heart Association Professional Education Committee. Resistant hypertension: diagnosis, evaluation, and treatment: a scientific statement from the American Heart Association Professional Education Committee of the Council for High Blood Pressure Research. Circulation 2008; 117(25):e510–e526. doi:10.1161/CIRCULATIONAHA.108.189141
- Koeppen BM, Stanton BA. Physiology of diuretic action. In: Renal Physiology. 5th ed. Philadelphia, PA: Elsevier Inc; 2013:167–178.
- Blumenfeld JD, Sealey JE, Schlussel Y, et al. Diagnosis and treatment of primary hyperaldosteronism. Ann Intern Med 1994; 121(11):877–885. pmid:7978702
- Kempers MJ, Lenders JW, van Outheusden L, et al. Systematic review: diagnostic procedures to differentiate unilateral from bilateral adrenal abnormality in primary aldosteronism. Ann Intern Med 2009; 151(5):329–337. pmid:19721021
- Karagiannis A, Tziomalos K, Papageorgiou A, et al. Spironolactone versus eplerenone for the treatment of idiopathic hyperaldosteronism. Expert Opin Pharmacother 2008; 9(4):509–515. doi:10.1517/14656566.9.4.509
- Sawka AM, Young WF, Thompson GB, et al. Primary aldosteronism: factors associated with normalization of blood pressure after surgery. Ann Intern Med 2001; 135(4):258–261. pmid:11511140
- Haab F, Duclos JM, Guyenne T, Plouin PF, Corvol P. Renin secreting tumors: diagnosis, conservative surgical approach and long-term results. J Urol 1995; 153(6):1781–1784. pmid:7752315
- Sabbadin C, Armanini D. Syndromes that mimic an excess of mineralocorticoids. High Blood Press Cardiovasc Prev 2016; 23(3):231–235. doi:10.1007/s40292-016-0160-5
- Apostolakos JM, Caines LC. Apparent mineralocorticoid excess syndrome: a case of resistant hypertension from licorice tea consumption. J Clin Hypertens (Greenwich) 2016; 18(10):991–993. doi:10.1111/jch.12841
- Glatt K, Garzon DL, Popovic J. Congenital adrenal hyperplasia due to 21-hydroxylase deficiency. J Spec Pediatr Nurs 2005; 10(3):104–114. doi:10.1111/j.1744-6155.2005.00022.x
- Findling JW, Raff H, Hansson JH, Lifton RP. Liddle’s syndrome: prospective genetic screening and suppressed aldosterone secretion in an extended kindred. J Clin Endocrinol Metab 1997; 82(4):1071–1074. doi:10.1210/jcem.82.4.3862
- Wang C, Chan TK, Yeung RT, Coghlan JP, Scoggins BA, Stockigt JR. The effect of triamterene and sodium intake on renin, aldosterone, and erythrocyte sodium transport in Liddle’s syndrome. J Clin Endocrinol Metab 1981; 52(5):1027–1032. doi:10.1210/jcem-52-5-1027
- Torpy DJ, Mullen N, Ilias I, Nieman LK. Association of hypertension and hypokalemia with Cushing’s syndrome caused by ectopic ACTH secretion: a series of 58 cases. Ann N Y Acad Sci 2002; 970:134–144. pmid:12381548
- Saruta T, Suzuki H, Handa M, Igarashi Y, Kondo K, Senba S. Multiple factors contribute to the pathogenesis of hypertension in Cushing’s syndrome. J Clin Endocrinol Metab 1986; 62(2):275–279. doi:10.1210/jcem-62-2-275
- Clayton RN, Jones PW, Reulen RC, et al. Mortality in patients with Cushing’s disease more than 10 years after remission: a multicentre, multinational, retrospective cohort study. Lancet Diabetes Endocrinol 2016; 4(7):569–576. doi:10.1016/S2213-8587(16)30005-5
- Baid SK, Rubino D, Sinaii N, Ramsey S, Frank A, Nieman LK. Specificity of screening tests for Cushing’s syndrome in an overweight and obese population. J Clin Endocrinol Metab 2009; 94(10):3857–3864. doi:10.1210/jc.2008-2766
- Nieman LK, Biller BM, Findling JW, et al. The diagnosis of Cushing’s syndrome: an Endocrine Society Clinical Practice Guideline. J Clin Endocrinol Metab 2008; 93(5):1526–1540. doi:10.1210/jc.2008-0125
- Sharma ST, Nieman LK, Feelders RA. Cushing’s syndrome: epidemiology and developments in disease management. Clin Epidemiol 2015; 7:281–293. doi:10.2147/CLEP.S44336
- Tavares Bello C, van der Poest Clement E, Feelders R. Severe Cushing’s syndrome and bilateral pulmonary nodules: beyond ectopic ACTH. Endocrinol Diabetes Metab Case Rep 2017; pii:17–0100. doi:10.1530/EDM-17-0100
- Sathyakumar S, Paul TV, Asha HS, et al. Ectopic Cushing syndrome: a 10-year experience from a tertiary care center in southern India. Endocr Pract 2017; 23(8):907–914. doi:10.4158/EP161677.OR