User login
FDA still concerned about biotin affecting troponin tests
The

However, not all troponin tests are affected, according to the update. “Since the FDA’s safety communication on this topic in 2017, some lab test developers have been successful at mitigating the biotin interference of their assays, but others have not yet addressed it,” according to the new communication, issued in early November.
Also known as vitamin B7 and appearing in many dietary supplements, including prenatal multivitamins and supplements for hair, skin, and nail growth, biotin can lead to falsely low results on some troponin tests, especially at high levels. The worry is that biotin interference could therefore lead to missed diagnoses. The FDA has provided a list of those tests that have not taken biotin’s effects into account, titled “Biotin Interference with Troponin Lab Tests – Assays Subject to Biotin Interference.”
The daily recommended allowance for biotin, according to the communication, is about 0.3 mg, but it isn’t always clear how much is actually included in supplements – some can contain 20 mg or even as much as 100 mg per pill of biotin. The communication includes recommendations for patients, health care professionals, laboratory personnel, and lab test manufacturers and developers.
The full safety communication can be found on the FDA website, and problems with tests can be reported via the FDA’s MedWatch Voluntary Reporting Form.
The
However, not all troponin tests are affected, according to the update. “Since the FDA’s safety communication on this topic in 2017, some lab test developers have been successful at mitigating the biotin interference of their assays, but others have not yet addressed it,” according to the new communication, issued in early November.
Also known as vitamin B7 and appearing in many dietary supplements, including prenatal multivitamins and supplements for hair, skin, and nail growth, biotin can lead to falsely low results on some troponin tests, especially at high levels. The worry is that biotin interference could therefore lead to missed diagnoses. The FDA has provided a list of those tests that have not taken biotin’s effects into account, titled “Biotin Interference with Troponin Lab Tests – Assays Subject to Biotin Interference.”
The daily recommended allowance for biotin, according to the communication, is about 0.3 mg, but it isn’t always clear how much is actually included in supplements – some can contain 20 mg or even as much as 100 mg per pill of biotin. The communication includes recommendations for patients, health care professionals, laboratory personnel, and lab test manufacturers and developers.
The full safety communication can be found on the FDA website, and problems with tests can be reported via the FDA’s MedWatch Voluntary Reporting Form.
Risk stratification of syncope patients can help determine duration of telemetry monitoring
Background: About half of ED patients with syncope of unknown etiology are admitted for telemetry monitoring. No consensus exists regarding the optimal duration of telemetry monitoring in these patients to detect underlying arrhythmia.

Study design: Prospective cohort study.
Setting: Six EDs in Canada during September 2010–March 2015.
Synopsis: Using the Canadian Syncope Risk Score, 5,581 adults who presented to the ED within 24 hours of a syncopal event were risk stratified as low, medium, or high risk for serious adverse events (arrhythmic vs. nonarrhythmic) and then followed for 30 days. Approximately half of arrhythmias were identified among low-risk patients within 2 hours of telemetry monitoring and within 6 hours of monitoring among medium- and high-risk patients. In the low-risk group, none experienced death or ventricular arrhythmia within 30 days. In the medium- and high-risk group, 91.7% of underlying arrhythmias were identified within 15 days. The study was limited by the lack of standardized approach in the use of outpatient cardiac rhythm monitoring, which may have resulted in arrhythmia underdetection.
Bottom line: Among ED patients with syncope of unknown etiology, approximately 47% of arrhythmias were detected after 2-6 hours of telemetry monitoring. Among medium- and high-risk patients, the majority of serious arrhythmias were identified within 15 days. Based on these results, the authors recommend the use of 15-day outpatient cardiac monitoring for medium- and high-risk patients.
Citation: Thiruganasambandamoorthy V et al. Duration of electrocardiographic monitoring of emergency department patients with syncope. Circulation. 2019 Mar 12;139(11):1396-406.
Dr. Roy is a hospitalist at Beth Israel Deaconess Medical Center and instructor in medicine at Harvard Medical School.
Background: About half of ED patients with syncope of unknown etiology are admitted for telemetry monitoring. No consensus exists regarding the optimal duration of telemetry monitoring in these patients to detect underlying arrhythmia.
Study design: Prospective cohort study.
Setting: Six EDs in Canada during September 2010–March 2015.
Synopsis: Using the Canadian Syncope Risk Score, 5,581 adults who presented to the ED within 24 hours of a syncopal event were risk stratified as low, medium, or high risk for serious adverse events (arrhythmic vs. nonarrhythmic) and then followed for 30 days. Approximately half of arrhythmias were identified among low-risk patients within 2 hours of telemetry monitoring and within 6 hours of monitoring among medium- and high-risk patients. In the low-risk group, none experienced death or ventricular arrhythmia within 30 days. In the medium- and high-risk group, 91.7% of underlying arrhythmias were identified within 15 days. The study was limited by the lack of standardized approach in the use of outpatient cardiac rhythm monitoring, which may have resulted in arrhythmia underdetection.
Bottom line: Among ED patients with syncope of unknown etiology, approximately 47% of arrhythmias were detected after 2-6 hours of telemetry monitoring. Among medium- and high-risk patients, the majority of serious arrhythmias were identified within 15 days. Based on these results, the authors recommend the use of 15-day outpatient cardiac monitoring for medium- and high-risk patients.
Citation: Thiruganasambandamoorthy V et al. Duration of electrocardiographic monitoring of emergency department patients with syncope. Circulation. 2019 Mar 12;139(11):1396-406.
Dr. Roy is a hospitalist at Beth Israel Deaconess Medical Center and instructor in medicine at Harvard Medical School.
Statins cut long-term CVD risk in kids with familial hypercholesterolemia
Statins started in childhood for patients with familial hypercholesterolemia reduced progression of carotid thickening and cut the risk of cardiovascular disease 20 years later, according to authors of a long-term follow-up study.
There were no deaths and one cardiovascular event by the age of 39 years for patients in the observational study who had, as children, participated in a placebo-controlled, 2-year safety and efficacy study of pravastatin.
These positive effects on disease and a disease marker (carotid intima-media thickness) were observed even though only 20% of patients met LDL cholesterol goals, according to study senior authors John J.P. Kastelein, MD, PhD, and Barbara A. Hutten, PhD, of Amsterdam University Medical Centers in the Netherlands, and their colleagues.
“If corroborated, such findings would underscore the current pediatric guidelines, which recommend starting treatment from the age of 8 years or 10 years, with less-stringent targets than those for adults,” the investigators wrote in the report, which was published in the New England Journal of Medicine.
The study was based in part on follow-up visits with 184 of the original cohort of 214 patients with familial hypercholesterolemia in the 2-year pravastatin study, along with 77 of 95 unaffected siblings who had served as a control group in that study.
At the time of the 20-year follow-up, 79% of the familial hypercholesterolemia patients said they were using lipid-lowering medication, the investigators wrote.
The mean LDL cholesterol level at follow-up was 160.7 mg/dL for those with familial hypercholesterolemia, a drop of 32% when compared with the mean LDL cholesterol level at baseline in the original study, according to the investigators. By contrast, LDL cholesterol in the unaffected siblings was 121.9 mg/dL, up 24% from baseline.
Just 37 patients with familial hypercholesterolemia, or about 20%, reached the LDL cholesterol treatment target of less than 100 mg/dL, the investigators wrote.
At the start of the original trial, carotid intima-media thickness was greater in patients with familial hypercholesterolemia, compared with their unaffected siblings, with a mean difference of 0.012 mm (95% confidence interval, 0.002-0.021) after adjustment for age and sex.
Some 20 years later, the mean difference in thickness for patients with familial hypercholesterolemia and unaffected siblings, was 0.555 mm and 0.551 mm, respectively, for a mean difference of just 0.008 mm (95% CI, –0.009 to 0.026) after adjustments.
Data on cardiovascular events and deaths for affected parents was collected, as each child in the study had a parent with confirmed familial hypercholesterolemia, the investigators wrote.
A total of 7% of affected parents had died of MI before the age of 40 years, whereas there were no deaths from cardiovascular causes in all 214 patients with familial hypercholesterolemia from the original study.
Similarly, about a quarter of affected parents had a cardiovascular event before age 40, whereas there was only one event recorded in the patients in the study. That event, angina pectoris resulting in percutaneous coronary intervention, occurred in a patient who stopped taking the drug at the end of the trial, the investigators wrote.
The study was supported by a grant from the AMC Foundation. The study authors reported disclosures related to numerous pharmaceutical companies and government, nonprofit, or academic entities.
SOURCE: Kastelein JJP et al. N Engl J Med. 2019;381:1547-56.
FROM THE NEW ENGLAND JOURNAL OF MEDICINE
Transcatheter TR repair tops medical management
SAN FRANCISCO – Survival after 12 months was more likely with transcatheter repair of tricuspid regurgitation instead of guideline-directed medical therapy, and patients were less likely to be rehospitalized with heart failure, in a propensity-matched case-control study presented at the Transcatheter Cardiovascular Therapeutics annual meeting.
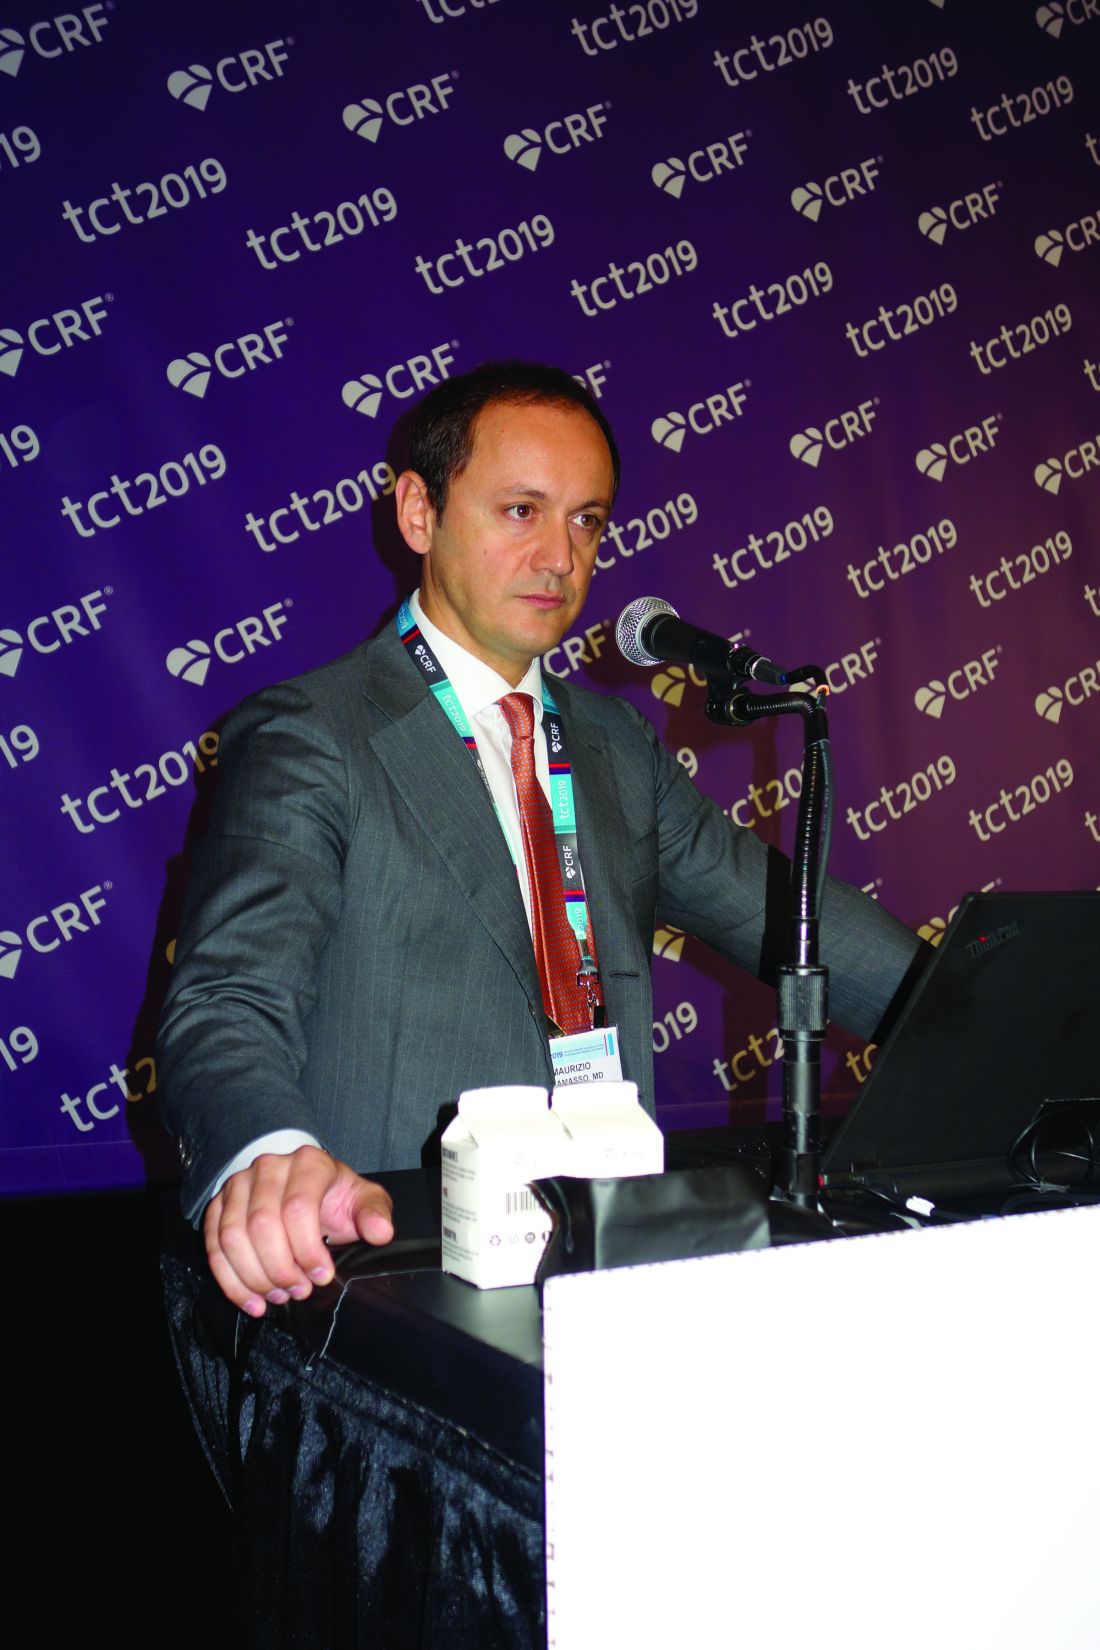
Tricuspid regurgitation carries a substantial burden of morbidity and mortality, but there hasn’t been great success with surgical approaches, so several trials are underway assessing transcatheter repair. It’s unclear at the moment whether it will beat medical management, which generally includes diuretics and symptom relief, said lead investigator Maurizio Taramasso, MD, PhD, a cardiac surgeon and interventional cardiologist at the University Hospital of Zürich.
Dr. Taramasso and colleagues wanted to take a look at the issue pending results of the randomized trials. “There’s still a lot of uncertainty in regard to what we can do for the patient by reducing tricuspid regurgitation. [There are] no data showing that reducing tricuspid regurgitation improves survival,” he said at the meeting.
The investigators matched 268 patients from the international Transcatheter Tricuspid Valve Therapies registry treated during 2016-2018 with 268 medical-management patients from the Mayo Clinic in Rochester, Minn., and Leiden (the Netherlands) University, based on age, European System for Cardiac Operative Risk Evaluation II scores, and systolic pulmonary artery pressure, the major predictor of poor outcomes in tricuspid regurgitation.
Even with matching, transcatheter patients were worse off, which is probably why they had valve repair in the first place, Dr. Taramasso said at the meeting sponsored by the Cardiovascular Research Foundation. The baseline burden of right ventricular dysfunction, heart failure, mitral regurgitation, atrial fibrillation, and pacemaker placement were all significantly higher in the transcatheter group.
Even so, transcatheter patients had lower 1-year mortality (23% vs. 36%; P = .001) and fewer heart failure rehospitalizations (32% vs. 49%, P less than .0001). Transcatheter repair was associated with greater survival and freedom from heart failure rehospitalization (HR, 0.60; 95% CI, 0.46-0.79; P = .003), which remained significant after adjusting for sex, New York Heart Association functional class, right ventricular dysfunction, and atrial fibrillation (HR, 0.39; 95% CI, 0.26-0.59; P less than .0001), and after further adjustment for mitral regurgitation and pacemaker/defibrillator placement (HR, 0.35; 95% CI, 0.23-0.54; P less than .0001). Subgroup analyses based on mitral regurgitation severity, pulmonary artery pressure, and other factors all favored repair.
“This is an important set of data to show that, indeed, fixing the tricuspid valve does lead to better outcomes, and perhaps we can do that with a transcatheter approach,” said Robert Bonow, MD, a professor of cardiology at Northwestern University, Chicago, after hearing the presentation.
The fact that transcatheter patients were sicker when they were treated is reassuring, added moderator Ajay Kirtane, MD, an interventional cardiologist and associate professor of medicine at Columbia University, New York.
The success rate for the procedure, which was to be alive at the end of it, with the device successfully implanted, the delivery system retrieved, and residual tricuspid regurgitation (TR) less than 3+, was 86%, and 85% of patients were treated with MitraClip, most with two or three clips. Outcomes were similar, but not worse, than medical management when TR wasn’t significantly reduced.
Operators were highly experienced, there were no emergent conversions to surgery, and patients tolerated the approach “pretty well,” Dr. Taramasso said. The lesson is that “we should really try to reduce TR, but just a little bit is not enough.” Overall, “we probably need better devices and better patient selection. With the data we are collecting, we’ll be able soon to known when late is too late, which patients should not be treated,” he said.
The study didn’t address postprocedure medications, but it’s been noted in the registry that medication use generally declines after a few months. Subjects tended to be aged in their mid-70s, and there were slightly more women than men.
The results were published online concurrently with Dr. Taramasso’s report in the Journal of the American College of Cardiology.
No company funding was reported. Dr. Taramasso is a consultant for Abbott Vascular, Boston Scientific, 4TECH, and CoreMedic; and has received speaker fees from Edwards Lifesciences.
SOURCE: Taramasso M et al. J Am Coll Cardiol. 2019 Sep 24. doi: 10.1016/j.jacc.2019.09.028.
SAN FRANCISCO – Survival after 12 months was more likely with transcatheter repair of tricuspid regurgitation instead of guideline-directed medical therapy, and patients were less likely to be rehospitalized with heart failure, in a propensity-matched case-control study presented at the Transcatheter Cardiovascular Therapeutics annual meeting.
Tricuspid regurgitation carries a substantial burden of morbidity and mortality, but there hasn’t been great success with surgical approaches, so several trials are underway assessing transcatheter repair. It’s unclear at the moment whether it will beat medical management, which generally includes diuretics and symptom relief, said lead investigator Maurizio Taramasso, MD, PhD, a cardiac surgeon and interventional cardiologist at the University Hospital of Zürich.
Dr. Taramasso and colleagues wanted to take a look at the issue pending results of the randomized trials. “There’s still a lot of uncertainty in regard to what we can do for the patient by reducing tricuspid regurgitation. [There are] no data showing that reducing tricuspid regurgitation improves survival,” he said at the meeting.
The investigators matched 268 patients from the international Transcatheter Tricuspid Valve Therapies registry treated during 2016-2018 with 268 medical-management patients from the Mayo Clinic in Rochester, Minn., and Leiden (the Netherlands) University, based on age, European System for Cardiac Operative Risk Evaluation II scores, and systolic pulmonary artery pressure, the major predictor of poor outcomes in tricuspid regurgitation.
Even with matching, transcatheter patients were worse off, which is probably why they had valve repair in the first place, Dr. Taramasso said at the meeting sponsored by the Cardiovascular Research Foundation. The baseline burden of right ventricular dysfunction, heart failure, mitral regurgitation, atrial fibrillation, and pacemaker placement were all significantly higher in the transcatheter group.
Even so, transcatheter patients had lower 1-year mortality (23% vs. 36%; P = .001) and fewer heart failure rehospitalizations (32% vs. 49%, P less than .0001). Transcatheter repair was associated with greater survival and freedom from heart failure rehospitalization (HR, 0.60; 95% CI, 0.46-0.79; P = .003), which remained significant after adjusting for sex, New York Heart Association functional class, right ventricular dysfunction, and atrial fibrillation (HR, 0.39; 95% CI, 0.26-0.59; P less than .0001), and after further adjustment for mitral regurgitation and pacemaker/defibrillator placement (HR, 0.35; 95% CI, 0.23-0.54; P less than .0001). Subgroup analyses based on mitral regurgitation severity, pulmonary artery pressure, and other factors all favored repair.
“This is an important set of data to show that, indeed, fixing the tricuspid valve does lead to better outcomes, and perhaps we can do that with a transcatheter approach,” said Robert Bonow, MD, a professor of cardiology at Northwestern University, Chicago, after hearing the presentation.
The fact that transcatheter patients were sicker when they were treated is reassuring, added moderator Ajay Kirtane, MD, an interventional cardiologist and associate professor of medicine at Columbia University, New York.
The success rate for the procedure, which was to be alive at the end of it, with the device successfully implanted, the delivery system retrieved, and residual tricuspid regurgitation (TR) less than 3+, was 86%, and 85% of patients were treated with MitraClip, most with two or three clips. Outcomes were similar, but not worse, than medical management when TR wasn’t significantly reduced.
Operators were highly experienced, there were no emergent conversions to surgery, and patients tolerated the approach “pretty well,” Dr. Taramasso said. The lesson is that “we should really try to reduce TR, but just a little bit is not enough.” Overall, “we probably need better devices and better patient selection. With the data we are collecting, we’ll be able soon to known when late is too late, which patients should not be treated,” he said.
The study didn’t address postprocedure medications, but it’s been noted in the registry that medication use generally declines after a few months. Subjects tended to be aged in their mid-70s, and there were slightly more women than men.
The results were published online concurrently with Dr. Taramasso’s report in the Journal of the American College of Cardiology.
No company funding was reported. Dr. Taramasso is a consultant for Abbott Vascular, Boston Scientific, 4TECH, and CoreMedic; and has received speaker fees from Edwards Lifesciences.
SOURCE: Taramasso M et al. J Am Coll Cardiol. 2019 Sep 24. doi: 10.1016/j.jacc.2019.09.028.
REPORTING FROM TCT 2019
Low LDL-C and blood pressure can reduce lifetime CVD risk by 80%
PARIS – Over the course of years and decades, lower LDL cholesterol levels and lower systolic blood pressure can reduce the lifetime risk of cardiovascular disease by up to 80%, according to a new study.

“What we found is that lifetime exposure to the combination of lower LDL and lower systolic blood pressure is associated with independent, additive, and dose-dependent effects on the lifetime risk of cardiovascular disease,” said the study’s senior author, Brian Ference, MD, speaking at the annual congress of the European Society of Cardiology. “The data seem to confirm that most cardiovascular events are preventable, and suggest that most cardiovascular events can be prevented, with prolonged exposure to modestly lower LDL cholesterol and systolic blood pressure.”
Any reduction of LDL-C and systolic blood pressure (SBP), in any combination, was associated with a lower lifetime risk of cardiovascular disease (CVD) in the study, which took advantage of the United Kingdom’s large Biobank to identify individuals with genetically lower LDL-C and blood pressure levels. The relationship was dose-dependent and showed a log-linear relationship to the combined absolute LDL-C and SBP differences, said Dr. Ference, professor and executive director of the Centre for Naturally Randomised Trials at the University of Cambridge, England.
The results validate current guidelines that focus on a lifetime approach to cardiovascular risk reduction and support a focus on therapeutic lifestyle interventions for individuals at all levels of risk for cardiovascular events, said Dr. Ference. He foresees the results shaping new risk-estimating algorithms and informing the next round of prevention guidelines.
Previous studies had suggested that long-term exposure to lower levels of LDL-C and lower systolic blood pressure reduced cardiovascular risk, but the association hadn’t been fully quantified. Ideally, said Dr. Ference, the question would be answered by a long-term randomized controlled trial, but it would be decades before meaningful data would accrue, and such a trial is unlikely to be conducted.
Using data from 438,952 Biobank participants, Dr. Ference and coinvestigators sought to quantify the association between LDL-C, systolic blood pressure, and atherosclerotic CVD. Taking advantage of genetic variants known to be associated with both lower LDL-C and lower systolic blood pressure, the researchers constructed a “natural randomization” trial. This trial design is also known as Mendelian randomization.
First, the entire study population was randomized into those with exome variants associated with higher or lower LDL-C, which resulted in a mean 15-mg/dL difference between the arms. Then, each LDL-C arm was randomized into groups with exome variants associated with higher or lower SBP, resulting in a difference of 2.9-3 mm Hg between the blood pressure arms within each LDL arm. This randomization yielded a reference group, a group with lower LDL-C, a group with lower SBP, and a group with lower LDL-C and SBP.
For the total population, the mean LDL-C was 138 mg/dL, and the mean SBP was 137.8 mm Hg.
A total of 24,980 participants had coronary revascularization, a nonfatal myocardial infarction (MI), or coronary death – the composite primary outcome measure of major coronary events.
“What we found is that long-term exposure to the combination of 1 mmol/L [about 39 mg/dL] lower LDL and 10 mm/Hg lower blood pressure is associated with an 80% lifetime reduction in risk of cardiovascular events, a 75% reduction in the risk of MI, and 68% reduction in the long-term risk of cardiovascular death,” said Dr. Ference.
By breaking participants out into separate quartiles of LDL-C and SBP levels, and examining outcomes for each quartile independently, Dr. Ference and collaborators were able to ascertain that the salutary effects of lower LDL-C and SBP were independent of each other.
Looking at individual cardiovascular outcomes, “The effect of combined exposure to both lower LDL and lower systolic blood pressure appear to be quite similar across multiple composite cardiovascular outcomes,” said Dr. Ference; benefit was seen in risk of MI, stroke, and other vascular events.
Plotting out the amount of risk reduction against the genetic scores for LDL-C and SBP reduction showed a proportional relationship that was logarithmically linear. “These large proportional reductions in risk really suggest that, for LDL, systolic blood pressure, and their combination, the benefit really depends both on the magnitude and the duration of the exposure,” said Dr. Ference. The effect was seen regardless of age, gender, body mass index, and diabetes status; being a smoker slightly attenuated the effects of LDL-C and SBP.
The mean participant age was 65 years, and women made up 54% of the study population. Aside from lipid values and systolic blood pressure, there were no significant between-group differences.
From these findings, what message can clinicians take to their patients? “Benefit is a much greater motivator, rather than the nebulous concept of risk,” said Dr. Ference. “So if we begin to crystallize and give an estimate of how much someone can benefit – either from adhering to a healthy lifestyle, with specific goals for LDL and blood pressure reductions, or from encouraging them to remain compliant with their therapies, achieving those corresponding goals – we can quantify their expected clinical benefit and encourage them to invest in their health over the long term.”
Dr. Ference said that the actual mechanism by which lipids and blood pressure are lowered matters less than the amount and duration of lowering: “These data are really agnostic as to the mechanism by which either blood pressure or LDL – or apo-B–containing lipoproteins generally – and blood pressure are reduced. It really suggests that whatever mechanism by which an individual person can most effectively lower their LDL and blood pressure, that’s the best one for that person, if they can maintain that over time.”
Dr. Ference reported financial relationships, including research contracts, consulting arrangements, receipt of royalties, and being an owner or stockholder of more than a dozen pharmaceutical companies. The study was funded by the United Kingdom’s National Institute of Health Research and Medical Research Council, and by the British Heart Foundation.
SOURCE: Ference B. et al. ESC Congress 2019, Hot Line Session 3.
Jemma Hopewell, PhD, was the assigned discussant for the Mendelian randomization study of LDL-C and SBP’s effects on cardiovascular health. She placed the genetic epidemiological study within the framework of other short- and medium-term studies that have examined the effects of LDL-C and SBP on cardiovascular health.
“Let’s think about this in the context of other studies,” said Dr. Hopewell, asking what the study adds to what’s known about exposure to LDL-C and systolic blood pressure levels. Shorter-term clinical trials that tracked differences in LDL-C over about 5 years have shown a 20%-25% drop in cardiovascular risk, while medium-term observational studies have shown a decrease of about 30%.
Now, she said, Mendelian randomization studies such as this analysis of the UK Biobank data are showing larger effects with the lifelong exposure to lower LDL levels that genetic variants confer. “As you can see, a pattern emerges ... of larger effects on risk than might be anticipated from the short-term clinical trials.”
A similar pattern can be seen with SBP, with shorter-term clinical trials showing smaller reductions in CVD. Observational studies show more reduction in risk when participants are followed for longer periods, and studies such as the present one show the larger effects of a lifetime of lower blood pressure, said Dr. Hopewell.
In terms of the combined effects, “It’s for the first time today that we see these nice results in a Mendelian randomization framework. This is a very well conducted analysis.”
Still, she cited potential limitations that can inform interpretation of the study results. These include the fact that Biobank participants have been followed for just about 10 years at this point, with most participants still alive. “Therefore, it is unclear whether this truly reflects the lifetime risk of coronary events.”
Also, the paucity of ethnic variation in the Biobank cohort means generalization is problematic until studies are conducted across different ethnic groups, she said.
The study design leaves open the possibility for reverse causality given the fact that participant characteristics captured at the time of recruitment may be influenced by prior disease, said Dr. Hopewell.
She also cited the complication of pleiotropy that’s a known limitation of Mendelian randomization studies. Importantly, the study’s reliance on genetic variation means that results may not directly translate to long-term use of lipid-lowering medication and antihypertensives, she said.
Still, the effects seen with the Biobank population bolster the importance of prevention efforts. “This really is quite encouraging,” said Dr. Hopewell. “Small differences over a long period of time have a material impact on risk.”
Dr. Hopewell is associate professor and senior scientist in genetic epidemiology and clinical trials at Oxford Cardiovascular Science, University of Oxford, England. She disclosed research contracts from unspecified pharmaceutical companies, and she has a fellowship from the British Heart Foundation.
PARIS – Over the course of years and decades, lower LDL cholesterol levels and lower systolic blood pressure can reduce the lifetime risk of cardiovascular disease by up to 80%, according to a new study.
“What we found is that lifetime exposure to the combination of lower LDL and lower systolic blood pressure is associated with independent, additive, and dose-dependent effects on the lifetime risk of cardiovascular disease,” said the study’s senior author, Brian Ference, MD, speaking at the annual congress of the European Society of Cardiology. “The data seem to confirm that most cardiovascular events are preventable, and suggest that most cardiovascular events can be prevented, with prolonged exposure to modestly lower LDL cholesterol and systolic blood pressure.”
Any reduction of LDL-C and systolic blood pressure (SBP), in any combination, was associated with a lower lifetime risk of cardiovascular disease (CVD) in the study, which took advantage of the United Kingdom’s large Biobank to identify individuals with genetically lower LDL-C and blood pressure levels. The relationship was dose-dependent and showed a log-linear relationship to the combined absolute LDL-C and SBP differences, said Dr. Ference, professor and executive director of the Centre for Naturally Randomised Trials at the University of Cambridge, England.
The results validate current guidelines that focus on a lifetime approach to cardiovascular risk reduction and support a focus on therapeutic lifestyle interventions for individuals at all levels of risk for cardiovascular events, said Dr. Ference. He foresees the results shaping new risk-estimating algorithms and informing the next round of prevention guidelines.
Previous studies had suggested that long-term exposure to lower levels of LDL-C and lower systolic blood pressure reduced cardiovascular risk, but the association hadn’t been fully quantified. Ideally, said Dr. Ference, the question would be answered by a long-term randomized controlled trial, but it would be decades before meaningful data would accrue, and such a trial is unlikely to be conducted.
Using data from 438,952 Biobank participants, Dr. Ference and coinvestigators sought to quantify the association between LDL-C, systolic blood pressure, and atherosclerotic CVD. Taking advantage of genetic variants known to be associated with both lower LDL-C and lower systolic blood pressure, the researchers constructed a “natural randomization” trial. This trial design is also known as Mendelian randomization.
First, the entire study population was randomized into those with exome variants associated with higher or lower LDL-C, which resulted in a mean 15-mg/dL difference between the arms. Then, each LDL-C arm was randomized into groups with exome variants associated with higher or lower SBP, resulting in a difference of 2.9-3 mm Hg between the blood pressure arms within each LDL arm. This randomization yielded a reference group, a group with lower LDL-C, a group with lower SBP, and a group with lower LDL-C and SBP.
For the total population, the mean LDL-C was 138 mg/dL, and the mean SBP was 137.8 mm Hg.
A total of 24,980 participants had coronary revascularization, a nonfatal myocardial infarction (MI), or coronary death – the composite primary outcome measure of major coronary events.
“What we found is that long-term exposure to the combination of 1 mmol/L [about 39 mg/dL] lower LDL and 10 mm/Hg lower blood pressure is associated with an 80% lifetime reduction in risk of cardiovascular events, a 75% reduction in the risk of MI, and 68% reduction in the long-term risk of cardiovascular death,” said Dr. Ference.
By breaking participants out into separate quartiles of LDL-C and SBP levels, and examining outcomes for each quartile independently, Dr. Ference and collaborators were able to ascertain that the salutary effects of lower LDL-C and SBP were independent of each other.
Looking at individual cardiovascular outcomes, “The effect of combined exposure to both lower LDL and lower systolic blood pressure appear to be quite similar across multiple composite cardiovascular outcomes,” said Dr. Ference; benefit was seen in risk of MI, stroke, and other vascular events.
Plotting out the amount of risk reduction against the genetic scores for LDL-C and SBP reduction showed a proportional relationship that was logarithmically linear. “These large proportional reductions in risk really suggest that, for LDL, systolic blood pressure, and their combination, the benefit really depends both on the magnitude and the duration of the exposure,” said Dr. Ference. The effect was seen regardless of age, gender, body mass index, and diabetes status; being a smoker slightly attenuated the effects of LDL-C and SBP.
The mean participant age was 65 years, and women made up 54% of the study population. Aside from lipid values and systolic blood pressure, there were no significant between-group differences.
From these findings, what message can clinicians take to their patients? “Benefit is a much greater motivator, rather than the nebulous concept of risk,” said Dr. Ference. “So if we begin to crystallize and give an estimate of how much someone can benefit – either from adhering to a healthy lifestyle, with specific goals for LDL and blood pressure reductions, or from encouraging them to remain compliant with their therapies, achieving those corresponding goals – we can quantify their expected clinical benefit and encourage them to invest in their health over the long term.”
Dr. Ference said that the actual mechanism by which lipids and blood pressure are lowered matters less than the amount and duration of lowering: “These data are really agnostic as to the mechanism by which either blood pressure or LDL – or apo-B–containing lipoproteins generally – and blood pressure are reduced. It really suggests that whatever mechanism by which an individual person can most effectively lower their LDL and blood pressure, that’s the best one for that person, if they can maintain that over time.”
Dr. Ference reported financial relationships, including research contracts, consulting arrangements, receipt of royalties, and being an owner or stockholder of more than a dozen pharmaceutical companies. The study was funded by the United Kingdom’s National Institute of Health Research and Medical Research Council, and by the British Heart Foundation.
SOURCE: Ference B. et al. ESC Congress 2019, Hot Line Session 3.
REPORTING FROM ESC CONGRESS 2019
Better time data from in-hospital resuscitations
Benefits of an undocumented defibrillator feature
Research and quality improvement (QI) related to in-hospital cardiopulmonary resuscitation attempts (“codes” from here forward) are hampered significantly by the poor quality of data on time intervals from arrest onset to clinical interventions.1

In 2000, the American Heart Association’s (AHA) Emergency Cardiac Care Guidelines said that current data were inaccurate and that greater accuracy was “the key to future high-quality research”2 – but since then, the general situation has not improved: Time intervals reported by the national AHA-supported registry Get With the Guidelines–Resuscitation (GWTG-R, 200+ hospitals enrolled) include a figure from all hospitals for times to first defibrillation of 1 minute median and 0 minutes first interquartile.3 Such numbers are typical – when they are tracked at all – but they strain credulity, and prima facie evidence is available at most clinical simulation centers simply by timing simulated defibrillation attempts under realistic conditions, as in “mock codes.”4,5
Taking artificially short time-interval data from GWTG-R or other sources at face value can hide serious delays in response to in-hospital arrests. It can also lead to flawed studies and highly questionable conclusions.6
The key to accuracy of critical time intervals – the intervals from arrest to key interventions – is an accurate time of arrest.7 Codes are typically recorded in handwritten form, though they may later be transcribed or scanned into electronic records. The “start” of the code for unmonitored arrests and most monitored arrests is typically taken to be the time that a human bedside recorder, arriving at an unknown interval after the arrest, writes down the first intervention. Researchers acknowledged the problem of artificially short time intervals in 2005, but they did not propose a remedy.1 Since then, the problem of in-hospital resuscitation delays has received little to no attention in the professional literature.
Description of feature
To get better time data from unmonitored resuscitation attempts, it is necessary to use a “surrogate marker” – a stand-in or substitute event – for the time of arrest. This event should occur reliably for each code, and as near as possible to the actual time of arrest. The main early events in a code are starting basic CPR, paging the code, and moving the defibrillator (usually on a code cart) to the scene. Ideally these events occur almost simultaneously, but that is not consistently achieved.
There are significant problems with use of the first two events as surrogate markers: the time of starting CPR cannot be determined accurately, and paging the code is dependent on several intermediate steps that lead to inaccuracy. Furthermore, the times of both markers are recorded using clocks that are typically not synchronized with the clock used for recording the code (defibrillator clock or the human recorder’s timepiece). Reconciliation of these times with the code record, while not particularly difficult,8 is rarely if ever done.
Defibrillator Power On is recorded on the defibrillator timeline and thus does not need to be reconciled with the defibrillator clock, but it is not suitable as a surrogate marker because this time is highly variable: It often does not occur until the time that monitoring pads are placed. Moving the code cart to the scene, which must occur early in the code, is a much more valid surrogate marker, with the added benefit that it can be marked on the defibrillator timeline.
The undocumented feature described here provides that marker. This feature has been a part of the LIFEPAK 20/20e’s design since it was launched in 2002, but it has not been publicized until now and is not documented in the user manual.
Hospital defibrillators are connected to alternating-current (AC) power when not in use. When the defibrillator is moved to the scene of the code, it is obviously necessary to disconnect the defibrillator from the wall outlet, at which time “AC Power Loss” is recorded on the event record generated by the LIFEPAK 20/20e defibrillators. The defibrillator may be powered on up to 10 minutes later while retaining the AC Power Loss marker in the event record. This surrogate marker for the start time will be on the same timeline as other events recorded by the defibrillator, including times of first monitoring and shocks.
Once the event record is acquired, determining time intervals is accomplished by subtracting clock times (see example, Figure 1).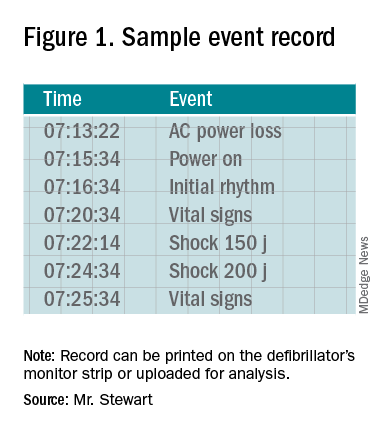
In the example, using AC Power Loss as the start time, time intervals from arrest to first monitoring (Initial Rhythm on the Event Record) and first shock were 3:12 (07:16:34 minus 07:13:22) and 8:42 (07:22:14 minus 07:13:22). Note that if Power On were used as the surrogate time of arrest in the example, the calculated intervals would be artificially shorter, by 2 min 12 sec.
Using this undocumented feature, any facility using LIFEPAK 20/20e defibrillators can easily measure critical time intervals during resuscitation attempts with much greater accuracy, including times to first monitoring and first defibrillation. Each defibrillator stores code summaries sufficient for dozens of events and accessing past data is simple. Analysis of the data can provide a much-improved measure of the facility’s speed of response as a baseline for QI.
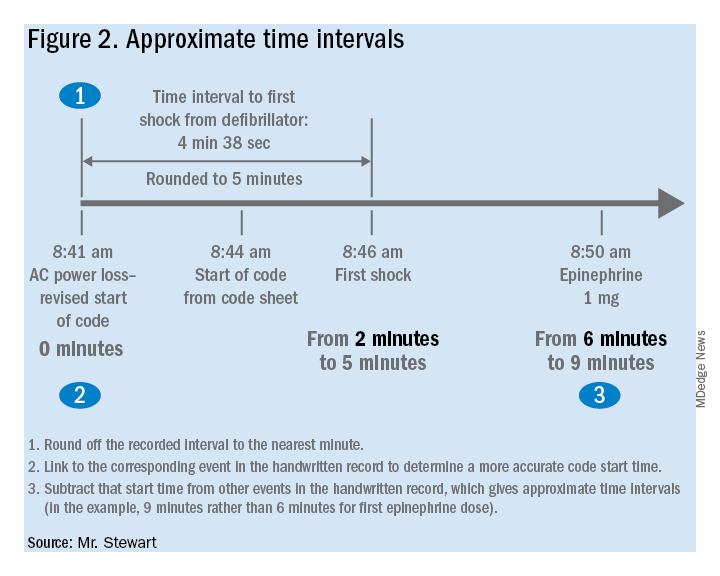
If desired, the time-interval data thus obtained can also be integrated with the handwritten record. The usual handwritten code sheet records times only in whole minutes, but with one of the more accurate intervals from the defibrillator – to first monitoring or first defibrillation – an adjusted time of arrest can be added to any code record to get other intervals that better approximate real-world response times.9
Research prospects
The feature opens multiple avenues for future research. Acquiring data by this method should be simple for any facility using LIFEPAK 20/20e defibrillators as its standard devices. Matching the existing handwritten code records with the time intervals obtained using this surrogate time marker will show how inaccurate the commonly reported data are. This can be done with a retrospective study comparing the time intervals from the archived event records with those from the handwritten records, to provide an example of the inaccuracy of data reported in the medical literature. The more accurate picture of time intervals can provide a much-needed yardstick for future research aimed at shortening response times.
The feature can facilitate aggregation of data across multiple facilities that use the LIFEPAK 20/20e as their standard defibrillator. Also, it is possible that other defibrillator manufacturers will duplicate this feature with their devices – it should produce valid data with any defibrillator – although there may be legal and technical obstacles to adopting it.
Combining data from multiple sites might lead to an important contribution to resuscitation research: a reasonably accurate overall survival curve for in-hospital tachyarrhythmic arrests. A commonly cited but crude guideline is that survival from tachyarrhythmic arrests decreases by 10%-15% per minute as defibrillation is delayed,10 but it seems unlikely that the relationship would be linear: Experience and the literature suggest that survival drops very quickly in the first few minutes, flattening out as elapsed time after arrest increases. Aggregating the much more accurate time-interval data from multiple facilities should produce a survival curve for in-hospital tachyarrhythmic arrests that comes much closer to reality.
Conclusion
It is unknown whether this feature will be used to improve the accuracy of reported code response times. It greatly facilitates acquiring more accurate times, but the task has never been especially difficult – particularly when balanced with the importance of better time data for QI and research.8 One possible impediment may be institutional obstacles to publishing studies with accurate response times due to concerns about public relations or legal exposure: The more accurate times will almost certainly be longer than those generally reported.
As was stated almost 2 decades ago and remains true today, acquiring accurate time-interval data is “the key to future high-quality research.”2 It is also key to improving any hospital’s quality of code response. As described in this article, better time data can easily be acquired. It is time for this important problem to be recognized and remedied.
Mr. Stewart has worked as a hospital nurse in Seattle for many years, and has numerous publications to his credit related to resuscitation issues. You can contact him at jastewart325@gmail.com.
References
1. Kaye W et al. When minutes count – the fallacy of accurate time documentation during in-hospital resuscitation. Resuscitation. 2005;65(3):285-90.
2. The American Heart Association in collaboration with the International Liaison Committee on Resuscitation. Guidelines 2000 for Cardiopulmonary Resuscitation and Emergency Cardiovascular Care, Part 4: the automated external defibrillator: key link in the chain of survival. Circulation. 2000;102(8 Suppl):I-60-76.
3. Chan PS et al. American Heart Association National Registry of Cardiopulmonary Resuscitation Investigators. Delayed time to defibrillation after in-hospital cardiac arrest. N Engl J Med. 2008 Jan 3;358(1):9-17. doi: 10.1056/NEJMoa0706467.
4. Hunt EA et al. Simulation of in-hospital pediatric medical emergencies and cardiopulmonary arrests: Highlighting the importance of the first 5 minutes. Pediatrics. 2008;121(1):e34-e43. doi: 10.1542/peds.2007-0029.
5. Reeson M et al. Defibrillator design and usability may be impeding timely defibrillation. Comm J Qual Patient Saf. 2018 Sep;44(9):536-544. doi: 10.1016/j.jcjq.2018.01.005.
6. Hunt EA et al. American Heart Association’s Get With The Guidelines – Resuscitation Investigators. Association between time to defibrillation and survival in pediatric in-hospital cardiac arrest with a first documented shockable rhythm JAMA Netw Open. 2018;1(5):e182643. doi: 10.1001/jamanetworkopen.2018.2643.
7. Cummins RO et al. Recommended guidelines for reviewing, reporting, and conducting research on in-hospital resuscitation: the in-hospital “Utstein” style. Circulation. 1997;95:2213-39.
8. Stewart JA. Determining accurate call-to-shock times is easy. Resuscitation. 2005 Oct;67(1):150-1.
9. In infrequent cases, the code cart and defibrillator may be moved to a deteriorating patient before a full arrest. Such occurrences should be analyzed separately or excluded from analysis.
10. Valenzuela TD et al. Estimating effectiveness of cardiac arrest interventions: a logistic regression survival model. Circulation. 1997;96(10):3308-13. doi: 10.1161/01.cir.96.10.3308.
Benefits of an undocumented defibrillator feature
Benefits of an undocumented defibrillator feature
Research and quality improvement (QI) related to in-hospital cardiopulmonary resuscitation attempts (“codes” from here forward) are hampered significantly by the poor quality of data on time intervals from arrest onset to clinical interventions.1
In 2000, the American Heart Association’s (AHA) Emergency Cardiac Care Guidelines said that current data were inaccurate and that greater accuracy was “the key to future high-quality research”2 – but since then, the general situation has not improved: Time intervals reported by the national AHA-supported registry Get With the Guidelines–Resuscitation (GWTG-R, 200+ hospitals enrolled) include a figure from all hospitals for times to first defibrillation of 1 minute median and 0 minutes first interquartile.3 Such numbers are typical – when they are tracked at all – but they strain credulity, and prima facie evidence is available at most clinical simulation centers simply by timing simulated defibrillation attempts under realistic conditions, as in “mock codes.”4,5
Taking artificially short time-interval data from GWTG-R or other sources at face value can hide serious delays in response to in-hospital arrests. It can also lead to flawed studies and highly questionable conclusions.6
The key to accuracy of critical time intervals – the intervals from arrest to key interventions – is an accurate time of arrest.7 Codes are typically recorded in handwritten form, though they may later be transcribed or scanned into electronic records. The “start” of the code for unmonitored arrests and most monitored arrests is typically taken to be the time that a human bedside recorder, arriving at an unknown interval after the arrest, writes down the first intervention. Researchers acknowledged the problem of artificially short time intervals in 2005, but they did not propose a remedy.1 Since then, the problem of in-hospital resuscitation delays has received little to no attention in the professional literature.
Description of feature
To get better time data from unmonitored resuscitation attempts, it is necessary to use a “surrogate marker” – a stand-in or substitute event – for the time of arrest. This event should occur reliably for each code, and as near as possible to the actual time of arrest. The main early events in a code are starting basic CPR, paging the code, and moving the defibrillator (usually on a code cart) to the scene. Ideally these events occur almost simultaneously, but that is not consistently achieved.
There are significant problems with use of the first two events as surrogate markers: the time of starting CPR cannot be determined accurately, and paging the code is dependent on several intermediate steps that lead to inaccuracy. Furthermore, the times of both markers are recorded using clocks that are typically not synchronized with the clock used for recording the code (defibrillator clock or the human recorder’s timepiece). Reconciliation of these times with the code record, while not particularly difficult,8 is rarely if ever done.
Defibrillator Power On is recorded on the defibrillator timeline and thus does not need to be reconciled with the defibrillator clock, but it is not suitable as a surrogate marker because this time is highly variable: It often does not occur until the time that monitoring pads are placed. Moving the code cart to the scene, which must occur early in the code, is a much more valid surrogate marker, with the added benefit that it can be marked on the defibrillator timeline.
The undocumented feature described here provides that marker. This feature has been a part of the LIFEPAK 20/20e’s design since it was launched in 2002, but it has not been publicized until now and is not documented in the user manual.
Hospital defibrillators are connected to alternating-current (AC) power when not in use. When the defibrillator is moved to the scene of the code, it is obviously necessary to disconnect the defibrillator from the wall outlet, at which time “AC Power Loss” is recorded on the event record generated by the LIFEPAK 20/20e defibrillators. The defibrillator may be powered on up to 10 minutes later while retaining the AC Power Loss marker in the event record. This surrogate marker for the start time will be on the same timeline as other events recorded by the defibrillator, including times of first monitoring and shocks.
Once the event record is acquired, determining time intervals is accomplished by subtracting clock times (see example, Figure 1).
In the example, using AC Power Loss as the start time, time intervals from arrest to first monitoring (Initial Rhythm on the Event Record) and first shock were 3:12 (07:16:34 minus 07:13:22) and 8:42 (07:22:14 minus 07:13:22). Note that if Power On were used as the surrogate time of arrest in the example, the calculated intervals would be artificially shorter, by 2 min 12 sec.
Using this undocumented feature, any facility using LIFEPAK 20/20e defibrillators can easily measure critical time intervals during resuscitation attempts with much greater accuracy, including times to first monitoring and first defibrillation. Each defibrillator stores code summaries sufficient for dozens of events and accessing past data is simple. Analysis of the data can provide a much-improved measure of the facility’s speed of response as a baseline for QI.
If desired, the time-interval data thus obtained can also be integrated with the handwritten record. The usual handwritten code sheet records times only in whole minutes, but with one of the more accurate intervals from the defibrillator – to first monitoring or first defibrillation – an adjusted time of arrest can be added to any code record to get other intervals that better approximate real-world response times.9
Research prospects
The feature opens multiple avenues for future research. Acquiring data by this method should be simple for any facility using LIFEPAK 20/20e defibrillators as its standard devices. Matching the existing handwritten code records with the time intervals obtained using this surrogate time marker will show how inaccurate the commonly reported data are. This can be done with a retrospective study comparing the time intervals from the archived event records with those from the handwritten records, to provide an example of the inaccuracy of data reported in the medical literature. The more accurate picture of time intervals can provide a much-needed yardstick for future research aimed at shortening response times.
The feature can facilitate aggregation of data across multiple facilities that use the LIFEPAK 20/20e as their standard defibrillator. Also, it is possible that other defibrillator manufacturers will duplicate this feature with their devices – it should produce valid data with any defibrillator – although there may be legal and technical obstacles to adopting it.
Combining data from multiple sites might lead to an important contribution to resuscitation research: a reasonably accurate overall survival curve for in-hospital tachyarrhythmic arrests. A commonly cited but crude guideline is that survival from tachyarrhythmic arrests decreases by 10%-15% per minute as defibrillation is delayed,10 but it seems unlikely that the relationship would be linear: Experience and the literature suggest that survival drops very quickly in the first few minutes, flattening out as elapsed time after arrest increases. Aggregating the much more accurate time-interval data from multiple facilities should produce a survival curve for in-hospital tachyarrhythmic arrests that comes much closer to reality.
Conclusion
It is unknown whether this feature will be used to improve the accuracy of reported code response times. It greatly facilitates acquiring more accurate times, but the task has never been especially difficult – particularly when balanced with the importance of better time data for QI and research.8 One possible impediment may be institutional obstacles to publishing studies with accurate response times due to concerns about public relations or legal exposure: The more accurate times will almost certainly be longer than those generally reported.
As was stated almost 2 decades ago and remains true today, acquiring accurate time-interval data is “the key to future high-quality research.”2 It is also key to improving any hospital’s quality of code response. As described in this article, better time data can easily be acquired. It is time for this important problem to be recognized and remedied.
Mr. Stewart has worked as a hospital nurse in Seattle for many years, and has numerous publications to his credit related to resuscitation issues. You can contact him at jastewart325@gmail.com.
References
1. Kaye W et al. When minutes count – the fallacy of accurate time documentation during in-hospital resuscitation. Resuscitation. 2005;65(3):285-90.
2. The American Heart Association in collaboration with the International Liaison Committee on Resuscitation. Guidelines 2000 for Cardiopulmonary Resuscitation and Emergency Cardiovascular Care, Part 4: the automated external defibrillator: key link in the chain of survival. Circulation. 2000;102(8 Suppl):I-60-76.
3. Chan PS et al. American Heart Association National Registry of Cardiopulmonary Resuscitation Investigators. Delayed time to defibrillation after in-hospital cardiac arrest. N Engl J Med. 2008 Jan 3;358(1):9-17. doi: 10.1056/NEJMoa0706467.
4. Hunt EA et al. Simulation of in-hospital pediatric medical emergencies and cardiopulmonary arrests: Highlighting the importance of the first 5 minutes. Pediatrics. 2008;121(1):e34-e43. doi: 10.1542/peds.2007-0029.
5. Reeson M et al. Defibrillator design and usability may be impeding timely defibrillation. Comm J Qual Patient Saf. 2018 Sep;44(9):536-544. doi: 10.1016/j.jcjq.2018.01.005.
6. Hunt EA et al. American Heart Association’s Get With The Guidelines – Resuscitation Investigators. Association between time to defibrillation and survival in pediatric in-hospital cardiac arrest with a first documented shockable rhythm JAMA Netw Open. 2018;1(5):e182643. doi: 10.1001/jamanetworkopen.2018.2643.
7. Cummins RO et al. Recommended guidelines for reviewing, reporting, and conducting research on in-hospital resuscitation: the in-hospital “Utstein” style. Circulation. 1997;95:2213-39.
8. Stewart JA. Determining accurate call-to-shock times is easy. Resuscitation. 2005 Oct;67(1):150-1.
9. In infrequent cases, the code cart and defibrillator may be moved to a deteriorating patient before a full arrest. Such occurrences should be analyzed separately or excluded from analysis.
10. Valenzuela TD et al. Estimating effectiveness of cardiac arrest interventions: a logistic regression survival model. Circulation. 1997;96(10):3308-13. doi: 10.1161/01.cir.96.10.3308.
CVD risk in black SLE patients 18 times higher than in whites
ATLANTA – Black race was the single greatest predictor of cardiovascular disease (CVD) events in systemic lupus erythematosus, with black patients having an 18-fold higher risk than white patients from 2 years before to 8 years after diagnosis, according to a review of 336 patients in the Georgia Lupus Registry that was presented at the annual meeting of the American College of Rheumatology.
The greatest risk was in the first 2 years after diagnosis, which has been reported before in white patients, but not before in a mostly (75%) black cohort.
Lupus is known to strike earlier and be more aggressive in black patients, so “we were expecting racial disparities in incident CVD, but” the magnitude of the increased risk “was very surprising. This study [identifies] a population that needs more attention, more targeted CVD prevention. We have to intervene early and be on top of everything,” especially for black patients, said lead investigator Shivani Garg, MD, an assistant professor of rheumatology at the University of Wisconsin–Madison.
Lipids, blood pressure, and the other usual CVD risk factors, as well as lupus itself, have to be optimally controlled; glucocorticoid use limited as much as possible; and there needs to be improved adherence to hydroxychloroquine, which has been shown to reduce CVD events in lupus patients, she said in an interview.
The 336 patients, mostly women (87%) from the Atlanta area, were diagnosed during 2002-2004 at a mean age of 40 years. Dr. Garg and associates reviewed CVD events – ischemic heart disease, stroke, transient ischemic attack, and peripheral vascular disease – and death over 16 years, beginning 2 years before diagnosis.
About 22% of subjects had a CVD event, most commonly within 2 years after diagnosis. The risk was 500% higher in black patients overall (adjusted hazard ratio, 6.4; 95% confidence interval, 2.4-17.5; P = .0003), and markedly higher in the first 10 years (aHR, 18; 95% CI, 2.2-141; P less than .0001). The findings were not adjusted for socioeconomic factors.
In the first 12 years of the study, the mean age at lupus diagnosis was 46 years and the first CVD event occurred at an average of 48 years. From 12 to 16 years follow-up, the mean age of diagnosis was 38 years, and the first CVD event occurred at 52 years.
Age older than 65 years (aHR, 7.9; 95% CI, 2.2-29) and the presence of disease-associated antibodies (aHR, 2.1; 95% CI, 1.01-4.4) increased CVD risk, which wasn’t surprising, but another predictor – discoid lupus – was unexpected (aHR, 3.2; 95% CI, 1.5-6.8). “A lot of times, we’ve considered discoid rash to be a milder form, but these patients have some kind of chronic, smoldering inflammation that is leading to atherosclerosis,” Dr. Garg said.
At diagnosis, 84% of the subjects had lupus hematologic disorders, 69% immunologic disorders, and 14% a discoid rash. CVD risk factor data were not collected.
There was no external funding, and the investigators reported no disclosures.
SOURCE: Garg S et al. Arthritis Rheumatol. 2019;71(suppl 10), Abstract 805.
REPORTING FROM ACR 2019
A New Valve—and a Change of Heart?
ANSWER
This ECG shows sinus rhythm with complete heart block and a junctional rhythm with a right-axis deviation. Additionally, ventricular depolarization in the precordial leads is suggestive of an anterior myocardial infarction.
Sinus rhythm is evidenced by the regular, steady progression of P waves with a P-P interval of about 90 beats/min. Complete atrioventricular dissociation indicates complete heart block.
A normal QRS duration of 106 ms at a rate of 56 beats/min supports the diagnosis of a junctional escape rhythm. Right-axis deviation is evidenced by an R axis of 120°.
Finally, poor R-wave progression with deep S waves in leads V1 through V5 is suggestive of an anterior myocardial infarction. However, in this case, there is no evidence of ischemia or history of infarction—so these are thought to be early postoperative findings.

Three days ago, a 64-year-old man underwent a tricuspid valve replacement for severe tricuspid regurgitation of unknown etiology. The surgical procedure included implantation of a 29-mm porcine valve and 2 epicardial right ventricular epicardial pacing leads.
The patient’s preoperative echocardiogram had shown severe tricuspid regurgitation with anterior leaflet prolapse and severe right atrial and ventricular enlargement. Preoperatively, the peak velocity of the tricuspid valve was 3.4 m/s, and the right ventricular systolic pressure was measured at 55 mm Hg. There was no mitral valvular disease or evidence of ischemia, and the overall left ventricular function was preserved, with a normal ejection fraction.
Preoperative history included 3-year progression of shortness of breath, dyspnea on exertion, and bilateral lower extremity edema. Over the past 2 months, he has had signs of hepatic congestion, including elevated serum transaminase, alkaline phosphatase, and direct bilirubin levels. A physical exam had revealed an enlarged liver that was tender to deep palpation. Social and family histories are noncontributory to the case as presented.
This morning, the patient is in no distress, sitting comfortably in a chair, and is alert and cooperative. Vital signs include a blood pressure of 118/64 mm Hg; pulse, 60 beats/min; respiratory rate, 16 breaths/min; and temperature, 96.4°F.
The surgical incision is clean, dry, and well approximated, and the patient is back to his preoperative weight. Pulmonary exam reveals clear breath sounds, with the exception of the left base, which demonstrates crackles that change with coughing. There are no wheezes. The cardiac exam reveals a regular rhythm at a rate of 60 beats/min, with a soft grade II/VI systolic murmur at the left lower sternal border. A late systolic friction rub is also evident. The abdomen is soft and nontender, with good bowel sounds and no organomegaly. Peripheral pulses are strong bilaterally, and there is trace pitting edema in both lower extremities. Neurologic exam is normal.
This morning’s ECG reveals a ventricular rate of 56 beats/min; PR interval, unmeasurable; QRS duration, 106 ms; QT/QTc interval, 400/386 ms; P axis, 36°; R axis, 120°; and T axis, 7°. What is your interpretation of this ECG?

Getting high heightens stroke, arrhythmia risks
Stoners, beware: , and people with cannabis use disorder are at a 50% greater risk of being hospitalized for arrhythmias, according to new research presented at the American Heart Association Scientific Sessions 2019.

An analysis of pooled data on nearly 44,000 participants in a cross-sectional survey showed that, among the 13.6% who reported using marijuana within the last 30 days, the adjusted odds ratio for young-onset stroke (aged 18-44 years), compared with non-users, was 2.75, reported Tarang Parekh, MBBS, a health policy researcher of George Mason University in Fairfax, Va., and colleagues.
In a separate study, a retrospective analysis of national inpatient data showed that people diagnosed with cannabis use disorder – a pathological pattern of impaired control, social impairment, risky behavior or physiological adaptation similar in nature to alcoholism – had a 47%-52% increased likelihood of hospitalization for an arrhythmia, reported Rikinkumar S. Patel, MD, a psychiatry resident at Griffin Memorial Hospital in Norman, Okla.
“As these [cannabis] products become increasingly used across the country, getting clearer, scientifically rigorous data is going to be important as we try to understand the overall health effects of cannabis,” said AHA President Robert Harrington, MD, of Stanford (Calif.) University in a statement.
Currently, use of both medical and recreational marijuana is fully legal in 11 U.S. states and the District of Columbia. Medical marijuana is legal with recreational use decriminalized (or penalties reduced) in 28 other states, and totally illegal in 11 other states, according to employee screening firm DISA Global Solutions.
Stroke study
In an oral presentation with simultaneous publication in the AHA journal Stroke, Dr. Parekh and colleagues presented an analysis of pooled data from the Behavioral Risk Factor Surveillance System (BRFSS), a nationally representative cross-sectional survey collected by the Centers for Disease Control and Prevention in 2016 and 2017.
They looked at baseline sociodemographic data and created multivariable logistic regression models with state fixed effects to determine whether marijuana use within the last 30 days was associated with young-onset stroke.
They identified 43,860 participants representing a weighted sample of 35.5 million Americans. Of the sample, 63.3% were male, and 13.6 % of all participants reported using marijuana in the last 30 days.
They found in an unadjusted model that marijuana users had an odds ratio for stroke, compared with nonusers, of 1.59 (P less than.1), and in a model adjusted for demographic factors (gender, race, ethnicity, and education) the OR increased to 1.76 (P less than .05).
When they threw risk behavior into the model (physical activity, body mass index, heavy drinking, and cigarette smoking), they saw that the OR for stroke shot up to 2.75 (P less than .01).
“Physicians should ask patients if they use cannabis and counsel them about its potential stroke risk as part of regular doctor visits,” Dr. Parekh said in a statement.
Arrhythmias study

Based on recent studies suggesting that cannabis use may trigger cardiovascular events, Dr. Patel and colleagues studied whether cannabis use disorder may be related to arrhythmias, approaching the question through hospital records.
“The effects of using cannabis are seen within 15 minutes and last for around 3 hours. At lower doses, it is linked to a rapid heartbeat. At higher doses, it is linked to a too-slow heartbeat,” he said in a statement.
Dr. Patel and colleagues conducted a retrospective analysis of the Nationwide Inpatient Sample from 2010-2014, a period during which medical marijuana became legal in several states and recreational marijuana became legal in Colorado and Washington. The sample is a database maintained by the Healthcare Cost and Utilization Project of the U.S. Office of Disease Prevention and Health Promotion.
They identified 570,557 patients aged 15-54 years with a primary diagnosis of arrhythmia, and compared them with a sample of 67,662,082 patients hospitalized with no arrhythmia diagnosed during the same period.
They found a 2.6% incidence of cannabis use disorder among patients hospitalized for arrhythmias. Patients with cannabis use disorder tended to be younger (15- to 24-years-old; OR, 4.23), male (OR, 1.70) and African American (OR, 2.70).
In regression analysis adjusted for demographics and comorbidities, cannabis use disorder was associated with higher odds of arrhythmia hospitalization in young patients, at 1.28 times among 15- to 24-year-olds (95% confidence interval, 1.229-1.346) and 1.52 times for 25- to 34-year-olds (95% CI, 1.469-1.578).
“As medical and recreational cannabis is legalized in many states, it is important to know the difference between therapeutic cannabis dosing for medical purposes and the consequences of cannabis abuse. We urgently need additional research to understand these issues,” Dr. Patel said.
“It’s not proving that there’s a direct link, but it’s raising a suggestion in an observational analysis that [this] indeed might be the case. What that means for clinicians is that, if you’re seeing a patient who is presenting with a symptomatic arrhythmia, adding cannabis usage to your list of questions as you begin to try to understand possible precipitating factors for this arrhythmia seems to be a reasonable thing to do,” Dr. Harrington commented.
Stoners, beware: , and people with cannabis use disorder are at a 50% greater risk of being hospitalized for arrhythmias, according to new research presented at the American Heart Association Scientific Sessions 2019.
An analysis of pooled data on nearly 44,000 participants in a cross-sectional survey showed that, among the 13.6% who reported using marijuana within the last 30 days, the adjusted odds ratio for young-onset stroke (aged 18-44 years), compared with non-users, was 2.75, reported Tarang Parekh, MBBS, a health policy researcher of George Mason University in Fairfax, Va., and colleagues.
In a separate study, a retrospective analysis of national inpatient data showed that people diagnosed with cannabis use disorder – a pathological pattern of impaired control, social impairment, risky behavior or physiological adaptation similar in nature to alcoholism – had a 47%-52% increased likelihood of hospitalization for an arrhythmia, reported Rikinkumar S. Patel, MD, a psychiatry resident at Griffin Memorial Hospital in Norman, Okla.
“As these [cannabis] products become increasingly used across the country, getting clearer, scientifically rigorous data is going to be important as we try to understand the overall health effects of cannabis,” said AHA President Robert Harrington, MD, of Stanford (Calif.) University in a statement.
Currently, use of both medical and recreational marijuana is fully legal in 11 U.S. states and the District of Columbia. Medical marijuana is legal with recreational use decriminalized (or penalties reduced) in 28 other states, and totally illegal in 11 other states, according to employee screening firm DISA Global Solutions.
Stroke study
In an oral presentation with simultaneous publication in the AHA journal Stroke, Dr. Parekh and colleagues presented an analysis of pooled data from the Behavioral Risk Factor Surveillance System (BRFSS), a nationally representative cross-sectional survey collected by the Centers for Disease Control and Prevention in 2016 and 2017.
They looked at baseline sociodemographic data and created multivariable logistic regression models with state fixed effects to determine whether marijuana use within the last 30 days was associated with young-onset stroke.
They identified 43,860 participants representing a weighted sample of 35.5 million Americans. Of the sample, 63.3% were male, and 13.6 % of all participants reported using marijuana in the last 30 days.
They found in an unadjusted model that marijuana users had an odds ratio for stroke, compared with nonusers, of 1.59 (P less than.1), and in a model adjusted for demographic factors (gender, race, ethnicity, and education) the OR increased to 1.76 (P less than .05).
When they threw risk behavior into the model (physical activity, body mass index, heavy drinking, and cigarette smoking), they saw that the OR for stroke shot up to 2.75 (P less than .01).
“Physicians should ask patients if they use cannabis and counsel them about its potential stroke risk as part of regular doctor visits,” Dr. Parekh said in a statement.
Arrhythmias study
Based on recent studies suggesting that cannabis use may trigger cardiovascular events, Dr. Patel and colleagues studied whether cannabis use disorder may be related to arrhythmias, approaching the question through hospital records.
“The effects of using cannabis are seen within 15 minutes and last for around 3 hours. At lower doses, it is linked to a rapid heartbeat. At higher doses, it is linked to a too-slow heartbeat,” he said in a statement.
Dr. Patel and colleagues conducted a retrospective analysis of the Nationwide Inpatient Sample from 2010-2014, a period during which medical marijuana became legal in several states and recreational marijuana became legal in Colorado and Washington. The sample is a database maintained by the Healthcare Cost and Utilization Project of the U.S. Office of Disease Prevention and Health Promotion.
They identified 570,557 patients aged 15-54 years with a primary diagnosis of arrhythmia, and compared them with a sample of 67,662,082 patients hospitalized with no arrhythmia diagnosed during the same period.
They found a 2.6% incidence of cannabis use disorder among patients hospitalized for arrhythmias. Patients with cannabis use disorder tended to be younger (15- to 24-years-old; OR, 4.23), male (OR, 1.70) and African American (OR, 2.70).
In regression analysis adjusted for demographics and comorbidities, cannabis use disorder was associated with higher odds of arrhythmia hospitalization in young patients, at 1.28 times among 15- to 24-year-olds (95% confidence interval, 1.229-1.346) and 1.52 times for 25- to 34-year-olds (95% CI, 1.469-1.578).
“As medical and recreational cannabis is legalized in many states, it is important to know the difference between therapeutic cannabis dosing for medical purposes and the consequences of cannabis abuse. We urgently need additional research to understand these issues,” Dr. Patel said.
“It’s not proving that there’s a direct link, but it’s raising a suggestion in an observational analysis that [this] indeed might be the case. What that means for clinicians is that, if you’re seeing a patient who is presenting with a symptomatic arrhythmia, adding cannabis usage to your list of questions as you begin to try to understand possible precipitating factors for this arrhythmia seems to be a reasonable thing to do,” Dr. Harrington commented.
REPORTING FROM AHA 2019
Aspirin for primary prevention reduces risk of CV events, increases bleeding
Background: Aspirin is beneficial in secondary prevention of stroke and MI. There is no consensus on its role in primary prevention of the same.
Study design: Systematic review and meta-analysis.
Setting: PubMed and Embase search on Cochrane from the earliest publication available through Nov. 1, 2018.
Synopsis: This meta-analysis included randomized, controlled trials that compared aspirin use versus no aspirin use in more than 1,000 participants without known cardiovascular (CV) disease. The primary CV outcome was a composite of CV mortality, nonfatal MI, and nonfatal stroke. The primary bleeding outcome was major bleeding (defined by individual studies). Thirteen studies enrolling 164,225 participants and including 1,050,511 participant-years were included. Compared with no aspirin use, aspirin use showed a reduction in composite CV outcomes (hazard ratio, 0.89; 95% confidence interval, 0.84-0.95; number needed to treat, 265) and an increased risk of major bleeding (HR, 1.43; 95% CI, 1.30-1.56; number needed to harm, 210). Limitations of the study include variations in data quality, outcome definitions, and aspirin doses among trials. The study authors advocate for including the lower risk of CV events and increased risk of major bleeding as part of discussions with patients about the use of aspirin for primary prevention.
Bottom line: Aspirin for primary prevention lowers risk of CV events and increases risk of major bleeding. Health care providers should include this as part of informed decision-making discussions with patients about the use of aspirin for primary prevention.
Citation: Zheng S et al. Association of aspirin use for primary prevention with cardiovascular events and bleeding events: A systematic review and meta-analysis. JAMA. 2019 Jan 22;321(3):277-87.
Dr. Radhakrishnan is a hospitalist at Beth Israel Deaconess Medical Center.