User login
PHiD-CV with 4CMenB safe, effective for infants
Concomitant administration of pneumococcal and meningococcal vaccines is not only safe but also offers the potential to improve vaccine uptake and reduce the number of doctors’ visits required for routine vaccination, advised Marco Aurelio P. Safadi, MD, PhD, of Santa Casa de São Paulo School of Medical Sciences, Brazil, and associates.

In a post hoc analysis of a phase 3b open-label study, Dr. Safadi and associates sought to evaluate immune response in pneumococcal non-typeable Haemophilus influenzae protein D conjugate vaccine (PHiD-CV) administered concomitantly with either meningococcal serogroup B (4CMenB) vaccine and CRM-conjugated meningococcal serogroup C vaccine (MenC-CRM) or with MenC-CRM alone using reduced schedules in 213 healthy infants aged 83-104 days. Study participants were enrolled and randomized to one of two groups between April 2011 and December 2014 at four sites in Brazil (Vaccine. 2019 Jul 18. doi: 10.1016/j.vaccine.2019.07.021).
Similar immune response was seen with vaccine serotypes and vaccine-related pneumococcal serotypes 6A and 19A in children who had received concomitant administration of PHiD-CV, 4CMenB, and MenC-CRM without 4CMenB.
Dr. Safadi and associates pointed out that PHiD-CV was given in accordance with a 3+1 dosing schedule, while 4CMenB used a reduced 2+1 schedule, which was observed to produce an immune response and provide an acceptable safety profile.
The findings yielded valuable information for the 2+1 PHiD-CV vaccination schedule, which was recently introduced in Brazil, the researchers said. The post-booster results further reflect the “immunogenicity following 3-dose priming.”
The post hoc nature of this study design effectively demonstrated that or with MenC-CRM alone, they explained.
The study was supported by GlaxoSmithKline (GSK) Biologicals. Three authors are employees of the GSK group of companies, and three others received a grant from the GSK companies, two of whom received compensation from other pharmaceutical companies. The institution of one of the authors received clinical trial fees from the GSK companies, and received personal fees/nonfinancial support/grants/other from the GSK companies and many other pharmaceutical companies.
Concomitant administration of pneumococcal and meningococcal vaccines is not only safe but also offers the potential to improve vaccine uptake and reduce the number of doctors’ visits required for routine vaccination, advised Marco Aurelio P. Safadi, MD, PhD, of Santa Casa de São Paulo School of Medical Sciences, Brazil, and associates.
In a post hoc analysis of a phase 3b open-label study, Dr. Safadi and associates sought to evaluate immune response in pneumococcal non-typeable Haemophilus influenzae protein D conjugate vaccine (PHiD-CV) administered concomitantly with either meningococcal serogroup B (4CMenB) vaccine and CRM-conjugated meningococcal serogroup C vaccine (MenC-CRM) or with MenC-CRM alone using reduced schedules in 213 healthy infants aged 83-104 days. Study participants were enrolled and randomized to one of two groups between April 2011 and December 2014 at four sites in Brazil (Vaccine. 2019 Jul 18. doi: 10.1016/j.vaccine.2019.07.021).
Similar immune response was seen with vaccine serotypes and vaccine-related pneumococcal serotypes 6A and 19A in children who had received concomitant administration of PHiD-CV, 4CMenB, and MenC-CRM without 4CMenB.
Dr. Safadi and associates pointed out that PHiD-CV was given in accordance with a 3+1 dosing schedule, while 4CMenB used a reduced 2+1 schedule, which was observed to produce an immune response and provide an acceptable safety profile.
The findings yielded valuable information for the 2+1 PHiD-CV vaccination schedule, which was recently introduced in Brazil, the researchers said. The post-booster results further reflect the “immunogenicity following 3-dose priming.”
The post hoc nature of this study design effectively demonstrated that or with MenC-CRM alone, they explained.
The study was supported by GlaxoSmithKline (GSK) Biologicals. Three authors are employees of the GSK group of companies, and three others received a grant from the GSK companies, two of whom received compensation from other pharmaceutical companies. The institution of one of the authors received clinical trial fees from the GSK companies, and received personal fees/nonfinancial support/grants/other from the GSK companies and many other pharmaceutical companies.
Concomitant administration of pneumococcal and meningococcal vaccines is not only safe but also offers the potential to improve vaccine uptake and reduce the number of doctors’ visits required for routine vaccination, advised Marco Aurelio P. Safadi, MD, PhD, of Santa Casa de São Paulo School of Medical Sciences, Brazil, and associates.
In a post hoc analysis of a phase 3b open-label study, Dr. Safadi and associates sought to evaluate immune response in pneumococcal non-typeable Haemophilus influenzae protein D conjugate vaccine (PHiD-CV) administered concomitantly with either meningococcal serogroup B (4CMenB) vaccine and CRM-conjugated meningococcal serogroup C vaccine (MenC-CRM) or with MenC-CRM alone using reduced schedules in 213 healthy infants aged 83-104 days. Study participants were enrolled and randomized to one of two groups between April 2011 and December 2014 at four sites in Brazil (Vaccine. 2019 Jul 18. doi: 10.1016/j.vaccine.2019.07.021).
Similar immune response was seen with vaccine serotypes and vaccine-related pneumococcal serotypes 6A and 19A in children who had received concomitant administration of PHiD-CV, 4CMenB, and MenC-CRM without 4CMenB.
Dr. Safadi and associates pointed out that PHiD-CV was given in accordance with a 3+1 dosing schedule, while 4CMenB used a reduced 2+1 schedule, which was observed to produce an immune response and provide an acceptable safety profile.
The findings yielded valuable information for the 2+1 PHiD-CV vaccination schedule, which was recently introduced in Brazil, the researchers said. The post-booster results further reflect the “immunogenicity following 3-dose priming.”
The post hoc nature of this study design effectively demonstrated that or with MenC-CRM alone, they explained.
The study was supported by GlaxoSmithKline (GSK) Biologicals. Three authors are employees of the GSK group of companies, and three others received a grant from the GSK companies, two of whom received compensation from other pharmaceutical companies. The institution of one of the authors received clinical trial fees from the GSK companies, and received personal fees/nonfinancial support/grants/other from the GSK companies and many other pharmaceutical companies.
FROM VACCINE
Air pollution levels correlated with cardiorespiratory mortality, reduced life expectancy
particularly among lower-income populations, research suggests.

A study published in PLOS Medicine used vital registration and population data from across the United States for 1999-2015 to estimate the number of deaths and loss of life expectancy associated with four different models of concentrations of fine particulate matter pollution, and examine how that has changed over time.
While the current national ambient air quality standard for particle pollution is 12 mcg/m3 in almost all counties, the study found that in 1999, 59% of the 1,339 county units had concentrations above this level. At that time, the population-weighted average fine particulate matter pollution concentration for the entire country was 13.6mcg/m3. The highest level was seen in Fresno county in California, which had a fine particulate pollution concentration of 22.1 mcg/m3.
By 2015, national concentrations had declined to 8.0 mcg/m3, and the lowest observed concentration was 2.8 mcg/m3.
The investigators wrote, “Each model was applied to county-level cardiorespiratory death rates separately by sex and age group (5-year age groups from birth to 85 years and 85 years and older) because death rates vary by age group and sex, as might their associations with air pollution. From each model we estimated age-specific proportional increases in death rates (i.e. rate ratios) for each 1 mcg/m3 of PM2.5 [fine particulate matter].” The analysis revealed that fine particulate matter pollution above the lowest observed concentration of 2.8 mcg/m3 was associated with higher death rates from cardiorespiratory diseases.
Overall, researchers estimated that these higher levels contributed to 15,612 deaths from cardiorespiratory diseases in women and 14,757 deaths in men, representing 2.8% and 2.7% of all cardiorespiratory deaths, respectively. This amounted to 0.15 years of life expectancy lost in women and 0.13 years lost in men.
There was significant variation in the cost to life expectancy around the country. In the midwestern and Rocky Mountain counties in states such as New Mexico, Colorado, and Arizona, which had lower levels of air pollution, life expectancy loss was less than 0.05 years. But in southern states where the air pollution levels were highest, such as Arkansas, Oklahoma, Alabama, and around Los Angeles, the life expectancy loss was greater than 0.3 years.
“While current PM2.5 pollution is responsible for a significant mortality burden and loss of longevity, reductions in pollution since the late 1990s have benefited virtually the entire country, with the exception of 14 counties where PM2.5 increased slightly over this period,” wrote James E. Bennett, PhD, of the School of Public Health at Imperial College London and coauthors.
The primary limitation of the study is that this association between air pollution and cardiorespiratory health or life expectancy cannot be shown to be causal. Other pollutants and other environmental and behavioral factors that impact cardiorespiratory health may be significant. For example, including ozone and nitrogen dioxide levels in the models could result in different results in terms of the impact of PM2.5 on cardiorespiratory health.
The data highlighted that life expectancy loss associated with air pollution was larger in lower-income counties, those where a higher proportion of the population had a family income below the poverty line, and those where a higher proportion of the population were black or African American.
“This inequality in mortality burden occurs because lower-income counties, those with more poverty, with a greater proportion who are of black or African American race, or with a lower proportion who have graduated high school tend to have higher baseline death rates at any pollution level because of conditions associated with these covariates and hence experience a larger absolute number of deaths as a result of air pollution,” the authors wrote.
The study was funded by the U.S. Environmental Protection Agency and the Wellcome Trust. One author declared grants and personal fees from private industry, outside the submitted work.
SOURCE: Bennett JE et al. PLoS Med. 2019 Jul 23. doi: 10.1371/journal.pmed.1002856.
particularly among lower-income populations, research suggests.
A study published in PLOS Medicine used vital registration and population data from across the United States for 1999-2015 to estimate the number of deaths and loss of life expectancy associated with four different models of concentrations of fine particulate matter pollution, and examine how that has changed over time.
While the current national ambient air quality standard for particle pollution is 12 mcg/m3 in almost all counties, the study found that in 1999, 59% of the 1,339 county units had concentrations above this level. At that time, the population-weighted average fine particulate matter pollution concentration for the entire country was 13.6mcg/m3. The highest level was seen in Fresno county in California, which had a fine particulate pollution concentration of 22.1 mcg/m3.
By 2015, national concentrations had declined to 8.0 mcg/m3, and the lowest observed concentration was 2.8 mcg/m3.
The investigators wrote, “Each model was applied to county-level cardiorespiratory death rates separately by sex and age group (5-year age groups from birth to 85 years and 85 years and older) because death rates vary by age group and sex, as might their associations with air pollution. From each model we estimated age-specific proportional increases in death rates (i.e. rate ratios) for each 1 mcg/m3 of PM2.5 [fine particulate matter].” The analysis revealed that fine particulate matter pollution above the lowest observed concentration of 2.8 mcg/m3 was associated with higher death rates from cardiorespiratory diseases.
Overall, researchers estimated that these higher levels contributed to 15,612 deaths from cardiorespiratory diseases in women and 14,757 deaths in men, representing 2.8% and 2.7% of all cardiorespiratory deaths, respectively. This amounted to 0.15 years of life expectancy lost in women and 0.13 years lost in men.
There was significant variation in the cost to life expectancy around the country. In the midwestern and Rocky Mountain counties in states such as New Mexico, Colorado, and Arizona, which had lower levels of air pollution, life expectancy loss was less than 0.05 years. But in southern states where the air pollution levels were highest, such as Arkansas, Oklahoma, Alabama, and around Los Angeles, the life expectancy loss was greater than 0.3 years.
“While current PM2.5 pollution is responsible for a significant mortality burden and loss of longevity, reductions in pollution since the late 1990s have benefited virtually the entire country, with the exception of 14 counties where PM2.5 increased slightly over this period,” wrote James E. Bennett, PhD, of the School of Public Health at Imperial College London and coauthors.
The primary limitation of the study is that this association between air pollution and cardiorespiratory health or life expectancy cannot be shown to be causal. Other pollutants and other environmental and behavioral factors that impact cardiorespiratory health may be significant. For example, including ozone and nitrogen dioxide levels in the models could result in different results in terms of the impact of PM2.5 on cardiorespiratory health.
The data highlighted that life expectancy loss associated with air pollution was larger in lower-income counties, those where a higher proportion of the population had a family income below the poverty line, and those where a higher proportion of the population were black or African American.
“This inequality in mortality burden occurs because lower-income counties, those with more poverty, with a greater proportion who are of black or African American race, or with a lower proportion who have graduated high school tend to have higher baseline death rates at any pollution level because of conditions associated with these covariates and hence experience a larger absolute number of deaths as a result of air pollution,” the authors wrote.
The study was funded by the U.S. Environmental Protection Agency and the Wellcome Trust. One author declared grants and personal fees from private industry, outside the submitted work.
SOURCE: Bennett JE et al. PLoS Med. 2019 Jul 23. doi: 10.1371/journal.pmed.1002856.
particularly among lower-income populations, research suggests.
A study published in PLOS Medicine used vital registration and population data from across the United States for 1999-2015 to estimate the number of deaths and loss of life expectancy associated with four different models of concentrations of fine particulate matter pollution, and examine how that has changed over time.
While the current national ambient air quality standard for particle pollution is 12 mcg/m3 in almost all counties, the study found that in 1999, 59% of the 1,339 county units had concentrations above this level. At that time, the population-weighted average fine particulate matter pollution concentration for the entire country was 13.6mcg/m3. The highest level was seen in Fresno county in California, which had a fine particulate pollution concentration of 22.1 mcg/m3.
By 2015, national concentrations had declined to 8.0 mcg/m3, and the lowest observed concentration was 2.8 mcg/m3.
The investigators wrote, “Each model was applied to county-level cardiorespiratory death rates separately by sex and age group (5-year age groups from birth to 85 years and 85 years and older) because death rates vary by age group and sex, as might their associations with air pollution. From each model we estimated age-specific proportional increases in death rates (i.e. rate ratios) for each 1 mcg/m3 of PM2.5 [fine particulate matter].” The analysis revealed that fine particulate matter pollution above the lowest observed concentration of 2.8 mcg/m3 was associated with higher death rates from cardiorespiratory diseases.
Overall, researchers estimated that these higher levels contributed to 15,612 deaths from cardiorespiratory diseases in women and 14,757 deaths in men, representing 2.8% and 2.7% of all cardiorespiratory deaths, respectively. This amounted to 0.15 years of life expectancy lost in women and 0.13 years lost in men.
There was significant variation in the cost to life expectancy around the country. In the midwestern and Rocky Mountain counties in states such as New Mexico, Colorado, and Arizona, which had lower levels of air pollution, life expectancy loss was less than 0.05 years. But in southern states where the air pollution levels were highest, such as Arkansas, Oklahoma, Alabama, and around Los Angeles, the life expectancy loss was greater than 0.3 years.
“While current PM2.5 pollution is responsible for a significant mortality burden and loss of longevity, reductions in pollution since the late 1990s have benefited virtually the entire country, with the exception of 14 counties where PM2.5 increased slightly over this period,” wrote James E. Bennett, PhD, of the School of Public Health at Imperial College London and coauthors.
The primary limitation of the study is that this association between air pollution and cardiorespiratory health or life expectancy cannot be shown to be causal. Other pollutants and other environmental and behavioral factors that impact cardiorespiratory health may be significant. For example, including ozone and nitrogen dioxide levels in the models could result in different results in terms of the impact of PM2.5 on cardiorespiratory health.
The data highlighted that life expectancy loss associated with air pollution was larger in lower-income counties, those where a higher proportion of the population had a family income below the poverty line, and those where a higher proportion of the population were black or African American.
“This inequality in mortality burden occurs because lower-income counties, those with more poverty, with a greater proportion who are of black or African American race, or with a lower proportion who have graduated high school tend to have higher baseline death rates at any pollution level because of conditions associated with these covariates and hence experience a larger absolute number of deaths as a result of air pollution,” the authors wrote.
The study was funded by the U.S. Environmental Protection Agency and the Wellcome Trust. One author declared grants and personal fees from private industry, outside the submitted work.
SOURCE: Bennett JE et al. PLoS Med. 2019 Jul 23. doi: 10.1371/journal.pmed.1002856.
FROM PLOS MEDICINE
Key clinical point: Air pollution linked to reduced life expectancy, particularly in poorer areas.
Major finding: Fine particulate matter air pollution linked to 0.15 years of life expectancy lost in women and 0.13 years lost in men.
Study details: Population-wide data analysis for the United States.
Disclosures: The study was funded by the U.S. Environmental Protection Agency and the Wellcome Trust. One author declared grants and personal fees from private industry outside the submitted work.
Source: Bennett JE et al. PLoS Med. 2019 Jul 23. doi: 10.1371/journal.pmed.1002856.
An Algorithm to Identify PrEP-Potential Patients
Health care providers who do not have the time or tools to screen patients for HIV risk also may not be prescribing preexposure prophylaxis (PrEP). But help is on the way: NIH-funded researchers have come up with novel computerized methods to identify the patients PrEP could benefit.
In 2 separate studies, the researchers developed and validated algorithms that analyze electronic health records (EHR). In the first study, Harvard researchers used machine learning to create an HIV prediction algorithm using 2007 to 2015 data from > 1 million patients in Massachusetts. The model included variables such as diagnosis codes for HIV counseling or sexually transmitted infections (STIs), laboratory tests for HIV or STIs, and prescriptions for medications related to treating STIs.
The model was validated using data from nearly 600,000 other patients treated between 2011 and 2016. The prediction algorithm successfully distinguished with high precision between patients who did or did not acquire HIV and between those who did or did not receive a PrEP prescription.
The researchers found hundreds of potential missed opportunities. They point to > 9,500 people in the 2016 dataset with particularly high-risk scores who were not prescribed PrEP. A “striking outcome,” the researchers say, is that their analysis suggests that nearly 40% of new HIV cases might have been averted had clinicians received alerts to discuss and offer PrEP to patients with the highest 2% of risk scores.
In the second study, researchers used the EHRs of > 3.7 million patients who entered the Kaiser Permanente System Northern California between 2007 and 2014 to develop a model to predict HIV incidence, then validated the model with data from between 2015 and 2017. Of the original patient group, 784 developed HIV within 3 years of baseline. The study found that the model identified nearly half of the incident HIV cases among males by flagging only 2% of the general patient population.
Embedding the algorithm into the EHR, the lead investigator says, “could prompt providers to discuss PrEP with patients who are most likely to benefit.”
Health care providers who do not have the time or tools to screen patients for HIV risk also may not be prescribing preexposure prophylaxis (PrEP). But help is on the way: NIH-funded researchers have come up with novel computerized methods to identify the patients PrEP could benefit.
In 2 separate studies, the researchers developed and validated algorithms that analyze electronic health records (EHR). In the first study, Harvard researchers used machine learning to create an HIV prediction algorithm using 2007 to 2015 data from > 1 million patients in Massachusetts. The model included variables such as diagnosis codes for HIV counseling or sexually transmitted infections (STIs), laboratory tests for HIV or STIs, and prescriptions for medications related to treating STIs.
The model was validated using data from nearly 600,000 other patients treated between 2011 and 2016. The prediction algorithm successfully distinguished with high precision between patients who did or did not acquire HIV and between those who did or did not receive a PrEP prescription.
The researchers found hundreds of potential missed opportunities. They point to > 9,500 people in the 2016 dataset with particularly high-risk scores who were not prescribed PrEP. A “striking outcome,” the researchers say, is that their analysis suggests that nearly 40% of new HIV cases might have been averted had clinicians received alerts to discuss and offer PrEP to patients with the highest 2% of risk scores.
In the second study, researchers used the EHRs of > 3.7 million patients who entered the Kaiser Permanente System Northern California between 2007 and 2014 to develop a model to predict HIV incidence, then validated the model with data from between 2015 and 2017. Of the original patient group, 784 developed HIV within 3 years of baseline. The study found that the model identified nearly half of the incident HIV cases among males by flagging only 2% of the general patient population.
Embedding the algorithm into the EHR, the lead investigator says, “could prompt providers to discuss PrEP with patients who are most likely to benefit.”
Health care providers who do not have the time or tools to screen patients for HIV risk also may not be prescribing preexposure prophylaxis (PrEP). But help is on the way: NIH-funded researchers have come up with novel computerized methods to identify the patients PrEP could benefit.
In 2 separate studies, the researchers developed and validated algorithms that analyze electronic health records (EHR). In the first study, Harvard researchers used machine learning to create an HIV prediction algorithm using 2007 to 2015 data from > 1 million patients in Massachusetts. The model included variables such as diagnosis codes for HIV counseling or sexually transmitted infections (STIs), laboratory tests for HIV or STIs, and prescriptions for medications related to treating STIs.
The model was validated using data from nearly 600,000 other patients treated between 2011 and 2016. The prediction algorithm successfully distinguished with high precision between patients who did or did not acquire HIV and between those who did or did not receive a PrEP prescription.
The researchers found hundreds of potential missed opportunities. They point to > 9,500 people in the 2016 dataset with particularly high-risk scores who were not prescribed PrEP. A “striking outcome,” the researchers say, is that their analysis suggests that nearly 40% of new HIV cases might have been averted had clinicians received alerts to discuss and offer PrEP to patients with the highest 2% of risk scores.
In the second study, researchers used the EHRs of > 3.7 million patients who entered the Kaiser Permanente System Northern California between 2007 and 2014 to develop a model to predict HIV incidence, then validated the model with data from between 2015 and 2017. Of the original patient group, 784 developed HIV within 3 years of baseline. The study found that the model identified nearly half of the incident HIV cases among males by flagging only 2% of the general patient population.
Embedding the algorithm into the EHR, the lead investigator says, “could prompt providers to discuss PrEP with patients who are most likely to benefit.”
New measles outbreaks reported in Los Angeles and El Paso
according to the Centers for Disease Control and Prevention.
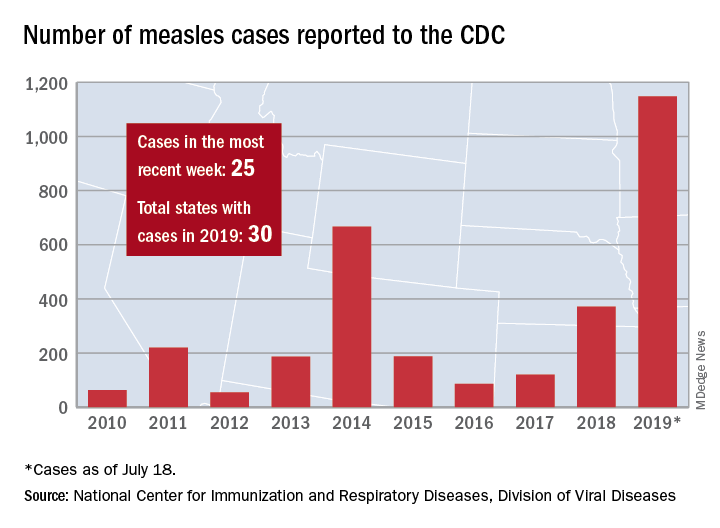
The total number of confirmed cases of measles in the United States is now up to 1,148 for the year, which is 25 more than the previous week, the CDC said on July 22. The highest 1-week total for the year was the 90 cases reported during the week of April 11.
The number of outbreaks is back up to five as California returned to the list after a 1-week absence and El Paso, Tex., made its first appearance of the year. The current outbreak in California – the state’s fifth – is occurring in Los Angeles, which is now up to 16 total cases in 2019. El Paso just reported its fourth case on July 17, and the city’s health department noted that “it had been more than 25 years since El Paso saw its last case of measles before these four recent cases.” Outbreaks also are ongoing in Rockland County, N.Y.; New York City; and three counties in Washington State.
States that joined the ranks of the measles-infected during this most recent reporting week were Alaska and Ohio, which brings the total number to 30 for the year, the CDC said.
The Alaska Department of Health and Social Services said that it “has confirmed a single case of measles in an unvaccinated teenager from the Kenai Peninsula who recently traveled out of state to Arizona via Seattle.” The Ohio case is a “young adult from Stark County [who] recently traveled to a state with confirmed measles cases,” according to the state’s health department.
according to the Centers for Disease Control and Prevention.
The total number of confirmed cases of measles in the United States is now up to 1,148 for the year, which is 25 more than the previous week, the CDC said on July 22. The highest 1-week total for the year was the 90 cases reported during the week of April 11.
The number of outbreaks is back up to five as California returned to the list after a 1-week absence and El Paso, Tex., made its first appearance of the year. The current outbreak in California – the state’s fifth – is occurring in Los Angeles, which is now up to 16 total cases in 2019. El Paso just reported its fourth case on July 17, and the city’s health department noted that “it had been more than 25 years since El Paso saw its last case of measles before these four recent cases.” Outbreaks also are ongoing in Rockland County, N.Y.; New York City; and three counties in Washington State.
States that joined the ranks of the measles-infected during this most recent reporting week were Alaska and Ohio, which brings the total number to 30 for the year, the CDC said.
The Alaska Department of Health and Social Services said that it “has confirmed a single case of measles in an unvaccinated teenager from the Kenai Peninsula who recently traveled out of state to Arizona via Seattle.” The Ohio case is a “young adult from Stark County [who] recently traveled to a state with confirmed measles cases,” according to the state’s health department.
according to the Centers for Disease Control and Prevention.
The total number of confirmed cases of measles in the United States is now up to 1,148 for the year, which is 25 more than the previous week, the CDC said on July 22. The highest 1-week total for the year was the 90 cases reported during the week of April 11.
The number of outbreaks is back up to five as California returned to the list after a 1-week absence and El Paso, Tex., made its first appearance of the year. The current outbreak in California – the state’s fifth – is occurring in Los Angeles, which is now up to 16 total cases in 2019. El Paso just reported its fourth case on July 17, and the city’s health department noted that “it had been more than 25 years since El Paso saw its last case of measles before these four recent cases.” Outbreaks also are ongoing in Rockland County, N.Y.; New York City; and three counties in Washington State.
States that joined the ranks of the measles-infected during this most recent reporting week were Alaska and Ohio, which brings the total number to 30 for the year, the CDC said.
The Alaska Department of Health and Social Services said that it “has confirmed a single case of measles in an unvaccinated teenager from the Kenai Peninsula who recently traveled out of state to Arizona via Seattle.” The Ohio case is a “young adult from Stark County [who] recently traveled to a state with confirmed measles cases,” according to the state’s health department.
Atherosclerotic disease risk persists decades after smoking cessation
Adults who quit smoking reduced their risk for peripheral artery disease in the short term, but remained at increased risk for up to 30 years, compared with never-smokers, based on data from more than 13,000 adults in a community-based study.

Most reports on the impact of smoking cessation on cardiovascular disease have focused on coronary heart disease (CHD), and stroke, while data on the effects of smoking cessation on peripheral artery disease (PAD) are limited, wrote Ning Ding, MBBS, SCM, of the Johns Hopkins Bloomberg School of Public Health, Baltimore, Md., and colleagues.
To compare the impact of smoking on PAD, CHD, and stroke, the researchers used data from the Atherosclerosis Risk in Communities (ARIC) study, which included 15,792 adults aged 45-64 years in four communities. The findings were published in the Journal of the American College of Cardiology.
The study population of 13,355 individuals had no baseline history of PAD, CHD, or stroke. Over a median 26 years of follow-up, the researchers identified 492 cases of PAD, 1,798 cases of CHD, and 1,106 cases of stroke.
The risk of all three conditions began to decline within 5 years of smoking cessation, which could be encouraging to smokers who wish to quit, the researchers noted. In addition, the longer the duration of smoking cessation, the lower the risk for all three conditions (See central illustration).
However, a significantly elevated risk remained for PAD for up to 30 years after smoking cessation and for CHD for up to 20 years after smoking cessation, compared with never-smokers.
The researchers also found a roughly fourfold increased risk for PAD for smokers who smoked for 40 or more pack-years, compared with never-smokers, which was greater than the 2.1 hazard ratio for CHD and 1.8 HR for stroke. In addition, current smokers of at least one pack per day had a significantly greater risk of PAD, compared with never-smokers (HR, 5.36) that was higher than the risk for CHD or stroke (HR, 2.38 and HR, 1.88, respectively).
The study findings were limited by several factors including the reliance on self-reports, potential misclassification of data, and the potential exclusion of mild PAD cases that did not require hospitalization, the researchers noted. However, the results support the value of encouraging smokers to quit and support the need to include PAD risk in public health information, they said. “Although public statements about smoking and [cardiovascular disease] have been focusing on CHD and stroke, our results indicate the need to take account of PAD as well for comprehensively acknowledging the effect of smoking on overall cardiovascular health,” they added.
The ARIC study was funded by the National Heart, Lung, and Blood Institute, National Institutes of Health. Lead author Dr. Ding had no financial conflicts to disclose; coauthors disclosed relationships with Bristol-Myers Squibb and Fukuda Denshi.
SOURCE: Ding N et al. J Am Coll Cardiol. 2019 Jul 22;74:498-507. doi: 10.1016/j.jacc.2019.06.003.
Although the pathophysiology of smoking and cardiovascular disease has yet to be teased out, the current study findings support the public health message that any and all smokers can improve their health by quitting any time: “It is never too early or too late to benefit from quitting,” wrote Nancy A. Rigotti, MD, and Mary M. McDermott, MD, in an accompanying editorial. The editorialists questioned whether the findings were generalizable to patients with mild PAD or those who are not hospitalized. However, they found the data consistent with previous studies suggesting that atherosclerosis is not homogeneous. “Differences in shear stress and hemodynamic forces among the femoral, coronary, and carotid arterial beds may also explain variability in associations of smoking and smoking cessation with the incidence of PAD versus myocardial infarction or stroke,” they said.
The findings also support the need to emphasize PAD in public health messages and provide an opportunity to educate patients about the risks of limb loss and impaired mobility associated with PAD, they said.
Many clinicians put a low priority on smoking cessation, the editorialists wrote, but “long-term tobacco abstinence is achievable using a chronic disease management approach resembling the strategies used to manage other risk factors,” they said. They cited the American College of Cardiology’s recently released “Expert Consensus Decision Pathway on Tobacco Cessation Treatment.” The pathway outlines advice for clinicians, including how to provide a brief intervention and resources along with advice to quit smoking.
Dr. Rigotti is affiliated with Harvard Medical School, Boston. Dr. McDermott is affiliated with Northwestern University, Chicago. Dr. Rigotti disclosed royalties from UpToDate, serving as a consultant for Achieve Life Sciences, and travel expenses from Pfizer for unpaid consulting. Dr. McDermott disclosed research funding from Regeneron, the National Heart, Lung, and Blood Institute, the National Institute on Aging, and the American Heart Association, plus research support from Chromadex, ReserveAge, Hershey, and ViroMed.
Although the pathophysiology of smoking and cardiovascular disease has yet to be teased out, the current study findings support the public health message that any and all smokers can improve their health by quitting any time: “It is never too early or too late to benefit from quitting,” wrote Nancy A. Rigotti, MD, and Mary M. McDermott, MD, in an accompanying editorial. The editorialists questioned whether the findings were generalizable to patients with mild PAD or those who are not hospitalized. However, they found the data consistent with previous studies suggesting that atherosclerosis is not homogeneous. “Differences in shear stress and hemodynamic forces among the femoral, coronary, and carotid arterial beds may also explain variability in associations of smoking and smoking cessation with the incidence of PAD versus myocardial infarction or stroke,” they said.
The findings also support the need to emphasize PAD in public health messages and provide an opportunity to educate patients about the risks of limb loss and impaired mobility associated with PAD, they said.
Many clinicians put a low priority on smoking cessation, the editorialists wrote, but “long-term tobacco abstinence is achievable using a chronic disease management approach resembling the strategies used to manage other risk factors,” they said. They cited the American College of Cardiology’s recently released “Expert Consensus Decision Pathway on Tobacco Cessation Treatment.” The pathway outlines advice for clinicians, including how to provide a brief intervention and resources along with advice to quit smoking.
Dr. Rigotti is affiliated with Harvard Medical School, Boston. Dr. McDermott is affiliated with Northwestern University, Chicago. Dr. Rigotti disclosed royalties from UpToDate, serving as a consultant for Achieve Life Sciences, and travel expenses from Pfizer for unpaid consulting. Dr. McDermott disclosed research funding from Regeneron, the National Heart, Lung, and Blood Institute, the National Institute on Aging, and the American Heart Association, plus research support from Chromadex, ReserveAge, Hershey, and ViroMed.
Although the pathophysiology of smoking and cardiovascular disease has yet to be teased out, the current study findings support the public health message that any and all smokers can improve their health by quitting any time: “It is never too early or too late to benefit from quitting,” wrote Nancy A. Rigotti, MD, and Mary M. McDermott, MD, in an accompanying editorial. The editorialists questioned whether the findings were generalizable to patients with mild PAD or those who are not hospitalized. However, they found the data consistent with previous studies suggesting that atherosclerosis is not homogeneous. “Differences in shear stress and hemodynamic forces among the femoral, coronary, and carotid arterial beds may also explain variability in associations of smoking and smoking cessation with the incidence of PAD versus myocardial infarction or stroke,” they said.
The findings also support the need to emphasize PAD in public health messages and provide an opportunity to educate patients about the risks of limb loss and impaired mobility associated with PAD, they said.
Many clinicians put a low priority on smoking cessation, the editorialists wrote, but “long-term tobacco abstinence is achievable using a chronic disease management approach resembling the strategies used to manage other risk factors,” they said. They cited the American College of Cardiology’s recently released “Expert Consensus Decision Pathway on Tobacco Cessation Treatment.” The pathway outlines advice for clinicians, including how to provide a brief intervention and resources along with advice to quit smoking.
Dr. Rigotti is affiliated with Harvard Medical School, Boston. Dr. McDermott is affiliated with Northwestern University, Chicago. Dr. Rigotti disclosed royalties from UpToDate, serving as a consultant for Achieve Life Sciences, and travel expenses from Pfizer for unpaid consulting. Dr. McDermott disclosed research funding from Regeneron, the National Heart, Lung, and Blood Institute, the National Institute on Aging, and the American Heart Association, plus research support from Chromadex, ReserveAge, Hershey, and ViroMed.
Adults who quit smoking reduced their risk for peripheral artery disease in the short term, but remained at increased risk for up to 30 years, compared with never-smokers, based on data from more than 13,000 adults in a community-based study.
Most reports on the impact of smoking cessation on cardiovascular disease have focused on coronary heart disease (CHD), and stroke, while data on the effects of smoking cessation on peripheral artery disease (PAD) are limited, wrote Ning Ding, MBBS, SCM, of the Johns Hopkins Bloomberg School of Public Health, Baltimore, Md., and colleagues.
To compare the impact of smoking on PAD, CHD, and stroke, the researchers used data from the Atherosclerosis Risk in Communities (ARIC) study, which included 15,792 adults aged 45-64 years in four communities. The findings were published in the Journal of the American College of Cardiology.
The study population of 13,355 individuals had no baseline history of PAD, CHD, or stroke. Over a median 26 years of follow-up, the researchers identified 492 cases of PAD, 1,798 cases of CHD, and 1,106 cases of stroke.
The risk of all three conditions began to decline within 5 years of smoking cessation, which could be encouraging to smokers who wish to quit, the researchers noted. In addition, the longer the duration of smoking cessation, the lower the risk for all three conditions (See central illustration).
However, a significantly elevated risk remained for PAD for up to 30 years after smoking cessation and for CHD for up to 20 years after smoking cessation, compared with never-smokers.
The researchers also found a roughly fourfold increased risk for PAD for smokers who smoked for 40 or more pack-years, compared with never-smokers, which was greater than the 2.1 hazard ratio for CHD and 1.8 HR for stroke. In addition, current smokers of at least one pack per day had a significantly greater risk of PAD, compared with never-smokers (HR, 5.36) that was higher than the risk for CHD or stroke (HR, 2.38 and HR, 1.88, respectively).
The study findings were limited by several factors including the reliance on self-reports, potential misclassification of data, and the potential exclusion of mild PAD cases that did not require hospitalization, the researchers noted. However, the results support the value of encouraging smokers to quit and support the need to include PAD risk in public health information, they said. “Although public statements about smoking and [cardiovascular disease] have been focusing on CHD and stroke, our results indicate the need to take account of PAD as well for comprehensively acknowledging the effect of smoking on overall cardiovascular health,” they added.
The ARIC study was funded by the National Heart, Lung, and Blood Institute, National Institutes of Health. Lead author Dr. Ding had no financial conflicts to disclose; coauthors disclosed relationships with Bristol-Myers Squibb and Fukuda Denshi.
SOURCE: Ding N et al. J Am Coll Cardiol. 2019 Jul 22;74:498-507. doi: 10.1016/j.jacc.2019.06.003.
Adults who quit smoking reduced their risk for peripheral artery disease in the short term, but remained at increased risk for up to 30 years, compared with never-smokers, based on data from more than 13,000 adults in a community-based study.
Most reports on the impact of smoking cessation on cardiovascular disease have focused on coronary heart disease (CHD), and stroke, while data on the effects of smoking cessation on peripheral artery disease (PAD) are limited, wrote Ning Ding, MBBS, SCM, of the Johns Hopkins Bloomberg School of Public Health, Baltimore, Md., and colleagues.
To compare the impact of smoking on PAD, CHD, and stroke, the researchers used data from the Atherosclerosis Risk in Communities (ARIC) study, which included 15,792 adults aged 45-64 years in four communities. The findings were published in the Journal of the American College of Cardiology.
The study population of 13,355 individuals had no baseline history of PAD, CHD, or stroke. Over a median 26 years of follow-up, the researchers identified 492 cases of PAD, 1,798 cases of CHD, and 1,106 cases of stroke.
The risk of all three conditions began to decline within 5 years of smoking cessation, which could be encouraging to smokers who wish to quit, the researchers noted. In addition, the longer the duration of smoking cessation, the lower the risk for all three conditions (See central illustration).
However, a significantly elevated risk remained for PAD for up to 30 years after smoking cessation and for CHD for up to 20 years after smoking cessation, compared with never-smokers.
The researchers also found a roughly fourfold increased risk for PAD for smokers who smoked for 40 or more pack-years, compared with never-smokers, which was greater than the 2.1 hazard ratio for CHD and 1.8 HR for stroke. In addition, current smokers of at least one pack per day had a significantly greater risk of PAD, compared with never-smokers (HR, 5.36) that was higher than the risk for CHD or stroke (HR, 2.38 and HR, 1.88, respectively).
The study findings were limited by several factors including the reliance on self-reports, potential misclassification of data, and the potential exclusion of mild PAD cases that did not require hospitalization, the researchers noted. However, the results support the value of encouraging smokers to quit and support the need to include PAD risk in public health information, they said. “Although public statements about smoking and [cardiovascular disease] have been focusing on CHD and stroke, our results indicate the need to take account of PAD as well for comprehensively acknowledging the effect of smoking on overall cardiovascular health,” they added.
The ARIC study was funded by the National Heart, Lung, and Blood Institute, National Institutes of Health. Lead author Dr. Ding had no financial conflicts to disclose; coauthors disclosed relationships with Bristol-Myers Squibb and Fukuda Denshi.
SOURCE: Ding N et al. J Am Coll Cardiol. 2019 Jul 22;74:498-507. doi: 10.1016/j.jacc.2019.06.003.
FROM THE JOURNAL OF THE AMERICAN COLLEGE OF CARDIOLOGY
Adjuvanted flu vaccine performs better than others in young children
according to an industry-funded synthesis of six studies.

The vaccine “offers significant advances over conventional inactivated influenza vaccines and presents an acceptable safety profile in children 6 months through 5 years of age,” Sanjay S. Patel, PhD, of Novartis Vaccines and Diagnostics, Cambridge, Mass., and associates wrote in the analysis, published in the International Journal of Infectious Diseases. “The noteworthy increases in antibody responses and decreases in influenza cases following vaccination suggest an alternative for use in a population that is heavily impacted by influenza disease.”
Children are, of course, vulnerable to flu. The Centers for Disease Control and Prevention reported that 186 children died of flu during the landmark 2017-2018 flu season. That’s the highest number of pediatric flu deaths since they became a notifiable condition in 2004 (exclusive of the 2009 pandemic, when 358 pediatric deaths were reported from April 15, 2009, to October 2, 2010).The CDC said the vaccine during that flu season had an overall effectiveness level of 40%. According to research of others, however, flu vaccines are less effective in younger children than in adolescents and adults (Vaccine. 2014;32[31]:3886-94; Cochrane Database Syst Rev. 2008. doi: 10.1002/14651858.CD004879.pub3).
Fluad – a MF59-adjuvanted inactivated trivalent seasonal influenza vaccine – is used in adults over 65 in the United States and 29 other countries, and it is approved for children aged 6 months through 23 months in Canada.
Dr. Patel and associates examined the results of six studies – one phase 1b, three phase 2, and two phase 3 – that tested Fluad with or without other vaccines in 11,942 children aged 6 months to 5 years. The studies, mostly multicenter, were conducted in various countries, mainly in Europe and South and Central America, from 2006 to 2012.
In general, children in the intervention groups in the studies received two doses of the Fluad vaccine 4 weeks apart: two 0.25-mL doses for children aged 6-35 months and two 0.5-mL doses for those aged 3 years or older. In most of the studies, parallel control groups received nonadjuvanted trivalent or quadrivalent influenza vaccines.
Most participants (93%-94%) completed the studies. Solicited adverse effects were common in all groups (72% in the Fluad group vs. 67% who received IIV3 vaccines), and generally mild to moderate and resolved in 1-3 days. Unsolicited adverse effects were similar (55% and 62%, respectively) in the two flu vaccine groups. The authors wrote that “these data reflect a safety profile consistent with other licensed inactivated influenza vaccines administered to children.”
As for results, Dr. Patel and colleagues said, “HI [hemagglutination inhibition] antibody responses to both homologous and heterologous influenza strains are higher following vaccination with aIIV3, and this increase in immunogenicity is observed across all age subgroups in children aged 6 months through 5 years, and most profound in the children 6 to 36 months.”
For example, in one of the phase 3 studies when the influenza viruses were antigenically matched (homologous) for A/H1N1 among the children aged 6-35 months seroconversion was 100% for allV3 (Fluad) and 38% for IIV3-1/IIV3-4 (trivalent/quadrivalent flu vaccines); among children aged 3-5 years seroconversion was 100% for allV3 and 82% for IIV3-1/IIV3-4. For AH3N2 homologous among children aged 6-35 months, seroconversion was 98% for allV3 and 44% for IIV3-1/IIV3-4. For the B strain homologous among children aged 6-35 months, seroconversion was 88% for allV3 and 19% for IIV3-1/IIV3-4; among children aged 3-5 years seroconversion for B was 99% for allV3 and 59% for IIV3-1/IIV3-4.
In the same study when the influenza viruses were antigenically mismatched (heterologous) for A/H1N1 among children of all ages 6 months to greater than 72 months, seroconversion was 96% for allV3 (Fluad) and 44% for IIV3-1/IIV3-4; for A/H3N2 it was 98% for allV3 and 49% for IIV3-1/IIV3-4, and for the B strain it was 10% for allV3 and 3% for IIV3-1/IIV3-4.
They added that “in addition, aIIV3 had the fastest onset of immunogenicity and longest persistence of immune response, which has implications for the real-world clinical setting, where the influenza season might start earlier than expected or last longer, and second (follow-up) vaccinations may be missed.”
Dr. Patel and associates said the MF59 adjuvant in Fluad “recruits immune cells (primarily monocytes, macrophages, neutrophils, and dendritic cells) at the site of injection and differentiates them into antigen-presenting cells. With an MF59-adjuvanted vaccine, more antigen is transported from the injection site to the draining lymph node, wherein MF59 leads to T-cell activation and an increased B-cell expansion and a greater number and diversity of antibodies.”
According to goodrx.com, one syringe of Fluad 0.5 mL costs $45-$74 with coupon. The same dose of Fluzone Quadrivalent, a flu vaccine recently approved by the Food and Drug Administration for use in young children aged 6-35 months, costs $31 with coupon.
The study was funded by Novartis Vaccines and Diagnostics and Seqirus (formerly part of Novartis Vaccines and Diagnostics). The study authors disclosed employment by Novartis and Seqirus.
SOURCE: Patel SS et al. Int J Infect Dis. 2019. doi: 10.1016/j.ijid.2019.05.009.
according to an industry-funded synthesis of six studies.
The vaccine “offers significant advances over conventional inactivated influenza vaccines and presents an acceptable safety profile in children 6 months through 5 years of age,” Sanjay S. Patel, PhD, of Novartis Vaccines and Diagnostics, Cambridge, Mass., and associates wrote in the analysis, published in the International Journal of Infectious Diseases. “The noteworthy increases in antibody responses and decreases in influenza cases following vaccination suggest an alternative for use in a population that is heavily impacted by influenza disease.”
Children are, of course, vulnerable to flu. The Centers for Disease Control and Prevention reported that 186 children died of flu during the landmark 2017-2018 flu season. That’s the highest number of pediatric flu deaths since they became a notifiable condition in 2004 (exclusive of the 2009 pandemic, when 358 pediatric deaths were reported from April 15, 2009, to October 2, 2010).The CDC said the vaccine during that flu season had an overall effectiveness level of 40%. According to research of others, however, flu vaccines are less effective in younger children than in adolescents and adults (Vaccine. 2014;32[31]:3886-94; Cochrane Database Syst Rev. 2008. doi: 10.1002/14651858.CD004879.pub3).
Fluad – a MF59-adjuvanted inactivated trivalent seasonal influenza vaccine – is used in adults over 65 in the United States and 29 other countries, and it is approved for children aged 6 months through 23 months in Canada.
Dr. Patel and associates examined the results of six studies – one phase 1b, three phase 2, and two phase 3 – that tested Fluad with or without other vaccines in 11,942 children aged 6 months to 5 years. The studies, mostly multicenter, were conducted in various countries, mainly in Europe and South and Central America, from 2006 to 2012.
In general, children in the intervention groups in the studies received two doses of the Fluad vaccine 4 weeks apart: two 0.25-mL doses for children aged 6-35 months and two 0.5-mL doses for those aged 3 years or older. In most of the studies, parallel control groups received nonadjuvanted trivalent or quadrivalent influenza vaccines.
Most participants (93%-94%) completed the studies. Solicited adverse effects were common in all groups (72% in the Fluad group vs. 67% who received IIV3 vaccines), and generally mild to moderate and resolved in 1-3 days. Unsolicited adverse effects were similar (55% and 62%, respectively) in the two flu vaccine groups. The authors wrote that “these data reflect a safety profile consistent with other licensed inactivated influenza vaccines administered to children.”
As for results, Dr. Patel and colleagues said, “HI [hemagglutination inhibition] antibody responses to both homologous and heterologous influenza strains are higher following vaccination with aIIV3, and this increase in immunogenicity is observed across all age subgroups in children aged 6 months through 5 years, and most profound in the children 6 to 36 months.”
For example, in one of the phase 3 studies when the influenza viruses were antigenically matched (homologous) for A/H1N1 among the children aged 6-35 months seroconversion was 100% for allV3 (Fluad) and 38% for IIV3-1/IIV3-4 (trivalent/quadrivalent flu vaccines); among children aged 3-5 years seroconversion was 100% for allV3 and 82% for IIV3-1/IIV3-4. For AH3N2 homologous among children aged 6-35 months, seroconversion was 98% for allV3 and 44% for IIV3-1/IIV3-4. For the B strain homologous among children aged 6-35 months, seroconversion was 88% for allV3 and 19% for IIV3-1/IIV3-4; among children aged 3-5 years seroconversion for B was 99% for allV3 and 59% for IIV3-1/IIV3-4.
In the same study when the influenza viruses were antigenically mismatched (heterologous) for A/H1N1 among children of all ages 6 months to greater than 72 months, seroconversion was 96% for allV3 (Fluad) and 44% for IIV3-1/IIV3-4; for A/H3N2 it was 98% for allV3 and 49% for IIV3-1/IIV3-4, and for the B strain it was 10% for allV3 and 3% for IIV3-1/IIV3-4.
They added that “in addition, aIIV3 had the fastest onset of immunogenicity and longest persistence of immune response, which has implications for the real-world clinical setting, where the influenza season might start earlier than expected or last longer, and second (follow-up) vaccinations may be missed.”
Dr. Patel and associates said the MF59 adjuvant in Fluad “recruits immune cells (primarily monocytes, macrophages, neutrophils, and dendritic cells) at the site of injection and differentiates them into antigen-presenting cells. With an MF59-adjuvanted vaccine, more antigen is transported from the injection site to the draining lymph node, wherein MF59 leads to T-cell activation and an increased B-cell expansion and a greater number and diversity of antibodies.”
According to goodrx.com, one syringe of Fluad 0.5 mL costs $45-$74 with coupon. The same dose of Fluzone Quadrivalent, a flu vaccine recently approved by the Food and Drug Administration for use in young children aged 6-35 months, costs $31 with coupon.
The study was funded by Novartis Vaccines and Diagnostics and Seqirus (formerly part of Novartis Vaccines and Diagnostics). The study authors disclosed employment by Novartis and Seqirus.
SOURCE: Patel SS et al. Int J Infect Dis. 2019. doi: 10.1016/j.ijid.2019.05.009.
according to an industry-funded synthesis of six studies.
The vaccine “offers significant advances over conventional inactivated influenza vaccines and presents an acceptable safety profile in children 6 months through 5 years of age,” Sanjay S. Patel, PhD, of Novartis Vaccines and Diagnostics, Cambridge, Mass., and associates wrote in the analysis, published in the International Journal of Infectious Diseases. “The noteworthy increases in antibody responses and decreases in influenza cases following vaccination suggest an alternative for use in a population that is heavily impacted by influenza disease.”
Children are, of course, vulnerable to flu. The Centers for Disease Control and Prevention reported that 186 children died of flu during the landmark 2017-2018 flu season. That’s the highest number of pediatric flu deaths since they became a notifiable condition in 2004 (exclusive of the 2009 pandemic, when 358 pediatric deaths were reported from April 15, 2009, to October 2, 2010).The CDC said the vaccine during that flu season had an overall effectiveness level of 40%. According to research of others, however, flu vaccines are less effective in younger children than in adolescents and adults (Vaccine. 2014;32[31]:3886-94; Cochrane Database Syst Rev. 2008. doi: 10.1002/14651858.CD004879.pub3).
Fluad – a MF59-adjuvanted inactivated trivalent seasonal influenza vaccine – is used in adults over 65 in the United States and 29 other countries, and it is approved for children aged 6 months through 23 months in Canada.
Dr. Patel and associates examined the results of six studies – one phase 1b, three phase 2, and two phase 3 – that tested Fluad with or without other vaccines in 11,942 children aged 6 months to 5 years. The studies, mostly multicenter, were conducted in various countries, mainly in Europe and South and Central America, from 2006 to 2012.
In general, children in the intervention groups in the studies received two doses of the Fluad vaccine 4 weeks apart: two 0.25-mL doses for children aged 6-35 months and two 0.5-mL doses for those aged 3 years or older. In most of the studies, parallel control groups received nonadjuvanted trivalent or quadrivalent influenza vaccines.
Most participants (93%-94%) completed the studies. Solicited adverse effects were common in all groups (72% in the Fluad group vs. 67% who received IIV3 vaccines), and generally mild to moderate and resolved in 1-3 days. Unsolicited adverse effects were similar (55% and 62%, respectively) in the two flu vaccine groups. The authors wrote that “these data reflect a safety profile consistent with other licensed inactivated influenza vaccines administered to children.”
As for results, Dr. Patel and colleagues said, “HI [hemagglutination inhibition] antibody responses to both homologous and heterologous influenza strains are higher following vaccination with aIIV3, and this increase in immunogenicity is observed across all age subgroups in children aged 6 months through 5 years, and most profound in the children 6 to 36 months.”
For example, in one of the phase 3 studies when the influenza viruses were antigenically matched (homologous) for A/H1N1 among the children aged 6-35 months seroconversion was 100% for allV3 (Fluad) and 38% for IIV3-1/IIV3-4 (trivalent/quadrivalent flu vaccines); among children aged 3-5 years seroconversion was 100% for allV3 and 82% for IIV3-1/IIV3-4. For AH3N2 homologous among children aged 6-35 months, seroconversion was 98% for allV3 and 44% for IIV3-1/IIV3-4. For the B strain homologous among children aged 6-35 months, seroconversion was 88% for allV3 and 19% for IIV3-1/IIV3-4; among children aged 3-5 years seroconversion for B was 99% for allV3 and 59% for IIV3-1/IIV3-4.
In the same study when the influenza viruses were antigenically mismatched (heterologous) for A/H1N1 among children of all ages 6 months to greater than 72 months, seroconversion was 96% for allV3 (Fluad) and 44% for IIV3-1/IIV3-4; for A/H3N2 it was 98% for allV3 and 49% for IIV3-1/IIV3-4, and for the B strain it was 10% for allV3 and 3% for IIV3-1/IIV3-4.
They added that “in addition, aIIV3 had the fastest onset of immunogenicity and longest persistence of immune response, which has implications for the real-world clinical setting, where the influenza season might start earlier than expected or last longer, and second (follow-up) vaccinations may be missed.”
Dr. Patel and associates said the MF59 adjuvant in Fluad “recruits immune cells (primarily monocytes, macrophages, neutrophils, and dendritic cells) at the site of injection and differentiates them into antigen-presenting cells. With an MF59-adjuvanted vaccine, more antigen is transported from the injection site to the draining lymph node, wherein MF59 leads to T-cell activation and an increased B-cell expansion and a greater number and diversity of antibodies.”
According to goodrx.com, one syringe of Fluad 0.5 mL costs $45-$74 with coupon. The same dose of Fluzone Quadrivalent, a flu vaccine recently approved by the Food and Drug Administration for use in young children aged 6-35 months, costs $31 with coupon.
The study was funded by Novartis Vaccines and Diagnostics and Seqirus (formerly part of Novartis Vaccines and Diagnostics). The study authors disclosed employment by Novartis and Seqirus.
SOURCE: Patel SS et al. Int J Infect Dis. 2019. doi: 10.1016/j.ijid.2019.05.009.
FROM INTERNATIONAL JOURNAL OF INFECTIOUS DISEASES
Adjuvanted influenza vaccine appears safe for at-risk children
according to a study in the International Journal of Infectious Diseases.

Sanjay S. Patel, PhD, of Novartis Vaccines and Diagnostics, Cambridge, Mass., and colleagues performed a retrospective analysis on an integrated dataset that drew from six randomized clinical trials comparing aIIV3 with nonadjuvanted trivalent inactivated influenza vaccine (IIV3). The dataset comprised 10,794 patients aged 6 months through 5 years, of whom 373 (3%) were deemed at risk of influenza complications after review of their medical history for conditions such as heart disease, asthma, and endocrine disorders.
The rates of solicited adverse events (such as erythema, diarrhea, fever, and localized swelling) were 74% in the aIIV3 group and 73% in the IIV3 group. The rates for any unsolicited adverse events (such as upper respiratory tract infection) for aIIV3 and IIV3 were 54% and 59%, respectively (Int J Infect Dis. 2019. doi: 10.1016/j.ijid.2019.04.023).
One of the six studies included in the dataset randomized 2,655 children for immunogenicity analyses, of whom 103 (4%) were deemed at risk. Hemagglutination inhibition assay geometric mean titers against homologous A/H1N1, A/H3N2, and B strains 21 days after the second of two doses of vaccines were two to three times higher in the aIIV3 than in the IIV3 group, which suggests that aIIV3 is more immunogenic than IIV3. As the investigators noted, this is likely because the adjuvanted vaccine induces a greater magnitude of immune response to the vaccine, something already lower in children than in adults, as well as more breadth of response, meaning the response goes beyond strains included in the vaccines.
The small number of at-risk children in the study poses a limitation on its findings. Dr. Patel and associates said that, regardless, the results of immunogenicity analyses were strong. “Overall, this analysis indicates that aIIV3 has a similar safety profile in young children with underlying medical conditions, consistent with other licensed inactivated influenza vaccines.”
Novartis Vaccines and Diagnostics originally funded the study, but was later acquired by CSL Group and now operates as Seqirus, which continued funding for the study. The authors were employees of one or the other of these companies.
according to a study in the International Journal of Infectious Diseases.
Sanjay S. Patel, PhD, of Novartis Vaccines and Diagnostics, Cambridge, Mass., and colleagues performed a retrospective analysis on an integrated dataset that drew from six randomized clinical trials comparing aIIV3 with nonadjuvanted trivalent inactivated influenza vaccine (IIV3). The dataset comprised 10,794 patients aged 6 months through 5 years, of whom 373 (3%) were deemed at risk of influenza complications after review of their medical history for conditions such as heart disease, asthma, and endocrine disorders.
The rates of solicited adverse events (such as erythema, diarrhea, fever, and localized swelling) were 74% in the aIIV3 group and 73% in the IIV3 group. The rates for any unsolicited adverse events (such as upper respiratory tract infection) for aIIV3 and IIV3 were 54% and 59%, respectively (Int J Infect Dis. 2019. doi: 10.1016/j.ijid.2019.04.023).
One of the six studies included in the dataset randomized 2,655 children for immunogenicity analyses, of whom 103 (4%) were deemed at risk. Hemagglutination inhibition assay geometric mean titers against homologous A/H1N1, A/H3N2, and B strains 21 days after the second of two doses of vaccines were two to three times higher in the aIIV3 than in the IIV3 group, which suggests that aIIV3 is more immunogenic than IIV3. As the investigators noted, this is likely because the adjuvanted vaccine induces a greater magnitude of immune response to the vaccine, something already lower in children than in adults, as well as more breadth of response, meaning the response goes beyond strains included in the vaccines.
The small number of at-risk children in the study poses a limitation on its findings. Dr. Patel and associates said that, regardless, the results of immunogenicity analyses were strong. “Overall, this analysis indicates that aIIV3 has a similar safety profile in young children with underlying medical conditions, consistent with other licensed inactivated influenza vaccines.”
Novartis Vaccines and Diagnostics originally funded the study, but was later acquired by CSL Group and now operates as Seqirus, which continued funding for the study. The authors were employees of one or the other of these companies.
according to a study in the International Journal of Infectious Diseases.
Sanjay S. Patel, PhD, of Novartis Vaccines and Diagnostics, Cambridge, Mass., and colleagues performed a retrospective analysis on an integrated dataset that drew from six randomized clinical trials comparing aIIV3 with nonadjuvanted trivalent inactivated influenza vaccine (IIV3). The dataset comprised 10,794 patients aged 6 months through 5 years, of whom 373 (3%) were deemed at risk of influenza complications after review of their medical history for conditions such as heart disease, asthma, and endocrine disorders.
The rates of solicited adverse events (such as erythema, diarrhea, fever, and localized swelling) were 74% in the aIIV3 group and 73% in the IIV3 group. The rates for any unsolicited adverse events (such as upper respiratory tract infection) for aIIV3 and IIV3 were 54% and 59%, respectively (Int J Infect Dis. 2019. doi: 10.1016/j.ijid.2019.04.023).
One of the six studies included in the dataset randomized 2,655 children for immunogenicity analyses, of whom 103 (4%) were deemed at risk. Hemagglutination inhibition assay geometric mean titers against homologous A/H1N1, A/H3N2, and B strains 21 days after the second of two doses of vaccines were two to three times higher in the aIIV3 than in the IIV3 group, which suggests that aIIV3 is more immunogenic than IIV3. As the investigators noted, this is likely because the adjuvanted vaccine induces a greater magnitude of immune response to the vaccine, something already lower in children than in adults, as well as more breadth of response, meaning the response goes beyond strains included in the vaccines.
The small number of at-risk children in the study poses a limitation on its findings. Dr. Patel and associates said that, regardless, the results of immunogenicity analyses were strong. “Overall, this analysis indicates that aIIV3 has a similar safety profile in young children with underlying medical conditions, consistent with other licensed inactivated influenza vaccines.”
Novartis Vaccines and Diagnostics originally funded the study, but was later acquired by CSL Group and now operates as Seqirus, which continued funding for the study. The authors were employees of one or the other of these companies.
FROM THE INTERNATIONAL JOURNAL OF INFECTIOUS DISEASES
VA Urges All Veterans to Get Tested
The US Department of Veterans Affairs (VA) has a well-established National HIV Program, says Dr. Richard Stone, executive in charge of the VHA. In fact, he notes, the VA is the single largest provider of HIV care in America and has treated 31,000 veterans for HIV.
Thus, the VA plays a critical role in the effort to establish tools and resources to eradicate HIV in the US, Stone says, “one veteran at a time.” To realize this “ambitious but achievable target,” the VA is:
- Offering HIV testing at least once to every veteran and more often to those at risk;
- Rapidly linking those who are diagnosed to effective treatment;
- Deploying an HIV health force to hard-hit areas of the country, expanding timely access to high-quality HIV care and prevention across the VA’s integrated network, with both face-to-face encounters and telehealth; and
- Offering pre-exposure prophylaxis (PrEP) when clinically appropriate.
The primary goal, Stone says, is for veterans with HIV or at risk for HIV to be able to access the best care “safely and free from stigma and discrimination.”
Resources and educational tools are available at www.hiv.va.gov, including recently updated fact sheets and videos for patients about PrEP
The US Department of Veterans Affairs (VA) has a well-established National HIV Program, says Dr. Richard Stone, executive in charge of the VHA. In fact, he notes, the VA is the single largest provider of HIV care in America and has treated 31,000 veterans for HIV.
Thus, the VA plays a critical role in the effort to establish tools and resources to eradicate HIV in the US, Stone says, “one veteran at a time.” To realize this “ambitious but achievable target,” the VA is:
- Offering HIV testing at least once to every veteran and more often to those at risk;
- Rapidly linking those who are diagnosed to effective treatment;
- Deploying an HIV health force to hard-hit areas of the country, expanding timely access to high-quality HIV care and prevention across the VA’s integrated network, with both face-to-face encounters and telehealth; and
- Offering pre-exposure prophylaxis (PrEP) when clinically appropriate.
The primary goal, Stone says, is for veterans with HIV or at risk for HIV to be able to access the best care “safely and free from stigma and discrimination.”
Resources and educational tools are available at www.hiv.va.gov, including recently updated fact sheets and videos for patients about PrEP
The US Department of Veterans Affairs (VA) has a well-established National HIV Program, says Dr. Richard Stone, executive in charge of the VHA. In fact, he notes, the VA is the single largest provider of HIV care in America and has treated 31,000 veterans for HIV.
Thus, the VA plays a critical role in the effort to establish tools and resources to eradicate HIV in the US, Stone says, “one veteran at a time.” To realize this “ambitious but achievable target,” the VA is:
- Offering HIV testing at least once to every veteran and more often to those at risk;
- Rapidly linking those who are diagnosed to effective treatment;
- Deploying an HIV health force to hard-hit areas of the country, expanding timely access to high-quality HIV care and prevention across the VA’s integrated network, with both face-to-face encounters and telehealth; and
- Offering pre-exposure prophylaxis (PrEP) when clinically appropriate.
The primary goal, Stone says, is for veterans with HIV or at risk for HIV to be able to access the best care “safely and free from stigma and discrimination.”
Resources and educational tools are available at www.hiv.va.gov, including recently updated fact sheets and videos for patients about PrEP
CDC Advisory: Acute Flaccid Myelitis
Late summer is the season to be especially alert for possible cases of acute flaccid myelitis (AFM), the CDC says.
Since 2014, when the CDC began tracking AFM, 570 cases, mostly in children, have been reported. Outbreaks have followed a pattern: every 2 years, spiking between August and October. Nearly all states and DC have reported cases. The largest outbreak, 233 cases, was in 2018. Theoretically, 2019 would be an off year, but too little is known about AFM to say outbreaks are unlikely.
AFM starts with symptoms similar to those of a viral infection but can progress rapidly to limb weakness, then respiratory failure. Most patients are previously healthy children, average age 5 years old, who had respiratory symptoms or fever consistent with a viral infection less than a week before they experienced sudden weakness in their arms or legs. On average, the CDC receives reports of suspected AFM cases 18 days after the patient develops limb weakness.
The CDC believes viruses play a role, but which ones is still unclear. Symptoms have been found to develop after poliovirus, West Nile virus, and adenovirus infections. In an analysis of confirmed cases from 2018, CDC researchers detected enteroviruses and rhinoviruses in nearly half of stool and respiratory specimens. However, of 74 cases with a cerebral spinal fluid specimen, only 2 were positive for enteroviruses. All specimens tested negative for poliovirus.
But even when it is associated with a viral infection, it is not known how the infection triggered the AFM, or why it triggers AFM in some people and not others. AFM is rare—affecting ≤ 2 children per million in the US every year. Viral infections from enteroviruses are common, especially in children—and especially in the late summer/early autumn months. It is not known why a small number of people develop AFM while most others recover.
AFM can be difficult to diagnose because the symptoms are similar to those of neurologic diseases, such as Guillain-Barré syndrome. As of yet, no laboratory test is available; diagnosis is done through physical examination and magnetic resonance imaging (MRI) scans of the spinal cord.
There also are no proven ways to treat or prevent AFM. That is why timing is so key. The CDC says as soon as AFM is suspected, collect cerebral spinal fluid, serum, stool, and nasopharyngeal swabs. If an MRI shows a spinal lesion with some gray matter involvement, alert the health department and send specimens and medical records. Refer to specialists, monitor the patient for worsening symptoms, hospitalize if indicated, and begin treatment and rehabilitation.
In short: no specific etiology, no specific way to diagnose, and no specific treatment exist for AFM. Treatments, including immunoglobulin, corticosteroids, and antivirals have been tried, but no clear evidence exists that any have affected recovery. Other treatment is supportive, with physical and occupational therapy.
The length of recovery time varies. Some people make a full recovery, most have continued muscle weakness even after a year.
The CDC is researching possible risk factors, conducting advanced laboratory testing and research to determine how viral infections may lead to AFM, and tracking long-term patient outcomes.
Clinicians can contact neurologists who specialize in AFM through the AFM Physician Consult and Support Portal: https://myelitis.org/living-with-myelitis/resources/afm-physician-support-portal/.
Late summer is the season to be especially alert for possible cases of acute flaccid myelitis (AFM), the CDC says.
Since 2014, when the CDC began tracking AFM, 570 cases, mostly in children, have been reported. Outbreaks have followed a pattern: every 2 years, spiking between August and October. Nearly all states and DC have reported cases. The largest outbreak, 233 cases, was in 2018. Theoretically, 2019 would be an off year, but too little is known about AFM to say outbreaks are unlikely.
AFM starts with symptoms similar to those of a viral infection but can progress rapidly to limb weakness, then respiratory failure. Most patients are previously healthy children, average age 5 years old, who had respiratory symptoms or fever consistent with a viral infection less than a week before they experienced sudden weakness in their arms or legs. On average, the CDC receives reports of suspected AFM cases 18 days after the patient develops limb weakness.
The CDC believes viruses play a role, but which ones is still unclear. Symptoms have been found to develop after poliovirus, West Nile virus, and adenovirus infections. In an analysis of confirmed cases from 2018, CDC researchers detected enteroviruses and rhinoviruses in nearly half of stool and respiratory specimens. However, of 74 cases with a cerebral spinal fluid specimen, only 2 were positive for enteroviruses. All specimens tested negative for poliovirus.
But even when it is associated with a viral infection, it is not known how the infection triggered the AFM, or why it triggers AFM in some people and not others. AFM is rare—affecting ≤ 2 children per million in the US every year. Viral infections from enteroviruses are common, especially in children—and especially in the late summer/early autumn months. It is not known why a small number of people develop AFM while most others recover.
AFM can be difficult to diagnose because the symptoms are similar to those of neurologic diseases, such as Guillain-Barré syndrome. As of yet, no laboratory test is available; diagnosis is done through physical examination and magnetic resonance imaging (MRI) scans of the spinal cord.
There also are no proven ways to treat or prevent AFM. That is why timing is so key. The CDC says as soon as AFM is suspected, collect cerebral spinal fluid, serum, stool, and nasopharyngeal swabs. If an MRI shows a spinal lesion with some gray matter involvement, alert the health department and send specimens and medical records. Refer to specialists, monitor the patient for worsening symptoms, hospitalize if indicated, and begin treatment and rehabilitation.
In short: no specific etiology, no specific way to diagnose, and no specific treatment exist for AFM. Treatments, including immunoglobulin, corticosteroids, and antivirals have been tried, but no clear evidence exists that any have affected recovery. Other treatment is supportive, with physical and occupational therapy.
The length of recovery time varies. Some people make a full recovery, most have continued muscle weakness even after a year.
The CDC is researching possible risk factors, conducting advanced laboratory testing and research to determine how viral infections may lead to AFM, and tracking long-term patient outcomes.
Clinicians can contact neurologists who specialize in AFM through the AFM Physician Consult and Support Portal: https://myelitis.org/living-with-myelitis/resources/afm-physician-support-portal/.
Late summer is the season to be especially alert for possible cases of acute flaccid myelitis (AFM), the CDC says.
Since 2014, when the CDC began tracking AFM, 570 cases, mostly in children, have been reported. Outbreaks have followed a pattern: every 2 years, spiking between August and October. Nearly all states and DC have reported cases. The largest outbreak, 233 cases, was in 2018. Theoretically, 2019 would be an off year, but too little is known about AFM to say outbreaks are unlikely.
AFM starts with symptoms similar to those of a viral infection but can progress rapidly to limb weakness, then respiratory failure. Most patients are previously healthy children, average age 5 years old, who had respiratory symptoms or fever consistent with a viral infection less than a week before they experienced sudden weakness in their arms or legs. On average, the CDC receives reports of suspected AFM cases 18 days after the patient develops limb weakness.
The CDC believes viruses play a role, but which ones is still unclear. Symptoms have been found to develop after poliovirus, West Nile virus, and adenovirus infections. In an analysis of confirmed cases from 2018, CDC researchers detected enteroviruses and rhinoviruses in nearly half of stool and respiratory specimens. However, of 74 cases with a cerebral spinal fluid specimen, only 2 were positive for enteroviruses. All specimens tested negative for poliovirus.
But even when it is associated with a viral infection, it is not known how the infection triggered the AFM, or why it triggers AFM in some people and not others. AFM is rare—affecting ≤ 2 children per million in the US every year. Viral infections from enteroviruses are common, especially in children—and especially in the late summer/early autumn months. It is not known why a small number of people develop AFM while most others recover.
AFM can be difficult to diagnose because the symptoms are similar to those of neurologic diseases, such as Guillain-Barré syndrome. As of yet, no laboratory test is available; diagnosis is done through physical examination and magnetic resonance imaging (MRI) scans of the spinal cord.
There also are no proven ways to treat or prevent AFM. That is why timing is so key. The CDC says as soon as AFM is suspected, collect cerebral spinal fluid, serum, stool, and nasopharyngeal swabs. If an MRI shows a spinal lesion with some gray matter involvement, alert the health department and send specimens and medical records. Refer to specialists, monitor the patient for worsening symptoms, hospitalize if indicated, and begin treatment and rehabilitation.
In short: no specific etiology, no specific way to diagnose, and no specific treatment exist for AFM. Treatments, including immunoglobulin, corticosteroids, and antivirals have been tried, but no clear evidence exists that any have affected recovery. Other treatment is supportive, with physical and occupational therapy.
The length of recovery time varies. Some people make a full recovery, most have continued muscle weakness even after a year.
The CDC is researching possible risk factors, conducting advanced laboratory testing and research to determine how viral infections may lead to AFM, and tracking long-term patient outcomes.
Clinicians can contact neurologists who specialize in AFM through the AFM Physician Consult and Support Portal: https://myelitis.org/living-with-myelitis/resources/afm-physician-support-portal/.
Smoking-cessation attempts changed little over 7-year span
according to the Centers for Disease Control and Prevention.

The median percentage of adult smokers who tried to quit cigarettes over the past year went from 64.9% in 2011 to 65.4% in 2017, CDC investigators reported in the Morbidity and Mortality Weekly Report, but the rate has gone down since 2014, when it reached 66.9%.
“The limited progress in increasing quit attempts … together with the variation in quit attempt prevalence among states, underscores the importance of enhanced efforts to motivate and help smokers to quit,” wrote Kimp Walton, MS, of the CDC’s National Center for Chronic Disease Prevention and Health Promotion and associates.
State-specific trends in quit-attempt rates reflected the national situation. The prevalence of past-year cessation attempts went up significantly in four states (Kansas, Louisiana, Virginia, and West Virginia) from 2011 to 2017, went down significantly in two states (New York and Tennessee), and did not change significantly in the other 44 states and the District of Columbia, they wrote.
In 2017, cigarette smokers in Connecticut were the most likely to have tried to quit in the past year, with a rate of 71.6%. The only other places with rates greater than 70% were Delaware, D.C., New Jersey, and Texas. The lowest quit-attempt rate that year, 58.6%, belonged to Wisconsin, with Iowa and Missouri the only other states under 60%, the investigators reported based on data from annual Behavioral Risk Factor Surveillance System surveys.
“Because most smokers make multiple quit attempts before succeeding, as many as 30 on average, tobacco dependence is viewed as a chronic, relapsing condition that requires repeated intervention. Smokers should be encouraged to keep trying to quit until they succeed, and health care providers should be encouraged to keep supporting smokers until they quit,” investigators wrote.
SOURCE: Walton K et al. MMWR. 2019 Jul 19;68(28):621-6.
according to the Centers for Disease Control and Prevention.
The median percentage of adult smokers who tried to quit cigarettes over the past year went from 64.9% in 2011 to 65.4% in 2017, CDC investigators reported in the Morbidity and Mortality Weekly Report, but the rate has gone down since 2014, when it reached 66.9%.
“The limited progress in increasing quit attempts … together with the variation in quit attempt prevalence among states, underscores the importance of enhanced efforts to motivate and help smokers to quit,” wrote Kimp Walton, MS, of the CDC’s National Center for Chronic Disease Prevention and Health Promotion and associates.
State-specific trends in quit-attempt rates reflected the national situation. The prevalence of past-year cessation attempts went up significantly in four states (Kansas, Louisiana, Virginia, and West Virginia) from 2011 to 2017, went down significantly in two states (New York and Tennessee), and did not change significantly in the other 44 states and the District of Columbia, they wrote.
In 2017, cigarette smokers in Connecticut were the most likely to have tried to quit in the past year, with a rate of 71.6%. The only other places with rates greater than 70% were Delaware, D.C., New Jersey, and Texas. The lowest quit-attempt rate that year, 58.6%, belonged to Wisconsin, with Iowa and Missouri the only other states under 60%, the investigators reported based on data from annual Behavioral Risk Factor Surveillance System surveys.
“Because most smokers make multiple quit attempts before succeeding, as many as 30 on average, tobacco dependence is viewed as a chronic, relapsing condition that requires repeated intervention. Smokers should be encouraged to keep trying to quit until they succeed, and health care providers should be encouraged to keep supporting smokers until they quit,” investigators wrote.
SOURCE: Walton K et al. MMWR. 2019 Jul 19;68(28):621-6.
according to the Centers for Disease Control and Prevention.
The median percentage of adult smokers who tried to quit cigarettes over the past year went from 64.9% in 2011 to 65.4% in 2017, CDC investigators reported in the Morbidity and Mortality Weekly Report, but the rate has gone down since 2014, when it reached 66.9%.
“The limited progress in increasing quit attempts … together with the variation in quit attempt prevalence among states, underscores the importance of enhanced efforts to motivate and help smokers to quit,” wrote Kimp Walton, MS, of the CDC’s National Center for Chronic Disease Prevention and Health Promotion and associates.
State-specific trends in quit-attempt rates reflected the national situation. The prevalence of past-year cessation attempts went up significantly in four states (Kansas, Louisiana, Virginia, and West Virginia) from 2011 to 2017, went down significantly in two states (New York and Tennessee), and did not change significantly in the other 44 states and the District of Columbia, they wrote.
In 2017, cigarette smokers in Connecticut were the most likely to have tried to quit in the past year, with a rate of 71.6%. The only other places with rates greater than 70% were Delaware, D.C., New Jersey, and Texas. The lowest quit-attempt rate that year, 58.6%, belonged to Wisconsin, with Iowa and Missouri the only other states under 60%, the investigators reported based on data from annual Behavioral Risk Factor Surveillance System surveys.
“Because most smokers make multiple quit attempts before succeeding, as many as 30 on average, tobacco dependence is viewed as a chronic, relapsing condition that requires repeated intervention. Smokers should be encouraged to keep trying to quit until they succeed, and health care providers should be encouraged to keep supporting smokers until they quit,” investigators wrote.
SOURCE: Walton K et al. MMWR. 2019 Jul 19;68(28):621-6.
FROM MMWR