User login
Hospitalists, Healthcare Reform, and the Presidential Election

Even though the 2008 elections seem very far away, the presidential nomination process is in full swing. Obviously, the No. 1 issue for most Americans is the war in Iraq. But, interestingly, the No. 2 item on many peoples’ list is healthcare reform. This is of particular interest to hospitalists because they are not only young and early in their careers, but clearly at the center of acute healthcare.
There are opportunities to reshape the financing and delivery of healthcare in a way that will be better for our patients and for hospitalists for many years to come. This will require us to be lucky, which I define as being prepared when opportunities present themselves and being ready to step up and change even when the future is not clearly defined.
The driving forces are several, not the least of which is the fact that in the richest country on Earth almost 50 million Americans still have no health coverage. We know these people eventually find their way to emergency rooms and are admitted to hospitals, but studies show the uninsured are sicker and die more quickly than the insured population. The uninsured are not the unemployed or the illegal aliens, but generally those with full-time jobs, our neighbors, our friends, and often our children of working age.
Because of a failure to adopt a national policy, several states have decided to move forward with their own attempts to insure all their citizens. Massachusetts enacted its landmark plan in 2006. (See The Hospitalist, May 2007, p. 1.) California Gov. Arnold Schwarzenegger has proposed a broad plan to insure the 6 million Californians without coverage. Schwarzenegger’s plan would require sacrifice by all constituencies and would be financed in part by taxing 3%-4% of each physician’s gross collections and an equal percentage on the revenue of hospitals. As you might imagine, this has led to the usual squawking from physician and hospital organizations. He has also called on contributions from the state’s general fund and support from the federal government.
At a national level, the American College of Physicians has developed its Patient Centered Medical Home proposal and has drawn support from the American Academy of Pediatrics, the American Academy of Family Physicians, and others. Basically, this plan calls for changes in the payment structure to recognize the coordination of care in managing chronic illness and taking care of the patient over time. This is a marked departure from our current system, which pays by the episode of care—the visit or the procedure. In many ways this approach harkens back to the best of managed care without being dragged down by managed care’s image of rationing care and limiting resources.
There are increasing calls to develop a single-payer plan to squeeze out the funds now “wasted” on the insurance industry and unnecessary administrative cost. In a perfect world this would allow for >90% of the healthcare dollar to go for patient-care services at a time where some insurance companies retain as much of 30% of every health dollar for profit and administration.
Some say we have elements of this process in place in covering seniors and the disabled with Medicare, in covering the very poor with Medicaid, and in covering children with S-CHIP (State Children’s Health Insurance Program). Much of this discussion overlooks the fact that in order to support Medicare, Medicaid, and S-CHIP, there needs to be cost-shifting to the tune of >125% that now comes out of private insurance payments. This also needs to be thought of in context of a population that craves choice and freedom in their healthcare and are very suspicious of enlarging government programs.
Some are calling for DRGs (diagnosis related groups) for hospital care for the physician component, much as exist for the hospital facility charge. This case-based approach may work well for the hospitalist model, where efficiencies could result and rewards can be tied to performance. More modeling and projections need to be done before this can be a viable option.
This leads to thoughts of how much pay for performance (P4P) will be a part of any healthcare reform. Some see this as the panacea. Others see P4P as motivating systems or institutions, but doing little to change individual physician behaviors. Some feel performance standards need to be part of the equation because institutions need to provide a transparent accountability of just how good a job they are doing. Hospitalists are in a position to provide leadership and direction as quality and documentation of performance become valued.
All this is woven through a political process that is media- and sound-bite driven.
While Hillary Clinton probably has more insider knowledge of healthcare reform concepts, she is so associated with the failed Clinton plans of the early 1990s that she may be reluctant to make healthcare her main policy direction.
John Edwards and Barack Obama, who want to speak for the “other America,” seem positioned to take on healthcare reform as a way to level the playing field and bring the 50 million uninsured at least up to some sort of healthcare access parity with the rest of Americans. Any proposal that tries to include another 50 million people will by necessity cause a revolution in the current system with marked, probably seismic, shifts in payment and delivery of care.
As the Republican candidates get sorted out, expect healthcare reform as a popular issue that isn’t a war issue to take a higher priority, much the way Al Gore and George Bush were touting their own approaches to a pharmacy benefit for seniors in 2000.
Hospital medicine at age 10 can no longer sit on the sidelines and wait to see what will happen. SHM, along with other national partners in hospital medicine, must start developing the hospital medicine strategy so we can be active participants in the reform discussions. The current system of reimbursement at the level of the visit or the procedure does not recognize the full value hospitalists can bring in improving quality, reducing resource use, increasing throughput and efficiency, etc. In addition, being on the front lines, catching everyone who is acutely ill and needs hospitalization regardless of ability to pay, puts us squarely in the middle of dealing with those Americans who lack insurance.
The good news is that hospitalists present many fewer barriers than other physician groups. We know we will be measured and that we need to prove our performance. We know we will treat the uninsured. There is no escape. We know many of us will still practice in 2025 and 2030, and we need to fix the system now because we will live in this space for many years to come.
Reforming healthcare—an industry that accounts for $2 trillion and 16% of the GDP—is staggering, but signs appear to indicate change is coming. SHM and hospitalists everywhere are ready to be part of the solution. TH
Dr. Wellikson has been CEO of SHM since 2000.
What's Your Diagnosis?

An 84-year-old white female, a former smoker with a medical history significant for coronary artery disease, chronic renal insufficiency, hypertension, and hyperlipidemia, presented to our hospital with two weeks of progressively worsening lower-back pain.
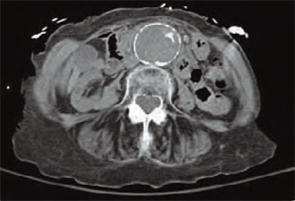
A detailed review of systems was negative for other symptoms. The patient was normotensive with stable vital signs. A physical examination found a 4 cm nontender, pulsatile mass above umbilicus, but a neurovascular exam of her lower extremities was normal. Laboratory testing revealed an elevated serum creatinine of 4.8 mg/dL (0.8-1.2 mg/dL). An abdominal computed tomography (CT) scan without contrast was performed. (See figure 1, below). TH
What should be your next appropriate
a) Obtain additional imaging studies
b) Initiate intravenous beta-blocker therapy to keep systolic blood pressure < 90 mm Hg
c) Initiate intravenous heparin therapy
d) Observation
e) Perform surgery emergently
Discussion
The answer is “d”: Observation. A CT scan of the abdomen without contrast shows a calcified abdominal aorta with aneurysmal dilatation measuring 4.4 cm in greatest diameter. No dissection or aneurysmal rupture is seen.
The abdominal aorta is the most common site for an arterial aneurysm, occurring below the origin of renal vessels in majority of cases. A diameter greater than 3.0 cm is considered aneurysmal.1 The prevalence increases markedly in individuals older than 60.2 Known risk factors include age, smoking, gender, atherosclerosis, hypertension, and family history of abdominal aneurysm.
The vast majority of the individuals with abdominal aortic aneurysms are asymptomatic. Abdominal or back pain is the most common complain in symptomatic patients. Often, patients have a ruptured aneurysm on presentation, along with pain in the abdomen, back or groin, hypotension with a tender, pulsatile abdominal mass seen on physical examination. In addition to history and examination, several imaging modalities are utilized for diagnosis. Most aneurysms are picked up incidentally on imaging studies performed for other purposes. Abdominal ultrasonography, CT scan, magnetic resonance imaging/magnetic resonance angiography and angiography are all used for diagnosis.
The size of the aneurysm is important when making management decisions. Risk of rupture increases dramatically for aneurysm diameter greater than 5-5.5 cm.3 Elective repair is generally indicated for asymptomatic aneurysms this size because mortality for emergency repair in case of rupture is extremely high. For asymptomatic aneurysms between 3.0-5.5 cm in diameter, the choice between surgery and surveillance depends on the patient’s preference, co-morbidities, presence of risk factors and the risk of surgery. For surveillance, monitor with ultrasound or CT scan every six to 24 months.1 Smoking cessation and treatment of hypertension and hyperlipidemia are important in medical management. Surgical repair is done either by the traditional transabdominal route or retroperitoneal approach. Endovascular stent grafts have also been introduced more recently. Symptomatic aneurysms require repair, regardless of the diameter.
Our patient had several risk factors, including age, smoking, hypertension, and atherosclerosis for developing an abdominal aortic aneurysm. After discussion of findings and management options, patient did not elect to undergo surgical repair. Smoking cessation, continued medical therapy for risk factors and surveillance was advised on discharge. TH
Drs. Aijaz and Newman practice at the Department of Medicine, Mayo Graduate School of Medical Education, Mayo Clinic, Rochester, Minn.
References
- Hirsch AT, Haskal ZJ, Hertzer NR, et al. ACC/AHA 2005 Practice Guidelines for the management of patients with peripheral arterial disease (lower extremity, renal, mesenteric, and abdominal aortic): a collaborative report from the American Association for Vascular Surgery/Society for Vascular Surgery, Society for Cardiovascular Angiography and Interventions, Society for Vascular Medicine and Biology, Society of Interventional Radiology, and the ACC/AHA Task Force on Practice Guidelines (Writing Committee to Develop Guidelines for the Management of Patients With Peripheral Arterial Disease): endorsed by the American Association of Cardiovascular and Pulmonary Rehabilitation; National Heart, Lung, and Blood Institute; Society for Vascular Nursing; TransAtlantic Inter-Society Consensus; and Vascular Disease Foundation. Circulation 2006 Mar 21;113(11):e463-654.
- Singh K, Bønaa KH, Jacobsen BK, Bjørk L, Solberg S. Prevalence of and risk factors for abdominal aortic aneurysms in a population-based study: The Tromso Study. Am J Epidemiol. 2001 Aug 1;154(3): 236-244.
- Powell JT, Greenhalgh RM. Clinical practice. Small abdominal aortic aneurysms. N Engl J Med. 2003 May 8;348(19):1895-1901.
An 84-year-old white female, a former smoker with a medical history significant for coronary artery disease, chronic renal insufficiency, hypertension, and hyperlipidemia, presented to our hospital with two weeks of progressively worsening lower-back pain.
A detailed review of systems was negative for other symptoms. The patient was normotensive with stable vital signs. A physical examination found a 4 cm nontender, pulsatile mass above umbilicus, but a neurovascular exam of her lower extremities was normal. Laboratory testing revealed an elevated serum creatinine of 4.8 mg/dL (0.8-1.2 mg/dL). An abdominal computed tomography (CT) scan without contrast was performed. (See figure 1, below). TH
What should be your next appropriate
a) Obtain additional imaging studies
b) Initiate intravenous beta-blocker therapy to keep systolic blood pressure < 90 mm Hg
c) Initiate intravenous heparin therapy
d) Observation
e) Perform surgery emergently
Discussion
The answer is “d”: Observation. A CT scan of the abdomen without contrast shows a calcified abdominal aorta with aneurysmal dilatation measuring 4.4 cm in greatest diameter. No dissection or aneurysmal rupture is seen.
The abdominal aorta is the most common site for an arterial aneurysm, occurring below the origin of renal vessels in majority of cases. A diameter greater than 3.0 cm is considered aneurysmal.1 The prevalence increases markedly in individuals older than 60.2 Known risk factors include age, smoking, gender, atherosclerosis, hypertension, and family history of abdominal aneurysm.
The vast majority of the individuals with abdominal aortic aneurysms are asymptomatic. Abdominal or back pain is the most common complain in symptomatic patients. Often, patients have a ruptured aneurysm on presentation, along with pain in the abdomen, back or groin, hypotension with a tender, pulsatile abdominal mass seen on physical examination. In addition to history and examination, several imaging modalities are utilized for diagnosis. Most aneurysms are picked up incidentally on imaging studies performed for other purposes. Abdominal ultrasonography, CT scan, magnetic resonance imaging/magnetic resonance angiography and angiography are all used for diagnosis.
The size of the aneurysm is important when making management decisions. Risk of rupture increases dramatically for aneurysm diameter greater than 5-5.5 cm.3 Elective repair is generally indicated for asymptomatic aneurysms this size because mortality for emergency repair in case of rupture is extremely high. For asymptomatic aneurysms between 3.0-5.5 cm in diameter, the choice between surgery and surveillance depends on the patient’s preference, co-morbidities, presence of risk factors and the risk of surgery. For surveillance, monitor with ultrasound or CT scan every six to 24 months.1 Smoking cessation and treatment of hypertension and hyperlipidemia are important in medical management. Surgical repair is done either by the traditional transabdominal route or retroperitoneal approach. Endovascular stent grafts have also been introduced more recently. Symptomatic aneurysms require repair, regardless of the diameter.
Our patient had several risk factors, including age, smoking, hypertension, and atherosclerosis for developing an abdominal aortic aneurysm. After discussion of findings and management options, patient did not elect to undergo surgical repair. Smoking cessation, continued medical therapy for risk factors and surveillance was advised on discharge. TH
Drs. Aijaz and Newman practice at the Department of Medicine, Mayo Graduate School of Medical Education, Mayo Clinic, Rochester, Minn.
References
- Hirsch AT, Haskal ZJ, Hertzer NR, et al. ACC/AHA 2005 Practice Guidelines for the management of patients with peripheral arterial disease (lower extremity, renal, mesenteric, and abdominal aortic): a collaborative report from the American Association for Vascular Surgery/Society for Vascular Surgery, Society for Cardiovascular Angiography and Interventions, Society for Vascular Medicine and Biology, Society of Interventional Radiology, and the ACC/AHA Task Force on Practice Guidelines (Writing Committee to Develop Guidelines for the Management of Patients With Peripheral Arterial Disease): endorsed by the American Association of Cardiovascular and Pulmonary Rehabilitation; National Heart, Lung, and Blood Institute; Society for Vascular Nursing; TransAtlantic Inter-Society Consensus; and Vascular Disease Foundation. Circulation 2006 Mar 21;113(11):e463-654.
- Singh K, Bønaa KH, Jacobsen BK, Bjørk L, Solberg S. Prevalence of and risk factors for abdominal aortic aneurysms in a population-based study: The Tromso Study. Am J Epidemiol. 2001 Aug 1;154(3): 236-244.
- Powell JT, Greenhalgh RM. Clinical practice. Small abdominal aortic aneurysms. N Engl J Med. 2003 May 8;348(19):1895-1901.
A Performance Metrics Primer
Hospitalists are no strangers to performance measurement. Every day, their performance is measured, formally and informally, by their sponsoring organizations, by third-party payers, and by patients.
But many hospitalists are not engaged in producing or reviewing that performance data.
“Historically, hospitalist groups have relied on the hospital to collect the data and present it to them—and still do, to a great extent, even today,” says Marc B. Westle, DO, FACP, president and managing partner for a large private hospital medicine group (HMG), Asheville Hospitalist Group in North Carolina.
This often puts hospitalists at a disadvantage, says Dr. Westle. If hospitalist groups don’t get involved with data reporting and analysis, they can’t have meaningful discussions with their hospitals.
With a background in hospital administration, Leslie Flores, MHA, co-principal of Nelson/Flores Associates, LLC, is well acquainted with the challenges of collecting and reporting hospital data. Through her consulting work with partner John Nelson, MD, she has found that sponsoring organizations often don’t review performance data with hospitalists. Hospitalists may examine their performance one way, while the hospital uses a different set of metrics, or analytical techniques. This disconnect, she notes, “leads to differences in interpretations and understandings that can occur between the hospital folks and the doctors when they try to present information.”
A new white paper produced by SHM’s Benchmarks Committee, “Measuring Hospitalist Performance: Metrics, Reports, and Dashboards,” aims to change these scenarios by encouraging hospitalists to take charge of their performance reporting. Geared to multiple levels of expertise with performance metrics, the white paper offers “some real, practical advice as to how you capture this information and then how you look at it,” says Joe Miller, SHM senior vice president and staff liaison to the Benchmarks Committee.
— Daniel Rauch, MD, FAAP
Select a Metric
The Benchmarks Committee used a Delphi process to rank the importance of various metrics and produced a list of 10 on which they would focus. The clearly written introduction walks readers through a step-by-step process intended to help HMGs decide which performance metrics they will measure.
Flores, editor of the white paper project, cautions that the “magic 10” metrics selected by the committee don’t necessarily represent the most important metrics for each practice. “We wanted to stimulate hospitalists to think about how they view their own performance and to create a common language and understanding of what some key issues and expectations should be for hospitalists’ performance monitoring,” she says. “They can use this document as a starting point and then come up with performance metrics that really matter to their practice.”
Choosing metrics to measure and report on for the hospitalist service will depend on a variety of variables particular to that group, including:
- The HMG’s original mission;
- The expectations of the hospital or other sponsoring organization (such as a multispecialty group) for the return on their investment;
- Key outcomes and/or performance measures sought by payers, regulators, and other stakeholders; and
- The practice’s high-priority issues.
Regarding the last item, Flores recalls one HMG that decided to include on its dashboard a survey of how it used consulting physicians from the community. This component was chosen to address the concerns of other specialists in the community, who feared the hospitalists were using only their own medical group’s specialists for consultations.
To further guide choices of metrics, the white paper uses a uniform template to organize each section. Whether the metric is descriptive (volume, data, case mix), operational (hospital cost, productivity, provider satisfaction, length of stay, patient satisfaction), or clinical (mortality data, readmission rate, JCAHO core measures), the user finds a description in each section titled, “Why this metric is important.”
Daniel Rauch, MD, FAAP, explains why a pediatric hospitalist group might choose to focus on referring provider satisfaction rather than volume data—perhaps a more critical metric for adult hospitalist groups.
“Our volume data [a descriptive metric] will depend on who’s referring to us and the availability of subspecialists, as opposed to market share and the notability of the institution in the local environment,” he notes.
Dr. Rauch, director of the Pediatric Hospitalist Program at New York University School of Medicine in New York City and editor of the Provider Satisfaction section of the white paper, co-presented the pediatric hospitalist perspective on the white paper with Flores at the Annual Meeting.
Much more critical to the success of a pediatric hospitalist service is nurturing relationships with local pediatricians, who traditionally want to retain their ability to manage patients under all circumstances. As a result, the pediatric hospitalist group might choose to survey its referring providers to learn how it can provide better service and take advantage of positive survey responses to market its service. (These interventions are outlined in “Performance Metric Seven: Provider Satisfaction.”)
Finding the Data
Once a group has selected its performance metrics, it faces many logistical and political challenges to obtain the pertinent data. Again, the white paper’s template furnishes clear direction on data sources for each metric.
To begin, hospitalists must understand their practicing environment. Many smaller rural or freestanding hospitals do not have the IT decision-support resources to generate customized reports for hospitalists. “For instance, the hospital may be able to furnish information about length of stay for the hospital in general, but [may] not [be able] to break out LOS numbers for the hospitalist group compared to other physicians,” explains Flores. In addition, some billing services can’t or won’t provide information on volume, charges, and collections to the hospitalist group.
“The other challenge is more of a cultural or philosophical one,” says Flores. “Very often, hospitals or other sponsoring entities are reluctant to share financial information, in particular, with the hospitalists, because they are afraid that the hospitalists will use the information inappropriately—or that they’ll somehow become more powerful by virtue of having that information. And, in fact, that’s what we really want: to be more powerful—but in a constructive, positive way.”
In this case, HMGs may need to invest time to ensure organizations that the information won’t be used against them and that its only goal is to improve practice performance.
“Finding the data is not always easy,” concedes Burke T. Kealey, MD, assistant medical director of hospital medicine for HealthPartners Medical Group in St. Paul, Minn., and chair of SHM’s Benchmarks Committee. “Some organizations can give you a lot of these data sets pretty easily, and some are not going to produce many of them at all. And, when you cross organizational boundaries, there are political considerations. For example, if you’re a national hospitalist company trying to get data from individual hospitals, it might be difficult.” (Dr. Kealey co-presented at the workshop on the white paper for adult HMGs with Flores at the 2007 SHM Annual Meeting in Dallas.)
Sources of data will vary from metric to metric. To obtain data for measuring volume (often used as an indicator for staffing requirements and scheduling), hospitalists need to access hospital admission/discharge/transfer systems, health-plan data systems, or the hospital medicine service billing system. For an operational metric like provider satisfaction, the hospitalist group may have to float its own referring provider survey (by mail, by phone, or in person) to gain understanding of how it is viewed by referring physicians.
How to Interpret the Data
Obtaining the data is only half the battle. Another core tool in the white paper is the template section “Unique Measurement and Analysis Considerations,” which guides hospitalists as they attempt to verify the validity of their data and ensure valid comparisons.
Dr. Westle’s group has studiously tracked its performance metrics for years; other groups may have little experience in this domain. Another critical step in creating dashboard reports, he states, is understanding how the data are collected and ensuring the data are accurate and attributed appropriately.
“The way clinical cases are coded ought to be the subject of some concern and scrutiny,” says John Novotny, MD, director of the Section of Hospital Medicine of the Allen Division at Columbia University Medical Center in New York City and another Benchmarks Committee member. “There may be a natural inclination to accept the performance information provided to us by the hospital, but the processes that generated these data need to be well understood to gauge the accuracy and acceptability of any conclusions drawn.”
With a background in statistics and information technology, Dr. Novotny cautions that “some assessment of the validity of comparisons within or between groups or to benchmark figures should be included in every analysis or report—to justify any conclusions drawn and to avoid the statistical pitfalls common to these data.”
He advises HMGs to run the numbers by someone with expertise in data interpretation, especially before reports are published or submitted for public review. These issues come up frequently in the analysis of frequency data, such as the number of deaths occurring in a group for a particular diagnosis over a period of time, where the numbers might be relatively small.
For example, if five deaths are observed in a subset of 20 patients, the statistic of a 25% death rate comes with such low precision that the true underlying death rate might fall anywhere between 8% and 50%.
“This is a limitation inherent in drawing conclusions from relatively small data sets, akin to driving down a narrow highway with a very loose steering wheel—avoiding the ravines is a challenge,” he says.
Dr. Novotny contributed the section on mortality metrics for the white paper. Although a group’s raw mortality data may be easily obtained, “HMGs should be wary of the smaller numbers resulting from stratifying the data by service, DRG [diagnosis-related group], or time periods,” he explains.
Instead, as suggested in the “Interventions” section, the HMG might want to take the additional approach of documenting the use of processes thought to have a positive impact on the risk of mortality in hospitalized patients. Potentially useful processes under development and discussion in the literature include interdisciplinary rounds, effective inter-provider communication, and ventilator care protocols, among others.
“We need to show that not only do we track our mortality figures, we analyze and respond to them by improving our patient care,” Dr. Novotny says. “We need to show that we’re making patient care safer.”
At the Ochsner Health Center in New Orleans, the HMG decided to track readmission rates for congestive heart failure—the primary DRG for inpatient care, and compare its rates with those of other services. Because heart failure is traditionally the bailiwick of cardiology, “you might think that the cardiology service would have the best outcomes,” says Steven Deitelzweig, MD, vice president of medical affairs and system chairman.
But, using order sets that align with JCAHO standards and best care as demonstrated by evidence in cardiology, Dr. Deitelzweig’s hospitalist group “was able to demonstrate statistically and objectively that our outcomes were better, adjusting for case mix.”
Make Your Own Case
Once the infrastructure for tracking and reporting productivity is in place, hospitalists can use performance metrics to build their own case, remarks Dr. Kealey. The white paper furnishes several examples of customized dashboards. Some use a visual display to illustrate improvement or maintenance in key performance areas.
Dr. Westle notes that metrics reports can be used in a variety of ways, including:
- Negotiating with the hospital;
- Managing a practice internally (i.e., tracking the productivity of established and new full-time equivalent employees (FTEs) and compensating physicians for their productivity); and
- Negotiating with third-party payers who increasingly rely on pay-for-performance measures. For instance, Dr. Westle says, if a group can track its cost per case for the top 15 DRGs and show those costs are less than the national average, this “puts the hospitalist group at a significant advantage when talking to insurance companies about pay for performance.”
Dr. Deitelzweig reports that his HMG at the Ochsner Health Center posts monthly updates of its dashboard results in the halls of its department and others. “Whether it’s readmission rates, patient satisfaction, or hand washing, it’s up there for all to see,” he says. He believes that this type of transparency is not only a good reminder for staff but benefits patients, as well. “It’s helpful because it highlights for your department members the goals of the department and that those are aligned with patient satisfaction and best outcomes.”
Conclusion
“If hospitalists can work with their hospitals to understand how various data elements are defined, collected and reported,” says Flores, “this will enable them to develop a greater understanding of what the information means, correct any misinterpretations on the hospital’s part, and gain a greater confidence in the information’s credibility and reliability. Hospitalists should work closely with their sponsoring organizations to define metrics and reports that are mutually credible and meaningful, so that all parties are looking at the same things and understanding them the same way.”
Participating in the white paper project gave Dr. Rauch a better appreciation of the value of measuring performance. His advice to first-timers: “It may seem overwhelming at first to do an all-encompassing dashboard, but even if you pick just a couple things to start with, this puts down on paper what your worth is. When you can point to how your services are improving or maintaining over time, that’s the picture that says a thousand words.” TH
Gretchen Henkel is a frequent contributor to The Hospitalist.