User login
Inpatient Hyperglycemia in Children
Diabetes is one of the most common diagnoses in hospitalized patients.1, 2 Hyperglycemia is present in 38% of adults admitted to the hospital, one third of whom had no history of diabetes before admission.3 The impact of inpatient hyperglycemia on clinical outcome in adult patients has been increasingly appreciated. Extensive evidence from observational studies indicates that hyperglycemia in patients with or without a history of diabetes is an important marker of poor clinical outcome.312 Several prospective randomized trials in patients with critical illness have shown that aggressive glycemic control improves short‐ and long‐term mortality, multiorgan failure and systemic infection, and length of hospitalization.1317 The importance of glucose control also applies to adult patients admitted to general surgical and medical wards.3, 6, 18 In such patients, we recently reported that the presence of hyperglycemia is associated with prolonged hospital stay, infection, disability after hospital discharge, and death.3, 6, 18 Despite the extensive data in adult patients, there is little information on the impact of inpatient hyperglycemia in pediatric patients. The few observational studies in critically ill children admitted to the pediatric ICU with severe brain injury or extensive burn injuries have shown a positive association between inpatient hyperglycemia and increased length of hospital and ICU stay and a higher risk of complication and mortality rates.1923 No previous studies, however, have examined the association of hyperglycemia and clinical outcome in children admitted to a general community pediatric hospital. Therefore, in this study we determined the prevalence of inpatient hyperglycemia and examined the impact of hyperglycemia on morbidity and mortality in children admitted to Hughes Spalding Children's Hospital, a large community hospital serving the inner city and indigent pediatric population in Atlanta, Georgia.
MATERIALS AND METHODS
This was a retrospective observational cohort of pediatric patients consecutively admitted to Hughes Spalding Children's Hospital in Atlanta from January 2004 to August 2004. This general community pediatric hospital is part of the Grady Health System in Atlanta, a large health care organization that operates under the auspices of the Fulton‐Dekalb Hospital Authoritythe major counties in metropolitan Atlantato deliver care to their uninsured and underserved populations. Ninety percent of the organization's inpatient cases are either uninsured or dependent on Medicaid. This is a broad‐based pediatric hospital without cardiac surgery, burn, or dedicated inpatient hematology‐oncology units. Patients are managed by members of the pediatric residency program and supervised by faculty members from Emory University School of Medicine. The Institutional Review Board of Emory University and Grady Health System Oversight Research Committee approved the methods for data collection and analysis used in the study and waived the need for informed consent.
The medical records of 903 consecutive pediatric patients admitted to both critical and noncritical care areas were reviewed. For the analysis, patients were divided according to a known history of diabetes prior to admission and according to admission blood glucose concentration. A normoglycemic group included patients with normal plasma glucose and without a history of diabetes. Serum or plasma glucose measured in the laboratory was assumed to be equivalent to blood glucose measured by finger stick at bedside using a glucose meter. Hyperglycemia was defined as an admission or in‐hospital blood glucose level >120 mg/dL. High blood glucose was subsequently divided into those with blood glucose of 120179 mg/dL and those with blood glucose 180 mg/dL. Patient information was collected regarding demographic characteristics, blood glucose level on admission and during hospital stay, concurrent medical diagnoses, medical treatment, and hospital outcome (including mortality and disposition at discharge).
The primary objectives of this study were to determine the prevalence of in‐hospital hyperglycemia and to examine the association of hyperglycemia and mortality in children with critical and noncritical illness in a community pediatric hospital. Secondary end points included length of hospital stay, requirement of intensive care, and treatment of hyperglycemia. In addition to blood glucose level, prognostic variables included sex, age, body mass index, admission diagnosis, presence of comorbidities, and intensive care unit admission.
Statistical Analysis
To compare demographics and clinical characteristics between groups, the independent t test and ANOVA with Sheff's method were used for continuous variables. Levine's test for homogeneity of variances and log transformations were used when necessary. For categorical variables, 2 analysis was used. P < .05 was considered significant. SPSS version 12.0 (SPSS, Inc., Chicago, IL), was the statistical software used for the analysis.
RESULTS
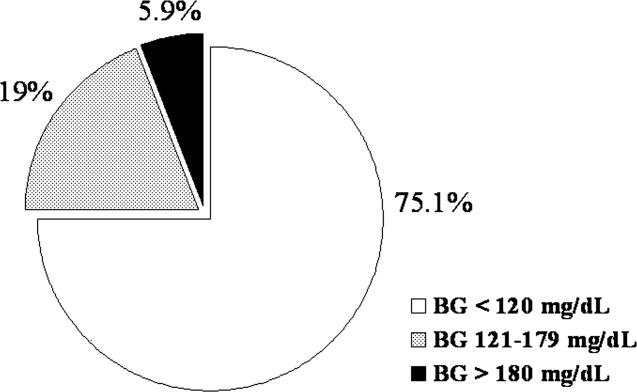
Of the 903 admitted patients, 342 patients (38%) had no blood glucose measurement during the hospital stay and were excluded from the analysis. Three patients with a length of stay greater than 6 months were excluded. In addition, 16 patients admitted with diabetic ketoacidosis (DKA) and 1 subject with hyperglycemic hyperosmolar syndrome were also excluded from the analysis. The remaining 542 patients constituted the study population. Most of these, 406 patients (75%), had an admission blood glucose concentration 120 mg/dL (mean SEM 98 1 mg/dL, median 93 mg/dL). A total of 103 children (19%) had an admission blood glucose level of 121179 mg/dL (mean 143 2 mg/dL, median 140 mg/dL), and 32 patients (5.9%) had an admission blood glucose level >180 mg/dL (mean 260 18 mg/dL, median 211 mg/dL; Fig. 1).

The clinical characteristics of study patients are shown in Table 1. Most patients in this study were from minority ethnic groups82% were black, 12% were Hispanic, 2% were from other minority groups, and 4.2% were white. There were no significant differences in mean age, sex, racial distribution, or body mass index among the 3 groups. A total of 409 patients (75.5%) were admitted to general pediatric wards and 133 patients (24.5%) were admitted to the surgical unit. There were no differences in the admission blood glucose between patients admitted to general pediatric wards (112.2 mg/dL) and those admitted to surgical areas (115.7 mg/dL, P > .05). The most common diagnoses in the severe hyperglycemia group were trauma/surgery (25%), pulmonary disease (18.8%), metabolic disorders (12.5%), and infection (6.3%). Most children admitted with hyperglycemia had no history of diabetes prior to admission. Among the 135 children with admission hyperglycemia (blood glucose >120 mg/dL), 17 patients (13%) had a known history of diabetes or were receiving therapy prior to admission. The mean admission blood glucose was 162.4 mg/dL (range 121480 mg/dL) in children with new hyperglycemia and 369.8 mg/dL (range 145678 mg/dL) in those children with a known history of diabetes (P < .01). Among children without a history of diabetes, 33 of 118 children (28%) with admission hyperglycemia had 1 or more glucose values >120 mg/dL during their hospitalizations. Twenty‐five children had a blood glucose of 121179 mg/dL (mean 109 5 mg/dL), and 8 children had a blood glucose 180 mg/dL (mean 159 13 mg/dL). Most patients with a history of diabetes were admitted with significant hyperglycemia. One patient (1%) had a glucose level in the 121179 mg/dL category, and 16 patients (50%) had a glucose level >180 mg/dL.
| BG <120 mg/dL | BG 121179 mg/dL | BG 180 mg/dL | |
|---|---|---|---|
| |||
| No. of patients (%) | 406 (75%) | 103 (19%) | 32 (6%) |
| Mean age (years) | 7.0 .4 | 6.8 .6 | 7.8 1.1 |
| Sex (M/F) | 50/50 | 57/43 | 50/50 |
| Race | |||
| White | 4% | 8% | 9% |
| Black | 80% | 80% | 84% |
| Hispanic | 15% | 10% | 6% |
| Other | 1% | 2% | 1% |
| Weight on admission (kg) | 29 2 | 26 3 | 32 6 |
| Height on admission (cm) | 79 4 | 94 9 | 74 19 |
| Body mass index (kg/m2) | 17 5 | 18 4 | 37 16 |
| Mean admission BG | 92 1 | 143 2 | 260 18 |
| Mean inpatient BG | 96 3 | 109 5 | 159 13 |
| Mean length of hospital stay | 3.8 0.2 | 5.4 1.0 | 5.7 1.8 |
| Mean length of ICU stay | 0.6 0.1 | 1.1 .4a | 3.6 1.9 |
| Admission service (%) | |||
| Pediatrics | 79.6% | 58.8% | 72.4% |
| Surgery | 20.4% | 41.2% | 27.6% |
The presence of hyperglycemia on admission in pediatric patients was not associated with increased mortality or with increased length of hospital stay. There was only 1 death reported during the study period, which occurred in a patient with respiratory failure because of bronchiolitis who was admitted with an admission blood glucose of 151 mg/dL. The mean length of stay for patients with normoglycemia was 3.83 0.2 days, which increased to 5.36 1.0 and 5.68 1.8 days for children with blood glucose of 120179 and 180 mg/dL, respectively (P > .05).
Children with hyperglycemia were more likely to be admitted to the ICU and had a longer length of ICU stay. Admission to the ICU was needed by 10% of children with an admission blood glucose <120 mg/dL, 18% of children with a blood glucose of 120179 mg/dL, and 40% of children with an admission blood 180 mg/dL (P < .01). In addition, length of ICU stay was significantly longer for hyperglycemic children, particularly those with a glucose level 180 mg/dL (P < .001). The mean length of ICU stay (ICU) was 0.56 0.1 days for patients with normoglycemia, and 1.1 0.4 days and 3.6 1.9 days for patients with a blood glucose of 120179 and 180 mg/dL, respectively (P < .01).
Newly diagnosed hyperglycemia was frequently left untreated. Only 3 children without a history of diabetes but with hyperglycemia recorded during the hospital stay received insulin therapy. New hyperglycemia patients received regular insulin per a sliding scale as the main insulin regimen in the hospital. In contrast, all patients with a previous history of diabetes were treated with insulin during their hospital stay.
DISCUSSION
Diabetes mellitus represents a significant public health burden on the basis of increased morbidity, mortality, and economic costs. Increasing evidence from observational and prospective interventional studies has shown that inpatient hyperglycemia is a predictor of poor clinical outcome of adult subjects.313, 16, 17 Admission hyperglycemia has been associated with increased morbidity and mortality in patients with critical illness, as well as in noncritically ill adult subjects admitted to general surgical and medical wards.3, 6, 18 In this study we also found that hyperglycemia is a common finding in children admitted with critical and noncritical illnesses and that most children had no history of diabetes before admission. One‐fourth of the children admitted to the hospital had hyperglycemia on admission. Children with hyperglycemia were more likely to be admitted to the ICU and had a longer length of ICU stay; however, inpatient hyperglycemia was not associated with higher hospital mortality or longer hospital stay than was inpatient normoglycemia. Our findings suggest that recognition of inpatient hyperglycemia can be improved because screening for hyperglycemia was not performed in more than one third of patients (38%) during the hospital stay.
The prevalence of inpatient hyperglycemia in children varies according to the severity of the illness and the study population. Ruiz Magro et al.21 reported that 50% of 353 critically ill children without diabetes mellitus had initial glucose values >120 mg/dL. In a study of 942 nondiabetic patients, Faustino et al.20 found that within 24 hours of admission to the ICU, hyperglycemia was prevalent in 70.4% of patients with a glucose value >120 mg/dL, 44.5% of patients with a glucose value >150 mg/dL, and 22.3% of patients with a glucose value >200 mg/dL. The prevalence of hyperglycemia in non‐critically ill children seen in the emergency department was much lower, ranging from 3.8% to 5.0% (based on an initial blood glucose >150 mg/dL).19, 24 In agreement with these studies, we found inpatient hyperglycemia to be a common finding among hospitalized children. Approximately 75% of our patients had a normal blood glucose on admission, 19% had an admission blood glucose of 121179 mg/dL (mean 143 2 mg/dL), and 5.9% of children had an admission blood glucose 180 mg/dL (mean 260 18 mg/dL). Only 13% of our patients had a known history of diabetes prior to admission, suggesting that the hyperglycemia was a result of the stress of the medical illness or the surgery. Stress hyperglycemia, defined as a transient increase in blood glucose level during acute physiological stress, has been reported to occur in 4% of children with an acute non‐critical illness and in more than 50% of children in the ICU.
A few studies have reported on the impact of inpatient hyperglycemia in children with acute critical illness.1015 Three retrospective studies have demonstrated that admission hyperglycemia is also a predictor of adverse outcomes in the pediatric intensive care unit.20, 22 Srinivasan and colleagues22 demonstrated that 86% of patients in their pediatric intensive care unit had a glucose value >126 mg/dL at some point during their stay. In addition, they showed that duration of the hyperglycemia and peak glucose were also associated with mortality. Faustino and Apkon20 demonstrated that hyperglycemia occurs frequently among critically‐ill nondiabetic children and is correlated with a greater in‐hospital mortality rate and longer length of stay in the ICU. They reported a 2.5‐fold increased risk of dying if the maximum glucose obtained within 24 hours of admission to the ICU was >150 mg/dL. More recently, Yates et al.25 reported that hyperglycemia in the postoperative period was associated with increased morbidity and mortality in postoperative pediatric cardiac patients. Other studies in children with traumatic brain or head injury have also shown an association between poor neurological outcome and elevated admission blood glucose.24, 2628 Brain trauma patients with permanent neurological deficits and in a vegetative state were found to have significantly higher admission blood glucose concentrations than children with good neurological recovery or minimal deficits. In addition, the development of inpatient hyperglycemia in children with extensive burn injuries, covering more than 60% of total body surface area, was found to increase the risk of bacteremia and fungemia, reduce skin graft adhesion, and increase the mortality rate.29 These data show an association of initial glucose, peak glucose, and duration of hyperglycemia with increased incidence of morbidity and mortality in children with acute critical illness. We found no association between initial blood glucose and risk of death. This is in contrast to our previous results in adult patients, in whom inpatient hyperglycemia was found to represent an important marker of increased morbidity and mortality among both those critically ill and not critically ill.3 It is important to note that the overall mortality rate reported in children with hyperglycemia relates to severity of illness and is significantly lower than that of adults.30 In most critically ill pediatric series, hospital mortality ranges from 2% to 5.3% and is higher in patients with severe trauma and those who underwent major cardiac surgery.23, 31 The mortality in children without critical illness admitted to general pediatric wards is significantly lower.30
In agreement with the increasing rate of obesity among children with diabetes,32, 33 especially in minority populations, we found that hospitalized children with a history of diabetes and glucose >180 mg/dL had a higher body mass index than those with normoglycemia (P < .001). Obesity in children has been associated with the presence of several comorbidities and an increased risk of hospital complications.34, 35 There is also increasing evidence among patients admitted to the intensive care unit that obesity contributes to increased morbidity and to a prolonged length of stay.35 Because they have a higher rate of hyperglycemia, diabetes, and hospital complications, we believe that obese children should be screened for hyperglycemia and diabetes.
We acknowledge the following limitations of this study. The main limitation was its retrospective nature. The method of blood glucose collection and analysis was not standardized; thus, it prevented uniformity in the determination of serum glucose values of individual patients. We arbitrarily used 3 glucose cutoff values in this study (<120, 120179, and >180 mg/dL). Although similar values have been used in inpatient diabetes studies,2022 there is no uniform definition of hyperglycemia in hospitalized patients, and the clinical significance of these cutoff values in pediatric population has not been determined. The study was conducted in a single institution in Atlanta, whose population and disease spectrum might be different from those at other pediatric institutions. Our study did not address the question of whether treatment of hyperglycemia might improve the outcome of length of hospital stay of patients with hyperglycemia. We believe that newly diagnosed hyperglycemia is usually considered a transient finding in response to acute illness not requiring medical intervention, as indicated by the fact that more than half of these patients did not receive antidiabetic therapy. Another limitation of our study is that we were not able to determine the percentage of patients with latent or unrecognized diabetes because of the lack of hemoglobin A1C testing and follow‐up after discharge. A prospective, randomized trial of strict glycemic control is certainly needed to address these issues.
In summary, inpatient hyperglycemia is a common finding in children with and without critical illness. One‐fourth of the children admitted to the hospital had hyperglycemia, most of them without a history of diabetes prior to admission. Although we found a higher need for ICU admission and a longer length of ICU stay, hyperglycemia in pediatric patients was not associated with higher hospital mortality compared with that in children with normoglycemia. Several observational studies have reported an association of hyperglycemia with poor clinical outcome in critically ill children; however, no prospective controlled studies have assessed the effect of tight glucose control in pediatric populations. These studies need to be prospective, randomized multicenter trials of sufficient magnitude to provide a well‐powered analysis to enable multiple observations and evaluation of subsets of critically and non‐critically ill pediatric patients.
- ,,, et al.Diabetes trends in the U.S.: 1990–1998.Diabetes Care.2000;23:1278–1283.
- ,,,,.Unrecognized diabetes among hospitalized patients.Diabetes Care.1998;21:246–249.
- ,,, et al.Hyperglycemia: an independent marker of in‐hospital mortality in patients with undiagnosed diabetes.J Clin Endocrinol Metab.2002;87:978–982.
- ,,, et al.Hospital hypoglycemia: not only treatment but also prevention.Endocr Pract.2004;10(Suppl 2):89–99.
- ,,,.Stress hyperglycaemia and increased risk of death after myocardial infarction in patients with and without diabetes: a systematic overview.Lancet.2000;355:773–778.
- ,,, et al.Management of diabetes and hyperglycemia in hospitals.Diabetes Care.2004;27:553–597.
- ,,,.Outcomes and perioperative hyperglycemia in patients with or without diabetes mellitus undergoing coronary artery bypass grafting.Ann Thorac Surg.2003;75:1392–1399.
- .Blood glucose management during critical illness.Rev Endocr Metab Disord.2003;4:187–194.
- ,,.Hyperglycemia in acutely ill patients.JAMA.2002;288:2167–2169.
- ,.ICU care for patients with diabetes.Curr Opin Endocrinol.2004;11:75–81.
- ,,.Admission plasma glucose. Independent risk factor for long‐term prognosis after myocardial infarction even in nondiabetic patients.Diabetes Care.1999;22:1827–1831.
- ,,,.Glucose control and mortality in critically ill patients.JAMA.2003;290:2041–2047.
- .Association between hyperglycemia and increased hospital mortality in a heterogeneous population of critically ill patients.Mayo Clin Proc.2003;78:1471–1478.
- ,,, et al.Management of hyperglycemic crises in patients with diabetes.Diabetes Care.2001;24:131–153.
- .Prospective randomised study of intensive insulin treatment on long term survival after acute myocardial infarction in patients with diabetes mellitus. DIGAMI (Diabetes Mellitus, Insulin Glucose Infusion in Acute Myocardial Infarction) Study Group.BMJ.1997;314:1512–1515.
- ,,, et al.Intensive insulin therapy in the medical ICU.N Engl J Med.2006;354:449–461.
- ,,, et al.Intensive insulin therapy in the critically ill patients.N Engl J Med.2001;345:1359–1367.
- ,,, et al.Early postoperative glucose control predicts nosocomial infection rate in diabetic patients.JPEN J Parenter Enteral Nutr.1998;22:77–81.
- ,,,,,.Prevalence of stress hyperglycemia among patients attending a pediatric emergency department.J Pediatr.1994;124:547–551.
- ,.Persistent hyperglycemia in critically ill children.J Pediatr.2005;146:30–34.
- ,, et al.[Metabolic changes in critically ill children].An Esp Pediatr.1999;51:143–148.
- ,,,,,:Association of timing, duration, and intensity of hyperglycemia with intensive care unit mortality in critically ill children.Pediatr Crit Care Med.2004;5:329–336.
- ,,.Improved survival with hospitalists in a pediatric intensive care unit.Crit Care Med2003;31:847–852.
- ,,,,,:High prevalence of stress hyperglycaemia in children with febrile seizures and traumatic injuries.Acta Paediatr2001;90:618–622.
- ,,, et al.Hyperglycemia is a marker for poor outcome in the postoperative pediatric cardiac patient.Pediatr Crit Care Med.2006;7:351–355.
- ,,,:Hyperglycemia and outcomes from pediatric traumatic brain injury.J Trauma.2003;55:1035–1038.
- ,,, et al.Prognostic implications of hyperglycaemia in paediatric head injury.Childs Nerv Syst.1998;14:455–459.
- ,,, et al.Gunshot wounds in brains of children: prognostic variables in mortality, course, and outcome.J Neurotrauma.1998;15:967–972.
- ,,,,,:Association of hyperglycemia with increased mortality after severe burn injury.J Trauma.51:540–544,2001.
- ,,, et al.Impact of a health maintenance organization hospitalist system in academic pediatrics.Pediatrics.2002;110:720–728.
- ,.Can regionalization decrease the number of deaths for children who undergo cardiac surgery? A theoretical analysis.Pediatrics.2002;109:173–181.
- ,,,.Emerging epidemic of type 2 diabetes in youth.Diabetes Care.1999;22:345–354.
- ,.Type 2 diabetes in children and adolescents: screening, diagnosis, and management.JAAPA.2007;20:51–54.
- ,,,,,.Childhood body mass index and perioperative complications.Paediatr Anaesth.2007;17:426–430.
- ,,,.Childhood obesity increases duration of therapy during severe asthma exacerbations.Pediatr Crit Care Med.2006;7:527–531.
Diabetes is one of the most common diagnoses in hospitalized patients.1, 2 Hyperglycemia is present in 38% of adults admitted to the hospital, one third of whom had no history of diabetes before admission.3 The impact of inpatient hyperglycemia on clinical outcome in adult patients has been increasingly appreciated. Extensive evidence from observational studies indicates that hyperglycemia in patients with or without a history of diabetes is an important marker of poor clinical outcome.312 Several prospective randomized trials in patients with critical illness have shown that aggressive glycemic control improves short‐ and long‐term mortality, multiorgan failure and systemic infection, and length of hospitalization.1317 The importance of glucose control also applies to adult patients admitted to general surgical and medical wards.3, 6, 18 In such patients, we recently reported that the presence of hyperglycemia is associated with prolonged hospital stay, infection, disability after hospital discharge, and death.3, 6, 18 Despite the extensive data in adult patients, there is little information on the impact of inpatient hyperglycemia in pediatric patients. The few observational studies in critically ill children admitted to the pediatric ICU with severe brain injury or extensive burn injuries have shown a positive association between inpatient hyperglycemia and increased length of hospital and ICU stay and a higher risk of complication and mortality rates.1923 No previous studies, however, have examined the association of hyperglycemia and clinical outcome in children admitted to a general community pediatric hospital. Therefore, in this study we determined the prevalence of inpatient hyperglycemia and examined the impact of hyperglycemia on morbidity and mortality in children admitted to Hughes Spalding Children's Hospital, a large community hospital serving the inner city and indigent pediatric population in Atlanta, Georgia.
MATERIALS AND METHODS
This was a retrospective observational cohort of pediatric patients consecutively admitted to Hughes Spalding Children's Hospital in Atlanta from January 2004 to August 2004. This general community pediatric hospital is part of the Grady Health System in Atlanta, a large health care organization that operates under the auspices of the Fulton‐Dekalb Hospital Authoritythe major counties in metropolitan Atlantato deliver care to their uninsured and underserved populations. Ninety percent of the organization's inpatient cases are either uninsured or dependent on Medicaid. This is a broad‐based pediatric hospital without cardiac surgery, burn, or dedicated inpatient hematology‐oncology units. Patients are managed by members of the pediatric residency program and supervised by faculty members from Emory University School of Medicine. The Institutional Review Board of Emory University and Grady Health System Oversight Research Committee approved the methods for data collection and analysis used in the study and waived the need for informed consent.
The medical records of 903 consecutive pediatric patients admitted to both critical and noncritical care areas were reviewed. For the analysis, patients were divided according to a known history of diabetes prior to admission and according to admission blood glucose concentration. A normoglycemic group included patients with normal plasma glucose and without a history of diabetes. Serum or plasma glucose measured in the laboratory was assumed to be equivalent to blood glucose measured by finger stick at bedside using a glucose meter. Hyperglycemia was defined as an admission or in‐hospital blood glucose level >120 mg/dL. High blood glucose was subsequently divided into those with blood glucose of 120179 mg/dL and those with blood glucose 180 mg/dL. Patient information was collected regarding demographic characteristics, blood glucose level on admission and during hospital stay, concurrent medical diagnoses, medical treatment, and hospital outcome (including mortality and disposition at discharge).
The primary objectives of this study were to determine the prevalence of in‐hospital hyperglycemia and to examine the association of hyperglycemia and mortality in children with critical and noncritical illness in a community pediatric hospital. Secondary end points included length of hospital stay, requirement of intensive care, and treatment of hyperglycemia. In addition to blood glucose level, prognostic variables included sex, age, body mass index, admission diagnosis, presence of comorbidities, and intensive care unit admission.
Statistical Analysis
To compare demographics and clinical characteristics between groups, the independent t test and ANOVA with Sheff's method were used for continuous variables. Levine's test for homogeneity of variances and log transformations were used when necessary. For categorical variables, 2 analysis was used. P < .05 was considered significant. SPSS version 12.0 (SPSS, Inc., Chicago, IL), was the statistical software used for the analysis.
RESULTS
Of the 903 admitted patients, 342 patients (38%) had no blood glucose measurement during the hospital stay and were excluded from the analysis. Three patients with a length of stay greater than 6 months were excluded. In addition, 16 patients admitted with diabetic ketoacidosis (DKA) and 1 subject with hyperglycemic hyperosmolar syndrome were also excluded from the analysis. The remaining 542 patients constituted the study population. Most of these, 406 patients (75%), had an admission blood glucose concentration 120 mg/dL (mean SEM 98 1 mg/dL, median 93 mg/dL). A total of 103 children (19%) had an admission blood glucose level of 121179 mg/dL (mean 143 2 mg/dL, median 140 mg/dL), and 32 patients (5.9%) had an admission blood glucose level >180 mg/dL (mean 260 18 mg/dL, median 211 mg/dL; Fig. 1).
The clinical characteristics of study patients are shown in Table 1. Most patients in this study were from minority ethnic groups82% were black, 12% were Hispanic, 2% were from other minority groups, and 4.2% were white. There were no significant differences in mean age, sex, racial distribution, or body mass index among the 3 groups. A total of 409 patients (75.5%) were admitted to general pediatric wards and 133 patients (24.5%) were admitted to the surgical unit. There were no differences in the admission blood glucose between patients admitted to general pediatric wards (112.2 mg/dL) and those admitted to surgical areas (115.7 mg/dL, P > .05). The most common diagnoses in the severe hyperglycemia group were trauma/surgery (25%), pulmonary disease (18.8%), metabolic disorders (12.5%), and infection (6.3%). Most children admitted with hyperglycemia had no history of diabetes prior to admission. Among the 135 children with admission hyperglycemia (blood glucose >120 mg/dL), 17 patients (13%) had a known history of diabetes or were receiving therapy prior to admission. The mean admission blood glucose was 162.4 mg/dL (range 121480 mg/dL) in children with new hyperglycemia and 369.8 mg/dL (range 145678 mg/dL) in those children with a known history of diabetes (P < .01). Among children without a history of diabetes, 33 of 118 children (28%) with admission hyperglycemia had 1 or more glucose values >120 mg/dL during their hospitalizations. Twenty‐five children had a blood glucose of 121179 mg/dL (mean 109 5 mg/dL), and 8 children had a blood glucose 180 mg/dL (mean 159 13 mg/dL). Most patients with a history of diabetes were admitted with significant hyperglycemia. One patient (1%) had a glucose level in the 121179 mg/dL category, and 16 patients (50%) had a glucose level >180 mg/dL.
| BG <120 mg/dL | BG 121179 mg/dL | BG 180 mg/dL | |
|---|---|---|---|
| |||
| No. of patients (%) | 406 (75%) | 103 (19%) | 32 (6%) |
| Mean age (years) | 7.0 .4 | 6.8 .6 | 7.8 1.1 |
| Sex (M/F) | 50/50 | 57/43 | 50/50 |
| Race | |||
| White | 4% | 8% | 9% |
| Black | 80% | 80% | 84% |
| Hispanic | 15% | 10% | 6% |
| Other | 1% | 2% | 1% |
| Weight on admission (kg) | 29 2 | 26 3 | 32 6 |
| Height on admission (cm) | 79 4 | 94 9 | 74 19 |
| Body mass index (kg/m2) | 17 5 | 18 4 | 37 16 |
| Mean admission BG | 92 1 | 143 2 | 260 18 |
| Mean inpatient BG | 96 3 | 109 5 | 159 13 |
| Mean length of hospital stay | 3.8 0.2 | 5.4 1.0 | 5.7 1.8 |
| Mean length of ICU stay | 0.6 0.1 | 1.1 .4a | 3.6 1.9 |
| Admission service (%) | |||
| Pediatrics | 79.6% | 58.8% | 72.4% |
| Surgery | 20.4% | 41.2% | 27.6% |
The presence of hyperglycemia on admission in pediatric patients was not associated with increased mortality or with increased length of hospital stay. There was only 1 death reported during the study period, which occurred in a patient with respiratory failure because of bronchiolitis who was admitted with an admission blood glucose of 151 mg/dL. The mean length of stay for patients with normoglycemia was 3.83 0.2 days, which increased to 5.36 1.0 and 5.68 1.8 days for children with blood glucose of 120179 and 180 mg/dL, respectively (P > .05).
Children with hyperglycemia were more likely to be admitted to the ICU and had a longer length of ICU stay. Admission to the ICU was needed by 10% of children with an admission blood glucose <120 mg/dL, 18% of children with a blood glucose of 120179 mg/dL, and 40% of children with an admission blood 180 mg/dL (P < .01). In addition, length of ICU stay was significantly longer for hyperglycemic children, particularly those with a glucose level 180 mg/dL (P < .001). The mean length of ICU stay (ICU) was 0.56 0.1 days for patients with normoglycemia, and 1.1 0.4 days and 3.6 1.9 days for patients with a blood glucose of 120179 and 180 mg/dL, respectively (P < .01).
Newly diagnosed hyperglycemia was frequently left untreated. Only 3 children without a history of diabetes but with hyperglycemia recorded during the hospital stay received insulin therapy. New hyperglycemia patients received regular insulin per a sliding scale as the main insulin regimen in the hospital. In contrast, all patients with a previous history of diabetes were treated with insulin during their hospital stay.
DISCUSSION
Diabetes mellitus represents a significant public health burden on the basis of increased morbidity, mortality, and economic costs. Increasing evidence from observational and prospective interventional studies has shown that inpatient hyperglycemia is a predictor of poor clinical outcome of adult subjects.313, 16, 17 Admission hyperglycemia has been associated with increased morbidity and mortality in patients with critical illness, as well as in noncritically ill adult subjects admitted to general surgical and medical wards.3, 6, 18 In this study we also found that hyperglycemia is a common finding in children admitted with critical and noncritical illnesses and that most children had no history of diabetes before admission. One‐fourth of the children admitted to the hospital had hyperglycemia on admission. Children with hyperglycemia were more likely to be admitted to the ICU and had a longer length of ICU stay; however, inpatient hyperglycemia was not associated with higher hospital mortality or longer hospital stay than was inpatient normoglycemia. Our findings suggest that recognition of inpatient hyperglycemia can be improved because screening for hyperglycemia was not performed in more than one third of patients (38%) during the hospital stay.
The prevalence of inpatient hyperglycemia in children varies according to the severity of the illness and the study population. Ruiz Magro et al.21 reported that 50% of 353 critically ill children without diabetes mellitus had initial glucose values >120 mg/dL. In a study of 942 nondiabetic patients, Faustino et al.20 found that within 24 hours of admission to the ICU, hyperglycemia was prevalent in 70.4% of patients with a glucose value >120 mg/dL, 44.5% of patients with a glucose value >150 mg/dL, and 22.3% of patients with a glucose value >200 mg/dL. The prevalence of hyperglycemia in non‐critically ill children seen in the emergency department was much lower, ranging from 3.8% to 5.0% (based on an initial blood glucose >150 mg/dL).19, 24 In agreement with these studies, we found inpatient hyperglycemia to be a common finding among hospitalized children. Approximately 75% of our patients had a normal blood glucose on admission, 19% had an admission blood glucose of 121179 mg/dL (mean 143 2 mg/dL), and 5.9% of children had an admission blood glucose 180 mg/dL (mean 260 18 mg/dL). Only 13% of our patients had a known history of diabetes prior to admission, suggesting that the hyperglycemia was a result of the stress of the medical illness or the surgery. Stress hyperglycemia, defined as a transient increase in blood glucose level during acute physiological stress, has been reported to occur in 4% of children with an acute non‐critical illness and in more than 50% of children in the ICU.
A few studies have reported on the impact of inpatient hyperglycemia in children with acute critical illness.1015 Three retrospective studies have demonstrated that admission hyperglycemia is also a predictor of adverse outcomes in the pediatric intensive care unit.20, 22 Srinivasan and colleagues22 demonstrated that 86% of patients in their pediatric intensive care unit had a glucose value >126 mg/dL at some point during their stay. In addition, they showed that duration of the hyperglycemia and peak glucose were also associated with mortality. Faustino and Apkon20 demonstrated that hyperglycemia occurs frequently among critically‐ill nondiabetic children and is correlated with a greater in‐hospital mortality rate and longer length of stay in the ICU. They reported a 2.5‐fold increased risk of dying if the maximum glucose obtained within 24 hours of admission to the ICU was >150 mg/dL. More recently, Yates et al.25 reported that hyperglycemia in the postoperative period was associated with increased morbidity and mortality in postoperative pediatric cardiac patients. Other studies in children with traumatic brain or head injury have also shown an association between poor neurological outcome and elevated admission blood glucose.24, 2628 Brain trauma patients with permanent neurological deficits and in a vegetative state were found to have significantly higher admission blood glucose concentrations than children with good neurological recovery or minimal deficits. In addition, the development of inpatient hyperglycemia in children with extensive burn injuries, covering more than 60% of total body surface area, was found to increase the risk of bacteremia and fungemia, reduce skin graft adhesion, and increase the mortality rate.29 These data show an association of initial glucose, peak glucose, and duration of hyperglycemia with increased incidence of morbidity and mortality in children with acute critical illness. We found no association between initial blood glucose and risk of death. This is in contrast to our previous results in adult patients, in whom inpatient hyperglycemia was found to represent an important marker of increased morbidity and mortality among both those critically ill and not critically ill.3 It is important to note that the overall mortality rate reported in children with hyperglycemia relates to severity of illness and is significantly lower than that of adults.30 In most critically ill pediatric series, hospital mortality ranges from 2% to 5.3% and is higher in patients with severe trauma and those who underwent major cardiac surgery.23, 31 The mortality in children without critical illness admitted to general pediatric wards is significantly lower.30
In agreement with the increasing rate of obesity among children with diabetes,32, 33 especially in minority populations, we found that hospitalized children with a history of diabetes and glucose >180 mg/dL had a higher body mass index than those with normoglycemia (P < .001). Obesity in children has been associated with the presence of several comorbidities and an increased risk of hospital complications.34, 35 There is also increasing evidence among patients admitted to the intensive care unit that obesity contributes to increased morbidity and to a prolonged length of stay.35 Because they have a higher rate of hyperglycemia, diabetes, and hospital complications, we believe that obese children should be screened for hyperglycemia and diabetes.
We acknowledge the following limitations of this study. The main limitation was its retrospective nature. The method of blood glucose collection and analysis was not standardized; thus, it prevented uniformity in the determination of serum glucose values of individual patients. We arbitrarily used 3 glucose cutoff values in this study (<120, 120179, and >180 mg/dL). Although similar values have been used in inpatient diabetes studies,2022 there is no uniform definition of hyperglycemia in hospitalized patients, and the clinical significance of these cutoff values in pediatric population has not been determined. The study was conducted in a single institution in Atlanta, whose population and disease spectrum might be different from those at other pediatric institutions. Our study did not address the question of whether treatment of hyperglycemia might improve the outcome of length of hospital stay of patients with hyperglycemia. We believe that newly diagnosed hyperglycemia is usually considered a transient finding in response to acute illness not requiring medical intervention, as indicated by the fact that more than half of these patients did not receive antidiabetic therapy. Another limitation of our study is that we were not able to determine the percentage of patients with latent or unrecognized diabetes because of the lack of hemoglobin A1C testing and follow‐up after discharge. A prospective, randomized trial of strict glycemic control is certainly needed to address these issues.
In summary, inpatient hyperglycemia is a common finding in children with and without critical illness. One‐fourth of the children admitted to the hospital had hyperglycemia, most of them without a history of diabetes prior to admission. Although we found a higher need for ICU admission and a longer length of ICU stay, hyperglycemia in pediatric patients was not associated with higher hospital mortality compared with that in children with normoglycemia. Several observational studies have reported an association of hyperglycemia with poor clinical outcome in critically ill children; however, no prospective controlled studies have assessed the effect of tight glucose control in pediatric populations. These studies need to be prospective, randomized multicenter trials of sufficient magnitude to provide a well‐powered analysis to enable multiple observations and evaluation of subsets of critically and non‐critically ill pediatric patients.
- ,,, et al.Diabetes trends in the U.S.: 1990–1998.Diabetes Care.2000;23:1278–1283.
- ,,,,.Unrecognized diabetes among hospitalized patients.Diabetes Care.1998;21:246–249.
- ,,, et al.Hyperglycemia: an independent marker of in‐hospital mortality in patients with undiagnosed diabetes.J Clin Endocrinol Metab.2002;87:978–982.
- ,,, et al.Hospital hypoglycemia: not only treatment but also prevention.Endocr Pract.2004;10(Suppl 2):89–99.
- ,,,.Stress hyperglycaemia and increased risk of death after myocardial infarction in patients with and without diabetes: a systematic overview.Lancet.2000;355:773–778.
- ,,, et al.Management of diabetes and hyperglycemia in hospitals.Diabetes Care.2004;27:553–597.
- ,,,.Outcomes and perioperative hyperglycemia in patients with or without diabetes mellitus undergoing coronary artery bypass grafting.Ann Thorac Surg.2003;75:1392–1399.
- .Blood glucose management during critical illness.Rev Endocr Metab Disord.2003;4:187–194.
- ,,.Hyperglycemia in acutely ill patients.JAMA.2002;288:2167–2169.
- ,.ICU care for patients with diabetes.Curr Opin Endocrinol.2004;11:75–81.
- ,,.Admission plasma glucose. Independent risk factor for long‐term prognosis after myocardial infarction even in nondiabetic patients.Diabetes Care.1999;22:1827–1831.
- ,,,.Glucose control and mortality in critically ill patients.JAMA.2003;290:2041–2047.
- .Association between hyperglycemia and increased hospital mortality in a heterogeneous population of critically ill patients.Mayo Clin Proc.2003;78:1471–1478.
- ,,, et al.Management of hyperglycemic crises in patients with diabetes.Diabetes Care.2001;24:131–153.
- .Prospective randomised study of intensive insulin treatment on long term survival after acute myocardial infarction in patients with diabetes mellitus. DIGAMI (Diabetes Mellitus, Insulin Glucose Infusion in Acute Myocardial Infarction) Study Group.BMJ.1997;314:1512–1515.
- ,,, et al.Intensive insulin therapy in the medical ICU.N Engl J Med.2006;354:449–461.
- ,,, et al.Intensive insulin therapy in the critically ill patients.N Engl J Med.2001;345:1359–1367.
- ,,, et al.Early postoperative glucose control predicts nosocomial infection rate in diabetic patients.JPEN J Parenter Enteral Nutr.1998;22:77–81.
- ,,,,,.Prevalence of stress hyperglycemia among patients attending a pediatric emergency department.J Pediatr.1994;124:547–551.
- ,.Persistent hyperglycemia in critically ill children.J Pediatr.2005;146:30–34.
- ,, et al.[Metabolic changes in critically ill children].An Esp Pediatr.1999;51:143–148.
- ,,,,,:Association of timing, duration, and intensity of hyperglycemia with intensive care unit mortality in critically ill children.Pediatr Crit Care Med.2004;5:329–336.
- ,,.Improved survival with hospitalists in a pediatric intensive care unit.Crit Care Med2003;31:847–852.
- ,,,,,:High prevalence of stress hyperglycaemia in children with febrile seizures and traumatic injuries.Acta Paediatr2001;90:618–622.
- ,,, et al.Hyperglycemia is a marker for poor outcome in the postoperative pediatric cardiac patient.Pediatr Crit Care Med.2006;7:351–355.
- ,,,:Hyperglycemia and outcomes from pediatric traumatic brain injury.J Trauma.2003;55:1035–1038.
- ,,, et al.Prognostic implications of hyperglycaemia in paediatric head injury.Childs Nerv Syst.1998;14:455–459.
- ,,, et al.Gunshot wounds in brains of children: prognostic variables in mortality, course, and outcome.J Neurotrauma.1998;15:967–972.
- ,,,,,:Association of hyperglycemia with increased mortality after severe burn injury.J Trauma.51:540–544,2001.
- ,,, et al.Impact of a health maintenance organization hospitalist system in academic pediatrics.Pediatrics.2002;110:720–728.
- ,.Can regionalization decrease the number of deaths for children who undergo cardiac surgery? A theoretical analysis.Pediatrics.2002;109:173–181.
- ,,,.Emerging epidemic of type 2 diabetes in youth.Diabetes Care.1999;22:345–354.
- ,.Type 2 diabetes in children and adolescents: screening, diagnosis, and management.JAAPA.2007;20:51–54.
- ,,,,,.Childhood body mass index and perioperative complications.Paediatr Anaesth.2007;17:426–430.
- ,,,.Childhood obesity increases duration of therapy during severe asthma exacerbations.Pediatr Crit Care Med.2006;7:527–531.
Copyright © 2008 Society of Hospital Medicine
Percentage of Health Care Workers who Smoke at KHMC
Smoking represents the single most important cause of premature death and potentially lost years of life in the developing countries. Cigarette smoking causes more than 350,000 deaths each year in the United States and more than 4.9 million premature deaths worldwide.1 Death as a consequence of smoking is by no means limited to the elderly. Tobacco is the largest single cause of premature death and accounts for 3 of 10 of all deaths that occur among smokers and nonsmokers between the ages 35 and 69.2 Because most health professionals deal with different smoking‐related health problems, they make up the sector with the greatest potential to influence reducing smoking among their patients if they can show a positive attitude toward smoking‐cessation intervention.3 Tobacco smoking by health care workers has a negative influence on the general population.3, 4 The World Health Organization (WHO) has advocated that physicians should not smoke cigarettes, and surveys on this issue should be conducted among medical professionals.35 In Jordan, the prevalence of smoking is high and is increasing among women, but there are no data about the prevalence of smoking among physicians and other health care workers (HCWs).5 As members of an antismoking committee working at King Hussein Medical Center (KHMC) we realized that before applying any tobacco control strategy, it was important to understand the prevalence of smoking among HCWs at our center. To our knowledge, no representative survey of smoking among physicians in Jordan has been reported.
This study describes the prevalence of cigarettes smoking among HCWs in the largest tertiary‐care hospital in Jordan.
METHODS
The study was approved by the local ethics committee at KHMC and was conducted between June 1999 and September 1999. The study involved 600 representative samples of HCWs at KHMC. Subjects were divided into 3 groups according to their professions (physicians, nurses, and other professions). Each subject was interviewed personally. Questions were designed to obtain various demographic data and cigarette smoking characteristics. All other forms of tobacco consumption were not included into the questionnaire. Questions addressed various factors such as the age at which smoking was started and its duration and the number of cigarettes smoked per day. We defined smoking status as current smoker, occasional smoker, past smoker, or never smoker, according to WHO's 1995 definitions.4 Current smokers were those who had smoked at least 100 cigarettes and who were currently smoking on a daily basis. Occasional smokers were those who did not smoke daily. Past (ex‐)smokers were those nonsmokers who previously smoked every day for 6 months or more. The rate of cigarette smoking was calculated for each age group and for different medical specialties. Statistical analysis was performed with Statistical Package for Social Sciences 10.0 software (SPSS Inc., Chicago, IL). The 2 test was used to determine statistical significance. The 2‐tailed significance level was set at 5% (P 0.05).
RESULTS
Among the 600 respondents, there were 310 women (52%) and 290 men (48%), of whom 260 (43%) were physicians, 250 (42%) were nurses, and 90 (15%) were other HCWs. The total prevalence of smoking was 65%, ranging from 10% in the dermatologist group to 75% in the family practitioner group. We learned that 52% of smokers started before age 21 and that 78% started their habit during the first 2 years of college. The most common motive for starting smoking was pleasure encouraged by peer influence. Eighty‐two percent of male HCWs smoked cigarettes compared with 47% of female HCWs. The prevalence of current smokers was 77% and 33% in men and women, respectively (P = .002). Forty‐three percent of women did not smoke cigarettes, whereas only 14% of men did not smoke (P = .002; Table 1). Smoking prevalence did not significantly differ between age groups (P = .38; Table 2). The highest rate of smoking was among current smokers age 3140 years (58%). Of the 260 physicians, 46% were smokers, (currently or occasionally), 29% were ex‐smokers, and 25% were nonsmokers. Sixty‐seven percent of physicians who were smokers smoked 1120 cigarettes/day. There were fewer current smokers among physicians than among other HCWs (46% versus 74%, respectively). The highest percentage of smokers in the physician group was observed among family practitioners working in the emergency room (75%). On the other hand, dermatologists had the lowest percentage (10%). Women in general had a lower prevalence than men in all categories. Of the female nurses, 17% were smokers, 13% were ex‐smokers, and 70% were nonsmokers. The smoking rate of female nurses fell below their male counterparts (17% and 49%, respectively; P = .002). Seventy‐eight percent of the nonsmoking physicians reported that they do ask their patients routinely about their smoking history and encourage them to discontinue this habit. Only 36% of the physicians who smoked provide such advice during their clinical practice.
| Smoking status | Men (n = 310) | Women (n = 290) | Total (n = 600) | |||
|---|---|---|---|---|---|---|
| n | % | n | % | n | % | |
| Current smoker | 238 | 77 | 96 | 33 | 334 | 56 |
| Occasional smoker | 17 | 5 | 40 | 14 | 57 | 9 |
| Ex‐smoker | 12 | 4 | 30 | 10 | 42 | 7 |
| Nonsmoker | 43 | 14 | 124 | 43 | 167 | 28 |
| Smoking status | Age group | |||||
|---|---|---|---|---|---|---|
| 30 Years | 3140 Years | >40 Years | ||||
| n | % | n | % | n | % | |
| Current smoker | 92 | 54% | 170 | 58% | 72 | 52% |
| Occasional smoker | 19 | 11% | 22 | 8% | 16 | 12% |
| Ex‐smoker | 10 | 6% | 12 | 4% | 20 | 14% |
| Nonsmoker | 49 | 29% | 88 | 30% | 30 | 22% |
| Total | 170 | 292 | 138 | |||
DISCUSSION
Tobacco use, notably cigarette smoking, is the leading cause of an array of preventable diseases.12 It is estimated that approximately 30%40% of the adult population worldwide smokes. The situation is particularly alarming in adolescents.5, 6 The prevalence of smoking in developing countries now equals or exceeds the high smoking levels common in the United Kingdom 20 or 30 years ago.6 There is a significant difference in smoking prevalence between socioeconomic groups in the Western world. For professional people the prevalence is now 16%, whereas for unskilled manual workers the prevalence is 48%.7 HCWs are important opinion leaders in the community, and their behavior more than their words has a significant impact on the lifestyle of their patients.3, 89 It is therefore discouraging to learn that so many doctors and nurses still smoke. The smoking habits of health staff members may influence their attitudes toward patients.810 Numerous international studies have addressed the issue of smoking among physicians and other HCWs.816 In a study conducted by Ohida et al.,8 the prevalence of smoking among Japanese physicians was 27.1% for men and 6.8% for women, about half the general population in Japan (male, 54.0%; female, 14.5%). The prevalence of smoking varied in other industrialized countries: in the United States, the prevalence was 3% of men and 10% of women9; in the United Kingdom, it was 4% of men and 5% of women10; in France, 33% of men and 24% of women;11 and in the Netherlands, 41% of men and 24% of women12 Approximately 40% of Italian general practitioners and approximately 45% of their Spanish colleagues also smoke.13 There are limited published data addressing the issue of cigarette smoking among physicians and other HCWs in various Arab countries. Our results showed a higher rate of cigarette smoking among Jordanian physicians compared with that in the surrounding Arab countries.1416 Physicians at KHMC have a very high prevalence of cigarette smokingfar above the results reported in the above‐noted countries. It is comparable with that of unskilled manual workers in the Western world.2, 5 It has been reported that the highest smoking prevalence among young women in the East Mediterranean region occurs in Jordan.17 Our study showed that the smoking rate among women at KHMC, especially among nursing staff, is much lower than that of men, but this might change in the coming years if antismoking measures are not applied and directed toward younger generations. Smoking practice widely varies among the nonmedical KHMC staff and is reaching a very dangerous and worrisome level. This study was the first to be conducted to calculate the prevalence of smoking among HCWs at the largest tertiary‐care hospital in Jordan. A limitation of our study was that the number of responders included in this study might not fully represent the smoking status among HCWs in the country. However, the results raise some important issues to be discussed and analyzed further on a national level concerning this growing health problem. Physicians play an important role in accelerating the process of smoking cessation. Physicians should play an active role in the control of smoking by participating in public debate regarding smoking, both individually and through medical organizations. Nonsmoking physicians at KHMC were more active in asking patients about smoking habits than were those who smoked. The physician smokers were less critical of smoking than were the physician nonsmokers. Jordanian physicians do not fully comply with the rules against tobacco smoking in hospital. Smoking doctors frequently smoke in the hospital and do not counsel patients about smoking.10, 11, 13 Special effort is needed in the educational field concerning the issue of tobacco smoking for Jordanian physicians, and a strong initiative toward smoke‐free hospitals would help spread the message. To promote antismoking measures among doctors and nurses, it will be necessary to scrutinize the smoking habits and behavior of medical and nursing students18 and to conduct effective antismoking and health education activities before they acquire the smoking habit.
- Centers for Disease Control and Prevention.Smoking‐attributable mortality and years of potential life lost—United States, 1990.MMMWR Morb Mortal Wkly Rep.1993;42:645–648.
- ,,,,.Mortality from tobacco in developed countries: indirect estimation from national vital statistics.Lancet.1992;339:1268–1278.
- Working Group on Tobacco or Health.Guidelines for the conduct of tobacco smoking surveys among health professionals.Tokyo, Japan:World Health Organization Regional Office for Western Pacific;1987:9–19.
- World Health Organization.Leave the Pack Behind.Geneva, Switzerland:World Health Organization;1999:33–39.
- ,,,Tobacco Control Country Profiles.2nd ed.Atlanta, GA:American Cancer Society;2003:220–221.
- .The Seventh World Conference on Tobacco and Health.Thorax.1990;45:560–562.
- Department of Health.Smoke‐Free for Health, an Action Plan to Achieve the Health of the Nation Targets on Smoking.London:Department of Health;1994.
- ,,, et al.Smoking prevalence and attitudes toward smoking among Japanese physicians.JAMA.2001;286:917.
- ,,, et al.Trends in cigarette smoking among US physicians and nurses.JAMA.1994;271:1273–1275.
- ,,, et al.Attitudes to smoking and smoking habits among hospital staff.Thorax.1993;48:174–175.
- ,,,,.Smoking by French general practitioners: behaviour, attitudes and practice.Eur J Public Health.2005;15:33–38.
- ,,,.Prevalence of smoking in physicians and medical students, and the generation effect in the Netherlands.Soc Sci Med.1993;36:817–822.
- .Smoking habits of Italian health professionals.Ital Heart J.2001;2:110–112.
- ,,.Knowledge of and attitudes towards tobacco control among smoking and non‐smoking physicians in 2 Gulf Arab states.Saudi Med J.2004;25:585–591.
- ,,.Smoking habits among physicians in two Gulf countries.J R Soc Health.1993;113:298–301.
- .Smoking habits of primary health care physicians in Bahrain.J R Soc Health.1999;119:36–39.
- ,,,Tobacco Control Country Profiles.1st ed.Atlanta, GA:American Cancer Society;2000:30.
- ,,,.Smoking habits and attitudes of medical students towards smoking and antismoking campaigns in nine Asian countries. The Tobacco and Health Committee of the International Union Against Tuberculosis and Lung Diseases.Int J Epidemiol.1992;21:298–304.
Smoking represents the single most important cause of premature death and potentially lost years of life in the developing countries. Cigarette smoking causes more than 350,000 deaths each year in the United States and more than 4.9 million premature deaths worldwide.1 Death as a consequence of smoking is by no means limited to the elderly. Tobacco is the largest single cause of premature death and accounts for 3 of 10 of all deaths that occur among smokers and nonsmokers between the ages 35 and 69.2 Because most health professionals deal with different smoking‐related health problems, they make up the sector with the greatest potential to influence reducing smoking among their patients if they can show a positive attitude toward smoking‐cessation intervention.3 Tobacco smoking by health care workers has a negative influence on the general population.3, 4 The World Health Organization (WHO) has advocated that physicians should not smoke cigarettes, and surveys on this issue should be conducted among medical professionals.35 In Jordan, the prevalence of smoking is high and is increasing among women, but there are no data about the prevalence of smoking among physicians and other health care workers (HCWs).5 As members of an antismoking committee working at King Hussein Medical Center (KHMC) we realized that before applying any tobacco control strategy, it was important to understand the prevalence of smoking among HCWs at our center. To our knowledge, no representative survey of smoking among physicians in Jordan has been reported.
This study describes the prevalence of cigarettes smoking among HCWs in the largest tertiary‐care hospital in Jordan.
METHODS
The study was approved by the local ethics committee at KHMC and was conducted between June 1999 and September 1999. The study involved 600 representative samples of HCWs at KHMC. Subjects were divided into 3 groups according to their professions (physicians, nurses, and other professions). Each subject was interviewed personally. Questions were designed to obtain various demographic data and cigarette smoking characteristics. All other forms of tobacco consumption were not included into the questionnaire. Questions addressed various factors such as the age at which smoking was started and its duration and the number of cigarettes smoked per day. We defined smoking status as current smoker, occasional smoker, past smoker, or never smoker, according to WHO's 1995 definitions.4 Current smokers were those who had smoked at least 100 cigarettes and who were currently smoking on a daily basis. Occasional smokers were those who did not smoke daily. Past (ex‐)smokers were those nonsmokers who previously smoked every day for 6 months or more. The rate of cigarette smoking was calculated for each age group and for different medical specialties. Statistical analysis was performed with Statistical Package for Social Sciences 10.0 software (SPSS Inc., Chicago, IL). The 2 test was used to determine statistical significance. The 2‐tailed significance level was set at 5% (P 0.05).
RESULTS
Among the 600 respondents, there were 310 women (52%) and 290 men (48%), of whom 260 (43%) were physicians, 250 (42%) were nurses, and 90 (15%) were other HCWs. The total prevalence of smoking was 65%, ranging from 10% in the dermatologist group to 75% in the family practitioner group. We learned that 52% of smokers started before age 21 and that 78% started their habit during the first 2 years of college. The most common motive for starting smoking was pleasure encouraged by peer influence. Eighty‐two percent of male HCWs smoked cigarettes compared with 47% of female HCWs. The prevalence of current smokers was 77% and 33% in men and women, respectively (P = .002). Forty‐three percent of women did not smoke cigarettes, whereas only 14% of men did not smoke (P = .002; Table 1). Smoking prevalence did not significantly differ between age groups (P = .38; Table 2). The highest rate of smoking was among current smokers age 3140 years (58%). Of the 260 physicians, 46% were smokers, (currently or occasionally), 29% were ex‐smokers, and 25% were nonsmokers. Sixty‐seven percent of physicians who were smokers smoked 1120 cigarettes/day. There were fewer current smokers among physicians than among other HCWs (46% versus 74%, respectively). The highest percentage of smokers in the physician group was observed among family practitioners working in the emergency room (75%). On the other hand, dermatologists had the lowest percentage (10%). Women in general had a lower prevalence than men in all categories. Of the female nurses, 17% were smokers, 13% were ex‐smokers, and 70% were nonsmokers. The smoking rate of female nurses fell below their male counterparts (17% and 49%, respectively; P = .002). Seventy‐eight percent of the nonsmoking physicians reported that they do ask their patients routinely about their smoking history and encourage them to discontinue this habit. Only 36% of the physicians who smoked provide such advice during their clinical practice.
| Smoking status | Men (n = 310) | Women (n = 290) | Total (n = 600) | |||
|---|---|---|---|---|---|---|
| n | % | n | % | n | % | |
| Current smoker | 238 | 77 | 96 | 33 | 334 | 56 |
| Occasional smoker | 17 | 5 | 40 | 14 | 57 | 9 |
| Ex‐smoker | 12 | 4 | 30 | 10 | 42 | 7 |
| Nonsmoker | 43 | 14 | 124 | 43 | 167 | 28 |
| Smoking status | Age group | |||||
|---|---|---|---|---|---|---|
| 30 Years | 3140 Years | >40 Years | ||||
| n | % | n | % | n | % | |
| Current smoker | 92 | 54% | 170 | 58% | 72 | 52% |
| Occasional smoker | 19 | 11% | 22 | 8% | 16 | 12% |
| Ex‐smoker | 10 | 6% | 12 | 4% | 20 | 14% |
| Nonsmoker | 49 | 29% | 88 | 30% | 30 | 22% |
| Total | 170 | 292 | 138 | |||
DISCUSSION
Tobacco use, notably cigarette smoking, is the leading cause of an array of preventable diseases.12 It is estimated that approximately 30%40% of the adult population worldwide smokes. The situation is particularly alarming in adolescents.5, 6 The prevalence of smoking in developing countries now equals or exceeds the high smoking levels common in the United Kingdom 20 or 30 years ago.6 There is a significant difference in smoking prevalence between socioeconomic groups in the Western world. For professional people the prevalence is now 16%, whereas for unskilled manual workers the prevalence is 48%.7 HCWs are important opinion leaders in the community, and their behavior more than their words has a significant impact on the lifestyle of their patients.3, 89 It is therefore discouraging to learn that so many doctors and nurses still smoke. The smoking habits of health staff members may influence their attitudes toward patients.810 Numerous international studies have addressed the issue of smoking among physicians and other HCWs.816 In a study conducted by Ohida et al.,8 the prevalence of smoking among Japanese physicians was 27.1% for men and 6.8% for women, about half the general population in Japan (male, 54.0%; female, 14.5%). The prevalence of smoking varied in other industrialized countries: in the United States, the prevalence was 3% of men and 10% of women9; in the United Kingdom, it was 4% of men and 5% of women10; in France, 33% of men and 24% of women;11 and in the Netherlands, 41% of men and 24% of women12 Approximately 40% of Italian general practitioners and approximately 45% of their Spanish colleagues also smoke.13 There are limited published data addressing the issue of cigarette smoking among physicians and other HCWs in various Arab countries. Our results showed a higher rate of cigarette smoking among Jordanian physicians compared with that in the surrounding Arab countries.1416 Physicians at KHMC have a very high prevalence of cigarette smokingfar above the results reported in the above‐noted countries. It is comparable with that of unskilled manual workers in the Western world.2, 5 It has been reported that the highest smoking prevalence among young women in the East Mediterranean region occurs in Jordan.17 Our study showed that the smoking rate among women at KHMC, especially among nursing staff, is much lower than that of men, but this might change in the coming years if antismoking measures are not applied and directed toward younger generations. Smoking practice widely varies among the nonmedical KHMC staff and is reaching a very dangerous and worrisome level. This study was the first to be conducted to calculate the prevalence of smoking among HCWs at the largest tertiary‐care hospital in Jordan. A limitation of our study was that the number of responders included in this study might not fully represent the smoking status among HCWs in the country. However, the results raise some important issues to be discussed and analyzed further on a national level concerning this growing health problem. Physicians play an important role in accelerating the process of smoking cessation. Physicians should play an active role in the control of smoking by participating in public debate regarding smoking, both individually and through medical organizations. Nonsmoking physicians at KHMC were more active in asking patients about smoking habits than were those who smoked. The physician smokers were less critical of smoking than were the physician nonsmokers. Jordanian physicians do not fully comply with the rules against tobacco smoking in hospital. Smoking doctors frequently smoke in the hospital and do not counsel patients about smoking.10, 11, 13 Special effort is needed in the educational field concerning the issue of tobacco smoking for Jordanian physicians, and a strong initiative toward smoke‐free hospitals would help spread the message. To promote antismoking measures among doctors and nurses, it will be necessary to scrutinize the smoking habits and behavior of medical and nursing students18 and to conduct effective antismoking and health education activities before they acquire the smoking habit.
- Centers for Disease Control and Prevention.Smoking‐attributable mortality and years of potential life lost—United States, 1990.MMMWR Morb Mortal Wkly Rep.1993;42:645–648.
- ,,,,.Mortality from tobacco in developed countries: indirect estimation from national vital statistics.Lancet.1992;339:1268–1278.
- Working Group on Tobacco or Health.Guidelines for the conduct of tobacco smoking surveys among health professionals.Tokyo, Japan:World Health Organization Regional Office for Western Pacific;1987:9–19.
- World Health Organization.Leave the Pack Behind.Geneva, Switzerland:World Health Organization;1999:33–39.
- ,,,Tobacco Control Country Profiles.2nd ed.Atlanta, GA:American Cancer Society;2003:220–221.
- .The Seventh World Conference on Tobacco and Health.Thorax.1990;45:560–562.
- Department of Health.Smoke‐Free for Health, an Action Plan to Achieve the Health of the Nation Targets on Smoking.London:Department of Health;1994.
- ,,, et al.Smoking prevalence and attitudes toward smoking among Japanese physicians.JAMA.2001;286:917.
- ,,, et al.Trends in cigarette smoking among US physicians and nurses.JAMA.1994;271:1273–1275.
- ,,, et al.Attitudes to smoking and smoking habits among hospital staff.Thorax.1993;48:174–175.
- ,,,,.Smoking by French general practitioners: behaviour, attitudes and practice.Eur J Public Health.2005;15:33–38.
- ,,,.Prevalence of smoking in physicians and medical students, and the generation effect in the Netherlands.Soc Sci Med.1993;36:817–822.
- .Smoking habits of Italian health professionals.Ital Heart J.2001;2:110–112.
- ,,.Knowledge of and attitudes towards tobacco control among smoking and non‐smoking physicians in 2 Gulf Arab states.Saudi Med J.2004;25:585–591.
- ,,.Smoking habits among physicians in two Gulf countries.J R Soc Health.1993;113:298–301.
- .Smoking habits of primary health care physicians in Bahrain.J R Soc Health.1999;119:36–39.
- ,,,Tobacco Control Country Profiles.1st ed.Atlanta, GA:American Cancer Society;2000:30.
- ,,,.Smoking habits and attitudes of medical students towards smoking and antismoking campaigns in nine Asian countries. The Tobacco and Health Committee of the International Union Against Tuberculosis and Lung Diseases.Int J Epidemiol.1992;21:298–304.
Sleepiness in Critical Care Nurses
Current practice patterns among nurses show they are working longer than they ever have.14 The effect of these long hours is that many nurses work in the midst of severe lethargy and sleep deprivation.5 Sleep deprivation jeopardizes not only patient safety but also the safety and general health of the nurses themselves.46 Numerous studies of shift workers in other professions have been done to assess sleepiness using subjective and objective data and also the effect of shift work on work and health.710 Despite the Accreditation Council for Graduate Medical Education (ACGME) mandating work‐hour limitations for medical residents, recent data suggest that sleepiness continues to be a significant issue for medical residents.11 There is a paucity of objective information about the sleepiness and performance of nurses, especially now that most nurses in the United States are working 12‐hour shifts. We hypothesized that nurses working a 12‐hour night shift would have a significant degree of sleepiness. Our objective was to assess the daytime sleepiness of post‐night‐shift nurses using both subjective measures (Epworth Sleepiness Scale [ESS]) and objective testing (Multiple Sleep Latency Test [MSLT]).
MATERIALS AND METHODS
The study was initiated after we obtained institutional review board approval.
Setting
The setting of the study was a community hospital in Corpus Christi, Texas.
Design
The study was a prospective pilot study.
Subjects
Twenty adult nurses (age > 18 years) assigned to duty on general floors (both medical and surgical) and the intensive care unit (ICU) who consented to participate in the study were included. Exclusion criteria included recent or ongoing use of sedative, hypnotic, stimulant drugs; illnesses such as cardiac disease; narcolepsy and other primary sleep disorders; being pregnant or lactating, and being obese (body mass index [BMI] > 30).
Protocol
Floor nurses (n = 10) constituted the control group, and ICU nurses (n = 10) formed the study group. Both groups of nurses came on duty at 7 PM and completed their duty at 7 AM. The MSLT test was performed in the morning following either the third or fourth night shift. All nurses maintained a detailed sleep diary for the week prior to the day of the test that included a detailed record of their bedtimes, wake times, and daytime naps and also included comments about nocturnal awakenings and subjective sleepiness. All nurses were asked to fill out the ESS prior to undergoing the MSLT. ESS is a well‐standardized and validated measure of subjective sleepiness.12 The score was established based on the questionnaire about their chances of falling asleep in 6 different scenarios. A score greater than 8 was considered abnormal. A modified protocol for MSLT was used, which consisted of only 2 nap opportunities. This was done to enable these nurses to go home at a reasonable time in order to catch up on their sleep after having spent the previous night at work. The MSLT procedure was explained to nurses before the start of study, and the MSLT was done at 7:15 AM and 8:30 AM. Standard guidelines for the test were followed.13 Nurses were given $25 gift certificates on completion of the study.
Statistical Analysis
Standard software was used for computation of all data. The t test was used for comparison of means, and Fisher's exact analysis was used to compare proportions. All P values are 2 sided. The term significant indicates a P value < .05. Computations were performed using Microsoft Excel software.
RESULTS
Baseline data are shown in Table 1. Nurses in the 2 groups were matched for age, sex, and marital and offspring status. There was a small but statistically significant difference between the 2 groups in BMI (see Table 1). There was no difference between the 2 groups in the average time slept (per night) in the week preceding the test. Seven of 10 ICU nurses had an abnormal ESS (>8) compared with 2 of 10 floor nurses. Mean ESS of ICU nurses was also higher (5.6 2.1 vs. 8.7 3.9 minutes, respectively, P = .042). Nine of 10 ICU nurses had sleep latency values in the severe pathologic range (<5 minutes) for the first sleep period, compared with only 2 of 10 in the floor group. Mean sleep latency in the nap 1 period differed significantly between the 2 groups (Table 2). Overall, however, mean MSLT value did not differ between the ICU nurses and the control group (6.1 3.8 vs. 10.6 7.5 minutes; Table 2 and Fig. 1). Also, during MSLT, the nurses were unaware of their sleep onset in 10 of the 32 periods (31.3%).

| Variable | ICU nurses (n = 10) | Floor nurses (n = 10) | P value |
|---|---|---|---|
| |||
| Age (years) | 37.1 7.53 | 34.6 7.19 | .45 |
| Sex (M:F) | 4:6 | 1:9 | .118 |
| BMI* | 24.9 3.5 | 21.6 1.9 | .02 |
| Married | 5 | 6 | .315 |
| With Children | 6 | 5 | .315 |
| Variable | ICU nurses (n = 10) | Floor nurses (n = 10) | P value |
|---|---|---|---|
| |||
| Sleep time (minutes) | 405.2 36.6 | 416.1 84.73 | .72 |
| ESS score* | 8.7 3.9 | 5.6 2.1 | .042 |
| Abnormal ESS (>8)* | 7 | 2 | .032 |
| MSLT (min) | 6.1 3.8 | 1.6 7.5 | .19 |
| First‐period sleep latency < 5 minutes* | 9 | 2 | <.005 |
| First nap MSLT | 4.65 5.56 | 1.85 7.44 | .025 |
DISCUSSION
Our study shows that nurses working night shifts have a pathologic degree of sleepiness. This was especially severe in the ICU nurses as determined by both the ESS and the MSLT studies.
To our knowledge, ours is the first study that has comprehensively evaluated the issue of sleepiness in nurses working night shifts using both the ESS and the MSLT. Previous studies have evaluated subjective sleepiness in nurses. In a cross‐sectional study in 8 large hospitals in Japan, Suzuki et al. found that an estimated 26% of the 4407 nurses surveyed reported excess sleepiness.14 They found key associations of daytime sleepiness with motor vehicle accidents, medication errors, and incorrect operation of medical equipment. Scott et al. randomly surveyed 502 critical care nurses across the US and found that almost two thirds reported struggling to stay awake at least once during the study period and that 22% fell asleep at least once during their work shift.2 Sleep deprivation resulting in impairment in cognitive and psychomotor performance and its association with medical errors have now been well documented in medical residents.1517 This has resulted in the Accreditation Council for Graduate Medical Education mandating a reduction in resident work hours.18 No state or federal regulations restrict the number of hours a nurse may voluntarily work in a 24‐hour or a 7‐day period. Bills prohibiting mandatory overtime for nurses have passed only in California, Maine, New Jersey, and Oregon. No measure, either proposed or enacted, addresses how long nurses may work voluntarily. The recent Institute of Medicine (IOM) report, Keeping Patients Safe, explicitly recommends that nurses' shifts be limited to 12 hours in a 24‐hour period, 60 hours per week, and that voluntary overtime be limited.19
Even with the current ACGME‐mandated reduction in work hours, we and others have reported that sleepiness in medical residents continues to be a major issue.11, 20 In the first year following implementation of the ACGME duty‐hour standards, as many as 43% of interns reported noncompliance with these requirements.21 This demonstrates that mandating work‐hour reductions is only the first step in what is likely to be a long process of effecting change in nurse work hours and fatigue and, in turn, improving patient safety. However, initiating this process is going to be crucial, given the impact even small changes in nursing fatigue could have on patient‐care outcomes.
A nationwide nursing shortage has placed enormous stress on the delivery of patient care in our hospitals. Demands of nursing care requirements have also increased in today's health care scenario because of a variety of socioeconomic factors, and this in turn has forced hospitals to encourage and in many instances insist on nurses working overtime and longer shifts. Rogers et al. examined logbooks completed by 393 hospital staff nurses and found that 40% of the 5317 work shifts they logged exceeded 12 hours. The risk of making an error was significantly increased when the work shift was longer than 12 hours, when overtime was worked, and when the workweek was more than 40 hours.5 There are good data comparing 8‐ and 12‐hour shift lengths among other occupational groups that demonstrate, particularly for the night shift, greater sleepiness during a 12‐hour night shift than during an 8‐hour night shift.22 Emergency room physicians overwhelmingly prefer shifts to last 8 and 10 hours than 12 hours, and longer shifts have been shown to impair their triage decisions in simulation studies.23 The problem is compounded for female nurses, as they also have to carry out their responsibilities as partner and parent along with working, resulting in chronic fatigue and sleep deprivation.24 From these results together with the results of the present study, we suggest enforcing a shift length of no longer than 10 hours for nurses working the night shift in a critical care environment.
In our study, ICU nurses were found to be more sleepy than floor nurses. Sleep quantity in the week prior to the study day did not differ between the 2 groups (405.2 36.6 vs. 416.1 84.73 minutes; P = .364; Fig. 2). For the 24 hours prior to the night shift that was studied, the average amount of sleep was not different between the 2 groups (406 65 minutes for the ICU group vs. 432 107 minutes for the control group; P = .265; Fig. 4). Sleep quality could certainly be markedly different between the 2 groups. A recent study has reported that nearly a third of ICU nurses had severe burnout syndrome, and this has been associated with profound sleep disturbances.25, 26 This could also be attributed to the floor nurses having a less demanding schedule than the ICU nurses.
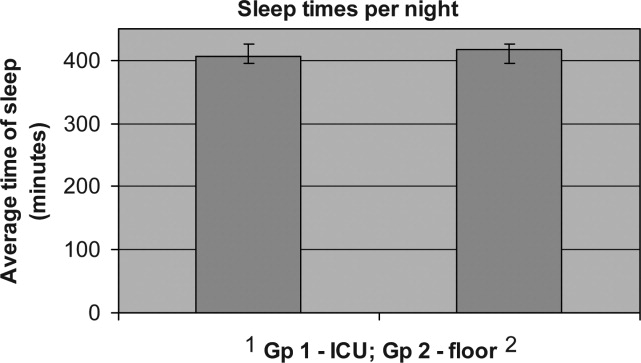
Our study had some limitations. Our sample size was small, and larger studies may be needed to validate the results of this pilot study. Although our 2 groups were matched for age and sex, the BMI of ICU nurses was slightly but statistically significantly higher than that of floor nurses. Although the mean BMI of ICU nurses was still not in the obese range (one of the exclusion criteria was a BMI > 30), we still cannot definitively rule out that the higher BMI may have conferred a risk of increased upper airway resistance and sleep‐disordered breathing. The control group consisted of RNs in different settingsmedical and surgicaland because of the small numbers of nurses studied, we are unable to further dissect this group and identify differences in degrees of sleepiness. For example, sleep deprivation effects have been shown to be less pronounced in nurses regularly and permanently working night shifts than in nurses working to rotating shifts,27 perhaps a consequence of circadian misalignment being more severe in the latter group, and this factor was not controlled for. We also measured sleepiness after the shift was completed and not during the shift. Not only is this likely reflective of the nurses' sleepiness toward the latter portion of their shift, it also has direct implications for the driving safety of nurses at the end of a shift.
Our MSLT data showed significant differences only for nap 1 but not when combined for the 2 nap periods. We speculate that the reason for this could be that some alertness was recovered by the first nap, as 9 of 10 in the ICU group had at least 15 minutes of sleep during the first nap opportunity compared with only 2 of 10 nurses in the floor group. Incidentally, the only nurse in the ICU group who had no sleep during the first nap period had a sleep latency of 2 minutes during the second nap period (see Fig. 3).
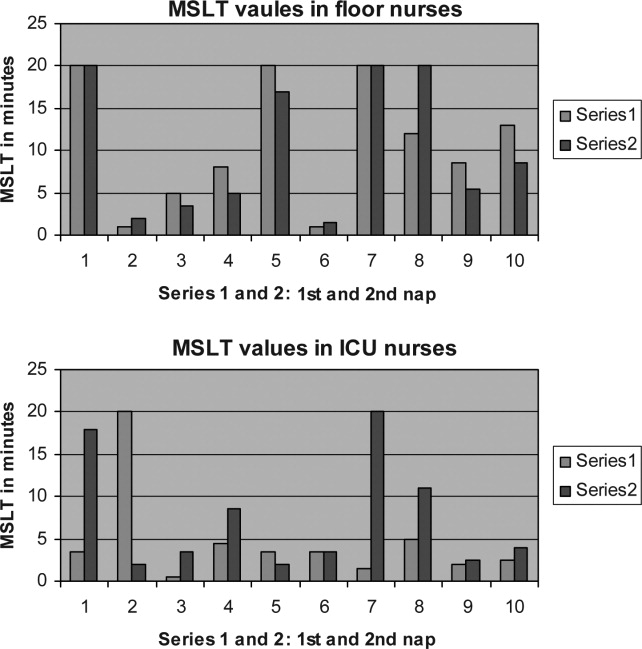
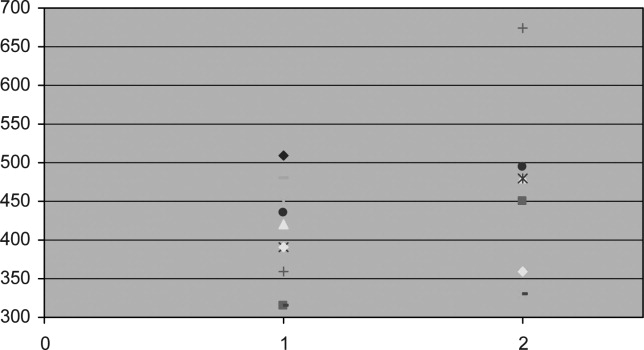
We also did not correlate sleepiness in our study with any clinical performance, and this will be an important variable to focus on in future studies.
In conclusion, our data indicate that nurses working in the ICU are significantly more sleepy than nurses on the floor. Level of sleepiness of ICU nurses is frequently in the pathologic range, comparable to narcolepsy.
- ,.Trends in nurse overtime, 1995–2002.Policy Polit Nurs Pract.2005;6:183–190.
- ,,,.Effects of critical care nurses' work hours on vigilance and patients' safety.Am J Crit Care.2006;15:30–37.
- ,,,,.How long and how much are nurses now working?Am J Nurs.2006;106:60–71.
- ,.Are you tired? Sleep deprivation compromises nurse's health and jeopardizes patients.Am J Nurs.2004;104:36–38.
- ,,,,.The working hours of hospital staff nurses and patient safety.Health Aff (Millwood).2004;23:202–212.
- ,.Twelve‐hour night shifts of healthcare workers: a risk to the patients?Chronobiol Int.2003;20:351–360.
- ,,,,.The sleep of long‐haul truck drivers.N Engl J Med.1997;337:755–761.
- ,,, et al.Subjective and objective measures of adaptation and readaptation to night work on an oil rig in the North Sea.Sleep.2006;29:821–829.
- ,,,,.Shift work sleep disorder: prevalence and consequences beyond that of symptomatic day workers.Sleep.2004;27:1453–1462.
- ,.Impact of shift work on the health and safety of nurses and patients.Clin J Oncol Nurs.2006;0:465–471.
- ,,,,.Sleepiness in medical residents: Impact of mandated reduction in work hours.Sleep Med.2007;8:90–93.
- .A new method for measuring daytime sleepiness: the Epworth sleepiness scale.Sleep.1991;14:540–545.
- ,,,,,, et al.Standards of practice committee of the American Academy of Sleep Medicine. Practice parameters for clinical use of the multiple sleep latency test and the maintenance of wakefulness test.Sleep.2005;28:113–121.
- ,,,,.Daytime sleepiness, sleep habits and occupational accidents among hospital nurses.J Adv Nurs.2005;52:445–453.
- ,,,,.Neurobehavioral performance of residents after heavy night call vs after alcohol ingestion.JAMA.2005;294:1025–1033.
- .Simulation study of rested versus sleep‐deprived anesthesiologists.Anesthesiology.2003;98:1345–1355.
- ,,,.The risks and implication of excessive daytime sleepiness in resident physicians.Acad Med.2002;77:1019–1025.
- Accreditation Council for Graduate Medical Education. Common program requirements. Available at: http://www.acgme.org/acWebsite/dutyHours/dh_dutyHoursCommonPR.pdf.
- Institute of Medicine.Keeping Patients Safe: Transforming the Work Environment of Nurses.Washington, DC:National Academies Press;2003.
- ,,, et al.Sleep and well‐being of ICU housestaff.Chest.2007;131:1685–1693.
- ,,,,.Interns' compliance with accreditation council for graduate medical education work‐hour limits.JAMA.2006;296:1063–1070.
- ,,, et al.Effects of alternating 8‐ and 12‐hour shifts on sleep, sleepiness, physical effort and performance.Scand J Work Environ Health.1998;24:62–68.
- ,,, et al.Emergency medicine residents' shiftwork tolerance and preference.Acad Emerg Med.2000;7:670–673.
- ,,,.A study of female nurses combining partner and parent roles with working a continuous three‐shift roster: the impact on sleep, fatigue and stress.Contemp Nurse.2002;12:294–302.
- ,,, et al.Burnout syndrome in critical care nursing staff.Am J Respir Crit Care Med2007;175:698–704.
- ,,, et al.Disturbed sleep and fatigue in occupational burnout.Scand J Work Environ Health.2006;32:121.
- .A computer‐aided comparative study of progressive alertness changes in nurses working two different night‐shift rotations.J Adv Nurs.1996;23:1247–1253.
Current practice patterns among nurses show they are working longer than they ever have.14 The effect of these long hours is that many nurses work in the midst of severe lethargy and sleep deprivation.5 Sleep deprivation jeopardizes not only patient safety but also the safety and general health of the nurses themselves.46 Numerous studies of shift workers in other professions have been done to assess sleepiness using subjective and objective data and also the effect of shift work on work and health.710 Despite the Accreditation Council for Graduate Medical Education (ACGME) mandating work‐hour limitations for medical residents, recent data suggest that sleepiness continues to be a significant issue for medical residents.11 There is a paucity of objective information about the sleepiness and performance of nurses, especially now that most nurses in the United States are working 12‐hour shifts. We hypothesized that nurses working a 12‐hour night shift would have a significant degree of sleepiness. Our objective was to assess the daytime sleepiness of post‐night‐shift nurses using both subjective measures (Epworth Sleepiness Scale [ESS]) and objective testing (Multiple Sleep Latency Test [MSLT]).
MATERIALS AND METHODS
The study was initiated after we obtained institutional review board approval.
Setting
The setting of the study was a community hospital in Corpus Christi, Texas.
Design
The study was a prospective pilot study.
Subjects
Twenty adult nurses (age > 18 years) assigned to duty on general floors (both medical and surgical) and the intensive care unit (ICU) who consented to participate in the study were included. Exclusion criteria included recent or ongoing use of sedative, hypnotic, stimulant drugs; illnesses such as cardiac disease; narcolepsy and other primary sleep disorders; being pregnant or lactating, and being obese (body mass index [BMI] > 30).
Protocol
Floor nurses (n = 10) constituted the control group, and ICU nurses (n = 10) formed the study group. Both groups of nurses came on duty at 7 PM and completed their duty at 7 AM. The MSLT test was performed in the morning following either the third or fourth night shift. All nurses maintained a detailed sleep diary for the week prior to the day of the test that included a detailed record of their bedtimes, wake times, and daytime naps and also included comments about nocturnal awakenings and subjective sleepiness. All nurses were asked to fill out the ESS prior to undergoing the MSLT. ESS is a well‐standardized and validated measure of subjective sleepiness.12 The score was established based on the questionnaire about their chances of falling asleep in 6 different scenarios. A score greater than 8 was considered abnormal. A modified protocol for MSLT was used, which consisted of only 2 nap opportunities. This was done to enable these nurses to go home at a reasonable time in order to catch up on their sleep after having spent the previous night at work. The MSLT procedure was explained to nurses before the start of study, and the MSLT was done at 7:15 AM and 8:30 AM. Standard guidelines for the test were followed.13 Nurses were given $25 gift certificates on completion of the study.
Statistical Analysis
Standard software was used for computation of all data. The t test was used for comparison of means, and Fisher's exact analysis was used to compare proportions. All P values are 2 sided. The term significant indicates a P value < .05. Computations were performed using Microsoft Excel software.
RESULTS
Baseline data are shown in Table 1. Nurses in the 2 groups were matched for age, sex, and marital and offspring status. There was a small but statistically significant difference between the 2 groups in BMI (see Table 1). There was no difference between the 2 groups in the average time slept (per night) in the week preceding the test. Seven of 10 ICU nurses had an abnormal ESS (>8) compared with 2 of 10 floor nurses. Mean ESS of ICU nurses was also higher (5.6 2.1 vs. 8.7 3.9 minutes, respectively, P = .042). Nine of 10 ICU nurses had sleep latency values in the severe pathologic range (<5 minutes) for the first sleep period, compared with only 2 of 10 in the floor group. Mean sleep latency in the nap 1 period differed significantly between the 2 groups (Table 2). Overall, however, mean MSLT value did not differ between the ICU nurses and the control group (6.1 3.8 vs. 10.6 7.5 minutes; Table 2 and Fig. 1). Also, during MSLT, the nurses were unaware of their sleep onset in 10 of the 32 periods (31.3%).
| Variable | ICU nurses (n = 10) | Floor nurses (n = 10) | P value |
|---|---|---|---|
| |||
| Age (years) | 37.1 7.53 | 34.6 7.19 | .45 |
| Sex (M:F) | 4:6 | 1:9 | .118 |
| BMI* | 24.9 3.5 | 21.6 1.9 | .02 |
| Married | 5 | 6 | .315 |
| With Children | 6 | 5 | .315 |
| Variable | ICU nurses (n = 10) | Floor nurses (n = 10) | P value |
|---|---|---|---|
| |||
| Sleep time (minutes) | 405.2 36.6 | 416.1 84.73 | .72 |
| ESS score* | 8.7 3.9 | 5.6 2.1 | .042 |
| Abnormal ESS (>8)* | 7 | 2 | .032 |
| MSLT (min) | 6.1 3.8 | 1.6 7.5 | .19 |
| First‐period sleep latency < 5 minutes* | 9 | 2 | <.005 |
| First nap MSLT | 4.65 5.56 | 1.85 7.44 | .025 |
DISCUSSION
Our study shows that nurses working night shifts have a pathologic degree of sleepiness. This was especially severe in the ICU nurses as determined by both the ESS and the MSLT studies.
To our knowledge, ours is the first study that has comprehensively evaluated the issue of sleepiness in nurses working night shifts using both the ESS and the MSLT. Previous studies have evaluated subjective sleepiness in nurses. In a cross‐sectional study in 8 large hospitals in Japan, Suzuki et al. found that an estimated 26% of the 4407 nurses surveyed reported excess sleepiness.14 They found key associations of daytime sleepiness with motor vehicle accidents, medication errors, and incorrect operation of medical equipment. Scott et al. randomly surveyed 502 critical care nurses across the US and found that almost two thirds reported struggling to stay awake at least once during the study period and that 22% fell asleep at least once during their work shift.2 Sleep deprivation resulting in impairment in cognitive and psychomotor performance and its association with medical errors have now been well documented in medical residents.1517 This has resulted in the Accreditation Council for Graduate Medical Education mandating a reduction in resident work hours.18 No state or federal regulations restrict the number of hours a nurse may voluntarily work in a 24‐hour or a 7‐day period. Bills prohibiting mandatory overtime for nurses have passed only in California, Maine, New Jersey, and Oregon. No measure, either proposed or enacted, addresses how long nurses may work voluntarily. The recent Institute of Medicine (IOM) report, Keeping Patients Safe, explicitly recommends that nurses' shifts be limited to 12 hours in a 24‐hour period, 60 hours per week, and that voluntary overtime be limited.19
Even with the current ACGME‐mandated reduction in work hours, we and others have reported that sleepiness in medical residents continues to be a major issue.11, 20 In the first year following implementation of the ACGME duty‐hour standards, as many as 43% of interns reported noncompliance with these requirements.21 This demonstrates that mandating work‐hour reductions is only the first step in what is likely to be a long process of effecting change in nurse work hours and fatigue and, in turn, improving patient safety. However, initiating this process is going to be crucial, given the impact even small changes in nursing fatigue could have on patient‐care outcomes.
A nationwide nursing shortage has placed enormous stress on the delivery of patient care in our hospitals. Demands of nursing care requirements have also increased in today's health care scenario because of a variety of socioeconomic factors, and this in turn has forced hospitals to encourage and in many instances insist on nurses working overtime and longer shifts. Rogers et al. examined logbooks completed by 393 hospital staff nurses and found that 40% of the 5317 work shifts they logged exceeded 12 hours. The risk of making an error was significantly increased when the work shift was longer than 12 hours, when overtime was worked, and when the workweek was more than 40 hours.5 There are good data comparing 8‐ and 12‐hour shift lengths among other occupational groups that demonstrate, particularly for the night shift, greater sleepiness during a 12‐hour night shift than during an 8‐hour night shift.22 Emergency room physicians overwhelmingly prefer shifts to last 8 and 10 hours than 12 hours, and longer shifts have been shown to impair their triage decisions in simulation studies.23 The problem is compounded for female nurses, as they also have to carry out their responsibilities as partner and parent along with working, resulting in chronic fatigue and sleep deprivation.24 From these results together with the results of the present study, we suggest enforcing a shift length of no longer than 10 hours for nurses working the night shift in a critical care environment.
In our study, ICU nurses were found to be more sleepy than floor nurses. Sleep quantity in the week prior to the study day did not differ between the 2 groups (405.2 36.6 vs. 416.1 84.73 minutes; P = .364; Fig. 2). For the 24 hours prior to the night shift that was studied, the average amount of sleep was not different between the 2 groups (406 65 minutes for the ICU group vs. 432 107 minutes for the control group; P = .265; Fig. 4). Sleep quality could certainly be markedly different between the 2 groups. A recent study has reported that nearly a third of ICU nurses had severe burnout syndrome, and this has been associated with profound sleep disturbances.25, 26 This could also be attributed to the floor nurses having a less demanding schedule than the ICU nurses.
Our study had some limitations. Our sample size was small, and larger studies may be needed to validate the results of this pilot study. Although our 2 groups were matched for age and sex, the BMI of ICU nurses was slightly but statistically significantly higher than that of floor nurses. Although the mean BMI of ICU nurses was still not in the obese range (one of the exclusion criteria was a BMI > 30), we still cannot definitively rule out that the higher BMI may have conferred a risk of increased upper airway resistance and sleep‐disordered breathing. The control group consisted of RNs in different settingsmedical and surgicaland because of the small numbers of nurses studied, we are unable to further dissect this group and identify differences in degrees of sleepiness. For example, sleep deprivation effects have been shown to be less pronounced in nurses regularly and permanently working night shifts than in nurses working to rotating shifts,27 perhaps a consequence of circadian misalignment being more severe in the latter group, and this factor was not controlled for. We also measured sleepiness after the shift was completed and not during the shift. Not only is this likely reflective of the nurses' sleepiness toward the latter portion of their shift, it also has direct implications for the driving safety of nurses at the end of a shift.
Our MSLT data showed significant differences only for nap 1 but not when combined for the 2 nap periods. We speculate that the reason for this could be that some alertness was recovered by the first nap, as 9 of 10 in the ICU group had at least 15 minutes of sleep during the first nap opportunity compared with only 2 of 10 nurses in the floor group. Incidentally, the only nurse in the ICU group who had no sleep during the first nap period had a sleep latency of 2 minutes during the second nap period (see Fig. 3).
We also did not correlate sleepiness in our study with any clinical performance, and this will be an important variable to focus on in future studies.
In conclusion, our data indicate that nurses working in the ICU are significantly more sleepy than nurses on the floor. Level of sleepiness of ICU nurses is frequently in the pathologic range, comparable to narcolepsy.
- ,.Trends in nurse overtime, 1995–2002.Policy Polit Nurs Pract.2005;6:183–190.
- ,,,.Effects of critical care nurses' work hours on vigilance and patients' safety.Am J Crit Care.2006;15:30–37.
- ,,,,.How long and how much are nurses now working?Am J Nurs.2006;106:60–71.
- ,.Are you tired? Sleep deprivation compromises nurse's health and jeopardizes patients.Am J Nurs.2004;104:36–38.
- ,,,,.The working hours of hospital staff nurses and patient safety.Health Aff (Millwood).2004;23:202–212.
- ,.Twelve‐hour night shifts of healthcare workers: a risk to the patients?Chronobiol Int.2003;20:351–360.
- ,,,,.The sleep of long‐haul truck drivers.N Engl J Med.1997;337:755–761.
- ,,, et al.Subjective and objective measures of adaptation and readaptation to night work on an oil rig in the North Sea.Sleep.2006;29:821–829.
- ,,,,.Shift work sleep disorder: prevalence and consequences beyond that of symptomatic day workers.Sleep.2004;27:1453–1462.
- ,.Impact of shift work on the health and safety of nurses and patients.Clin J Oncol Nurs.2006;0:465–471.
- ,,,,.Sleepiness in medical residents: Impact of mandated reduction in work hours.Sleep Med.2007;8:90–93.
- .A new method for measuring daytime sleepiness: the Epworth sleepiness scale.Sleep.1991;14:540–545.
- ,,,,,, et al.Standards of practice committee of the American Academy of Sleep Medicine. Practice parameters for clinical use of the multiple sleep latency test and the maintenance of wakefulness test.Sleep.2005;28:113–121.
- ,,,,.Daytime sleepiness, sleep habits and occupational accidents among hospital nurses.J Adv Nurs.2005;52:445–453.
- ,,,,.Neurobehavioral performance of residents after heavy night call vs after alcohol ingestion.JAMA.2005;294:1025–1033.
- .Simulation study of rested versus sleep‐deprived anesthesiologists.Anesthesiology.2003;98:1345–1355.
- ,,,.The risks and implication of excessive daytime sleepiness in resident physicians.Acad Med.2002;77:1019–1025.
- Accreditation Council for Graduate Medical Education. Common program requirements. Available at: http://www.acgme.org/acWebsite/dutyHours/dh_dutyHoursCommonPR.pdf.
- Institute of Medicine.Keeping Patients Safe: Transforming the Work Environment of Nurses.Washington, DC:National Academies Press;2003.
- ,,, et al.Sleep and well‐being of ICU housestaff.Chest.2007;131:1685–1693.
- ,,,,.Interns' compliance with accreditation council for graduate medical education work‐hour limits.JAMA.2006;296:1063–1070.
- ,,, et al.Effects of alternating 8‐ and 12‐hour shifts on sleep, sleepiness, physical effort and performance.Scand J Work Environ Health.1998;24:62–68.
- ,,, et al.Emergency medicine residents' shiftwork tolerance and preference.Acad Emerg Med.2000;7:670–673.
- ,,,.A study of female nurses combining partner and parent roles with working a continuous three‐shift roster: the impact on sleep, fatigue and stress.Contemp Nurse.2002;12:294–302.
- ,,, et al.Burnout syndrome in critical care nursing staff.Am J Respir Crit Care Med2007;175:698–704.
- ,,, et al.Disturbed sleep and fatigue in occupational burnout.Scand J Work Environ Health.2006;32:121.
- .A computer‐aided comparative study of progressive alertness changes in nurses working two different night‐shift rotations.J Adv Nurs.1996;23:1247–1253.
Copyright © 2008 Society of Hospital Medicine
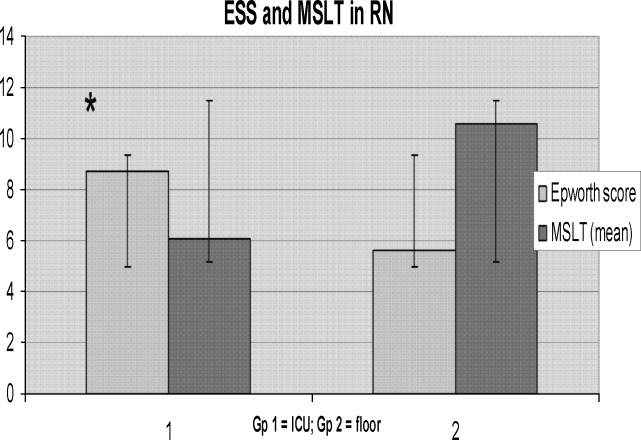
“String‐of‐Pearls”
A 41‐year‐old intravenous drug user (IVDU) was admitted with candidal endophthalmitis 6 weeks after a hospitalization for pneumonia. After discharge from his previous hospitalization which were blood cultures grew Candida albicans, attributed to contamination by a covering physician. The patient described looking through spider webs. Fundoscopic examination revealed fluffy, white string‐of‐pearls opacities with retinal obscuration (Fig. 1). There were no findings of endocarditis (negative echocardiogram) or congestive heart failure. Blood and vitreal cultures grew Candida albicans. The patient underwent a pars plana vitrectomy, and was prescribed chronic fluconazole. He was lost to follow‐up.

Candida albicans is the most common organism identified in endogenous endophthalmitis.1 Predisposing factors include IVDU, indwelling catheters, endocarditis, recent surgeries, immunosuppression, broad‐spectrum antibiotics, and parental nutrition.1 The diagnosis is based on retinal findings of white pinpoint opacities (string‐of‐pearls, Fig. 2), with vitreous involvement and positive cultures. Endocarditis occurs in 15%17% of patients with endophthalmitis.2 This case highlights the importance of physician recognition of the significant attributable morbidity and mortality of candidemia.3, 4

- ,,, et al.Endogenous endophthalmitis with azole‐resistant Candida albicans—case report and review of the literature.Infection.2006;34:285–288.
- ,,, et al.Endogenous endophthalmitis: a 13‐year review at a tertiary hospital in south Australia. ScandinavianJ Infect Dis.2005;37:184–189.
- ,,.Attributable mortaility of candidemia: a systematic review of matched cohort and case‐control studies.Eur J Clin Microbiol Infect Dis.2006;25:419–425.
- ,,, et al.Bloodstream infections in a secondary and tertiary care hospital setting.Intern Med J.2006;765–772.
A 41‐year‐old intravenous drug user (IVDU) was admitted with candidal endophthalmitis 6 weeks after a hospitalization for pneumonia. After discharge from his previous hospitalization which were blood cultures grew Candida albicans, attributed to contamination by a covering physician. The patient described looking through spider webs. Fundoscopic examination revealed fluffy, white string‐of‐pearls opacities with retinal obscuration (Fig. 1). There were no findings of endocarditis (negative echocardiogram) or congestive heart failure. Blood and vitreal cultures grew Candida albicans. The patient underwent a pars plana vitrectomy, and was prescribed chronic fluconazole. He was lost to follow‐up.
Candida albicans is the most common organism identified in endogenous endophthalmitis.1 Predisposing factors include IVDU, indwelling catheters, endocarditis, recent surgeries, immunosuppression, broad‐spectrum antibiotics, and parental nutrition.1 The diagnosis is based on retinal findings of white pinpoint opacities (string‐of‐pearls, Fig. 2), with vitreous involvement and positive cultures. Endocarditis occurs in 15%17% of patients with endophthalmitis.2 This case highlights the importance of physician recognition of the significant attributable morbidity and mortality of candidemia.3, 4
- ,,, et al.Endogenous endophthalmitis with azole‐resistant Candida albicans—case report and review of the literature.Infection.2006;34:285–288.
- ,,, et al.Endogenous endophthalmitis: a 13‐year review at a tertiary hospital in south Australia. ScandinavianJ Infect Dis.2005;37:184–189.
- ,,.Attributable mortaility of candidemia: a systematic review of matched cohort and case‐control studies.Eur J Clin Microbiol Infect Dis.2006;25:419–425.
- ,,, et al.Bloodstream infections in a secondary and tertiary care hospital setting.Intern Med J.2006;765–772.
Physician Specialty and Ischemic Stroke Outcomes
The appropriate role of specialists in hospital management of common medical conditions has been vigorously debated.13 Few argue that specialists serve an important role as consultants, but whether patients with specific conditions should be admitted to the care of specialists or generalists is unresolved. This is demonstrated by the large degree of hospital‐to‐hospital variability in the proportion of patients with myocardial infarction admitted to cardiologists,4 patients with asthma exacerbations admitted to pulmonologists,5 and patients with renal failure admitted to nephrologists.6
Stroke is another common diagnosis, with variable rates of admission to specialists and generalists. Several prior studies have suggested that outcomes after ischemic stroke are better if a neurologist is the attending physician.710 However, these observational studies could not rule out the possibility that differences in outcome were a result of prognosis at the time of admission rather than improvements in medical care. Although these studies have controlled for known prognostic variables, it is possible that unknown, unmeasured, or inadequately measured variables were different in the groups admitted to neurologists and the groups admitted to generalists. These differences, in turn, might account for outcome differences rather than specialist care.
This form of selection bias, a type of confounding by indication, is a constant threat to validity in observational studies. Randomized trials avoid it because the randomization process balances all prognostic variables, both known and unknown, in the treatment groups.11 Observational studies cannot guarantee the same balance of unmeasured risk factors.12 Multivariate modeling is meant to account for prognostic differences between groups in observational studies, but confounding by indication may remain if all the factors that determine prognosis are not accurately measured. We developed a method to avoid confounding by indication by evaluating individual outcome differences associated with practice variability.13 This technique, termed grouped‐treatment (GT) analysis, is related to the instrumental variable approach developed by economists and occasionally applied to health services research.14
In multivariate GT analyses, the institutional proportion of cases admitted to the care of a neurologist is used as a predictor of outcomes rather than whether an individual patient was admitted to neurology. For example, at a hospital where three‐fourths of acute stroke patients are admitted to neurology, all patients are treated as having a 75% chance of admission to neurology. Rather than denoting whether each patient's specialist attending was a neurologist or a generalist, the 0.75 probability of admission to neurology is used for analysis. If admission to an attending neurologist improves ischemic stroke care, then GT analysis should demonstrate that hospitals admitting higher proportions of stroke patients to neurologists have improved outcomes regardless of whether there is selection bias at the individual patient level. In this way, the method bypasses unmeasured confounders at the individual level in its estimates of treatment effects. The method is susceptible to confounding at the group level; that is, unmeasured prognostic differences in patients admitted to hospitals that rely more heavily on neurologists could bias the GT estimate of treatment effect. The GT estimates are accurate if it can be assumed that a hospital's rate of treatment is not associated (in an unmeasured way) with its patient population's intrinsic, pretreatment prognosis. However, practice variability is very common between hospitals and is generally poorly associated with systematic differences in prognosis of treated patients,15, 16 and in this setting GT provides an independent assessment of treatment effect that may either confirm or refute an association found at the individual level, where confounding is nearly always an important issue.
In this study, we evaluated the impact of admission to a neurologist or generalist on outcomes of ischemic stroke patients treated at academic medical centers throughout the United States. We also compared traditional analysis to GT analysis. In doing so, we demonstrate the influence of unmeasured confounders on observational assessments of specialist care and may provide a more accurate measure of the impact of care by a neurologist on outcomes after ischemic stroke.
MATERIALS AND METHODS
We used the University HealthSystem Consortium (UHC) administrative database, which contained patient information from 84 large academic health centers and their 39 associate hospitals, with more than 2.1 million discharges each year.17 We obtained UHC discharge abstracts for all ischemic stroke patients admitted through emergency departments from 1997 through 1999. Discharge abstracts included patient demographics, urgency status (emergent, urgent, elective), illness severity class, admitting and discharge specialties, discharge diagnoses, procedure codes, in‐hospital mortality, length of stay, and total hospital charges. Patients were identified using International Classification of Diseases, Ninth Revision (ICD‐9) codes that were previously recognized as specific indicators of acute ischemic stroke (ICD‐9 433.01, 433.11, 433.21, 433.31, 433.81, 433.91, 434.01, 434.11, 434.91, 436).1820 We limited the cohort to emergency department admissions in order to reduce the likelihood of referral bias.
Variables in the discharge database were validated by comparison with a detailed medical record review. Between June and December 1999, 42 institutions participating in a quality improvement project identified 30 consecutive ischemic stroke cases. Trained analysts or clinicians abstracted information on demographics, medical history, and treatment. Kappa statistics have been previously reported for all individual characteristics except hospital charges, for which medical record review data were not available.21 Demographic and clinical variables in the administrative database tended to agree well with medical record review, with agreement ranging from 85% to 100% (kappa 0.581.00). Because the admitting attending likely directed acute stroke management, this was used to define a patient's attending physician specialty in all analyses. Administrative coding of tissue plasminogen activator (tPA) use was imperfect, with a sensitivity of 50% but a specificity of 100%.22
Institutional rate of admission to neurologists versus generalists was calculated as the percentage over the entire study duration. Unadjusted logistic regression was used to compare the distribution of patient pretreatment prognostic factors between institutions above and below the 50th percentile to determine a rate of admission to neurology because generalized estimating equations that could account for clustering were unable to support these models as a result of diverging estimates. We calculated the yearly volume of ischemic strokes treated at an institution from discharge abstracts, including admissions from all sources, because all treated cases would be expected to increase physician experience.
In‐hospital mortality was chosen as the primary outcome because of its frequency, importance, and coding reliability. Univariate predictors of in‐hospital mortality were identified using Pearson's chi‐square and the Wilcoxon rank sum tests.23 Length of stay (LOS), total hospital charges, and receipt of tPA were secondary outcomes. LOS and total hospital charges were compared using the Wilcoxon rank sum test. LOS and total charge calculations included only those patients surviving to discharge so that early mortality would not be confused with more efficient care. Similarly, we compared demographics and clinical variables of patients admitted to the care of neurologists with those of patients admitted to the care of generalists. To evaluate variability between institutions, we determined the proportion of patients with specific characteristics and outcomes at each institution and report median values and the 10th‐ to 90th‐percentile range among the institutions. The correlation between institutional rate of admission and institutional rate of mortality was evaluated.
In standard multivariate analysis, we assessed physician specialty as a predictor of in‐hospital mortality of individual patients after adjustment for demographic characteristics, admission status (emergent, urgent, elective), comorbid illness severity score (range 04, from 0 = no substantial comorbid illness to 4 = catastrophic comorbid illness), and annual institutional treatment volume of ischemic stroke. UHC defined severity class to represent an individual's overall calculated risk of illness; its value was dependent on the refinement of the Health Care Facility Administration's diagnosis‐related groups (DRGs) and the Sach's Complication Profiler count of total comorbidities present.24, 25 Effects on LOS and total charges, as well as the ability of physician specialty to predict tPA use in individual patients, were similarly evaluated. Analysis of tPA use was restricted to patients admitted to universities that ever coded tPA use, which increased the sensitivity of the indicator to 57%.22 Residual misclassification error of tPA use would be expected to obscure a true underlying association between its use and physician specialty.
In multivariate GT calculations, we used the institutional proportion of cases admitted to a neurologist as a predictor of outcomes. GT analysis is based on the observation that if a treatment is effective, hospitals that use it more frequently should have better patient outcomes and that this association should persist regardless of whether individual‐level selection bias is present. The method assumes that hospital rates of admission to neurology are independent on the patient population's pretreatment prognosis. Because utilization differences between hospitals likely reflect practice variability rather than differences in patient prognosis,15, 16 the influence of unmeasured confounders at the hospital level is expected to be small. Measured variables that proved significant in univariate analyses or were thought to be responsible for an association between overall patient prognosis and modalities and frequencies of acute stroke treatments used, such as institutional treatment volume, were included in the multivariate GT model in order to isolate the effect of increasing rates of admission to neurologists.
We included both institutional and individual data to more accurately specify individual outcomes and covariates compared with an analysis that simply compared institutions' characteristics and their outcomes.26 Generalized estimating equations (GEE) were used in order to account for institutional clustering of predictor variables and outcomes. GEE is similar to logistic regression but produces broader confidence intervals (CIs) because logistic regression ignores the possibility that individuals at institutions are more similar to each other than would be expected by chance alone. We used a compound symmetry correlation structure, which initiates modeling by assuming a constant correlation between observations within each institution as well as between institutions, and used a logistic link function for binary outcomes in order to mimic logistic regression. The natural log transformations of LOS and hospital charges were modeled to reduce positive skew and approximate a normal distribution, and an identity link function was used in GEE to mimic linear regression for these analyses. To evaluate the impact of adjustment, both unadjusted and adjusted analyses were conducted. Methods to calculate power of GT analysis are not available. The Stata statistical package was used for all analyses (version 8.0; Stata Corporation, College Station, TX).
RESULTS
A total of 26,925 patients with ischemic strokes were admitted to neurologists or generalists through the emergency department at 113 institutions participating in the study. Patients admitted to neurologists rather than generalists (Table 1) were younger and more likely to be male, but less likely to have a serious comorbid illness. Institutions varied widely in the demographics of treated patients as well as in the markers of pretreatment prognosis. Institutional annual case volume of all ischemic strokes ranged from 1 to 741. Mortality rate, mean LOS, and mean hospital charges also varied broadly between institutions (Table 1). Patients treated at institutions whose rate of admissions to a neurologist's care was in the upper 50th percentile were younger and more often male, but did not differ in illness severity class (Table 2).
| Characteristic | Neurologist (n = 16,287) | Generalist (n = 10,638) | Institutional (n = 113) median (10th90th percentiles) |
|---|---|---|---|
| |||
| Age (years), mean (SD) | 66.2 (14.7) | 69.3 (15.2) | 67.7 (62.174.8) |
| Female, n (%) | 8291 (51) | 5904 (56) | 54% (46%67%) |
| Ethnicity | |||
| African American, n (%) | 4516 (28) | 3335 (31) | 19% (0%71%) |
| Asian American, n (%) | 570 (4) | 201 (2) | 0.7% (0%8%) |
| Hispanic, n (%) | 906 (6) | 458 (4) | 0.7% (0%16%) |
| Native American, Eskimo, n (%) | 48 (0) | 21 (0) | 0% (0%1%) |
| White, n (%) | 9012 (55) | 5851 (55) | 65% (10%95%) |
| Other ethnicity, n (%) | 398 (2) | 157 (1) | 0.3% (0%4%) |
| Unknown, n (%) | 837 (5) | 615 (6) | 0.1% (0%9%) |
| Comorbid illness severity score,* median (interquartile range) | 1 (01) | 1 (01) | 0.83 (0.650.95) |
| Treatment and outcome | |||
| tPA administered, n (%) | 132 (3) | 51 (2) | 1.9% (0.6%6.5%) |
| In‐hospital deaths, n (%) | 755 (5) | 1005 (9) | 6.1% (3%10%) |
| Discharges to home, n (%) | 9504 (59) | 5235 (49) | 52% (38%72%) |
| Length of stay (days), mean (SD) | 6.6 (7.2) | 7.9 (9.9) | 6.6 (4.210.0) |
| Total charges | $16,600 ($20,500) | $18,700 ($26,300) | $15,000 ($9000$30,000) |
| Characteristic | <50th percentile | >50th percentile | P value |
|---|---|---|---|
| |||
| Age (years), mean (SD) | 66.7 (15.2) | 69.4 (14.3) | <.001 |
| Female, n (%) | 5288 (54) | 8907 (52) | .001 |
| Comorbid illness severity score*, median (interquartile range) | 1 (01) | 1 (01) | .87 |
There were 1760 in‐hospital deaths (7.0%). In univariate analysis, older age (P < .001), white ethnicity (P < .001), emergent stroke (P < .001), and increased illness severity (P < .001) were associated with greater risk of death, whereas African‐American (P < .001) and Hispanic (P = .007) ethnicities were protective. No other patient characteristics were important, and institutional annual case volume showed no association with mortality risk.
Overall, 60% of patients with ischemic stroke were admitted to a neurologist's care. In univariate analysis (Table 3), a lower risk of in‐hospital mortality was observed in cases admitted to neurologists (4.6%) compared with those admitted to generalists (9.5%; P < .001). After adjustment in standard multivariable models, the association between neurologist admission and lower risk of death persisted (OR 0.60; 95% CI, 0.500.72; P < .001).
| Characteristics | Unadjusted | Adjusted | ||
|---|---|---|---|---|
| Odds ratio (95% CI) | P value | Odds ratio (95% CI) | P value | |
| ||||
| Mortality | ||||
| Attending neurologist | 0.32 (0.260.39) | <.001 | 0.60 (0.500.72) | <.001 |
| Proportion of admissions to neurology | 1.05 (0.851.31) | .64 | 1.02 (0.791.30) | .90 |
| tPA Use | ||||
| Attending neurologist | 1.87 (1.302.69) | .001 | 2.56 (1.723.78) | <.001 |
| Proportion of admissions to neurology | 2.32 (0.985.49) | .06 | 2.47 (1.085.65) | .03 |
The institutional rate of admission of ischemic stroke patients to neurologists ranged from 0% to 90%, and higher rates were seen at hospitals with higher institutional case volumes (P < .001). There was no correlation between the institutional rate of admission to neurology and the institutional mortality rate (0.33; P = .73). At the individual‐level, greater rates of admission to neurologists had no significant impact on mortality (OR 1.05; 95% CI, 0.851.31; P = .64; Table 3) in unadjusted analysis. After adjustment for patient demographics, comorbid illness severity score, urgency status, and institutional case volume in GT analysis, there remained no association between death and proportion of ischemic stroke cases admitted to neurologists (OR 1.02; 95% CI, 0.791.30; P = .90), consistent with the absence of an association between neurologist care and in‐hospital mortality.
Patients treated by neurologists were likely to have shorter stays (P < .001) and lower charges (P = .01) in univariate analysis (Table 4). In traditional adjusted multivariable analysis, the same associations were seen for LOS (P < .001) and charges (P = .05). However, in adjusted GT analyses, increased institutional rate of admission to neurologists was not associated with briefer LOS (P = .36) and was associated with greater hospital charges (P = .044).
| Characteristic | Unadjusted Analysis | Adjusted ratio* | |||
|---|---|---|---|---|---|
| Neurologist | Generalist | P value | Ratio (95% CI) | P value | |
| |||||
| LOS (days), n = 25,094 | |||||
| Standard analysis | 6.6 | 8.0 | <.001 | 0.92 (0.880.96) | <.001 |
| Group‐treatment analysis | 7.2 | 7.1 | .80 | 1.06 (0.941.19) | .35 |
| Total Charges, n = 21,812 | |||||
| Standard analysis | $16,600 | $18,700 | .01 | 0.95 (0.911.00) | .05 |
| Group‐treatment analysis | $17,800 | $16,900 | <.001 | 1.26 (1.011.57) | .04 |
In 1999, 190 (2.2%) ischemic stroke patients received tPA at the 64 universities that had ever coded tPA use. In univariate analysis, patients admitted to a neurologist were more likely to have received tPA (P = .001; Table 3), and this association persisted after adjustment (P < .001). In adjusted GT analysis, institutions admitting a higher proportion of ischemic stroke patients to neurologists also treated patients with tPA more frequently (P = .033).
DISCUSSION
Several prior studies found that ischemic stroke outcomes were better when an attending neurologist was responsible for patient care.710 Traditional analyses of our data also indicate that care by a neurologist lowers inpatient mortality, LOS, and total charges. By contrast, a GT analysis that bypasses selection bias at the patient level suggests there is no independent benefit of neurologist care on mortality or LOS and actually shows higher associated charges.
The discrepancy between standard and GT analyses suggests that healthier patients may have been preferentially admitted to the care of neurologists. Measured pretreatment prognostic factors in our data present a mixed picture. Patients admitted to a neurologist's care were younger, more often male, more often emergently admitted, and less likely to have serious comorbid illnesses. These patient factors were controlled for in all adjusted analyses. Although traditional multivariate analysis attempts to adjust for variations between the 2 patient populations, it cannot adjust for inaccurately measured or unmeasured differences. Using the institutional proportion of admissions to neurologists as a predictor of patient outcomes, we were better able to control for the selection bias associated with differential distribution of patients to teams led by attending neurologists versus generalists.13, 14
Petty et al.7 studied 299 ischemic stroke patients and showed equivalent survival among stroke patients admitted to neurology inpatient teams versus generalist teams with neurologic consultation. However, patients cared for by generalist teams without neurologic consultation fared worse. Their subjects were treated at both academic and community hospitals. In our study, contributing hospitals were solely academic institutions. Because specialty cross talk may be more frequent at university‐based hospitals, academic‐based generalist physicians may be more familiar with recent stroke literature and guidelines than are their community‐based peers. Further, restricting analysis to academic centers in our study should have reduced the potential confounding influences of differences between other aspects of institutional care. Although no information was available on neurologist consultation in our database, informal consultation is believed to play a large but hidden role at academic medical centers. Thus, the inclusion of a formal consultation variable may be misleading at academic medical centers.
Analyzing claims data on 44,099 Medicare beneficiaries with acute ischemic strokes cared for at both academic and community hospitals, Smith et al.10 also recently reported a 10% lower risk of 30‐day mortality and 12% lower risk of rehospitalization for infections and aspiration pneumonitis among patients admitted to the care of neurologists compared with those admitted to the care of generalists. However, the upper 95% confidence interval limits for these 2 findings nearly crossed 1 (ranging from 0.9980.999). The study also concluded that patients cared for collaboratively by generalists and neurologists had a 16% lower 30‐day mortality risk (hazard ratio 0.84; 95% CI, 0.790.90) than those cared for by generalists alone but simultaneously noted that patients admitted to generalists only had more comorbidities than either the collaborative care or neurologist‐only patient groups. If sicker patients were triaged to generalist admission, as occurs in confounding by indication (also known as channeling bias), then incomplete adjustment for comorbid disease may bias outcomes in favor of neurologist involvement. The GT analysis we employed is specifically designed to overcome this exact type of selection bias.
In our study, patients admitted to neurologists received tPA significantly more often than those admitted to generalists. GT analysis also found that hospitals admitting a higher proportion of strokes to neurologists treated more patients with tPA. This result is consistent with a prior study demonstrating that academic institutions employing a vascular neurologist had significantly higher odds of administering tPA.21 Since tPA must be administered within 3 hours of symptom onset,27 it is commonly delivered in the emergency department prior to admission. Thus, patients may be preferentially selected for admission to neurologic services because of their receipt of tPA, rather than that this association reflects an actual increased use of tPA by neurologists over generalists. Alternatively, institutions with a higher rate of stroke admissions to neurology may simply be more familiar with tPA protocols. Importantly, the poor sensitivity of our data for actual tPA administration may affect the analysis of its use by physician specialty; however, the failure to administratively code tPA use is unlikely to be differentially biased based on physician specialty. Thus, undercoding of tPA use would be expected to bias these analyses toward the null.
The potential advantage and efficacy of stroke centers, stroke units, stroke services, and other institutional processes of care are not addressed by our data. Previously, among academic hospitals, we found that acute ischemic stroke mortality was lower at hospitals employing a vascular neurologist and at those whose guidelines allowed only neurologists to administer tPA.21 A later analysis evaluated the impact of all elements of stroke center care supported by the original Brain Attack Coalition consensus28 and found that no single element improved mortality.29 However, recent studies have found significant mortality benefit associated with stroke units30, 31 and stroke services.32 Clearly, the debate continues over these important questions.
Our study had several limitations. First, generalizability may be lessened because only academic medical centers contributed data and only admissions through the ED were included. However, limiting the study population to academic centers provided a homogenous study population and greatly reduced the potential for confounding at the institutional level. Although the selection of ED cases mitigated the effects of referral bias and the use of only academic hospitals minimized interinstitutional differences, institutions whose rate of admissions to neurology was above the 50th percentile differed from those whose rate admissions to neurology was below the 50th percentile. However, this difference did not consistently result in patients with worse pretreatment prognostic factors being cared for at hospitals with higher rates of admission to neurology. Second, there are important limitations to using administrative data. In our study, patients were selected based on diagnostic coding of records analysts at discharge, and the diagnostic accuracy of such coding for stroke is imperfect.33 Furthermore, missing or incomplete information could have impaired adjustments for patient differences. Third, details of patient treatment were limited. The lack of information about formal and informal consultations may have obscured a true difference in outcomes among specialties.7 Additionally, academic institutions may use systematized care plans more often than do community hospitals, potentially minimizing differences between specialties. Fourth, at the time of our study, tPA had been recently introduced into stroke care. Current rates of tPA use among neurologists and generalists may be more similar. Fifth, the ability of in‐hospital mortality to adequately assess quality of care is limited, and longer‐term and functional outcomes would be better measures and more clinically relevant.
After controlling for selection bias using GT analysis, we found stroke outcomes to be similar regardless of whether a neurologist or a generalist was the admitting physician. This result contrasts with the findings of several previous studies that suggested admitting stroke patients to a neurologist resulted in better clinical outcomes.710 Because only 1 neurologist is employed for approximately every 19.8 generalists in the United States34 and 40% of acute strokes were cared for by generalists, even in this sample entirely restricted to university hospitals, such findings would suggest that many U.S. stroke patients receive inferior care. Because the role of the neurologist as consultant rather than as attending physician is significantly more feasible in most practice settings, the demonstration of equivalent outcomes by both types of physicians is reassuring and certainly reinforces the important role that unmeasured confounders may play in observational studies.
However, these results do imply that it is vital that generalists remain fully trained in the current best practices of acute stroke management in order to maintain the equivalence of care suggested here. Given how common acute stroke is, any proposed future hospitalist training, certification, and recertification programs should include a focus on acute stroke management.
- ,,.Knowledge, patterns of care, and outcomes of care for generalists and specialists.J Gen Intern Med.1999;14:499–511.
- ,,,,.The generalist role of specialty physicians: is there a hidden system of primary care?JAMA.1998;279:1364–1370.
- .Primary care: specialists or generalists.Mayo Clin Proc.1996;71:415–419.
- ,,, et al.Consultation between cardiologists and generalists in the management of acute myocardial infarction: implications for quality of care.Arch Intern Med.1998;158:1778–1783.
- ,,, et al.Quality of care and outcomes of adults with asthma treated by specialists and generalists in managed care.Arch Intern Med.2001;161:2554–2560.
- ,,, et al.Nephrologist care and mortality in patients with chronic renal insufficiency.Arch Intern Med.2002;162:2002–2006.
- ,,,,,.Ischemic stroke: outcomes, patient mix, and practice variation for neurologists and generalists in a community.Neurology.1998;50:1699–1678.
- ,,.Where and how should elderly stroke patients be treated? A randomized trial.Stroke.1995;26:249–253.
- ,,,,,.What role do neurologists play in determining the costs and outcomes of stroke patients?Stroke.1996;27:1937–1943.
- ,,,.30‐Day survival and rehospitalization for stroke patients according to physician specialty.Cerebrovasc Dis.2006;22:21–26.
- .The need for randomization in the study of intended effects.Stat Med.1983;2:267–271.
- ,.Modern Epidemiology.Philadelphia, PA:Lippincott‐Raven;1998.
- ,,,.Modeling treatment effects on binary outcomes with grouped‐treatment variables and individual covariates.Am J Epidemiol.2002;156:753–760.
- ,,.Does more intensive treatment of acute myocardial infarction in the elderly reduce mortality? Analysis using instrumental variables.JAMA.1994;272:859–866.
- .The Cochrane Lecture. The best and the enemy of the good: randomised controlled trials, uncertainty, and assessing the role of patient choice in medical decision making.J Epidemiol Community Health.1994;48:6–15.
- ,.Uses of ecologic studies in the assessment of intended treatment effects.J Clin Epidemiol.1999;52:7–12.
- University HealthSystem Consortium. Available at: http://www.uhc.edu. Accessed April 11,2007.
- ,,,.Identification of incident stroke in Norway: hospital discharge data compared with a population‐based stroke register.Stroke.1999;30:56–60.
- .Accuracy of ICD‐9‐CM coding for the identification of patients with acute ischemic stroke: effect of modifier codes.Stroke.1998;29:1602–1604.
- ,,,.Accuracy of hospital discharge abstracts for identifying stroke.Stroke.1994;25:2348–2355.
- ,.Characteristics of academic medical centers and ischemic stroke outcomes.Stroke.2001;32:2137–2142.
- ,,, et al.Utilization of intravenous tissue‐type plasminogen activator for ischemic stroke at academic medical centers: the influence of ethnicity.Stroke.2001;32:1061–1068.
- .Biostatistics: a Foundation for Analysis in the Health Sciences.New York:John Wiley 1995.
- Sachs Group.Sachs Complications Profiler, version 1.0, User's Guide.Evanston, IL,1995.
- University HealthSystem Consortium Services Corporation.Clinical information management: risk adjustment of the UHC clinical database.Oak Brook, IL,1997.
- .Combining ecological and individual variables to reduce confounding by indication: case study—subarachnoid hemorrhage treatment.J Clin Epidemiol.2000;53:1236–1241.
- The National Institute of Neurological Disorders and Stroke rt‐PA Stroke Study Group.Tissue plasminogen activator for acute ischemic stroke.N Engl J Med.1995;333:1581–1588.
- ,,, et al.Recommendations for the establishment of primary stroke centers. Brain Attack Coalition.JAMA.2000;283:3102–3109.
- ,,, et al.Do the Brain Attack Coalition's criteria for stroke centers improve care for ischemic stroke?Neurology.2005;64:422–427.
- Organised inpatient (stroke unit) care for stroke.Cochrane Database Syst Rev2002:CD000197.
- ,,,,,.Stroke‐unit care for acute stroke patients: an observational follow‐up study.Lancet.2007;369:299–305.
- ,,,.Multispecialty stroke services in California hospitals are associated with reduced mortality.Neurology.2006;66:1527–32.
- ,,,,,.Inaccuracy of the International Classification of Diseases (ICD‐9‐CM) in identifying the diagnosis of ischemic cerebrovascular disease.Neurology.1997;49:660–664.
- .Physician characteristics and distribution in the US. 2006 ed. In: Department of Data Quality and Measurement, ed. Physician Characteristics and Distribution in the US. Washington, DC: American Medical Association,2006:312.
The appropriate role of specialists in hospital management of common medical conditions has been vigorously debated.13 Few argue that specialists serve an important role as consultants, but whether patients with specific conditions should be admitted to the care of specialists or generalists is unresolved. This is demonstrated by the large degree of hospital‐to‐hospital variability in the proportion of patients with myocardial infarction admitted to cardiologists,4 patients with asthma exacerbations admitted to pulmonologists,5 and patients with renal failure admitted to nephrologists.6
Stroke is another common diagnosis, with variable rates of admission to specialists and generalists. Several prior studies have suggested that outcomes after ischemic stroke are better if a neurologist is the attending physician.710 However, these observational studies could not rule out the possibility that differences in outcome were a result of prognosis at the time of admission rather than improvements in medical care. Although these studies have controlled for known prognostic variables, it is possible that unknown, unmeasured, or inadequately measured variables were different in the groups admitted to neurologists and the groups admitted to generalists. These differences, in turn, might account for outcome differences rather than specialist care.
This form of selection bias, a type of confounding by indication, is a constant threat to validity in observational studies. Randomized trials avoid it because the randomization process balances all prognostic variables, both known and unknown, in the treatment groups.11 Observational studies cannot guarantee the same balance of unmeasured risk factors.12 Multivariate modeling is meant to account for prognostic differences between groups in observational studies, but confounding by indication may remain if all the factors that determine prognosis are not accurately measured. We developed a method to avoid confounding by indication by evaluating individual outcome differences associated with practice variability.13 This technique, termed grouped‐treatment (GT) analysis, is related to the instrumental variable approach developed by economists and occasionally applied to health services research.14
In multivariate GT analyses, the institutional proportion of cases admitted to the care of a neurologist is used as a predictor of outcomes rather than whether an individual patient was admitted to neurology. For example, at a hospital where three‐fourths of acute stroke patients are admitted to neurology, all patients are treated as having a 75% chance of admission to neurology. Rather than denoting whether each patient's specialist attending was a neurologist or a generalist, the 0.75 probability of admission to neurology is used for analysis. If admission to an attending neurologist improves ischemic stroke care, then GT analysis should demonstrate that hospitals admitting higher proportions of stroke patients to neurologists have improved outcomes regardless of whether there is selection bias at the individual patient level. In this way, the method bypasses unmeasured confounders at the individual level in its estimates of treatment effects. The method is susceptible to confounding at the group level; that is, unmeasured prognostic differences in patients admitted to hospitals that rely more heavily on neurologists could bias the GT estimate of treatment effect. The GT estimates are accurate if it can be assumed that a hospital's rate of treatment is not associated (in an unmeasured way) with its patient population's intrinsic, pretreatment prognosis. However, practice variability is very common between hospitals and is generally poorly associated with systematic differences in prognosis of treated patients,15, 16 and in this setting GT provides an independent assessment of treatment effect that may either confirm or refute an association found at the individual level, where confounding is nearly always an important issue.
In this study, we evaluated the impact of admission to a neurologist or generalist on outcomes of ischemic stroke patients treated at academic medical centers throughout the United States. We also compared traditional analysis to GT analysis. In doing so, we demonstrate the influence of unmeasured confounders on observational assessments of specialist care and may provide a more accurate measure of the impact of care by a neurologist on outcomes after ischemic stroke.
MATERIALS AND METHODS
We used the University HealthSystem Consortium (UHC) administrative database, which contained patient information from 84 large academic health centers and their 39 associate hospitals, with more than 2.1 million discharges each year.17 We obtained UHC discharge abstracts for all ischemic stroke patients admitted through emergency departments from 1997 through 1999. Discharge abstracts included patient demographics, urgency status (emergent, urgent, elective), illness severity class, admitting and discharge specialties, discharge diagnoses, procedure codes, in‐hospital mortality, length of stay, and total hospital charges. Patients were identified using International Classification of Diseases, Ninth Revision (ICD‐9) codes that were previously recognized as specific indicators of acute ischemic stroke (ICD‐9 433.01, 433.11, 433.21, 433.31, 433.81, 433.91, 434.01, 434.11, 434.91, 436).1820 We limited the cohort to emergency department admissions in order to reduce the likelihood of referral bias.
Variables in the discharge database were validated by comparison with a detailed medical record review. Between June and December 1999, 42 institutions participating in a quality improvement project identified 30 consecutive ischemic stroke cases. Trained analysts or clinicians abstracted information on demographics, medical history, and treatment. Kappa statistics have been previously reported for all individual characteristics except hospital charges, for which medical record review data were not available.21 Demographic and clinical variables in the administrative database tended to agree well with medical record review, with agreement ranging from 85% to 100% (kappa 0.581.00). Because the admitting attending likely directed acute stroke management, this was used to define a patient's attending physician specialty in all analyses. Administrative coding of tissue plasminogen activator (tPA) use was imperfect, with a sensitivity of 50% but a specificity of 100%.22
Institutional rate of admission to neurologists versus generalists was calculated as the percentage over the entire study duration. Unadjusted logistic regression was used to compare the distribution of patient pretreatment prognostic factors between institutions above and below the 50th percentile to determine a rate of admission to neurology because generalized estimating equations that could account for clustering were unable to support these models as a result of diverging estimates. We calculated the yearly volume of ischemic strokes treated at an institution from discharge abstracts, including admissions from all sources, because all treated cases would be expected to increase physician experience.
In‐hospital mortality was chosen as the primary outcome because of its frequency, importance, and coding reliability. Univariate predictors of in‐hospital mortality were identified using Pearson's chi‐square and the Wilcoxon rank sum tests.23 Length of stay (LOS), total hospital charges, and receipt of tPA were secondary outcomes. LOS and total hospital charges were compared using the Wilcoxon rank sum test. LOS and total charge calculations included only those patients surviving to discharge so that early mortality would not be confused with more efficient care. Similarly, we compared demographics and clinical variables of patients admitted to the care of neurologists with those of patients admitted to the care of generalists. To evaluate variability between institutions, we determined the proportion of patients with specific characteristics and outcomes at each institution and report median values and the 10th‐ to 90th‐percentile range among the institutions. The correlation between institutional rate of admission and institutional rate of mortality was evaluated.
In standard multivariate analysis, we assessed physician specialty as a predictor of in‐hospital mortality of individual patients after adjustment for demographic characteristics, admission status (emergent, urgent, elective), comorbid illness severity score (range 04, from 0 = no substantial comorbid illness to 4 = catastrophic comorbid illness), and annual institutional treatment volume of ischemic stroke. UHC defined severity class to represent an individual's overall calculated risk of illness; its value was dependent on the refinement of the Health Care Facility Administration's diagnosis‐related groups (DRGs) and the Sach's Complication Profiler count of total comorbidities present.24, 25 Effects on LOS and total charges, as well as the ability of physician specialty to predict tPA use in individual patients, were similarly evaluated. Analysis of tPA use was restricted to patients admitted to universities that ever coded tPA use, which increased the sensitivity of the indicator to 57%.22 Residual misclassification error of tPA use would be expected to obscure a true underlying association between its use and physician specialty.
In multivariate GT calculations, we used the institutional proportion of cases admitted to a neurologist as a predictor of outcomes. GT analysis is based on the observation that if a treatment is effective, hospitals that use it more frequently should have better patient outcomes and that this association should persist regardless of whether individual‐level selection bias is present. The method assumes that hospital rates of admission to neurology are independent on the patient population's pretreatment prognosis. Because utilization differences between hospitals likely reflect practice variability rather than differences in patient prognosis,15, 16 the influence of unmeasured confounders at the hospital level is expected to be small. Measured variables that proved significant in univariate analyses or were thought to be responsible for an association between overall patient prognosis and modalities and frequencies of acute stroke treatments used, such as institutional treatment volume, were included in the multivariate GT model in order to isolate the effect of increasing rates of admission to neurologists.
We included both institutional and individual data to more accurately specify individual outcomes and covariates compared with an analysis that simply compared institutions' characteristics and their outcomes.26 Generalized estimating equations (GEE) were used in order to account for institutional clustering of predictor variables and outcomes. GEE is similar to logistic regression but produces broader confidence intervals (CIs) because logistic regression ignores the possibility that individuals at institutions are more similar to each other than would be expected by chance alone. We used a compound symmetry correlation structure, which initiates modeling by assuming a constant correlation between observations within each institution as well as between institutions, and used a logistic link function for binary outcomes in order to mimic logistic regression. The natural log transformations of LOS and hospital charges were modeled to reduce positive skew and approximate a normal distribution, and an identity link function was used in GEE to mimic linear regression for these analyses. To evaluate the impact of adjustment, both unadjusted and adjusted analyses were conducted. Methods to calculate power of GT analysis are not available. The Stata statistical package was used for all analyses (version 8.0; Stata Corporation, College Station, TX).
RESULTS
A total of 26,925 patients with ischemic strokes were admitted to neurologists or generalists through the emergency department at 113 institutions participating in the study. Patients admitted to neurologists rather than generalists (Table 1) were younger and more likely to be male, but less likely to have a serious comorbid illness. Institutions varied widely in the demographics of treated patients as well as in the markers of pretreatment prognosis. Institutional annual case volume of all ischemic strokes ranged from 1 to 741. Mortality rate, mean LOS, and mean hospital charges also varied broadly between institutions (Table 1). Patients treated at institutions whose rate of admissions to a neurologist's care was in the upper 50th percentile were younger and more often male, but did not differ in illness severity class (Table 2).
| Characteristic | Neurologist (n = 16,287) | Generalist (n = 10,638) | Institutional (n = 113) median (10th90th percentiles) |
|---|---|---|---|
| |||
| Age (years), mean (SD) | 66.2 (14.7) | 69.3 (15.2) | 67.7 (62.174.8) |
| Female, n (%) | 8291 (51) | 5904 (56) | 54% (46%67%) |
| Ethnicity | |||
| African American, n (%) | 4516 (28) | 3335 (31) | 19% (0%71%) |
| Asian American, n (%) | 570 (4) | 201 (2) | 0.7% (0%8%) |
| Hispanic, n (%) | 906 (6) | 458 (4) | 0.7% (0%16%) |
| Native American, Eskimo, n (%) | 48 (0) | 21 (0) | 0% (0%1%) |
| White, n (%) | 9012 (55) | 5851 (55) | 65% (10%95%) |
| Other ethnicity, n (%) | 398 (2) | 157 (1) | 0.3% (0%4%) |
| Unknown, n (%) | 837 (5) | 615 (6) | 0.1% (0%9%) |
| Comorbid illness severity score,* median (interquartile range) | 1 (01) | 1 (01) | 0.83 (0.650.95) |
| Treatment and outcome | |||
| tPA administered, n (%) | 132 (3) | 51 (2) | 1.9% (0.6%6.5%) |
| In‐hospital deaths, n (%) | 755 (5) | 1005 (9) | 6.1% (3%10%) |
| Discharges to home, n (%) | 9504 (59) | 5235 (49) | 52% (38%72%) |
| Length of stay (days), mean (SD) | 6.6 (7.2) | 7.9 (9.9) | 6.6 (4.210.0) |
| Total charges | $16,600 ($20,500) | $18,700 ($26,300) | $15,000 ($9000$30,000) |
| Characteristic | <50th percentile | >50th percentile | P value |
|---|---|---|---|
| |||
| Age (years), mean (SD) | 66.7 (15.2) | 69.4 (14.3) | <.001 |
| Female, n (%) | 5288 (54) | 8907 (52) | .001 |
| Comorbid illness severity score*, median (interquartile range) | 1 (01) | 1 (01) | .87 |
There were 1760 in‐hospital deaths (7.0%). In univariate analysis, older age (P < .001), white ethnicity (P < .001), emergent stroke (P < .001), and increased illness severity (P < .001) were associated with greater risk of death, whereas African‐American (P < .001) and Hispanic (P = .007) ethnicities were protective. No other patient characteristics were important, and institutional annual case volume showed no association with mortality risk.
Overall, 60% of patients with ischemic stroke were admitted to a neurologist's care. In univariate analysis (Table 3), a lower risk of in‐hospital mortality was observed in cases admitted to neurologists (4.6%) compared with those admitted to generalists (9.5%; P < .001). After adjustment in standard multivariable models, the association between neurologist admission and lower risk of death persisted (OR 0.60; 95% CI, 0.500.72; P < .001).
| Characteristics | Unadjusted | Adjusted | ||
|---|---|---|---|---|
| Odds ratio (95% CI) | P value | Odds ratio (95% CI) | P value | |
| ||||
| Mortality | ||||
| Attending neurologist | 0.32 (0.260.39) | <.001 | 0.60 (0.500.72) | <.001 |
| Proportion of admissions to neurology | 1.05 (0.851.31) | .64 | 1.02 (0.791.30) | .90 |
| tPA Use | ||||
| Attending neurologist | 1.87 (1.302.69) | .001 | 2.56 (1.723.78) | <.001 |
| Proportion of admissions to neurology | 2.32 (0.985.49) | .06 | 2.47 (1.085.65) | .03 |
The institutional rate of admission of ischemic stroke patients to neurologists ranged from 0% to 90%, and higher rates were seen at hospitals with higher institutional case volumes (P < .001). There was no correlation between the institutional rate of admission to neurology and the institutional mortality rate (0.33; P = .73). At the individual‐level, greater rates of admission to neurologists had no significant impact on mortality (OR 1.05; 95% CI, 0.851.31; P = .64; Table 3) in unadjusted analysis. After adjustment for patient demographics, comorbid illness severity score, urgency status, and institutional case volume in GT analysis, there remained no association between death and proportion of ischemic stroke cases admitted to neurologists (OR 1.02; 95% CI, 0.791.30; P = .90), consistent with the absence of an association between neurologist care and in‐hospital mortality.
Patients treated by neurologists were likely to have shorter stays (P < .001) and lower charges (P = .01) in univariate analysis (Table 4). In traditional adjusted multivariable analysis, the same associations were seen for LOS (P < .001) and charges (P = .05). However, in adjusted GT analyses, increased institutional rate of admission to neurologists was not associated with briefer LOS (P = .36) and was associated with greater hospital charges (P = .044).
| Characteristic | Unadjusted Analysis | Adjusted ratio* | |||
|---|---|---|---|---|---|
| Neurologist | Generalist | P value | Ratio (95% CI) | P value | |
| |||||
| LOS (days), n = 25,094 | |||||
| Standard analysis | 6.6 | 8.0 | <.001 | 0.92 (0.880.96) | <.001 |
| Group‐treatment analysis | 7.2 | 7.1 | .80 | 1.06 (0.941.19) | .35 |
| Total Charges, n = 21,812 | |||||
| Standard analysis | $16,600 | $18,700 | .01 | 0.95 (0.911.00) | .05 |
| Group‐treatment analysis | $17,800 | $16,900 | <.001 | 1.26 (1.011.57) | .04 |
In 1999, 190 (2.2%) ischemic stroke patients received tPA at the 64 universities that had ever coded tPA use. In univariate analysis, patients admitted to a neurologist were more likely to have received tPA (P = .001; Table 3), and this association persisted after adjustment (P < .001). In adjusted GT analysis, institutions admitting a higher proportion of ischemic stroke patients to neurologists also treated patients with tPA more frequently (P = .033).
DISCUSSION
Several prior studies found that ischemic stroke outcomes were better when an attending neurologist was responsible for patient care.710 Traditional analyses of our data also indicate that care by a neurologist lowers inpatient mortality, LOS, and total charges. By contrast, a GT analysis that bypasses selection bias at the patient level suggests there is no independent benefit of neurologist care on mortality or LOS and actually shows higher associated charges.
The discrepancy between standard and GT analyses suggests that healthier patients may have been preferentially admitted to the care of neurologists. Measured pretreatment prognostic factors in our data present a mixed picture. Patients admitted to a neurologist's care were younger, more often male, more often emergently admitted, and less likely to have serious comorbid illnesses. These patient factors were controlled for in all adjusted analyses. Although traditional multivariate analysis attempts to adjust for variations between the 2 patient populations, it cannot adjust for inaccurately measured or unmeasured differences. Using the institutional proportion of admissions to neurologists as a predictor of patient outcomes, we were better able to control for the selection bias associated with differential distribution of patients to teams led by attending neurologists versus generalists.13, 14
Petty et al.7 studied 299 ischemic stroke patients and showed equivalent survival among stroke patients admitted to neurology inpatient teams versus generalist teams with neurologic consultation. However, patients cared for by generalist teams without neurologic consultation fared worse. Their subjects were treated at both academic and community hospitals. In our study, contributing hospitals were solely academic institutions. Because specialty cross talk may be more frequent at university‐based hospitals, academic‐based generalist physicians may be more familiar with recent stroke literature and guidelines than are their community‐based peers. Further, restricting analysis to academic centers in our study should have reduced the potential confounding influences of differences between other aspects of institutional care. Although no information was available on neurologist consultation in our database, informal consultation is believed to play a large but hidden role at academic medical centers. Thus, the inclusion of a formal consultation variable may be misleading at academic medical centers.
Analyzing claims data on 44,099 Medicare beneficiaries with acute ischemic strokes cared for at both academic and community hospitals, Smith et al.10 also recently reported a 10% lower risk of 30‐day mortality and 12% lower risk of rehospitalization for infections and aspiration pneumonitis among patients admitted to the care of neurologists compared with those admitted to the care of generalists. However, the upper 95% confidence interval limits for these 2 findings nearly crossed 1 (ranging from 0.9980.999). The study also concluded that patients cared for collaboratively by generalists and neurologists had a 16% lower 30‐day mortality risk (hazard ratio 0.84; 95% CI, 0.790.90) than those cared for by generalists alone but simultaneously noted that patients admitted to generalists only had more comorbidities than either the collaborative care or neurologist‐only patient groups. If sicker patients were triaged to generalist admission, as occurs in confounding by indication (also known as channeling bias), then incomplete adjustment for comorbid disease may bias outcomes in favor of neurologist involvement. The GT analysis we employed is specifically designed to overcome this exact type of selection bias.
In our study, patients admitted to neurologists received tPA significantly more often than those admitted to generalists. GT analysis also found that hospitals admitting a higher proportion of strokes to neurologists treated more patients with tPA. This result is consistent with a prior study demonstrating that academic institutions employing a vascular neurologist had significantly higher odds of administering tPA.21 Since tPA must be administered within 3 hours of symptom onset,27 it is commonly delivered in the emergency department prior to admission. Thus, patients may be preferentially selected for admission to neurologic services because of their receipt of tPA, rather than that this association reflects an actual increased use of tPA by neurologists over generalists. Alternatively, institutions with a higher rate of stroke admissions to neurology may simply be more familiar with tPA protocols. Importantly, the poor sensitivity of our data for actual tPA administration may affect the analysis of its use by physician specialty; however, the failure to administratively code tPA use is unlikely to be differentially biased based on physician specialty. Thus, undercoding of tPA use would be expected to bias these analyses toward the null.
The potential advantage and efficacy of stroke centers, stroke units, stroke services, and other institutional processes of care are not addressed by our data. Previously, among academic hospitals, we found that acute ischemic stroke mortality was lower at hospitals employing a vascular neurologist and at those whose guidelines allowed only neurologists to administer tPA.21 A later analysis evaluated the impact of all elements of stroke center care supported by the original Brain Attack Coalition consensus28 and found that no single element improved mortality.29 However, recent studies have found significant mortality benefit associated with stroke units30, 31 and stroke services.32 Clearly, the debate continues over these important questions.
Our study had several limitations. First, generalizability may be lessened because only academic medical centers contributed data and only admissions through the ED were included. However, limiting the study population to academic centers provided a homogenous study population and greatly reduced the potential for confounding at the institutional level. Although the selection of ED cases mitigated the effects of referral bias and the use of only academic hospitals minimized interinstitutional differences, institutions whose rate of admissions to neurology was above the 50th percentile differed from those whose rate admissions to neurology was below the 50th percentile. However, this difference did not consistently result in patients with worse pretreatment prognostic factors being cared for at hospitals with higher rates of admission to neurology. Second, there are important limitations to using administrative data. In our study, patients were selected based on diagnostic coding of records analysts at discharge, and the diagnostic accuracy of such coding for stroke is imperfect.33 Furthermore, missing or incomplete information could have impaired adjustments for patient differences. Third, details of patient treatment were limited. The lack of information about formal and informal consultations may have obscured a true difference in outcomes among specialties.7 Additionally, academic institutions may use systematized care plans more often than do community hospitals, potentially minimizing differences between specialties. Fourth, at the time of our study, tPA had been recently introduced into stroke care. Current rates of tPA use among neurologists and generalists may be more similar. Fifth, the ability of in‐hospital mortality to adequately assess quality of care is limited, and longer‐term and functional outcomes would be better measures and more clinically relevant.
After controlling for selection bias using GT analysis, we found stroke outcomes to be similar regardless of whether a neurologist or a generalist was the admitting physician. This result contrasts with the findings of several previous studies that suggested admitting stroke patients to a neurologist resulted in better clinical outcomes.710 Because only 1 neurologist is employed for approximately every 19.8 generalists in the United States34 and 40% of acute strokes were cared for by generalists, even in this sample entirely restricted to university hospitals, such findings would suggest that many U.S. stroke patients receive inferior care. Because the role of the neurologist as consultant rather than as attending physician is significantly more feasible in most practice settings, the demonstration of equivalent outcomes by both types of physicians is reassuring and certainly reinforces the important role that unmeasured confounders may play in observational studies.
However, these results do imply that it is vital that generalists remain fully trained in the current best practices of acute stroke management in order to maintain the equivalence of care suggested here. Given how common acute stroke is, any proposed future hospitalist training, certification, and recertification programs should include a focus on acute stroke management.
- ,,.Knowledge, patterns of care, and outcomes of care for generalists and specialists.J Gen Intern Med.1999;14:499–511.
- ,,,,.The generalist role of specialty physicians: is there a hidden system of primary care?JAMA.1998;279:1364–1370.
- .Primary care: specialists or generalists.Mayo Clin Proc.1996;71:415–419.
- ,,, et al.Consultation between cardiologists and generalists in the management of acute myocardial infarction: implications for quality of care.Arch Intern Med.1998;158:1778–1783.
- ,,, et al.Quality of care and outcomes of adults with asthma treated by specialists and generalists in managed care.Arch Intern Med.2001;161:2554–2560.
- ,,, et al.Nephrologist care and mortality in patients with chronic renal insufficiency.Arch Intern Med.2002;162:2002–2006.
- ,,,,,.Ischemic stroke: outcomes, patient mix, and practice variation for neurologists and generalists in a community.Neurology.1998;50:1699–1678.
- ,,.Where and how should elderly stroke patients be treated? A randomized trial.Stroke.1995;26:249–253.
- ,,,,,.What role do neurologists play in determining the costs and outcomes of stroke patients?Stroke.1996;27:1937–1943.
- ,,,.30‐Day survival and rehospitalization for stroke patients according to physician specialty.Cerebrovasc Dis.2006;22:21–26.
- .The need for randomization in the study of intended effects.Stat Med.1983;2:267–271.
- ,.Modern Epidemiology.Philadelphia, PA:Lippincott‐Raven;1998.
- ,,,.Modeling treatment effects on binary outcomes with grouped‐treatment variables and individual covariates.Am J Epidemiol.2002;156:753–760.
- ,,.Does more intensive treatment of acute myocardial infarction in the elderly reduce mortality? Analysis using instrumental variables.JAMA.1994;272:859–866.
- .The Cochrane Lecture. The best and the enemy of the good: randomised controlled trials, uncertainty, and assessing the role of patient choice in medical decision making.J Epidemiol Community Health.1994;48:6–15.
- ,.Uses of ecologic studies in the assessment of intended treatment effects.J Clin Epidemiol.1999;52:7–12.
- University HealthSystem Consortium. Available at: http://www.uhc.edu. Accessed April 11,2007.
- ,,,.Identification of incident stroke in Norway: hospital discharge data compared with a population‐based stroke register.Stroke.1999;30:56–60.
- .Accuracy of ICD‐9‐CM coding for the identification of patients with acute ischemic stroke: effect of modifier codes.Stroke.1998;29:1602–1604.
- ,,,.Accuracy of hospital discharge abstracts for identifying stroke.Stroke.1994;25:2348–2355.
- ,.Characteristics of academic medical centers and ischemic stroke outcomes.Stroke.2001;32:2137–2142.
- ,,, et al.Utilization of intravenous tissue‐type plasminogen activator for ischemic stroke at academic medical centers: the influence of ethnicity.Stroke.2001;32:1061–1068.
- .Biostatistics: a Foundation for Analysis in the Health Sciences.New York:John Wiley 1995.
- Sachs Group.Sachs Complications Profiler, version 1.0, User's Guide.Evanston, IL,1995.
- University HealthSystem Consortium Services Corporation.Clinical information management: risk adjustment of the UHC clinical database.Oak Brook, IL,1997.
- .Combining ecological and individual variables to reduce confounding by indication: case study—subarachnoid hemorrhage treatment.J Clin Epidemiol.2000;53:1236–1241.
- The National Institute of Neurological Disorders and Stroke rt‐PA Stroke Study Group.Tissue plasminogen activator for acute ischemic stroke.N Engl J Med.1995;333:1581–1588.
- ,,, et al.Recommendations for the establishment of primary stroke centers. Brain Attack Coalition.JAMA.2000;283:3102–3109.
- ,,, et al.Do the Brain Attack Coalition's criteria for stroke centers improve care for ischemic stroke?Neurology.2005;64:422–427.
- Organised inpatient (stroke unit) care for stroke.Cochrane Database Syst Rev2002:CD000197.
- ,,,,,.Stroke‐unit care for acute stroke patients: an observational follow‐up study.Lancet.2007;369:299–305.
- ,,,.Multispecialty stroke services in California hospitals are associated with reduced mortality.Neurology.2006;66:1527–32.
- ,,,,,.Inaccuracy of the International Classification of Diseases (ICD‐9‐CM) in identifying the diagnosis of ischemic cerebrovascular disease.Neurology.1997;49:660–664.
- .Physician characteristics and distribution in the US. 2006 ed. In: Department of Data Quality and Measurement, ed. Physician Characteristics and Distribution in the US. Washington, DC: American Medical Association,2006:312.
Copyright © 2008 Society of Hospital Medicine
Non–Housestaff Medicine Services in Academic Centers
Many academic medical centers (AMCs) have developed nonhousestaff services to provide clinical care once provided by physicians‐in‐training. These services, often staffed by hospitalists and/or midlevel providers, have experienced tremendous growth in the past few years, yet very little exists in the literature about their development, structure, efficacy, or impact on hospitals, patients, and hospital medicine programs. The primary forces driving this growth include Accreditation Council for Graduate Medical Education (ACGME) resident duty hour restrictions,1 growth of the hospitalist movement,2 and the emphasis on simultaneously improving financial performance and quality of care in AMCs.3
Resident Duty Hour Restrictions
In 2003, the ACGME mandated restrictions on resident work hours, limiting trainees to 80 hours per week.1 Many training programs struggled with how to provide important clinical services while complying with the new restrictionscreating numerous models that bridged care between different shifts of residents.45 Implementation of day floats (a dedicated resident who rounds with the postcall team), night floats (a dedicated overnight resident who admits and cross‐covers patients), or some variation of both was common.6 No guidelines accompanied the ACGME mandate, leaving institutions to independently structure their programs without a known best practice.
Subsequent literature carefully addressed how the duty hour restrictions affect residents' lives and education but failed to discuss models for providing care.711 Training programs began to institute necessary changes but in doing so, created greater patient discontinuity and increased handoffs between residents, elevating the potential for adverse patient outcomes.12 Recent large‐scale studies indicate that inpatient care is the same or improved since adoption of the duty hour restrictions,1316 but controversy continues, with several editorials debating the issue.1719
Because increasing the volume of patients on housestaff services was not a viable option,20 many AMCs created nonhousestaff services and hired midlevel providers (nurse practitioners and physician assistants) to offset resident workloads and comply with the new restrictions. However, this strategy represented a very expensive alternative.21 Moreover, the current 80‐hour work limits may be revised downward, particularly given the lower restrictions in other countries,22 and this will further drive the demand for nonhousestaff services. Hospitalists, with their documented impact on efficiency and return on investment,23 represent a solution to fill these needs and have quickly become the predominant approach at AMCs.
The Hospitalist Movement
Since the term hospitalist was first coined in 1996,24 the remarkable growth of the number of practicing hospitalists emphasizes how first community hospitals and now AMCs have embraced this approach.25 With more than 20,000 nationwide and projections that the field will grow to 30,000 by 2010,26 hospitalists are becoming the primary providers for in‐patients.2 This growth was further catalyzed when widely expressed concerns about safety and quality became public,2728 and hospitalists incorporated patient safety and quality improvement activities into their efforts.3 The confluence of these factors also prompted emergence of hospital medicine programs at AMCs, a growth that came with anticipated dangers.29 Reflecting the recognition that hospital medicine is becoming a separate specialty30 and is integral to the functioning of an AMC, institutions now operate dedicated divisions of hospital medicine.
AMCs and Hospital Performance
AMCs operate 3 related enterprises: a medical school that trains future physicians, a research arena that promotes basic and clinical investigation, and health care services that often encompass both hospitals and clinics. The financial viability of AMCs has always been a topic of debate, largely because of the different missions they pursue and the financial means by which they survive.3133 Over the past decade, cuts in Medicare reimbursement, challenges in balancing bed availability with occupancy rates, and a growing emphasis on cost reduction have created a more competitive health care environment, but without the predicted demise of AMCs.34 Because education and research generally fail to bolster the bottom line, AMCs have focused on optimizing clinical services to promote financial viability.
Hospitalists are uniquely positioned to help this bottom line, just as they do at community hospitals. Their involvement in patient care may produce reductions in length of stay, greater efficiency in discharge planning, and significant cost savings.3537 Hospitalists may also improve throughput in emergency departments and decrease wait times, leading to more efficient bed utilization.38 This leads to a potential for greater hospital revenue by increasing both the number of admissions, particularly surgical cases, and staffed inpatient beds, the latter a premium, as AMCs continue to expand their bed capacity almost annually. Finally, hospitalists may serve as change agents in improving the quality and safety of care delivered, an increasingly important metric given the desire for and expansion of publicly reported measures.
From a financial standpoint, Medicare support to AMCs for training residents now subsidizes fewer clinical care hours. Hospitalist‐driven nonhousestaff services will continue to fulfill a need created by this marked change in residency training. The tension of who pays for nonhousestaff servicesincreased federal support, financial backing from AMCs, or academic department fundsposes an ongoing struggle. In fact, this may be the most important issue currently debated among hospital administrators and department chairs. Regardless, AMCs continue to view hospitalists as a mechanism (or even solution) to maintaining their financial bottom line through improving care delivery systems, adhering to resident work hour restrictions, leading quality and safety improvement initiatives, and improving clinical patient outcomes.
MODELS FOR NONHOUSESTAFF MEDICAL SERVICES
For AMCs developing nonhousestaff services, the process begins by addressing a series of important questions (Table 1). How these questions are answered is often driven by local factors such as the vision of local leadership and the availability of important resources. Nonetheless, it is important for hospitals to share their experiences because best practices remain unclear. Table 2 provides a tabular snapshot of nonhousestaff medicine services at 5 AMCs to highlight similarities and differences. Data in the table were compiled by having a representative from each AMC report the different attributes, which reflects each program as of July 2007. Table 2 provides no data on the quality or efficiency of housestaff versus nonhousestaff services, though this type of investigation is underway and will be critical in future planning.3940
| Questions | Potential options |
|---|---|
| Who will provide care on nonhousestaff services? | Physicians seeking a 1‐year position |
| Physicians committed to a purely clinical career | |
| Physicians committed to an academic career in hospital medicine | |
| Will hospitalists share nonhousestaff service time, or will there be dedicated nonhousestaff hospitalists? | Hybrid positions |
| Dedicated nonhousestaff hospitalists | |
| Use of PGY‐4s1‐year positions (often individuals planning a fellowship) | |
| How should staffing be organized? | Hospitalist‐only services |
| Use of midlevel providers | |
| Will there be 24‐7 coverage, and if so, how will nights be staffed? | Dedicated nocturnists |
| Shared among daytime hospitalists | |
| Midlevel providers | |
| Moonlighters (fellows or residents) | |
| What type of schedule will provide blocks of clinical time to ensure continuity of care but also ensure adequate nonclinical time to prevent physician burnout and turnover? | 7 on/7 off sequences |
| 45 day sequences | |
| Longer shifts with fewer shifts per month | |
| Shorter shifts with more shifts per month | |
| Where will patients on a nonhousestaff service receive care? | Geographically designed serviced |
| ○ Different floor | |
| ○ Different hospital | |
| Mixed among housestaff service | |
| What patient population will be cared for on the nonhousestaff service? | Same as on housestaff service |
| Based on bed availability if nonhousestaff service is geographic (a unit) | |
| Based on triage guidelines (lower acuity, observation patients, specific diagnoses) | |
| What volume of patients will be cared for on the nonhousestaff service? | Fixed census cap based on staffing |
| Flexible census depending on activity of housestaff service (above their cap) | |
| Will compensation for providing nonhousestaff services differ from that on housestaff services? | Higher base salary |
| Incentives tied to nonhousestaff time | |
| Different incentive structures |
| Attributes | BWH | Emory | University of Michigan | Northwestern | UCSF |
|---|---|---|---|---|---|
| Description of staffing model | Mon.‐Sun.: 1 daytime Hospitalist | Mon.‐Sun.: 4 daytime hospitalists, 2 swing shift admitters | Weekdays: 7 daytime hospitalists, 1 swing shift hospitalist | Mon.‐Sun.: 8 daytime hospitalists, 1 triage hospitalist | Weekdays: 2 daytime hospitalists, 1 swing shift hospitalist |
| Nights: 1 MD | Nights: 1 MDs | Weekends: 7 daytime hospitalists | Nights: 2 MDs | Weekends: 2 daytime hospitalists | |
| Nights: 2 MDs | Nights: 1 MD | ||||
| Location of service | In same university hospital | In same university hospital | In same university hospital | In same university hospital | Physically separate hospital affiliate (UCSF Medical Center at Mount Zion) |
| Nonhousestaff FTEs/total hospitalist group | 3/15 | 10/14 | 20/30 | 25/34 | 6/36 |
| What hospitalists provide care on nonhous estaff services? | Core of 3 hospitalists (also do month on housestaff service) | Hospitalist group shares nonhousestaff services | Core of 14 FTEs dedicated to nonhousestaff services | Hospitalist group shares nonhousestaff services | Core of 6 Mount Zionbased hospitalists (also spend 23 months on housestaff service at university hospital) |
| Other 6 FTEs consist of 10 faculty with mixed roles | |||||
| Age of service | 2 years | 4 years | 3 years | 5 years | 3 years |
| How patients get assigned to non‐housestaff service? | 1. Only ED admissions with no transfers from ICU or other services | Assigned by rotation | 1. Alternating admissions with housestaff services during afternoon | 1. Alternating admissions with housestaff services during day | 1. Lower‐acuity admissions from ED |
| 2. Admit whenever bed open on service (geographic) | 2. Observation cases triaged directly to service | 2. Lower‐acuity patients and direct admissions | 2. Lower‐acuity admissions from clinics | ||
| 3. Once housestaff cap, all subsequent admits until midnight to nonhousestaff service | 3. Nonhousestaff service admits all patients once resident caps reached | 3. Transfers from housestaff service no longer requiring tertiary services (or with complex discharge planning) | |||
| Average daily census of nonhousestaff service | 12 | 56 | 70 (75 cap) | 8595 | 2026 |
| Number of shifts per month/shift duration | 15/1012 hours | 15/12 hours | 1517 (depending on number of nights covered)/812 hours (swing = 8 hours, day = 1012 hours, night = 12 hours) | 20/1012 hours | 1617/1012 hours |
| Shift sequences | 710 days consecutive | Variable | 67 days consecutive followed by 1 night for those who cover nights | 7 days consecutive | 4‐ to 6‐day variable sequences |
| Total clinical days worked/year | 168 | 182.5 | 185202 (depending on number of nights covered) | 212 | 196 |
| Weekend clinical time | 50% of weekends | 50% of weekends | 50% of weekends | 50% of weekends | 50% of weekends |
| Night coverage/by whom? | Yes/exclusively moonlighters | Yes/shared (50% covered by 1 dedicated nocturnist) | Yes/66% of nights staffed by dedicated nocturnists with remainder shared | Yes/exclusively by six 1‐year nocturnists | Yes/exclusively by moonlighters |
| Presence of midlevel providers | Yes 6 FTE PAs Mon.‐Sun. | No | Yes 8 FTE PAs weekdays | No | No |
| Presence of dedicated case manager | Yes | Yes | Yes | No | Yes |
| Presence of medical students for patient care | No | No | Yes, 4th‐year subinterns or students on elective rotation | No | No |
| Compensation model | Salary + weekend bonus beyond 10 | Salary + incentive | Base + shift‐based incentive + quality incentive | Salary + incentive | Salary |
| Pay differential compared to housestaff service compensation | 10% Higher because of weekend bonus | None | About 20% higher base compensation; loan forgiveness program tied to nonhousestaff time | None | About 20% higher compensation |
| Hospital financial support | Yes | Yes | Yes | Yes | Yes |
Table 2 does illustrate several important considerations in structuring nonhousestaff services. For example, if a nonhousestaff service operates at a different physical location, careful triage of patients is necessary. Resources, including the availability of subspecialty and surgical consultants, may differ, and thus patient complexity and acuity may dictate whether a patient gets admitted to the nonhousestaff service. These triage factors were a major challenge in the design of UCSF's nonhousestaff service. The other nonhousestaff services handle overflow admissions after the housestaff service reaches a census or admission cap; transfers between services rarely occur, and resources are similar.
Other observations include that hospitalists work a similar number of hours each year and cover 50% of weekends but with differing shift lengths and sequences. Each service also provides night coverage but only Emory, the University of Michigan, and Northwestern utilize dedicated nocturnists. The University of Michigan and Brigham & Women's Hospital are the only sites that employ midlevel providers who work closely with hospitalists. In terms of group structure, Northwestern's hospitalists are the most integrated, with each hospitalist sharing equal responsibility for nonhousestaff coverage. In contrast, the other programs use selected hospitalists or a dedicated core of hospitalists to provide nonhousestaff services. Compensation models also vary, with certain groups salaried and others having incentive systems, although all receive hospital‐based funding support. Hospital‐based funding support ranges from 40% to 100% of total program costs across sites, creating similar variance in a given program's deficit risk. Finally, most programs do compensate nonhousestaff services at higher rates.
All the decisions captured in Table 2 have implications for costs, recruitment, and service structure. Furthermore, the striking variations demonstrate how different academic hospitalist positions can occur both within a hospital medicine group and across institutions. Of note, Table 2 only characterizes nonhousestaff medicine services, not the growing number of comanagement (eg, orthopedics, neurosurgery, or hematology/oncology) and other clinical services (eg, observation unit or preoperative medicine clinic) also staffed by hospitalists at AMCs.
CHALLENGES
Hospital medicine programs and AMCs face several challenges in building non‐housestaff services, but these will likely become less daunting as programs learn from their own experiences, from those of colleagues at other institutions, and from future investigations of these care models. We highlight a few issues below that warrant important consideration.
The Equities of the System
Prior to developing nonhousestaff services, our academic hospitalist programs scheduled teaching service time in month or half‐month blocks, balancing holidays and weekends. Equity in scheduling became a function of required clinical time, sources of non‐clinical funding (eg, grants, educational or administrative roles), and expectations for scholarship, attributes typical of most subspecialty academic divisions. Given the differing clinical missions that have stimulated academic hospital medicine programs to form, concerns of scheduling equity have grown, posing challenges not experienced in other divisions.
Institutions that choose to divide housestaff and nonhousestaff duties among distinct groups of hospitalists create the potential for a 2‐tiered system, one in which those with housestaff roles are more valued and respected by the institution. Hospitalists working on nonhousestaff services admit patients, write orders, and field direct patient calls, a role rarely undertaken by subspecialty attendings or hospitalists on housestaff services. Our collective experiences provide evidence of the danger of this second‐class‐citizen status, one that requires attention to ensure job satisfaction, retention, and necessary career development.
Institutions have accentuated the second‐class‐citizen concern by staffing nonhousestaff roles with 1‐year hospitalistsPGY‐4s. Most of these hires in our institutions are individuals just out of residency and intent on pursuing a fellowship. We speculate that they enjoy the comforts of the AMC where they often trained and accept purely nonhousestaff positions because of what they view as an appealing work schedule and salary. Although this approach addresses the growing need for hospitalists on nonhousestaff services in the short term, these positions must remain attractive enough (both financially and professionally) to encourage residency graduates to pursue an academic hospitalist career instead of a 1‐year position as a transition to fellowship. Otherwise, the approach conveys a message that relatively inexperienced physicians are good enough to be hospitalists.
Developing a cadre of clinically focused hospitalists who provide outstanding patient care and also garner respect as successful academicians is a difficult task. Although 1 group in our sample (Northwestern) shares nonhousestaff responsibilities equally, others may find this impractical, particularly where faculty members were hired before nonhousestaff services were established. Redefining such clinical positions several years into a career may be challenging, as it forces faculty members into roles they didn't sign up for or grandfathers them out of such roles, adding to the risk of a 2‐tiered system. Alternatively, groups may focus on building academic activities into nonhousestaff services, including medical student teaching, quality improvement, or clinical research activities. In this article, we deliberately classified these services as nonhousestaff rather than non‐teaching because the latter fails to acknowledge that these hospitalists often serve as teachers (eg, housestaff conferences, supervision of midlevel providers, and/or rotating medical students)an important if not symbolic distinction. It is imperative that planning for nonhousestaff services balance the larger academic mission of hospital medicine groups with creating equitable, valued, and sustainable job descriptions.
Defining the Patient Mix
Developing an optimal patient mix on nonhousestaff services also carries important implications. For services that work in parallel with the housestaff service and simply take extra patients above the resident cap, this concern may be less significant. However, other nonhousestaff services have been structured to care for lower‐acuity patients (eg, cellulitis, asthma, pneumonia) or select patient populations (eg, sickle cell or inflammatory bowel disease). This distribution system potentially changes the educational experience on the housestaff servicedecreasing the bread‐and‐butter admissionsbut also may affect the job satisfaction of hospitalists and midlevel providers on nonhousestaff services. Building triage criteria, working with emergency department leadership, and avoiding patients being turfed between different services is critical. We strongly recommend a regular process to review admissions to each service and determine when the triage process requires further calibration.
Recruitment and Retention
Traditionally, graduates of residency or fellowship training programs chose academic positions because of an interest in teaching, a desire for scholarship, or a commitment to research. Those interested in primarily clinical roles typically pursued positions in nonacademic settings. The development of nonhousestaff services challenges this paradigm because the objective for academic hospitalist leadership now becomes recruiting pure clinicians as well as academicians. These might be the same individual, a hospitalist who provides both housestaff and nonhousestaff services, or 2 different individuals if the nonhousestaff service is covered by dedicated hospitalists. In addition, with the current promotion structure in academia, a purely clinical position may be less attractive, as it provides fewer opportunities for advancement.
Therefore, recruitment and retention of academic hospitalists will require job descriptions that provide dedicated teaching opportunities, time for participation in quality and safety improvement projects, or pursuit of a scholarly interest in non‐clinical timethe diastole of an academic hospitalist.41 Hospital medicine leadership will also need to better distinguish off‐time from non‐clinical time, as many young hospitalists struggle to balance professional and personal commitmentsa recipe for burnout.42 Regardless of how clinical responsibilities differ between 2 hospitalists, providing them with similar academic resources is what will distinguish their positions from that in the community. Furthermore, many groups have chosen to pay faculty a premium for their nonhousestaff roles or to use specific recruitment incentives such as educational loan forgiveness programs.
With the expected growth of nonhousestaff services and surgical comanagement, hospital medicine programs will also need to determine if new hires will focus on a specific service (eg, orthopedic hospitalist) or whether job descriptions will include a mix of activities (eg, 3 months' teaching service, 3 months' nonhousestaff medical service, and 3 months' surgical comanagement service). A second and equally important question is where does the hospitalist live? If cardiology wants hospitalists to care for their patients, should they be hired and mentored by cardiologists or by hospitalists in a division of general or hospital medicine? In many cases, a graduating resident with plans to pursue a fellowship (eg, cardiology or hematology/oncology) may be a perfect candidate for a 1‐year position on his or her future specialty service. However, in the long term, maintaining all the academic hospitalists under the same umbrella will provide greater mentorship, professional development, opportunities for collaboration, clinical diversity, and sense of belonging to a group, rather than being a token hospitalist for another division.
Compensation and Financial Relationships with AMCs
Salaries for hospitalists working on nonhousestaff services are typically higher at AMCs, which are competing with community standards given the similar level of clinical hours worked. However, although pay for nonhousestaff activities should reflect the nature of the work, compensation models based on clinical productivity alone may prove inadequate. It appears hospitalists working in academic facilities spend significant time on indirect patient care because of these hospitals' inefficiencies, usually not found in community settings.43 Devising compensation for an academic hospitalist requires careful attention and must balance a number of factors because these hospitalists will not generate their entire salary from clinical services. Financial support must come from either the division or medical center, an annual negotiation at AMCs.
Several methods exist to structure hospitalist compensation. A hospitalist's salary may be fixed, may have a base salary with incentives, or may be derived based on clinical productivity. For example, if a hospital medicine program provides both housestaff and nonhousestaff services and employs a fixed‐salary approach, it may choose a menu‐style method to determine compensation (eg, 6 months on nonhousestaff service at x dollars/month + 3 months on housestaff service at x dollars/month = annual salary). If a hospitalist takes on a funded nonclinical role or secures extramural funding, the salary menu gets adjusted accordingly as the clinical time is bought out. Critics of the fixed‐salary approach argue that paying each hospitalist the same salary regardless of the specific job description yields an inequitable system in which some are rewarded with less clinical time.
Compensation should probably have a guaranteed base salary with incentives, which could be determined by a formula that weighs clinical productivity, quality improvement efforts, scholarly activity, and teaching excellence. This model provides financial incentives to develop both clinically and academically but introduces complexity in determining a fair incentive structure. Finally, compensation can be structured without salary guarantee and putting compensation fully at risk based on clinical productivity, although this is an unlikely strategy for any hospital medicine group. This approach does disproportionately reward high volume providers, potentially at the risk of quality and safety, but also creates significant incentives to improve efficiency.
With respect to AMC relationships, hospital medicine programs must ensure the positive return on investment that drives financial support at their institutions. This fundamental economic dynamic makes AMCs dependent on their hospital medicine groups and vice versa. We caution programs from solely relying on measures such as reduced hospital costs or length of stay as a basis of funding unless there is a reward for maintaining performance once it inevitably plateaus. Moreover, explicitly tying utilization efficiency (ie, length of stay) to salary violates Stark rules44 and carries potential malpractice implications should patient care errors be attributable to premature hospital discharge. Over time hospitalists will need to maintain clinical benchmarks but also provide additional and valued services to their institutions, including quality and safety improvement activities and compliance with residency work hour restrictions.
Defining the Academic Hospitalist
The question is simple and perhaps philosophical: Are hospitalists who work at an AMC academic hospitalists? And what job description truly defines an academic hospitalist? Currently, there are no standards for the clinical activity of an academic hospitalist position (eg, number of weeks, weekends, and hours) or for assessment of nonclinical productivity. Hospital medicine programs face the challenge of defining positions that fulfill the growing clinical mission at AMCs but have little experience or guidance in ensuring they will lead to advancing the academic mission. Specifically, how do hospitalists who provide mostly clinical care, particularly on nonhousestaff services, achieve promotion? Hospital medicine program leadership must create enough opportunity and time for the development of skills in research, education, and quality or systems improvement if academic hospitalists are to succeed.
The Association of Chiefs of General Internal Medicine (ACGIM), the Society of General Internal Medicine (SGIM), and the Society of Hospital Medicine (SHM) are currently collaborating to develop consensus guidelines in this area. Ultimately, through the efforts of these important governing bodies, the specialty of hospital medicine will be able to demonstrate the unique skills and services they provide and move toward advocating for academic promotion criteria that recognize their value and accomplishments.
FUTURE DIRECTIONS
Many lament that the milieu for academic hospitalists raises more challenges than solutions, but we believe the current era is one of excitement and opportunity. In the coming years, we will experience continued growth of nonhousestaff services, including greater comanagement with our surgical and medical specialty colleagues. These opportunities will create new relationships and increase our visibility in AMCs. However, we must remain committed to studying nonhousestaff services and determine if and how they differ from their housestaff and community counterparts, as this will be an important step toward addressing current challenges.
As hospitalists take on increasingly diverse roles,45 we must also lead initiatives to better train, recruit, and retain those interested in our specialty. Promoting our field and recruiting future faculty should occur through local hospitalist career nights, events at national meetings (targeting students, housestaff, and fellows), and other mechanisms utilized by our subspecialty colleagues. For housestaff interested in fellowship training, the growing number of hospitalist fellowships can provide skills in teaching and quality improvement.46 For trainees committed to research, we should work with existing general medicine research fellowships and partner to provide hospitalist mentorship.
Hospitalists are in a unique position to influence the delivery of clinical services, shape the future of residency training, guide quality and safety improvement initiatives, and take on leadership roles through our departments, universities, and medical centers. With the growing number of clinical services being added to our portfolio, we will need careful planning and evaluation of our efforts to build successful partnerships and develop faculty roles that balance clinical and academic pursuits to sustain long‐term and satisfying hospitalist careers.
- Accreditation Council for Graduate Medical Education. Information related to the ACGME's effort to address resident duty hours and other relevant resource materials. Available at: http://www.acgme.org/acWebsite/dutyHours/dh_index.asp Accessed May 28,2007.
- ,,,.The status of hospital medicine groups in the United States.J Hosp Med.2006;1:75–80.
- .Reflections: the hospitalist movement a decade later.J Hosp Med.2006;1:248–252.
- .Duty hours for resident physicians—tough choices for teaching hospitals.N Engl J Med.2002;347:1275–1278.
- ,.Resident work hours, hospitalist programs and academic medical centers.The Hospitalist.2005;Jan/Feb:30–33.
- .Adapting to duty‐hour limits—four years on.N Engl J Med.2007;356:2668–2670.
- ,,,,,.Effects of work hour reduction on residents' lives: a systematic review.JAMA.2005;294:1088–1100.
- ,,,,.Impact of reduced duty hours on residents' educational satisfaction at the University of California, San Francisco.Acad Med.2006;81:76–81.
- ,,, et al.Effect of Residency Duty‐Hour Limits. Views of Key Clinical Faculty.Arch Intern Med.2007;167:1487–1492.
- ,,,.Perceived impact of duty hours regulation: a survey of residents and program directors.Am J Med.2007;120:644–648.
- ,,,.The impact of duty hours on resident self reports of errors.J Gen Intern Med.2007;22:205–209.
- ,,,,.Managing discontinuity in academic medical centers: strategies for a safe and effective resident sign‐out.J Hosp Med.2006;1:257–266.
- ,.Changes in hospital mortality associated with residency work‐hour regulations.Ann Intern Med.2007;147:73–80.
- ,,,.Changes in outcomes for internal medicine inpatients after work‐hour regulations.Ann Intern Med.2007;147:97–103.
- ,,, et al.Mortality among hospitalized Medicare beneficiaries in the first 2 years following ACGME resident duty hour reform.JAMA.2007;298:975–983.
- ,,, et al.Mortality among patients in VA hospitals in the first 2 years following ACGME resident duty hour reform.JAMA.2007;298:984–991.
- .An elusive balance—residents' work hours and the continuity of care.N Engl J Med.2007;356:2665–2667.
- ,.Hippocrates affirmed? Limiting residents' work hours does no harm to patients.Ann Intern Med.2007;356:143–144.
- ,.Evaluating resident duty hour reforms.JAMA.2007;298:1055–1057.
- ,,,,.Housestaff team workload and organization effects on patient outcomes in an academic general internal medicine inpatient service.Arch Intern Med.2007;167:47–52.
- ,,,.Predicting future staffing needs at teaching hospitals: use of an analytical program with multiple variables.Arch Surg.2007;142:329–334.
- . A primer on: resident work hours. American Medical Student Association. 6th ed. 2005. Available at: http://www.amsa.org/rwh/RWHprimer_6thEdition.pdf. Accessed May 28,2007.
- ,.The hospitalist movement 5 years later.JAMA.2002;287:487–494.
- ,.The emerging role of “hospitalists” in the American health care system.N Engl J Med.1996;335:514–517.
- .The future of hospital medicine: evolution or revolution?Am J Med.2004;117:446–450.
- Society of Hospital Medicine. Media Center link: Growth of hospital medicine nationwide. Available at www.hospitalmedicine.org. Accessed May 28,2007.
- Kohn L,Corrigan JM,Donaldson MS, eds.To Err Is Human: Building a Safer Health System.Washington DC:Committee on Quality of Health Care in America, Institute of Medicine, National Academy Press;2000.
- Committee on Quality of Health Care in America, Institute of Medicine.Crossing the Quality Chasm: A New Health System for the 21st Century.Washington, DC:National Academy Press;2001.
- ,.Hospitalists in teaching hospitals: opportunities but not without danger.J Gen Intern Med.2004;19:392–393.
- .What will board certification be‐and mean‐for hospitalists?J Hosp Med.2007;2:102–104.
- .Academic medical centers under siege.N Engl J Med.1994;331:1370–1371.
- ,.Academic medicine meets managed care: a high impact collision.Acad Med.1996;71:839–845.
- .Preventing the academic medical center from becoming an oxymoron.Acad Med.1996;71:117–120.
- ,,.Why have academic medical center survived?JAMA.2005:293;1495–1500.
- ,,,.Comparison of hospitalist and nonhospitalists in inpatient length of stay adjusting for patient and physician characteristics.J Gen Intern Med.2004;19:1127–1132.
- ,,.Comparison of hospital costs and length of stay for community internists, hospitalists, and academicians.J Gen Intern Med.2007;22;662–667.
- ,.The impact of hospitalists on the cost and quality of inpatient care in the United States: a research synthesis.Med Care Res Rev.2005;62:379–406.
- ,,.Hospitalists and an innovative emergency department admissions process.J Gen Intern Med.2004;19:266–268.
- ,,,,.Comparison of resource utilization and clinical outcomes between teaching and nonteaching medical services.J Hosp Med.2007;2:150–157.
- ,,.Comparison of hospital costs and length of stay for community internists, hospitalists, and academicians.J Gen Intern Med.2007;22:662–667.
- ,,,.Preparing for “diastole”: advanced training opportunities for academic hospitalists.J Hosp Med.2006;1:368–377.
- Society of Hospital Medicine Career Satisfaction Task Force. White Paper on Hospitalist Career Satisfaction. 2006;1–45. Available at: http://www.hospitalmedicine.org. Accessed August 11,2007.
- ,,.How hospitalists spend their time: insights on efficiency and safety.J Hosp Med.2006;1:88–93.
- A Guide to Complying with Stark Self‐Referral Rules.Washington, DC:Atlantic Information Services, Inc.; 2004. Available at: http://www.aispub.com/. Accessed September 9, 2007.
- ,.The expanding role of hospitalists in the United States.Swiss Med Wkly.2006;136:591–596.
- ,,,.Hospital medicine fellowships: works in progress.Am J Med.2006;119:72e71–e77.
Many academic medical centers (AMCs) have developed nonhousestaff services to provide clinical care once provided by physicians‐in‐training. These services, often staffed by hospitalists and/or midlevel providers, have experienced tremendous growth in the past few years, yet very little exists in the literature about their development, structure, efficacy, or impact on hospitals, patients, and hospital medicine programs. The primary forces driving this growth include Accreditation Council for Graduate Medical Education (ACGME) resident duty hour restrictions,1 growth of the hospitalist movement,2 and the emphasis on simultaneously improving financial performance and quality of care in AMCs.3
Resident Duty Hour Restrictions
In 2003, the ACGME mandated restrictions on resident work hours, limiting trainees to 80 hours per week.1 Many training programs struggled with how to provide important clinical services while complying with the new restrictionscreating numerous models that bridged care between different shifts of residents.45 Implementation of day floats (a dedicated resident who rounds with the postcall team), night floats (a dedicated overnight resident who admits and cross‐covers patients), or some variation of both was common.6 No guidelines accompanied the ACGME mandate, leaving institutions to independently structure their programs without a known best practice.
Subsequent literature carefully addressed how the duty hour restrictions affect residents' lives and education but failed to discuss models for providing care.711 Training programs began to institute necessary changes but in doing so, created greater patient discontinuity and increased handoffs between residents, elevating the potential for adverse patient outcomes.12 Recent large‐scale studies indicate that inpatient care is the same or improved since adoption of the duty hour restrictions,1316 but controversy continues, with several editorials debating the issue.1719
Because increasing the volume of patients on housestaff services was not a viable option,20 many AMCs created nonhousestaff services and hired midlevel providers (nurse practitioners and physician assistants) to offset resident workloads and comply with the new restrictions. However, this strategy represented a very expensive alternative.21 Moreover, the current 80‐hour work limits may be revised downward, particularly given the lower restrictions in other countries,22 and this will further drive the demand for nonhousestaff services. Hospitalists, with their documented impact on efficiency and return on investment,23 represent a solution to fill these needs and have quickly become the predominant approach at AMCs.
The Hospitalist Movement
Since the term hospitalist was first coined in 1996,24 the remarkable growth of the number of practicing hospitalists emphasizes how first community hospitals and now AMCs have embraced this approach.25 With more than 20,000 nationwide and projections that the field will grow to 30,000 by 2010,26 hospitalists are becoming the primary providers for in‐patients.2 This growth was further catalyzed when widely expressed concerns about safety and quality became public,2728 and hospitalists incorporated patient safety and quality improvement activities into their efforts.3 The confluence of these factors also prompted emergence of hospital medicine programs at AMCs, a growth that came with anticipated dangers.29 Reflecting the recognition that hospital medicine is becoming a separate specialty30 and is integral to the functioning of an AMC, institutions now operate dedicated divisions of hospital medicine.
AMCs and Hospital Performance
AMCs operate 3 related enterprises: a medical school that trains future physicians, a research arena that promotes basic and clinical investigation, and health care services that often encompass both hospitals and clinics. The financial viability of AMCs has always been a topic of debate, largely because of the different missions they pursue and the financial means by which they survive.3133 Over the past decade, cuts in Medicare reimbursement, challenges in balancing bed availability with occupancy rates, and a growing emphasis on cost reduction have created a more competitive health care environment, but without the predicted demise of AMCs.34 Because education and research generally fail to bolster the bottom line, AMCs have focused on optimizing clinical services to promote financial viability.
Hospitalists are uniquely positioned to help this bottom line, just as they do at community hospitals. Their involvement in patient care may produce reductions in length of stay, greater efficiency in discharge planning, and significant cost savings.3537 Hospitalists may also improve throughput in emergency departments and decrease wait times, leading to more efficient bed utilization.38 This leads to a potential for greater hospital revenue by increasing both the number of admissions, particularly surgical cases, and staffed inpatient beds, the latter a premium, as AMCs continue to expand their bed capacity almost annually. Finally, hospitalists may serve as change agents in improving the quality and safety of care delivered, an increasingly important metric given the desire for and expansion of publicly reported measures.
From a financial standpoint, Medicare support to AMCs for training residents now subsidizes fewer clinical care hours. Hospitalist‐driven nonhousestaff services will continue to fulfill a need created by this marked change in residency training. The tension of who pays for nonhousestaff servicesincreased federal support, financial backing from AMCs, or academic department fundsposes an ongoing struggle. In fact, this may be the most important issue currently debated among hospital administrators and department chairs. Regardless, AMCs continue to view hospitalists as a mechanism (or even solution) to maintaining their financial bottom line through improving care delivery systems, adhering to resident work hour restrictions, leading quality and safety improvement initiatives, and improving clinical patient outcomes.
MODELS FOR NONHOUSESTAFF MEDICAL SERVICES
For AMCs developing nonhousestaff services, the process begins by addressing a series of important questions (Table 1). How these questions are answered is often driven by local factors such as the vision of local leadership and the availability of important resources. Nonetheless, it is important for hospitals to share their experiences because best practices remain unclear. Table 2 provides a tabular snapshot of nonhousestaff medicine services at 5 AMCs to highlight similarities and differences. Data in the table were compiled by having a representative from each AMC report the different attributes, which reflects each program as of July 2007. Table 2 provides no data on the quality or efficiency of housestaff versus nonhousestaff services, though this type of investigation is underway and will be critical in future planning.3940
| Questions | Potential options |
|---|---|
| Who will provide care on nonhousestaff services? | Physicians seeking a 1‐year position |
| Physicians committed to a purely clinical career | |
| Physicians committed to an academic career in hospital medicine | |
| Will hospitalists share nonhousestaff service time, or will there be dedicated nonhousestaff hospitalists? | Hybrid positions |
| Dedicated nonhousestaff hospitalists | |
| Use of PGY‐4s1‐year positions (often individuals planning a fellowship) | |
| How should staffing be organized? | Hospitalist‐only services |
| Use of midlevel providers | |
| Will there be 24‐7 coverage, and if so, how will nights be staffed? | Dedicated nocturnists |
| Shared among daytime hospitalists | |
| Midlevel providers | |
| Moonlighters (fellows or residents) | |
| What type of schedule will provide blocks of clinical time to ensure continuity of care but also ensure adequate nonclinical time to prevent physician burnout and turnover? | 7 on/7 off sequences |
| 45 day sequences | |
| Longer shifts with fewer shifts per month | |
| Shorter shifts with more shifts per month | |
| Where will patients on a nonhousestaff service receive care? | Geographically designed serviced |
| ○ Different floor | |
| ○ Different hospital | |
| Mixed among housestaff service | |
| What patient population will be cared for on the nonhousestaff service? | Same as on housestaff service |
| Based on bed availability if nonhousestaff service is geographic (a unit) | |
| Based on triage guidelines (lower acuity, observation patients, specific diagnoses) | |
| What volume of patients will be cared for on the nonhousestaff service? | Fixed census cap based on staffing |
| Flexible census depending on activity of housestaff service (above their cap) | |
| Will compensation for providing nonhousestaff services differ from that on housestaff services? | Higher base salary |
| Incentives tied to nonhousestaff time | |
| Different incentive structures |
| Attributes | BWH | Emory | University of Michigan | Northwestern | UCSF |
|---|---|---|---|---|---|
| Description of staffing model | Mon.‐Sun.: 1 daytime Hospitalist | Mon.‐Sun.: 4 daytime hospitalists, 2 swing shift admitters | Weekdays: 7 daytime hospitalists, 1 swing shift hospitalist | Mon.‐Sun.: 8 daytime hospitalists, 1 triage hospitalist | Weekdays: 2 daytime hospitalists, 1 swing shift hospitalist |
| Nights: 1 MD | Nights: 1 MDs | Weekends: 7 daytime hospitalists | Nights: 2 MDs | Weekends: 2 daytime hospitalists | |
| Nights: 2 MDs | Nights: 1 MD | ||||
| Location of service | In same university hospital | In same university hospital | In same university hospital | In same university hospital | Physically separate hospital affiliate (UCSF Medical Center at Mount Zion) |
| Nonhousestaff FTEs/total hospitalist group | 3/15 | 10/14 | 20/30 | 25/34 | 6/36 |
| What hospitalists provide care on nonhous estaff services? | Core of 3 hospitalists (also do month on housestaff service) | Hospitalist group shares nonhousestaff services | Core of 14 FTEs dedicated to nonhousestaff services | Hospitalist group shares nonhousestaff services | Core of 6 Mount Zionbased hospitalists (also spend 23 months on housestaff service at university hospital) |
| Other 6 FTEs consist of 10 faculty with mixed roles | |||||
| Age of service | 2 years | 4 years | 3 years | 5 years | 3 years |
| How patients get assigned to non‐housestaff service? | 1. Only ED admissions with no transfers from ICU or other services | Assigned by rotation | 1. Alternating admissions with housestaff services during afternoon | 1. Alternating admissions with housestaff services during day | 1. Lower‐acuity admissions from ED |
| 2. Admit whenever bed open on service (geographic) | 2. Observation cases triaged directly to service | 2. Lower‐acuity patients and direct admissions | 2. Lower‐acuity admissions from clinics | ||
| 3. Once housestaff cap, all subsequent admits until midnight to nonhousestaff service | 3. Nonhousestaff service admits all patients once resident caps reached | 3. Transfers from housestaff service no longer requiring tertiary services (or with complex discharge planning) | |||
| Average daily census of nonhousestaff service | 12 | 56 | 70 (75 cap) | 8595 | 2026 |
| Number of shifts per month/shift duration | 15/1012 hours | 15/12 hours | 1517 (depending on number of nights covered)/812 hours (swing = 8 hours, day = 1012 hours, night = 12 hours) | 20/1012 hours | 1617/1012 hours |
| Shift sequences | 710 days consecutive | Variable | 67 days consecutive followed by 1 night for those who cover nights | 7 days consecutive | 4‐ to 6‐day variable sequences |
| Total clinical days worked/year | 168 | 182.5 | 185202 (depending on number of nights covered) | 212 | 196 |
| Weekend clinical time | 50% of weekends | 50% of weekends | 50% of weekends | 50% of weekends | 50% of weekends |
| Night coverage/by whom? | Yes/exclusively moonlighters | Yes/shared (50% covered by 1 dedicated nocturnist) | Yes/66% of nights staffed by dedicated nocturnists with remainder shared | Yes/exclusively by six 1‐year nocturnists | Yes/exclusively by moonlighters |
| Presence of midlevel providers | Yes 6 FTE PAs Mon.‐Sun. | No | Yes 8 FTE PAs weekdays | No | No |
| Presence of dedicated case manager | Yes | Yes | Yes | No | Yes |
| Presence of medical students for patient care | No | No | Yes, 4th‐year subinterns or students on elective rotation | No | No |
| Compensation model | Salary + weekend bonus beyond 10 | Salary + incentive | Base + shift‐based incentive + quality incentive | Salary + incentive | Salary |
| Pay differential compared to housestaff service compensation | 10% Higher because of weekend bonus | None | About 20% higher base compensation; loan forgiveness program tied to nonhousestaff time | None | About 20% higher compensation |
| Hospital financial support | Yes | Yes | Yes | Yes | Yes |
Table 2 does illustrate several important considerations in structuring nonhousestaff services. For example, if a nonhousestaff service operates at a different physical location, careful triage of patients is necessary. Resources, including the availability of subspecialty and surgical consultants, may differ, and thus patient complexity and acuity may dictate whether a patient gets admitted to the nonhousestaff service. These triage factors were a major challenge in the design of UCSF's nonhousestaff service. The other nonhousestaff services handle overflow admissions after the housestaff service reaches a census or admission cap; transfers between services rarely occur, and resources are similar.
Other observations include that hospitalists work a similar number of hours each year and cover 50% of weekends but with differing shift lengths and sequences. Each service also provides night coverage but only Emory, the University of Michigan, and Northwestern utilize dedicated nocturnists. The University of Michigan and Brigham & Women's Hospital are the only sites that employ midlevel providers who work closely with hospitalists. In terms of group structure, Northwestern's hospitalists are the most integrated, with each hospitalist sharing equal responsibility for nonhousestaff coverage. In contrast, the other programs use selected hospitalists or a dedicated core of hospitalists to provide nonhousestaff services. Compensation models also vary, with certain groups salaried and others having incentive systems, although all receive hospital‐based funding support. Hospital‐based funding support ranges from 40% to 100% of total program costs across sites, creating similar variance in a given program's deficit risk. Finally, most programs do compensate nonhousestaff services at higher rates.
All the decisions captured in Table 2 have implications for costs, recruitment, and service structure. Furthermore, the striking variations demonstrate how different academic hospitalist positions can occur both within a hospital medicine group and across institutions. Of note, Table 2 only characterizes nonhousestaff medicine services, not the growing number of comanagement (eg, orthopedics, neurosurgery, or hematology/oncology) and other clinical services (eg, observation unit or preoperative medicine clinic) also staffed by hospitalists at AMCs.
CHALLENGES
Hospital medicine programs and AMCs face several challenges in building non‐housestaff services, but these will likely become less daunting as programs learn from their own experiences, from those of colleagues at other institutions, and from future investigations of these care models. We highlight a few issues below that warrant important consideration.
The Equities of the System
Prior to developing nonhousestaff services, our academic hospitalist programs scheduled teaching service time in month or half‐month blocks, balancing holidays and weekends. Equity in scheduling became a function of required clinical time, sources of non‐clinical funding (eg, grants, educational or administrative roles), and expectations for scholarship, attributes typical of most subspecialty academic divisions. Given the differing clinical missions that have stimulated academic hospital medicine programs to form, concerns of scheduling equity have grown, posing challenges not experienced in other divisions.
Institutions that choose to divide housestaff and nonhousestaff duties among distinct groups of hospitalists create the potential for a 2‐tiered system, one in which those with housestaff roles are more valued and respected by the institution. Hospitalists working on nonhousestaff services admit patients, write orders, and field direct patient calls, a role rarely undertaken by subspecialty attendings or hospitalists on housestaff services. Our collective experiences provide evidence of the danger of this second‐class‐citizen status, one that requires attention to ensure job satisfaction, retention, and necessary career development.
Institutions have accentuated the second‐class‐citizen concern by staffing nonhousestaff roles with 1‐year hospitalistsPGY‐4s. Most of these hires in our institutions are individuals just out of residency and intent on pursuing a fellowship. We speculate that they enjoy the comforts of the AMC where they often trained and accept purely nonhousestaff positions because of what they view as an appealing work schedule and salary. Although this approach addresses the growing need for hospitalists on nonhousestaff services in the short term, these positions must remain attractive enough (both financially and professionally) to encourage residency graduates to pursue an academic hospitalist career instead of a 1‐year position as a transition to fellowship. Otherwise, the approach conveys a message that relatively inexperienced physicians are good enough to be hospitalists.
Developing a cadre of clinically focused hospitalists who provide outstanding patient care and also garner respect as successful academicians is a difficult task. Although 1 group in our sample (Northwestern) shares nonhousestaff responsibilities equally, others may find this impractical, particularly where faculty members were hired before nonhousestaff services were established. Redefining such clinical positions several years into a career may be challenging, as it forces faculty members into roles they didn't sign up for or grandfathers them out of such roles, adding to the risk of a 2‐tiered system. Alternatively, groups may focus on building academic activities into nonhousestaff services, including medical student teaching, quality improvement, or clinical research activities. In this article, we deliberately classified these services as nonhousestaff rather than non‐teaching because the latter fails to acknowledge that these hospitalists often serve as teachers (eg, housestaff conferences, supervision of midlevel providers, and/or rotating medical students)an important if not symbolic distinction. It is imperative that planning for nonhousestaff services balance the larger academic mission of hospital medicine groups with creating equitable, valued, and sustainable job descriptions.
Defining the Patient Mix
Developing an optimal patient mix on nonhousestaff services also carries important implications. For services that work in parallel with the housestaff service and simply take extra patients above the resident cap, this concern may be less significant. However, other nonhousestaff services have been structured to care for lower‐acuity patients (eg, cellulitis, asthma, pneumonia) or select patient populations (eg, sickle cell or inflammatory bowel disease). This distribution system potentially changes the educational experience on the housestaff servicedecreasing the bread‐and‐butter admissionsbut also may affect the job satisfaction of hospitalists and midlevel providers on nonhousestaff services. Building triage criteria, working with emergency department leadership, and avoiding patients being turfed between different services is critical. We strongly recommend a regular process to review admissions to each service and determine when the triage process requires further calibration.
Recruitment and Retention
Traditionally, graduates of residency or fellowship training programs chose academic positions because of an interest in teaching, a desire for scholarship, or a commitment to research. Those interested in primarily clinical roles typically pursued positions in nonacademic settings. The development of nonhousestaff services challenges this paradigm because the objective for academic hospitalist leadership now becomes recruiting pure clinicians as well as academicians. These might be the same individual, a hospitalist who provides both housestaff and nonhousestaff services, or 2 different individuals if the nonhousestaff service is covered by dedicated hospitalists. In addition, with the current promotion structure in academia, a purely clinical position may be less attractive, as it provides fewer opportunities for advancement.
Therefore, recruitment and retention of academic hospitalists will require job descriptions that provide dedicated teaching opportunities, time for participation in quality and safety improvement projects, or pursuit of a scholarly interest in non‐clinical timethe diastole of an academic hospitalist.41 Hospital medicine leadership will also need to better distinguish off‐time from non‐clinical time, as many young hospitalists struggle to balance professional and personal commitmentsa recipe for burnout.42 Regardless of how clinical responsibilities differ between 2 hospitalists, providing them with similar academic resources is what will distinguish their positions from that in the community. Furthermore, many groups have chosen to pay faculty a premium for their nonhousestaff roles or to use specific recruitment incentives such as educational loan forgiveness programs.
With the expected growth of nonhousestaff services and surgical comanagement, hospital medicine programs will also need to determine if new hires will focus on a specific service (eg, orthopedic hospitalist) or whether job descriptions will include a mix of activities (eg, 3 months' teaching service, 3 months' nonhousestaff medical service, and 3 months' surgical comanagement service). A second and equally important question is where does the hospitalist live? If cardiology wants hospitalists to care for their patients, should they be hired and mentored by cardiologists or by hospitalists in a division of general or hospital medicine? In many cases, a graduating resident with plans to pursue a fellowship (eg, cardiology or hematology/oncology) may be a perfect candidate for a 1‐year position on his or her future specialty service. However, in the long term, maintaining all the academic hospitalists under the same umbrella will provide greater mentorship, professional development, opportunities for collaboration, clinical diversity, and sense of belonging to a group, rather than being a token hospitalist for another division.
Compensation and Financial Relationships with AMCs
Salaries for hospitalists working on nonhousestaff services are typically higher at AMCs, which are competing with community standards given the similar level of clinical hours worked. However, although pay for nonhousestaff activities should reflect the nature of the work, compensation models based on clinical productivity alone may prove inadequate. It appears hospitalists working in academic facilities spend significant time on indirect patient care because of these hospitals' inefficiencies, usually not found in community settings.43 Devising compensation for an academic hospitalist requires careful attention and must balance a number of factors because these hospitalists will not generate their entire salary from clinical services. Financial support must come from either the division or medical center, an annual negotiation at AMCs.
Several methods exist to structure hospitalist compensation. A hospitalist's salary may be fixed, may have a base salary with incentives, or may be derived based on clinical productivity. For example, if a hospital medicine program provides both housestaff and nonhousestaff services and employs a fixed‐salary approach, it may choose a menu‐style method to determine compensation (eg, 6 months on nonhousestaff service at x dollars/month + 3 months on housestaff service at x dollars/month = annual salary). If a hospitalist takes on a funded nonclinical role or secures extramural funding, the salary menu gets adjusted accordingly as the clinical time is bought out. Critics of the fixed‐salary approach argue that paying each hospitalist the same salary regardless of the specific job description yields an inequitable system in which some are rewarded with less clinical time.
Compensation should probably have a guaranteed base salary with incentives, which could be determined by a formula that weighs clinical productivity, quality improvement efforts, scholarly activity, and teaching excellence. This model provides financial incentives to develop both clinically and academically but introduces complexity in determining a fair incentive structure. Finally, compensation can be structured without salary guarantee and putting compensation fully at risk based on clinical productivity, although this is an unlikely strategy for any hospital medicine group. This approach does disproportionately reward high volume providers, potentially at the risk of quality and safety, but also creates significant incentives to improve efficiency.
With respect to AMC relationships, hospital medicine programs must ensure the positive return on investment that drives financial support at their institutions. This fundamental economic dynamic makes AMCs dependent on their hospital medicine groups and vice versa. We caution programs from solely relying on measures such as reduced hospital costs or length of stay as a basis of funding unless there is a reward for maintaining performance once it inevitably plateaus. Moreover, explicitly tying utilization efficiency (ie, length of stay) to salary violates Stark rules44 and carries potential malpractice implications should patient care errors be attributable to premature hospital discharge. Over time hospitalists will need to maintain clinical benchmarks but also provide additional and valued services to their institutions, including quality and safety improvement activities and compliance with residency work hour restrictions.
Defining the Academic Hospitalist
The question is simple and perhaps philosophical: Are hospitalists who work at an AMC academic hospitalists? And what job description truly defines an academic hospitalist? Currently, there are no standards for the clinical activity of an academic hospitalist position (eg, number of weeks, weekends, and hours) or for assessment of nonclinical productivity. Hospital medicine programs face the challenge of defining positions that fulfill the growing clinical mission at AMCs but have little experience or guidance in ensuring they will lead to advancing the academic mission. Specifically, how do hospitalists who provide mostly clinical care, particularly on nonhousestaff services, achieve promotion? Hospital medicine program leadership must create enough opportunity and time for the development of skills in research, education, and quality or systems improvement if academic hospitalists are to succeed.
The Association of Chiefs of General Internal Medicine (ACGIM), the Society of General Internal Medicine (SGIM), and the Society of Hospital Medicine (SHM) are currently collaborating to develop consensus guidelines in this area. Ultimately, through the efforts of these important governing bodies, the specialty of hospital medicine will be able to demonstrate the unique skills and services they provide and move toward advocating for academic promotion criteria that recognize their value and accomplishments.
FUTURE DIRECTIONS
Many lament that the milieu for academic hospitalists raises more challenges than solutions, but we believe the current era is one of excitement and opportunity. In the coming years, we will experience continued growth of nonhousestaff services, including greater comanagement with our surgical and medical specialty colleagues. These opportunities will create new relationships and increase our visibility in AMCs. However, we must remain committed to studying nonhousestaff services and determine if and how they differ from their housestaff and community counterparts, as this will be an important step toward addressing current challenges.
As hospitalists take on increasingly diverse roles,45 we must also lead initiatives to better train, recruit, and retain those interested in our specialty. Promoting our field and recruiting future faculty should occur through local hospitalist career nights, events at national meetings (targeting students, housestaff, and fellows), and other mechanisms utilized by our subspecialty colleagues. For housestaff interested in fellowship training, the growing number of hospitalist fellowships can provide skills in teaching and quality improvement.46 For trainees committed to research, we should work with existing general medicine research fellowships and partner to provide hospitalist mentorship.
Hospitalists are in a unique position to influence the delivery of clinical services, shape the future of residency training, guide quality and safety improvement initiatives, and take on leadership roles through our departments, universities, and medical centers. With the growing number of clinical services being added to our portfolio, we will need careful planning and evaluation of our efforts to build successful partnerships and develop faculty roles that balance clinical and academic pursuits to sustain long‐term and satisfying hospitalist careers.
- Accreditation Council for Graduate Medical Education. Information related to the ACGME's effort to address resident duty hours and other relevant resource materials. Available at: http://www.acgme.org/acWebsite/dutyHours/dh_index.asp Accessed May 28,2007.
- ,,,.The status of hospital medicine groups in the United States.J Hosp Med.2006;1:75–80.
- .Reflections: the hospitalist movement a decade later.J Hosp Med.2006;1:248–252.
- .Duty hours for resident physicians—tough choices for teaching hospitals.N Engl J Med.2002;347:1275–1278.
- ,.Resident work hours, hospitalist programs and academic medical centers.The Hospitalist.2005;Jan/Feb:30–33.
- .Adapting to duty‐hour limits—four years on.N Engl J Med.2007;356:2668–2670.
- ,,,,,.Effects of work hour reduction on residents' lives: a systematic review.JAMA.2005;294:1088–1100.
- ,,,,.Impact of reduced duty hours on residents' educational satisfaction at the University of California, San Francisco.Acad Med.2006;81:76–81.
- ,,, et al.Effect of Residency Duty‐Hour Limits. Views of Key Clinical Faculty.Arch Intern Med.2007;167:1487–1492.
- ,,,.Perceived impact of duty hours regulation: a survey of residents and program directors.Am J Med.2007;120:644–648.
- ,,,.The impact of duty hours on resident self reports of errors.J Gen Intern Med.2007;22:205–209.
- ,,,,.Managing discontinuity in academic medical centers: strategies for a safe and effective resident sign‐out.J Hosp Med.2006;1:257–266.
- ,.Changes in hospital mortality associated with residency work‐hour regulations.Ann Intern Med.2007;147:73–80.
- ,,,.Changes in outcomes for internal medicine inpatients after work‐hour regulations.Ann Intern Med.2007;147:97–103.
- ,,, et al.Mortality among hospitalized Medicare beneficiaries in the first 2 years following ACGME resident duty hour reform.JAMA.2007;298:975–983.
- ,,, et al.Mortality among patients in VA hospitals in the first 2 years following ACGME resident duty hour reform.JAMA.2007;298:984–991.
- .An elusive balance—residents' work hours and the continuity of care.N Engl J Med.2007;356:2665–2667.
- ,.Hippocrates affirmed? Limiting residents' work hours does no harm to patients.Ann Intern Med.2007;356:143–144.
- ,.Evaluating resident duty hour reforms.JAMA.2007;298:1055–1057.
- ,,,,.Housestaff team workload and organization effects on patient outcomes in an academic general internal medicine inpatient service.Arch Intern Med.2007;167:47–52.
- ,,,.Predicting future staffing needs at teaching hospitals: use of an analytical program with multiple variables.Arch Surg.2007;142:329–334.
- . A primer on: resident work hours. American Medical Student Association. 6th ed. 2005. Available at: http://www.amsa.org/rwh/RWHprimer_6thEdition.pdf. Accessed May 28,2007.
- ,.The hospitalist movement 5 years later.JAMA.2002;287:487–494.
- ,.The emerging role of “hospitalists” in the American health care system.N Engl J Med.1996;335:514–517.
- .The future of hospital medicine: evolution or revolution?Am J Med.2004;117:446–450.
- Society of Hospital Medicine. Media Center link: Growth of hospital medicine nationwide. Available at www.hospitalmedicine.org. Accessed May 28,2007.
- Kohn L,Corrigan JM,Donaldson MS, eds.To Err Is Human: Building a Safer Health System.Washington DC:Committee on Quality of Health Care in America, Institute of Medicine, National Academy Press;2000.
- Committee on Quality of Health Care in America, Institute of Medicine.Crossing the Quality Chasm: A New Health System for the 21st Century.Washington, DC:National Academy Press;2001.
- ,.Hospitalists in teaching hospitals: opportunities but not without danger.J Gen Intern Med.2004;19:392–393.
- .What will board certification be‐and mean‐for hospitalists?J Hosp Med.2007;2:102–104.
- .Academic medical centers under siege.N Engl J Med.1994;331:1370–1371.
- ,.Academic medicine meets managed care: a high impact collision.Acad Med.1996;71:839–845.
- .Preventing the academic medical center from becoming an oxymoron.Acad Med.1996;71:117–120.
- ,,.Why have academic medical center survived?JAMA.2005:293;1495–1500.
- ,,,.Comparison of hospitalist and nonhospitalists in inpatient length of stay adjusting for patient and physician characteristics.J Gen Intern Med.2004;19:1127–1132.
- ,,.Comparison of hospital costs and length of stay for community internists, hospitalists, and academicians.J Gen Intern Med.2007;22;662–667.
- ,.The impact of hospitalists on the cost and quality of inpatient care in the United States: a research synthesis.Med Care Res Rev.2005;62:379–406.
- ,,.Hospitalists and an innovative emergency department admissions process.J Gen Intern Med.2004;19:266–268.
- ,,,,.Comparison of resource utilization and clinical outcomes between teaching and nonteaching medical services.J Hosp Med.2007;2:150–157.
- ,,.Comparison of hospital costs and length of stay for community internists, hospitalists, and academicians.J Gen Intern Med.2007;22:662–667.
- ,,,.Preparing for “diastole”: advanced training opportunities for academic hospitalists.J Hosp Med.2006;1:368–377.
- Society of Hospital Medicine Career Satisfaction Task Force. White Paper on Hospitalist Career Satisfaction. 2006;1–45. Available at: http://www.hospitalmedicine.org. Accessed August 11,2007.
- ,,.How hospitalists spend their time: insights on efficiency and safety.J Hosp Med.2006;1:88–93.
- A Guide to Complying with Stark Self‐Referral Rules.Washington, DC:Atlantic Information Services, Inc.; 2004. Available at: http://www.aispub.com/. Accessed September 9, 2007.
- ,.The expanding role of hospitalists in the United States.Swiss Med Wkly.2006;136:591–596.
- ,,,.Hospital medicine fellowships: works in progress.Am J Med.2006;119:72e71–e77.
Time for Health Education of Hospitalized Patients
Educating patients about smoking cessation when they are hospitalized for acute coronary syndrome results in a 57% 1‐year quit rate.1 This rate is far higher than the typical 15%‐30% 1‐year quit rates observed with smoking cessation programs administered in the outpatient setting24 and suggests that hospitalized patients may be uniquely motivated to respond to health education.
Kerzman and colleagues5 found that 42% of hospitalized patients expressed a wish to receive more comprehensive counseling about their medications before being discharged from the hospital. And although the Joint Commission on Hospital Accreditation and the Centers for Medicare and Medicaid Services have established core quality measures mandating that patients hospitalized with congestive heart failure receive education as one component of a high‐quality discharge process,6, 7 approximately one third of patients nationally do not receive adequate patient education.8
Barber‐Parker9 suggested that because patient acuity in hospitals was so high and patients were so commonly absent from their nursing units for testing and treatment, there was little time available for health education during their hospitalization. Anecdotal observations in our institution suggested, however, that adult patients hospitalized on the general Internal Medicine service spent much of their day doing little more than lying in bed watching television. Accordingly, we hypothesized that considerable time might be available for patient education during a hospitalization. We therefore sought to quantify the fraction of time patients were not involved in treatment activities, diagnostic testing, or other evaluations and to determine whether during these times they wanted and were feeling well enough to participate in educational activities. We also sought to determine what patients wanted to know about their health problems and what types of educational activities they most preferred.
MATERIALS AND METHODS
We conducted a time‐motion and survey study from June 25, 2005, to August 15, 2005, at Denver Health Medical Center, an academic public safety‐net hospital affiliated with the University of Colorado School of Medicine. All patients older than 18 years of age who spoke English or Spanish and were admitted to the general Internal Medicine service were candidates for enrollment. Exclusion criteria were being admitted to the intensive care unit, having an inability to communicate, being in contact precautions, and being previously enrolled. The study was approved by the Colorado Multiple Institutional Review Board. Written informed consent was obtained for all study participants.
At 8:00 AM, all patients admitted during the previous 15 hours were assigned a random number from a random number table and were approached for consent in numeric order. With 2 data collectors working daily, a maximum of 12 patients could be enrolled each day. Consenting subjects who passed a vision test were given the Test of Functional Health Literacy in Adults at the time of enrollment and a written questionnaire (in either English or Spanish) on a daily basis for a maximum of 6 days. Some of these patients also participated in a structured interview that was designed to elicit their views on health education topics and formats for education of hospitalized patients. Others, again determined by random number, were subjects of a time‐motion study.
Demographic data collected included age, sex, language, race, comorbidities, insurance status, and discharge diagnosis.
Time‐Motion Study
Patients were observed from 8:00 AM to noon and from 1:00 to 5:00 PM7 days a week. Data were collected using TimerPro on a Dell Axim A5 pocket PC and imported daily into an Excel spreadsheet. Observations were categorized as downtime, busy time, or provider time and subcategorized as summarized in Table 1.
| First level | Second level | Third level |
|---|---|---|
| Downtime | Alone | TV |
| Resting | ||
| Sleeping | ||
| Reading | ||
| Telephone | ||
| Other | ||
| Friends/family | TV | |
| Resting | ||
| Sleeping | ||
| Reading | ||
| Telephone/talk | ||
| Other | ||
| Provider | Physician | |
| Nurse | ||
| Physician and nurse | ||
| Physician and other | ||
| Other | ||
| Busy | ADL | |
| Meal | ||
| Out of room | ||
| Other |
Questionnaire
We were unable to find a validated questionnaire in the literature that was designed to assess patient opinion or level of interest in educational activities during a hospitalization. Accordingly, we developed our own using a 5‐point Likert scale (Box 1). Two outcomes researchers with expertise in using questionnaires for clinical research independently reviewed the questionnaire to establish face validity.
Box 1. Daily Questionnaire on In‐Hospital Health Education
The following statements were read to the patients on a daily basis and answered using the following scale: 1 = Strongly Disagree, 2 = Disagree, 3 = Neutral, 4 = Agree, 5 = Strongly Agree
I feel well enough today to learn about my illness or my health.
I want to learn more about my illness or my health today.
I have time to learn about my health today.
It is important to me to learn more about my illness or health while in the hospital.
Interview
All patients were asked the open‐ended questions listed in Box 2, and the entire interview was recorded on audiotape for subsequent analysis.
Box 2. Interview Questions with Probes for Educational Preferences
What things related to your health would you like to learn more about while you are in the hospital? (list up to three topics in order of impotance to you).
How can we help you learn more about your illness or health while in the hospital?
Who should do the teaching (eg, an MD, a nurse, a dietician, a medical student, peers, physical therapists, respiratory therapists)?
Who else should be present (eg, patients with similar illness, family, no one)?
How should this teaching be done (eg, didactic sessions, hands‐on, video tape, pre‐ and post‐testing)?
Data Analysis
All analyses were performed using SAS, version 9.1 (SAS Institute, Inc., Cary, NC). A P value < 0.05 was considered significant.
Time‐Motion Data
Mixed‐effects general linear models (growth curve or repeated measures), using SAS Proc Mixed, were used to test whether the proportions of downtime, busy time, and provider time differed by day of hospitalization. Linear growth curve models were used to test whether a linear trend was present. If not, repeated‐measures models were used to obtain estimates by day of hospitalization.
Questionnaire Data
Mixed‐effects general linear models (growth curve or repeated measures) were used to determine whether patient responses differed by day of hospitalization, as described above.
Interview Data
Tape recordings were reviewed in depth to code participant responses to the structured questions. We utilized the template style of analysis, coding segments of the interviews and identifying illustrative quotes whenever possible. Key patterns and themes were summarized along with specific patient preferences regarding topics of interest and learning opportunities while in the hospital and after discharge.
RESULTS
Patient selection is described in Figure 1, and patient demographics are summarized in Tables 2 and 3.

| Demographic | Time‐motion | Interview | Questionnaire |
|---|---|---|---|
| |||
| Study subjects | 13 | 15 | 125 |
| Sex | |||
| Male | 6 (46) | 7 (47) | 61 (49) |
| Female | 7 (54) | 8 (53) | 64 (51) |
| Age (years), median (IQR) | 47 (20) | 51 (20.5) | 51 (18) |
| Race/ethnicity | |||
| White, non‐Hispanic | 6 (46) | 5 (33) | 46 (37) |
| Black/African American | 3 (23) | 4 (27) | 27 (22) |
| American Indian | 0 (0) | 0 (0) | 1 (1) |
| Hispanic | 4 (31) | 6 (40) | 51 (41) |
| Primary language | |||
| English | 12 (92) | 14 (93) | 109 (87) |
| Spanish | 1 (8) | 1 (7) | 16 (13) |
| Health literacy* | |||
| Adequate | 3 (75) | 9 (82) | 60 (71) |
| Marginal | 1 (25) | 0 (0) | 6 (7) |
| Inadequate | 0 (0) | 2 (18) | 18 (22) |
| Insurance status | |||
| Self‐pay | 3 (23) | 1 (7) | 24 (19) |
| Medicaid | 1 (8) | 4 (27) | 19 (15) |
| Medicare | 3 (23) | 0 (0) | 2 (2) |
| Colorado Indigent Care Program | 3 (23) | 7 (47) | 51 (41) |
| Private | 2 (15) | 1 (7) | 5 (4) |
| Other | 1 (8) | 2 (14) | 24 (18) |
| Time‐motion | Interview | Questionnaire | |
|---|---|---|---|
| Study subjects (n) | 13 | 15 | 125 |
| Discharge diagnoses (selected) | |||
| Coronary artery disease (including angina) | 1 (8) | 2 (13) | 24 (19) |
| Congestive heart failure | 1 (8) | 1 (7) | 4 (3) |
| Upper gastrointestinal bleeding, gastritis, reflux | 2 (15) | 4 (27) | 14 (11) |
| Syncope | 2 (15) | 0 | 5 (4) |
| Acute renal failure | 0 | 0 | 5 (4) |
| Pancreatitis | 0 | 1 (7) | 6 (5) |
| Venous thromboembolism | 2 (15) | 1 (7) | 3 (2) |
| Chronic obstructive pulmonary disease | 0 | 0 | 4 (3) |
| Diabetic ketoacidosis | 1 (8) | 1 (7) | 3 (2) |
| Pyelonephritis | 0 | 0 | 5 (4) |
| Pneumonia | 2 (15) | 1 (7) | 5 (4) |
| Comorbidities | |||
| Diabetes | 5 (38) | 9 (60) | 41 (33) |
| Hypertension | 1 (8) | 9 (60) | 55 (44) |
| Dyslipidemia | 6 (46) | 2 (13) | 26 (21) |
| Tobacco | 5 (38) | 7 (47) | 55 (44) |
| Chronic obstructive pulmonary disease | 2 (15) | 4 (27) | 15 (12) |
| Congestive heart failure | 2 (15) | 2 (13) | 13 (10) |
| Coronary heart disease | 3 (23) | 3 (20) | 21 (17) |
Time‐Motion Study
Thirteen patients were studied. Of the 315 patient‐hours observed, 71% were categorized as downtime, 15% as provider time, and 14% as busy time. The proportion of downtime ranged from a low of 0.65 (SE 0.04) on hospital Day 2 to a high of 0.76 (SE 0.06) on hospital Day 4, but the differences in downtime proportions by day did not reach statistical significance (P = .65; Fig. 2). The lowest percentage of downtime observed in any patient on any day was 39%. The 125 hours of downtime observed consisted of 1317 separate blocks of time, 80% of which were less than 15 minutes in duration, 14% of which were 15 to 30 minutes in duration, and 6% of which exceeded 30 minutes in duration.
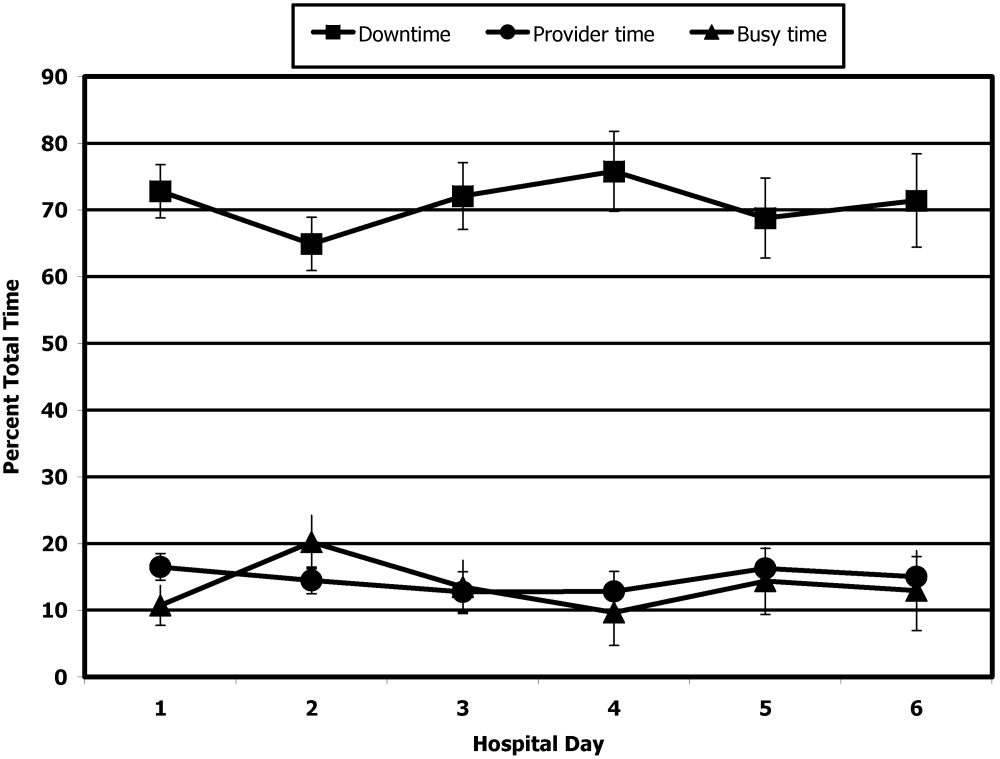
Thirty‐six full days of observation, defined as greater than 7 hours of observation in 1 day, were used to assess the amount of time spent with providers. Of the 60 minutes/day (IQR = 44) that patients spent with health care providers, 21 minutes/day (IQR = 34) was spent with phlebotomists, physical or occupational therapists, dieticians, or social workers, 25 minutes/day (IQR = 25) was spent with patients' nurses, and a median of only 9 minutes/day (IQR = 11) was spent with their physicians.
Questionnaire
A total of 311 questionnaires were administered to the 138 consenting participants. Irrespective of the day of testing, 79% to 97% strongly agreed or agreed with the 4 statements (Fig. 3). In response to the first statementI feel well enough to learnpatient scores increased steadily over the 6 days of hospitalization patients were surveyed (coefficient = 0.15, P = .004). On hospital day 1, the mean score was 3.85 (SE 0.08), and by day 6 the mean score had increased to 4.75 (SE 0.08) However, there was no significant change over time in patients' desire to learn, self‐perceived time available to learn, or importance placed on learning during their hospital stay.

Interview
Fifteen interviews were conducted. Representative comments are presented in Table 4. Responses generally indicated that the patients had anxieties and uncertainties about their health and safety after discharge. Most participants wanted to know more about the condition for which they had been hospitalized, including information pertaining to management, prevention, etiology, and prognosis of their disease. Diabetic patients asked for information on insulin dosing, nutrition, and the effect of the disease on their bodies.
| Theme | Sample quotes |
|---|---|
| Preferred topics | |
| Self‐management | I need to know what to do when I go home, how to take care of it. Medical peopledon't give enough information to the patient and patient's family so they can help themselves. You need to encourage patients to help themselves, take some responsibility for themselves. |
| Prevention of disease recurrence or progression | It's okay to tell people that they have something and give them medicine, but also tell them what they can do to prevent it or make it less painful. I've known about bronchitis for many years, but didn't know it would affect my heart. |
| What's happening to me? | Am I going to diehow long? |
| Just fix me | I came to the hospital to get fixed, not educated. I'm results‐oriented, not cause‐oriented. |
| Preferred learning methods | |
| One‐to‐one didactics with MDs | I'd like one‐to‐one time with someone who has the time to listen. One to one with doctors who can explain what can happen, what to take, what not to take. |
| Family involvement | Get the family involved so the family understands the limitations of the person, how medications affect them. To say a person has a heart condition is a very vague statement. If they [family] understand more, it's better. |
| Groups | A group of people with similar illnessI like groups where everyone listens. I'd participate in groups at the hospital but not at home. |
| Video | Hospital TV is not meeting my needs. |
| Printed material | A doctor or nurse tell me what's going on and then also handouts on dietary and nutrition. |
| Electronic learning | I learned a lot through the encyclopedia of family health care, and through Web sites |
Patients preferred to pick their own topics for education rather than having topics chosen for them. Patients also showed in interest in prevention. One diabetic patient wanted to know how to prevent her children from becoming diabetic, and a cardiac patient wanted education on heart disease prevention. Other recurrent themes included the desire to know what was causing their illness and information about prognosis.
Almost all the patients were interested in more than one type of learning experience. The most frequently cited preference was to have a doctor or other knowledgeable health care professional answer questions specific to their individual situation. Video and group learning were each mentioned by approximately half the participants. Most patients thought that having family present during educational discussions was important.
Video was the most frequently mentioned learning tool, and patients thought it would be useful to have this modality available in the hospital as well as the home. Two patients expressed interest in computerized learning (one of whom had used health Web sites before his hospitalization). Most patients wanted handouts or reading material in addition to other methods of communicating information. Although many patients said they felt comfortable discussing their problems in group settings, some did not.
DISCUSSION
The important findings of this study are that hospitalized patients have a substantial amount of time available for health education and a considerable willingness and interest in participating in health educational activities. We found that although there was a great deal of time available on all days of hospitalization studied, patients felt increasingly well enough to participate in educational activities through their hospital stay.
We are unaware of other studies that have attempted to quantify the amount of time hospitalized patients are available for educational activities or whether they feel capable of participating in these activities. McBride10 found that 95% of hospitalized patients supported a health‐promoting hospital and that almost 80% wanted to modify at least 1 aspect of their lifestyle. Martin and colleagues11 found that patient satisfaction was improved by a patient‐centered unit incorporating dedicated nursing staff to promote patient involvement and provide personalized care and education. Barber‐Parker9 suggested that high patient acuity, short durations of hospitalization, and lack of patient availability because of testing and treatment limited the opportunities that patients had for health education during their hospitalization. These conclusions were reached on the basis of surveys of nurses' perceptions, however, rather than on direct observations or assessments of patients' perceptions.
Our findings suggest that many types of patient educational approaches may be needed to achieve maximal effectiveness and that regardless of the specific approach employed, the focus should be on the primary reason for a patient's hospitalization, what the hospitalization meant, why it happened and what the patient can do to prevent hospitalization from occurring in the future.
Transitions in care have been identified as periods in which communication lapses occur and outcomes can be adversely affected.12 A recent study by Epstein and colleagues13 found that almost 12% of patients had new or worsening symptoms of disease within the first few days after discharge from the hospital and that 22% either did not pick up their medications or understand how to take them (consistent with the observations of Kerzman and colleagues).5 The most common action taken in response to these findings was nurse‐mediated patient education. Our study indicates there is potential for further educational processes in hospitals, which may improve the safety of transitions from a hospital setting to outpatient care.
Although many disease management programs have been studied in the outpatient setting,1417 very few have been extended into hospitals. Accordingly, hospitalists are ideally suited to develop and implement disease management programs in concert with outpatient efforts.18 Our study suggests there is an underutilized opportunity for hospital‐based physicians and other health care providers to work with patients at a time when they are uniquely focused on their own health and free from many of the time constraints of their normal lives.
Although JCAHO mandates that hospitalized patients receive education and training specific to the patient's needs and as appropriate to the care, treatment and services provided,19 there is a paucity of data describing the educational processes in US hospitals. Johansson and colleagues20 conducted a survey in a Finnish hospital where patient education is also mandated. Written materials were given to about 55% of the patients. Demonstration and practice were used with about one third, whereas the Internet and videotapes were used for fewer than 10%. Although patients underwent educational activities throughout their hospitalization, and most were satisfied with the process, Johansson and colleagues found that only 59% felt that what they knew about their care was sufficient, almost a third felt they did not know enough about the side effects of their medical care, and almost half felt they did not have sufficient input into what they were being taught.
Although we found a large amount of time that might be used for patient education during a hospitalization, this time was commonly limited to 15‐minute blocks, as has been noted previously.9 This observation implies that educational activities should be designed so they can be conducted over short periods and/or stopped for short periods when interruptions occur or that the processes of care during a hospitalization should be altered to create larger blocks of continuous time available for educational activities.
A number of issues could have biased our results. Only 66% of the patients who were approached to participate agreed to do so. Because those declining may have been sicker and because sicker patients may require more diagnostic testing or more invasive treatment, we may have overestimated both the amount of downtime available and the willingness of patients to participate in educational activities. If we assume, however, that all patients who refused to participate either disagreed or strongly disagreed with the statements in the questionnaire regarding their interest in educational activities, the fraction of patients agreeing or strongly agreeing with idea that they were well enough and interested would still be 57% to 75% of the population sampled. Accordingly, this potential bias, if it occurred, would not alter our conclusions.
The time‐motion studies were only performed between 8:00 AM and 5:00 PM, such that the resulting data do not reflect any diagnostic testing, therapeutic interventions, or contact with health care providers that occurred at other times. This may have contributed to the strikingly small amount of time that patients spent with their physicians and nurses. If patient time after 5:00 PM and before 8:00 AM had been observed and included, it is likely that the absolute amount of time spent with physicians and nurses would increase, whereas the overall proportion of patient time spent with providers would decrease.
We were also only able to collect data on 13 time‐motion subjects. This limited sample size from a single institution may not be representative of all hospitalized non‐ICU patients on general medical wards. Accordingly, we make no claims that our data can be generalized to the entire population of patients admitted to non‐ICU medical services. However, the results of our surveys, which sampled a much broader patient population and supported our time‐motion findings, suggest that our time‐motion findings are likely to be representative of significant underutilized time and motivation for patient education in the hospital setting.
Also, it is important to note that although the time‐motion studies were only done with 13 patients, these studies are extremely labor intensive and are rarely done with much larger samples. In addition, the SDs on the data collected from the time‐motion studies were quite small. It is possible that if a larger sample were studied, the percentage of free time might be larger or smaller than what we observed for the 13 patients we studied. However, it would be quite unlikely that the amount of free time would be so small (eg, 10%‐15%) that it would invalidate our conclusion that considerable time is available for patient education over and above what currently occurs in most hospital settings.
A patient's self‐perception of his or her ability to learn may not reflect that patient's true cognitive readiness to do so. JCAHO requirements mandate that nurses be trained to assess patients for their ability to learn and to do so as part of the admission process. After reviewing all day 1 patient responses to our questionnaires, in no instance did a nurse assess a patient as having a barrier to learning when the patient had reported feeling well enough to learn. Accordingly, although we performed no direct tests of patients' ability to learn, this retrospective independent assessment did not suggest that patients systematically overestimated their ability to learn.
Finding that hospitalized patients are unoccupied for approximately 70% of their daytime hours and that most patients are both highly motivated to learn and have few barriers to doing so indicates that educational activities during hospitalizations have substantial potential for expansion. The current structure for educating hospitalized patients should be supplemented to take these findings into account.
Acknowledgements
We thank Dr. John Steiner and Dr. Sheena Bull for their assistance in study design as well as the development of the questionnaire and interview tools. We also thank Carolyn Nowels for her assistance with the qualitative data analysis. The assistance of Dr. Bull and Dr. Steiner was made possible through NHLBI grant U01HL079160, and funding for data collection was made possible by the University of Colorado at Denver and Health Sciences Center Department of Medicine, Division of General Internal Medicine small grants program.
- ,.Randomized controlled trial of smoking cessation intervention after admission for coronary heart disease.BMJ.2003;327:1254–1257.
- .Treatment of tobacco use and dependence.N Engl J Med.2002;346:506–512.
- ,, et al.A clinical practice guideline for treating tobacco use and dependence: a US Public Health Service report.JAMA.2000;283:3244–3254.
- ,,, et al.National Institutes of Health state‐of‐the science conference statement: tobacco use: prevention, cessation and control.Ann Intern Med.2006;145:839–844.
- ,,.What do discharged patients know about their medications?Patient Educ Couns.2005;56:276–282.
- Joint Commission on Accreditation of Healthcare Organizations.A Comprehensive Review for the Development and Testing for National Implementation of Hospital Core Measures.2006:1–40.
- .ACC/AHA 2005 guideline update for the diagnosis and management of chronic heart failure in the adult: a report of the American College of Cardiology/ American Heart Association task force on practice guidelines.J Am Coll Cardiol.2005;46:1–82.
- JCAHO data. Available: https://cimprod.uhc.edu/CoreMeasures/Products/DownloadSystem/WebPages/ViewReportsDownloadList.aspx.
- .Integrating patient teaching into bedside patient care: a participant‐observation study of hospital nurses.Patient Educ Couns.2002;48:107–113.
- .Health promotion in the acute hospital setting: the receptivity of adult in‐patients.Patient Educ Couns.2004;54:73–78.
- ,,,,,.Randomized trial of a patient‐centered hospital unit.Patient Educ Couns.1998;34:125–133.
- ,,,,,.Deficits in communication and information transfer between hospital‐based and primary care physicians: implications for patient safety and continuity of care. HYPERLINK “javascript:AL_get(this,%20'jour',%20'JAMA.');”JAMA.2007;297:831–841.
- ,,,,.Frequency of new or worsening symptoms in the posthospitalization period.J Hosp Med.2007;2:58–68.
- ,,,.Patient self‐management of chronic disease in primary care.JAMA.2002;288:2469–2475.
- ,,.Effectiveness of self‐management training in type 2 diabetes.Diabetes Care.2001;24:561–587.
- ,,.Quality of life assessment after patient education a randomized controlled study on asthma and chronic obstructive pulmonary disease.Am J Respir Crit Care Med.2001;95:56–63.
- ,.The effects of a health educational and exercise program for older adults with osteoarthritis for the hip or knee.J Rheumatol.1997;24:1378–1383.
- ,,,.Expanding the roles of hospitalist physicians to include public health.J Hosp Med.2007;2:93–101.
- The Joint Commission on Accreditation of Healthcare Organizations Comprehensive Accreditation Manual for Hospitals: The Official Handbook. January2007. p.152
- ,,,.Need for change in patient education: a Finnish survey from the patient's perspective.Patient Educ Couns.2003;51:239–245.
Educating patients about smoking cessation when they are hospitalized for acute coronary syndrome results in a 57% 1‐year quit rate.1 This rate is far higher than the typical 15%‐30% 1‐year quit rates observed with smoking cessation programs administered in the outpatient setting24 and suggests that hospitalized patients may be uniquely motivated to respond to health education.
Kerzman and colleagues5 found that 42% of hospitalized patients expressed a wish to receive more comprehensive counseling about their medications before being discharged from the hospital. And although the Joint Commission on Hospital Accreditation and the Centers for Medicare and Medicaid Services have established core quality measures mandating that patients hospitalized with congestive heart failure receive education as one component of a high‐quality discharge process,6, 7 approximately one third of patients nationally do not receive adequate patient education.8
Barber‐Parker9 suggested that because patient acuity in hospitals was so high and patients were so commonly absent from their nursing units for testing and treatment, there was little time available for health education during their hospitalization. Anecdotal observations in our institution suggested, however, that adult patients hospitalized on the general Internal Medicine service spent much of their day doing little more than lying in bed watching television. Accordingly, we hypothesized that considerable time might be available for patient education during a hospitalization. We therefore sought to quantify the fraction of time patients were not involved in treatment activities, diagnostic testing, or other evaluations and to determine whether during these times they wanted and were feeling well enough to participate in educational activities. We also sought to determine what patients wanted to know about their health problems and what types of educational activities they most preferred.
MATERIALS AND METHODS
We conducted a time‐motion and survey study from June 25, 2005, to August 15, 2005, at Denver Health Medical Center, an academic public safety‐net hospital affiliated with the University of Colorado School of Medicine. All patients older than 18 years of age who spoke English or Spanish and were admitted to the general Internal Medicine service were candidates for enrollment. Exclusion criteria were being admitted to the intensive care unit, having an inability to communicate, being in contact precautions, and being previously enrolled. The study was approved by the Colorado Multiple Institutional Review Board. Written informed consent was obtained for all study participants.
At 8:00 AM, all patients admitted during the previous 15 hours were assigned a random number from a random number table and were approached for consent in numeric order. With 2 data collectors working daily, a maximum of 12 patients could be enrolled each day. Consenting subjects who passed a vision test were given the Test of Functional Health Literacy in Adults at the time of enrollment and a written questionnaire (in either English or Spanish) on a daily basis for a maximum of 6 days. Some of these patients also participated in a structured interview that was designed to elicit their views on health education topics and formats for education of hospitalized patients. Others, again determined by random number, were subjects of a time‐motion study.
Demographic data collected included age, sex, language, race, comorbidities, insurance status, and discharge diagnosis.
Time‐Motion Study
Patients were observed from 8:00 AM to noon and from 1:00 to 5:00 PM7 days a week. Data were collected using TimerPro on a Dell Axim A5 pocket PC and imported daily into an Excel spreadsheet. Observations were categorized as downtime, busy time, or provider time and subcategorized as summarized in Table 1.
| First level | Second level | Third level |
|---|---|---|
| Downtime | Alone | TV |
| Resting | ||
| Sleeping | ||
| Reading | ||
| Telephone | ||
| Other | ||
| Friends/family | TV | |
| Resting | ||
| Sleeping | ||
| Reading | ||
| Telephone/talk | ||
| Other | ||
| Provider | Physician | |
| Nurse | ||
| Physician and nurse | ||
| Physician and other | ||
| Other | ||
| Busy | ADL | |
| Meal | ||
| Out of room | ||
| Other |
Questionnaire
We were unable to find a validated questionnaire in the literature that was designed to assess patient opinion or level of interest in educational activities during a hospitalization. Accordingly, we developed our own using a 5‐point Likert scale (Box 1). Two outcomes researchers with expertise in using questionnaires for clinical research independently reviewed the questionnaire to establish face validity.
Box 1. Daily Questionnaire on In‐Hospital Health Education
The following statements were read to the patients on a daily basis and answered using the following scale: 1 = Strongly Disagree, 2 = Disagree, 3 = Neutral, 4 = Agree, 5 = Strongly Agree
I feel well enough today to learn about my illness or my health.
I want to learn more about my illness or my health today.
I have time to learn about my health today.
It is important to me to learn more about my illness or health while in the hospital.
Interview
All patients were asked the open‐ended questions listed in Box 2, and the entire interview was recorded on audiotape for subsequent analysis.
Box 2. Interview Questions with Probes for Educational Preferences
What things related to your health would you like to learn more about while you are in the hospital? (list up to three topics in order of impotance to you).
How can we help you learn more about your illness or health while in the hospital?
Who should do the teaching (eg, an MD, a nurse, a dietician, a medical student, peers, physical therapists, respiratory therapists)?
Who else should be present (eg, patients with similar illness, family, no one)?
How should this teaching be done (eg, didactic sessions, hands‐on, video tape, pre‐ and post‐testing)?
Data Analysis
All analyses were performed using SAS, version 9.1 (SAS Institute, Inc., Cary, NC). A P value < 0.05 was considered significant.
Time‐Motion Data
Mixed‐effects general linear models (growth curve or repeated measures), using SAS Proc Mixed, were used to test whether the proportions of downtime, busy time, and provider time differed by day of hospitalization. Linear growth curve models were used to test whether a linear trend was present. If not, repeated‐measures models were used to obtain estimates by day of hospitalization.
Questionnaire Data
Mixed‐effects general linear models (growth curve or repeated measures) were used to determine whether patient responses differed by day of hospitalization, as described above.
Interview Data
Tape recordings were reviewed in depth to code participant responses to the structured questions. We utilized the template style of analysis, coding segments of the interviews and identifying illustrative quotes whenever possible. Key patterns and themes were summarized along with specific patient preferences regarding topics of interest and learning opportunities while in the hospital and after discharge.
RESULTS
Patient selection is described in Figure 1, and patient demographics are summarized in Tables 2 and 3.
| Demographic | Time‐motion | Interview | Questionnaire |
|---|---|---|---|
| |||
| Study subjects | 13 | 15 | 125 |
| Sex | |||
| Male | 6 (46) | 7 (47) | 61 (49) |
| Female | 7 (54) | 8 (53) | 64 (51) |
| Age (years), median (IQR) | 47 (20) | 51 (20.5) | 51 (18) |
| Race/ethnicity | |||
| White, non‐Hispanic | 6 (46) | 5 (33) | 46 (37) |
| Black/African American | 3 (23) | 4 (27) | 27 (22) |
| American Indian | 0 (0) | 0 (0) | 1 (1) |
| Hispanic | 4 (31) | 6 (40) | 51 (41) |
| Primary language | |||
| English | 12 (92) | 14 (93) | 109 (87) |
| Spanish | 1 (8) | 1 (7) | 16 (13) |
| Health literacy* | |||
| Adequate | 3 (75) | 9 (82) | 60 (71) |
| Marginal | 1 (25) | 0 (0) | 6 (7) |
| Inadequate | 0 (0) | 2 (18) | 18 (22) |
| Insurance status | |||
| Self‐pay | 3 (23) | 1 (7) | 24 (19) |
| Medicaid | 1 (8) | 4 (27) | 19 (15) |
| Medicare | 3 (23) | 0 (0) | 2 (2) |
| Colorado Indigent Care Program | 3 (23) | 7 (47) | 51 (41) |
| Private | 2 (15) | 1 (7) | 5 (4) |
| Other | 1 (8) | 2 (14) | 24 (18) |
| Time‐motion | Interview | Questionnaire | |
|---|---|---|---|
| Study subjects (n) | 13 | 15 | 125 |
| Discharge diagnoses (selected) | |||
| Coronary artery disease (including angina) | 1 (8) | 2 (13) | 24 (19) |
| Congestive heart failure | 1 (8) | 1 (7) | 4 (3) |
| Upper gastrointestinal bleeding, gastritis, reflux | 2 (15) | 4 (27) | 14 (11) |
| Syncope | 2 (15) | 0 | 5 (4) |
| Acute renal failure | 0 | 0 | 5 (4) |
| Pancreatitis | 0 | 1 (7) | 6 (5) |
| Venous thromboembolism | 2 (15) | 1 (7) | 3 (2) |
| Chronic obstructive pulmonary disease | 0 | 0 | 4 (3) |
| Diabetic ketoacidosis | 1 (8) | 1 (7) | 3 (2) |
| Pyelonephritis | 0 | 0 | 5 (4) |
| Pneumonia | 2 (15) | 1 (7) | 5 (4) |
| Comorbidities | |||
| Diabetes | 5 (38) | 9 (60) | 41 (33) |
| Hypertension | 1 (8) | 9 (60) | 55 (44) |
| Dyslipidemia | 6 (46) | 2 (13) | 26 (21) |
| Tobacco | 5 (38) | 7 (47) | 55 (44) |
| Chronic obstructive pulmonary disease | 2 (15) | 4 (27) | 15 (12) |
| Congestive heart failure | 2 (15) | 2 (13) | 13 (10) |
| Coronary heart disease | 3 (23) | 3 (20) | 21 (17) |
Time‐Motion Study
Thirteen patients were studied. Of the 315 patient‐hours observed, 71% were categorized as downtime, 15% as provider time, and 14% as busy time. The proportion of downtime ranged from a low of 0.65 (SE 0.04) on hospital Day 2 to a high of 0.76 (SE 0.06) on hospital Day 4, but the differences in downtime proportions by day did not reach statistical significance (P = .65; Fig. 2). The lowest percentage of downtime observed in any patient on any day was 39%. The 125 hours of downtime observed consisted of 1317 separate blocks of time, 80% of which were less than 15 minutes in duration, 14% of which were 15 to 30 minutes in duration, and 6% of which exceeded 30 minutes in duration.
Thirty‐six full days of observation, defined as greater than 7 hours of observation in 1 day, were used to assess the amount of time spent with providers. Of the 60 minutes/day (IQR = 44) that patients spent with health care providers, 21 minutes/day (IQR = 34) was spent with phlebotomists, physical or occupational therapists, dieticians, or social workers, 25 minutes/day (IQR = 25) was spent with patients' nurses, and a median of only 9 minutes/day (IQR = 11) was spent with their physicians.
Questionnaire
A total of 311 questionnaires were administered to the 138 consenting participants. Irrespective of the day of testing, 79% to 97% strongly agreed or agreed with the 4 statements (Fig. 3). In response to the first statementI feel well enough to learnpatient scores increased steadily over the 6 days of hospitalization patients were surveyed (coefficient = 0.15, P = .004). On hospital day 1, the mean score was 3.85 (SE 0.08), and by day 6 the mean score had increased to 4.75 (SE 0.08) However, there was no significant change over time in patients' desire to learn, self‐perceived time available to learn, or importance placed on learning during their hospital stay.
Interview
Fifteen interviews were conducted. Representative comments are presented in Table 4. Responses generally indicated that the patients had anxieties and uncertainties about their health and safety after discharge. Most participants wanted to know more about the condition for which they had been hospitalized, including information pertaining to management, prevention, etiology, and prognosis of their disease. Diabetic patients asked for information on insulin dosing, nutrition, and the effect of the disease on their bodies.
| Theme | Sample quotes |
|---|---|
| Preferred topics | |
| Self‐management | I need to know what to do when I go home, how to take care of it. Medical peopledon't give enough information to the patient and patient's family so they can help themselves. You need to encourage patients to help themselves, take some responsibility for themselves. |
| Prevention of disease recurrence or progression | It's okay to tell people that they have something and give them medicine, but also tell them what they can do to prevent it or make it less painful. I've known about bronchitis for many years, but didn't know it would affect my heart. |
| What's happening to me? | Am I going to diehow long? |
| Just fix me | I came to the hospital to get fixed, not educated. I'm results‐oriented, not cause‐oriented. |
| Preferred learning methods | |
| One‐to‐one didactics with MDs | I'd like one‐to‐one time with someone who has the time to listen. One to one with doctors who can explain what can happen, what to take, what not to take. |
| Family involvement | Get the family involved so the family understands the limitations of the person, how medications affect them. To say a person has a heart condition is a very vague statement. If they [family] understand more, it's better. |
| Groups | A group of people with similar illnessI like groups where everyone listens. I'd participate in groups at the hospital but not at home. |
| Video | Hospital TV is not meeting my needs. |
| Printed material | A doctor or nurse tell me what's going on and then also handouts on dietary and nutrition. |
| Electronic learning | I learned a lot through the encyclopedia of family health care, and through Web sites |
Patients preferred to pick their own topics for education rather than having topics chosen for them. Patients also showed in interest in prevention. One diabetic patient wanted to know how to prevent her children from becoming diabetic, and a cardiac patient wanted education on heart disease prevention. Other recurrent themes included the desire to know what was causing their illness and information about prognosis.
Almost all the patients were interested in more than one type of learning experience. The most frequently cited preference was to have a doctor or other knowledgeable health care professional answer questions specific to their individual situation. Video and group learning were each mentioned by approximately half the participants. Most patients thought that having family present during educational discussions was important.
Video was the most frequently mentioned learning tool, and patients thought it would be useful to have this modality available in the hospital as well as the home. Two patients expressed interest in computerized learning (one of whom had used health Web sites before his hospitalization). Most patients wanted handouts or reading material in addition to other methods of communicating information. Although many patients said they felt comfortable discussing their problems in group settings, some did not.
DISCUSSION
The important findings of this study are that hospitalized patients have a substantial amount of time available for health education and a considerable willingness and interest in participating in health educational activities. We found that although there was a great deal of time available on all days of hospitalization studied, patients felt increasingly well enough to participate in educational activities through their hospital stay.
We are unaware of other studies that have attempted to quantify the amount of time hospitalized patients are available for educational activities or whether they feel capable of participating in these activities. McBride10 found that 95% of hospitalized patients supported a health‐promoting hospital and that almost 80% wanted to modify at least 1 aspect of their lifestyle. Martin and colleagues11 found that patient satisfaction was improved by a patient‐centered unit incorporating dedicated nursing staff to promote patient involvement and provide personalized care and education. Barber‐Parker9 suggested that high patient acuity, short durations of hospitalization, and lack of patient availability because of testing and treatment limited the opportunities that patients had for health education during their hospitalization. These conclusions were reached on the basis of surveys of nurses' perceptions, however, rather than on direct observations or assessments of patients' perceptions.
Our findings suggest that many types of patient educational approaches may be needed to achieve maximal effectiveness and that regardless of the specific approach employed, the focus should be on the primary reason for a patient's hospitalization, what the hospitalization meant, why it happened and what the patient can do to prevent hospitalization from occurring in the future.
Transitions in care have been identified as periods in which communication lapses occur and outcomes can be adversely affected.12 A recent study by Epstein and colleagues13 found that almost 12% of patients had new or worsening symptoms of disease within the first few days after discharge from the hospital and that 22% either did not pick up their medications or understand how to take them (consistent with the observations of Kerzman and colleagues).5 The most common action taken in response to these findings was nurse‐mediated patient education. Our study indicates there is potential for further educational processes in hospitals, which may improve the safety of transitions from a hospital setting to outpatient care.
Although many disease management programs have been studied in the outpatient setting,1417 very few have been extended into hospitals. Accordingly, hospitalists are ideally suited to develop and implement disease management programs in concert with outpatient efforts.18 Our study suggests there is an underutilized opportunity for hospital‐based physicians and other health care providers to work with patients at a time when they are uniquely focused on their own health and free from many of the time constraints of their normal lives.
Although JCAHO mandates that hospitalized patients receive education and training specific to the patient's needs and as appropriate to the care, treatment and services provided,19 there is a paucity of data describing the educational processes in US hospitals. Johansson and colleagues20 conducted a survey in a Finnish hospital where patient education is also mandated. Written materials were given to about 55% of the patients. Demonstration and practice were used with about one third, whereas the Internet and videotapes were used for fewer than 10%. Although patients underwent educational activities throughout their hospitalization, and most were satisfied with the process, Johansson and colleagues found that only 59% felt that what they knew about their care was sufficient, almost a third felt they did not know enough about the side effects of their medical care, and almost half felt they did not have sufficient input into what they were being taught.
Although we found a large amount of time that might be used for patient education during a hospitalization, this time was commonly limited to 15‐minute blocks, as has been noted previously.9 This observation implies that educational activities should be designed so they can be conducted over short periods and/or stopped for short periods when interruptions occur or that the processes of care during a hospitalization should be altered to create larger blocks of continuous time available for educational activities.
A number of issues could have biased our results. Only 66% of the patients who were approached to participate agreed to do so. Because those declining may have been sicker and because sicker patients may require more diagnostic testing or more invasive treatment, we may have overestimated both the amount of downtime available and the willingness of patients to participate in educational activities. If we assume, however, that all patients who refused to participate either disagreed or strongly disagreed with the statements in the questionnaire regarding their interest in educational activities, the fraction of patients agreeing or strongly agreeing with idea that they were well enough and interested would still be 57% to 75% of the population sampled. Accordingly, this potential bias, if it occurred, would not alter our conclusions.
The time‐motion studies were only performed between 8:00 AM and 5:00 PM, such that the resulting data do not reflect any diagnostic testing, therapeutic interventions, or contact with health care providers that occurred at other times. This may have contributed to the strikingly small amount of time that patients spent with their physicians and nurses. If patient time after 5:00 PM and before 8:00 AM had been observed and included, it is likely that the absolute amount of time spent with physicians and nurses would increase, whereas the overall proportion of patient time spent with providers would decrease.
We were also only able to collect data on 13 time‐motion subjects. This limited sample size from a single institution may not be representative of all hospitalized non‐ICU patients on general medical wards. Accordingly, we make no claims that our data can be generalized to the entire population of patients admitted to non‐ICU medical services. However, the results of our surveys, which sampled a much broader patient population and supported our time‐motion findings, suggest that our time‐motion findings are likely to be representative of significant underutilized time and motivation for patient education in the hospital setting.
Also, it is important to note that although the time‐motion studies were only done with 13 patients, these studies are extremely labor intensive and are rarely done with much larger samples. In addition, the SDs on the data collected from the time‐motion studies were quite small. It is possible that if a larger sample were studied, the percentage of free time might be larger or smaller than what we observed for the 13 patients we studied. However, it would be quite unlikely that the amount of free time would be so small (eg, 10%‐15%) that it would invalidate our conclusion that considerable time is available for patient education over and above what currently occurs in most hospital settings.
A patient's self‐perception of his or her ability to learn may not reflect that patient's true cognitive readiness to do so. JCAHO requirements mandate that nurses be trained to assess patients for their ability to learn and to do so as part of the admission process. After reviewing all day 1 patient responses to our questionnaires, in no instance did a nurse assess a patient as having a barrier to learning when the patient had reported feeling well enough to learn. Accordingly, although we performed no direct tests of patients' ability to learn, this retrospective independent assessment did not suggest that patients systematically overestimated their ability to learn.
Finding that hospitalized patients are unoccupied for approximately 70% of their daytime hours and that most patients are both highly motivated to learn and have few barriers to doing so indicates that educational activities during hospitalizations have substantial potential for expansion. The current structure for educating hospitalized patients should be supplemented to take these findings into account.
Acknowledgements
We thank Dr. John Steiner and Dr. Sheena Bull for their assistance in study design as well as the development of the questionnaire and interview tools. We also thank Carolyn Nowels for her assistance with the qualitative data analysis. The assistance of Dr. Bull and Dr. Steiner was made possible through NHLBI grant U01HL079160, and funding for data collection was made possible by the University of Colorado at Denver and Health Sciences Center Department of Medicine, Division of General Internal Medicine small grants program.
- ,.Randomized controlled trial of smoking cessation intervention after admission for coronary heart disease.BMJ.2003;327:1254–1257.
- .Treatment of tobacco use and dependence.N Engl J Med.2002;346:506–512.
- ,, et al.A clinical practice guideline for treating tobacco use and dependence: a US Public Health Service report.JAMA.2000;283:3244–3254.
- ,,, et al.National Institutes of Health state‐of‐the science conference statement: tobacco use: prevention, cessation and control.Ann Intern Med.2006;145:839–844.
- ,,.What do discharged patients know about their medications?Patient Educ Couns.2005;56:276–282.
- Joint Commission on Accreditation of Healthcare Organizations.A Comprehensive Review for the Development and Testing for National Implementation of Hospital Core Measures.2006:1–40.
- .ACC/AHA 2005 guideline update for the diagnosis and management of chronic heart failure in the adult: a report of the American College of Cardiology/ American Heart Association task force on practice guidelines.J Am Coll Cardiol.2005;46:1–82.
- JCAHO data. Available: https://cimprod.uhc.edu/CoreMeasures/Products/DownloadSystem/WebPages/ViewReportsDownloadList.aspx.
- .Integrating patient teaching into bedside patient care: a participant‐observation study of hospital nurses.Patient Educ Couns.2002;48:107–113.
- .Health promotion in the acute hospital setting: the receptivity of adult in‐patients.Patient Educ Couns.2004;54:73–78.
- ,,,,,.Randomized trial of a patient‐centered hospital unit.Patient Educ Couns.1998;34:125–133.
- ,,,,,.Deficits in communication and information transfer between hospital‐based and primary care physicians: implications for patient safety and continuity of care. HYPERLINK “javascript:AL_get(this,%20'jour',%20'JAMA.');”JAMA.2007;297:831–841.
- ,,,,.Frequency of new or worsening symptoms in the posthospitalization period.J Hosp Med.2007;2:58–68.
- ,,,.Patient self‐management of chronic disease in primary care.JAMA.2002;288:2469–2475.
- ,,.Effectiveness of self‐management training in type 2 diabetes.Diabetes Care.2001;24:561–587.
- ,,.Quality of life assessment after patient education a randomized controlled study on asthma and chronic obstructive pulmonary disease.Am J Respir Crit Care Med.2001;95:56–63.
- ,.The effects of a health educational and exercise program for older adults with osteoarthritis for the hip or knee.J Rheumatol.1997;24:1378–1383.
- ,,,.Expanding the roles of hospitalist physicians to include public health.J Hosp Med.2007;2:93–101.
- The Joint Commission on Accreditation of Healthcare Organizations Comprehensive Accreditation Manual for Hospitals: The Official Handbook. January2007. p.152
- ,,,.Need for change in patient education: a Finnish survey from the patient's perspective.Patient Educ Couns.2003;51:239–245.
Copyright © 2008 Society of Hospital Medicine
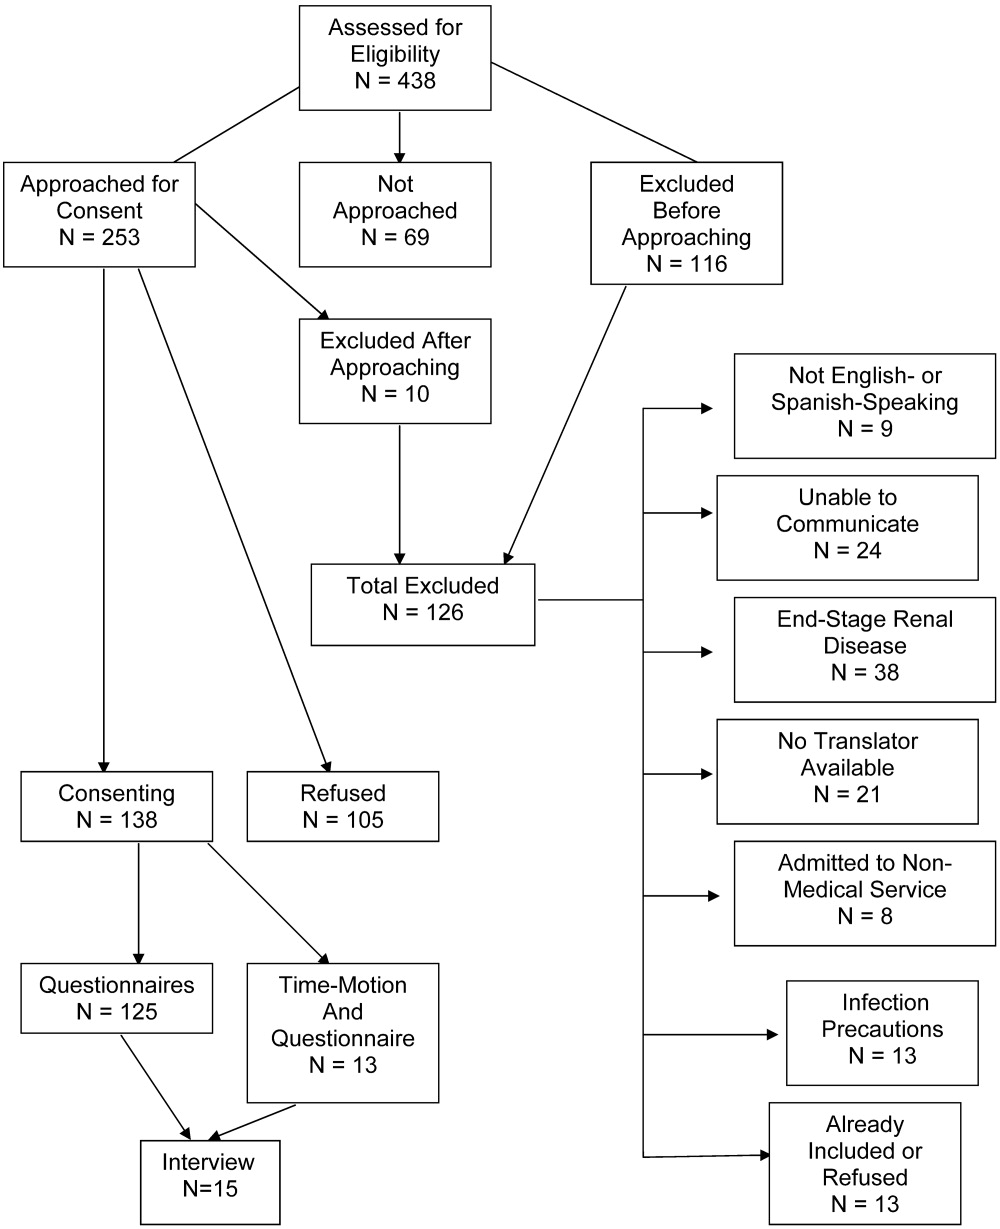
Esophageal Perforation, Complication of EGD
Esophagogastroduodenoscopy (EGD) carries a small but serious risk of esophageal perforation.13 With its potential for sepsis and fatal mediastinitis, prompt recognition and treatment are essential for favorable outcomes. The risk of perforation with diagnostic flexible EGD is 0.03%, which is an improvement from the 0.1%0.4% risk associated with rigid endoscopy.4 However, the risk of perforation can dramatically increase to 17% depending on the methods of therapeutic intervention and underlying risk factors (Table 1).1, 57
| Level of operator experience |
| Underlying esophageal disease |
| Zenker's diverticulum |
| Eosinophilic esophagitis |
| Esophageal or mediastinal irradiation |
| Esophageal malignancy |
| Esophageal strictures |
| Systemic disease |
| Anterior cervical osteophytes |
| Advanced liver cirrhosis |
| Diabetes mellitus |
| Scleroderma |
| Complexity of intervention |
| Esophageal stent placement |
| Pneumatic dilation |
| Other |
| Heavy sedation |
| Advanced age |
It is estimated that 33%75% of all esophageal perforations are iatrogenic.8 Of those caused by EGD, therapeutic interventions portend an increased risk compared with the risk of diagnostic endoscopy alone (Table 2).4 With the expanding role of flexible EGD and the increasing number of procedures performed, this modest risk per procedure still translates into a sizable number of perforations with their ensuing complications.4, 7 Mortality rates following esophageal perforation may approach 25%.9
| Endoscopic procedure | Esophageal perforation risk |
|---|---|
| Diagnostic | 0.03% |
| Dilation | 0.25% (normal esophagus)4%7% (achalasia)*7% (gastric outlet obstruction)*17% (strictures due to caustic agent) |
| Thermal method (treatment of malignancy) | 10% |
| Endoprosthesis | 3% |
| Variceal sclerotherapy | 1%5% (acute perforation)2%5% (delayed perforation) |
| Band ligation | 0.7% (perforation) |
| Nonvariceal hemostasis (use of sclerosant or cautery) | 0%2% (first hemostasis)4% (hemostasis repeated within 2448 hours) |
ANATOMY AND PATHOPHYSIOLOGY
The most common site of perforation is at the level of the cricopharyngeus, as it is a narrow introitus leading to the esophagus. The risk of perforation at this location is further increased with the presence of a Zenker's diverticulum or cervical osteophytes. The second most common site is proximal to the lower esophageal sphincter because of the angulation of the hiatus and the high frequency of esophageal webs, rings, reflux strictures, and hiatal hernias. The relatively straight middle esophagus is an uncommon site for perforations.
Cervical perforations are less commonly caused by organic lesions of the esophagus. Often, they are the result of technique and manipulation of the endoscope, or of certain conditions associated with the jaw, neck, or spinal column that are unfavorable for endoscopy. The risk of cervical perforation increases with the presence of bony spurs, as the upper esophagus is compressed over the underlying spinal column. Thoracic perforations, however, are more commonly seen with organic esophageal obstruction. These obstructions may be caused by an underlying inflammatory process, benign stricture, or neoplasm. In these cases, the risk of thoracic perforation is increased with blind procedures. Thoracic perforations carry a worse prognosis if diagnosis is delayed, or if the underlying obstruction cannot be removed.10
Esophageal perforation leads to periesophageal tissues being contaminated by food, secretions, air, or gastric contents and may be followed by chemical tissue injury and infection. The nature and extent of infection depend on the site of esophageal perforation. Cervical esophageal perforation can cause retropharyngeal space infection, which has the potential to extend directly into the posterior mediastinum via the danger space, which is between the retropharyngeal and prevertebral spaces and extends from the base of the skull descending freely throughout the entire length of the posterior mediastinum. With thoracic perforations, esophageal contents can enter the pleural space by negative intrathoracic pressure with subsequent pleural contamination and empyema.8, 1113
Pathogens responsible for infections after esophageal perforation vary based on several factors including site of perforation, clinical status of patient when perforation occurs (hospitalized versus not hospitalized, critically ill versus healthy), receipt of enteral nutrition, gastric acid suppression with H2‐receptor antagonists or proton‐pump inhibitors, immunosuppression, and recent (or current) receipt of antimicrobials. In nonintubated, healthy adults not on antimicrobial therapy, organisms in the upper esophagus are essentially identical to those in the oropharynx and include viridans streptococci, Haemophilus species, and anaerobes. During critical illness and following antibiotic therapy, the normal oral flora is rapidly replaced by aerobic Gram‐negative bacilli, Staphylococcus aureus, and yeast.14 The stomach, which is normally devoid of bacteria, can likewise be colonized with pathogenic organisms in the setting of gastric acid suppression and enteral nutrition.15, 16
SIGNS AND SYMPTOMS
Esophageal perforation should be considered after EGD, dilation, sclerotherapy, variceal banding, and esophageal stenting. However, perforation can also result from other invasive procedures such as insertion of feeding and nasogastric tubes, rapid sequence intubation, and transesophageal echocardiography.
The clinical triad of esophageal perforation includes pain, fever, and subcutaneous air.17 In a study by Wychulis et al., among 33 patients with esophageal perforation, 75% demonstrated all 3 findings.10 Pain is the most sensitive finding and occurs in nearly all patients identified with esophageal perforation. Crepitation, which results from air dissecting along soft tissue planes of the mediastinum and into the neck, occurs in up to 70% with cervical perforation and 30% with thoracic perforation.8, 10, 18
Clinical presentation and outcomes vary depending on the location of the perforation (Table 3).8 Cervical perforation is usually associated with anterior neck pain, located at the anterior border of the sternocleidomastoid muscle. Movement of the neck and palpation typically aggravate the pain. Thoracic perforation typically presents as substernal chest pain, often with a component of pleurisy. Pleural effusions are present in 50% of thoracic perforations, and mediastinitis is more likely to occur.19 Hamman's sign, a finding characterized by an audible crunch with chest auscultation, is suggestive of mediastinal emphysema. Perforation of the intra‐abdominal esophagus can result in epigastric pain and signs of acute abdomen.10, 17 Subcutaneous emphysema occurs more frequently with cervical perforation but can be present regardless of location.10 Secondary infections following esophageal perforation can manifest with an accelerated clinical course leading to sepsis and shock.
| Location of perforation | Symptom | Sign* |
|---|---|---|
| ||
| Cervical esophagus | Muscle spasm Dysphonia Hoarseness Dysphagia | Anterior neck tendernessTenderness on cervical motionSubcutaneous emphysema |
| Thoracic esophagus | Substernal chest pain Dysphagia Odynophagia | Cyanosis, Dyspnea Hamman's sign Pleural effusion Subcutaneous emphysema |
| Intraabdominal esophagus | Epigastric pain | Acute abdomenSubcutaneous emphysema |
DIAGNOSIS
Clinical suspicion of esophageal perforation should prompt necessary radiographic studies to establish the diagnosis.18, 20 Contrast‐enhanced computed tomography (CT) scans of the neck and chest are preferable because of their increased sensitivity in localizing the site and showing the extent of perforation and abscess. CT scans may reveal subcutaneous or mediastinal air, abscess cavities adjacent to the esophagus, and fistulas between the esophagus and mediastinum (Figs. 1 and 2).2022 Results of contrast studies may be negative and warrant repeating within several hours.19
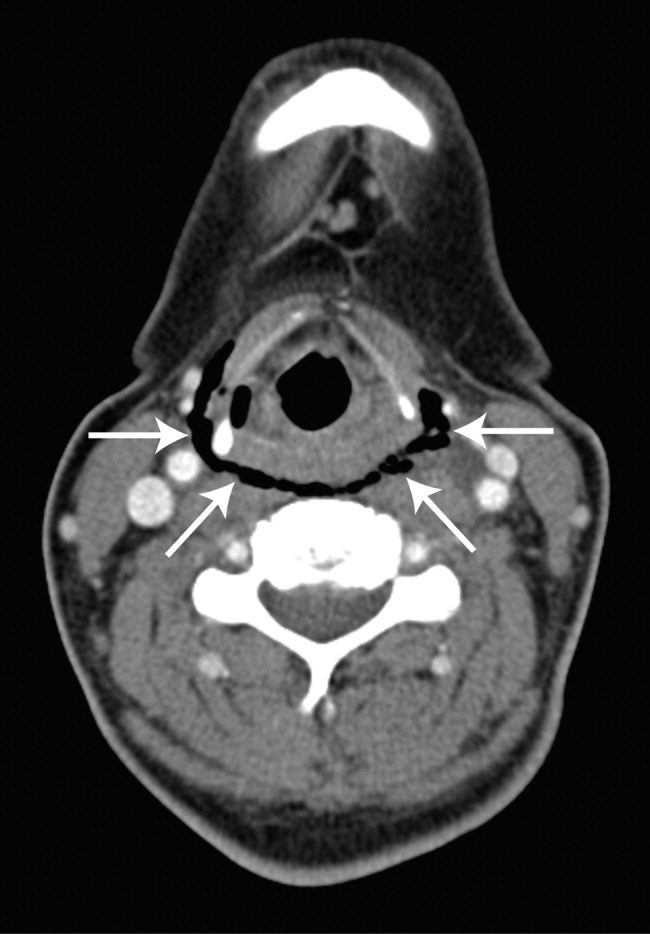

If CT scans cannot be performed, neck (soft‐tissue) and chest x‐rays may be useful. Although plain films have limited value in evaluating the retropharyngeal space, they can reveal soft‐tissue emphysema, a widened mediastinum, pulmonary infiltrates or effusions, neck abscess, and mediastinal air‐fluid levels. In cervical perforation, a lateral film of the neck can show air in deep cervical tissue before clinical signs are apparent.
Swallow studies with Gastrografin (meglumine diatrizoate) are useful in defining the exact location of the perforation (Fig. 3). However, the false‐negative rate of swallow studies can exceed 10%, especially if the patient is upright during the study. When the contrast propagates past the site of perforation too quickly, it may not extravasate.23 Although barium may provide slightly greater contrast, it may add to the problem of foreign body reaction in the area of perforation.18 An additional complication of barium is that once it has extravasated, it is not readily absorbed. The persistence of extravasated barium makes it difficult to assess the resolution of an esophageal tear on subsequent fluoroscopic or CT exams. Hence, our institution avoids using barium to evaluate esophageal perforation, unless Gastrografin swallow has excluded any major esophageal perforation. Barium swallow may then be used to exclude small mural tears. Some medical centers elect to routinely screen their high‐risk patients with swallow evaluations after an EGD, although this is not common practice.8, 24
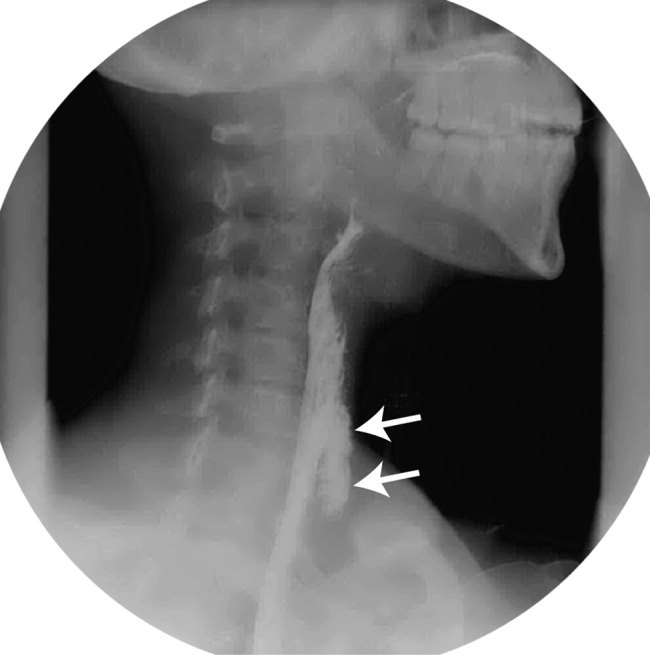
If the above workup is negative, the use of EGD may be considered for establishing the diagnosis if a high index of suspicion remains. However, the risks of EGD in this situation include extension of the perforation, further extravasation of esophageal contents, and difficulty with subsequent radiographic studies to visualize the perforation.19
MANAGEMENT
Once the diagnosis of esophageal perforation has been established, treatment options are individualized based on the clinical scenario. Currently, there are no established guidelines, and large randomized clinical trials comparing outcomes of operative versus nonoperative management have not been conducted (Fig. 4).25, 26 Outcomes associated with esophageal perforations depend on preoperative clinical condition, comorbidities, location and size of the perforation, nature of underlying esophageal disease (if any), and time to establish the diagnosis and initiate therapy.10 Delay in patient presentation or diagnosis beyond 24 hours following esophageal perforation has been associated with adverse outcomes.18, 27, 28
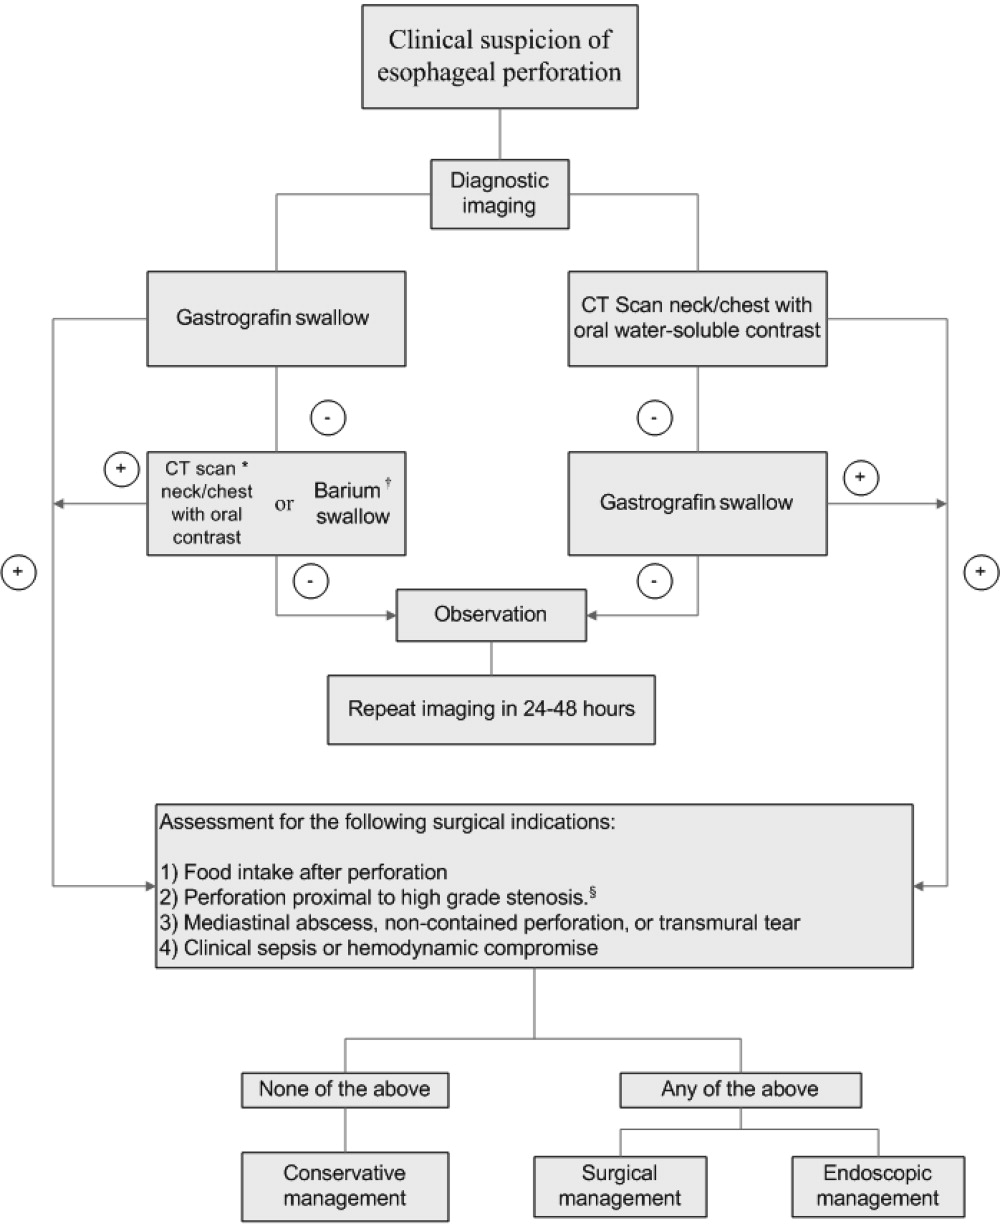
A conservative approach is appropriate when clinically stable patients with minimal symptoms have well‐contained, nontransmural tears. Management entails broad‐spectrum antibiotics, nothing by mouth, nasogastric suction, and parenteral nutrition.24 Early surgical consultation is recommended in all cases. Serial CT scanning is useful for following the resolution of fistulas and tears. An oral diet can be resumed when contrast or swallow studies show no extravasation of dye. Cervical perforations typically fare well with this approach.26, 29
Surgical therapy is recommended for patients with large or uncontained esophageal perforations, mediastinal abscesses, and/or sepsis.25, 27 Surgical options include esophageal diversion, esophagectomy, or drainage with or without primary repair. Drainage with primary repair is considered the treatment of choice, regardless of time to presentation. Esophagectomy is considered in cases of delayed or neglected perforations, extensive transmural necrosis or underlying cancer.30 Operative mortality is 0%30% when treated within 24 hours. This rate increases to 26%64% when treatment is delayed beyond 24 hours, reaffirming the importance of making a prompt diagnosis.8
Endoscopic intervention is gaining recognition for its role in the management of esophageal perforations, especially when the risks make surgery prohibitive. Therapeutic options include stenting and clipping a perforation, as well as debriding and draining an abscess. Endoscopists can successfully treat traumatic nonmalignant esophageal perforations smaller than 50% to 70% of the circumference with self‐expanding plastic stents.26 Another option is to use metallic clipping devices to treat small esophageal perforations (1 cm).3133 Combined with medical management and appropriate patient selection, the benefits of an endoscopic approach may potentially outweigh the risks of surgery.26, 29, 33, 34
Regardless of treatment approach, the appropriate and timely selection of empiric antibiotic therapy improves outcomes. Empiric antimicrobial therapy for esophageal perforation will depend on several host factors as well as the site of perforation. In healthy nonhospitalized adults, ampicillin‐sulbactam, clindamycin, and penicillin G plus metronidazole are good choices because of their excellent activity against oral microflora. In patients who are critically ill, are hospitalized, are immunosuppressed, or have gastric acid suppression, initial broad‐spectrum antimicrobials such as piperacillin‐tazobactam, imipenem, meropenem, or a third‐generation cephalosporin plus metronidazole (or clindamycin) should be initiated. Additional therapy against methicillin‐resistant Staphylococcus aureus or Candida sp. should be considered if the patient is critically ill or is known to be colonized with these organisms. Initial empiric therapy should be modified as necessary based on culture results. Total duration of therapy will vary based on location and magnitude of the infection, adjunctive surgical debridement, and pathogens involved.
SUMMARY
Despite being an extremely safe procedure, EGD carries a known serious risk of esophageal perforation. Mortality after esophageal perforation can approach 25%. Although diagnostic endoscopy has a perforation rate of less than 0.03%, the risk can approach 17% with therapeutic interventions such as stent placement and esophageal dilation. Factors influencing the risks of perforation include procedural complexity, operator experience, and underlying esophageal and systemic diseases. Furthermore, perforations complicated by infection can lead to fatal mediastinitis and sepsis. The clinical triad of esophageal perforation is fever, neck pain, and crepitus. The optimal diagnostic study is CT scan of the neck and thorax with water‐soluble oral contrast. Treatment options range from conservative management with broad‐spectrum antibiotics to surgery. Diagnosis of esophageal perforation within 24 hours is essential for favorable outcomes.
- .Complications of endoscopic gastrointestinal dilation techniques.Gastrointest Endosc Clin N Am.1996;6:323–341.
- .Complications of upper gastrointestinal endoscopy.Gastrointest Endosc Clin N Am.1996;6:287–303.
- ,.Complications of upper gastrointestinal endoscopy and their management.Gastrointest Endosc Clin N Am.1994;4:551–570.
- ,,,,.Treatment of endoscopic esophageal perforation.Surg Endosc.1999;13:962–966.
- ,,,.Unsedated small‐caliber esophagogastroduodenoscopy (EGD) versus conventional EGD: a comparative study [see comment].Gastroenterology.1999;117:1301–1307.
- ,,,,.Complications associated with esophagogastroduodenoscopy and with esophageal dilation.Gastrointest Endosc.1976;23(1):16–19.
- ,,.Comparison among the perforation rates of Maloney, balloon, and savary dilation of esophageal strictures.Gastrointest Endosc.2000;51(4 Pt 1):460–462.
- ,.Esophageal emergencies: things that will wake you from a sound sleep.Gastroenterol Clin N Am.2003;32:1035–1052.
- ,,, et al.Complications of upper GI endoscopy.Gastrointest Endosc.2002;55:784–793.
- ,,.Instrumental perforations of the esophagus.Dis Chest.1969;55(3):184–189.
- ,Complications of esophageal dilation and guidelines for their prevention.Gastrointest Endosc.1981;27:229–234.
- .Infectious complications associated with gastrointestinal endoscopy.Gastrointest Endosc Clin N Am.2000;10:215–232.
- ,,,The occurrence of bacteremia after esophageal dilation.Gastrointestinal Endoscopy1975;22(2):86–87.
- ,,,,,.The pathogenesis of ventilator‐associated pneumonia: its relevance to developing effective strategies for prevention.Respir Care.2005;50:725–739; discussion39–41.
- ,,, et al.Stomach as a source of colonization of the respiratory tract during mechanical ventilation: association with ventilator‐associated pneumonia.Eur Respir J.1996;9:1729–1735.
- ,,, et al.Gastric microbiota in elderly patients fed via nasogastric tubes for prolonged periods.J Hosp Infect.2006;63(1):79–83.
- ,.Retroesophageal abscess twenty‐five days after esophagoscopy. An unusual complication of endoscopy.Gastrointest Endosc.1972;18:167–168.
- ,,.The radiologist in prevention and diagnosis of instrumental perforation of the esophagus.South Med J.1974;67:830–836.
- ,,.Short‐ and long‐term outcome of esophageal perforation.Gastrointest Endosc.1995;41(2):130–134.
- ,,,.The diagnosis and treatment of esophageal perforations resulting from nonmalignant causes.Surg Today.1997;27:793–800.
- ,.Radiology of the retropharyngeal space.Clin Radiol.2000;55:740–748.
- ,,.Diagnosis and management decisions in infections of the deep fascial spaces of the head and neck utilizing computerized tomography.Laryngoscope.1982;92(6, Pt. 1):630–633.
- .Perforation of the esophagus.Ann Thorac Surg.1986;42:231–232.
- ,,, et al.Successfully treated case of cervical abscess and mediastinitis due to esophageal perforation after gastrointestinal endoscopy.Dis Esophagus.2002;15:250–252.
- ,.The spectrum of spontaneous and iatrogenic esophageal injury: perforations, Mallory‐Weiss tears, and hematomas.J Clin Gastroenterol.1999;29:306–317.
- .Treatment of esophageal perforations and anastomotic leaks: the endoscopist is stepping into the arena.Gastrointest Endosc.2005;61:897–900.
- ,,.Operative and nonoperative management of esophageal perforations.Ann Surg.1981;194(1):57–63.
- ,,.Current results of therapy for esophageal perforation.Am J Surg.1995;169:615–617.
- ,,.Successful endoscopic management of a cervical pharyngeal perforation and mediastinal abscess.Gastrointest Endosc.2005;61(1):158–160.
- ,,,,.Thoracic esophageal perforations: a decade of experience.[see comment].Ann Thorac Surg.2003;75:1071–1074.
- ,.Perforation: part and parcel of endoscopic resection? [comment].Gastrointest Endosc.2006;63:602–605.
- ,,,.Endoscopic clip application as an adjunct to closure of mature esophageal perforation with fistulae.Clin Gastroenterol Hepatol.2003;1(1):44–50.
- ,,.Endoscopic clipping of esophageal perforation after pneumatic dilation for achalasia.Endoscopy.1995;27:608–611.
- ,,, et al.Esophageal dilation.Gastrointest Endosc.2006;63:755–760.
Esophagogastroduodenoscopy (EGD) carries a small but serious risk of esophageal perforation.13 With its potential for sepsis and fatal mediastinitis, prompt recognition and treatment are essential for favorable outcomes. The risk of perforation with diagnostic flexible EGD is 0.03%, which is an improvement from the 0.1%0.4% risk associated with rigid endoscopy.4 However, the risk of perforation can dramatically increase to 17% depending on the methods of therapeutic intervention and underlying risk factors (Table 1).1, 57
| Level of operator experience |
| Underlying esophageal disease |
| Zenker's diverticulum |
| Eosinophilic esophagitis |
| Esophageal or mediastinal irradiation |
| Esophageal malignancy |
| Esophageal strictures |
| Systemic disease |
| Anterior cervical osteophytes |
| Advanced liver cirrhosis |
| Diabetes mellitus |
| Scleroderma |
| Complexity of intervention |
| Esophageal stent placement |
| Pneumatic dilation |
| Other |
| Heavy sedation |
| Advanced age |
It is estimated that 33%75% of all esophageal perforations are iatrogenic.8 Of those caused by EGD, therapeutic interventions portend an increased risk compared with the risk of diagnostic endoscopy alone (Table 2).4 With the expanding role of flexible EGD and the increasing number of procedures performed, this modest risk per procedure still translates into a sizable number of perforations with their ensuing complications.4, 7 Mortality rates following esophageal perforation may approach 25%.9
| Endoscopic procedure | Esophageal perforation risk |
|---|---|
| Diagnostic | 0.03% |
| Dilation | 0.25% (normal esophagus)4%7% (achalasia)*7% (gastric outlet obstruction)*17% (strictures due to caustic agent) |
| Thermal method (treatment of malignancy) | 10% |
| Endoprosthesis | 3% |
| Variceal sclerotherapy | 1%5% (acute perforation)2%5% (delayed perforation) |
| Band ligation | 0.7% (perforation) |
| Nonvariceal hemostasis (use of sclerosant or cautery) | 0%2% (first hemostasis)4% (hemostasis repeated within 2448 hours) |
ANATOMY AND PATHOPHYSIOLOGY
The most common site of perforation is at the level of the cricopharyngeus, as it is a narrow introitus leading to the esophagus. The risk of perforation at this location is further increased with the presence of a Zenker's diverticulum or cervical osteophytes. The second most common site is proximal to the lower esophageal sphincter because of the angulation of the hiatus and the high frequency of esophageal webs, rings, reflux strictures, and hiatal hernias. The relatively straight middle esophagus is an uncommon site for perforations.
Cervical perforations are less commonly caused by organic lesions of the esophagus. Often, they are the result of technique and manipulation of the endoscope, or of certain conditions associated with the jaw, neck, or spinal column that are unfavorable for endoscopy. The risk of cervical perforation increases with the presence of bony spurs, as the upper esophagus is compressed over the underlying spinal column. Thoracic perforations, however, are more commonly seen with organic esophageal obstruction. These obstructions may be caused by an underlying inflammatory process, benign stricture, or neoplasm. In these cases, the risk of thoracic perforation is increased with blind procedures. Thoracic perforations carry a worse prognosis if diagnosis is delayed, or if the underlying obstruction cannot be removed.10
Esophageal perforation leads to periesophageal tissues being contaminated by food, secretions, air, or gastric contents and may be followed by chemical tissue injury and infection. The nature and extent of infection depend on the site of esophageal perforation. Cervical esophageal perforation can cause retropharyngeal space infection, which has the potential to extend directly into the posterior mediastinum via the danger space, which is between the retropharyngeal and prevertebral spaces and extends from the base of the skull descending freely throughout the entire length of the posterior mediastinum. With thoracic perforations, esophageal contents can enter the pleural space by negative intrathoracic pressure with subsequent pleural contamination and empyema.8, 1113
Pathogens responsible for infections after esophageal perforation vary based on several factors including site of perforation, clinical status of patient when perforation occurs (hospitalized versus not hospitalized, critically ill versus healthy), receipt of enteral nutrition, gastric acid suppression with H2‐receptor antagonists or proton‐pump inhibitors, immunosuppression, and recent (or current) receipt of antimicrobials. In nonintubated, healthy adults not on antimicrobial therapy, organisms in the upper esophagus are essentially identical to those in the oropharynx and include viridans streptococci, Haemophilus species, and anaerobes. During critical illness and following antibiotic therapy, the normal oral flora is rapidly replaced by aerobic Gram‐negative bacilli, Staphylococcus aureus, and yeast.14 The stomach, which is normally devoid of bacteria, can likewise be colonized with pathogenic organisms in the setting of gastric acid suppression and enteral nutrition.15, 16
SIGNS AND SYMPTOMS
Esophageal perforation should be considered after EGD, dilation, sclerotherapy, variceal banding, and esophageal stenting. However, perforation can also result from other invasive procedures such as insertion of feeding and nasogastric tubes, rapid sequence intubation, and transesophageal echocardiography.
The clinical triad of esophageal perforation includes pain, fever, and subcutaneous air.17 In a study by Wychulis et al., among 33 patients with esophageal perforation, 75% demonstrated all 3 findings.10 Pain is the most sensitive finding and occurs in nearly all patients identified with esophageal perforation. Crepitation, which results from air dissecting along soft tissue planes of the mediastinum and into the neck, occurs in up to 70% with cervical perforation and 30% with thoracic perforation.8, 10, 18
Clinical presentation and outcomes vary depending on the location of the perforation (Table 3).8 Cervical perforation is usually associated with anterior neck pain, located at the anterior border of the sternocleidomastoid muscle. Movement of the neck and palpation typically aggravate the pain. Thoracic perforation typically presents as substernal chest pain, often with a component of pleurisy. Pleural effusions are present in 50% of thoracic perforations, and mediastinitis is more likely to occur.19 Hamman's sign, a finding characterized by an audible crunch with chest auscultation, is suggestive of mediastinal emphysema. Perforation of the intra‐abdominal esophagus can result in epigastric pain and signs of acute abdomen.10, 17 Subcutaneous emphysema occurs more frequently with cervical perforation but can be present regardless of location.10 Secondary infections following esophageal perforation can manifest with an accelerated clinical course leading to sepsis and shock.
| Location of perforation | Symptom | Sign* |
|---|---|---|
| ||
| Cervical esophagus | Muscle spasm Dysphonia Hoarseness Dysphagia | Anterior neck tendernessTenderness on cervical motionSubcutaneous emphysema |
| Thoracic esophagus | Substernal chest pain Dysphagia Odynophagia | Cyanosis, Dyspnea Hamman's sign Pleural effusion Subcutaneous emphysema |
| Intraabdominal esophagus | Epigastric pain | Acute abdomenSubcutaneous emphysema |
DIAGNOSIS
Clinical suspicion of esophageal perforation should prompt necessary radiographic studies to establish the diagnosis.18, 20 Contrast‐enhanced computed tomography (CT) scans of the neck and chest are preferable because of their increased sensitivity in localizing the site and showing the extent of perforation and abscess. CT scans may reveal subcutaneous or mediastinal air, abscess cavities adjacent to the esophagus, and fistulas between the esophagus and mediastinum (Figs. 1 and 2).2022 Results of contrast studies may be negative and warrant repeating within several hours.19
If CT scans cannot be performed, neck (soft‐tissue) and chest x‐rays may be useful. Although plain films have limited value in evaluating the retropharyngeal space, they can reveal soft‐tissue emphysema, a widened mediastinum, pulmonary infiltrates or effusions, neck abscess, and mediastinal air‐fluid levels. In cervical perforation, a lateral film of the neck can show air in deep cervical tissue before clinical signs are apparent.
Swallow studies with Gastrografin (meglumine diatrizoate) are useful in defining the exact location of the perforation (Fig. 3). However, the false‐negative rate of swallow studies can exceed 10%, especially if the patient is upright during the study. When the contrast propagates past the site of perforation too quickly, it may not extravasate.23 Although barium may provide slightly greater contrast, it may add to the problem of foreign body reaction in the area of perforation.18 An additional complication of barium is that once it has extravasated, it is not readily absorbed. The persistence of extravasated barium makes it difficult to assess the resolution of an esophageal tear on subsequent fluoroscopic or CT exams. Hence, our institution avoids using barium to evaluate esophageal perforation, unless Gastrografin swallow has excluded any major esophageal perforation. Barium swallow may then be used to exclude small mural tears. Some medical centers elect to routinely screen their high‐risk patients with swallow evaluations after an EGD, although this is not common practice.8, 24
If the above workup is negative, the use of EGD may be considered for establishing the diagnosis if a high index of suspicion remains. However, the risks of EGD in this situation include extension of the perforation, further extravasation of esophageal contents, and difficulty with subsequent radiographic studies to visualize the perforation.19
MANAGEMENT
Once the diagnosis of esophageal perforation has been established, treatment options are individualized based on the clinical scenario. Currently, there are no established guidelines, and large randomized clinical trials comparing outcomes of operative versus nonoperative management have not been conducted (Fig. 4).25, 26 Outcomes associated with esophageal perforations depend on preoperative clinical condition, comorbidities, location and size of the perforation, nature of underlying esophageal disease (if any), and time to establish the diagnosis and initiate therapy.10 Delay in patient presentation or diagnosis beyond 24 hours following esophageal perforation has been associated with adverse outcomes.18, 27, 28
A conservative approach is appropriate when clinically stable patients with minimal symptoms have well‐contained, nontransmural tears. Management entails broad‐spectrum antibiotics, nothing by mouth, nasogastric suction, and parenteral nutrition.24 Early surgical consultation is recommended in all cases. Serial CT scanning is useful for following the resolution of fistulas and tears. An oral diet can be resumed when contrast or swallow studies show no extravasation of dye. Cervical perforations typically fare well with this approach.26, 29
Surgical therapy is recommended for patients with large or uncontained esophageal perforations, mediastinal abscesses, and/or sepsis.25, 27 Surgical options include esophageal diversion, esophagectomy, or drainage with or without primary repair. Drainage with primary repair is considered the treatment of choice, regardless of time to presentation. Esophagectomy is considered in cases of delayed or neglected perforations, extensive transmural necrosis or underlying cancer.30 Operative mortality is 0%30% when treated within 24 hours. This rate increases to 26%64% when treatment is delayed beyond 24 hours, reaffirming the importance of making a prompt diagnosis.8
Endoscopic intervention is gaining recognition for its role in the management of esophageal perforations, especially when the risks make surgery prohibitive. Therapeutic options include stenting and clipping a perforation, as well as debriding and draining an abscess. Endoscopists can successfully treat traumatic nonmalignant esophageal perforations smaller than 50% to 70% of the circumference with self‐expanding plastic stents.26 Another option is to use metallic clipping devices to treat small esophageal perforations (1 cm).3133 Combined with medical management and appropriate patient selection, the benefits of an endoscopic approach may potentially outweigh the risks of surgery.26, 29, 33, 34
Regardless of treatment approach, the appropriate and timely selection of empiric antibiotic therapy improves outcomes. Empiric antimicrobial therapy for esophageal perforation will depend on several host factors as well as the site of perforation. In healthy nonhospitalized adults, ampicillin‐sulbactam, clindamycin, and penicillin G plus metronidazole are good choices because of their excellent activity against oral microflora. In patients who are critically ill, are hospitalized, are immunosuppressed, or have gastric acid suppression, initial broad‐spectrum antimicrobials such as piperacillin‐tazobactam, imipenem, meropenem, or a third‐generation cephalosporin plus metronidazole (or clindamycin) should be initiated. Additional therapy against methicillin‐resistant Staphylococcus aureus or Candida sp. should be considered if the patient is critically ill or is known to be colonized with these organisms. Initial empiric therapy should be modified as necessary based on culture results. Total duration of therapy will vary based on location and magnitude of the infection, adjunctive surgical debridement, and pathogens involved.
SUMMARY
Despite being an extremely safe procedure, EGD carries a known serious risk of esophageal perforation. Mortality after esophageal perforation can approach 25%. Although diagnostic endoscopy has a perforation rate of less than 0.03%, the risk can approach 17% with therapeutic interventions such as stent placement and esophageal dilation. Factors influencing the risks of perforation include procedural complexity, operator experience, and underlying esophageal and systemic diseases. Furthermore, perforations complicated by infection can lead to fatal mediastinitis and sepsis. The clinical triad of esophageal perforation is fever, neck pain, and crepitus. The optimal diagnostic study is CT scan of the neck and thorax with water‐soluble oral contrast. Treatment options range from conservative management with broad‐spectrum antibiotics to surgery. Diagnosis of esophageal perforation within 24 hours is essential for favorable outcomes.
- .Complications of endoscopic gastrointestinal dilation techniques.Gastrointest Endosc Clin N Am.1996;6:323–341.
- .Complications of upper gastrointestinal endoscopy.Gastrointest Endosc Clin N Am.1996;6:287–303.
- ,.Complications of upper gastrointestinal endoscopy and their management.Gastrointest Endosc Clin N Am.1994;4:551–570.
- ,,,,.Treatment of endoscopic esophageal perforation.Surg Endosc.1999;13:962–966.
- ,,,.Unsedated small‐caliber esophagogastroduodenoscopy (EGD) versus conventional EGD: a comparative study [see comment].Gastroenterology.1999;117:1301–1307.
- ,,,,.Complications associated with esophagogastroduodenoscopy and with esophageal dilation.Gastrointest Endosc.1976;23(1):16–19.
- ,,.Comparison among the perforation rates of Maloney, balloon, and savary dilation of esophageal strictures.Gastrointest Endosc.2000;51(4 Pt 1):460–462.
- ,.Esophageal emergencies: things that will wake you from a sound sleep.Gastroenterol Clin N Am.2003;32:1035–1052.
- ,,, et al.Complications of upper GI endoscopy.Gastrointest Endosc.2002;55:784–793.
- ,,.Instrumental perforations of the esophagus.Dis Chest.1969;55(3):184–189.
- ,Complications of esophageal dilation and guidelines for their prevention.Gastrointest Endosc.1981;27:229–234.
- .Infectious complications associated with gastrointestinal endoscopy.Gastrointest Endosc Clin N Am.2000;10:215–232.
- ,,,The occurrence of bacteremia after esophageal dilation.Gastrointestinal Endoscopy1975;22(2):86–87.
- ,,,,,.The pathogenesis of ventilator‐associated pneumonia: its relevance to developing effective strategies for prevention.Respir Care.2005;50:725–739; discussion39–41.
- ,,, et al.Stomach as a source of colonization of the respiratory tract during mechanical ventilation: association with ventilator‐associated pneumonia.Eur Respir J.1996;9:1729–1735.
- ,,, et al.Gastric microbiota in elderly patients fed via nasogastric tubes for prolonged periods.J Hosp Infect.2006;63(1):79–83.
- ,.Retroesophageal abscess twenty‐five days after esophagoscopy. An unusual complication of endoscopy.Gastrointest Endosc.1972;18:167–168.
- ,,.The radiologist in prevention and diagnosis of instrumental perforation of the esophagus.South Med J.1974;67:830–836.
- ,,.Short‐ and long‐term outcome of esophageal perforation.Gastrointest Endosc.1995;41(2):130–134.
- ,,,.The diagnosis and treatment of esophageal perforations resulting from nonmalignant causes.Surg Today.1997;27:793–800.
- ,.Radiology of the retropharyngeal space.Clin Radiol.2000;55:740–748.
- ,,.Diagnosis and management decisions in infections of the deep fascial spaces of the head and neck utilizing computerized tomography.Laryngoscope.1982;92(6, Pt. 1):630–633.
- .Perforation of the esophagus.Ann Thorac Surg.1986;42:231–232.
- ,,, et al.Successfully treated case of cervical abscess and mediastinitis due to esophageal perforation after gastrointestinal endoscopy.Dis Esophagus.2002;15:250–252.
- ,.The spectrum of spontaneous and iatrogenic esophageal injury: perforations, Mallory‐Weiss tears, and hematomas.J Clin Gastroenterol.1999;29:306–317.
- .Treatment of esophageal perforations and anastomotic leaks: the endoscopist is stepping into the arena.Gastrointest Endosc.2005;61:897–900.
- ,,.Operative and nonoperative management of esophageal perforations.Ann Surg.1981;194(1):57–63.
- ,,.Current results of therapy for esophageal perforation.Am J Surg.1995;169:615–617.
- ,,.Successful endoscopic management of a cervical pharyngeal perforation and mediastinal abscess.Gastrointest Endosc.2005;61(1):158–160.
- ,,,,.Thoracic esophageal perforations: a decade of experience.[see comment].Ann Thorac Surg.2003;75:1071–1074.
- ,.Perforation: part and parcel of endoscopic resection? [comment].Gastrointest Endosc.2006;63:602–605.
- ,,,.Endoscopic clip application as an adjunct to closure of mature esophageal perforation with fistulae.Clin Gastroenterol Hepatol.2003;1(1):44–50.
- ,,.Endoscopic clipping of esophageal perforation after pneumatic dilation for achalasia.Endoscopy.1995;27:608–611.
- ,,, et al.Esophageal dilation.Gastrointest Endosc.2006;63:755–760.

A “Super” case of longevity
A 109‐year‐old woman was admitted to the hospital for mild congestive heart failure and bradycardia. She scored 30 out of 30 on the Mini‐mental status exam. Further conversations revealed that she was a native of San Francisco and that she was 9 years old during the earthquake of 1906. She was 109 years old during hospitalization (Fig. 1). About 5 months after the hospitalization, she celebrated her 110th birthday (Fig. 2).
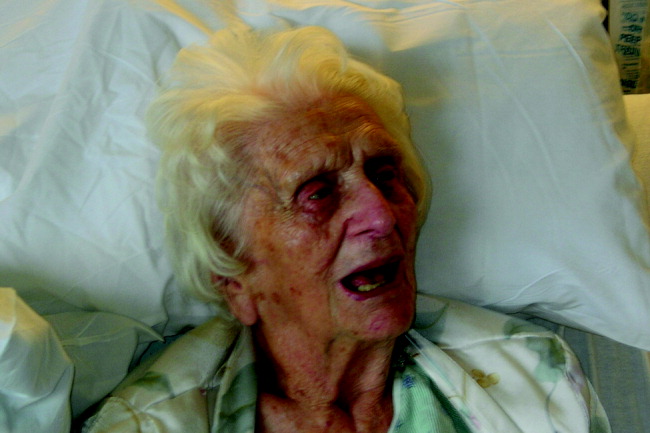

A centenarian is a person who has lived to the age of 100, and a supercentenarian is a person who has reached the age of 110. The number of centenarians in the United States was counted as 50,454 in the 2000 Census, increased from the 37,306 reported in 1990.1 The US Census Bureau estimates the current number of centenarians to be 79,682 and projects an increase to 580,605 by the year 2040.2 The number of supercentenarians was reported as 1400 in the 2000 Census.3
Hospital physicians can expect to see a growing number of centenarians in their practice as this segment of the population continues to increase.
A 109‐year‐old woman was admitted to the hospital for mild congestive heart failure and bradycardia. She scored 30 out of 30 on the Mini‐mental status exam. Further conversations revealed that she was a native of San Francisco and that she was 9 years old during the earthquake of 1906. She was 109 years old during hospitalization (Fig. 1). About 5 months after the hospitalization, she celebrated her 110th birthday (Fig. 2).
A centenarian is a person who has lived to the age of 100, and a supercentenarian is a person who has reached the age of 110. The number of centenarians in the United States was counted as 50,454 in the 2000 Census, increased from the 37,306 reported in 1990.1 The US Census Bureau estimates the current number of centenarians to be 79,682 and projects an increase to 580,605 by the year 2040.2 The number of supercentenarians was reported as 1400 in the 2000 Census.3
Hospital physicians can expect to see a growing number of centenarians in their practice as this segment of the population continues to increase.

Evidence in Prevention of Secondary Stroke
Stroke is a leading cause of disability and the third leading cause of death in the United States.1 Transient ischemic attack (TIA) carries a substantial short‐term risk for stroke.1 The risk of stroke following TIA ranges from 2% to 5% within 48 hours, is 10.5% within 90 days, and ranges from 24% to 29% within 5 years.24 Among the 780,000 new or recurrent strokes that occur each year, 180,000 are recurrent attacks.1, 5 Several evidence‐based guidelines for secondary prevention of stroke are available. To reduce variability in the assessment, diagnostic evaluation, and treatment of patients with TIA in actual clinical practice and to simplify the management of TIA or ischemic stroke, this article will review the available guidelines for secondary prevention of stroke and the data from clinical trials that support these guidelines.
PATHOPHYSIOLOGY AND SUBTYPES/CLASSIFICATION
Stroke is broadly classified as hemorrhagic or ischemic stroke. Hemorrhagic stroke, including intraparenchymal and subarachnoid hemorrhage, accounts for 13% of strokes and ischemic stroke for 87%.1 Ischemic stroke is caused by inadequate cerebral blood flow as a result of either stenosis or occlusion of the vessels supplying the brain.6 The average rate of cerebral blood flow is 50 mL/100 g a minute. Flow rates below 2025 mL/100 g a minute are usually associated with cerebral impairment, and rates below 10 mL/100 g a minute are associated with irreversible brain damage.
Approximately 20% of ischemic strokes are of cardioembolic origin; 25% are a result of atherosclerotic cerebrovascular disease; 20% are a result of penetrating artery disease (lacunes); 5% are due to other causes, such as hypercoagulable states, including protein S and C deficiency, sickle cell disease, and various types of vasculitis; and 30% are cryptogenic.7, 8 Cardioembolic stroke can be a manifestation of atrial fibrillation, valvular disease, ventricular thrombi, and other cardiac conditions.9 Large arteries, such as the carotid arteries and the proximal aorta, are a source of atherogenic emboli.10 Atherosclerotic plaques in the arteries may narrow the lumen of the blood vessel or produce emboli, which results in occlusion of the distal arteries, causing a stroke.
RISK FACTORS
Several risk factors, both nonmodifiable and modifiable, predispose individuals to stroke. Nonmodifiable risk factors include age, sex, race, and family or personal history of stroke or myocardial infarction (MI).1, 5 After the age of 55, the stroke rate doubles for every 10‐year increase in age.1 African Americans have a 50% greater risk of death due to stroke than whites.1 The appropriate management of modifiable risk factors can significantly reduce the risk of recurrent stroke and improve survival. The many modifiable factors include hypertension, heart disease, smoking, diabetes, atrial fibrillation, dyslipidemia, obesity, and alcohol abuse.1, 5 The mechanisms of how these factors increase the risk for stroke and management of these factors are discussed later in this article. It is important to educate individuals, particularly those who also have nonmodifiable risk factors, about modifiable risk factors in order to enable early and appropriate intervention.
DIAGNOSIS
Most patients with TIA are asymptomatic when they present to the emergency department (ED). The risk of stroke following an episode of TIA has been found to be 3.5% within 48 hours in a meta‐analysis based on a random effects model;11 therefore, it is critical to quickly identify patients with high short‐term risk for recurrent stroke.12 The ABCD2 score was recently validated in TIA patients to estimate the near‐term risk of completed stroke.13 Patients with a score of 03 on the ABCD2 are at low risk, those with a score of 4 or 5 are at moderate risk, and those with a score 6 or 7 are at severe risk for recurrent stroke (Table 1).13 Risk scores, although highly predictive, should complement clinical judgment in the assessment of individual stroke risk.
| Risk factors | Points |
|---|---|
| |
| AAge > 60 years | 1 |
| BBlood pressure | |
| Systolic 140 mm Hg | 1 |
| Diastolic 90 mm Hg | 1 |
| CClinical features | |
| Unilateral weakness | 2 |
| Speech impairment without weakness | 1 |
| DDuration of symptoms | |
| 1059 minutes | 1 |
| 60 minutes | 2 |
| DDiabetes | 1 |
Currently, there are no specific guidelines for the diagnostic evaluation of patients with suspected TIA. However, the following approach, including elements of acute evaluation for both stroke and TIA as well as risk factor identification that may aid in choosing specifics of secondary prevention, may be adopted in the management of patients with TIA (Table 2).14, 15
| Diagnostic test | Indication |
|---|---|
| |
| Acute phase | |
| CT brain (noncontrast) | Rule out intracerebral or subarachnoid hemorrhage and may show early signs of stroke; if clinically suspected subarachnoid hemorrhage, lumbar puncture should be performed |
| CT angiogram with CT perfusion | Visualize occluded vessel and identify infarcted versus at‐risk tissue |
| Chest radiograph | Potentially identify aortic aneurysm or lung masses prone to hemorrhage |
| Finger stick (glucometer testing) | Rule out hypoglycemia as etiology; follow‐up glucose screening may identify diabetes as a risk factor |
| Basic metabolic panel | Rule out metabolic problems leading to symptomatology and renal disease, which may prevent contrast imaging |
| Coagulation profiles | Rule out preexisting coagulopathy that would make patient prone to hemorrhage or ineligible for some therapies, including tissue plasminogen activator |
| Stool guaiac | Rule out gastrointestinal bleed, which may make patient ineligible for some therapies |
| Electrocardiogram | Rule out concurrent myocardial infarction or cardiac arrhythmia |
| Postacute phase | |
| MRI/MRA: diffusion and perfusion studies | Quantify region of infarcted tissue and affected arterymay be useful in acute phase if available on an expedited basis |
| Transthoracic/transesophageal echocardiogram | Rule out cardioembolic stroke etiology (ie, mural thrombus, patent foramen ovale, valvular disease) |
| Carotid duplex | Rule out carotid stenosis as stroke risk factor (secondary prevention) |
| Lipid profile | Rule out hyperlipidemia as stroke risk factor (secondary prevention) |
| Blood tests: antinuclear antibodies, rapid plasma reagin test, thyroid panel, antiphospholipid antibodies; other tests for hypercoagulability | Rule out other reasons for hypercoagulable state in the appropriate patient population |
A computed tomography (CT) scan of the head or magnetic resonance imaging (MRI) of the brain should be performed as soon as possible to distinguish between ischemic and hemorrhagic stroke, eliminate other pathologies that mimic TIA or stroke, and guide selection of the appropriate treatment approach. CT scanning is often the best initial imaging choice because it reliably excludes intracranial hemorrhage and is rapidly available in most settings. For those for whom the diagnosis is uncertain, diffusion‐weighted MRI may be more helpful. Because of the time issues surrounding the use of tissue plasminogen activator, waiting for an MRI may not always be the best choice, although some institutions are now able to provide quick access to MRI imaging. Imaging can detect silent cerebral infarcts associated with an increased risk of stroke. In patients with previous TIA and/or stroke, MRI is more sensitive than CT in detecting small, old infarcts (although most are seen on CT) and in visualizing the posterior fossa (cerebellum and brain stem).12
Holter electrocardiography or inpatient telemetry monitoring can be performed to identify atrial fibrillation, a known risk factor for stroke or TIA.16 Transesophageal echocardiography (TEE) has been reported to be more sensitive than transthoracic echocardiography (TTE) for detecting cardioembolic sources of TIA or ischemic stroke across multiple age groups.17 TEE has several advantages over TTE, such as the creation of clearer images of the aorta, the pulmonary artery, valves of the heart, both atria, the atrial septum, and the left atrial appendage.
Cerebral angiography is indicated in several instances, including in children or young patients with ischemic stroke because vascular abnormalities and cerebral vasculitis are relatively more common causes in patients in these age groups.18 Furthermore, in centers in which intra‐arterial procedures are frequently performed, angiography is indicated to confirm the suspicion of posterior circulation vessel (ie, vertebral or basilar artery) occlusion prior to intervention. Angiography has the highest diagnostic validity compared with other noninvasive techniques and may be indicated if cerebral vasculitis or nonatherosclerotic disease of extracranial arteries (eg, dissections, vascular malformations) is suspected. Angiography of intracranial vessels is the gold standard for the study of cerebral aneurysms and is recommended in patients with subarachnoid hemorrhage, but there is evidence that magnetic resonance angiography (MRA) and digital subtraction angiography have better discriminatory ability in the 70%99% range of stenosis compared with duplex ultrasonography (DUS) for determining candidacy for carotid endarterectomy (CEA) or stenting.19, 20
The MRA and CT angiography (CTA) are generally used to visualize the intracranial and extracranialboth anterior and posteriorcerebral circulation. The use of MRA or CTA to image cerebral circulation has generally supplanted the use of carotid and transcranial ultrasonography and obviated the need for catheter angiography in investigating the etiology of most ischemic strokes and TIAs. The degree of carotid stenosis should be primarily estimated using noninvasive techniques (DUS, MRA, CTA).21 Duplex ultrasonography is recommended after CEA 6 months and every 1 2 years after the procedure in order to monitor recurrent stenosis.22 Angiography should be performed when the results of noninvasive examinations are discordant; when significant atherosclerotic disease of intracranial arteries is suspected, especially in vertebrobasilar arteries; or when MRA or CT angiography provides technically poor images.23
Transcranial Doppler ultrasonography and color Doppler ultrasound (TCD) are used to evaluate the intracranial vessels and may provide additional information on patency of cerebral vessels, recanalization, and collateral pathways. Compared with the gold standard of conventional angiography, TCD has a positive predictive value of 36% and a negative predictive value of 86% for a diagnosis of intracranial stenosis.24 This technique also can be used as a complementary examination in patients undergoing CEA in order to aid in preoperative evaluation and intraoperative monitoring of blood flow in the territory of the operated artery.12
TREATMENT
The management of ischemic stroke or TIA includes lifestyle modifications, reduction of modifiable risk factors, and appropriate surgical and medical intervention.12
Lifestyle Modifications
There is strong evidence for smoking as an independent risk factor for ischemic stroke, irrespective of age, sex, or ethnic background.25 Among smokers, the risk for ischemic stroke is twice that of nonsmokers.26 All patients with previous ischemic stroke or TIA are strongly encouraged not to smoke and to avoid smoke in their environments as much as possible. These patients are also recommended to obtain counseling and smoking cessation medications as needed; these interventions should be started at the time of hospital admission.
The relationship of alcohol consumption to cardiovascular risk is controversial because most studies suggest a J‐shaped association between alcohol and ischemic stroke: a protective effect forthose who consume light‐to‐moderate amounts of alcohol (<60 g ethanol/day)27 and elevated stroke risk for heavy drinkers.28 The protective effect of moderate drinking may be related to an increase in high‐density lipoprotein cholesterol,29, 30 reduced platelet aggregation,31 and lower plasma fibrinogen concentration.32 In contrast, heavy drinking can lead to alcohol‐induced hypertension,33 a hypercoagulable state, reduced cerebral blood flow, and atrial fibrillation. Patients with prior ischemic stroke or TIA who are heavy drinkers are recommended to reduce or eliminate alcohol consumption.34
Obesity (body mass index [BMI] > 30 kg/m2) is an independent risk factor for coronary heart disease and premature mortality.1 Obesity is also associated with several other risk factors, such as hypertension, diabetes, dyslipidemia, and obstructive sleep apnea.35 Indeed, obesity is often a symptom of metabolic syndrome, a combination of medical disorders that increases a person's risk for cardiovascular disease and diabetes (the International Diabetes Federation consensus worldwide definition of metabolic syndrome). All ischemic stroke or TIA patients who are overweight should maintain a goal BMI of 18.524.9 kg/m2 and a waist circumference of less than 35 inches, if female, or less than 40 inches, if male, because abdominal obesity is more related to stroke risk.36 Clinicians should recommend caloric restriction as the cornerstone of weight loss along with diets low in fat and cholesterol, increased physical activity, and behavioral counseling. A recent retrospective review suggests that moderately or highly active individuals have a lower risk of stroke or mortality than those whose physical activity is low.37 Physical activity exerts its beneficial effects by lowering blood pressure and weight, enhancing vasodilation, improving glucose tolerance, and promoting cardiovascular health.
Management of Modifiable Risk Factors
Hypertension
An estimated 73 million Americans have hypertension.1 Meta‐analyses of randomized trials confirm that lowering blood pressure is associated with a 30%40% reduction in stroke risk.38, 39 Because hypertension is a risk factor for many cardiovascular and cerebrovascular conditions, detailed evidence‐based recommendations for blood pressure screening and treatment of individuals with hypertension are summarized in the American Heart Association (AHA)/American Stroke Association (ASA) guidelines on the primary prevention of ischemic stroke.40 More detailed information is available in the Seventh Report of the Joint National Committee on Prevention, Detection, Evaluation, and Treatment of High Blood Pressure.41 Antihypertensive treatment is recommended for the prevention of recurrent stroke and other vascular events in individuals with ischemic stroke who are beyond the period immediately after an ischemic stroke regardless of whether they have a history of hypertension. Average blood pressure reduction of 10/5 mm Hg or maintenance of normal blood pressure (<120/80 mm Hg) is associated with benefits via diet, exercise, or medication.42 In a meta‐analysis of 7 trials that included a total of 15,527 patients, treatment with antihypertensive agents was associated with a 24% reduction in total stroke (P = .005), a 21% reduction in nonfatal stroke (P = .01), and a nonsignificant 24% reduction in fatal stroke (P = .08).42 The choice of specific drugs, discussed in the antihypertensive section of this article, and the target blood pressure should be individualized.
Diabetes
Diabetes affects 8% of the adult U.S. population, and several studies have reported that 15%33% of patients with ischemic stroke have diabetes.4345 The prevalence of diagnosed diabetes is projected to rise to 29 million by 2050 from the current 11 million, an increase of 165%.46 Diabetes is a critical independent risk factor for ischemic stroke. Rigorous control of blood pressure and lipid level is recommended in patients with diabetes, as well as in patients with hypertension and/or elevated cholesterol.5 Several agents used to treat diabetes, such as metformin and pioglitazone, improve glucose and lipid metabolism and exert antiatherogenic effects, aiding in the prevention of atherosclerosis.47 Glycemic control is recommended for patients with diabetes in order to prevent stroke and cardiovascular disease, but data are limited. Randomized trial data have shown that continual reduction of vascular events is correlated with control of glucose to normal levels.48
Elevated Cholesterol
The National Cholesterol Education Program (NCEP) Adult Treatment Panel III (ATP III) guidelines recommend that lifestyle modification, diet, and medications be used to manage ischemic stroke or TIA patients with elevated cholesterol, comorbid coronary artery disease, or evidence of atherosclerosis. The target goal for those with coronary heart disease or symptomatic atherosclerosis is low‐density lipoprotein (LDL) cholesterol below 100 mg/dL.49 The 2004 update to the NCEP guidelines proposed an LDL cholesterol target below 70 mg/dL in very high‐risk patients or in those with established CHD plus multiple major risk factors (especially diabetes), severe and poorly controlled risk factors (especially continued cigarette smoking), multiple risk factors of the metabolic syndrome (especially high triglycerides [ 200 mg/dL] plus nonhigh‐density lipoprotein [HDL] cholesterol 130 mg/dL with low HDL‐C [<40 mg/dL]), or patients with acute coronary syndromes.50
Medical Treatment
Antiplatelet therapy is the cornerstone of secondary prevention of stroke.51 Four antiplatelet drugs are availableaspirin, clopidogrel, dipyridamole, and ticlopidinethat are approved by the U.S. Food and Drug Administration for secondary prevention of stroke. The following sections review the evidence for the efficacy and safety of these drugs for the secondary prevention of stroke (Table 3).5268 The role of anticoagulation for secondary prevention of noncardioembolic stroke is also discussed (Table 4).6971
| Study | Population | Treatment | Duration | Risk reduction | Outcome |
|---|---|---|---|---|---|
| |||||
| ATC52 | 70,000 High‐risk patients | Antiplatelet (mostly aspirin 75325 mg/day), placebo | >1 month | RRR, 25% vs. placebo; ARR, 3.3% | Vascular events (nonfatal MI, nonfatal stroke, vascular death) |
| IST53 | 19,435 Patients with acute ischemic stroke | Heparin 5000 or 12,500 U/day, aspirin 300 mg/day, heparin + aspirin, placebo | 14 days | Risk of ischemic stroke, 2.8% with aspirin vs. 3.9% in nonaspirin groups | Nonfatal stroke |
| CAPRIE56 | 19,185 Patients with recent ischemic stroke, MI, or atherosclerotic PAD | Clopidogrel 75 mg/day, aspirin 325 mg/day | 13 years (mean, 1.91 years) | RRR, 8.7% clopidogrel vs. aspirin; ARR, 0.5% with clopidogrel | MI, stroke, or vascular death |
| MATCH58 | 7599 Patients with recent ischemic stroke or TIA plus 1 additional vascular risk factor | Clopidogrel 75 mg/day, clopidogrel + aspirin 75 mg/day | 1.5 years | RRR, 6.4% combination vs. aspirin (NS) | Ischemic stroke, MI, vascular death, hospitalization for ischemic event |
| CHARISMA59 | 15,603 Patients with established cardiovascular disease or multiple risk factors | Clopidogrel 75 mg/day + aspirin 75162 mg/day, aspirin alone | 2 years | RRR, 7% for combination vs. aspirin | MI, ischemic stroke, vascular death |
| ESPS‐261 | 6602 Patients with TIA or stroke in previous 3 months | Aspirin 50 mg/day, dipyridamole 200 mg twice daily, aspirin + dipyridamole, placebo | 2 years | RRR, 37% combination vs. placebo; ARR, 3.4% combination vs. aspirin | Secondary stroke |
| ESPRIT65 | 2739 Patients with TIA or minor ischemic stroke | Aspirin (30325 mg/day), aspirin + dipyridamole (200 mg twice daily), oral anticoagulants | 5 years | RRR, 20% combination vs. aspirin; ARR, 1% per year combination vs. aspirin | Vascular death, nonfatal MI, nonfatal stroke |
| Study | Key efficacy results | Key safety results |
|---|---|---|
| ||
| WARSS70 | No difference between warfarin and aspirin in prevention of recurrent ischemic stroke, death, or rate of major hemorrhage | Although safety profile of warfarin was similar to aspirin in this study, there is potential increased risk in a community setting |
| WASID71 | Warfarin provided no additional benefit over high‐dose aspirin (1300 mg/day) for prevention of recurrent stroke or death | Warfarin was associated with significantly higher rates of adverse events |
| ESPRIT69 | Oral anticoagulants did not provide additional benefit over aspirin for prevention of TIA or minor stroke of arterial origin | Oral anticoagulants were associated with increased incidence of bleeding complications |
Aspirin
The Antiplatelet Trialists' Collaboration (ATC) determined the effect of prolonged antiplatelet therapy on vascular events (nonfatal MI, nonfatal stroke, or vascular death) in various patient groups.52 This retrospective analysis included about 70,000 high‐risk patients and 30,000 low‐risk patients from 145 randomized trials that compared prolonged antiplatelet therapy versus control and about 10,000 patients from 29 randomized trials that directly compared different antiplatelet regimens. Overall, the typical reduction in risk for these vascular events was 25% (SD 2%) with antiplatelet therapy compared with placebo (P < .001). The most commonly used antiplatelet regimen was medium‐dose aspirin (75325 mg/day). The number needed to treat (NNT) was 30 (absolute risk reduction [ARR], 3.3%) for 2.5 years for prevention of vascular events with aspirin.
The International Stroke Trial was a large, randomized, open‐label trial of up to 14 days of antithrombotic therapy immediately following the onset of stroke.53 In this trial, 19,435 patients were randomly assigned to receive unfractionated heparin (5000 or 12,500 IU twice daily) or aspirin (300 mg/day), alone or in combination, or placebo. The primary outcomes were death within 14 days and death or dependency at 6 months. Heparin treatment was not associated with a significant reduction in deaths within 14 days (876 [9.0%] vs. 905 [9.3%] with placebo) or rate of death or dependency at 6 months (62.9% in both groups). Heparin treatment was associated with an increase in the rate of hemorrhagic stroke and a significant excess of 9 (SD 1) transfused or fatal extracranial bleeds per 1000. Aspirin was not associated with a significant reduction in death within 14 days (872 [9.0%] vs. 909 [9.4%]; however, at 6 months, there was a nonsignificant trend toward a smaller proportion of deaths or dependency in those receiving aspirin (62.2% vs. 63.5%; P = .07), a difference of 13 (SD 7) deaths per 1000. Patients receiving aspirin had significantly fewer recurrent ischemic strokes within 14 days (2.8% vs. 3.9%; P < .001) with no significant increase in hemorrhagic strokes (0.9% vs. 0.8%), resulting in a significant reduction in the incidence of death or nonfatal recurrent stroke (11.3% vs. 12.4%, P = .02). Aspirin alone was associated with an excess of 2 (SD 1) transfused or fatal extracranial bleeds per 1000. These data suggest that aspirin should be started immediately after an ischemic stroke. The NNT for 14 days was 91 to prevent 1 nonfatal stroke.53
The efficacy of a lower dose of aspirin (30 mg/day) was compared with that of aspirin 238 mg/day by the Dutch TIA Trial Study Group. The results showed that the lower dose of aspirin was as effective as the higher dose in the prevention of a recurrent vascular event, and patients taking the lower dose had fewer adverse events.54
However, aspirin resistance is an issue of ongoing research and debate. It is one of several explanations for the limited efficacy of aspirin in the stroke population. Results of one study showed that resistance to aspirin in platelet function was not uncommon, as measured by platelet aggregation 24 hours and 3, 6, and 12 months following initiation of aspirin therapy.55
Clopidogrel
The Clopidogrel Versus Aspirin in Patients at Risk of Ischemic Events (CAPRIE) study was a randomized, blinded trial designed to assess the relative efficacy of clopidogrel (75 mg/day) and aspirin (325 mg/day) in reducing the risk of the composite outcome of ischemic stroke, MI, or vascular death.56 In this study, 19,185 patients with atherosclerotic vascular disease (recent ischemic stroke, recent MI, or symptomatic peripheral arterial disease) were followed up for 1.91 years. Clopidogrel was associated with a 5.32% risk of the primary composite outcome compared with 5.83% with aspirin (relative risk reduction [RRR], 8.7%; 95% CI, 0.3%16.5%; P = .043). The NNT was 196 (ARR, 0.51%; 95% CI, 1024188; P = .043) for 1 year with clopidogrel instead of aspirin to prevent 1 patient from having a stroke, MI, or vascular death.56 Both treatments were associated with a similar safety profile. In a prespecified subgroup analysis among patients with a previous stroke, the risk reduction with clopidogrel was nonsignificant. However, in a post hoc analysis of patients with diabetes enrolled in the CAPRIE trial (n = 3866), clopidogrel was associated with a greater benefit than aspirin (ARR, 2.1%; P = .042) compared with no benefit in nondiabetic patients.57
In the Management of Atherothrombosis with Clopidogrel in High‐Risk Patients with TIA or Stroke (MATCH) trial, 7599 patients with a prior stroke or TIA plus additional risk factors received clopidogrel 75 mg/day or combination therapy of clopidogrel 75 mg/day plus aspirin 75 mg/day.58 The primary outcome was the composite of ischemic stroke, MI, vascular death, or rehospitalization secondary to ischemic events. There was no significant benefit of combination therapy compared with clopidogrel alone in reducing the primary outcome (RRR, 6.4%; 95% CI, 4.6%16.3%; ARR, 1%; 95% CI, 0.6%2.7%) or any of the secondary outcomes. The risk of major hemorrhage was significantly increased in the combination group compared with clopidogrel alone, with a significant 1.3% absolute increase in life‐threatening bleeding (95% CI, 0.6%1.9%). Although clopidogrel plus aspirin is recommended over aspirin for acute coronary syndromes, with most guidelines advocating up to 12 months of treatment, the results of the MATCH trial do not suggest a similar risk reduction for stroke patients.58
The Clopidogrel for High Atherothrombotic Risk and Ischemic Stabilization, Management, and Avoidance (CHARISMA) trial investigated the efficacy of dual antiplatelet therapy with clopidogrel (75 mg/day) plus low‐dose aspirin (75162 mg/day) versus low‐dose aspirin alone in reducing subsequent stroke and MI and death from cardiovascular causes in 15,603 men and women with clinically evident cardiovascular disease or multiple cardiovascular risk factors.59 At the end of follow‐up, there was no significant difference between treatments in the primary efficacy outcome (6.6% with clopidogrel plus aspirin vs. 7.3% with aspirin alone; relative risk [RR], 0.93; 95% CI, 0.831.05; P = .22). The combination was associated with a greater incidence of gastrointestinal bleeding (number needed to harm, 88; 95% CI, 59‐170) over 28 months. There was a nonsignificant increase in the risk of severe bleeding with clopidogrel in combination with aspirin compared with aspirin alone (RR, 1.2; 95% CI, 0.911.59; P = .20). Among patients with multiple risk factors (but no clinically evident cardiovascular disease), cardiovascular mortality was significantly higher with clopidogrel plus aspirin (3.9%) versus aspirin alone (2.2%; P = .01).59
Recently, a post hoc analysis of data from CHARISMA was performed to assess the possible benefit of dual antiplatelet therapy in a subgroup of patients (n = 9478) with a documented history of MI, ischemic stroke, or symptomatic peripheral arterial disease.60 In this subgroup, the rate of cardiovascular death, MI, or stroke was significantly lower in the clopidogrel‐plus‐aspirin group compared with aspirin alone (7.3% versus 8.8%; hazard ratio [HR], 0.83; 95% CI, 0.720.96; P = .01). There was no significant difference in severe bleeding between the clopidogrel‐plus‐aspirin and aspirin‐alone groups in this subpopulation (1.7% vs. 1.5%; HR, 1.12; 95% CI, 0.811.53; P = .50). However, there was a significantly higher increase in moderate bleeding with clopidogrel plus aspirin compared with aspirin alone (2.0% versus 1.3%; HR, 1.60; 95% CI, 1.162.20; P = .004). These data from the post hoc subanalysis suggest that a large proportion of patients with documented prior MI, ischemic stroke, or symptomatic peripheral artery disease may derive significant benefit from dual antiplatelet therapy with clopidogrel plus aspirin.60 These observations do not support the observations in the MATCH trial; therefore, additional studies are required to validate these findings.
Aspirin Plus Extended‐Release Dipyridamole
In the Second European Stroke Prevention Study (ESPS‐2), 6602 patients with prior stroke or TIA were assigned to low‐dose aspirin (25 mg twice daily) plus extended‐release dipyridamole (ER‐DP; 200 mg twice daily), aspirin alone, ER‐DP alone, or placebo.61 The extended‐release formulation of dipyridamole provided the benefits of continuous absorption and steady serum levels, resulting in a more consistent response in a narrow therapeutic index, especially in the elderly.62 The relative risk of stroke was reduced by 37% with the combination treatment versus 18% with low‐dose aspirin alone or 16% with dipyridamole alone. The combination treatment was also associated with a significant reduction (36%) in the risk of TIA compared with placebo (P < .001).61 Thus, significantly greater protective effects were seen with the combination therapy. Gastrointestinal bleeding was more common in patients receiving aspirin than in those receiving placebo or ER‐DP. No significant additional bleeding was observed with the aspirin‐plus‐ER‐DP combination compared with aspirin alone. The 3.4% ARR with aspirin plus ER‐DP compared with aspirin alone suggests an NNT of 34 for 2 years to prevent 1 recurrent stroke.63 In addition, the ESPS‐2 data meta‐analysis combined with 14 smaller trials of aspirin and dipyridamole was found to reduce the odds of nonfatal stroke by 23% relative to aspirin monotherapy.64
The European/Australasian Stroke Prevention in Reversible Ischaemia Trial (ESPRIT) was designed to assess the efficacy and safety of aspirin plus dipyridamole versus aspirin alone for secondary prevention of cardiovascular events in patients with ischemic stroke of presumed arterial origin.65 In this trial, 2739 patients were randomly assigned to aspirin (30325 mg/day) with or without dipyridamole (200 mg twice daily) within 6 months of TIA or minor stroke of presumed arterial origin. The primary outcome was a composite of death from all vascular causes, nonfatal stroke, nonfatal MI, or major bleeding complication, whichever occurred first. Median aspirin dose was 75 mg/day in both treatment groups, and ER‐DP was used by 83% of the patients in the combination group. The primary outcome occurred in 173 (13%) of patients receiving aspirin plus dipyridamole and in 216 (16%) of those receiving aspirin alone (HR, 0.8; 95% CI, 0.660.98; ARR, 1.0% per year, 95% CI, 0.1%1.8%). The NNT was 33 over 3.5 years to prevent 1 primary outcome with aspirin plus dipyridamole.65 These results, confirming those of ESPS‐2, strongly suggest that use of combination aspirin plus ER‐DP among patients with recent brain ischemia provides significant benefit compared with aspirin alone, without additional adverse effects.
Ticlopidine
Ticlopidine was found to be more effective than aspirin or placebo in risk reduction for recurrent stroke.66 However, the results of several studies showed that its use was associated with serious adverse effects, such as gastrointestinal events, neutropenia, skin rash, and thrombotic thrombocytopenic purpura.66, 67 The more recent African American Antiplatelet Stroke Prevention Study (AAASPS), which included more than 1800 stroke patients, showed that 250 mg of ticlopidine twice daily was no more effective than 325 mg of aspirin twice daily in an African American population.68 Overall, ticlopidine use for prevention of recurrent stroke is not supported by trial data, especially considering the substantial risk of adverse effects.
Anticoagulation
In an additional arm of the ESPRIT trial, 1068 patients were randomly assigned either anticoagulants (target international normalized ratio [INR], 2.03.0) or aspirin (30325 mg/day) within 6 months of a TIA or minor stroke of presumed arterial origin (Table 4).69 In a post hoc analysis, anticoagulants were also compared with the combination of aspirin and dipyridamole (200 mg twice daily). The primary outcome was the composite of death from all vascular causes, nonfatal stroke, nonfatal MI, or major bleeding complication, whichever occurred first. The primary event was observed in 20% of patients (106 of 523) receiving anticoagulants compared with 16% of patients (82 of 509) receiving aspirin plus dipyridamole (HR, 1.31; 95% CI, 0.981.75). The risk for major bleeding was at least 60% lower in patients receiving aspirin plus dipyridamole compared with anticoagulants (2% versus 9%; HR, 4.37; 95% CI, 2.278.43).69 These data confirm that the combination of aspirin plus dipyridamole is more effective than aspirin alone or warfarin for secondary prevention of stroke in patients with stroke of arterial origin.
The Warfarin Aspirin Recurrent Stroke Study (WARSS) compared warfarin (target INR, 1.42.8) versus aspirin (325 mg/day) for the prevention of recurrent ischemic stroke among 2206 patients with a noncardioembolic stroke (Table 4).70 Results of this randomized, double‐blind, multicenter trial showed no significant difference in the rates of recurrent stroke or death (warfarin, 17.8%; aspirin, 16.0%). Warfarin and aspirin were also associated with similar rates of major bleeding (2.2% and 1.5% per year, respectively). Although there were no differences between the 2 treatments, the potential increased risk of bleeding and cost of monitoring were considered in the recommendation of the AHA/ASA to choose antiplatelets over anticoagulants in the setting of noncardioembolic stroke.5
The Warfarin‐Aspirin Symptomatic Intracranial Disease (WASID) trial was designed to test the efficacy of warfarin (target INR, 2.03.0 [mean, 2.5]) versus aspirin among patients with >50% angiographically documented intracranial stenosis (Table 4).71 WASID was stopped prematurely because of warfarin's association with significantly higher rates of adverse events and evidence of no benefit over high‐dose aspirin (1300 mg/day). During a mean follow‐up of 1.8 years, adverse events in the 2 groups were death (aspirin, 4.3%, vs. warfarin, 9.7%; HR, 0.46; 95% CI, 0.230.90; P = .02), major hemorrhage (aspirin, 3.2%, vs. warfarin, 8.3%; HR, 0.39; 95% CI, 0.180.84; P = .01), and MI or sudden death (aspirin, 2.9%, vs. warfarin, 7.3%; HR, 0.40; 95% CI, 0.180.91; P = .02). The primary end point (ischemic stroke, brain hemorrhage, and nonstroke vascular death) occurred in approximately 22% of patients in both treatment arms (HR, 1.04; 95% CI, 0.731.48; P = .83).
Statins
Statins reduce the risk of stroke among patients with vascular disease, primarily through LDL cholesterol reduction.72 In the Heart Protection Study (N = 20,536), treatment with simvastatin 40 mg resulted in a 25% relative reduction in the first‐event rate for stroke (P < .0001) and a 28% reduction in presumed ischemic strokes (P < .0001) in patients with cerebrovascular disease, other occlusive vascular disease, or diabetes. No apparent difference in strokes was attributed to hemorrhage (0.5% vs. 0.5%; P = .8). Among patients with preexisting cerebrovascular disease (n = 3280), simvastatin therapy resulted in a 20% reduction in the rate of any major vascular event (P = .001).72
The Stroke Prevention by Aggressive Reduction in Cholesterol Levels (SPARCL) trial examined the effect of high‐dose atorvastatin specifically on secondary prevention of stroke in patients who had a recent history of stroke or TIA and LDL cholesterol levels of 100190 mg/dL (2.64.9 mmol/L) but no known coronary disease.73 In this double‐blind, randomized, placebo‐controlled study, 4731 patients received 80 mg of atorvastatin or placebo. The primary end point was fatal or nonfatal stroke. The mean LDL cholesterol level was 73 mg/dL (1.9 mmol/L) in patients receiving atorvastatin and 129 mg/dL (3.3 mmol/L) in patients receiving placebo. During a median follow‐up of 4.9 years, the incidence of recurrent stroke was lower among patients receiving atorvastatin, with 265 patients (11.2%) experiencing fatal or nonfatal stroke versus 311 (13.1%) of those receiving placebo (5‐year absolute reduction in risk, 2.2%; adjusted HR, 0.84; 95% CI, 0.710.99; P = .03; unadjusted P = .05). Eighty‐seven percent of patients in both treatment groups were receiving concomitant antiplatelet therapy, and 65% were receiving antihypertensives. Atorvastatin treatment resulted in a significant reduction in the risk of fatal stroke but not nonfatal stroke.
In SPARCL, the reduction in risk of fatal or nonfatal stroke, which included hemorrhagic stroke, was maintained despite increased incidence of hemorrhagic stroke with atorvastatin (55 of 273, 20%) versus placebo (33 of 307, 11%).73 The primary end point (fatal and nonfatal strokes) was inclusive of hemorrhagic stroke. Therefore, these results indicate that the benefit seen with atorvastatin therapy was greater than the potential risk of hemorrhagic stroke. High‐dose atorvastatin should be considered for routine secondary prevention on the basis of these findings.
Several studies have evaluated the efficacy of statin therapy in primary prevention of stroke; however, statins were not associated with a decrease in the risk of hemorrhagic stroke.72, 74, 75 Therefore, the potential risk of recurrent hemorrhagic stroke should be considered prior to initiating statin therapy. There is some evidence to suggest that statins can reduce stroke incidence, even in those patients with normal lipid levels, presumably via lowering blood pressure.76
Antihypertensives
High blood pressure is a strong risk factor for initial and recurrent stroke. It is well established that lowering blood pressure reduces the risk of both fatal and nonfatal stroke in a variety of patient groups. The Perindopril Protection Against Recurrent Stroke Study (PROGRESS) quantified the effects of treating hypertension on long‐term disability and dependency among patients with cerebrovascular disease.77 In this randomized, double‐blind, placebo‐controlled study, 6105 patients with a history of stroke or TIA were randomly assigned to receive perindopril 4 mg with or without a diuretic or to receive a placebo. Treatment with perindopril reduced the rate of disability, compared with placebo (19% vs. 22%; adjusted odds ratio, 0.76; 95% CI, 0.650.89; P < .001), primarily by reducing the incidence of recurrent stroke. The NNT for 4 years was 30 (95% CI, 1979) to prevent 1 case of long‐term disability. Interestingly, treatment reduced the risk of stroke in both hypertensive and nonhypertensive patients.78
SUMMARY OF GUIDELINES FOR SECONDARY PREVENTION OF STROKE
The AHA/ASA, American College of Chest Physicians (ACCP), and National Stroke Association (NSA) have developed and published practice guidelines for the management of TIA, with detailed information on secondary prevention of stroke.5, 79, 80 The key recommendations from these 3 organizations are summarized in Table 5 .5, 79, 80 This section summarizes the current guidelines regarding the use of antiplatelets and anticoagulants for the secondary prevention of stroke.
| AHA/ASA5 | NSA79 | ACCP80 | |
|---|---|---|---|
| |||
| Extracranial carotid artery disease | |||
| Hemodynamically significant stenosis 70%, or 50%69% depending on patient‐specific factors | |||
| ○ Carotid endarterectomy* | Class I, level A | Category 1 | No recommendations |
| Nonhemodynamically significant stenosis; stenosis <50% | |||
| ○ Carotid endarterectomy not indicated | Class III, level A | Category 1 | No recommendations |
| Atrial fibrillation | |||
| Long‐term anticoagulation (adjusted‐dose warfarin) | Class I, level A | Category 1 | Grade 1A |
| Aspirin (325 mg/day), if anticoagulants contraindicated | Class I, level A | Category 1 | Grade 1A |
| Mitral valve prolapse | |||
| Long‐term antiplatelet therapy | Class IIa, level C | Category 3 | Grade 1C+ |
| Prosthetic heart valves | |||
| Anticoagulants | Class I, level B | Category 1 | Grade 1C+ |
| Plus antiplatelets (if anticoagulants inadequate) | Class IIa, level B | Category 3 | Grade 1C |
Antiplatelets Versus Anticoagulants
The latest guidelines from the AHA/ASA and the ACCP recommend the use of anticoagulants (adjusted‐dose warfarin) for the secondary prevention of stroke in patients with persistent or paroxysmal atrial fibrillation and in those with artificial heart valves.5, 80 Warfarin therapy (INR, 2.03.0) is also a reasonable option for secondary prevention of stroke in TIA patients with dilated cardiomyopathy. Although warfarin may be prescribed to reduce cardioembolic events in this population, it is controversial whether there is benefit to the use of warfarin in patients with cardiac failure or a reduced left ventricular ejection fraction.81, 82 The Warfarin and Antiplatelet Therapy in Chronic Heart Failure Trial (WATCH) was initiated to evaluate warfarin versus aspirin 162 mg/day or clopidogrel 75 mg/day in patients with symptomatic heart failure in sinus rhythm with an ejection fraction less than or equal to 35%, but was terminated for poor recruitment.83 Results of observational studies have shown that treatment with warfarin may reduce the risk of recurrent embolism in those with rheumatic mitral valve disease.5, 84
In contrast, for patients with noncardioembolic stroke or TIA, antiplatelet agents are recommended for the secondary prevention of stroke and prevention of other cardiovascular events.5, 79, 80, 85
Currently, there are no data from prospective, randomized, controlled studies to support the use of intravenous heparin or warfarin in patients with carotid or vertebral dissection. The use of anticoagulation in patients with cerebral hemorrhage is influenced by several factors, such as type of hemorrhage, patient age, risk factors for recurrent hemorrhage, and indication for anticoagulation. The risk of recurrent hemorrhage must be weighed against the risk of ischemic cerebrovascular event. The AHA/ASA guidelines recommend that in patients with intracranial hemorrhage, subarachnoid hemorrhage, or subdural hematoma, all anticoagulants and antiplatelets should be discontinued during the acute period of at least 12 weeks posthemorrhage and that the anticoagulant effect should be reversed immediately with appropriate agents.5
FUTURE DEVELOPMENTS
One of the largest stroke prevention trials currently ongoing is the Prevention Regimen for Effectively avoiding Second Strokes (PRoFESS) study. The PRoFESS trial is a large (N = 20,333), randomized, double‐blind, placebo‐controlled, multinational study comparing the efficacy and safety of aspirin plus ER‐DP with that of clopidogrel and the efficacy of telmisartan versus placebo in the presence of background blood pressure treatments in preventing recurrent stroke.86 The primary outcome of the study is time to first recurrent stroke. Recently, the baseline demographics were published.86 The mean age of patients was 66.1 years at enrollment, 36% of patients were women, and mean time from event to randomization was 15 days (40% randomized within 10 days). Most participants had had a stroke of arterial origin (29% large vessel disease and 52% small vessel disease), whereas 2% had had a stroke due to cardioembolism and 18% due to other causes. These baseline data suggest that the trial involves a representative international population of patients with stroke. The PRoFESS trial will provide additional insight into the benefits of the combination of aspirin plus ER‐DP for secondary prevention of stroke in addition to providing direct comparison of efficacy with clopidogrel. The latest information on this and other ongoing stroke prevention trials can be accessed at
- ,,American Heart Association Statistics Committee and Stroke Statistics Subcommittee.Heart disease and stroke statistics—2008 update: a report from the American Heart Association Statistics Committee and Stroke Statistics Subcommittee.Circulation.2008;117:e25–e146.
- ,,,.Short‐term prognosis after emergency department diagnosis of TIA.JAMA.2000;284:2901–2906.
- ,,,,,.Very early risk of stroke after a first transient ischemic attack.Stroke.2003;34:e138–e140.
- ,,, et al.Incidence and short‐term prognosis of transient ischemic attack in a population‐based study.Stroke.2005;36:720–723.
- ,,, et al. American Heart Association/American Stroke Association Council on Stroke; Council on Cardiovascular Radiology and Intervention; American Academy of Neurology.Guidelines for prevention of stroke in patients with ischemic stroke or transient ischemic attack: a statement for healthcare professionals from the American Heart Association/American Stroke Association Council on Stroke. Co‐sponsored by the Council on Cardiovascular Radiology and Intervention: the American Academy of Neurology affirms the value of this guideline.Circulation.2006;113:e409–e449.
- .Stroke: early pathophysiology and treatment. Summary of the Fifth Annual Decade of the Brain Symposium.Stroke.1994;25:1877–1881.
- ,,, et al.Deficiency of both protein C and protein S in a family with ischemic strokes in young adults.Neurology.1994;44:1238–1240.
- ,,, et al.Classification of subtype of acute ischemic stroke: definitions for use in a multicenter clinical trial: TOAST: Trial of Org 10172 in Acute Stroke Treatment.Stroke.1993;24:35–41.
- ,.Cardioembolic stroke.Curr Atheroscler Rep.2006;8:310–316.
- ,.The proximal aorta: a source of stroke.Baillieres Clin Neurol.1995;4:207–220.
- ,,,,,.Early risk of stroke after transient ischemic attack: a systematic review and meta‐analysis.Arch Intern Med.2007;167:2417–2422.
- ,.Evaluation and management of transient ischemic attack: an important component of stroke prevention.Nat Clin Pract Cardiovasc Med.2007;4:310–318.
- ,,, et al.Validation and refinement of scores to predict very early stroke risk after transient ischaemic attack.Lancet.2007;369:283–292.
- Bader MK,Littlejohns LR, eds.AANN Core Curriculum for Neuroscience Nursing.4th ed.Philadelphia, PA:Saunders;2004.
- ,,, et al.Italian guidelines for stroke prevention and management: synthesis and recommendations. Stroke Prevention and Educational Awareness Diffusion.4th ed.Milan, Italy:Hyperphar Group SpA;2005. Available at: http://www.spread.it/SpreadEng/SPREAD_ENG_4thEd.pdf. Accessed January 29, 2008.
- ,,.Atrial fibrillation as an independent risk factor for stroke: the Framingham Study.Stroke.1991:22:983–988.
- ,,, et al.Transesophageal echocardiography is superior to transthoracic echocardiography in management of patients of any age with transient ischemic attack or stroke.Stroke.2006;37:2531–2534.
- .Cerebral vasculitis: imaging signs revisited.Neuroradiology.2007;49:471–479.
- ,,, et al.Intracranial aneurysms: role of multidetector CT angiography in diagnosis and endovascular therapy planning.Radiology.2007;244:532–540.
- ,,.Duplex ultrasound and magnetic resonance angiography compared with digital subtraction angiography in carotid artery stenosis: a systematic review.Stroke.2003;34:1324–1332.
- ,,, et al.Preoperative diagnosis of carotid artery stenosis: accuracy of noninvasive testing.Stroke.2002;33:2003–2008.
- ,,, et al.Neurologic complications of cerebral angiography.AJNR Am J Neuroradiol.1994;15:1401–1407.
- ,,,,,.Frequency of postoperative carotid duplex surveillance and type of closure: results from a randomized trial.J Vasc Surg.2000;32:1043–1051.
- ,,, et al.The Stroke Outcomes and Neuroimaging of Intracranial Atherosclerosis (SONIA) Trial Investigators. The Stroke Outcomes and Neuroimaging of Intracranial Atherosclerosis (SONIA) Trial.Neurology.2007;68:2099–2106.
- ,,,,.Cigarette smoking as a risk factor for stroke: the Framingham Study.JAMA.1988;259:1025–1029.
- ,.Meta‐analysis of relation between cigarette smoking and stroke.BMJ.1989;298:789–794.
- .Moderate alcohol consumption and stroke: the epidemiologic evidence.Stroke.1989;20:1611–1626.
- .Does alcohol prevent or cause stroke?Cerebrovascular Dis.1995;5:379.
- ,,, et al.Moderate alcohol intake, increased levels of high‐density lipoprotein and its subfractions, and decreased risk of myocardial infarction.N Engl J Med.1993;329:1829–1834.
- ,.Alcohol, lipids and lipoproteins. In:Zakhari S,Wassef M, eds.National Institutes of Health: Alcohol and the Cardiovascular System: Research Monograph. NIH publication 96‐4133.Washington, DC:National Institutes of Health;1996;31:369–391.
- ,,,,.Inhibition of platelet aggregation in whole blood by alcohol.Thromb Res.1995;78:107–115.
- ,,.Sustained inhibition of whole‐blood clot procoagulant activity by inhibition of thrombus‐associated factor Xa.Arterioscler Thromb Vasc Biol.1996;16:1285–1291.
- ,.Binge drinking and ambulatory blood pressure.Hypertension.1999;33:79–82.
- ,,, et al.Light‐to‐moderate alcohol consumption and risk of stroke among US male physicians.N Engl J Med.1999;341:1557–1564.
- .The influence of obesity on health (second of two parts).N Engl J Med.1974;291:226–232.
- ,,, et al.Northern Manhattan Stroke Study. Abdominal obesity and risk of ischemic stroke: the Northern Manhattan Stroke Study.Stroke.2003;34:1586–1592.
- ,,.Physical activity and stroke risk: a meta‐analysis.Stroke.2003;34:2475–2481.
- ,,,,,.Effects of an angiotensin‐converting‐enzyme inhibitor, ramipril, on cardiovascular events in high‐risk patients: the Heart Outcomes Prevention Evaluation Study Investigators.N Engl J Med.2000;342:145–153.
- ,,,.Blood pressure and stroke: an overview of published reviews.Stroke.2004;35:776–785.
- ,,, et al. American Heart Association; American Stroke Association Stroke Council.Primary prevention of ischemic stroke: a guideline from the American Heart Association/American Stroke Association Stroke Council. Cosponsored by the Atherosclerotic Peripheral Vascular Disease Interdisciplinary Working Group; Cardiovascular Nursing Council; Clinical Cardiology Council; Nutrition, Physical Activity, and Metabolism Council; and the Quality of Care and Outcomes Research Interdisciplinary Working Group.Circulation.2006;113:e873–e923.
- ,,, et al.National Heart, Lung, and Blood Institute Joint National Committee on Prevention, Detection, Evaluation, and Treatment of High Blood Pressure; National High Blood Pressure Education Program Coordinating Committee. Seventh Report of the Joint National Committee on Prevention, Detection, Evaluation, and Treatment of High Blood Pressure: the JNC 7 Report.JAMA.2003;289:2560–2571.
- ,,.Blood pressure reduction and secondary prevention of stroke and other vascular events: a systematic review.Stroke.2003;34:2741–2748.
- American Diabetes Association.ADA clinical practice recommendations.Diabetes Care.2004;27:S1–S143.
- ,,,,.Stroke patterns, etiology, and prognosis in patients with diabetes mellitus.Neurology.2004;62:1558–1562.
- ,,, et al.Incidence rates of first‐ever ischemic stroke subtypes among blacks: a population‐based study.Stroke.1999;30:2517–2522.
- ,,, et al.Projection of diabetes burden through 2050: impact of changing demography and disease prevalence in the US.Diabetes Care.2001;24:1936–1940.
- ,,.Prevention and treatment for development and progression of diabetic macroangiopathy with pioglitazone and metformin [in Japanese].Nippon Rinsho.2006;64:2119–2125.
- American Diabetes Association.Standards of medical care for patients with diabetes mellitus.Diabetes Care.2003;26:S33–S50.
- Executive Summary of the Third Report of the National Cholesterol Education Program (NCEP) Expert Panel on Detection, Evaluation, and Treatment of High Blood Cholesterol in Adults (Adult Treatment Panel III).JAMA.2001;285:2486–2497.
- ,,, et al.Implications of recent clinical trials for the National Cholesterol Education Program Adult Treatment Panel III Guidelines.Circulation.2004;110:227–239.
- Antithrombotic Trialists' Collaboration.Collaborative meta‐analysis of randomised trials of antiplatelet therapy for prevention of death, myocardial infarction, and stroke in high‐risk patients.BMJ.2002;324:71–86.
- Antiplatelet Trialists' Collaboration.Collaborative overview of randomised trials of antiplatelet therapy—I: prevention of death, myocardial infarction, and stroke by prolonged antiplatelet therapy in various categories of patients.BMJ.1994;308:81–106.
- International Stroke Trial Collaborative Group.The International Stroke Trial (IST): a randomised trial of aspirin, subcutaneous heparin, both, or neither among 19,435 patients with acute ischaemic stroke.Lancet.1997;349:1569–1581.
- A comparison of two doses of aspirin (30 mg vs. 283 mg a day) in patients after a transient ischemic attack or minor ischemic stroke. The Dutch TIA Trial Study Group.N Engl J Med.1991;325:1261–1266.
- ,,, et al.Aspirin resistance in secondary stroke prevention.Acta Neurol Scand.2006;113:31–35.
- CAPRIE Steering Committee.A randomised, blinded trial of clopidogrel versus aspirin in patients at risk of ischaemic events (CAPRIE).Lancet.1996;348:1329–1339.
- ,,,,,.Amplified benefit of clopidogrel versus aspirin in patients with diabetes mellitus.Am J Cardiol.2002;90:625–628.
- ,,, et al.Aspirin and clopidogrel compared with clopidogrel alone after recent ischaemic stroke or transient ischaemic attack in high‐risk patients (MATCH): randomised, double‐blind, placebo‐controlled trial.Lancet.2004;364:331–337.
- ,,, et al.Clopidogrel and aspirin versus aspirin alone for the prevention of atherothrombotic events.N Engl J Med.2006;354:1706–1717.
- ,,, et al.;CHARISMA Investigators. Patients with prior myocardial infarction, stroke, or symptomatic peripheral arterial disease in the CHARISMA trial.J Am Coll Cardiol.2007;49:1982–1988.
- ,,, et al.European Stroke Prevention Study 2. Dipyridamole and acetylsalicylic acid in the secondary prevention of stroke.J Neurol Sci.1996;143:1–13.
- ,,,,.Dipyridamole bioavailability in subjects with reduced gastric acidityJ Clin Pharmacol.2005;45:845–850.
- Thrombosis Interest Group of Canada. Practice guidelines [on‐line monograph]. Updated yearly. Available at: http://www.tigc.org/eguidelines/strokeprevention.htm. Accessed May 16, 2001.
- ,.Dipyridamole plus aspirin in cerebrovascular disease.Arch Neurol.1999;566:1087–1092.
- ESPRIT Study Group.Aspirin plus dipyridamole versus aspirin alone after cerebral ischaemia of arterial origin (ESPRIT): randomised controlled trial.Lancet.2006;367:1665–1673.
- ,,, et al.A randomized trial comparing ticlopidine hydrochloride with aspirin for the prevention of stroke in high‐risk patients. Ticlopidine Aspirin Stroke Study Group.N Engl J Med.1989;321:501–507.
- ,,,,,.Thrombotic thrombocytopenic purpura associated with ticlopidine: a review of 60 cases.Ann Intern Med.1998;128:541–544.
- ,,, et al.;African American Antiplatelet Stroke Prevention Study Investigators. Aspirin and ticlopidine for prevention of recurrent stroke in black patients: a randomized trial.JAMA.2003;289:2947–2957.
- ;ESPRIT Study Group.Medium intensity oral anticoagulants versus aspirin after cerebral ischaemia of arterial origin (ESPRIT): a randomised controlled trial.Lancet Neurol.2007;6:115–124.
- ,,, et al. for the Warfarin‐Aspirin Recurrent Stroke Study Group.A comparison of warfarin and aspirin for the prevention of recurrent ischemic stroke.N Engl J Med.2001;345:1444–1451.
- ,,, et al.Comparison of warfarin and aspirin for symptomatic intracranial arterial stenosis.N Engl J Med.2005;352:1305–1316.
- ,,, et al. Heart Protection Study Collaborative Group.Effects of cholesterol‐lowering with simvastatin on stroke and other major vascular events in 20536 people with cerebrovascular disease or other high‐risk conditions.Lancet.2004;363:757–767.
- ,,, et al.Stroke Prevention by Aggressive Reduction in Cholesterol Levels (SPARCL) Investigators. High‐dose atorvastatin after stroke or transient ischemic attack.N Engl J Med.2006;355:549–559.
- ,,, et al.Pravastatin in Elderly Individuals at Risk of Vascular Disease (PROSPER): a randomised controlled trial.Lancet.2002;360:1623–1630.
- Heart Protection Study Collaborative Group.MRC/BHF Heart Protection Study of cholesterol lowering with simvastatin in 20,536 high‐risk individuals: a randomised placebo‐controlled trial.Lancet.2002;360:7–22.
- ,,,.Analysis of antihypertensive effects of statins.Curr Hypertens Rep.2007;9:175–183.
- Perindopril Protection Against Recurrent Stroke Study PROGRESS Collaborative Group.Effects of a perindopril‐based blood pressure‐lowering regimen on disability and dependency in 6105 patients with cerebrovascular disease.Stroke.2003;34:2333–2338.
- PROGRESS Collaborative Group.Randomised trial of a perindopril‐based blood‐pressure‐lowering regimen among 6,105 individuals with previous stroke or transient ischaemic attack.Lancet.2001;358:1033–1041.
- ,,, et al.National Stroke Association guidelines for the management of transient ischemic attacks.Ann Neurol.2006;60:301–313.
- ,,,,.Antithrombotic and thrombolytic therapy for ischemic stroke: the Seventh ACCP Conference on Antithrombotic and Thrombolytic Therapy.Chest.2004;126:483S–512S.
- .A plea for a clinical trial of anticoagulation in dilated cardiomyopathy.Am J Cardiol.1990;65:914–915.
- .Antithrombotics for left‐ventricular impairment?Lancet.1998;351:1904.
- ,,, et al.Ventricular dysfunction and the risk of stroke after myocardial infarction.N Engl J Med.1997;336:251–257.
- ,,,,.Usefulness of anticoagulant therapy in the prevention of embolic complications of atrial fibrillation.Am Heart J.1986;112:1039–1043.
- ,,, et al.Guidelines for the early management of adults with ischemic stroke: a guideline from the American Heart Association/American Stroke Association Stroke Council, Clinical Cardiology Council, Cardiovascular Radiology and Intervention Council, and the Atherosclerotic Peripheral Vascular Disease and Quality of Care Outcomes in Research Interdisciplinary Working Groups. The American Academy of Neurology affirms the value of this guideline as an educational tool for neurologists.Stroke.2007;38:1655–1711.
- ,,;Steering Committee; PRoFESS Study Group.Rationale, design and baseline data of a randomized, double‐blind, controlled trial comparing two antithrombotic regimens (a fixed‐dose combination of extended‐release dipyridamole plus asa with clopidogrel) and telmisartan versus placebo in patients with strokes. The Prevention Regimen for Effectively Avoiding Second Strokes Trial (PRoFESS).Cerebrovasc Dis.2007;23:368–380.
Stroke is a leading cause of disability and the third leading cause of death in the United States.1 Transient ischemic attack (TIA) carries a substantial short‐term risk for stroke.1 The risk of stroke following TIA ranges from 2% to 5% within 48 hours, is 10.5% within 90 days, and ranges from 24% to 29% within 5 years.24 Among the 780,000 new or recurrent strokes that occur each year, 180,000 are recurrent attacks.1, 5 Several evidence‐based guidelines for secondary prevention of stroke are available. To reduce variability in the assessment, diagnostic evaluation, and treatment of patients with TIA in actual clinical practice and to simplify the management of TIA or ischemic stroke, this article will review the available guidelines for secondary prevention of stroke and the data from clinical trials that support these guidelines.
PATHOPHYSIOLOGY AND SUBTYPES/CLASSIFICATION
Stroke is broadly classified as hemorrhagic or ischemic stroke. Hemorrhagic stroke, including intraparenchymal and subarachnoid hemorrhage, accounts for 13% of strokes and ischemic stroke for 87%.1 Ischemic stroke is caused by inadequate cerebral blood flow as a result of either stenosis or occlusion of the vessels supplying the brain.6 The average rate of cerebral blood flow is 50 mL/100 g a minute. Flow rates below 2025 mL/100 g a minute are usually associated with cerebral impairment, and rates below 10 mL/100 g a minute are associated with irreversible brain damage.
Approximately 20% of ischemic strokes are of cardioembolic origin; 25% are a result of atherosclerotic cerebrovascular disease; 20% are a result of penetrating artery disease (lacunes); 5% are due to other causes, such as hypercoagulable states, including protein S and C deficiency, sickle cell disease, and various types of vasculitis; and 30% are cryptogenic.7, 8 Cardioembolic stroke can be a manifestation of atrial fibrillation, valvular disease, ventricular thrombi, and other cardiac conditions.9 Large arteries, such as the carotid arteries and the proximal aorta, are a source of atherogenic emboli.10 Atherosclerotic plaques in the arteries may narrow the lumen of the blood vessel or produce emboli, which results in occlusion of the distal arteries, causing a stroke.
RISK FACTORS
Several risk factors, both nonmodifiable and modifiable, predispose individuals to stroke. Nonmodifiable risk factors include age, sex, race, and family or personal history of stroke or myocardial infarction (MI).1, 5 After the age of 55, the stroke rate doubles for every 10‐year increase in age.1 African Americans have a 50% greater risk of death due to stroke than whites.1 The appropriate management of modifiable risk factors can significantly reduce the risk of recurrent stroke and improve survival. The many modifiable factors include hypertension, heart disease, smoking, diabetes, atrial fibrillation, dyslipidemia, obesity, and alcohol abuse.1, 5 The mechanisms of how these factors increase the risk for stroke and management of these factors are discussed later in this article. It is important to educate individuals, particularly those who also have nonmodifiable risk factors, about modifiable risk factors in order to enable early and appropriate intervention.
DIAGNOSIS
Most patients with TIA are asymptomatic when they present to the emergency department (ED). The risk of stroke following an episode of TIA has been found to be 3.5% within 48 hours in a meta‐analysis based on a random effects model;11 therefore, it is critical to quickly identify patients with high short‐term risk for recurrent stroke.12 The ABCD2 score was recently validated in TIA patients to estimate the near‐term risk of completed stroke.13 Patients with a score of 03 on the ABCD2 are at low risk, those with a score of 4 or 5 are at moderate risk, and those with a score 6 or 7 are at severe risk for recurrent stroke (Table 1).13 Risk scores, although highly predictive, should complement clinical judgment in the assessment of individual stroke risk.
| Risk factors | Points |
|---|---|
| |
| AAge > 60 years | 1 |
| BBlood pressure | |
| Systolic 140 mm Hg | 1 |
| Diastolic 90 mm Hg | 1 |
| CClinical features | |
| Unilateral weakness | 2 |
| Speech impairment without weakness | 1 |
| DDuration of symptoms | |
| 1059 minutes | 1 |
| 60 minutes | 2 |
| DDiabetes | 1 |
Currently, there are no specific guidelines for the diagnostic evaluation of patients with suspected TIA. However, the following approach, including elements of acute evaluation for both stroke and TIA as well as risk factor identification that may aid in choosing specifics of secondary prevention, may be adopted in the management of patients with TIA (Table 2).14, 15
| Diagnostic test | Indication |
|---|---|
| |
| Acute phase | |
| CT brain (noncontrast) | Rule out intracerebral or subarachnoid hemorrhage and may show early signs of stroke; if clinically suspected subarachnoid hemorrhage, lumbar puncture should be performed |
| CT angiogram with CT perfusion | Visualize occluded vessel and identify infarcted versus at‐risk tissue |
| Chest radiograph | Potentially identify aortic aneurysm or lung masses prone to hemorrhage |
| Finger stick (glucometer testing) | Rule out hypoglycemia as etiology; follow‐up glucose screening may identify diabetes as a risk factor |
| Basic metabolic panel | Rule out metabolic problems leading to symptomatology and renal disease, which may prevent contrast imaging |
| Coagulation profiles | Rule out preexisting coagulopathy that would make patient prone to hemorrhage or ineligible for some therapies, including tissue plasminogen activator |
| Stool guaiac | Rule out gastrointestinal bleed, which may make patient ineligible for some therapies |
| Electrocardiogram | Rule out concurrent myocardial infarction or cardiac arrhythmia |
| Postacute phase | |
| MRI/MRA: diffusion and perfusion studies | Quantify region of infarcted tissue and affected arterymay be useful in acute phase if available on an expedited basis |
| Transthoracic/transesophageal echocardiogram | Rule out cardioembolic stroke etiology (ie, mural thrombus, patent foramen ovale, valvular disease) |
| Carotid duplex | Rule out carotid stenosis as stroke risk factor (secondary prevention) |
| Lipid profile | Rule out hyperlipidemia as stroke risk factor (secondary prevention) |
| Blood tests: antinuclear antibodies, rapid plasma reagin test, thyroid panel, antiphospholipid antibodies; other tests for hypercoagulability | Rule out other reasons for hypercoagulable state in the appropriate patient population |
A computed tomography (CT) scan of the head or magnetic resonance imaging (MRI) of the brain should be performed as soon as possible to distinguish between ischemic and hemorrhagic stroke, eliminate other pathologies that mimic TIA or stroke, and guide selection of the appropriate treatment approach. CT scanning is often the best initial imaging choice because it reliably excludes intracranial hemorrhage and is rapidly available in most settings. For those for whom the diagnosis is uncertain, diffusion‐weighted MRI may be more helpful. Because of the time issues surrounding the use of tissue plasminogen activator, waiting for an MRI may not always be the best choice, although some institutions are now able to provide quick access to MRI imaging. Imaging can detect silent cerebral infarcts associated with an increased risk of stroke. In patients with previous TIA and/or stroke, MRI is more sensitive than CT in detecting small, old infarcts (although most are seen on CT) and in visualizing the posterior fossa (cerebellum and brain stem).12
Holter electrocardiography or inpatient telemetry monitoring can be performed to identify atrial fibrillation, a known risk factor for stroke or TIA.16 Transesophageal echocardiography (TEE) has been reported to be more sensitive than transthoracic echocardiography (TTE) for detecting cardioembolic sources of TIA or ischemic stroke across multiple age groups.17 TEE has several advantages over TTE, such as the creation of clearer images of the aorta, the pulmonary artery, valves of the heart, both atria, the atrial septum, and the left atrial appendage.
Cerebral angiography is indicated in several instances, including in children or young patients with ischemic stroke because vascular abnormalities and cerebral vasculitis are relatively more common causes in patients in these age groups.18 Furthermore, in centers in which intra‐arterial procedures are frequently performed, angiography is indicated to confirm the suspicion of posterior circulation vessel (ie, vertebral or basilar artery) occlusion prior to intervention. Angiography has the highest diagnostic validity compared with other noninvasive techniques and may be indicated if cerebral vasculitis or nonatherosclerotic disease of extracranial arteries (eg, dissections, vascular malformations) is suspected. Angiography of intracranial vessels is the gold standard for the study of cerebral aneurysms and is recommended in patients with subarachnoid hemorrhage, but there is evidence that magnetic resonance angiography (MRA) and digital subtraction angiography have better discriminatory ability in the 70%99% range of stenosis compared with duplex ultrasonography (DUS) for determining candidacy for carotid endarterectomy (CEA) or stenting.19, 20
The MRA and CT angiography (CTA) are generally used to visualize the intracranial and extracranialboth anterior and posteriorcerebral circulation. The use of MRA or CTA to image cerebral circulation has generally supplanted the use of carotid and transcranial ultrasonography and obviated the need for catheter angiography in investigating the etiology of most ischemic strokes and TIAs. The degree of carotid stenosis should be primarily estimated using noninvasive techniques (DUS, MRA, CTA).21 Duplex ultrasonography is recommended after CEA 6 months and every 1 2 years after the procedure in order to monitor recurrent stenosis.22 Angiography should be performed when the results of noninvasive examinations are discordant; when significant atherosclerotic disease of intracranial arteries is suspected, especially in vertebrobasilar arteries; or when MRA or CT angiography provides technically poor images.23
Transcranial Doppler ultrasonography and color Doppler ultrasound (TCD) are used to evaluate the intracranial vessels and may provide additional information on patency of cerebral vessels, recanalization, and collateral pathways. Compared with the gold standard of conventional angiography, TCD has a positive predictive value of 36% and a negative predictive value of 86% for a diagnosis of intracranial stenosis.24 This technique also can be used as a complementary examination in patients undergoing CEA in order to aid in preoperative evaluation and intraoperative monitoring of blood flow in the territory of the operated artery.12
TREATMENT
The management of ischemic stroke or TIA includes lifestyle modifications, reduction of modifiable risk factors, and appropriate surgical and medical intervention.12
Lifestyle Modifications
There is strong evidence for smoking as an independent risk factor for ischemic stroke, irrespective of age, sex, or ethnic background.25 Among smokers, the risk for ischemic stroke is twice that of nonsmokers.26 All patients with previous ischemic stroke or TIA are strongly encouraged not to smoke and to avoid smoke in their environments as much as possible. These patients are also recommended to obtain counseling and smoking cessation medications as needed; these interventions should be started at the time of hospital admission.
The relationship of alcohol consumption to cardiovascular risk is controversial because most studies suggest a J‐shaped association between alcohol and ischemic stroke: a protective effect forthose who consume light‐to‐moderate amounts of alcohol (<60 g ethanol/day)27 and elevated stroke risk for heavy drinkers.28 The protective effect of moderate drinking may be related to an increase in high‐density lipoprotein cholesterol,29, 30 reduced platelet aggregation,31 and lower plasma fibrinogen concentration.32 In contrast, heavy drinking can lead to alcohol‐induced hypertension,33 a hypercoagulable state, reduced cerebral blood flow, and atrial fibrillation. Patients with prior ischemic stroke or TIA who are heavy drinkers are recommended to reduce or eliminate alcohol consumption.34
Obesity (body mass index [BMI] > 30 kg/m2) is an independent risk factor for coronary heart disease and premature mortality.1 Obesity is also associated with several other risk factors, such as hypertension, diabetes, dyslipidemia, and obstructive sleep apnea.35 Indeed, obesity is often a symptom of metabolic syndrome, a combination of medical disorders that increases a person's risk for cardiovascular disease and diabetes (the International Diabetes Federation consensus worldwide definition of metabolic syndrome). All ischemic stroke or TIA patients who are overweight should maintain a goal BMI of 18.524.9 kg/m2 and a waist circumference of less than 35 inches, if female, or less than 40 inches, if male, because abdominal obesity is more related to stroke risk.36 Clinicians should recommend caloric restriction as the cornerstone of weight loss along with diets low in fat and cholesterol, increased physical activity, and behavioral counseling. A recent retrospective review suggests that moderately or highly active individuals have a lower risk of stroke or mortality than those whose physical activity is low.37 Physical activity exerts its beneficial effects by lowering blood pressure and weight, enhancing vasodilation, improving glucose tolerance, and promoting cardiovascular health.
Management of Modifiable Risk Factors
Hypertension
An estimated 73 million Americans have hypertension.1 Meta‐analyses of randomized trials confirm that lowering blood pressure is associated with a 30%40% reduction in stroke risk.38, 39 Because hypertension is a risk factor for many cardiovascular and cerebrovascular conditions, detailed evidence‐based recommendations for blood pressure screening and treatment of individuals with hypertension are summarized in the American Heart Association (AHA)/American Stroke Association (ASA) guidelines on the primary prevention of ischemic stroke.40 More detailed information is available in the Seventh Report of the Joint National Committee on Prevention, Detection, Evaluation, and Treatment of High Blood Pressure.41 Antihypertensive treatment is recommended for the prevention of recurrent stroke and other vascular events in individuals with ischemic stroke who are beyond the period immediately after an ischemic stroke regardless of whether they have a history of hypertension. Average blood pressure reduction of 10/5 mm Hg or maintenance of normal blood pressure (<120/80 mm Hg) is associated with benefits via diet, exercise, or medication.42 In a meta‐analysis of 7 trials that included a total of 15,527 patients, treatment with antihypertensive agents was associated with a 24% reduction in total stroke (P = .005), a 21% reduction in nonfatal stroke (P = .01), and a nonsignificant 24% reduction in fatal stroke (P = .08).42 The choice of specific drugs, discussed in the antihypertensive section of this article, and the target blood pressure should be individualized.
Diabetes
Diabetes affects 8% of the adult U.S. population, and several studies have reported that 15%33% of patients with ischemic stroke have diabetes.4345 The prevalence of diagnosed diabetes is projected to rise to 29 million by 2050 from the current 11 million, an increase of 165%.46 Diabetes is a critical independent risk factor for ischemic stroke. Rigorous control of blood pressure and lipid level is recommended in patients with diabetes, as well as in patients with hypertension and/or elevated cholesterol.5 Several agents used to treat diabetes, such as metformin and pioglitazone, improve glucose and lipid metabolism and exert antiatherogenic effects, aiding in the prevention of atherosclerosis.47 Glycemic control is recommended for patients with diabetes in order to prevent stroke and cardiovascular disease, but data are limited. Randomized trial data have shown that continual reduction of vascular events is correlated with control of glucose to normal levels.48
Elevated Cholesterol
The National Cholesterol Education Program (NCEP) Adult Treatment Panel III (ATP III) guidelines recommend that lifestyle modification, diet, and medications be used to manage ischemic stroke or TIA patients with elevated cholesterol, comorbid coronary artery disease, or evidence of atherosclerosis. The target goal for those with coronary heart disease or symptomatic atherosclerosis is low‐density lipoprotein (LDL) cholesterol below 100 mg/dL.49 The 2004 update to the NCEP guidelines proposed an LDL cholesterol target below 70 mg/dL in very high‐risk patients or in those with established CHD plus multiple major risk factors (especially diabetes), severe and poorly controlled risk factors (especially continued cigarette smoking), multiple risk factors of the metabolic syndrome (especially high triglycerides [ 200 mg/dL] plus nonhigh‐density lipoprotein [HDL] cholesterol 130 mg/dL with low HDL‐C [<40 mg/dL]), or patients with acute coronary syndromes.50
Medical Treatment
Antiplatelet therapy is the cornerstone of secondary prevention of stroke.51 Four antiplatelet drugs are availableaspirin, clopidogrel, dipyridamole, and ticlopidinethat are approved by the U.S. Food and Drug Administration for secondary prevention of stroke. The following sections review the evidence for the efficacy and safety of these drugs for the secondary prevention of stroke (Table 3).5268 The role of anticoagulation for secondary prevention of noncardioembolic stroke is also discussed (Table 4).6971
| Study | Population | Treatment | Duration | Risk reduction | Outcome |
|---|---|---|---|---|---|
| |||||
| ATC52 | 70,000 High‐risk patients | Antiplatelet (mostly aspirin 75325 mg/day), placebo | >1 month | RRR, 25% vs. placebo; ARR, 3.3% | Vascular events (nonfatal MI, nonfatal stroke, vascular death) |
| IST53 | 19,435 Patients with acute ischemic stroke | Heparin 5000 or 12,500 U/day, aspirin 300 mg/day, heparin + aspirin, placebo | 14 days | Risk of ischemic stroke, 2.8% with aspirin vs. 3.9% in nonaspirin groups | Nonfatal stroke |
| CAPRIE56 | 19,185 Patients with recent ischemic stroke, MI, or atherosclerotic PAD | Clopidogrel 75 mg/day, aspirin 325 mg/day | 13 years (mean, 1.91 years) | RRR, 8.7% clopidogrel vs. aspirin; ARR, 0.5% with clopidogrel | MI, stroke, or vascular death |
| MATCH58 | 7599 Patients with recent ischemic stroke or TIA plus 1 additional vascular risk factor | Clopidogrel 75 mg/day, clopidogrel + aspirin 75 mg/day | 1.5 years | RRR, 6.4% combination vs. aspirin (NS) | Ischemic stroke, MI, vascular death, hospitalization for ischemic event |
| CHARISMA59 | 15,603 Patients with established cardiovascular disease or multiple risk factors | Clopidogrel 75 mg/day + aspirin 75162 mg/day, aspirin alone | 2 years | RRR, 7% for combination vs. aspirin | MI, ischemic stroke, vascular death |
| ESPS‐261 | 6602 Patients with TIA or stroke in previous 3 months | Aspirin 50 mg/day, dipyridamole 200 mg twice daily, aspirin + dipyridamole, placebo | 2 years | RRR, 37% combination vs. placebo; ARR, 3.4% combination vs. aspirin | Secondary stroke |
| ESPRIT65 | 2739 Patients with TIA or minor ischemic stroke | Aspirin (30325 mg/day), aspirin + dipyridamole (200 mg twice daily), oral anticoagulants | 5 years | RRR, 20% combination vs. aspirin; ARR, 1% per year combination vs. aspirin | Vascular death, nonfatal MI, nonfatal stroke |
| Study | Key efficacy results | Key safety results |
|---|---|---|
| ||
| WARSS70 | No difference between warfarin and aspirin in prevention of recurrent ischemic stroke, death, or rate of major hemorrhage | Although safety profile of warfarin was similar to aspirin in this study, there is potential increased risk in a community setting |
| WASID71 | Warfarin provided no additional benefit over high‐dose aspirin (1300 mg/day) for prevention of recurrent stroke or death | Warfarin was associated with significantly higher rates of adverse events |
| ESPRIT69 | Oral anticoagulants did not provide additional benefit over aspirin for prevention of TIA or minor stroke of arterial origin | Oral anticoagulants were associated with increased incidence of bleeding complications |
Aspirin
The Antiplatelet Trialists' Collaboration (ATC) determined the effect of prolonged antiplatelet therapy on vascular events (nonfatal MI, nonfatal stroke, or vascular death) in various patient groups.52 This retrospective analysis included about 70,000 high‐risk patients and 30,000 low‐risk patients from 145 randomized trials that compared prolonged antiplatelet therapy versus control and about 10,000 patients from 29 randomized trials that directly compared different antiplatelet regimens. Overall, the typical reduction in risk for these vascular events was 25% (SD 2%) with antiplatelet therapy compared with placebo (P < .001). The most commonly used antiplatelet regimen was medium‐dose aspirin (75325 mg/day). The number needed to treat (NNT) was 30 (absolute risk reduction [ARR], 3.3%) for 2.5 years for prevention of vascular events with aspirin.
The International Stroke Trial was a large, randomized, open‐label trial of up to 14 days of antithrombotic therapy immediately following the onset of stroke.53 In this trial, 19,435 patients were randomly assigned to receive unfractionated heparin (5000 or 12,500 IU twice daily) or aspirin (300 mg/day), alone or in combination, or placebo. The primary outcomes were death within 14 days and death or dependency at 6 months. Heparin treatment was not associated with a significant reduction in deaths within 14 days (876 [9.0%] vs. 905 [9.3%] with placebo) or rate of death or dependency at 6 months (62.9% in both groups). Heparin treatment was associated with an increase in the rate of hemorrhagic stroke and a significant excess of 9 (SD 1) transfused or fatal extracranial bleeds per 1000. Aspirin was not associated with a significant reduction in death within 14 days (872 [9.0%] vs. 909 [9.4%]; however, at 6 months, there was a nonsignificant trend toward a smaller proportion of deaths or dependency in those receiving aspirin (62.2% vs. 63.5%; P = .07), a difference of 13 (SD 7) deaths per 1000. Patients receiving aspirin had significantly fewer recurrent ischemic strokes within 14 days (2.8% vs. 3.9%; P < .001) with no significant increase in hemorrhagic strokes (0.9% vs. 0.8%), resulting in a significant reduction in the incidence of death or nonfatal recurrent stroke (11.3% vs. 12.4%, P = .02). Aspirin alone was associated with an excess of 2 (SD 1) transfused or fatal extracranial bleeds per 1000. These data suggest that aspirin should be started immediately after an ischemic stroke. The NNT for 14 days was 91 to prevent 1 nonfatal stroke.53
The efficacy of a lower dose of aspirin (30 mg/day) was compared with that of aspirin 238 mg/day by the Dutch TIA Trial Study Group. The results showed that the lower dose of aspirin was as effective as the higher dose in the prevention of a recurrent vascular event, and patients taking the lower dose had fewer adverse events.54
However, aspirin resistance is an issue of ongoing research and debate. It is one of several explanations for the limited efficacy of aspirin in the stroke population. Results of one study showed that resistance to aspirin in platelet function was not uncommon, as measured by platelet aggregation 24 hours and 3, 6, and 12 months following initiation of aspirin therapy.55
Clopidogrel
The Clopidogrel Versus Aspirin in Patients at Risk of Ischemic Events (CAPRIE) study was a randomized, blinded trial designed to assess the relative efficacy of clopidogrel (75 mg/day) and aspirin (325 mg/day) in reducing the risk of the composite outcome of ischemic stroke, MI, or vascular death.56 In this study, 19,185 patients with atherosclerotic vascular disease (recent ischemic stroke, recent MI, or symptomatic peripheral arterial disease) were followed up for 1.91 years. Clopidogrel was associated with a 5.32% risk of the primary composite outcome compared with 5.83% with aspirin (relative risk reduction [RRR], 8.7%; 95% CI, 0.3%16.5%; P = .043). The NNT was 196 (ARR, 0.51%; 95% CI, 1024188; P = .043) for 1 year with clopidogrel instead of aspirin to prevent 1 patient from having a stroke, MI, or vascular death.56 Both treatments were associated with a similar safety profile. In a prespecified subgroup analysis among patients with a previous stroke, the risk reduction with clopidogrel was nonsignificant. However, in a post hoc analysis of patients with diabetes enrolled in the CAPRIE trial (n = 3866), clopidogrel was associated with a greater benefit than aspirin (ARR, 2.1%; P = .042) compared with no benefit in nondiabetic patients.57
In the Management of Atherothrombosis with Clopidogrel in High‐Risk Patients with TIA or Stroke (MATCH) trial, 7599 patients with a prior stroke or TIA plus additional risk factors received clopidogrel 75 mg/day or combination therapy of clopidogrel 75 mg/day plus aspirin 75 mg/day.58 The primary outcome was the composite of ischemic stroke, MI, vascular death, or rehospitalization secondary to ischemic events. There was no significant benefit of combination therapy compared with clopidogrel alone in reducing the primary outcome (RRR, 6.4%; 95% CI, 4.6%16.3%; ARR, 1%; 95% CI, 0.6%2.7%) or any of the secondary outcomes. The risk of major hemorrhage was significantly increased in the combination group compared with clopidogrel alone, with a significant 1.3% absolute increase in life‐threatening bleeding (95% CI, 0.6%1.9%). Although clopidogrel plus aspirin is recommended over aspirin for acute coronary syndromes, with most guidelines advocating up to 12 months of treatment, the results of the MATCH trial do not suggest a similar risk reduction for stroke patients.58
The Clopidogrel for High Atherothrombotic Risk and Ischemic Stabilization, Management, and Avoidance (CHARISMA) trial investigated the efficacy of dual antiplatelet therapy with clopidogrel (75 mg/day) plus low‐dose aspirin (75162 mg/day) versus low‐dose aspirin alone in reducing subsequent stroke and MI and death from cardiovascular causes in 15,603 men and women with clinically evident cardiovascular disease or multiple cardiovascular risk factors.59 At the end of follow‐up, there was no significant difference between treatments in the primary efficacy outcome (6.6% with clopidogrel plus aspirin vs. 7.3% with aspirin alone; relative risk [RR], 0.93; 95% CI, 0.831.05; P = .22). The combination was associated with a greater incidence of gastrointestinal bleeding (number needed to harm, 88; 95% CI, 59‐170) over 28 months. There was a nonsignificant increase in the risk of severe bleeding with clopidogrel in combination with aspirin compared with aspirin alone (RR, 1.2; 95% CI, 0.911.59; P = .20). Among patients with multiple risk factors (but no clinically evident cardiovascular disease), cardiovascular mortality was significantly higher with clopidogrel plus aspirin (3.9%) versus aspirin alone (2.2%; P = .01).59
Recently, a post hoc analysis of data from CHARISMA was performed to assess the possible benefit of dual antiplatelet therapy in a subgroup of patients (n = 9478) with a documented history of MI, ischemic stroke, or symptomatic peripheral arterial disease.60 In this subgroup, the rate of cardiovascular death, MI, or stroke was significantly lower in the clopidogrel‐plus‐aspirin group compared with aspirin alone (7.3% versus 8.8%; hazard ratio [HR], 0.83; 95% CI, 0.720.96; P = .01). There was no significant difference in severe bleeding between the clopidogrel‐plus‐aspirin and aspirin‐alone groups in this subpopulation (1.7% vs. 1.5%; HR, 1.12; 95% CI, 0.811.53; P = .50). However, there was a significantly higher increase in moderate bleeding with clopidogrel plus aspirin compared with aspirin alone (2.0% versus 1.3%; HR, 1.60; 95% CI, 1.162.20; P = .004). These data from the post hoc subanalysis suggest that a large proportion of patients with documented prior MI, ischemic stroke, or symptomatic peripheral artery disease may derive significant benefit from dual antiplatelet therapy with clopidogrel plus aspirin.60 These observations do not support the observations in the MATCH trial; therefore, additional studies are required to validate these findings.
Aspirin Plus Extended‐Release Dipyridamole
In the Second European Stroke Prevention Study (ESPS‐2), 6602 patients with prior stroke or TIA were assigned to low‐dose aspirin (25 mg twice daily) plus extended‐release dipyridamole (ER‐DP; 200 mg twice daily), aspirin alone, ER‐DP alone, or placebo.61 The extended‐release formulation of dipyridamole provided the benefits of continuous absorption and steady serum levels, resulting in a more consistent response in a narrow therapeutic index, especially in the elderly.62 The relative risk of stroke was reduced by 37% with the combination treatment versus 18% with low‐dose aspirin alone or 16% with dipyridamole alone. The combination treatment was also associated with a significant reduction (36%) in the risk of TIA compared with placebo (P < .001).61 Thus, significantly greater protective effects were seen with the combination therapy. Gastrointestinal bleeding was more common in patients receiving aspirin than in those receiving placebo or ER‐DP. No significant additional bleeding was observed with the aspirin‐plus‐ER‐DP combination compared with aspirin alone. The 3.4% ARR with aspirin plus ER‐DP compared with aspirin alone suggests an NNT of 34 for 2 years to prevent 1 recurrent stroke.63 In addition, the ESPS‐2 data meta‐analysis combined with 14 smaller trials of aspirin and dipyridamole was found to reduce the odds of nonfatal stroke by 23% relative to aspirin monotherapy.64
The European/Australasian Stroke Prevention in Reversible Ischaemia Trial (ESPRIT) was designed to assess the efficacy and safety of aspirin plus dipyridamole versus aspirin alone for secondary prevention of cardiovascular events in patients with ischemic stroke of presumed arterial origin.65 In this trial, 2739 patients were randomly assigned to aspirin (30325 mg/day) with or without dipyridamole (200 mg twice daily) within 6 months of TIA or minor stroke of presumed arterial origin. The primary outcome was a composite of death from all vascular causes, nonfatal stroke, nonfatal MI, or major bleeding complication, whichever occurred first. Median aspirin dose was 75 mg/day in both treatment groups, and ER‐DP was used by 83% of the patients in the combination group. The primary outcome occurred in 173 (13%) of patients receiving aspirin plus dipyridamole and in 216 (16%) of those receiving aspirin alone (HR, 0.8; 95% CI, 0.660.98; ARR, 1.0% per year, 95% CI, 0.1%1.8%). The NNT was 33 over 3.5 years to prevent 1 primary outcome with aspirin plus dipyridamole.65 These results, confirming those of ESPS‐2, strongly suggest that use of combination aspirin plus ER‐DP among patients with recent brain ischemia provides significant benefit compared with aspirin alone, without additional adverse effects.
Ticlopidine
Ticlopidine was found to be more effective than aspirin or placebo in risk reduction for recurrent stroke.66 However, the results of several studies showed that its use was associated with serious adverse effects, such as gastrointestinal events, neutropenia, skin rash, and thrombotic thrombocytopenic purpura.66, 67 The more recent African American Antiplatelet Stroke Prevention Study (AAASPS), which included more than 1800 stroke patients, showed that 250 mg of ticlopidine twice daily was no more effective than 325 mg of aspirin twice daily in an African American population.68 Overall, ticlopidine use for prevention of recurrent stroke is not supported by trial data, especially considering the substantial risk of adverse effects.
Anticoagulation
In an additional arm of the ESPRIT trial, 1068 patients were randomly assigned either anticoagulants (target international normalized ratio [INR], 2.03.0) or aspirin (30325 mg/day) within 6 months of a TIA or minor stroke of presumed arterial origin (Table 4).69 In a post hoc analysis, anticoagulants were also compared with the combination of aspirin and dipyridamole (200 mg twice daily). The primary outcome was the composite of death from all vascular causes, nonfatal stroke, nonfatal MI, or major bleeding complication, whichever occurred first. The primary event was observed in 20% of patients (106 of 523) receiving anticoagulants compared with 16% of patients (82 of 509) receiving aspirin plus dipyridamole (HR, 1.31; 95% CI, 0.981.75). The risk for major bleeding was at least 60% lower in patients receiving aspirin plus dipyridamole compared with anticoagulants (2% versus 9%; HR, 4.37; 95% CI, 2.278.43).69 These data confirm that the combination of aspirin plus dipyridamole is more effective than aspirin alone or warfarin for secondary prevention of stroke in patients with stroke of arterial origin.
The Warfarin Aspirin Recurrent Stroke Study (WARSS) compared warfarin (target INR, 1.42.8) versus aspirin (325 mg/day) for the prevention of recurrent ischemic stroke among 2206 patients with a noncardioembolic stroke (Table 4).70 Results of this randomized, double‐blind, multicenter trial showed no significant difference in the rates of recurrent stroke or death (warfarin, 17.8%; aspirin, 16.0%). Warfarin and aspirin were also associated with similar rates of major bleeding (2.2% and 1.5% per year, respectively). Although there were no differences between the 2 treatments, the potential increased risk of bleeding and cost of monitoring were considered in the recommendation of the AHA/ASA to choose antiplatelets over anticoagulants in the setting of noncardioembolic stroke.5
The Warfarin‐Aspirin Symptomatic Intracranial Disease (WASID) trial was designed to test the efficacy of warfarin (target INR, 2.03.0 [mean, 2.5]) versus aspirin among patients with >50% angiographically documented intracranial stenosis (Table 4).71 WASID was stopped prematurely because of warfarin's association with significantly higher rates of adverse events and evidence of no benefit over high‐dose aspirin (1300 mg/day). During a mean follow‐up of 1.8 years, adverse events in the 2 groups were death (aspirin, 4.3%, vs. warfarin, 9.7%; HR, 0.46; 95% CI, 0.230.90; P = .02), major hemorrhage (aspirin, 3.2%, vs. warfarin, 8.3%; HR, 0.39; 95% CI, 0.180.84; P = .01), and MI or sudden death (aspirin, 2.9%, vs. warfarin, 7.3%; HR, 0.40; 95% CI, 0.180.91; P = .02). The primary end point (ischemic stroke, brain hemorrhage, and nonstroke vascular death) occurred in approximately 22% of patients in both treatment arms (HR, 1.04; 95% CI, 0.731.48; P = .83).
Statins
Statins reduce the risk of stroke among patients with vascular disease, primarily through LDL cholesterol reduction.72 In the Heart Protection Study (N = 20,536), treatment with simvastatin 40 mg resulted in a 25% relative reduction in the first‐event rate for stroke (P < .0001) and a 28% reduction in presumed ischemic strokes (P < .0001) in patients with cerebrovascular disease, other occlusive vascular disease, or diabetes. No apparent difference in strokes was attributed to hemorrhage (0.5% vs. 0.5%; P = .8). Among patients with preexisting cerebrovascular disease (n = 3280), simvastatin therapy resulted in a 20% reduction in the rate of any major vascular event (P = .001).72
The Stroke Prevention by Aggressive Reduction in Cholesterol Levels (SPARCL) trial examined the effect of high‐dose atorvastatin specifically on secondary prevention of stroke in patients who had a recent history of stroke or TIA and LDL cholesterol levels of 100190 mg/dL (2.64.9 mmol/L) but no known coronary disease.73 In this double‐blind, randomized, placebo‐controlled study, 4731 patients received 80 mg of atorvastatin or placebo. The primary end point was fatal or nonfatal stroke. The mean LDL cholesterol level was 73 mg/dL (1.9 mmol/L) in patients receiving atorvastatin and 129 mg/dL (3.3 mmol/L) in patients receiving placebo. During a median follow‐up of 4.9 years, the incidence of recurrent stroke was lower among patients receiving atorvastatin, with 265 patients (11.2%) experiencing fatal or nonfatal stroke versus 311 (13.1%) of those receiving placebo (5‐year absolute reduction in risk, 2.2%; adjusted HR, 0.84; 95% CI, 0.710.99; P = .03; unadjusted P = .05). Eighty‐seven percent of patients in both treatment groups were receiving concomitant antiplatelet therapy, and 65% were receiving antihypertensives. Atorvastatin treatment resulted in a significant reduction in the risk of fatal stroke but not nonfatal stroke.
In SPARCL, the reduction in risk of fatal or nonfatal stroke, which included hemorrhagic stroke, was maintained despite increased incidence of hemorrhagic stroke with atorvastatin (55 of 273, 20%) versus placebo (33 of 307, 11%).73 The primary end point (fatal and nonfatal strokes) was inclusive of hemorrhagic stroke. Therefore, these results indicate that the benefit seen with atorvastatin therapy was greater than the potential risk of hemorrhagic stroke. High‐dose atorvastatin should be considered for routine secondary prevention on the basis of these findings.
Several studies have evaluated the efficacy of statin therapy in primary prevention of stroke; however, statins were not associated with a decrease in the risk of hemorrhagic stroke.72, 74, 75 Therefore, the potential risk of recurrent hemorrhagic stroke should be considered prior to initiating statin therapy. There is some evidence to suggest that statins can reduce stroke incidence, even in those patients with normal lipid levels, presumably via lowering blood pressure.76
Antihypertensives
High blood pressure is a strong risk factor for initial and recurrent stroke. It is well established that lowering blood pressure reduces the risk of both fatal and nonfatal stroke in a variety of patient groups. The Perindopril Protection Against Recurrent Stroke Study (PROGRESS) quantified the effects of treating hypertension on long‐term disability and dependency among patients with cerebrovascular disease.77 In this randomized, double‐blind, placebo‐controlled study, 6105 patients with a history of stroke or TIA were randomly assigned to receive perindopril 4 mg with or without a diuretic or to receive a placebo. Treatment with perindopril reduced the rate of disability, compared with placebo (19% vs. 22%; adjusted odds ratio, 0.76; 95% CI, 0.650.89; P < .001), primarily by reducing the incidence of recurrent stroke. The NNT for 4 years was 30 (95% CI, 1979) to prevent 1 case of long‐term disability. Interestingly, treatment reduced the risk of stroke in both hypertensive and nonhypertensive patients.78
SUMMARY OF GUIDELINES FOR SECONDARY PREVENTION OF STROKE
The AHA/ASA, American College of Chest Physicians (ACCP), and National Stroke Association (NSA) have developed and published practice guidelines for the management of TIA, with detailed information on secondary prevention of stroke.5, 79, 80 The key recommendations from these 3 organizations are summarized in Table 5 .5, 79, 80 This section summarizes the current guidelines regarding the use of antiplatelets and anticoagulants for the secondary prevention of stroke.
| AHA/ASA5 | NSA79 | ACCP80 | |
|---|---|---|---|
| |||
| Extracranial carotid artery disease | |||
| Hemodynamically significant stenosis 70%, or 50%69% depending on patient‐specific factors | |||
| ○ Carotid endarterectomy* | Class I, level A | Category 1 | No recommendations |
| Nonhemodynamically significant stenosis; stenosis <50% | |||
| ○ Carotid endarterectomy not indicated | Class III, level A | Category 1 | No recommendations |
| Atrial fibrillation | |||
| Long‐term anticoagulation (adjusted‐dose warfarin) | Class I, level A | Category 1 | Grade 1A |
| Aspirin (325 mg/day), if anticoagulants contraindicated | Class I, level A | Category 1 | Grade 1A |
| Mitral valve prolapse | |||
| Long‐term antiplatelet therapy | Class IIa, level C | Category 3 | Grade 1C+ |
| Prosthetic heart valves | |||
| Anticoagulants | Class I, level B | Category 1 | Grade 1C+ |
| Plus antiplatelets (if anticoagulants inadequate) | Class IIa, level B | Category 3 | Grade 1C |
Antiplatelets Versus Anticoagulants
The latest guidelines from the AHA/ASA and the ACCP recommend the use of anticoagulants (adjusted‐dose warfarin) for the secondary prevention of stroke in patients with persistent or paroxysmal atrial fibrillation and in those with artificial heart valves.5, 80 Warfarin therapy (INR, 2.03.0) is also a reasonable option for secondary prevention of stroke in TIA patients with dilated cardiomyopathy. Although warfarin may be prescribed to reduce cardioembolic events in this population, it is controversial whether there is benefit to the use of warfarin in patients with cardiac failure or a reduced left ventricular ejection fraction.81, 82 The Warfarin and Antiplatelet Therapy in Chronic Heart Failure Trial (WATCH) was initiated to evaluate warfarin versus aspirin 162 mg/day or clopidogrel 75 mg/day in patients with symptomatic heart failure in sinus rhythm with an ejection fraction less than or equal to 35%, but was terminated for poor recruitment.83 Results of observational studies have shown that treatment with warfarin may reduce the risk of recurrent embolism in those with rheumatic mitral valve disease.5, 84
In contrast, for patients with noncardioembolic stroke or TIA, antiplatelet agents are recommended for the secondary prevention of stroke and prevention of other cardiovascular events.5, 79, 80, 85
Currently, there are no data from prospective, randomized, controlled studies to support the use of intravenous heparin or warfarin in patients with carotid or vertebral dissection. The use of anticoagulation in patients with cerebral hemorrhage is influenced by several factors, such as type of hemorrhage, patient age, risk factors for recurrent hemorrhage, and indication for anticoagulation. The risk of recurrent hemorrhage must be weighed against the risk of ischemic cerebrovascular event. The AHA/ASA guidelines recommend that in patients with intracranial hemorrhage, subarachnoid hemorrhage, or subdural hematoma, all anticoagulants and antiplatelets should be discontinued during the acute period of at least 12 weeks posthemorrhage and that the anticoagulant effect should be reversed immediately with appropriate agents.5
FUTURE DEVELOPMENTS
One of the largest stroke prevention trials currently ongoing is the Prevention Regimen for Effectively avoiding Second Strokes (PRoFESS) study. The PRoFESS trial is a large (N = 20,333), randomized, double‐blind, placebo‐controlled, multinational study comparing the efficacy and safety of aspirin plus ER‐DP with that of clopidogrel and the efficacy of telmisartan versus placebo in the presence of background blood pressure treatments in preventing recurrent stroke.86 The primary outcome of the study is time to first recurrent stroke. Recently, the baseline demographics were published.86 The mean age of patients was 66.1 years at enrollment, 36% of patients were women, and mean time from event to randomization was 15 days (40% randomized within 10 days). Most participants had had a stroke of arterial origin (29% large vessel disease and 52% small vessel disease), whereas 2% had had a stroke due to cardioembolism and 18% due to other causes. These baseline data suggest that the trial involves a representative international population of patients with stroke. The PRoFESS trial will provide additional insight into the benefits of the combination of aspirin plus ER‐DP for secondary prevention of stroke in addition to providing direct comparison of efficacy with clopidogrel. The latest information on this and other ongoing stroke prevention trials can be accessed at
- ,,American Heart Association Statistics Committee and Stroke Statistics Subcommittee.Heart disease and stroke statistics—2008 update: a report from the American Heart Association Statistics Committee and Stroke Statistics Subcommittee.Circulation.2008;117:e25–e146.
- ,,,.Short‐term prognosis after emergency department diagnosis of TIA.JAMA.2000;284:2901–2906.
- ,,,,,.Very early risk of stroke after a first transient ischemic attack.Stroke.2003;34:e138–e140.
- ,,, et al.Incidence and short‐term prognosis of transient ischemic attack in a population‐based study.Stroke.2005;36:720–723.
- ,,, et al. American Heart Association/American Stroke Association Council on Stroke; Council on Cardiovascular Radiology and Intervention; American Academy of Neurology.Guidelines for prevention of stroke in patients with ischemic stroke or transient ischemic attack: a statement for healthcare professionals from the American Heart Association/American Stroke Association Council on Stroke. Co‐sponsored by the Council on Cardiovascular Radiology and Intervention: the American Academy of Neurology affirms the value of this guideline.Circulation.2006;113:e409–e449.
- .Stroke: early pathophysiology and treatment. Summary of the Fifth Annual Decade of the Brain Symposium.Stroke.1994;25:1877–1881.
- ,,, et al.Deficiency of both protein C and protein S in a family with ischemic strokes in young adults.Neurology.1994;44:1238–1240.
- ,,, et al.Classification of subtype of acute ischemic stroke: definitions for use in a multicenter clinical trial: TOAST: Trial of Org 10172 in Acute Stroke Treatment.Stroke.1993;24:35–41.
- ,.Cardioembolic stroke.Curr Atheroscler Rep.2006;8:310–316.
- ,.The proximal aorta: a source of stroke.Baillieres Clin Neurol.1995;4:207–220.
- ,,,,,.Early risk of stroke after transient ischemic attack: a systematic review and meta‐analysis.Arch Intern Med.2007;167:2417–2422.
- ,.Evaluation and management of transient ischemic attack: an important component of stroke prevention.Nat Clin Pract Cardiovasc Med.2007;4:310–318.
- ,,, et al.Validation and refinement of scores to predict very early stroke risk after transient ischaemic attack.Lancet.2007;369:283–292.
- Bader MK,Littlejohns LR, eds.AANN Core Curriculum for Neuroscience Nursing.4th ed.Philadelphia, PA:Saunders;2004.
- ,,, et al.Italian guidelines for stroke prevention and management: synthesis and recommendations. Stroke Prevention and Educational Awareness Diffusion.4th ed.Milan, Italy:Hyperphar Group SpA;2005. Available at: http://www.spread.it/SpreadEng/SPREAD_ENG_4thEd.pdf. Accessed January 29, 2008.
- ,,.Atrial fibrillation as an independent risk factor for stroke: the Framingham Study.Stroke.1991:22:983–988.
- ,,, et al.Transesophageal echocardiography is superior to transthoracic echocardiography in management of patients of any age with transient ischemic attack or stroke.Stroke.2006;37:2531–2534.
- .Cerebral vasculitis: imaging signs revisited.Neuroradiology.2007;49:471–479.
- ,,, et al.Intracranial aneurysms: role of multidetector CT angiography in diagnosis and endovascular therapy planning.Radiology.2007;244:532–540.
- ,,.Duplex ultrasound and magnetic resonance angiography compared with digital subtraction angiography in carotid artery stenosis: a systematic review.Stroke.2003;34:1324–1332.
- ,,, et al.Preoperative diagnosis of carotid artery stenosis: accuracy of noninvasive testing.Stroke.2002;33:2003–2008.
- ,,, et al.Neurologic complications of cerebral angiography.AJNR Am J Neuroradiol.1994;15:1401–1407.
- ,,,,,.Frequency of postoperative carotid duplex surveillance and type of closure: results from a randomized trial.J Vasc Surg.2000;32:1043–1051.
- ,,, et al.The Stroke Outcomes and Neuroimaging of Intracranial Atherosclerosis (SONIA) Trial Investigators. The Stroke Outcomes and Neuroimaging of Intracranial Atherosclerosis (SONIA) Trial.Neurology.2007;68:2099–2106.
- ,,,,.Cigarette smoking as a risk factor for stroke: the Framingham Study.JAMA.1988;259:1025–1029.
- ,.Meta‐analysis of relation between cigarette smoking and stroke.BMJ.1989;298:789–794.
- .Moderate alcohol consumption and stroke: the epidemiologic evidence.Stroke.1989;20:1611–1626.
- .Does alcohol prevent or cause stroke?Cerebrovascular Dis.1995;5:379.
- ,,, et al.Moderate alcohol intake, increased levels of high‐density lipoprotein and its subfractions, and decreased risk of myocardial infarction.N Engl J Med.1993;329:1829–1834.
- ,.Alcohol, lipids and lipoproteins. In:Zakhari S,Wassef M, eds.National Institutes of Health: Alcohol and the Cardiovascular System: Research Monograph. NIH publication 96‐4133.Washington, DC:National Institutes of Health;1996;31:369–391.
- ,,,,.Inhibition of platelet aggregation in whole blood by alcohol.Thromb Res.1995;78:107–115.
- ,,.Sustained inhibition of whole‐blood clot procoagulant activity by inhibition of thrombus‐associated factor Xa.Arterioscler Thromb Vasc Biol.1996;16:1285–1291.
- ,.Binge drinking and ambulatory blood pressure.Hypertension.1999;33:79–82.
- ,,, et al.Light‐to‐moderate alcohol consumption and risk of stroke among US male physicians.N Engl J Med.1999;341:1557–1564.
- .The influence of obesity on health (second of two parts).N Engl J Med.1974;291:226–232.
- ,,, et al.Northern Manhattan Stroke Study. Abdominal obesity and risk of ischemic stroke: the Northern Manhattan Stroke Study.Stroke.2003;34:1586–1592.
- ,,.Physical activity and stroke risk: a meta‐analysis.Stroke.2003;34:2475–2481.
- ,,,,,.Effects of an angiotensin‐converting‐enzyme inhibitor, ramipril, on cardiovascular events in high‐risk patients: the Heart Outcomes Prevention Evaluation Study Investigators.N Engl J Med.2000;342:145–153.
- ,,,.Blood pressure and stroke: an overview of published reviews.Stroke.2004;35:776–785.
- ,,, et al. American Heart Association; American Stroke Association Stroke Council.Primary prevention of ischemic stroke: a guideline from the American Heart Association/American Stroke Association Stroke Council. Cosponsored by the Atherosclerotic Peripheral Vascular Disease Interdisciplinary Working Group; Cardiovascular Nursing Council; Clinical Cardiology Council; Nutrition, Physical Activity, and Metabolism Council; and the Quality of Care and Outcomes Research Interdisciplinary Working Group.Circulation.2006;113:e873–e923.
- ,,, et al.National Heart, Lung, and Blood Institute Joint National Committee on Prevention, Detection, Evaluation, and Treatment of High Blood Pressure; National High Blood Pressure Education Program Coordinating Committee. Seventh Report of the Joint National Committee on Prevention, Detection, Evaluation, and Treatment of High Blood Pressure: the JNC 7 Report.JAMA.2003;289:2560–2571.
- ,,.Blood pressure reduction and secondary prevention of stroke and other vascular events: a systematic review.Stroke.2003;34:2741–2748.
- American Diabetes Association.ADA clinical practice recommendations.Diabetes Care.2004;27:S1–S143.
- ,,,,.Stroke patterns, etiology, and prognosis in patients with diabetes mellitus.Neurology.2004;62:1558–1562.
- ,,, et al.Incidence rates of first‐ever ischemic stroke subtypes among blacks: a population‐based study.Stroke.1999;30:2517–2522.
- ,,, et al.Projection of diabetes burden through 2050: impact of changing demography and disease prevalence in the US.Diabetes Care.2001;24:1936–1940.
- ,,.Prevention and treatment for development and progression of diabetic macroangiopathy with pioglitazone and metformin [in Japanese].Nippon Rinsho.2006;64:2119–2125.
- American Diabetes Association.Standards of medical care for patients with diabetes mellitus.Diabetes Care.2003;26:S33–S50.
- Executive Summary of the Third Report of the National Cholesterol Education Program (NCEP) Expert Panel on Detection, Evaluation, and Treatment of High Blood Cholesterol in Adults (Adult Treatment Panel III).JAMA.2001;285:2486–2497.
- ,,, et al.Implications of recent clinical trials for the National Cholesterol Education Program Adult Treatment Panel III Guidelines.Circulation.2004;110:227–239.
- Antithrombotic Trialists' Collaboration.Collaborative meta‐analysis of randomised trials of antiplatelet therapy for prevention of death, myocardial infarction, and stroke in high‐risk patients.BMJ.2002;324:71–86.
- Antiplatelet Trialists' Collaboration.Collaborative overview of randomised trials of antiplatelet therapy—I: prevention of death, myocardial infarction, and stroke by prolonged antiplatelet therapy in various categories of patients.BMJ.1994;308:81–106.
- International Stroke Trial Collaborative Group.The International Stroke Trial (IST): a randomised trial of aspirin, subcutaneous heparin, both, or neither among 19,435 patients with acute ischaemic stroke.Lancet.1997;349:1569–1581.
- A comparison of two doses of aspirin (30 mg vs. 283 mg a day) in patients after a transient ischemic attack or minor ischemic stroke. The Dutch TIA Trial Study Group.N Engl J Med.1991;325:1261–1266.
- ,,, et al.Aspirin resistance in secondary stroke prevention.Acta Neurol Scand.2006;113:31–35.
- CAPRIE Steering Committee.A randomised, blinded trial of clopidogrel versus aspirin in patients at risk of ischaemic events (CAPRIE).Lancet.1996;348:1329–1339.
- ,,,,,.Amplified benefit of clopidogrel versus aspirin in patients with diabetes mellitus.Am J Cardiol.2002;90:625–628.
- ,,, et al.Aspirin and clopidogrel compared with clopidogrel alone after recent ischaemic stroke or transient ischaemic attack in high‐risk patients (MATCH): randomised, double‐blind, placebo‐controlled trial.Lancet.2004;364:331–337.
- ,,, et al.Clopidogrel and aspirin versus aspirin alone for the prevention of atherothrombotic events.N Engl J Med.2006;354:1706–1717.
- ,,, et al.;CHARISMA Investigators. Patients with prior myocardial infarction, stroke, or symptomatic peripheral arterial disease in the CHARISMA trial.J Am Coll Cardiol.2007;49:1982–1988.
- ,,, et al.European Stroke Prevention Study 2. Dipyridamole and acetylsalicylic acid in the secondary prevention of stroke.J Neurol Sci.1996;143:1–13.
- ,,,,.Dipyridamole bioavailability in subjects with reduced gastric acidityJ Clin Pharmacol.2005;45:845–850.
- Thrombosis Interest Group of Canada. Practice guidelines [on‐line monograph]. Updated yearly. Available at: http://www.tigc.org/eguidelines/strokeprevention.htm. Accessed May 16, 2001.
- ,.Dipyridamole plus aspirin in cerebrovascular disease.Arch Neurol.1999;566:1087–1092.
- ESPRIT Study Group.Aspirin plus dipyridamole versus aspirin alone after cerebral ischaemia of arterial origin (ESPRIT): randomised controlled trial.Lancet.2006;367:1665–1673.
- ,,, et al.A randomized trial comparing ticlopidine hydrochloride with aspirin for the prevention of stroke in high‐risk patients. Ticlopidine Aspirin Stroke Study Group.N Engl J Med.1989;321:501–507.
- ,,,,,.Thrombotic thrombocytopenic purpura associated with ticlopidine: a review of 60 cases.Ann Intern Med.1998;128:541–544.
- ,,, et al.;African American Antiplatelet Stroke Prevention Study Investigators. Aspirin and ticlopidine for prevention of recurrent stroke in black patients: a randomized trial.JAMA.2003;289:2947–2957.
- ;ESPRIT Study Group.Medium intensity oral anticoagulants versus aspirin after cerebral ischaemia of arterial origin (ESPRIT): a randomised controlled trial.Lancet Neurol.2007;6:115–124.
- ,,, et al. for the Warfarin‐Aspirin Recurrent Stroke Study Group.A comparison of warfarin and aspirin for the prevention of recurrent ischemic stroke.N Engl J Med.2001;345:1444–1451.
- ,,, et al.Comparison of warfarin and aspirin for symptomatic intracranial arterial stenosis.N Engl J Med.2005;352:1305–1316.
- ,,, et al. Heart Protection Study Collaborative Group.Effects of cholesterol‐lowering with simvastatin on stroke and other major vascular events in 20536 people with cerebrovascular disease or other high‐risk conditions.Lancet.2004;363:757–767.
- ,,, et al.Stroke Prevention by Aggressive Reduction in Cholesterol Levels (SPARCL) Investigators. High‐dose atorvastatin after stroke or transient ischemic attack.N Engl J Med.2006;355:549–559.
- ,,, et al.Pravastatin in Elderly Individuals at Risk of Vascular Disease (PROSPER): a randomised controlled trial.Lancet.2002;360:1623–1630.
- Heart Protection Study Collaborative Group.MRC/BHF Heart Protection Study of cholesterol lowering with simvastatin in 20,536 high‐risk individuals: a randomised placebo‐controlled trial.Lancet.2002;360:7–22.
- ,,,.Analysis of antihypertensive effects of statins.Curr Hypertens Rep.2007;9:175–183.
- Perindopril Protection Against Recurrent Stroke Study PROGRESS Collaborative Group.Effects of a perindopril‐based blood pressure‐lowering regimen on disability and dependency in 6105 patients with cerebrovascular disease.Stroke.2003;34:2333–2338.
- PROGRESS Collaborative Group.Randomised trial of a perindopril‐based blood‐pressure‐lowering regimen among 6,105 individuals with previous stroke or transient ischaemic attack.Lancet.2001;358:1033–1041.
- ,,, et al.National Stroke Association guidelines for the management of transient ischemic attacks.Ann Neurol.2006;60:301–313.
- ,,,,.Antithrombotic and thrombolytic therapy for ischemic stroke: the Seventh ACCP Conference on Antithrombotic and Thrombolytic Therapy.Chest.2004;126:483S–512S.
- .A plea for a clinical trial of anticoagulation in dilated cardiomyopathy.Am J Cardiol.1990;65:914–915.
- .Antithrombotics for left‐ventricular impairment?Lancet.1998;351:1904.
- ,,, et al.Ventricular dysfunction and the risk of stroke after myocardial infarction.N Engl J Med.1997;336:251–257.
- ,,,,.Usefulness of anticoagulant therapy in the prevention of embolic complications of atrial fibrillation.Am Heart J.1986;112:1039–1043.
- ,,, et al.Guidelines for the early management of adults with ischemic stroke: a guideline from the American Heart Association/American Stroke Association Stroke Council, Clinical Cardiology Council, Cardiovascular Radiology and Intervention Council, and the Atherosclerotic Peripheral Vascular Disease and Quality of Care Outcomes in Research Interdisciplinary Working Groups. The American Academy of Neurology affirms the value of this guideline as an educational tool for neurologists.Stroke.2007;38:1655–1711.
- ,,;Steering Committee; PRoFESS Study Group.Rationale, design and baseline data of a randomized, double‐blind, controlled trial comparing two antithrombotic regimens (a fixed‐dose combination of extended‐release dipyridamole plus asa with clopidogrel) and telmisartan versus placebo in patients with strokes. The Prevention Regimen for Effectively Avoiding Second Strokes Trial (PRoFESS).Cerebrovasc Dis.2007;23:368–380.
Copyright © 2008 Society of Hospital Medicine