User login
6 office tests to assess ovarian reserve, and what they tell you
The University of Medicine and Dentistry of New Jersey (UMDNJ) owns a patent relating to the use of anti-Müllerian hormone/Müllerian inhibiting substance for predicting ovarian response in women with infertility. The patent is based in part on work that Dr. Seifer carried out while employed at UMDNJ. In accordance with UMDNJ policy, Dr. Seifer, a named inventor on this patent, assigned his interest in the invention to UMDNJ. UMDNJ has a licensing agreement with Diagnostic Systems Laboratory for the use of the claimed invention. Dr. Seifer receives a portion of the royalties, as determined by UMDNJ policy, that UMDNJ gains from this licensing agreement.
CASE: Borderline test result prompts referral
A 36-year-old nulliparous woman is seen in your office for evaluation after 6 months of infertility. She is ovulatory, and has been using an ovulation-prediction kit to time intercourse. You learn that she had Chlamydia trachomatis infection in the distant past, but elicit no other significant medical or surgical history. She reports that she smoked approximately one pack of cigarettes a day for 15 years but gave up smoking 5 years ago.
You order a hysterosalpingogram, followed by day 3 testing of follicle-stimulating hormone (FSH). The hysterosalpingogram is normal; the FSH level is 7.5 mIU/mL and the estradiol level is 30 pg/mL—both in the normal range.
The patient asks for testing of anti-Müllerian hormone (AMH; also known as Müllerian-inhibiting substance) because she has read that it is a new marker of fertility. The result is 0.5 ng/mL, a borderline value. After reviewing these results, you refer her to a reproductive endocrinologist for further management.
Was the test for AMH indicated? And is this referral appropriate?
The referral is entirely appropriate, even though the patient has not been trying to conceive for a full year. Why? The AMH value suggests that her ovarian reserve is in early decline. She would benefit from evaluation by a subspecialist who can review the entire spectrum of treatments, including aggressive options such as ovulation induction and in vitro fertilization (IVF), to optimize her reproductive success.
This article reviews the various biomarkers available to assess ovarian reserve in women who experience infertility:
- day 3 (basal) FSH
- clomiphene citrate challenge
- gonadotropin-releasing hormone (GnRH) agonist stimulation
- inhibin-B
- antral follicle count (AFC)
- AMH.
The AFC and AMH tend to detect the earliest changes in ovarian reserve, followed, sequentially, by inhibin-B, the clomiphene citrate challenge test (CCCT), and basal FSH.
The tests we describe are used primarily to assess treatment prognosis in infertile women. In time, however, appropriate population screening of ovarian reserve may be feasible to provide many more women with information about their reproductive potential and help them shape their life plan.
What makes a test valuable?
Ovarian reserve describes a woman’s reproductive potential—specifically, the number and quality of oocytes she possesses.1 Biochemical tests of ovarian reserve emerged during the rise of assisted reproductive technologies (ART) in the late 1980s to predict both responsiveness to superovulation drugs and the odds of pregnancy with treatment.
Ideally, a test that assesses ovarian reserve should be affordable, straightforward, rapidly interpretable, and minimally invasive. It also should be able to detect changes that begin early in reproductive life. To be applicable to large populations of reproductive-age women, it should be of use anytime in the menstrual cycle, and should provide reproducible and highly accurate assessment of the reproductive aging process.
Our ability to offer tests that accurately measure ovarian reserve has a significant impact on women at risk of infertility and early menopause and on those who choose to delay childbearing for personal (nonmedical) reasons. These tests have become increasingly relevant because women are choosing to have their first child at a later age than their counterparts did 20 years ago:
- In 1980, 40% of women having their first baby were younger than 25 years, and only 5% were older than 35
- In 2000, 25% of women were younger than 25 when their first child was born, and 15% were older than 35.
Who should be tested?
Ovarian reserve is a complex clinical phenomenon that is influenced by age, genetics, and environmental variables. The decline in a woman’s ovarian reserve over time is irreversible; the trajectory of this decline is fundamental to the odds of fertility with age and the timing of the menopausal transition. At present, the markers used most often in clinical practice have some utility but also suffer from several drawbacks ( TABLE ).
For the general practitioner performing an infertility evaluation, we recommend focusing on the following groups of women for ovarian reserve testing:
- women over 30 years of age
- women with a history of exposure to a confirmed gonadotoxin, i.e., tobacco smoke, chemotherapy, radiation therapy
- women with a strong family history of early menopause or premature ovarian failure
- women who have had extensive ovarian surgery, i.e., cystectomy and unilateral oophorectomy.
Testing tends to have the highest yield in these groups. Women who have abnormal results should be referred to a reproductive endocrinologist for further evaluation and treatment.
The six tests are described below.
TABLE
How six markers of ovarian reserve stack up
| Test (year described) | Timing | Intracycle and intercycle variability | Sensitivity (specificity) | Reflects changes in ovarian reserve | Normal levels | Confounders | Out-of-pocket cost |
|---|---|---|---|---|---|---|---|
| Basal follicle-stimulating hormone (FSH) (1988) | Day 3 of menstrual cycle | Clinically significant | 7%–8% (98%–99%) | Late | • Early follicular phase FSH level <10 mIU/mL • Estradiol level <80 pg/mL | • High estradiol level (decreases) • Oral contraceptive use (decreases) • Pregnancy (decreases) | $125–$150 |
| Clomiphene challenge test (1989) | Days 3 and 10 of menstrual cycle | Clinically significant | 25%–40% (98%–99%) | Late | • Day 3 FSH level <10 mIU/mL; day 3 estradiol level <80 pg/mL • Day 10 FSH level <10 mIU/mL | • High day 3 estradiol level (decreases day 3 FSH) • Low day 10 estradiol (increases day 10 FSH) • Oral contraceptive use (decreases) • Pregnancy (decreases) | $550–$600 |
| GnRH agonist (1988) | Early follicular phase of menstrual cycle | Clinically significant | 32%–89% (79%–97%) | Late | Variable | • Oral contraceptives (decrease estradiol levels) • Pregnancy (increases estrogens) | $300–$350 |
| Inhibin-B (1997) | Early follicular phase of menstrual cycle | Clinically significant | 33%–81% (29%–95%) | Early | Variable in the literature; normal cutoffs range from ≥45–80 pg/mL | • Obesity (decreases) • PCOS (increases) • Exogenous FSH administration (increases) • Oral contraceptive use (decreases) | $150–$200 |
| Antral follicle count (1997) | Early follicular phase of menstrual cycle | Clinically significant (includes interobserver variability) | 8%–60% (33%–96%) | Earliest | ≥5–10 total antral follicles | • Oral contraceptive use (decreases) • Polycystic ovary syndrome (PCOS) (increases) | $300–$500 |
| Anti–Müllerian hormone/Müllerian-inhibiting substance (2002) | At any time; not cycle-dependent | Minimal | 49%–76% (89%–94%) | Earliest | >0.7 ng/mL | • PCOS (increases) • Obesity (decreases) • Exogenous FSH administration (decreases) | $150–$400 |
1 | Basal FSH—widely used but only moderately informative
Day 3 FSH and the CCCT are the most widely used measures of ovarian reserve in ART practice. The use of early follicular-phase FSH as a marker of ovarian reserve and fertility was proposed 20 years ago with the emergence of IVF.2-4 The test is an indirect assessment of ovarian reserve in that it measures pituitary production of FSH in response to feedback from ovarian hormones. Estradiol and inhibin-B reach a nadir early in the menstrual cycle; measuring FSH on day 3 offers a glimpse of the functioning of the hypothalamic–pituitary–ovarian axis before ovarian hormone levels rise later in the cycle ( FIGURE 1 ).5,6
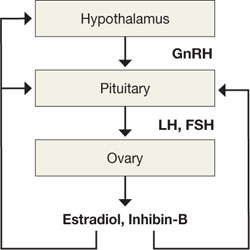
FIGURE 1 The HPO axis
The FSH level opens a window onto the function of the hypothalamic–pituitary–ovarian axis before ovarian hormone levels rise in the cycle. Women who have normal ovarian reserve have sufficient ovarian hormone production early in the menstrual cycle to maintain FSH levels within the normal range. Conversely, a “monotropic” elevation in FSH—one that is unaccompanied by a rise in luteinizing hormone (LH)—reflects poor hormone production from an aging pool of ovarian follicles and disinhibition of FSH production.5,6
FSH measurements are typically combined with estradiol to enhance the sensitivity of testing ( FIGURE 2, ). Premature elevations of estradiol early in the follicular phase are driven by rising FSH levels in women with declining ovarian reserve. Abnormally elevated estrogen levels then feed back negatively on pituitary production of FSH and mask an elevation that might otherwise reveal diminished ovarian reserve. Measurement of both FSH and estradiol on cycle day 3 may therefore help decrease the incidence of false-negative testing.
Commonly cited criteria for normal ovarian reserve are:
- early follicular phase FSH, <10 mIU/mL
- estradiol, <80 pg/mL1
It is extremely important to note, however, that these are general guidelines and that cutoffs are both laboratory- and practice-specific.
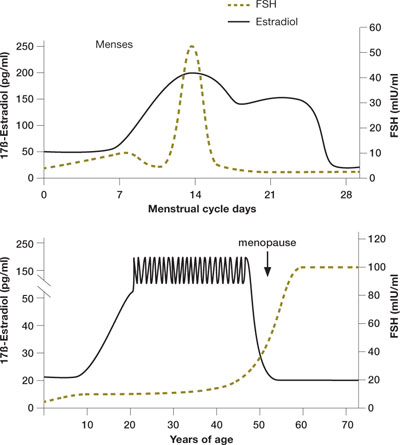
FIGURE 2 Monthly and lifetime variations in estradiol and FSH
How 17ß-estradiol and follicle-stimulating hormone levels vary over the menstrual cycle (top) and a woman’s lifetime (bottom).
2 | Clomiphene citrate—more sensitive than FSH testing
Like basal FSH testing, the CCCT is an indirect assessment of ovarian reserve. Unlike FSH testing, the CCCT is provocative. It involves administration of 100 mg of clomiphene citrate (Clomid) on days 5 through 9 of the menstrual cycle, with FSH and estradiol measured on days 3 and 10. Once clomiphene citrate is administered, FSH and LH levels rise, followed by an increase in estradiol and inhibin. Evidence suggests that the smaller follicular cohorts in women with diminished ovarian reserve produce less inhibin-B and estradiol and, therefore, less negative feedback on clomiphene-induced pituitary FSH release.6,7 The result: persistent elevation of the day 10 FSH value and a positive screen for diminished ovarian reserve.
In some women, day 10 FSH is elevated even after a normal day 3 value. This makes the CCCT more sensitive than basal FSH testing; it can identify women who might go unrecognized if evaluated by day 3 FSH and estradiol levels alone.
More expensive and labor-intensive than the alternatives
Interpretation of the CCCT requires that FSH and estradiol both be assessed on days 3 and 10. An elevated FSH (≥10 mIU/mL) on either day indicates diminished ovarian reserve. As with basal FSH testing, elevated estradiol (≥80 pg/mL) on day 3 is considered abnormal. The day 10 estradiol value of the CCCT reflects whether or not clomiphene citrate was administered appropriately, and should be elevated. However, the significance of the day 10 estradiol level has been debated with respect to its predictive value for pregnancy in infertile populations.8
The addition of day 10 FSH assessment improves the sensitivity of the CCCT over basal FSH measurement, but makes it a more expensive and labor-intensive test ( TABLE ).5,6 The CCCT involves administration of clomiphene citrate, a safe drug (though it can have side effects), and two blood draws instead of one. Nevertheless, both tests are relatively noninvasive, rapid measures of ovarian reserve.
Drawbacks of the tests
Both basal FSH testing and the CCCT are widely used, although support for their ability to predict ovarian reserve in the infertile population has been challenged recently. Newer data demonstrate that these tests are limited in their ability to predict outcome (pregnancy and response to superovulation drugs) in all but a narrow group of patients undergoing IVF. Performance is particularly limited in:
Additional drawbacks of basal FSH testing and the CCCT include:
- significant variability of test results from cycle to cycle (intercycle variability)
- limited time frame within which the tests can be performed (intracycle variability).
The basal FSH test and CCCT have high specificity (98% to 99% for each) as an assessment of reproductive performance in infertile women and generate few false-positive results.5,6 However, the high screen cutoffs that allow for such specificity come at a price: Few women will screen positive, and sensitivity of the tests is low (between 7% and 8% for basal FSH and between 25% and 40% for the CCCT). Such low sensitivity means that many women will not conceive after infertility treatment despite a normal test result.5,11 Overall, the tests are not highly informative for many women who get tested.
Once abnormal, normal results are meaningless
Once an FSH level or the CCCT has ever been abnormal, the patient has diminished ovarian reserve; normal values in subsequent menstrual cycles do not improve the odds of pregnancy with treatment.14 This fact can be a significant source of confusion and frustration for patients.
3 | GnRH agonist stimulation —no better than FSH testing
This test was developed in the search for a very sensitive assessment of ovarian reserve. It was designed to uncover subtle abnormalities in pituitary and ovarian dynamics. It involves administering a gonadotropin-releasing hormone (GnRH) agonist such as leuprolide acetate (Lupron) on day 2 or 3 of the menstrual cycle and measuring pituitary and ovarian hormone responses.5,15
One group of investigators demonstrated a correlation between stimulated estradiol levels and responsiveness during IVF,16 but other studies have shown that the test does not perform significantly better than day 3 FSH in predicting ovarian reserve.17,18
The sensitivity of GnRH agonist testing for pregnancy is moderate (32% to 89%); specificity ranges from 79% to 97%.19
4 | Inhibin-B—not helpful when used alone
This glycoprotein hormone produced by granulosa cells of developing follicles is a direct measure of ovarian reserve when assessed in the early follicular phase of the menstrual cycle.20 Women treated with IVF who have a low inhibin-B level—particularly when using cutoffs below the range of 45–80 pg/mL—have been shown to respond poorly to superovulation and have a lower pregnancy rate than women with high inhibin-B.21,22 One group of investigators demonstrated that women with clinical evidence of diminished ovarian reserve but a normal FSH level also had low inhibin-B production, suggesting that it may be a more sensitive marker than FSH.22
Inhibin-B testing involves a simple blood draw. However, the test has been incorporated into clinical assessment of ovarian reserve only to a limited degree, due to the lack of reliable assays and controversy concerning its prognostic value.23
Because of these limitations, routine testing of serum inhibin-B in isolation of other markers of ovarian reserve is not recommended.
5 | Antral follicle count—good predictor of IVF outcome
Transvaginal ultrasonographic determination of the number of ovarian follicles that measure between 2 mm and 10 mm in diameter in the early follicular phase of the cycle yields the AFC. As a direct marker of the cohort of growing follicles in the early menstrual cycle, the AFC is believed to correlate strongly with the number of primordial follicles present in the ovary and, therefore, ovarian reserve. Total AFCs of less than 5 to 10 are suggestive of diminished ovarian reserve.24,25
In IVF cycles, AFC has proven to be an accurate predictor of number of oocytes retrieved, risk of cycle cancellation, and odds of conception.24,25 Some investigators have even suggested that, compared with other markers of ovarian reserve, AFC is the best independent predictor of outcome in IVF cycles.7,26-27
In a group of normally cycling women with proven fertility, AFC also showed a strong correlation with age, declining slowly until age 37 and more rapidly thereafter.28,29
AFC sensitivity for pregnancy is moderate and varies widely in published reports (8% to 60%), whereas specificity tends to be higher (33% to 96%).19
Drawbacks of AFC
- Because of the need to perform transvaginal ultrasonography, AFC is a more invasive and often more expensive test than hormonal biomarkers
- Accurate assessment of AFC requires an experienced sonographer and can be limited in patients who have had pelvic surgery or uterine fibroids and in those who are obese
- Moderate interobserver and intercycle variability of AFC determinations limits its reproducibility29,30
- As with basal FSH measurement, the intercycle variability of AFC does not correlate well with IVF outcome in individual patients.30
6 | Anti-Müllerian hormone— many advantages
The drawbacks of the tests just described— e.g., intercycle variability, lack of uniform cutoffs, and limited ability to predict IVF outcomes—make the development of more reliable measures of ovarian reserve a priority in reproductive medicine. AMH is a highly promising marker that appears to have many advantages over other tests and may have the greatest power to predict ovarian aging in women of reproductive age.
How it works
AMH is a glycoprotein growth factor and a member of the transforming growth factor-ß superfamily.31 It is primarily produced by the pool of early-growing follicles, which are believed to serve as a proxy for the number of primordial follicles in the ovary. The number of primordial follicles at a given point in time represents the ovarian reserve. AMH levels above 0.7 ng/mL are considered normal; values between 0.3 ng/mL and 0.7 ng/mL are consistent with borderline ovarian reserve, according to 2007 data from Reprosource Corp.
AMH has been studied as a marker of ovarian reserve for 6 years, with multiple reports describing declines in levels with age and with diminishing oocyte numbers. It is undetectable at menopause.32
The age-related decline in AMH is gradual but measurable even in young women, consistently preceding changes in other markers of ovarian reserve such as FSH and inhibin-B.32-35 The longitudinal changes in AMH have been demonstrated in ovulatory premenopausal women and healthy volunteers with proven fertility.33,34 In one series of women followed over a mean of 4 years (ages 25 to 46), AMH testing was superior to day 3 FSH, inhibin-B, and AFC in its ability to predict the onset of cycle irregularity and the menopausal transition.33
Does it predict oocyte quality?
AMH has performed well as a biomarker, comparable in most series to AFC and superior to FSH. AMH levels are strongly correlated with the number of oocytes retrieved during IVF and the odds of cycle cancellation due to poor response35-41 —but does it accurately characterize oocyte quality, the other element of ovarian reserve?
Some reports have shown a strong association between AMH levels and surrogates of oocyte quality, including fertilization, oocyte morphology, embryo quality, and pregnancy and miscarriage rates,36-41 but others have not.42 Some reports demonstrate a relationship between AMH and some but not all surrogate markers of oocyte quality.40
Advantages of AMH
- It demonstrates minimal intracycle variability.32,43-45 Compared with other markers of ovarian reserve, which must be measured early in the follicular phase of the menstrual cycle, AMH can be assessed at random times, making it a more convenient method for patients and physicians
- It demonstrates minimal intercycle variability32,34
- AMH levels are not significantly affected by the hormonal changes of pregnancy, oral contraceptive use, or GnRH treatment, and can be measured in these settings.46,47
Utility of AMH is limited in PCOS and obesity
The ability to use AMH as a marker of ovarian aging in women who have polycystic ovary syndrome (PCOS) and in women who are obese may be limited by the ovulatory dysfunction in these populations. Circulating levels of AMH are higher in women with PCOS than in unaffected women, a finding thought to be indicative of oligo-ovulation and poor follicular development in polycystic ovaries.48-53
In a recent series investigating AMH levels in women with PCOS, AMH and the degree of insulin resistance were positively correlated, and the AMH level was negatively correlated with the number of menses in a year.49 The consistently positive correlation between AMH and PCOS may suggest a future role for this marker as a diagnostic tool.
In obese women who do not have PCOS, AMH production may be lower than in women of normal weight. In a recent series, normally cycling obese women in the later reproductive years were shown to have an AMH level 70% lower than those in women who were not obese.54 These differences have not been well studied in younger obese women.
Which test is best?
AMH may be preferable to the other tests to assess ovarian reserve because it can be measured any time during the menstrual cycle or between cycles. AMH measurement is also useful if a woman is taking oral contraceptives or leuprolide acetate because these medications may confound the results of the other test methods. In addition, AMH may be the earliest indicator of decline in ovarian reproductive function. As such, it may highlight cases that merit a search for other causes of infertility and make it possible to treat them in a timely manner.
Elevated AMH may reveal occult PCOS and warn of significant risk of ovarian hyperstimulation prior to ovulation induction with gonadotrophins, so that the clinician can plan smaller doses.
A normal female is born with 1 million to 2 million oocytes, a number that declines continuously, primarily through the process of follicular atresia. By the onset of puberty, the number of oocytes has declined to approximately 300,000. As a woman enters her late 30s, when the total number of oocytes is approximately 25,000, the pace of oocyte depletion begins to increase, as does the rate of spontaneous miscarriage.1,55,56
The effect of age on fertility is believed to arise from changes in both oocyte number and quality. Multiple investigators have found a greater frequency of cellular abnormalities in oocytes from older women.1,2,5,15,57
Although ovarian reserve declines with age in all women, women of similar ages can have very different degrees of ovarian reserve, and some women who have very poor ovarian reserve may never conceive, despite aggressive fertility treatment.
The biologic basis for differences in ovarian reserve among similar groups of women is not completely understood, but is probably rooted in genetic, lifestyle, and environmental factors that affect granulosa cell and oocyte function. Identifying sensitive biomarkers that can determine ovarian reserve independent of age is critical to predict fertility and age at menopause.5
1. Practice Committee of the American Society for Reproductive Medicine. Age and infertility in women. Fertil Steril. 2006;86:S248-S252.
2. Muasher SJ, Oehninger S, Simonetti S, Matta J, Ellis LM, Liu H-C. The value of basal and/or stimulated serum gonadotropin levels in prediction of stimulation response and in vitro fertilization outcome. Fertil Steril. 1988;50:298-307.
3. Scott RT, Toner JP, Muasher SJ, Oehninger S, Robinson S, Rosenwaks Z. Follicle stimulating hormone levels on cycle day 3 are predictive of in vitro fertilization outcome. Fertil Steril. 1989;51:651-654.
4. Toner JP, Philiput CB, Jones GS, Muasher SJ. Basal follicle stimulating hormone level is a better predictor of in vitro fertilization outcome than age. Fertil Steril. 1991;55:784-791.
5. Barnhart K, Osheroff J. Follicle stimulating hormone as a predictor of fertility. Curr Opin Obstet Gynecol. 1998;10:227-232.
6. Hofmann GE, Danforth DR, Seifer DB. Inhibin-B: the physiologic basis of the clomiphene citrate challenge test for ovarian reserve screening. Fertil Steril. 1998;69:474-477.
7. Yong PY, Baird DT, Thong KJ, McNeilly AS, Anderson RA. Prospective analysis of the relationships between the ovarian follicle cohort and basal FSH concentration, the inhibin response to exogenous FSH and ovarian follicle number at different stages of the normal menstrual cycle and after pituitary down-regulation. Hum Reprod. 2003;18:35-44.
8. Scott RT, Jr, Illions EH, Kost ER, Dellinger C, Hofmann GE, Navot D. Evaluation of the significance of the estradiol response during the clomiphene citrate challenge test. Fertil Steril. 1993;60:242-246.
9. Esposito MA, Coutifaris C, Barnhart KT. A moderately elevated day 3 FSH concentration has limited predictive value, especially in younger women. Hum Reprod. 2002;17:118-123.
10. Bancsi L, Broekmans FJM, Wol BWJ, Habbema DK, te Velde ER. Performance of basal follicle-stimulating hormone in the prediction of poor ovarian response and failure to become pregnant after in vitro fertilization: a meta-analysis. Fertil Steril. 2003;79:1091-1100.
11. Jain T, Soules MR, Collins JA. Comparison of basal follicle-stimulating hormone versus the clomiphene citrate challenge test for ovarian reserve screening. Fertil Steril. 2004;82:180-185.
12. Toner JP. Modest follicle-stimulating hormone elevations in younger women: warn but don’t disqualify. Fertil Steril. 2004;81:1493-1495.
13. Van Rooij IAJ, de Jong E, Broekmans FJM, Looman CWN, Habbeman DK, te Velde ER. High follicle-stimulating hormone levels should not necessarily lead to the exclusion of subfertile patients from treatment. Fertil Steril. 2004;81:1478-1485.
14. Scott RT, Hofmann GE, Oehninger S, Muasher SJ. Intercycle variability of day 3 follicle-stimulating hormone levels and its effect on stimulation quality in in vitro fertilization. Fertil Steril. 1990;54:297-302.
15. Bulkulmez O, Arici A. Assessment of ovarian reserve. Curr Opin Obstet Gynecol. 2004;16:231-237.
16. Ranieri DM, Quinn F, Makhlouf A, et al. Simultaneous evaluation of basal follicle-stimulating hormone and 17-beta-estradiol response to gonadotropin-releasing hormone analogue stimulation: an improved predictor of ovarian reserve. Fertil Steril. 1998;70:227-233.
17. Fujimoto VY, Klein NA, Battaglia DE, Bremmer WJ, Soules MR. The anterior pituitary response to a gonadotropin-releasing hormone challenge test in normal older reproductive age women. Fertil Steril. 1996;65:539-544.
18. Galtier-Dereure F, De Bouard V, Picto MC, et al. Ovarian reserve test with the gonadotrophin-releasing hormone agonist buserelin: correlation with in-vitro fertilization outcome. Hum Reprod. 1996;11:1393-1398.
19. Broekmans FJ, Fwee J, Hendricks DJ, Mol BW, Lambalk CB. A systematic review of tests predicting ovarian reserve and IVF outcome. Hum Reprod Update. 2006;12:685-718.
20. Klein NA, Illingworth PJ, Groome NP, NcNeilly AS, Battaglia DE, Soules MR. Decreased inhibin B secretion is associated with the monotropic FSH rise in older, ovulatory women: a study of serum and follicular fluid levels of dimeric inhibin A and B in spontaneous menstrual cycles. J Clin Endocrinol Metab. 1996;81:2742-2745.
21. Seifer DB, Lambert-Messerlian G, Hogan JW, et al. Day 3 serum inhibin-B is predictive of assisted reproductive technologies outcome. Fertil Steril. 1997;67:110-114.
22. Seifer DB, Scott RT, Jr, Bergh PA, et al. Women with declining ovarian reserve may demonstrate a decrease in day 3 serum inhibin B before a rise in day 3 follicle-stimulating hormone. Fertil Steril. 1999;72:63-65.
23. Corson SL, Gutmann J, Batzer FR, Wallace H, Klein N, Soules MR. Inhibin-B as a test of ovarian reserve for infertile women. Hum Reprod. 1999;14:2818-2821.
24. Tomas C, Nuojua-Huttunen S, Martikainen H. Pretreatment transvaginal ultrasound examination predicts ovarian responsiveness to gonadotrophins in in-vitro fertilization. Hum Reprod. 1997;12:220-223.
25. Chang MY, Chiang CH, Hsieh TT, Soong YK, Hsu KH. Use of the antral follicle count to predict the outcome of assisted reproductive technologies. Fertil Steril. 1998;69:505-510.
26. Hung E, Tang OS, Ho PC. The significance of the number of antral follicles prior to stimulation in predicting ovarian responses in an IVF programme. Hum Reprod. 2000;15:1937-1942.
27. Bancsi LFJMM, Broekmans FJM, Eijkemans MJC, de Jong FH, Habbema JDF, te Velde ER. Predictors of poor ovarian response in in vitro fertilization: a prospective study comparing basal markers of ovarian reserve. Fertil Steril. 2002;77:328-336.
28. Ng EH, Yeung WS, Fong DY, Ho PC. Effects of age on hormonal and ultrasound markers of ovarian reserve in Chinese women with proven fertility. Hum Reprod. 2003;18:2169-2174.
29. Scheffer GJ, Broekmans FJ, Dorland M, Habbema JD, Looman CW, te Velde ER. Antral follicle counts by transvaginal ultrasonography are related to age in women with proven natural fertility. Fertil Steril. 1999;72:845-851.
30. Hansen KR, Morris JL, Thyer AC, Soules MR. Reproductive aging and the variability in the ovarian antral follicle count: application in the clinical setting. Fertil Steril. 2003;80:577-583.
31. Cate RL, Mattaliano RJ, Hession C, et al. Isolation of the bovine and human genes for Müllerian inhibiting substance and expression of the human gene in animal cells. Cell. 1986;45:685-698.
32. de Vet A, Laven JSE, de Jong FH, Themmen APN, Fauser BCJM. Anti-Müllerian hormone serum levels: a putative marker for ovarian aging. Fertil Steril. 2002;77:357-362.
33. van Rooij IAJ, Broekmans FJM, Scheffer GJ, et al. Serum anti-Müllerian hormone levels best reflect the reproductive decline with age in normal women with proven fertility: a longitudinal study. Fertil Steril. 2005;83:979-987.
34. van Rooij IAJ, Tonkelaar I, Broekmans FJ, et al. Anti-Müllerian hormone is a promising predictor for the occurrence of the menopausal transition. Menopause. 2004;11:601-606.
35. Tremellen KP, Kolo M, Gilmore A, Lekamge DN. Anti-Müllerian hormone as a marker of ovarian reserve. Aust N Z J Obstet Gynaecol. 2005;45:20-24.
36. Silberstein T, MacLaughlin DT, Shai I, et al. Müllerian-inhibiting substance levels at the time of HCG administration in IVF cycles predict both ovarian reserve and embryo morphology. Hum Reprod. 2006;21:159-163.
37. Seifer DB, MacLaughlin DT, Christian BP, Feng B, Shelden RM. Early follicular serum Müllerian-inhibiting substance levels are associated with ovarian response during assisted reproductive technology cycles. Fertil Steril. 2002;77:468-471.
38. Ebner T, Sommergruber M, Moser M, Shebl O, Schreier-Lechner E, Tews G. Basal level anti-Müllerian hormone is associated with oocyte quality in stimulated cycles. Hum Reprod. 2006;21:2022-2026.
39. Hazout A, Bouchard P, Seifer DB, Aussage P, Junca AM, Cohen-Bacrie P. Serum anti-Müllerian hormone/Müllerian-inhibiting substance appears to be a more discriminatory marker of ART outcome than follicular stimulating hormone, inhibin B or estradiol. Fertil Steril. 2004;82:1323-1329.
40. Nelson SM, Yates RW, Fleming R. Serum anti-Müllerian hormone and FSH: prediction of live birth and extremes of response in stimulated cycles—implications for individualization of therapy. Hum Reprod. 2007;22:2414-2421.
41. Fanchin R, Mendez DH, Frydman N, et al. Anti-Müllerian hormone concentrations in the follicular fluid of the preovulatory follicle are predictive of the implantation potential of the ensuing embryo obtained by in vitro fertilization. J Clin Endocrinol Metab. 2007;92:1796-1802.
42. Smeenk JM, Sweep FC, Zielhuis GA, Kremer JA, Th omas CM, Braat DD. Anti-Müllerian hormone predicts ovarian responsiveness, but not embryo quality or pregnancy, after in vitro fertilization or intracyoplasmic sperm injection. Fertil Steril. 2007;87:223-226.
43. Hehenkamp WJ, Looman CW, Themmen AP, de Jong FM, Te Velde ER, Broekmans FJ. Anti-Müllerian hormone levels in the spontaneous menstrual cycle do not show substantial fluctuation. J Clin Endocrinol Metab. 2006;91:4057-4063.
44. La Marca A, Stabile G, Artenisio AC, Volpe A. Serum anti-Müllerian hormone throughout the menstrual cycle. Hum Reprod. 2006;21:3103-3107.
45. Tsepelidis S, Devreker F, Demeestere F, Flahaut I, Gervy A, Englert C. Stable serum levels of anti-Müllerian hormone during the menstrual cycle: a prospective study in normo-ovulatory women. Hum Reprod. 2007;22:1837-1840.
46. La Marca A, Giulini Orvieto R, De Leo V, Volpe A. Anti-Müllerian hormone concentrations in maternal serum during pregnancy. Hum Reprod. 2005;20:1569-1572.
47. Somunkiran A, Yavuz T, Yucel O, Ozdemir I. Anti-Müllerian hormone levels during hormonal contraception in women with polycystic ovary syndrome. Eur J Obstet Gynecol Reprod Biol. 2007;134:196-201.
48. Al-Qahtani A, Groome NP. Anti-Müllerian hormone: Cinderella finds new admirers. J Clin Endocrinol Metab. 2006;91:3760-3762.
49. La Marca A, Orvieto R, Giulini S, Jasonni VM, Volpe A, De Leo V. Müllerian-inhibiting substance in women with polycystic ovary syndrome: relationship with hormonal and metabolic characteristics. Fertil Steril. 2004;82:970-971.
50. Piltonen T, Morin-Papunen L, Koivunen R, Perheentupa A, Ruokonen A, Tapanainen JS. Serum anti-Müllerian hormone levels remain high until late reproductive age and decrease during metformin therapy in women with polycystic ovary syndrome. Hum Reprod. 2005;20:1820-1836.
51. Pigny P, Merlen E, Robert Y, et al. Elevated serum level of anti-Müllerian hormone in patients with polycystic ovary syndrome: relationship to the ovarian follicle excess and to the follicular arrest. J Clin Endocrinol Metab. 2003;88:5957-5962.
52. Cook CL, Siow Y, Brenner AG, Fallat ME. Relationship between serum anti-Müllerian substance and other reproductive hormones in untreated women with polycystic ovary syndrome and endometriosis. Fertil Steril. 1997;67:962-965.
53. Pellatt L, Hanna L, Brincat M, et al. Granulosa cell production of anti-Müllerian hormone is increased in polycystic ovaries. J Clin Endocrinol Metab. 2007;92:240-245.
54. Freeman EW, Gracia CG, Sammel MD, Lin H, Lim LC, Strauss JF, 3rd. Association of anti-Müllerian hormone levels with obesity in later reproductive-age women. Fertil Steril. 2007;87:101-106.
55. Scott RT, Opsahl MS, Leonardi MR, Neall GS, Illions EH, Navot D. Life table analysis of pregnancy rates in a general infertility population relative to ovarian reserve and patient age. Hum Reprod. 1995;10:1706-1710.
56. Speroff L. Fritz M. eds. Clinical Gynecologic Endocrinology and Infertility. 7th ed. Philadelphia: Lippincott Williams & Wilkins; 2004.
57. Lim AS, Tsakok MFH. Age-related decline in fertility: a link to degenerative oocytes? Fertil Steril. 1997;68:265-271.
The University of Medicine and Dentistry of New Jersey (UMDNJ) owns a patent relating to the use of anti-Müllerian hormone/Müllerian inhibiting substance for predicting ovarian response in women with infertility. The patent is based in part on work that Dr. Seifer carried out while employed at UMDNJ. In accordance with UMDNJ policy, Dr. Seifer, a named inventor on this patent, assigned his interest in the invention to UMDNJ. UMDNJ has a licensing agreement with Diagnostic Systems Laboratory for the use of the claimed invention. Dr. Seifer receives a portion of the royalties, as determined by UMDNJ policy, that UMDNJ gains from this licensing agreement.
CASE: Borderline test result prompts referral
A 36-year-old nulliparous woman is seen in your office for evaluation after 6 months of infertility. She is ovulatory, and has been using an ovulation-prediction kit to time intercourse. You learn that she had Chlamydia trachomatis infection in the distant past, but elicit no other significant medical or surgical history. She reports that she smoked approximately one pack of cigarettes a day for 15 years but gave up smoking 5 years ago.
You order a hysterosalpingogram, followed by day 3 testing of follicle-stimulating hormone (FSH). The hysterosalpingogram is normal; the FSH level is 7.5 mIU/mL and the estradiol level is 30 pg/mL—both in the normal range.
The patient asks for testing of anti-Müllerian hormone (AMH; also known as Müllerian-inhibiting substance) because she has read that it is a new marker of fertility. The result is 0.5 ng/mL, a borderline value. After reviewing these results, you refer her to a reproductive endocrinologist for further management.
Was the test for AMH indicated? And is this referral appropriate?
The referral is entirely appropriate, even though the patient has not been trying to conceive for a full year. Why? The AMH value suggests that her ovarian reserve is in early decline. She would benefit from evaluation by a subspecialist who can review the entire spectrum of treatments, including aggressive options such as ovulation induction and in vitro fertilization (IVF), to optimize her reproductive success.
This article reviews the various biomarkers available to assess ovarian reserve in women who experience infertility:
- day 3 (basal) FSH
- clomiphene citrate challenge
- gonadotropin-releasing hormone (GnRH) agonist stimulation
- inhibin-B
- antral follicle count (AFC)
- AMH.
The AFC and AMH tend to detect the earliest changes in ovarian reserve, followed, sequentially, by inhibin-B, the clomiphene citrate challenge test (CCCT), and basal FSH.
The tests we describe are used primarily to assess treatment prognosis in infertile women. In time, however, appropriate population screening of ovarian reserve may be feasible to provide many more women with information about their reproductive potential and help them shape their life plan.
What makes a test valuable?
Ovarian reserve describes a woman’s reproductive potential—specifically, the number and quality of oocytes she possesses.1 Biochemical tests of ovarian reserve emerged during the rise of assisted reproductive technologies (ART) in the late 1980s to predict both responsiveness to superovulation drugs and the odds of pregnancy with treatment.
Ideally, a test that assesses ovarian reserve should be affordable, straightforward, rapidly interpretable, and minimally invasive. It also should be able to detect changes that begin early in reproductive life. To be applicable to large populations of reproductive-age women, it should be of use anytime in the menstrual cycle, and should provide reproducible and highly accurate assessment of the reproductive aging process.
Our ability to offer tests that accurately measure ovarian reserve has a significant impact on women at risk of infertility and early menopause and on those who choose to delay childbearing for personal (nonmedical) reasons. These tests have become increasingly relevant because women are choosing to have their first child at a later age than their counterparts did 20 years ago:
- In 1980, 40% of women having their first baby were younger than 25 years, and only 5% were older than 35
- In 2000, 25% of women were younger than 25 when their first child was born, and 15% were older than 35.
Who should be tested?
Ovarian reserve is a complex clinical phenomenon that is influenced by age, genetics, and environmental variables. The decline in a woman’s ovarian reserve over time is irreversible; the trajectory of this decline is fundamental to the odds of fertility with age and the timing of the menopausal transition. At present, the markers used most often in clinical practice have some utility but also suffer from several drawbacks ( TABLE ).
For the general practitioner performing an infertility evaluation, we recommend focusing on the following groups of women for ovarian reserve testing:
- women over 30 years of age
- women with a history of exposure to a confirmed gonadotoxin, i.e., tobacco smoke, chemotherapy, radiation therapy
- women with a strong family history of early menopause or premature ovarian failure
- women who have had extensive ovarian surgery, i.e., cystectomy and unilateral oophorectomy.
Testing tends to have the highest yield in these groups. Women who have abnormal results should be referred to a reproductive endocrinologist for further evaluation and treatment.
The six tests are described below.
TABLE
How six markers of ovarian reserve stack up
| Test (year described) | Timing | Intracycle and intercycle variability | Sensitivity (specificity) | Reflects changes in ovarian reserve | Normal levels | Confounders | Out-of-pocket cost |
|---|---|---|---|---|---|---|---|
| Basal follicle-stimulating hormone (FSH) (1988) | Day 3 of menstrual cycle | Clinically significant | 7%–8% (98%–99%) | Late | • Early follicular phase FSH level <10 mIU/mL • Estradiol level <80 pg/mL | • High estradiol level (decreases) • Oral contraceptive use (decreases) • Pregnancy (decreases) | $125–$150 |
| Clomiphene challenge test (1989) | Days 3 and 10 of menstrual cycle | Clinically significant | 25%–40% (98%–99%) | Late | • Day 3 FSH level <10 mIU/mL; day 3 estradiol level <80 pg/mL • Day 10 FSH level <10 mIU/mL | • High day 3 estradiol level (decreases day 3 FSH) • Low day 10 estradiol (increases day 10 FSH) • Oral contraceptive use (decreases) • Pregnancy (decreases) | $550–$600 |
| GnRH agonist (1988) | Early follicular phase of menstrual cycle | Clinically significant | 32%–89% (79%–97%) | Late | Variable | • Oral contraceptives (decrease estradiol levels) • Pregnancy (increases estrogens) | $300–$350 |
| Inhibin-B (1997) | Early follicular phase of menstrual cycle | Clinically significant | 33%–81% (29%–95%) | Early | Variable in the literature; normal cutoffs range from ≥45–80 pg/mL | • Obesity (decreases) • PCOS (increases) • Exogenous FSH administration (increases) • Oral contraceptive use (decreases) | $150–$200 |
| Antral follicle count (1997) | Early follicular phase of menstrual cycle | Clinically significant (includes interobserver variability) | 8%–60% (33%–96%) | Earliest | ≥5–10 total antral follicles | • Oral contraceptive use (decreases) • Polycystic ovary syndrome (PCOS) (increases) | $300–$500 |
| Anti–Müllerian hormone/Müllerian-inhibiting substance (2002) | At any time; not cycle-dependent | Minimal | 49%–76% (89%–94%) | Earliest | >0.7 ng/mL | • PCOS (increases) • Obesity (decreases) • Exogenous FSH administration (decreases) | $150–$400 |
1 | Basal FSH—widely used but only moderately informative
Day 3 FSH and the CCCT are the most widely used measures of ovarian reserve in ART practice. The use of early follicular-phase FSH as a marker of ovarian reserve and fertility was proposed 20 years ago with the emergence of IVF.2-4 The test is an indirect assessment of ovarian reserve in that it measures pituitary production of FSH in response to feedback from ovarian hormones. Estradiol and inhibin-B reach a nadir early in the menstrual cycle; measuring FSH on day 3 offers a glimpse of the functioning of the hypothalamic–pituitary–ovarian axis before ovarian hormone levels rise later in the cycle ( FIGURE 1 ).5,6
FIGURE 1 The HPO axis
The FSH level opens a window onto the function of the hypothalamic–pituitary–ovarian axis before ovarian hormone levels rise in the cycle. Women who have normal ovarian reserve have sufficient ovarian hormone production early in the menstrual cycle to maintain FSH levels within the normal range. Conversely, a “monotropic” elevation in FSH—one that is unaccompanied by a rise in luteinizing hormone (LH)—reflects poor hormone production from an aging pool of ovarian follicles and disinhibition of FSH production.5,6
FSH measurements are typically combined with estradiol to enhance the sensitivity of testing ( FIGURE 2, ). Premature elevations of estradiol early in the follicular phase are driven by rising FSH levels in women with declining ovarian reserve. Abnormally elevated estrogen levels then feed back negatively on pituitary production of FSH and mask an elevation that might otherwise reveal diminished ovarian reserve. Measurement of both FSH and estradiol on cycle day 3 may therefore help decrease the incidence of false-negative testing.
Commonly cited criteria for normal ovarian reserve are:
- early follicular phase FSH, <10 mIU/mL
- estradiol, <80 pg/mL1
It is extremely important to note, however, that these are general guidelines and that cutoffs are both laboratory- and practice-specific.
FIGURE 2 Monthly and lifetime variations in estradiol and FSH
How 17ß-estradiol and follicle-stimulating hormone levels vary over the menstrual cycle (top) and a woman’s lifetime (bottom).
2 | Clomiphene citrate—more sensitive than FSH testing
Like basal FSH testing, the CCCT is an indirect assessment of ovarian reserve. Unlike FSH testing, the CCCT is provocative. It involves administration of 100 mg of clomiphene citrate (Clomid) on days 5 through 9 of the menstrual cycle, with FSH and estradiol measured on days 3 and 10. Once clomiphene citrate is administered, FSH and LH levels rise, followed by an increase in estradiol and inhibin. Evidence suggests that the smaller follicular cohorts in women with diminished ovarian reserve produce less inhibin-B and estradiol and, therefore, less negative feedback on clomiphene-induced pituitary FSH release.6,7 The result: persistent elevation of the day 10 FSH value and a positive screen for diminished ovarian reserve.
In some women, day 10 FSH is elevated even after a normal day 3 value. This makes the CCCT more sensitive than basal FSH testing; it can identify women who might go unrecognized if evaluated by day 3 FSH and estradiol levels alone.
More expensive and labor-intensive than the alternatives
Interpretation of the CCCT requires that FSH and estradiol both be assessed on days 3 and 10. An elevated FSH (≥10 mIU/mL) on either day indicates diminished ovarian reserve. As with basal FSH testing, elevated estradiol (≥80 pg/mL) on day 3 is considered abnormal. The day 10 estradiol value of the CCCT reflects whether or not clomiphene citrate was administered appropriately, and should be elevated. However, the significance of the day 10 estradiol level has been debated with respect to its predictive value for pregnancy in infertile populations.8
The addition of day 10 FSH assessment improves the sensitivity of the CCCT over basal FSH measurement, but makes it a more expensive and labor-intensive test ( TABLE ).5,6 The CCCT involves administration of clomiphene citrate, a safe drug (though it can have side effects), and two blood draws instead of one. Nevertheless, both tests are relatively noninvasive, rapid measures of ovarian reserve.
Drawbacks of the tests
Both basal FSH testing and the CCCT are widely used, although support for their ability to predict ovarian reserve in the infertile population has been challenged recently. Newer data demonstrate that these tests are limited in their ability to predict outcome (pregnancy and response to superovulation drugs) in all but a narrow group of patients undergoing IVF. Performance is particularly limited in:
Additional drawbacks of basal FSH testing and the CCCT include:
- significant variability of test results from cycle to cycle (intercycle variability)
- limited time frame within which the tests can be performed (intracycle variability).
The basal FSH test and CCCT have high specificity (98% to 99% for each) as an assessment of reproductive performance in infertile women and generate few false-positive results.5,6 However, the high screen cutoffs that allow for such specificity come at a price: Few women will screen positive, and sensitivity of the tests is low (between 7% and 8% for basal FSH and between 25% and 40% for the CCCT). Such low sensitivity means that many women will not conceive after infertility treatment despite a normal test result.5,11 Overall, the tests are not highly informative for many women who get tested.
Once abnormal, normal results are meaningless
Once an FSH level or the CCCT has ever been abnormal, the patient has diminished ovarian reserve; normal values in subsequent menstrual cycles do not improve the odds of pregnancy with treatment.14 This fact can be a significant source of confusion and frustration for patients.
3 | GnRH agonist stimulation —no better than FSH testing
This test was developed in the search for a very sensitive assessment of ovarian reserve. It was designed to uncover subtle abnormalities in pituitary and ovarian dynamics. It involves administering a gonadotropin-releasing hormone (GnRH) agonist such as leuprolide acetate (Lupron) on day 2 or 3 of the menstrual cycle and measuring pituitary and ovarian hormone responses.5,15
One group of investigators demonstrated a correlation between stimulated estradiol levels and responsiveness during IVF,16 but other studies have shown that the test does not perform significantly better than day 3 FSH in predicting ovarian reserve.17,18
The sensitivity of GnRH agonist testing for pregnancy is moderate (32% to 89%); specificity ranges from 79% to 97%.19
4 | Inhibin-B—not helpful when used alone
This glycoprotein hormone produced by granulosa cells of developing follicles is a direct measure of ovarian reserve when assessed in the early follicular phase of the menstrual cycle.20 Women treated with IVF who have a low inhibin-B level—particularly when using cutoffs below the range of 45–80 pg/mL—have been shown to respond poorly to superovulation and have a lower pregnancy rate than women with high inhibin-B.21,22 One group of investigators demonstrated that women with clinical evidence of diminished ovarian reserve but a normal FSH level also had low inhibin-B production, suggesting that it may be a more sensitive marker than FSH.22
Inhibin-B testing involves a simple blood draw. However, the test has been incorporated into clinical assessment of ovarian reserve only to a limited degree, due to the lack of reliable assays and controversy concerning its prognostic value.23
Because of these limitations, routine testing of serum inhibin-B in isolation of other markers of ovarian reserve is not recommended.
5 | Antral follicle count—good predictor of IVF outcome
Transvaginal ultrasonographic determination of the number of ovarian follicles that measure between 2 mm and 10 mm in diameter in the early follicular phase of the cycle yields the AFC. As a direct marker of the cohort of growing follicles in the early menstrual cycle, the AFC is believed to correlate strongly with the number of primordial follicles present in the ovary and, therefore, ovarian reserve. Total AFCs of less than 5 to 10 are suggestive of diminished ovarian reserve.24,25
In IVF cycles, AFC has proven to be an accurate predictor of number of oocytes retrieved, risk of cycle cancellation, and odds of conception.24,25 Some investigators have even suggested that, compared with other markers of ovarian reserve, AFC is the best independent predictor of outcome in IVF cycles.7,26-27
In a group of normally cycling women with proven fertility, AFC also showed a strong correlation with age, declining slowly until age 37 and more rapidly thereafter.28,29
AFC sensitivity for pregnancy is moderate and varies widely in published reports (8% to 60%), whereas specificity tends to be higher (33% to 96%).19
Drawbacks of AFC
- Because of the need to perform transvaginal ultrasonography, AFC is a more invasive and often more expensive test than hormonal biomarkers
- Accurate assessment of AFC requires an experienced sonographer and can be limited in patients who have had pelvic surgery or uterine fibroids and in those who are obese
- Moderate interobserver and intercycle variability of AFC determinations limits its reproducibility29,30
- As with basal FSH measurement, the intercycle variability of AFC does not correlate well with IVF outcome in individual patients.30
6 | Anti-Müllerian hormone— many advantages
The drawbacks of the tests just described— e.g., intercycle variability, lack of uniform cutoffs, and limited ability to predict IVF outcomes—make the development of more reliable measures of ovarian reserve a priority in reproductive medicine. AMH is a highly promising marker that appears to have many advantages over other tests and may have the greatest power to predict ovarian aging in women of reproductive age.
How it works
AMH is a glycoprotein growth factor and a member of the transforming growth factor-ß superfamily.31 It is primarily produced by the pool of early-growing follicles, which are believed to serve as a proxy for the number of primordial follicles in the ovary. The number of primordial follicles at a given point in time represents the ovarian reserve. AMH levels above 0.7 ng/mL are considered normal; values between 0.3 ng/mL and 0.7 ng/mL are consistent with borderline ovarian reserve, according to 2007 data from Reprosource Corp.
AMH has been studied as a marker of ovarian reserve for 6 years, with multiple reports describing declines in levels with age and with diminishing oocyte numbers. It is undetectable at menopause.32
The age-related decline in AMH is gradual but measurable even in young women, consistently preceding changes in other markers of ovarian reserve such as FSH and inhibin-B.32-35 The longitudinal changes in AMH have been demonstrated in ovulatory premenopausal women and healthy volunteers with proven fertility.33,34 In one series of women followed over a mean of 4 years (ages 25 to 46), AMH testing was superior to day 3 FSH, inhibin-B, and AFC in its ability to predict the onset of cycle irregularity and the menopausal transition.33
Does it predict oocyte quality?
AMH has performed well as a biomarker, comparable in most series to AFC and superior to FSH. AMH levels are strongly correlated with the number of oocytes retrieved during IVF and the odds of cycle cancellation due to poor response35-41 —but does it accurately characterize oocyte quality, the other element of ovarian reserve?
Some reports have shown a strong association between AMH levels and surrogates of oocyte quality, including fertilization, oocyte morphology, embryo quality, and pregnancy and miscarriage rates,36-41 but others have not.42 Some reports demonstrate a relationship between AMH and some but not all surrogate markers of oocyte quality.40
Advantages of AMH
- It demonstrates minimal intracycle variability.32,43-45 Compared with other markers of ovarian reserve, which must be measured early in the follicular phase of the menstrual cycle, AMH can be assessed at random times, making it a more convenient method for patients and physicians
- It demonstrates minimal intercycle variability32,34
- AMH levels are not significantly affected by the hormonal changes of pregnancy, oral contraceptive use, or GnRH treatment, and can be measured in these settings.46,47
Utility of AMH is limited in PCOS and obesity
The ability to use AMH as a marker of ovarian aging in women who have polycystic ovary syndrome (PCOS) and in women who are obese may be limited by the ovulatory dysfunction in these populations. Circulating levels of AMH are higher in women with PCOS than in unaffected women, a finding thought to be indicative of oligo-ovulation and poor follicular development in polycystic ovaries.48-53
In a recent series investigating AMH levels in women with PCOS, AMH and the degree of insulin resistance were positively correlated, and the AMH level was negatively correlated with the number of menses in a year.49 The consistently positive correlation between AMH and PCOS may suggest a future role for this marker as a diagnostic tool.
In obese women who do not have PCOS, AMH production may be lower than in women of normal weight. In a recent series, normally cycling obese women in the later reproductive years were shown to have an AMH level 70% lower than those in women who were not obese.54 These differences have not been well studied in younger obese women.
Which test is best?
AMH may be preferable to the other tests to assess ovarian reserve because it can be measured any time during the menstrual cycle or between cycles. AMH measurement is also useful if a woman is taking oral contraceptives or leuprolide acetate because these medications may confound the results of the other test methods. In addition, AMH may be the earliest indicator of decline in ovarian reproductive function. As such, it may highlight cases that merit a search for other causes of infertility and make it possible to treat them in a timely manner.
Elevated AMH may reveal occult PCOS and warn of significant risk of ovarian hyperstimulation prior to ovulation induction with gonadotrophins, so that the clinician can plan smaller doses.
A normal female is born with 1 million to 2 million oocytes, a number that declines continuously, primarily through the process of follicular atresia. By the onset of puberty, the number of oocytes has declined to approximately 300,000. As a woman enters her late 30s, when the total number of oocytes is approximately 25,000, the pace of oocyte depletion begins to increase, as does the rate of spontaneous miscarriage.1,55,56
The effect of age on fertility is believed to arise from changes in both oocyte number and quality. Multiple investigators have found a greater frequency of cellular abnormalities in oocytes from older women.1,2,5,15,57
Although ovarian reserve declines with age in all women, women of similar ages can have very different degrees of ovarian reserve, and some women who have very poor ovarian reserve may never conceive, despite aggressive fertility treatment.
The biologic basis for differences in ovarian reserve among similar groups of women is not completely understood, but is probably rooted in genetic, lifestyle, and environmental factors that affect granulosa cell and oocyte function. Identifying sensitive biomarkers that can determine ovarian reserve independent of age is critical to predict fertility and age at menopause.5
1. Practice Committee of the American Society for Reproductive Medicine. Age and infertility in women. Fertil Steril. 2006;86:S248-S252.
2. Muasher SJ, Oehninger S, Simonetti S, Matta J, Ellis LM, Liu H-C. The value of basal and/or stimulated serum gonadotropin levels in prediction of stimulation response and in vitro fertilization outcome. Fertil Steril. 1988;50:298-307.
3. Scott RT, Toner JP, Muasher SJ, Oehninger S, Robinson S, Rosenwaks Z. Follicle stimulating hormone levels on cycle day 3 are predictive of in vitro fertilization outcome. Fertil Steril. 1989;51:651-654.
4. Toner JP, Philiput CB, Jones GS, Muasher SJ. Basal follicle stimulating hormone level is a better predictor of in vitro fertilization outcome than age. Fertil Steril. 1991;55:784-791.
5. Barnhart K, Osheroff J. Follicle stimulating hormone as a predictor of fertility. Curr Opin Obstet Gynecol. 1998;10:227-232.
6. Hofmann GE, Danforth DR, Seifer DB. Inhibin-B: the physiologic basis of the clomiphene citrate challenge test for ovarian reserve screening. Fertil Steril. 1998;69:474-477.
7. Yong PY, Baird DT, Thong KJ, McNeilly AS, Anderson RA. Prospective analysis of the relationships between the ovarian follicle cohort and basal FSH concentration, the inhibin response to exogenous FSH and ovarian follicle number at different stages of the normal menstrual cycle and after pituitary down-regulation. Hum Reprod. 2003;18:35-44.
8. Scott RT, Jr, Illions EH, Kost ER, Dellinger C, Hofmann GE, Navot D. Evaluation of the significance of the estradiol response during the clomiphene citrate challenge test. Fertil Steril. 1993;60:242-246.
9. Esposito MA, Coutifaris C, Barnhart KT. A moderately elevated day 3 FSH concentration has limited predictive value, especially in younger women. Hum Reprod. 2002;17:118-123.
10. Bancsi L, Broekmans FJM, Wol BWJ, Habbema DK, te Velde ER. Performance of basal follicle-stimulating hormone in the prediction of poor ovarian response and failure to become pregnant after in vitro fertilization: a meta-analysis. Fertil Steril. 2003;79:1091-1100.
11. Jain T, Soules MR, Collins JA. Comparison of basal follicle-stimulating hormone versus the clomiphene citrate challenge test for ovarian reserve screening. Fertil Steril. 2004;82:180-185.
12. Toner JP. Modest follicle-stimulating hormone elevations in younger women: warn but don’t disqualify. Fertil Steril. 2004;81:1493-1495.
13. Van Rooij IAJ, de Jong E, Broekmans FJM, Looman CWN, Habbeman DK, te Velde ER. High follicle-stimulating hormone levels should not necessarily lead to the exclusion of subfertile patients from treatment. Fertil Steril. 2004;81:1478-1485.
14. Scott RT, Hofmann GE, Oehninger S, Muasher SJ. Intercycle variability of day 3 follicle-stimulating hormone levels and its effect on stimulation quality in in vitro fertilization. Fertil Steril. 1990;54:297-302.
15. Bulkulmez O, Arici A. Assessment of ovarian reserve. Curr Opin Obstet Gynecol. 2004;16:231-237.
16. Ranieri DM, Quinn F, Makhlouf A, et al. Simultaneous evaluation of basal follicle-stimulating hormone and 17-beta-estradiol response to gonadotropin-releasing hormone analogue stimulation: an improved predictor of ovarian reserve. Fertil Steril. 1998;70:227-233.
17. Fujimoto VY, Klein NA, Battaglia DE, Bremmer WJ, Soules MR. The anterior pituitary response to a gonadotropin-releasing hormone challenge test in normal older reproductive age women. Fertil Steril. 1996;65:539-544.
18. Galtier-Dereure F, De Bouard V, Picto MC, et al. Ovarian reserve test with the gonadotrophin-releasing hormone agonist buserelin: correlation with in-vitro fertilization outcome. Hum Reprod. 1996;11:1393-1398.
19. Broekmans FJ, Fwee J, Hendricks DJ, Mol BW, Lambalk CB. A systematic review of tests predicting ovarian reserve and IVF outcome. Hum Reprod Update. 2006;12:685-718.
20. Klein NA, Illingworth PJ, Groome NP, NcNeilly AS, Battaglia DE, Soules MR. Decreased inhibin B secretion is associated with the monotropic FSH rise in older, ovulatory women: a study of serum and follicular fluid levels of dimeric inhibin A and B in spontaneous menstrual cycles. J Clin Endocrinol Metab. 1996;81:2742-2745.
21. Seifer DB, Lambert-Messerlian G, Hogan JW, et al. Day 3 serum inhibin-B is predictive of assisted reproductive technologies outcome. Fertil Steril. 1997;67:110-114.
22. Seifer DB, Scott RT, Jr, Bergh PA, et al. Women with declining ovarian reserve may demonstrate a decrease in day 3 serum inhibin B before a rise in day 3 follicle-stimulating hormone. Fertil Steril. 1999;72:63-65.
23. Corson SL, Gutmann J, Batzer FR, Wallace H, Klein N, Soules MR. Inhibin-B as a test of ovarian reserve for infertile women. Hum Reprod. 1999;14:2818-2821.
24. Tomas C, Nuojua-Huttunen S, Martikainen H. Pretreatment transvaginal ultrasound examination predicts ovarian responsiveness to gonadotrophins in in-vitro fertilization. Hum Reprod. 1997;12:220-223.
25. Chang MY, Chiang CH, Hsieh TT, Soong YK, Hsu KH. Use of the antral follicle count to predict the outcome of assisted reproductive technologies. Fertil Steril. 1998;69:505-510.
26. Hung E, Tang OS, Ho PC. The significance of the number of antral follicles prior to stimulation in predicting ovarian responses in an IVF programme. Hum Reprod. 2000;15:1937-1942.
27. Bancsi LFJMM, Broekmans FJM, Eijkemans MJC, de Jong FH, Habbema JDF, te Velde ER. Predictors of poor ovarian response in in vitro fertilization: a prospective study comparing basal markers of ovarian reserve. Fertil Steril. 2002;77:328-336.
28. Ng EH, Yeung WS, Fong DY, Ho PC. Effects of age on hormonal and ultrasound markers of ovarian reserve in Chinese women with proven fertility. Hum Reprod. 2003;18:2169-2174.
29. Scheffer GJ, Broekmans FJ, Dorland M, Habbema JD, Looman CW, te Velde ER. Antral follicle counts by transvaginal ultrasonography are related to age in women with proven natural fertility. Fertil Steril. 1999;72:845-851.
30. Hansen KR, Morris JL, Thyer AC, Soules MR. Reproductive aging and the variability in the ovarian antral follicle count: application in the clinical setting. Fertil Steril. 2003;80:577-583.
31. Cate RL, Mattaliano RJ, Hession C, et al. Isolation of the bovine and human genes for Müllerian inhibiting substance and expression of the human gene in animal cells. Cell. 1986;45:685-698.
32. de Vet A, Laven JSE, de Jong FH, Themmen APN, Fauser BCJM. Anti-Müllerian hormone serum levels: a putative marker for ovarian aging. Fertil Steril. 2002;77:357-362.
33. van Rooij IAJ, Broekmans FJM, Scheffer GJ, et al. Serum anti-Müllerian hormone levels best reflect the reproductive decline with age in normal women with proven fertility: a longitudinal study. Fertil Steril. 2005;83:979-987.
34. van Rooij IAJ, Tonkelaar I, Broekmans FJ, et al. Anti-Müllerian hormone is a promising predictor for the occurrence of the menopausal transition. Menopause. 2004;11:601-606.
35. Tremellen KP, Kolo M, Gilmore A, Lekamge DN. Anti-Müllerian hormone as a marker of ovarian reserve. Aust N Z J Obstet Gynaecol. 2005;45:20-24.
36. Silberstein T, MacLaughlin DT, Shai I, et al. Müllerian-inhibiting substance levels at the time of HCG administration in IVF cycles predict both ovarian reserve and embryo morphology. Hum Reprod. 2006;21:159-163.
37. Seifer DB, MacLaughlin DT, Christian BP, Feng B, Shelden RM. Early follicular serum Müllerian-inhibiting substance levels are associated with ovarian response during assisted reproductive technology cycles. Fertil Steril. 2002;77:468-471.
38. Ebner T, Sommergruber M, Moser M, Shebl O, Schreier-Lechner E, Tews G. Basal level anti-Müllerian hormone is associated with oocyte quality in stimulated cycles. Hum Reprod. 2006;21:2022-2026.
39. Hazout A, Bouchard P, Seifer DB, Aussage P, Junca AM, Cohen-Bacrie P. Serum anti-Müllerian hormone/Müllerian-inhibiting substance appears to be a more discriminatory marker of ART outcome than follicular stimulating hormone, inhibin B or estradiol. Fertil Steril. 2004;82:1323-1329.
40. Nelson SM, Yates RW, Fleming R. Serum anti-Müllerian hormone and FSH: prediction of live birth and extremes of response in stimulated cycles—implications for individualization of therapy. Hum Reprod. 2007;22:2414-2421.
41. Fanchin R, Mendez DH, Frydman N, et al. Anti-Müllerian hormone concentrations in the follicular fluid of the preovulatory follicle are predictive of the implantation potential of the ensuing embryo obtained by in vitro fertilization. J Clin Endocrinol Metab. 2007;92:1796-1802.
42. Smeenk JM, Sweep FC, Zielhuis GA, Kremer JA, Th omas CM, Braat DD. Anti-Müllerian hormone predicts ovarian responsiveness, but not embryo quality or pregnancy, after in vitro fertilization or intracyoplasmic sperm injection. Fertil Steril. 2007;87:223-226.
43. Hehenkamp WJ, Looman CW, Themmen AP, de Jong FM, Te Velde ER, Broekmans FJ. Anti-Müllerian hormone levels in the spontaneous menstrual cycle do not show substantial fluctuation. J Clin Endocrinol Metab. 2006;91:4057-4063.
44. La Marca A, Stabile G, Artenisio AC, Volpe A. Serum anti-Müllerian hormone throughout the menstrual cycle. Hum Reprod. 2006;21:3103-3107.
45. Tsepelidis S, Devreker F, Demeestere F, Flahaut I, Gervy A, Englert C. Stable serum levels of anti-Müllerian hormone during the menstrual cycle: a prospective study in normo-ovulatory women. Hum Reprod. 2007;22:1837-1840.
46. La Marca A, Giulini Orvieto R, De Leo V, Volpe A. Anti-Müllerian hormone concentrations in maternal serum during pregnancy. Hum Reprod. 2005;20:1569-1572.
47. Somunkiran A, Yavuz T, Yucel O, Ozdemir I. Anti-Müllerian hormone levels during hormonal contraception in women with polycystic ovary syndrome. Eur J Obstet Gynecol Reprod Biol. 2007;134:196-201.
48. Al-Qahtani A, Groome NP. Anti-Müllerian hormone: Cinderella finds new admirers. J Clin Endocrinol Metab. 2006;91:3760-3762.
49. La Marca A, Orvieto R, Giulini S, Jasonni VM, Volpe A, De Leo V. Müllerian-inhibiting substance in women with polycystic ovary syndrome: relationship with hormonal and metabolic characteristics. Fertil Steril. 2004;82:970-971.
50. Piltonen T, Morin-Papunen L, Koivunen R, Perheentupa A, Ruokonen A, Tapanainen JS. Serum anti-Müllerian hormone levels remain high until late reproductive age and decrease during metformin therapy in women with polycystic ovary syndrome. Hum Reprod. 2005;20:1820-1836.
51. Pigny P, Merlen E, Robert Y, et al. Elevated serum level of anti-Müllerian hormone in patients with polycystic ovary syndrome: relationship to the ovarian follicle excess and to the follicular arrest. J Clin Endocrinol Metab. 2003;88:5957-5962.
52. Cook CL, Siow Y, Brenner AG, Fallat ME. Relationship between serum anti-Müllerian substance and other reproductive hormones in untreated women with polycystic ovary syndrome and endometriosis. Fertil Steril. 1997;67:962-965.
53. Pellatt L, Hanna L, Brincat M, et al. Granulosa cell production of anti-Müllerian hormone is increased in polycystic ovaries. J Clin Endocrinol Metab. 2007;92:240-245.
54. Freeman EW, Gracia CG, Sammel MD, Lin H, Lim LC, Strauss JF, 3rd. Association of anti-Müllerian hormone levels with obesity in later reproductive-age women. Fertil Steril. 2007;87:101-106.
55. Scott RT, Opsahl MS, Leonardi MR, Neall GS, Illions EH, Navot D. Life table analysis of pregnancy rates in a general infertility population relative to ovarian reserve and patient age. Hum Reprod. 1995;10:1706-1710.
56. Speroff L. Fritz M. eds. Clinical Gynecologic Endocrinology and Infertility. 7th ed. Philadelphia: Lippincott Williams & Wilkins; 2004.
57. Lim AS, Tsakok MFH. Age-related decline in fertility: a link to degenerative oocytes? Fertil Steril. 1997;68:265-271.
How to safeguard the ureter and repair surgical injury
The author has no financial relationships relevant to this article.
CASE: Inadvertent ureteral transection
A gynecologic surgeon operates via Pfannenstiel incision to remove a 12-cm complex left adnexal mass from a 36-year-old obese woman. When she discovers that the mass is densely adherent to the pelvic peritoneum, the surgeon incises the peritoneum lateral to the mass and opens the retroperitoneal space. However, the size and relative immobility of the mass, coupled with the low transverse incision, impair visualization of retroperitoneal structures.
The surgeon clamps and divides the ovarian vessels above the mass but, afterward, suspects that the ureter has been transected and that its ends are included within the clamps. She separates the ovarian vessels above the clamp and ligates them, at which time transection of the ureter is confirmed.
How should she proceed?
The ureter is intimately associated with the female internal genitalia in a way that challenges the gynecologic surgeon to avoid it. In a small percentage of cases involving surgical extirpation in a woman who has severe pelvic pathology, ureteral injury may be inevitable.
Several variables predispose a patient to ureteral injury, including limited exposure, as in the opening case. Others include distorted anatomy of the urinary tract relative to internal genitalia and operations that require extensive resection of pelvic tissues.
This article describes:
- prevention and intraoperative recognition of ureteral injury during gynecologic surgery
- management of intraoperatively recognized ureteral injury.
Maintain a high index of suspicion
The surgeon in the opening case has already taken the first and most important step in ensuring a good outcome: She suspected ureteral injury. In high-risk situations, intraoperative recognition of ureteral injury is more likely when the operative field is inspected thoroughly during and at the conclusion of the surgical procedure.
In a high-risk case, the combined use of intravenous indigo carmine, careful inspection of the operative field, cystoscopy, and ureteral dissection is recommended and should be routine.
Common sites of injury
During gynecologic surgery, the ureter is susceptible to injury along its entire course through the pelvis (see “The ureter takes a course fraught with hazard,”).
During adnexectomy, the gonadal vessels are generally ligated 2 to 3 cm above the adnexa. The ureter lies in close proximity to these vessels and may inadvertently be included in the ligation.
During hysterectomy, the ureter is susceptible to injury as it passes through the parametrium a short distance from the uterus and vaginal fornix.
Sutures placed in the posterior lateral cul de sac during prolapse surgery lie near the midpelvic ureter, and sutures placed during vaginal cuff closure, anterior colporrhaphy, and retropubic urethropexy are in close proximity to the trigonal portion of the ureter.
The ureter extends from the renal pelvis to the bladder, with a length that ranges from 25 to 30 cm, depending on the patient’s height. It crosses the pelvic brim near the bifurcation of the common iliac artery, where it becomes the “pelvic” ureter. The abdominal and pelvic portions of the ureter are approximately equal in length.
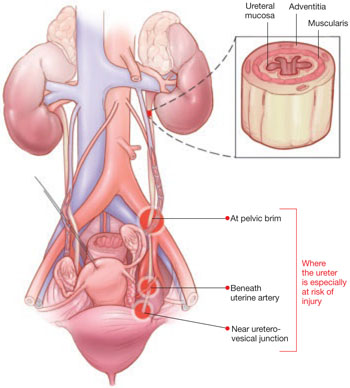
ILLUSTRATIONS BY ROB FLEWELL FOR OBG MANAGEMENT
The blood supply of the ureter derives from branches of the major arterial system of the lower abdomen and pelvis. These branches reach the medial aspect of the abdominal ureter and the lateral side of the pelvic ureter to form an anastomotic vascular network protected by an adventitial layer surrounding the ureter.
The ureter is attached to the posterior lateral pelvic peritoneum running dorsal to ovarian vessels. At the midpelvis, it separates from the peritoneum to pierce the base of the broad ligament underneath the uterine artery. At this point, the ureter is about 1.5 to 2 cm lateral to the uterus and curves medially and ventrally, tunneling through the cardinal and vesicovaginal ligaments to enter the bladder trigone.
Risky procedures
In gynecologic surgery, ureteral injury occurs most often during abdominal hysterectomy—probably because of how frequently this operation is performed and the range of pathology managed. The incidence of ureteral injury is much higher during abdominal hysterectomy than vaginal hysterectomy.1-4
Laparoscopic hysterectomy also has been associated with a higher incidence of ureteral injury, especially in the early phase of training.5,6 Possible explanations include:
- greater difficulty identifying the ureter
- a steeper learning curve
- more frequent use of energy to hemostatically divide pedicles, with the potential for thermal injury
- less traction–countertraction, resulting in dissection closer to the ureter
- management of complex pathology.
Although the overall incidence of ureteral injury during adnexectomy is low, it is probably much higher in women undergoing this procedure after a previous hysterectomy or in the presence of complex adnexal pathology.
When injury is likely
Compromised exposure, distorted anatomy, and certain procedures can heighten the risk of ureteral injury. Large tumors may limit the ability of the surgeon to visualize or palpate the ureter (FIGURE 1). Extensive adhesions may cause similar difficulties, and a small incision or obesity may hinder identification of pelvic sidewall structures.
A number of pathologic conditions can distort the anatomy of the ureter, especially as it relates to the female genital tract:
- Malignancies such as ovarian cancer often encroach on and occasionally encase the ureter
- Pelvic inflammatory disease, endometriosis, and a history of surgery or pelvic radiotherapy can retract and encase the ureter toward the gynecologic tract
- Some masses expand against the lower ureter, such as cervical or broad-ligament leiomyomata or placenta previa with accreta
- During vaginal hysterectomy for complete uterine prolapse, the ureters frequently extend beyond the introitus well within the operative field
- Congenital anomalies of the ureter or hydroureter can also cause distortion.
Even in the presence of relatively normal anatomy, certain procedures predispose the ureter to injury. For example, radical hysterectomy involves the almost complete separation of the pelvic ureter from the gynecologic tract and its surrounding soft tissue. When pelvic pathology is significant, the plane of dissection will always be near the ureter.
FIGURE 1 Access to the ureter is obstructed, putting it in jeopardy
Large tumors may limit the ability of the surgeon to visualize or palpate the ureter.
Prevention is the best strategy
At least 50% of ureteral injuries reported during gynecologic surgery have occurred in the absence of a recognizable risk factor.2,7 Nevertheless, knowledge of anatomy and the ability to recognize situations in which there is an elevated risk for ureteral injury will best enable the surgeon to prevent such injury.
When a high-risk situation is encountered, critical preventive steps include:
- adequate exposure
- competent assistance
- exposure of the path of the ureter through the planned course of dissection. Dissecting the ureter beyond this area is usually unnecessary and may itself cause injury.
Skip preoperative IVP in most cases
The vast majority of women who undergo gynecologic surgery do not benefit from preoperative intravenous pyelography (IVP). This measure does not appear to reduce the likelihood of ureteral injury, even in the face of obvious gynecologic disease. However, preoperative identification of obvious ureteral involvement by the disease process is useful. In such cases, the plane of dissection will probably lie closer to the ureter. One of the goals of surgery will then be to clear the urinary tract from the affected area.
When there is a high index of suspicion of an abnormality such as obstruction, intrinsic ureteral endometriosis, or congenital anomaly, preoperative IVP is indicated.
A stent may be helpful in some cases
Ureteral stents are sometimes placed in order to aid in identification and dissection of the ureters during surgery. Some authors of reports on this topic, including Hoffman, believe that stents are useful in certain situations, such as excision of an ovarian remnant, radical vaginal hysterectomy, and when pelvic organs are encased by malignant ovarian tumors. However, stents do not clearly reduce the risk of injury and, in some cases, may increase the risk by providing a false sense of security and predisposing the ureter to adventitial injury during difficult dissection.
Anticipate the effects of disease
The surgeon must have a thorough knowledge of the gynecologic disease process as it relates to surgery involving the urinary tract. For example, an ovarian remnant will almost always be somewhat densely adherent to the pelvic ureter. When severe endometriosis involves the posterior leaf of the broad ligament, the ureter will often be fibrotically retracted toward the operative field.
Certain procedures have special challenges. During resection of adnexa, for example, it is important that the ureter be identified in the retroperitoneum before the ovarian vessels are ligated. During hysterectomy, soft tissues that contain the bladder and ureters should be mobilized caudally and laterally, respectively, creating a U-shaped region (“U” for urinary tract, FIGURE 2) to which the surgeon must limit dissection.
FIGURE 2 During hysterectomy, mobilize the bladder and ureter
Mobilize the soft tissues that contain the bladder and ureters caudally and laterally, respectively, creating a U-shaped region. During division of the paracervical tissues, the surgeon must remain within this region.
Intraoperative detection
Two main types of ureteral injury occur during gynecologic surgery: transection and destruction. The latter includes ligation, crushing, devascularization, and thermal injury.
Intraoperative detection of ureteral injury is more likely when the surgeon recognizes at the outset that the operation places the ureter at increased risk. When dissection has been difficult or complicated for any reason, be concerned about possible injury.
In general, ureteral injury is first recognized by careful inspection of the surgical field. Begin by instilling 5 ml of indigo carmine intravenously. Once the dye begins to appear in the Foley catheter, inspect the area of dissection under a small amount of irrigation fluid, looking for extravasation of dye that indicates partial or complete transection.
If no injury is identified, cystoscopy is the next step. I perform all major abdominal operations with the patient in the low lithotomy position, which provides easy access to the perineum. Cystoscopic identification of urine jetting from both ureteral orifices confirms patency. When only wisps of dye are observed, it is likely that the ureter in question has been partially occluded (e.g., by acute angulation). Failure of any urine to appear from one of the orifices highly suggests injury to that ureter.
During inspection of the operative field, attempt to pass a ureteral stent into the affected orifice. If the stent passes easily and dyed urine is seen to drip freely from it, look for possible angulation of the ureter. If you find none, remove the stent and inspect the orifice again for jetting urine.
If the ureteral stent will move only a few centimeters into the ureteral orifice, ligation (with or without transection) is likely. In this case, leave the stent in place. If the operative site is readily accessible, dissect the applicable area to identify the problem. Depending on the circumstances, you may wish to infuse dye through the stent to aid in operative identification or radiographic evaluation.
Intraoperative IVP may be useful, especially when cystoscopy is unavailable.
Fundamentals of repair
Repair of major injury to the pelvic ureter is generally best accomplished by ureteroneocystostomy or, in selected cases involving injury to the proximal pelvic ureter, by ureteroureterostomy.
When intraoperatively recognized injury to the pelvic ureter appears to be minor, it can be managed by placing a ureteral stent and a closed-suction pelvic drain. Also consider wrapping the injured area with vascularized tissue such as perivesical fat. Minor lacerations can be closed perpendicular to the axis of the ureter using interrupted 4-0 delayed absorbable suture.
Most injuries to the pelvic ureter are optimally managed by ureteroneocystostomy (FIGURE 3). When a significant portion of the pelvic ureter has been lost, ureteroneocystostomy usually requires a combination of:
- extensive mobilization of the bladder
- conservative mobilization of the ureter
- elongation of the bladder
- psoas hitch.
When necessary, mobilization of the kidney with suturing of the caudal perinephric fascia to the psoas muscle will bridge an additional 2- to 3-cm gap.
Major injury to the distal half of the pelvic ureter is repaired using straightforward ureteroneocystostomy.
When there is no significant pelvic disease and the distal ureter is healthy, injury to the proximal pelvic ureter during division of the ovarian vessels may be repaired via ureteroureterostomy. If the ureteral ends will be anastomosed on tension or there is any question about the integrity of the distal portion of the ureter, as when extensive distal ureterolysis has been necessary, consider ureteroneocystostomy.
FIGURE 3 When the distal ureter is injured
Most injuries to the pelvic ureter are managed optimally by ureteroneocystostomy.
Ureter injured during emergent hysterectomy
A 37-year-old woman, para 4, undergoes her fourth repeat cesarean section. When the OB attempts to manually extract the placenta, the patient begins to hemorrhage profusely. Conservative measures fail to stop the bleeding, and the patient becomes hypotensive. The physician performs emergent hysterectomy, taking large pedicles of tissue. Although the patient stabilizes, the doctor worries that the ureters may have been injured.
Resolution: Cystoscopy is performed to check for injury. Because indigo carmine does not spill from the left ureteral orifice, the physician passes a stent with the abdomen still open, and it stops within the most distal ligamentous pedicle. Upon deligation, indigo carmine begins to drain from the stent, which then passes easily.
The stent is withdrawn to below the site of injury, and dilute methylene blue is instilled through it while the ureter is observed under irrigation. No extravasation is noted. Because the ligature had been around a block of tissue that was thought to have acutely angulated rather than incorporated the ureter, the physician concludes that severe damage is unlikely. He places a 6 French double-J stent, wraps the damaged portion of the distal ureter in perivesical fat, and places a closed-suction pelvic drain. Healing is uneventful.
Obstruction is confirmed. Now the surgeon must find it
A 45-year-old woman, para 3, who has a symptomatic 14-weeks’ size myomatous uterus, undergoes vaginal hysterectomy. The surgeon ligates and divides the uterine vessel pedicles before beginning morcellation. At the completion of the procedure, during cystoscopy, indigo carmine fails to spill from the right ureteral orifice, suggesting injury to that ureter. The surgeon passes a stent into the ureter, and it stops approximately 6 cm from the orifice. A retrograde pyelogram confirms complete obstruction.
Resolution: With the stent left in place, the surgeon performs a midline laparotomy, tracing the ureter to the uterine artery pedicle in which it has been incorporated and transected. The distal ureter with the stent is found within soft tissue lateral to the cardinal ligament pedicle, and the transected end is securely ligated using 2–0 silk suture. After the bladder is mobilized, a ureteroneocystostomy is performed. The patient recovers fully.
Postoperative management
After repair of a ureteral injury, leave a closed-suction pelvic drain in place for 2 to 3 days so that any major urinary leak can be detected; it also enhances spontaneous closure and helps prevent potentially infected fluid from accumulating in the region of anastomosis.
The cystotomy performed during ureteroneocystostomy generally heals quickly with a low risk of complications.
Leave a large-bore (20 or 22 French) urethral Foley catheter in place for 2 weeks.
I recommend that a 6 French double-J ureteral stent be left in place for 6 weeks. Potential benefits of the stent include:
- prevention of stricture
- stabilization and immobilization of the ureter during healing
- reduced risk of extravasation of urine
- reduced risk of angulation of the ureter
- isolation of the repair from infection, retroperitoneal fibrosis, and cancer.
I perform IVP approximately 1 week after stent removal to ensure ureteral patency.
CASE RESOLVED
Exposure is improved by widening the incision and dividing the tendonous insertions of the rectus abdominus muscles. The surgeon then removes the mass, preserving the distal ureter, which is estimated to be 12 cm in length and to have intact adventitia.
The surgeon performs a double-spatulated end-to-end ureteroureterostomy over a 6 French double-J ureteral stent that has been passed proximally into the renal pelvis and distally into the bladder. The stent is removed 6 weeks postoperatively, and an IVP the following week demonstrates excellent patency.
The majority of payers consider ureterolysis integral to good surgical technique, but there can be exceptions when documentation supports existing codes. Three CPT codes describe this procedure:
50715 Ureterolysis, with or without repositioning of ureter for retroperitoneal fibrosis
50722 Ureterolysis for ovarian vein syndrome
50725 Ureterolysis for retrocaval ureter, with reanastomosis of upper urinary tract or vena cava
The key to getting paid will be to document the existence of the condition indicated by each of the codes.
The ICD-9 code for both retroperitoneal fibrosis and ovarian vein syndrome is the same, 593.4 (Other ureteric obstruction). If the patient requires ureterolysis for a retrocaval ureter, the code 753.4 (Other specified anomalies of ureter) would be reported instead. Note, however, that these procedure codes cannot be reported if the ureterolysis is performed laparoscopically. In that case, the most appropriate code is 50949 (Unlisted laparoscopy procedure, ureter).
When repair is necessary, you have several codes to choose from, but the supporting diagnosis code 998.2 (Accidental puncture or laceration during a procedure) must be indicated. If a Medicare patient is involved, the surgeon who created the injury would not be paid additionally for repair.
50780 Ureteroneocystostomy; anastomosis of single ureter to bladder
50782 Ureteroneocystostomy; anastomosis of duplicated ureter to bladder
50783 Ureteroneocystostomy; with extensive ureteral tailoring
50785 Ureteroneocystostomy; with vesico-psoas hitch or bladder flap
50760 Ureteroureterostomy; fusion of ureters
50770 Transureteroureterostomy, anastomosis of ureter to contralateral ureter—MELANIE WITT, RN, CPC-OBGYN, MA
1. St. Lezin MA, Stoller ML. Surgical ureteral injuries. Urology. 1991;38:497-506.
2. Liapis A, Bakas P, Giannopoulos V, Creatsas G. Ureteral injuries during gynecological surgery. Int Urogynecol J Pelvic Floor Dysfunct. 2001;12:391-394.
3. Vakili B, Chesson RR, Kyle BL, et al. The incidence of urinary tract injury during hysterectomy: a prospective analysis based on universal cystoscopy. Am J Obstet Gynecol. 2005;192:1599-1604.
4. Sakellariou P, Protopapas AG, Voulgaris Z, et al. Management of ureteric injuries during gynecological operations: 10 years experience. Eur J Obstet Gynecol Reprod Biol. 2002;101:179-184.
5. Assimos DG, Patterson LC, Taylor CL. Changing incidence and etiology of iatrogenic ureteral injuries. J Urol. 1994;152:2240-2246.
6. Härkki-Sirén P, Sjöberg J, Titinen A. Urinary tract injuries after hysterectomy. Obstet Gynecol. 1998;92:113-118.
7. Chan JK, Morrow J, Manetta A. Prevention of ureteral injuries in gynecologic surgery. Am J Obstet Gynecol. 2003;188:1273-1277.
The author has no financial relationships relevant to this article.
CASE: Inadvertent ureteral transection
A gynecologic surgeon operates via Pfannenstiel incision to remove a 12-cm complex left adnexal mass from a 36-year-old obese woman. When she discovers that the mass is densely adherent to the pelvic peritoneum, the surgeon incises the peritoneum lateral to the mass and opens the retroperitoneal space. However, the size and relative immobility of the mass, coupled with the low transverse incision, impair visualization of retroperitoneal structures.
The surgeon clamps and divides the ovarian vessels above the mass but, afterward, suspects that the ureter has been transected and that its ends are included within the clamps. She separates the ovarian vessels above the clamp and ligates them, at which time transection of the ureter is confirmed.
How should she proceed?
The ureter is intimately associated with the female internal genitalia in a way that challenges the gynecologic surgeon to avoid it. In a small percentage of cases involving surgical extirpation in a woman who has severe pelvic pathology, ureteral injury may be inevitable.
Several variables predispose a patient to ureteral injury, including limited exposure, as in the opening case. Others include distorted anatomy of the urinary tract relative to internal genitalia and operations that require extensive resection of pelvic tissues.
This article describes:
- prevention and intraoperative recognition of ureteral injury during gynecologic surgery
- management of intraoperatively recognized ureteral injury.
Maintain a high index of suspicion
The surgeon in the opening case has already taken the first and most important step in ensuring a good outcome: She suspected ureteral injury. In high-risk situations, intraoperative recognition of ureteral injury is more likely when the operative field is inspected thoroughly during and at the conclusion of the surgical procedure.
In a high-risk case, the combined use of intravenous indigo carmine, careful inspection of the operative field, cystoscopy, and ureteral dissection is recommended and should be routine.
Common sites of injury
During gynecologic surgery, the ureter is susceptible to injury along its entire course through the pelvis (see “The ureter takes a course fraught with hazard,”).
During adnexectomy, the gonadal vessels are generally ligated 2 to 3 cm above the adnexa. The ureter lies in close proximity to these vessels and may inadvertently be included in the ligation.
During hysterectomy, the ureter is susceptible to injury as it passes through the parametrium a short distance from the uterus and vaginal fornix.
Sutures placed in the posterior lateral cul de sac during prolapse surgery lie near the midpelvic ureter, and sutures placed during vaginal cuff closure, anterior colporrhaphy, and retropubic urethropexy are in close proximity to the trigonal portion of the ureter.
The ureter extends from the renal pelvis to the bladder, with a length that ranges from 25 to 30 cm, depending on the patient’s height. It crosses the pelvic brim near the bifurcation of the common iliac artery, where it becomes the “pelvic” ureter. The abdominal and pelvic portions of the ureter are approximately equal in length.
ILLUSTRATIONS BY ROB FLEWELL FOR OBG MANAGEMENT
The blood supply of the ureter derives from branches of the major arterial system of the lower abdomen and pelvis. These branches reach the medial aspect of the abdominal ureter and the lateral side of the pelvic ureter to form an anastomotic vascular network protected by an adventitial layer surrounding the ureter.
The ureter is attached to the posterior lateral pelvic peritoneum running dorsal to ovarian vessels. At the midpelvis, it separates from the peritoneum to pierce the base of the broad ligament underneath the uterine artery. At this point, the ureter is about 1.5 to 2 cm lateral to the uterus and curves medially and ventrally, tunneling through the cardinal and vesicovaginal ligaments to enter the bladder trigone.
Risky procedures
In gynecologic surgery, ureteral injury occurs most often during abdominal hysterectomy—probably because of how frequently this operation is performed and the range of pathology managed. The incidence of ureteral injury is much higher during abdominal hysterectomy than vaginal hysterectomy.1-4
Laparoscopic hysterectomy also has been associated with a higher incidence of ureteral injury, especially in the early phase of training.5,6 Possible explanations include:
- greater difficulty identifying the ureter
- a steeper learning curve
- more frequent use of energy to hemostatically divide pedicles, with the potential for thermal injury
- less traction–countertraction, resulting in dissection closer to the ureter
- management of complex pathology.
Although the overall incidence of ureteral injury during adnexectomy is low, it is probably much higher in women undergoing this procedure after a previous hysterectomy or in the presence of complex adnexal pathology.
When injury is likely
Compromised exposure, distorted anatomy, and certain procedures can heighten the risk of ureteral injury. Large tumors may limit the ability of the surgeon to visualize or palpate the ureter (FIGURE 1). Extensive adhesions may cause similar difficulties, and a small incision or obesity may hinder identification of pelvic sidewall structures.
A number of pathologic conditions can distort the anatomy of the ureter, especially as it relates to the female genital tract:
- Malignancies such as ovarian cancer often encroach on and occasionally encase the ureter
- Pelvic inflammatory disease, endometriosis, and a history of surgery or pelvic radiotherapy can retract and encase the ureter toward the gynecologic tract
- Some masses expand against the lower ureter, such as cervical or broad-ligament leiomyomata or placenta previa with accreta
- During vaginal hysterectomy for complete uterine prolapse, the ureters frequently extend beyond the introitus well within the operative field
- Congenital anomalies of the ureter or hydroureter can also cause distortion.
Even in the presence of relatively normal anatomy, certain procedures predispose the ureter to injury. For example, radical hysterectomy involves the almost complete separation of the pelvic ureter from the gynecologic tract and its surrounding soft tissue. When pelvic pathology is significant, the plane of dissection will always be near the ureter.
FIGURE 1 Access to the ureter is obstructed, putting it in jeopardy
Large tumors may limit the ability of the surgeon to visualize or palpate the ureter.
Prevention is the best strategy
At least 50% of ureteral injuries reported during gynecologic surgery have occurred in the absence of a recognizable risk factor.2,7 Nevertheless, knowledge of anatomy and the ability to recognize situations in which there is an elevated risk for ureteral injury will best enable the surgeon to prevent such injury.
When a high-risk situation is encountered, critical preventive steps include:
- adequate exposure
- competent assistance
- exposure of the path of the ureter through the planned course of dissection. Dissecting the ureter beyond this area is usually unnecessary and may itself cause injury.
Skip preoperative IVP in most cases
The vast majority of women who undergo gynecologic surgery do not benefit from preoperative intravenous pyelography (IVP). This measure does not appear to reduce the likelihood of ureteral injury, even in the face of obvious gynecologic disease. However, preoperative identification of obvious ureteral involvement by the disease process is useful. In such cases, the plane of dissection will probably lie closer to the ureter. One of the goals of surgery will then be to clear the urinary tract from the affected area.
When there is a high index of suspicion of an abnormality such as obstruction, intrinsic ureteral endometriosis, or congenital anomaly, preoperative IVP is indicated.
A stent may be helpful in some cases
Ureteral stents are sometimes placed in order to aid in identification and dissection of the ureters during surgery. Some authors of reports on this topic, including Hoffman, believe that stents are useful in certain situations, such as excision of an ovarian remnant, radical vaginal hysterectomy, and when pelvic organs are encased by malignant ovarian tumors. However, stents do not clearly reduce the risk of injury and, in some cases, may increase the risk by providing a false sense of security and predisposing the ureter to adventitial injury during difficult dissection.
Anticipate the effects of disease
The surgeon must have a thorough knowledge of the gynecologic disease process as it relates to surgery involving the urinary tract. For example, an ovarian remnant will almost always be somewhat densely adherent to the pelvic ureter. When severe endometriosis involves the posterior leaf of the broad ligament, the ureter will often be fibrotically retracted toward the operative field.
Certain procedures have special challenges. During resection of adnexa, for example, it is important that the ureter be identified in the retroperitoneum before the ovarian vessels are ligated. During hysterectomy, soft tissues that contain the bladder and ureters should be mobilized caudally and laterally, respectively, creating a U-shaped region (“U” for urinary tract, FIGURE 2) to which the surgeon must limit dissection.
FIGURE 2 During hysterectomy, mobilize the bladder and ureter
Mobilize the soft tissues that contain the bladder and ureters caudally and laterally, respectively, creating a U-shaped region. During division of the paracervical tissues, the surgeon must remain within this region.
Intraoperative detection
Two main types of ureteral injury occur during gynecologic surgery: transection and destruction. The latter includes ligation, crushing, devascularization, and thermal injury.
Intraoperative detection of ureteral injury is more likely when the surgeon recognizes at the outset that the operation places the ureter at increased risk. When dissection has been difficult or complicated for any reason, be concerned about possible injury.
In general, ureteral injury is first recognized by careful inspection of the surgical field. Begin by instilling 5 ml of indigo carmine intravenously. Once the dye begins to appear in the Foley catheter, inspect the area of dissection under a small amount of irrigation fluid, looking for extravasation of dye that indicates partial or complete transection.
If no injury is identified, cystoscopy is the next step. I perform all major abdominal operations with the patient in the low lithotomy position, which provides easy access to the perineum. Cystoscopic identification of urine jetting from both ureteral orifices confirms patency. When only wisps of dye are observed, it is likely that the ureter in question has been partially occluded (e.g., by acute angulation). Failure of any urine to appear from one of the orifices highly suggests injury to that ureter.
During inspection of the operative field, attempt to pass a ureteral stent into the affected orifice. If the stent passes easily and dyed urine is seen to drip freely from it, look for possible angulation of the ureter. If you find none, remove the stent and inspect the orifice again for jetting urine.
If the ureteral stent will move only a few centimeters into the ureteral orifice, ligation (with or without transection) is likely. In this case, leave the stent in place. If the operative site is readily accessible, dissect the applicable area to identify the problem. Depending on the circumstances, you may wish to infuse dye through the stent to aid in operative identification or radiographic evaluation.
Intraoperative IVP may be useful, especially when cystoscopy is unavailable.
Fundamentals of repair
Repair of major injury to the pelvic ureter is generally best accomplished by ureteroneocystostomy or, in selected cases involving injury to the proximal pelvic ureter, by ureteroureterostomy.
When intraoperatively recognized injury to the pelvic ureter appears to be minor, it can be managed by placing a ureteral stent and a closed-suction pelvic drain. Also consider wrapping the injured area with vascularized tissue such as perivesical fat. Minor lacerations can be closed perpendicular to the axis of the ureter using interrupted 4-0 delayed absorbable suture.
Most injuries to the pelvic ureter are optimally managed by ureteroneocystostomy (FIGURE 3). When a significant portion of the pelvic ureter has been lost, ureteroneocystostomy usually requires a combination of:
- extensive mobilization of the bladder
- conservative mobilization of the ureter
- elongation of the bladder
- psoas hitch.
When necessary, mobilization of the kidney with suturing of the caudal perinephric fascia to the psoas muscle will bridge an additional 2- to 3-cm gap.
Major injury to the distal half of the pelvic ureter is repaired using straightforward ureteroneocystostomy.
When there is no significant pelvic disease and the distal ureter is healthy, injury to the proximal pelvic ureter during division of the ovarian vessels may be repaired via ureteroureterostomy. If the ureteral ends will be anastomosed on tension or there is any question about the integrity of the distal portion of the ureter, as when extensive distal ureterolysis has been necessary, consider ureteroneocystostomy.
FIGURE 3 When the distal ureter is injured
Most injuries to the pelvic ureter are managed optimally by ureteroneocystostomy.
Ureter injured during emergent hysterectomy
A 37-year-old woman, para 4, undergoes her fourth repeat cesarean section. When the OB attempts to manually extract the placenta, the patient begins to hemorrhage profusely. Conservative measures fail to stop the bleeding, and the patient becomes hypotensive. The physician performs emergent hysterectomy, taking large pedicles of tissue. Although the patient stabilizes, the doctor worries that the ureters may have been injured.
Resolution: Cystoscopy is performed to check for injury. Because indigo carmine does not spill from the left ureteral orifice, the physician passes a stent with the abdomen still open, and it stops within the most distal ligamentous pedicle. Upon deligation, indigo carmine begins to drain from the stent, which then passes easily.
The stent is withdrawn to below the site of injury, and dilute methylene blue is instilled through it while the ureter is observed under irrigation. No extravasation is noted. Because the ligature had been around a block of tissue that was thought to have acutely angulated rather than incorporated the ureter, the physician concludes that severe damage is unlikely. He places a 6 French double-J stent, wraps the damaged portion of the distal ureter in perivesical fat, and places a closed-suction pelvic drain. Healing is uneventful.
Obstruction is confirmed. Now the surgeon must find it
A 45-year-old woman, para 3, who has a symptomatic 14-weeks’ size myomatous uterus, undergoes vaginal hysterectomy. The surgeon ligates and divides the uterine vessel pedicles before beginning morcellation. At the completion of the procedure, during cystoscopy, indigo carmine fails to spill from the right ureteral orifice, suggesting injury to that ureter. The surgeon passes a stent into the ureter, and it stops approximately 6 cm from the orifice. A retrograde pyelogram confirms complete obstruction.
Resolution: With the stent left in place, the surgeon performs a midline laparotomy, tracing the ureter to the uterine artery pedicle in which it has been incorporated and transected. The distal ureter with the stent is found within soft tissue lateral to the cardinal ligament pedicle, and the transected end is securely ligated using 2–0 silk suture. After the bladder is mobilized, a ureteroneocystostomy is performed. The patient recovers fully.
Postoperative management
After repair of a ureteral injury, leave a closed-suction pelvic drain in place for 2 to 3 days so that any major urinary leak can be detected; it also enhances spontaneous closure and helps prevent potentially infected fluid from accumulating in the region of anastomosis.
The cystotomy performed during ureteroneocystostomy generally heals quickly with a low risk of complications.
Leave a large-bore (20 or 22 French) urethral Foley catheter in place for 2 weeks.
I recommend that a 6 French double-J ureteral stent be left in place for 6 weeks. Potential benefits of the stent include:
- prevention of stricture
- stabilization and immobilization of the ureter during healing
- reduced risk of extravasation of urine
- reduced risk of angulation of the ureter
- isolation of the repair from infection, retroperitoneal fibrosis, and cancer.
I perform IVP approximately 1 week after stent removal to ensure ureteral patency.
CASE RESOLVED
Exposure is improved by widening the incision and dividing the tendonous insertions of the rectus abdominus muscles. The surgeon then removes the mass, preserving the distal ureter, which is estimated to be 12 cm in length and to have intact adventitia.
The surgeon performs a double-spatulated end-to-end ureteroureterostomy over a 6 French double-J ureteral stent that has been passed proximally into the renal pelvis and distally into the bladder. The stent is removed 6 weeks postoperatively, and an IVP the following week demonstrates excellent patency.
The majority of payers consider ureterolysis integral to good surgical technique, but there can be exceptions when documentation supports existing codes. Three CPT codes describe this procedure:
50715 Ureterolysis, with or without repositioning of ureter for retroperitoneal fibrosis
50722 Ureterolysis for ovarian vein syndrome
50725 Ureterolysis for retrocaval ureter, with reanastomosis of upper urinary tract or vena cava
The key to getting paid will be to document the existence of the condition indicated by each of the codes.
The ICD-9 code for both retroperitoneal fibrosis and ovarian vein syndrome is the same, 593.4 (Other ureteric obstruction). If the patient requires ureterolysis for a retrocaval ureter, the code 753.4 (Other specified anomalies of ureter) would be reported instead. Note, however, that these procedure codes cannot be reported if the ureterolysis is performed laparoscopically. In that case, the most appropriate code is 50949 (Unlisted laparoscopy procedure, ureter).
When repair is necessary, you have several codes to choose from, but the supporting diagnosis code 998.2 (Accidental puncture or laceration during a procedure) must be indicated. If a Medicare patient is involved, the surgeon who created the injury would not be paid additionally for repair.
50780 Ureteroneocystostomy; anastomosis of single ureter to bladder
50782 Ureteroneocystostomy; anastomosis of duplicated ureter to bladder
50783 Ureteroneocystostomy; with extensive ureteral tailoring
50785 Ureteroneocystostomy; with vesico-psoas hitch or bladder flap
50760 Ureteroureterostomy; fusion of ureters
50770 Transureteroureterostomy, anastomosis of ureter to contralateral ureter—MELANIE WITT, RN, CPC-OBGYN, MA
1. St. Lezin MA, Stoller ML. Surgical ureteral injuries. Urology. 1991;38:497-506.
2. Liapis A, Bakas P, Giannopoulos V, Creatsas G. Ureteral injuries during gynecological surgery. Int Urogynecol J Pelvic Floor Dysfunct. 2001;12:391-394.
3. Vakili B, Chesson RR, Kyle BL, et al. The incidence of urinary tract injury during hysterectomy: a prospective analysis based on universal cystoscopy. Am J Obstet Gynecol. 2005;192:1599-1604.
4. Sakellariou P, Protopapas AG, Voulgaris Z, et al. Management of ureteric injuries during gynecological operations: 10 years experience. Eur J Obstet Gynecol Reprod Biol. 2002;101:179-184.
5. Assimos DG, Patterson LC, Taylor CL. Changing incidence and etiology of iatrogenic ureteral injuries. J Urol. 1994;152:2240-2246.
6. Härkki-Sirén P, Sjöberg J, Titinen A. Urinary tract injuries after hysterectomy. Obstet Gynecol. 1998;92:113-118.
7. Chan JK, Morrow J, Manetta A. Prevention of ureteral injuries in gynecologic surgery. Am J Obstet Gynecol. 2003;188:1273-1277.
Rabies Vaccine Supply Issue: Facts Are Key
The current limitation of the rabies vaccine supply presents an urgent, but not emergent, situation. In fact, nothing has changed regarding the indications for the vaccine's use. However, the supply issue does underscore the need for judicious use and careful attention to information gathering.
At this time, rabies vaccine is limited to postexposure prophylaxis and is not being given to travelers or individuals with occupational exposure risk. On Oct. 8, the Centers for Disease Control and Prevention announced that Novartis has collaborated with public health and government officials to provide additional supplies of RabAvert vaccine for postexposure prophylaxis without the need for a pass code or other restrictions. (Questions can be directed to Novartis customer service at 1-800-244-7668.)
A pass code is still required to receive Sanofi Pasteur Inc.'s IMOVAX. To obtain IMOVAX rabies vaccine, you must first contact your rabies state health official to conduct a risk assessment for the suspected exposure. (A list of those officials, along with the latest supply updates, is available at www.cdc.gov/rabies
The required form has specific information that should be collected so that an appropriate decision can be made for each patient. Basic information includes details regarding the animal species, the bite circumstances, and local rabies epidemiology. Even when the rabies vaccine supply is back to normal, practitioners will continue to be responsible for obtaining the relevant data that are necessary for making a decision about vaccine.
Children's Mercy Hospital has developed an easy-to-use form that practitioners can utilize now and in the future. Our infectious disease section data analyst, Josh Herigon, helped develop our current form, which can be accessed at http://www.childrensmercy.org/rabiesform
Parents of children who have had an animal bite are usually highly anxious and need to know that you are collecting all relevant information so that appropriate postexposure prophylaxis occurs in a timely fashion. In cases in which rabies postexposure prophylaxis is not recommended, parents need to understand the rationale for that decision.
Other key concepts include the following:
▸ Attempts should be made to recover the animal in all cases of exposure or possible exposure. If the animal is in a high-risk category, it should be immediately referred for rabies testing. Domestic animals that are acting normally should be observed, and referred for testing if they begin to exhibit abnormal behavior. Postexposure prophylaxis can be safely delayed for this period of time.
▸ If the animal can't be recovered, the next step depends upon the information you've gathered. If the animal is in the high-risk category and there was a bite wound, then postexposure prophylaxis—comprising both vaccine and rabies immune globulin—must be initiated.
▸ On the other hand, bites from low-risk animals that have escaped will rarely require vaccination. Indeed, the animal's ability to escape is a sign of noninfection, because a rabid animal is usually very sick and typically won't be able to make a quick getaway. Knowing whether the attack was provoked or not is also helpful, as a provoked animal is far less likely to be infected than is one that attacks for no apparent reason. Low-risk animals rarely carry rabies, and have never been documented to transmit it to a human in the United States.
▸ In an intermediate-risk situation, such as a dog bite in which the dog escapes, information such as the local rabies rates, the type and severity of the wound, and whether or not the attack was provoked will help you make the decision regarding whether or not to vaccinate. Again, consult with your local health officials or infectious disease specialist.
▸ Seeing a bat in the house commonly arouses concern about rabies. In the case of a preverbal child or an impaired (for example, drunk) adult who has no noticeable bite wound but who nevertheless may have been exposed, animal control should be called to capture the animal, and arrangements should be made with the local health department for rabies testing. If the bat cannot be captured, immunization plus rabies immune globulin is necessary. Approximately 5% of bats in the United States are rabid.
▸ Rabies vaccine is given intramuscularly on days 0, 3, 7, 14, and 28. The same dosage is used for both children and adults, but the injection is given in the deltoid in adults and in the anterolateral thigh in infants and children. Although primary care physicians don't typically administer rabies vaccine, it's important to educate patients about what's in store.
▸ Wound cleansing is extremely important. Irrigation (except in the case of puncture wounds), tetanus vaccination, antibiotic prophylaxis in appropriate cases, and wound closure when indicated are all essential. Animal studies suggest that wound cleansing reduces the chance of viral transmission.
▸ Officials at the CDC anticipate that the rabies vaccine supply will be fully restored in mid-2009, when Sanofi Pasteur's manufacturing facility in France is expected to be reopened. It was the scheduled closing of that facility in June 2007—combined with Novartis' inability to meet the remaining market demand—that resulted in the current supply problems. Hopefully, if we continue to practice judicious use of the vaccine even after the supply is restored, we can prevent a similar situation from reoccurring.
By the way, those of you practicing in Hawaii don't need to worry. Yours is the only U.S. state that has never had a documented case of rabies.
Glycemic Control Team Business Case
Implementation of targeted inpatient glycemic control by a multidisciplinary team in the hospital is a time‐intensive and labor‐intensive undertaking. A variety of business models may be applied including those in which the hospital provides financial support and those which will be self‐supporting through clinical billing revenues (Table 1). In practice, a combination of these strategies may be used.
| Model | Strategy | Target |
|---|---|---|
| A. Hospital‐Supported | 1. Improve documented patient acuity | Improve accuracy of documentation and coding of: |
| a. uncontrolled diabetes (DM); | ||
| b. unrecognized DM; | ||
| c. DM complications | ||
| 2. Increase capacity and denied payment for readmissions | Reduction in overall length of stay and readmission rates | |
| 3. Optimize resource utilization | Reduction in morbidity and mortality and reduction in intensive care unit length of stay | |
| B. Self‐Supported | 1. Allied health professional billings (NP, PA) | Salary offset through income generation |
| 2. Physician billings |
In order to make the case to hospital administration for investment of financial support for glycemic control programs, it is necessary to develop a business plan that will justify return on investment. The following discussion is a composite of information from the published literature, personal communication with hospital glycemic control champions, and the author's experience developing, implementing, and assessing outcomes for a glycemic control task force charged with improving glucose control in the 7 hospital MedStar Health system from which more than 45,000 patients are discharged annually with a diagnosis of diabetes.
The principles for making the business case for support of a glycemic control team are the same as those applied in other hospital‐based programs. While the clinical argument for a new process, resource, or staff member may be sound, the business plan will also be analyzed from nonclinical perspectives, with attention to its fiscal and operational feasibility. It is therefore important to involve hospital administration, operations, and finance representatives early, in order to obtain their support and address concerns early that would otherwise weaken the request. The information provided in this article is intended to provide practical guidance for developing a plan that is realistic and tailored to the needs of the individual institution.
A. HOSPITAL‐SUPPORTED MODELS
The business case for hospital support for the glycemic control team is based on opportunities to improve revenue through accurate documentation and coding, reduction in length of stay, and optimization of resource utilization through reduction in morbidity and mortality (cost aversion).
In order to understand opportunities for improved revenue, it is necessary to understand how hospitals are reimbursed for inpatient care. Medical record documentation is reviewed by hospital coding personnel who apply strict guidelines and ICD‐9‐CM nomenclature to establish the diagnoses and procedures for each case. The ICD‐9‐CM is a numerical coding scheme of more than 13,000 diagnoses and 5,000 procedures. The principal and secondary diagnoses and procedures are grouped into a Diagnosis Related Group (DRG) code. In most states, CMS (Medicare) reimburses hospitals a flat rate based on the DRG code assigned to each inpatient case. CMS calculates a specific DRG weight for each DRG code. The DRG weight is a number such as 0.895 or 1.24, which reflects the acuity of the patient assigned to a particular DRG code and expected resource utilization. The greater the weight, the greater the acuity and expected resource utilization. The overall Case Mix Index (CMI) is the simple average of the DRG weight for a population of inpatients. CMI indicates the relative severity of a patient population and is directly proportional to DRG payments. This index is valuable when making comparisons between hospitals or patient groups.
Each hospital is provided a single rate relative to a DRG weight of 1.0 which allows calculation of the expected revenue from CMS per case. The DRG payment for a Medicare patient is determined by multiplying the relative weight for the DRG by the hospital's blended rate: DRG PAYMENT = WEIGHT RATE. Each hospital's payment rate is defined by federal regulations and is updated annually to reflect inflation, technical adjustments, and budgetary constraints. There are separate rate calculations for large urban hospitals and other hospitals. There are also technical adjustments for local wage variations, teaching hospitals, and hospitals with a disproportionate share of indigent patients.1
Determination of allowable charges for inpatient care varies by location and payor. The State of Maryland, for example regulates hospital inpatient charges for all patients based on the CMI of each hospital. In this reimbursement system, the hospital must ensure that their total average charge per case is on par with their reported CMI, when compared to other hospitals. For non‐Medicare payors, reimbursement may also be based on a set DRG payment or a percentage of charges based on contractual stipulations. The business case will be based on the individual hospital's allowed charges.
Empirical studies in this area are lacking, perhaps in part because this is a sensitive data area. Publications tend to focus on potential rather than actual results. Profiling hospital improvement management performance for documentation, coding and reimbursement does allow hospitals to go beyond focused operational metrics to evaluate themselves in a broad industry context to determine whether they are in alignment with examples from other institutions.2
Given this background, specific strategies used to justify hospital support for the glycemic control will now be outlined.
1. Documentation Opportunities
The hospital glycemic control team can help optimize reimbursement through improved accuracy of physician documentation and of coding. Each opportunity should be determined in collaboration with the coding and finance departments. Education for providers and coders must be ongoing, especially in hospitals where staff turnover is common. It should also be made clear that coders cannot specify a diagnosis unless the provider has documented it in the chart. Some initiatives incorporate notifying providers when a documentation deficiency is identified in order to offer an opportunity to provide clarification.
Establishing a definition for each coding designation for diabetes will enable collection of specific data upon which the business case can be built.
a. Accuracy of Designating Diabetes as Controlled or Uncontrolled
The glycemic control team should come to a consensus on a definition of uncontrolled diabetes. In the absence of accepted criteria for this designation, the following descriptions are an attempt to provide some guidance. They are derived from the ICD‐9‐CM Professional 6th edition3 and the American Diabetes Association (ADA) article on management of diabetes and hyperglycemia in the hospital4
-
A nonspecific term indicating that the treatment regimen does not keep the blood sugar level of a patient within acceptable limits3
-
Admission BG over 180(200) mg/dL or 2 or more BG during the hospital stay over 180(200) mg/dL
-
Lesser persistent hyperglycemia outside guidelines set by AACE and ADA for hospital management, eg, fasting BG over 110 mg/dL and other BGs over 180 mg/dL on noncritical care units, could also be considered consistent with uncontrolled diabetes.
The modifier uncontrolled only applies when the patient has a known diagnosis of diabetes. CMS has recently revised reimbursement guidelines for uncontrolled diabetes. This designation no longer provides an incremental increase in reimbursement; however, it is still weighted in the determination of case mix index.
b. Unrecognized Diabetes
The key feature of this designation is that the diabetes is either unrecognized by the treating provider or is not clearly documented as diabetes in the medical record during the hospital stay. Beyond these key features, there are no clearly defined criteria for unrecognized diabetes. It is again contingent on the hospital team, including the coding specialists, to decide on blood glucose thresholds that will be applied to identify those cases which are to be designated unrecognized diabetes. Daily reports of patients with hyperglycemia could be generated in order to alert providers about its presence.
There is a paucity of data to guide us in defining a new diagnosis of diabetes in the hospital and multiple variables associated with the stress of illness and hospitalization are known to impact glucose tolerance. However, it seems reasonable to the authors to accept that a patient with a random BG greater than or equal to 200 mg/dL in the hospital has diabetes, particularly when symptoms of hyperglycemia are present, unless there are clearly extenuating circumstances that predispose to hyperglycemia, such as high‐dose glucocorticoid therapy. Less clear is the validity of designating a diabetes diagnosis if the fasting BG in the hospital is greater than or equal to 126 mg/dL, the standard cutoff in the outpatient setting. Hemoglobin A1C level may also help clarify underlying glucose tolerance. It is contingent upon the treating physician to confirm a diabetes diagnosis following discharge from the hospital when a lesser degree of hyperglycemia was present or the diabetes diagnosis was in question during the hospital stay.
c. Diabetes Complications
Accurate documentation of diabetes complications also provides opportunities for optimizing reimbursement. The ICD‐9‐CM1 classifies diabetes complications as follows:
-
Renal manifestations, eg, diabetic nephropathy
-
Ophthalmic manifestations, eg, diabetic retinopathy
-
Neurologic manifestations, eg, diabetic polyneuropathy, gastroparesis
-
Peripheral circulatory disorders, eg, peripheral angiopathy, gangrene
-
Other specified manifestations, eg, diabetic hypoglycemia; hypoglycemic shock; associated ulceration; diabetic bone changes; drug‐induced, eg, secondary to treatment with high‐dose glucocorticoids for acute medical condition
Within each of these opportunities, one must collect baseline data to accurately quantify potential for improvement or impact directly attributable to a glycemic control team initiative. Data will be gathered by chart review and/or by extraction from electronic data repositories and then correlated with known financial implications of improved accuracy of documentation for the given criteria, eg, impact on case‐mix ratio and or implications for direct billing and reimbursement to the hospital.
The steps necessary to quantify each of these opportunities include:
-
Defining the patient population to be assessed, eg, uncontrolled or unrecognized diabetes or diabetes with specific complications, as discussed above
-
Delineating the time period to be assessed, eg, baseline, or preimplementation and postimplementation of the intervention
-
Obtaining DRG (or other classification system) code and ICD‐9 principal and secondary code information
-
Review implications of improved coding on reimbursement rates for the hospital for the targeted area of opportunity, ie, if the selected opportunity, eg, uncontrolled diabetes is correctly documented and coded, what is the dollar amount/case that would potentially be recognized by the institution based on the new DRG codes assigned to these cases.
-
Extrapolate from the number of cases identified as having potential to be accurately coded, or the increased number of cases that are accurately coded as a result of the team intervention and the dollar amount of value per case to derive a projected total dollar amount that could or has been recognized for the hospital.
EXAMPLE: Potential for Improved Revenue Based on Allowed Charges for Uncontrolled Diabetes.
Assessment of potential for improved revenue based on allowed charges in a MedStar community teaching hospital with 344 beds was conducted using the case mix index (CMI) reimbursement system for the State of Maryland.5
Step 1. Define criteria for selection of specific population:
-
Hospital all discharges
-
Time period = Baseline FY 2006 Q3
-
Age 18 or greater, excluding cases with diabetic ketoacidosis or non‐ketotic hyperosmolar state (codes 250.1, 250.2, and 250.3)
Step 2. Obtain APR Diagnostic‐related group (DRG) and severity of illness (SOI) information for each case.
Step 3. List reviewed by rates and reimbursement specialist:
-
246 cases reviewed
-
Noted that all SOI levels 3 and 4 were not designated as having uncontrolled diabetes
-
49 of the 246 cases (19.9%) with potential for changes in allowed charge per case based on designation as uncontrolled diabetes.
| Item | Original (o) CMI | Improved (i) CMI |
|---|---|---|
| Case mix index (CMI) | 0.9269 | 0.9750 |
| Allowed charge/case | $8,531 | $8,973 |
| 246 cases (total allowed charge) | $2,098,522 (o) | $2,207,431 (i) |
| Q3 Potential for improved revenue (io) | $108,910 | |
| Annualized potential for improved revenue | $435,640 |
A similar process can be applied to demonstrate potential for improved revenue in systems where reimbursement is based on a combined case rate and percentage of charges based on contractual stipulation.
It is always advisable to use conservative, realistic assumptions when making such projections. Finally, one should note that in a hospital where successful efforts to optimize documentation and coding have been implemented such that the CMI, for example, has been maximized, it is less likely that financial benefit from incremental improvement in documentation will be recognized.
2. Reduction in Length of Stay and Readmissions
Financial benefit linked to reduction in length of stay (LOS) may be assessed in one of two ways. If reimbursement is predetermined based on DRG, shorter LOS means that fewer resources are spent caring for the patient. This model is known as cost aversion. It optimizes revenue recognized per case for the hospital. The second model focuses on throughput for hospital beds. If LOS is shortened there is increased availability of beds for additional billable patients to be admitted to the hospital. Newton and colleagues have applied the throughput model to successfully obtain hospital support for a nurse‐case manager diabetes management team, as shown in the example below.6 This model's success is contingent on high occupancy rates.
The concept that intervention by a glycemic control team can have a positive impact on LOS is not new. In a small study (N = 70) by Levetan and colleagues in 1995, the average LOS of patients cared for by a diabetes team was 3.6 1.7 days, which was 56% shorter than in diabetes patients who did not (8.2 6.2 days), P .001, and 35% shorter than that for patients who received a traditional individual Endocrine consult (5.5 3.4 days), P .05. Of note, LOS correlated significantly (P .0001) with time from admission to consultation, such that each 1‐day delay in consultation resulted in a 1‐day increase in length of stay.7 Admittedly, the magnitude of reduction in LOS that is currently feasible through implementation of glycemic control teams is likely less than was possible a decade ago.
EXAMPLE: Reduction in length of stay and resultant increase in patient throughput.
Newton and colleagues applied the throughput model to the results of an inpatient diabetes management program in Greenville, North Carolina, to calculate the return on investment for a multidisciplinary glycemic control team that uses endocrinologist supervised nurse case managers. A 0.26‐day reduction in LOS among 6,876 discharges for patients with diabetes was equated to 1,788 days saved per year, allowing an incremental annual inpatient volume of 350 patients with an average LOS of 5.11 days. Multiplying this incremental inpatient volume by the hospital's $6,357 revenue margin per patient is translated into a throughput value of $2,224,029 for the year. Based on salaries, consultant fees, data management and product services expended to implement their inpatient diabetes management program, these authors suggest that the throughput value allowed a 467% return on investment.6 The return would be even greater if averted expenditures were factored in.
3. Resource Utilization
Opportunities for cost savings through improved glycemic management may be assessed by analysis of geometric mean cost, expected cost for the selected practice and comparative cost deviation between patients with and without hyperglycemia. Many companies offer risk‐adjustment analysis software for hospitals. The Care Science software utilized by MedStar Health calculates a geometric mean cost for a given population of inpatient cases and compares this to the expected cost based on the population's clinical and demographic information. The cost of a specific inpatient case is calculated using the hospital's overall cost to charge ratio. The average cost for a given population is calculated using a geometric mean of these specific costs. Geometric mean is used to dampen any outlier effect of extremely high‐cost cases. A statistical model provided by the software company utilizes clinical and demographic information to calculate expected cost for an individual case or a population. In addition, analysis of the impact of glycemic control on morbidity and mortality will allow demonstration of cost savings attributable to the inpatient glycemic control initiative.
Relative to impact of glycemic control on morbidity, mortality and cost savings Furnary and colleagues have demonstrated the impact of targeted blood glucose control in diabetes patients undergoing open heart surgery (N = 4864) in an ongoing prospective, nonrandomized, interventional study. Continuous intravenous insulin infusion therapy (IIT) targeting BG 150 mg/dL was found to be associated independently with reduction in mortality risk and deep sternal wound infection by 57% and 66% respectively (P .0001 for both). Coronary artery bypass graft (CABG) surgery‐related mortality (2.5%) and deep sternal wound infection (DSWI) rates (0.8%) were normalized to that of the population without diabetes through implementation of targeted BG control using IIT for 3 days following cardiac surgery. Taking into account both direct and indirect costs of insulin therapy, additional costs and LOS attributable to DSWI this group estimates that intensive BG control realizes an overall cost savings of $680 per patient. The estimated cost saving was calculated based upon assumptions that the Portland protocol [reduced the incidence of DSWI by 1 case for every 83 patients in whom it was applied, off‐setting the cost of a single DSWI] + [reduction in LOS by 1 day accounted for by a 50 mg/dL reduction in BG] [the increased cost of implementing the protocol per patient]. The majority of savings are attributed to decreased costs for treatment of wound infections and to shorter length of hospital stay.8
Schmeltz and colleagues recently have reported reduction of surgical morbidity and mortality in diabetes patients undergoing cardiac surgery using IIT in the ICU followed by subcutaneous insulin outside the ICU. The authors hypothesize that the combination of IV and SQ insulin might be less costly and less nursing intensive than the 3 days of IV insulin therapy recommended by Furnary.9
EXAMPLE: Opportunity for cost savings through improved glycemic management.
Exploratory cost analysis for identification of potential resource utilization opportunities was carried out for a 33% sample of discharges from a 344‐bed community teaching hospital in the MedStar Health System for FY 2006, Quarter 3. Data were obtained from COMPAS (Clinical Outcomes Management and Process Analysis System), a database and software managed and licensed by Quovadx's CareScience division. The database warehouses patient characteristics, resource utilization, and most laboratory data for all inpatients. Analysis compared costs for cases with two or more BG > 180 mg/dL at some point during the hospital stay to those cases in which hyperglycemia was not present during the stay,3 as shown in Table 2. The data suggest a financial opportunity as evidenced by the delta in comparative cost deviation.
| Outcome | Cases with 2 or More BG at Some Point During Stay > 180 mg/dL | Cases with Controlled BG |
|---|---|---|
| Cases | 465 | 1,228 |
| Geometric mean cost | $10,312 | $5,272 |
| Expected cost (select practice) | $9,639 | $5,595 |
| Comparative cost deviation | $ 673 | ($ 323) |
| Comparative cost sig level | 90% sig | 90% sig |
Such analyses can serve as the basis for discussion with finance and operations to obtain an estimate of potential value of the glycemic control team to the hospital.
B. REVENUE GENERATION THROUGH BILLING FOR CLINICAL SERVICES
Implementation of targeted BG control in the hospital provides opportunities for an increase in the provision of clinical consultative services for diabetes management. Physicians and allied healthcare providers can bill when they provide such care, and the revenues offset costs of salary, fringe benefits and other expenses.
1. Nurse Practitioner (NP) Support Model
Northwestern University has successfully implemented a Glycemic Management Service (GMS) with the use of easy‐to‐follow insulin protocols guided by a formal management service. This model, implemented on inpatient surgical services utilizing Advanced NPs in conjunction with supervision by a board‐certified endocrinologist, has proven to be effective and financially viable. Revenue generated by GMS consultation has been able to provide salary support for the NPs and 25% of a supervising physician's salary.10
EXAMPLE: Justification of NP support through offset by billings for consultative diabetes management services.
Nurse Practitioners on the Northwestern glycemic management service did between 35 and 45 new patient plus follow‐up consults each per month in the first 7 months of 2006. Total monthly billings for each NP for new patient consults averaged $13,000 and for follow‐up consults averaged $12,600. This annualizes to billings of about $310,000 for each NP. If one assumes an annual salary of $80,000 for an NP plus 30% fringe benefits ($24,000), the total salary expenses incurred to support each NP is $104,000 (Mark Molitch, personal communication, 2008). Additional operating costs and contractual allowances must also be offset in the return on investment equation, as illustrated in the physician support model example below.
2. Physician Support Model
The case for return on investment (ROI) for physician consultation may be made in a similar fashion (Table 3). This model's success is contingent upon meeting the projected number of new consults and follow‐up visits.
| Physician‐Supported Model for Business Case | ||
|---|---|---|
| Item | Amount $ | Comments |
| A. Operating Revenue | ||
| ‐ Gross Patient Service Revenue | ||
| Professional Fees | 328,320 | Based on 4‐5 new level 4 consults/day generating $24,000/month and 2 level 2 follow‐up consults/day generating $5,760/month billings on average; balance in level 3 outpatient visits. |
| ‐ Deductions from Revenue | ||
| Contractual Allowances | (123,504) | |
| ‐ Net Patient Service Revenue | 204,816 | = 62% |
| Total operating revenue | 204,816 | |
| B. Operating Expenses | ||
| ‐ Personnel (salary) | (150,000) | 1.0 FTE endocrinologist |
| ‐ Benefits | (15,000) | |
| ‐ Purchased services | (18,443) | 9% billing fees |
| ‐ Risk Management | (11,000) | |
| ‐ Other operating expenses | (5,000) | Pager/phone/printed materials/CME |
| Total operating expenses | (199,433) | |
| C. Earnings from Operations | ||
| Net earnings | 5,383 | |
One should also note that reductions in length of stay attributed to the diabetes case management provided by the physician or NP/PA can potentially be factored in the resultant financial benefit equation.
Other: Diabetes Education in the Inpatient Setting
Finally, at this time, financial justification for direct support for inpatient diabetes education services is challenging as there is no mechanism whereby inpatient education services can be billed. The case is therefore supported by incorporating the role of the educator into the business plan for the diabetes case management team as a whole. Financial support is then justified indirectly via 1 or more mechanisms. Net positive collections for clinical services by the team physicians and/or allied healthcare providers who are NPs or PAs may be applied to defray the cost of educator salary. Reduction in length of stay and/or costs resulting from the team initiative may also be used in support of diabetes educator positions. The diabetes educator may also be incorporated as a member of the hospital education program in order to help meet the requirement that basic diabetes education be provided to enable safe discharge of the patient from the hospital into the primary care setting.
CONCLUSION
Financial justification for support of a hospital based glycemic control team is challenging but possible, as has been shown by Newton5 and by DeSantis and Molitch.10 Various models may be used individually or in combination to make the case to hospital administration for salary support for team members. The models that may be helpful in this regard include: improved documentation opportunities; reduction in length of stay; reimbursement for direct clinical diabetes case management consultative services by physicians and NPs or PAs, and demonstration of improved resource utilization for the hyperglycemic patient managed by the hospital glycemic control team.
- American Hospital Directory. Medicare Prospective Payment System. http://www.ahd.com/pps.html. Accessed September 5,2008.
- ,.How does your coding measure up?: analyzing performance data gives HIM a boost in managing revenue.J AHIMA.2005;76(7):26–31.
- Hart AC,Hopkins CA,Ford B, eds.ICD‐9‐CM Professional for Physicians.6th ed.Salt Lake City, UT:Ingenix;2006.
- ,,, et al.on behalf of the American Diabetes Association Writing Group.Management of diabetes and hyperglycemia in hospitals.Diabetes Care.2004;27:553–591.
- Analysis provided by MedStar Health Outcomes Department.
- ,.Financial implications of glycemic control: results of an inpatient diabetes management program.Endocr Pract.2006;12(Suppl 3):43–48.
- ,,,.Impact of endocrine and diabetes team consultation on hospital length of stay for patients with diabetes.Am J Med.1995;99:22–28.
- ,,.Effect of hyperglycemia and continuous intravenous insulin infusions on outcomes of cardiac surgical procedures: the Portland diabetes project.Endocr Pract.2004;10:21–33.
- ,,, et al.Reduction of surgical mortality and morbidity in diabetic patients undergoing cardiac surgery with a combined intravenous and subcutaneous insulin glucose management strategy.Diabetes Care.2007;30:823–828.
- ,,, et al.Inpatient management of hyperglycemia: the Northwestern experience.Endocr Pract.2006;12:491–505.
Implementation of targeted inpatient glycemic control by a multidisciplinary team in the hospital is a time‐intensive and labor‐intensive undertaking. A variety of business models may be applied including those in which the hospital provides financial support and those which will be self‐supporting through clinical billing revenues (Table 1). In practice, a combination of these strategies may be used.
| Model | Strategy | Target |
|---|---|---|
| A. Hospital‐Supported | 1. Improve documented patient acuity | Improve accuracy of documentation and coding of: |
| a. uncontrolled diabetes (DM); | ||
| b. unrecognized DM; | ||
| c. DM complications | ||
| 2. Increase capacity and denied payment for readmissions | Reduction in overall length of stay and readmission rates | |
| 3. Optimize resource utilization | Reduction in morbidity and mortality and reduction in intensive care unit length of stay | |
| B. Self‐Supported | 1. Allied health professional billings (NP, PA) | Salary offset through income generation |
| 2. Physician billings |
In order to make the case to hospital administration for investment of financial support for glycemic control programs, it is necessary to develop a business plan that will justify return on investment. The following discussion is a composite of information from the published literature, personal communication with hospital glycemic control champions, and the author's experience developing, implementing, and assessing outcomes for a glycemic control task force charged with improving glucose control in the 7 hospital MedStar Health system from which more than 45,000 patients are discharged annually with a diagnosis of diabetes.
The principles for making the business case for support of a glycemic control team are the same as those applied in other hospital‐based programs. While the clinical argument for a new process, resource, or staff member may be sound, the business plan will also be analyzed from nonclinical perspectives, with attention to its fiscal and operational feasibility. It is therefore important to involve hospital administration, operations, and finance representatives early, in order to obtain their support and address concerns early that would otherwise weaken the request. The information provided in this article is intended to provide practical guidance for developing a plan that is realistic and tailored to the needs of the individual institution.
A. HOSPITAL‐SUPPORTED MODELS
The business case for hospital support for the glycemic control team is based on opportunities to improve revenue through accurate documentation and coding, reduction in length of stay, and optimization of resource utilization through reduction in morbidity and mortality (cost aversion).
In order to understand opportunities for improved revenue, it is necessary to understand how hospitals are reimbursed for inpatient care. Medical record documentation is reviewed by hospital coding personnel who apply strict guidelines and ICD‐9‐CM nomenclature to establish the diagnoses and procedures for each case. The ICD‐9‐CM is a numerical coding scheme of more than 13,000 diagnoses and 5,000 procedures. The principal and secondary diagnoses and procedures are grouped into a Diagnosis Related Group (DRG) code. In most states, CMS (Medicare) reimburses hospitals a flat rate based on the DRG code assigned to each inpatient case. CMS calculates a specific DRG weight for each DRG code. The DRG weight is a number such as 0.895 or 1.24, which reflects the acuity of the patient assigned to a particular DRG code and expected resource utilization. The greater the weight, the greater the acuity and expected resource utilization. The overall Case Mix Index (CMI) is the simple average of the DRG weight for a population of inpatients. CMI indicates the relative severity of a patient population and is directly proportional to DRG payments. This index is valuable when making comparisons between hospitals or patient groups.
Each hospital is provided a single rate relative to a DRG weight of 1.0 which allows calculation of the expected revenue from CMS per case. The DRG payment for a Medicare patient is determined by multiplying the relative weight for the DRG by the hospital's blended rate: DRG PAYMENT = WEIGHT RATE. Each hospital's payment rate is defined by federal regulations and is updated annually to reflect inflation, technical adjustments, and budgetary constraints. There are separate rate calculations for large urban hospitals and other hospitals. There are also technical adjustments for local wage variations, teaching hospitals, and hospitals with a disproportionate share of indigent patients.1
Determination of allowable charges for inpatient care varies by location and payor. The State of Maryland, for example regulates hospital inpatient charges for all patients based on the CMI of each hospital. In this reimbursement system, the hospital must ensure that their total average charge per case is on par with their reported CMI, when compared to other hospitals. For non‐Medicare payors, reimbursement may also be based on a set DRG payment or a percentage of charges based on contractual stipulations. The business case will be based on the individual hospital's allowed charges.
Empirical studies in this area are lacking, perhaps in part because this is a sensitive data area. Publications tend to focus on potential rather than actual results. Profiling hospital improvement management performance for documentation, coding and reimbursement does allow hospitals to go beyond focused operational metrics to evaluate themselves in a broad industry context to determine whether they are in alignment with examples from other institutions.2
Given this background, specific strategies used to justify hospital support for the glycemic control will now be outlined.
1. Documentation Opportunities
The hospital glycemic control team can help optimize reimbursement through improved accuracy of physician documentation and of coding. Each opportunity should be determined in collaboration with the coding and finance departments. Education for providers and coders must be ongoing, especially in hospitals where staff turnover is common. It should also be made clear that coders cannot specify a diagnosis unless the provider has documented it in the chart. Some initiatives incorporate notifying providers when a documentation deficiency is identified in order to offer an opportunity to provide clarification.
Establishing a definition for each coding designation for diabetes will enable collection of specific data upon which the business case can be built.
a. Accuracy of Designating Diabetes as Controlled or Uncontrolled
The glycemic control team should come to a consensus on a definition of uncontrolled diabetes. In the absence of accepted criteria for this designation, the following descriptions are an attempt to provide some guidance. They are derived from the ICD‐9‐CM Professional 6th edition3 and the American Diabetes Association (ADA) article on management of diabetes and hyperglycemia in the hospital4
-
A nonspecific term indicating that the treatment regimen does not keep the blood sugar level of a patient within acceptable limits3
-
Admission BG over 180(200) mg/dL or 2 or more BG during the hospital stay over 180(200) mg/dL
-
Lesser persistent hyperglycemia outside guidelines set by AACE and ADA for hospital management, eg, fasting BG over 110 mg/dL and other BGs over 180 mg/dL on noncritical care units, could also be considered consistent with uncontrolled diabetes.
The modifier uncontrolled only applies when the patient has a known diagnosis of diabetes. CMS has recently revised reimbursement guidelines for uncontrolled diabetes. This designation no longer provides an incremental increase in reimbursement; however, it is still weighted in the determination of case mix index.
b. Unrecognized Diabetes
The key feature of this designation is that the diabetes is either unrecognized by the treating provider or is not clearly documented as diabetes in the medical record during the hospital stay. Beyond these key features, there are no clearly defined criteria for unrecognized diabetes. It is again contingent on the hospital team, including the coding specialists, to decide on blood glucose thresholds that will be applied to identify those cases which are to be designated unrecognized diabetes. Daily reports of patients with hyperglycemia could be generated in order to alert providers about its presence.
There is a paucity of data to guide us in defining a new diagnosis of diabetes in the hospital and multiple variables associated with the stress of illness and hospitalization are known to impact glucose tolerance. However, it seems reasonable to the authors to accept that a patient with a random BG greater than or equal to 200 mg/dL in the hospital has diabetes, particularly when symptoms of hyperglycemia are present, unless there are clearly extenuating circumstances that predispose to hyperglycemia, such as high‐dose glucocorticoid therapy. Less clear is the validity of designating a diabetes diagnosis if the fasting BG in the hospital is greater than or equal to 126 mg/dL, the standard cutoff in the outpatient setting. Hemoglobin A1C level may also help clarify underlying glucose tolerance. It is contingent upon the treating physician to confirm a diabetes diagnosis following discharge from the hospital when a lesser degree of hyperglycemia was present or the diabetes diagnosis was in question during the hospital stay.
c. Diabetes Complications
Accurate documentation of diabetes complications also provides opportunities for optimizing reimbursement. The ICD‐9‐CM1 classifies diabetes complications as follows:
-
Renal manifestations, eg, diabetic nephropathy
-
Ophthalmic manifestations, eg, diabetic retinopathy
-
Neurologic manifestations, eg, diabetic polyneuropathy, gastroparesis
-
Peripheral circulatory disorders, eg, peripheral angiopathy, gangrene
-
Other specified manifestations, eg, diabetic hypoglycemia; hypoglycemic shock; associated ulceration; diabetic bone changes; drug‐induced, eg, secondary to treatment with high‐dose glucocorticoids for acute medical condition
Within each of these opportunities, one must collect baseline data to accurately quantify potential for improvement or impact directly attributable to a glycemic control team initiative. Data will be gathered by chart review and/or by extraction from electronic data repositories and then correlated with known financial implications of improved accuracy of documentation for the given criteria, eg, impact on case‐mix ratio and or implications for direct billing and reimbursement to the hospital.
The steps necessary to quantify each of these opportunities include:
-
Defining the patient population to be assessed, eg, uncontrolled or unrecognized diabetes or diabetes with specific complications, as discussed above
-
Delineating the time period to be assessed, eg, baseline, or preimplementation and postimplementation of the intervention
-
Obtaining DRG (or other classification system) code and ICD‐9 principal and secondary code information
-
Review implications of improved coding on reimbursement rates for the hospital for the targeted area of opportunity, ie, if the selected opportunity, eg, uncontrolled diabetes is correctly documented and coded, what is the dollar amount/case that would potentially be recognized by the institution based on the new DRG codes assigned to these cases.
-
Extrapolate from the number of cases identified as having potential to be accurately coded, or the increased number of cases that are accurately coded as a result of the team intervention and the dollar amount of value per case to derive a projected total dollar amount that could or has been recognized for the hospital.
EXAMPLE: Potential for Improved Revenue Based on Allowed Charges for Uncontrolled Diabetes.
Assessment of potential for improved revenue based on allowed charges in a MedStar community teaching hospital with 344 beds was conducted using the case mix index (CMI) reimbursement system for the State of Maryland.5
Step 1. Define criteria for selection of specific population:
-
Hospital all discharges
-
Time period = Baseline FY 2006 Q3
-
Age 18 or greater, excluding cases with diabetic ketoacidosis or non‐ketotic hyperosmolar state (codes 250.1, 250.2, and 250.3)
Step 2. Obtain APR Diagnostic‐related group (DRG) and severity of illness (SOI) information for each case.
Step 3. List reviewed by rates and reimbursement specialist:
-
246 cases reviewed
-
Noted that all SOI levels 3 and 4 were not designated as having uncontrolled diabetes
-
49 of the 246 cases (19.9%) with potential for changes in allowed charge per case based on designation as uncontrolled diabetes.
| Item | Original (o) CMI | Improved (i) CMI |
|---|---|---|
| Case mix index (CMI) | 0.9269 | 0.9750 |
| Allowed charge/case | $8,531 | $8,973 |
| 246 cases (total allowed charge) | $2,098,522 (o) | $2,207,431 (i) |
| Q3 Potential for improved revenue (io) | $108,910 | |
| Annualized potential for improved revenue | $435,640 |
A similar process can be applied to demonstrate potential for improved revenue in systems where reimbursement is based on a combined case rate and percentage of charges based on contractual stipulation.
It is always advisable to use conservative, realistic assumptions when making such projections. Finally, one should note that in a hospital where successful efforts to optimize documentation and coding have been implemented such that the CMI, for example, has been maximized, it is less likely that financial benefit from incremental improvement in documentation will be recognized.
2. Reduction in Length of Stay and Readmissions
Financial benefit linked to reduction in length of stay (LOS) may be assessed in one of two ways. If reimbursement is predetermined based on DRG, shorter LOS means that fewer resources are spent caring for the patient. This model is known as cost aversion. It optimizes revenue recognized per case for the hospital. The second model focuses on throughput for hospital beds. If LOS is shortened there is increased availability of beds for additional billable patients to be admitted to the hospital. Newton and colleagues have applied the throughput model to successfully obtain hospital support for a nurse‐case manager diabetes management team, as shown in the example below.6 This model's success is contingent on high occupancy rates.
The concept that intervention by a glycemic control team can have a positive impact on LOS is not new. In a small study (N = 70) by Levetan and colleagues in 1995, the average LOS of patients cared for by a diabetes team was 3.6 1.7 days, which was 56% shorter than in diabetes patients who did not (8.2 6.2 days), P .001, and 35% shorter than that for patients who received a traditional individual Endocrine consult (5.5 3.4 days), P .05. Of note, LOS correlated significantly (P .0001) with time from admission to consultation, such that each 1‐day delay in consultation resulted in a 1‐day increase in length of stay.7 Admittedly, the magnitude of reduction in LOS that is currently feasible through implementation of glycemic control teams is likely less than was possible a decade ago.
EXAMPLE: Reduction in length of stay and resultant increase in patient throughput.
Newton and colleagues applied the throughput model to the results of an inpatient diabetes management program in Greenville, North Carolina, to calculate the return on investment for a multidisciplinary glycemic control team that uses endocrinologist supervised nurse case managers. A 0.26‐day reduction in LOS among 6,876 discharges for patients with diabetes was equated to 1,788 days saved per year, allowing an incremental annual inpatient volume of 350 patients with an average LOS of 5.11 days. Multiplying this incremental inpatient volume by the hospital's $6,357 revenue margin per patient is translated into a throughput value of $2,224,029 for the year. Based on salaries, consultant fees, data management and product services expended to implement their inpatient diabetes management program, these authors suggest that the throughput value allowed a 467% return on investment.6 The return would be even greater if averted expenditures were factored in.
3. Resource Utilization
Opportunities for cost savings through improved glycemic management may be assessed by analysis of geometric mean cost, expected cost for the selected practice and comparative cost deviation between patients with and without hyperglycemia. Many companies offer risk‐adjustment analysis software for hospitals. The Care Science software utilized by MedStar Health calculates a geometric mean cost for a given population of inpatient cases and compares this to the expected cost based on the population's clinical and demographic information. The cost of a specific inpatient case is calculated using the hospital's overall cost to charge ratio. The average cost for a given population is calculated using a geometric mean of these specific costs. Geometric mean is used to dampen any outlier effect of extremely high‐cost cases. A statistical model provided by the software company utilizes clinical and demographic information to calculate expected cost for an individual case or a population. In addition, analysis of the impact of glycemic control on morbidity and mortality will allow demonstration of cost savings attributable to the inpatient glycemic control initiative.
Relative to impact of glycemic control on morbidity, mortality and cost savings Furnary and colleagues have demonstrated the impact of targeted blood glucose control in diabetes patients undergoing open heart surgery (N = 4864) in an ongoing prospective, nonrandomized, interventional study. Continuous intravenous insulin infusion therapy (IIT) targeting BG 150 mg/dL was found to be associated independently with reduction in mortality risk and deep sternal wound infection by 57% and 66% respectively (P .0001 for both). Coronary artery bypass graft (CABG) surgery‐related mortality (2.5%) and deep sternal wound infection (DSWI) rates (0.8%) were normalized to that of the population without diabetes through implementation of targeted BG control using IIT for 3 days following cardiac surgery. Taking into account both direct and indirect costs of insulin therapy, additional costs and LOS attributable to DSWI this group estimates that intensive BG control realizes an overall cost savings of $680 per patient. The estimated cost saving was calculated based upon assumptions that the Portland protocol [reduced the incidence of DSWI by 1 case for every 83 patients in whom it was applied, off‐setting the cost of a single DSWI] + [reduction in LOS by 1 day accounted for by a 50 mg/dL reduction in BG] [the increased cost of implementing the protocol per patient]. The majority of savings are attributed to decreased costs for treatment of wound infections and to shorter length of hospital stay.8
Schmeltz and colleagues recently have reported reduction of surgical morbidity and mortality in diabetes patients undergoing cardiac surgery using IIT in the ICU followed by subcutaneous insulin outside the ICU. The authors hypothesize that the combination of IV and SQ insulin might be less costly and less nursing intensive than the 3 days of IV insulin therapy recommended by Furnary.9
EXAMPLE: Opportunity for cost savings through improved glycemic management.
Exploratory cost analysis for identification of potential resource utilization opportunities was carried out for a 33% sample of discharges from a 344‐bed community teaching hospital in the MedStar Health System for FY 2006, Quarter 3. Data were obtained from COMPAS (Clinical Outcomes Management and Process Analysis System), a database and software managed and licensed by Quovadx's CareScience division. The database warehouses patient characteristics, resource utilization, and most laboratory data for all inpatients. Analysis compared costs for cases with two or more BG > 180 mg/dL at some point during the hospital stay to those cases in which hyperglycemia was not present during the stay,3 as shown in Table 2. The data suggest a financial opportunity as evidenced by the delta in comparative cost deviation.
| Outcome | Cases with 2 or More BG at Some Point During Stay > 180 mg/dL | Cases with Controlled BG |
|---|---|---|
| Cases | 465 | 1,228 |
| Geometric mean cost | $10,312 | $5,272 |
| Expected cost (select practice) | $9,639 | $5,595 |
| Comparative cost deviation | $ 673 | ($ 323) |
| Comparative cost sig level | 90% sig | 90% sig |
Such analyses can serve as the basis for discussion with finance and operations to obtain an estimate of potential value of the glycemic control team to the hospital.
B. REVENUE GENERATION THROUGH BILLING FOR CLINICAL SERVICES
Implementation of targeted BG control in the hospital provides opportunities for an increase in the provision of clinical consultative services for diabetes management. Physicians and allied healthcare providers can bill when they provide such care, and the revenues offset costs of salary, fringe benefits and other expenses.
1. Nurse Practitioner (NP) Support Model
Northwestern University has successfully implemented a Glycemic Management Service (GMS) with the use of easy‐to‐follow insulin protocols guided by a formal management service. This model, implemented on inpatient surgical services utilizing Advanced NPs in conjunction with supervision by a board‐certified endocrinologist, has proven to be effective and financially viable. Revenue generated by GMS consultation has been able to provide salary support for the NPs and 25% of a supervising physician's salary.10
EXAMPLE: Justification of NP support through offset by billings for consultative diabetes management services.
Nurse Practitioners on the Northwestern glycemic management service did between 35 and 45 new patient plus follow‐up consults each per month in the first 7 months of 2006. Total monthly billings for each NP for new patient consults averaged $13,000 and for follow‐up consults averaged $12,600. This annualizes to billings of about $310,000 for each NP. If one assumes an annual salary of $80,000 for an NP plus 30% fringe benefits ($24,000), the total salary expenses incurred to support each NP is $104,000 (Mark Molitch, personal communication, 2008). Additional operating costs and contractual allowances must also be offset in the return on investment equation, as illustrated in the physician support model example below.
2. Physician Support Model
The case for return on investment (ROI) for physician consultation may be made in a similar fashion (Table 3). This model's success is contingent upon meeting the projected number of new consults and follow‐up visits.
| Physician‐Supported Model for Business Case | ||
|---|---|---|
| Item | Amount $ | Comments |
| A. Operating Revenue | ||
| ‐ Gross Patient Service Revenue | ||
| Professional Fees | 328,320 | Based on 4‐5 new level 4 consults/day generating $24,000/month and 2 level 2 follow‐up consults/day generating $5,760/month billings on average; balance in level 3 outpatient visits. |
| ‐ Deductions from Revenue | ||
| Contractual Allowances | (123,504) | |
| ‐ Net Patient Service Revenue | 204,816 | = 62% |
| Total operating revenue | 204,816 | |
| B. Operating Expenses | ||
| ‐ Personnel (salary) | (150,000) | 1.0 FTE endocrinologist |
| ‐ Benefits | (15,000) | |
| ‐ Purchased services | (18,443) | 9% billing fees |
| ‐ Risk Management | (11,000) | |
| ‐ Other operating expenses | (5,000) | Pager/phone/printed materials/CME |
| Total operating expenses | (199,433) | |
| C. Earnings from Operations | ||
| Net earnings | 5,383 | |
One should also note that reductions in length of stay attributed to the diabetes case management provided by the physician or NP/PA can potentially be factored in the resultant financial benefit equation.
Other: Diabetes Education in the Inpatient Setting
Finally, at this time, financial justification for direct support for inpatient diabetes education services is challenging as there is no mechanism whereby inpatient education services can be billed. The case is therefore supported by incorporating the role of the educator into the business plan for the diabetes case management team as a whole. Financial support is then justified indirectly via 1 or more mechanisms. Net positive collections for clinical services by the team physicians and/or allied healthcare providers who are NPs or PAs may be applied to defray the cost of educator salary. Reduction in length of stay and/or costs resulting from the team initiative may also be used in support of diabetes educator positions. The diabetes educator may also be incorporated as a member of the hospital education program in order to help meet the requirement that basic diabetes education be provided to enable safe discharge of the patient from the hospital into the primary care setting.
CONCLUSION
Financial justification for support of a hospital based glycemic control team is challenging but possible, as has been shown by Newton5 and by DeSantis and Molitch.10 Various models may be used individually or in combination to make the case to hospital administration for salary support for team members. The models that may be helpful in this regard include: improved documentation opportunities; reduction in length of stay; reimbursement for direct clinical diabetes case management consultative services by physicians and NPs or PAs, and demonstration of improved resource utilization for the hyperglycemic patient managed by the hospital glycemic control team.
- American Hospital Directory. Medicare Prospective Payment System. http://www.ahd.com/pps.html. Accessed September 5,2008.
- ,.How does your coding measure up?: analyzing performance data gives HIM a boost in managing revenue.J AHIMA.2005;76(7):26–31.
- Hart AC,Hopkins CA,Ford B, eds.ICD‐9‐CM Professional for Physicians.6th ed.Salt Lake City, UT:Ingenix;2006.
- ,,, et al.on behalf of the American Diabetes Association Writing Group.Management of diabetes and hyperglycemia in hospitals.Diabetes Care.2004;27:553–591.
- Analysis provided by MedStar Health Outcomes Department.
- ,.Financial implications of glycemic control: results of an inpatient diabetes management program.Endocr Pract.2006;12(Suppl 3):43–48.
- ,,,.Impact of endocrine and diabetes team consultation on hospital length of stay for patients with diabetes.Am J Med.1995;99:22–28.
- ,,.Effect of hyperglycemia and continuous intravenous insulin infusions on outcomes of cardiac surgical procedures: the Portland diabetes project.Endocr Pract.2004;10:21–33.
- ,,, et al.Reduction of surgical mortality and morbidity in diabetic patients undergoing cardiac surgery with a combined intravenous and subcutaneous insulin glucose management strategy.Diabetes Care.2007;30:823–828.
- ,,, et al.Inpatient management of hyperglycemia: the Northwestern experience.Endocr Pract.2006;12:491–505.
Metrics for Inpatient Glycemic Control
Data collection, analysis, and presentation are key to the success of any hospital glycemic control initiative. Such efforts enable the management team to track improvements in processes and outcomes, make necessary changes to their quality improvement efforts, justify the provision of necessary time and resources, and share their results with others. Reliable metrics for assessing glycemic control and frequency of hypoglycemia are essential to accomplish these tasks and to assess whether interventions result in more benefit than harm. Hypoglycemia metrics must be especially convincing because fear of hypoglycemia remains a major source of clinical inertia, impeding efforts to improve glucose control.
Currently, there are no official standards or guidelines for formulating metrics on the quality of inpatient glycemic control. This creates several problems. First, different metrics vary in their biases and in their responsiveness to change. Thus, use of a poor metric could lead to either a falsely positive or falsely negative impression that a quality improvement intervention is in fact improving glycemic control. Second, the proliferation of different measures and analytical plans in the research and quality improvement literature make it very difficult for hospitals to compare baseline performance, determine need for improvement, and understand which interventions may be most effective.
A related article in this supplement provides the rationale for improved inpatient glycemic control. That article argues that the current state of inpatient glycemic control, with the frequent occurrence of severe hyperglycemia and irrational insulin ordering, cannot be considered acceptable, especially given the large body of data (albeit largely observational) linking hyperglycemia to negative patient outcomes. However, regardless of whether one is an advocate or skeptic of tighter glucose control in the intensive care unit (ICU) and especially the non‐ICU setting, there is no question that standardized, valid, and reliable metrics are needed to compare efforts to improve glycemic control, better understand whether such control actually improves patient care, and closely monitor patient safety.
This article provides a summary of practical suggestions to assess glycemic control, insulin use patterns, and safety (hypoglycemia and severe hyperglycemia). In particular, we discuss the pros and cons of various measurement choices. We conclude with a tiered summary of recommendations for practical metrics that we hope will be useful to individual improvement teams. This article is not a consensus statement but rather a starting place that we hope will begin to standardize measurement across institutions and advance the dialogue on this subject. To more definitely address this problem, we call on the American Association of Clinical Endocrinologists (AACE), American Diabetes Association (ADA), Society of Hospital Medicine (SHM), and others to agree on consensus standards regarding metrics for the quality of inpatient glycemic control.
MEASURING GLYCEMIC CONTROL: GLUCOMETRICS
Glucometrics may be defined as the systematic analysis of blood glucose (BG) dataa phrase initially coined specifically for the inpatient setting. There are numerous ways to do these analyses, depending on which patients and glucose values are considered, the definitions used for hypoglycemia and hyperglycemia, the unit of measurement (eg, patient, patient‐day, individual glucose value), and the measure of control (eg, mean, median, percent of glucose readings within a certain range). We consider each of these dimensions in turn.
Defining the Target Patient Population
The first decision to be made is which patients to include in your analysis. Choices include the following:
-
Patients with a discharge diagnosis of diabetes: this group has face validity and intuitive appeal, is easy to identify retrospectively, and may capture some untested/untreated diabetics, but will miss patients with otherwise undiagnosed diabetes and stress hyperglycemia. It is also subject to the variable accuracy of billing codes.
-
Patients with a certain number of point‐of‐care (POC) glucose measurements: this group is also easy to identify, easy to measure, and will include patients with hyperglycemia without a previous diagnosis of diabetes, but will miss patients with untested/untreated hyperglycemia. Also, if glucose levels are checked on normoglycemic, nondiabetic patients, these values may dilute the overall assessment of glycemic control.
-
Patients treated with insulin in the hospital: this is a good choice if the purpose is mainly drug safety and avoidance of hypoglycemia, but by definition excludes most untreated patients.
-
Patients with 2 or more BG values (laboratory and/or POC) over a certain threshold (eg, >180 mg/dL). This will likely capture more patients with inpatient hyperglycemia, whether or not detected by the medical team, but is subject to wide variations in the frequency and timing of laboratory glucose testing, including whether or not the values are pre‐prandial (note that even preprandial POC glucose measurements are not always in fact fasting values).
Other considerations include the following:
-
Are there natural patient subgroups that should be measured and analyzed separately because of different guidelines? For example, there probably should be separate/emndependent inclusion criteria and analyses for critical care and noncritical care units because their glycemic targets and management considerations differ.
-
Which patients should be excluded? For example, if targeting subcutaneous insulin use in general hospitalized patients, one might eliminate those patients who are admitted specifically as the result of a diabetes emergency (eg, diabetic ketoacidosis [DKA] and hyperglycemic hyperosmolar state [HHS]), as their marked and prolonged hyperglycemia will skew BG data. Pregnant women should generally be excluded from broad‐based analyses or considered as a discrete category because they have very different targets for BG therapy. Patients with short lengths of stay may be less likely to benefit from tight glucose control and may also be considered for post hoc exclusion. One might also exclude patients with very few evaluable glucose readings (eg, fewer than 5) to ensure that measurement is meaningful for a given patient, keeping in mind that this may also exclude patients with undetected hyperglycemia, as mentioned above. Finally, patients receiving palliative care should also be considered for exclusion if feasible.
Recommendation: Do not limit analyses to only those patients with a diagnosis of diabetes or only those on insulin, which will lead to biased results.
-
For noncritical care patients, we recommend a combined approach: adult patients with a diagnosis of diabetes (e. g. using diagnosis‐related group [DRG] codes 294 or 295 or International Classification of Diseases 9th edition [ICD9] codes 250.xx) or with hyperglycemia (eg, 2 or more random laboratory and/or point of care (POC) BG values >180 mg/dL or 2 or more fasting BG values >130 mg/dL), excluding patients with DKA or HHS or who are pregnant.
-
For critical care units, we recommend either all patients, or patients with at least mild hyperglycemia (eg, 2 random glucose levels >140 mg/dL). Critical care patients with DKA, HHS, and pregnancy should be evaluated separately if possible.
Which Glucose Values to Include and Exclude
To answer this question, we first need to decide which method to use for BG measurement. There are several ways to measure BG, including the type of sample collected (capillary [fingerstick], arterial, and venous) and the technique used (central laboratory analyzing plasma, central laboratory analyzing whole blood [eg, from an arterial blood gas sample], glucose meter [usually calibrated to plasma], etc.). The POC (eg, capillary, glucose meter) glucose measurements alone are often preferred in the non‐ICU setting because laboratory plasma values generally provide little additional information and typically lower the mean glucose by including redundant fasting values.1 In critical care units, several different methods are often used together, and each merits inclusion. The inherent differences in calibration between the methods do not generally require separate analyses, especially given the frequency of testing in the ICU setting.
The next question is which values to include in analyses. In some situations, it may be most useful to focus on a certain period of hospitalization, such as the day of a procedure and the next 2 days in assessing the impact of the quality of perioperative care, or the first 14 days of a noncritical care stay to keep outliers for length of stay (LOS) from skewing the data. In the non‐ICU setting, it may be reasonable to exclude the first day of hospitalization, as early BG control is impacted by multiple variables beyond direct control of the clinician (eg, glucose control prior to admission, severity of presenting illness) and may not realistically reflect your interventions. (Keep in mind, however, that it may be useful to adjust for the admission glucose value in multivariable models given its importance to clinical outcomes and its strong relationship to subsequent inpatient glucose control.) However, in critical care units, it is reasonable to include the first day's readings in analyses given the high frequency of glucose measurements in this setting and the expectation that glucose control should be achieved within a few hours of starting an intravenous insulin infusion.
If feasible to do so with your institution's data capture methods, you may wish to select only the regularly scheduled (before each meal [qAC] and at bedtime [qHS], or every 6 hours [q6h]) glucose readings for inclusion in the summary data of glycemic control in the non‐ICU setting, thereby reducing bias caused by repeated measurements around extremes of glycemic excursions. An alternative in the non‐ICU setting is to censor glucose readings within 60 minutes of a previous reading.
Recommendation:
-
In the non‐ICU setting, we recommend first looking at all POC glucose values and if possible repeating the analyses excluding hospital day 1 and hospital day 15 and beyond, and also excluding glucose values measured within 60 minutes of a previous value.
-
In critical care units, we recommend evaluating all glucose readings used to guide care.
Units of Analysis
There are several different units of analysis, each with its own advantages and disadvantages:
-
Glucose value: this is the simplest measure and the one with the most statistical power. All glucose values for all patients of interest comprise the denominator. A report might say, for example, that 1% of the 1000 glucose values were 70 mg/dL during a certain period or that the mean of all glucose values collected for the month from patients in noncritical care areas was 160 mg/dL. The potential disadvantages of this approach are that these analyses are less clinically relevant than patient‐level analyses and that patients with many glucose readings and long hospitalizations may skew the data.
-
Patient (or the Patient Stay, [ie, the entire hospitalization]): all patients who are monitored make up the denominator. The numerator may be the percentage of patients with any hypoglycemia during their hospital stay or the percentage of patients achieving a certain mean glucose during their hospitalization, for example. This is inherently more clinically meaningful than using glucose value as a unit of analysis. A major disadvantage is not controlling for LOS effects. For example, a hospitalized patient with a long LOS is much more likely to be characterized as having at least 1 hypoglycemic value than is a patient with a shorter LOS. Another shortcoming is that this approach does not correct for uneven distribution of testing. A patient's mean glucose might be calculated on the basis of 8 glucose values on the first day of hospitalization, 4 on the second day, and 1 on the third day. Despite all these shortcomings, reporting by patient remains a popular and valid method of presenting glycemic control results, particularly when complemented by other views and refined to control for the number of readings per day.
-
Monitored Patient‐Day: The denominator in this setting is the total number of days a patient glucose level is monitored. The benefits of this method have been described and advocated in the literature.1 As with patient‐level analyses, this measure will be more rigorous and meaningful if the BG measures to be evaluated have been standardized. Typical reports might include percentage of monitored days with any hypoglycemia, or percentage of monitored days with all glucose values in the desired range. This unit of analysis may be considered more difficult to generate and to interpret. On the other hand, it is clinically relevant, less biased by LOS effects, and may be considered the most actionable metric by clinicians. This method provides a good balance when presented with data organized by patient.
The following example uses all 3 units of measurement, in this case to determine the rate of hypoglycemia, demonstrating the different but complementary information that each method provides:
-
In 1 month, 3900 POC glucose measurements were obtained from 286 patients representing 986 monitored patient‐days. With hypoglycemia defined as POC BG 60 mg/dL, the results showed the following:
-
50 of 3900 measurements (1.4%) were hypoglycemic 22 of 286 patients (7.7%) had 1 hypoglycemic episodes
-
40 of 986 monitored days (4.4%) had 1 hypoglycemic episodes.
The metric based on the number of glucose readings could be considered the least clinically relevant because it is unclear how many patients were affected; moreover, it may be based on variable testing patterns among patients, and could be influenced disproportionately by 1 patient with frequent hypoglycemia, many glucose readings, and/or a long LOS. One could argue that the patient‐stay metric is artificially elevated because a single hypoglycemic episode characterizes the entire stay as hypoglycemic. On the other hand, at least it acknowledges the number of patients affected by hypoglycemia. The patient‐day unit of analysis likely provides the most balanced view, one that is clinically relevant and measured over a standard period of time, and less biased by LOS and frequency of testing.
One way to express patient‐day glycemic control that deserves special mention is the patient‐day weighted mean. A mean glucose is calculated for each patient‐day, and then the mean is calculated across all patient‐days. The advantage of this approach is that it corrects for variation in the number of glucose readings each day; all hospital days are weighted equally.
Recommendation:
-
In noncritical care units, we recommend a combination of patient‐day and patient‐stay measures.
-
In critical care units, it is acceptable to also use glucose reading as the unit of measurement given more frequent and uniform data collection, but it should be complemented by more meaningful patient‐day and patient‐stay measures.
Measures of Control
In addition to deciding the unit(s) of analysis, another issue concerns which measures of control to use. These could include rates of hypoglycemia and hyperglycemia, percentage of glucose readings within various ranges (eg, 70, 70180, >180 mg/dL), mean glucose value, percentage of patient‐days during which the mean glucose is within various ranges, or the in control rate (ie, when all glucose values are within a certain range).
As with the various units of analysis, each of these measures of control has various advantages and disadvantages. For example, mean glucose is easy to report and understand, but masks extreme values. Percentage of glucose values within a certain range (eg, per patient, averaged across patients) presents a more complete picture but is a little harder to understand and will vary depending on the frequency of glucose monitoring. As mentioned above, this latter problem can be corrected in part by including only certain glucose values. Percent of glucose values within range may also be less sensitive to change than mean glucose (eg, a glucose that is lowered from 300 mg/dL to 200 mg/dL is still out of range). We recommend choosing a few, but not all, measures of control in order to get a complete picture of glycemic control. Over time one can then refine the measures being used to meet the needs of the glycemic control team and provide data that will drive the performance improvement process.
In critical care and perioperative settings, interest in glycemic control is often more intense around the time of a particular event such as major surgery or after admission to the ICU. Some measures commonly used in performing such analyses are:
-
All values outside a target range within a designated crucial period. For example, the University Healthcare Consortium and other organizations use a simple metric to gauge perioperative glycemic control. They collect the fasting glucose on postoperative days 1 and 2 and then calculate the percentage of postoperative days with any fasting glucose >200 mg/dL. Of course, this is a very liberal target, but it can always be lowered in a stepwise fashion once it is regularly being reached.
-
Three‐day blood glucose average. The Portland group uses the mean glucose of each patient for the period that includes the day of coronary artery bypass graft (CABG) surgery and the following 2 days. The 3‐day BG average (3‐BG) correlates very well with patient outcomes and can serve as a well‐defined target.2 It is likely that use of the 3‐BG would work well in other perioperative/trauma settings and could work in the medical ICU as well, with admission to the ICU as the starting point for calculation of the 3‐BG.
Hyperglycemic Index
Measuring the hyperglycemic index (HGI) is a validated method of summarizing glycemic control of ICU patients.3 It is designed to take into account the sometimes uneven distribution of patient testing. Time is plotted on the x‐axis and glucose values on the y‐axis. The HGI is calculated the area under the curve of glycemic values but above the upper limit of normal (ie, 110 mg/dL). Glucose values in the normal or hypoglycemic range are not included in the AUC. Mortality correlated well with this glycemic index. However, a recent observational study of glucometrics in patients hospitalized with acute myocardial infarction found that the simple mean of each patient's glucose values over the entire hospitalization was as predictive of in‐hospital mortality as the HGI or the time‐averaged glucose (AUC for all glucose values).4 In this study, metrics derived from glucose readings for the entire hospitalization were more predictive than those based on the first 24 or 48 hours or on the admission glucose.
Analyses Describing Change in Glycemic Control Over Time in the Hospital
In the critical care setting, this unit of analysis may be as simple as the mean time to reach the glycemic target on your insulin infusion protocol. On noncritical care wards, it is a bit more challenging to characterize the improvement (or clinical inertia) implied by failure of hyperglycemia to lessen as an inpatient stay progresses. One method is to calculate the mean glucose (or percentage of glucose values in a given range) for each patient on hospital day (HD) 1, and repeat for each HD (up to some reasonable limit, such as 5 or 7 days).
Recommendations:
-
In noncritical units, we recommend a limited set of complementary measures, such as the patient‐day weighted mean glucose, mean percent of glucose readings per patient that are within a certain range, and percentage of patients whose mean glucose is within a certain range on each hospital day.
-
In critical care units, it is often useful to focus measures around a certain critical event such as the 3‐day blood glucose average and to use measures such as the HGI that take advantage of more frequent blood glucose testing.
Definitions of Hyperglycemia and Hypoglycemia
Glucometrics outcomes will obviously depend on the thresholds established for hyperglycemia and hypoglycemia. Many centers define hypoglycemia as 60 mg/dL, whereas the ADA definition, based on physiologic changes that may take place, defines hypoglycemia (at least in the outpatient setting) as 70 mg/dL. Hypoglycemia may be further stratified by severity, with any glucose 40 mg/dL, for instance, defined as severe hypoglycemia.
Similarly, the definition of hyperglycemia (and therefore good control) must also be defined. Based on definitions developed by the ADA and AACE, the state of the medical literature, and current understanding of the pathophysiology of hyperglycemia, thresholds for critical care units include 110 mg/dL, 130 mg/dL, and 140 mg/dL, and options in noncritical care units include 130 mg/dL, 140 mg/dL, and 180 mg/dL. Because these thresholds implicitly assume adverse effects when glucose levels are above them, these levels are subject to revision as data become available confirming the benefits and safety of targeted glycemic control in various settings and patient populations.
Introducing optimal BG targets in a stepped fashion over time should also be considered. Furnary et al.2 have done this in the Portland Project, which tracks glycemic control in cardiac surgery patients receiving intravenous insulin therapy. The initial BG target for this project was 200 mg/dL; it was subsequently lowered stepwise over several years to 150 mg/dL, then to 120 mg/dL, and most recently to 110 mg/dL. This approach allows the safe introduction of targeted glycemic control and promotes acceptance of the concept by physicians and the allied nursing and medical staff.
Recommendations:
-
In noncritical care units, it is reasonable to use 40 mg/dL for severe hypoglycemia, 70 mg/dL for hypoglycemia, 130 mg/dL for fasting hyperglycemia, 180 mg/dL for random or postprandial hyperglycemia, and 300 mg/dL for severe hyperglycemia, keeping in mind that these thresholds are arbitrary. In critical care units, values from 110 mg/dL to 140 mg/dL might be better thresholds for hyperglycemia, but it may take time to safely and effectively move an organization toward these lower targets.
Other Considerations Relative to Glucometrics
Yale Glucometrics Website
The Yale Informatics group has put together a Web‐based resource (
Other Analytic Resources
Commercially available software, such as the RALS system (Medical Automation Systems, Inc., Charlottesville, VA) can gather POC glucose measurements directly from devices and provide real‐time reports of glycemic control, stratified by inpatient unit, using user‐defined targets for hypoglycemia and hyperglycemia. While they are no substitute for a dedicated, on‐site data analyst, such systems can be very useful for smaller hospitals with minimal data or information technology support staff.
APPROACHES TO ANALYSIS: RUN CHARTS
Most conventional clinical trials hold interventions fixed for a period of time and compare results with and without the intervention. For quality improvement studies, this is still a valid way to proceed, especially if studied as a randomized controlled trial. Such methods may be preferred when the clinical question is Does this type of intervention work in general? and the desired output is publication in peer‐reviewed journals so that others can learn about and adopt the intervention to their own institution. A before and after study with a similar analytic approach may also be valid, although concerns about temporal trends and cointerventions potentially compromise the validity of such studies. This approach again assumes that an intervention is held fixed over time such that it is clear what patients received during each time period.
If the desired result is improvement at a given institution (the question is Did we improve care?) then it may be preferable to present results over time using run‐charts. In a run chart, the x‐axis is time and the y‐axis the desired metric, such as patient‐day weighted mean glucose. Points in time when interventions were introduced or modified can be highlighted. Run charts have several advantages over before‐and‐after summaries: they do not require interventions remaining fixed and are more compatible with continuous quality improvement methods, it is easier to see the effect of different aspects of the interventions as they occur, one can get a quicker picture of whether something is working, and it is easier to separate out the impact of the intervention from secular trends. Finally, the use of run charts does not imply the absence of statistical rigor. Run charts with statistical process control (SPC) limits5 can easily convey when the observed time trend is unlikely to be due to chance using prespecified P values. (A full discussion of SPC and other methods to study quality improvement interventions is beyond the scope of this article.)
ASSESSING PATTERNS OF INSULIN USE AND ORDER SET UTILIZATION
Besides measuring the impact of quality improvement interventions on glucose control, it is important to measure processes such as proper insulin use. As mentioned in other articles in this supplement, processes are much more sensitive to change than outcomes. Failure to change processes should lead one to make changes to the intervention.
ICU and Perioperative Settings
For ICU and perioperative settings, the major process measure will likely be use of the insulin infusion order set. Designation of BG levels that trigger insulin infusion in these settings should be agreed upon in advance. The number of patients who meet the predefined glycemic criteria would make up the denominator, and the number of patients on the insulin infusion order set would make up the numerator.
NonCritical Care Units
On noncritical care units, measuring the percentage of subcutaneous insulin regimens that contain a basal insulin is a useful way to monitor the impact of an intervention. A more detailed analysis could examine the percentage of patients on simultaneous basal and nutritional insulin (if applicable). An important measure of clinical inertia is to track the percentage of patients who had changes in their insulin regimens on days after hypoglycemic or hyperglycemic excursions. Another important measure is the frequency with which the standardized order set is being used, analogous to the measure of insulin infusion use in the ICU. A final process measure, indirectly related to insulin use, is the frequency of use of oral diabetes agents, especially by patients for whom their use is contraindicated (eg, patients with congestive heart failure who are on thiazolidinediones and patients with renal insufficiency or receiving intravenous contrast continued on metformin).
OTHER CONSIDERATIONS AND METRICS
Examples of other metrics that can be used to track the success of quality improvement efforts include:
-
Glucose measurement within 8 hours of hospital admission.
-
Glycated hemoglobin (A1C) measurement obtained or available within 30 days of admission to help guide inpatient and especially discharge management.
-
Appropriate glucose testing in patients with diabetes or hyperglycemia (eg, 4 times per day in patients not on insulin infusion protocols, at least until 24 hours of euglycemia is documented).
-
The percentage of patients on insulin with on‐time tray delivery.
-
The timing of subcutaneous insulin administration in relation to glucose testing and nutrition delivery.
-
Documentation of carbohydrate intake among patients who are eating.
-
Satisfaction of physicians and nurses with order sets or protocols, using standard surveys.
-
Physician and nurse knowledge, attitudes, and beliefs about insulin administration, fear of hypoglycemia, treatment of hypoglycemia, and glycemic control in the hospital.
-
Patient satisfaction with their diabetes care in the hospital, including the education they received.
-
Nursing and physician education/certification in insulin prescribing, insulin administration, and other diabetes care issues.
-
Patient outcomes strongly associated with glycemic control, (eg, surgical wound infections, ICU LOS, catheter‐related bloodstream infections).
-
Appropriate treatment and documentation of hypoglycemia (eg, in accordance with hospital policy).
-
Documentation of severe hypoglycemic events through the hospital's adverse events reporting system (these may actually increase as change comes to the organization and as clinical personnel are more attuned to glycemic control).
-
Root causes of hypoglycemic events, which can be used to understand and prevent future events.
-
Appropriate transitions from IV to SC insulin regimens, (eg, starting basal insulin prior to discontinuing infusion in patients who have been on an insulin infusion of at least 2 units/hour or who have a known diagnosis of diabetes or A1C >7).
(Survey instruments and other measurement tools are available from the authors upon request.)
SHM GLYCEMIC CONTROL TASK FORCE SUMMARY RECOMMENDATIONS
The SHM Glycemic Control Task Force is working to develop standardized measures of inpatient glucose control and related indicators to track progress of hospital glycemic control initiatives (see the introduction to this supplement for a description of the charge and membership of this task force). The goals of the Task Force's metrics recommendations (Table 1) are several‐fold: (1) create a set of measurements that are complete but not overly burdensome; (2) create realistic measures that can be applied to institutions with different data management capabilities; and (3) allow for comparison across institutions for benchmarking purposes, evaluation of quality improvement projects, and reporting of results for formal research studies in this field.
| Measurement Issue | NonCritical Care Units | Critical Care Units | ||
|---|---|---|---|---|
| Tier 1 Recommendations | Tier 2 Recommendations | Tier 1 Recommendations | Tier 2 Recommendations | |
| ||||
| Patient inclusion and exclusion criteria | All adult patients with POC glucose testing (sampling acceptable). Exclude patients with DKA or HHS or who are pregnant. | All adult patients with diagnosis of diabetes by ICD‐9 code* or by glucose testing: random glucose (POC or laboratory) >180 mg/dL 2 or fasting glucose >130 mg/dL 2, excluding patients with DKA or HHS or who are pregnant. Additional analysis: exclude patients with 5 evaluable glucose readings, patients with LOS 2 days, or receiving palliative care. | All patients in every critical care unit (sampling acceptable). | Patients with DKA, HHS, or pregnancy in separate analyses. All patients in every critical care unit with random glucose (POC or laboratory) >140 mg/dL 2. |
| Glucose reading inclusion and exclusion criteria | All POC glucose values. | Additional analysis: exclude glucose values on hospital day 1 and on hospital day 15 and after. Additional analysis: exclude glucose values measured within 60 minutes of a previous value. | All POC and other glucose values used to guide care. | |
| Measures of safety | Analysis by patient‐day: Percentage of patient‐days with 1 or more values 40, 70, and >300 mg/dL. | Analysis by patient‐day: Percentage of patient‐days with 1 or more values 40, 70, and >300 mg/dL. | ||
| Measures of glucose control | Analysis by patient‐day: Percentage of patient‐days with mean 140, 180 mg/dL and/or Percentage of patient‐days with all values 180 mg/dL. | Analysis by patient‐day: Patient day‐weighted mean glucose. | Analysis by glucose reading: Percentage of readings 110, 140 mg/dL. | 3‐BG as above for all patients in critical care units.∥ Hyperglycemic index for all patients in critical care units (AUC of glucose values above target). |
| Analysis by patient stay: Percentage of patient stays with mean 140, 180 mg/dL. | Analysis by patient stay: Mean percentage of glucose readings of each patient 180 mg/dL. | Analysis by patient‐day: Percentage of patient‐days with mean 110, 140 mg/dL, and/or Percentage of patient‐days with all values 110, 140 mg/dL. | ||
| Analysis by hospital day: Percentage of patients with mean glucose readings 140, 180 mg/dL by hospital day (days 17). | Analysis by patient stay: 3‐day blood glucose average (3‐BG) for selected perioperative patients: Percentage of patients with 3‐BG 110, 140 mg/dL. Mean time (hours) to reach glycemic target (BG 110 or 140 mg/dL) on insulin infusion. | |||
| Measures of insulin use | Percentage of patients on any subcutaneous insulin that has a scheduled basal insulin component (glargine, NPH, or detemir). | Percentage of patients with at least 2 POC and/or laboratory glucose readings >180 mg/dL who have a scheduled basal insulin component. Percentage of eating patients with hyperglycemia as defined above with scheduled basal insulin and nutritional insulin. Percentage of patients and patient‐days with any changes in insulin orders the day after 2 or more episodes of hypoglycemia or hyperglycemia (ie, 70 or >180 mg/dL). | Percentage of patients with 2 POC or laboratory glucose readings >140 mg/dL placed on insulin infusion protocol. | |
| Other process measures | Glucose measured within 8 hours of hospital admission. | POC glucose testing at least 4 times a day for all patients with diabetes or hyperglycemia as defined above. | Glucose measured within 8 hours of hospital admission. | Appropriateness of hypoglycemia treatment and documentation. |
| A1C measurement obtained or available within 30 days of admission. | Measures of adherence to specific components of management protocol. | Frequency of BG testing (eg, per protocol if on insulin infusion; every 68 hours if not). | Clinical events of severe hypoglycemia reported through the organization's critical events reporting tool. | |
| Appropriateness of hypoglycemia treatment and documentation. | Root causes of hypoglycemia. | |||
| Clinical events of severe hypoglycemia reported through the organization's critical events reporting tool. | Appropriate use of IV‐to‐SC insulin transition protocol. | |||
| Root causes of hypoglycemia. | ||||
For each domain of glycemic management (glycemic control, safety, and insulin use), the task force chose a set of best measures. They are presented as two tiers of measurement standards, depending on the capabilities of the institution and the planned uses of the data. Tier 1 includes measures that, although they do take time and resources to collect, are feasible for most institutions. Tier 2 measures are recommended for hospitals with easy manipulation of electronic sources of data and for reporting quality‐of‐care measures for widespread publication, that is, in the context of a research study. It should be emphasized that these recommendations are only meant as a guide: the actual measures chosen should meet the needs and capabilities of each institution.
We recognize that few data support the recommendations made by this task force, that such data are needed, and that the field of data collection and analysis for hospital glycemic management is rapidly evolving. The hope is to begin the standardization process, promote dialogue in this field, and eventually reach a consensus in collaboration with the ADA, AACE, and other pertinent stakeholders.
CONCLUSIONS
Like the field of inpatient glycemic management itself, the field of devising metrics to measure the quality of inpatient glycemic control is also in its infancy and quickly evolving. One should not be paralyzed by the lack of consensus regarding measurementthe important point is to pick a few complementary metrics and begin the process. The table of recommendations can hopefully serve as a starting point for many institutions, with a focus on efficacy (glycemic control), safety (hypoglycemia), and process (insulin use patterns). As your institution gains experience with measurement and the field evolves, your metrics will likely change. We recommend keeping all process and outcome data in its raw form so that it can be summarized in different ways over time. It is also important not to wait for the perfect data collection tool before beginning to analyze data: sampling and paper processes are acceptable if automated data collection is not yet possible. Eventually, blood glucose meter readings should be downloaded into a central database that interfaces with hospital data repositories so data can be analyzed in conjunction with patient, service, and unit‐level information. Only with a rigorous measurement process can institutions hope to know whether their changes are resulting in improved care for patients.
- ,,, et al.“Glucometrics”—assessing the quality of inpatient glucose management.Diabetes Technol Ther.2006;8:560–569.
- ,,.Effect of hyperglycemia and continuous intravenous insulin infusions on outcomes of cardiac surgical procedures: the Portland Diabetic Project.Endocr Pract.2004;10(suppl 2):21–33.
- ,,.Hyperglycaemic index as a tool to assess glucose control: a retrospective study.Crit Care.2004;8:R122–R127.
- ,,, et al.Glucometrics in patients hospitalized with acute myocardial infarction: defining the optimal outcomes‐based measure of risk.Circulation.2008;117:1018–1027.
- ,,.Statistical process control as a tool for research and healthcare improvement.Qual Saf Health Care.2003;12:458–464.
Data collection, analysis, and presentation are key to the success of any hospital glycemic control initiative. Such efforts enable the management team to track improvements in processes and outcomes, make necessary changes to their quality improvement efforts, justify the provision of necessary time and resources, and share their results with others. Reliable metrics for assessing glycemic control and frequency of hypoglycemia are essential to accomplish these tasks and to assess whether interventions result in more benefit than harm. Hypoglycemia metrics must be especially convincing because fear of hypoglycemia remains a major source of clinical inertia, impeding efforts to improve glucose control.
Currently, there are no official standards or guidelines for formulating metrics on the quality of inpatient glycemic control. This creates several problems. First, different metrics vary in their biases and in their responsiveness to change. Thus, use of a poor metric could lead to either a falsely positive or falsely negative impression that a quality improvement intervention is in fact improving glycemic control. Second, the proliferation of different measures and analytical plans in the research and quality improvement literature make it very difficult for hospitals to compare baseline performance, determine need for improvement, and understand which interventions may be most effective.
A related article in this supplement provides the rationale for improved inpatient glycemic control. That article argues that the current state of inpatient glycemic control, with the frequent occurrence of severe hyperglycemia and irrational insulin ordering, cannot be considered acceptable, especially given the large body of data (albeit largely observational) linking hyperglycemia to negative patient outcomes. However, regardless of whether one is an advocate or skeptic of tighter glucose control in the intensive care unit (ICU) and especially the non‐ICU setting, there is no question that standardized, valid, and reliable metrics are needed to compare efforts to improve glycemic control, better understand whether such control actually improves patient care, and closely monitor patient safety.
This article provides a summary of practical suggestions to assess glycemic control, insulin use patterns, and safety (hypoglycemia and severe hyperglycemia). In particular, we discuss the pros and cons of various measurement choices. We conclude with a tiered summary of recommendations for practical metrics that we hope will be useful to individual improvement teams. This article is not a consensus statement but rather a starting place that we hope will begin to standardize measurement across institutions and advance the dialogue on this subject. To more definitely address this problem, we call on the American Association of Clinical Endocrinologists (AACE), American Diabetes Association (ADA), Society of Hospital Medicine (SHM), and others to agree on consensus standards regarding metrics for the quality of inpatient glycemic control.
MEASURING GLYCEMIC CONTROL: GLUCOMETRICS
Glucometrics may be defined as the systematic analysis of blood glucose (BG) dataa phrase initially coined specifically for the inpatient setting. There are numerous ways to do these analyses, depending on which patients and glucose values are considered, the definitions used for hypoglycemia and hyperglycemia, the unit of measurement (eg, patient, patient‐day, individual glucose value), and the measure of control (eg, mean, median, percent of glucose readings within a certain range). We consider each of these dimensions in turn.
Defining the Target Patient Population
The first decision to be made is which patients to include in your analysis. Choices include the following:
-
Patients with a discharge diagnosis of diabetes: this group has face validity and intuitive appeal, is easy to identify retrospectively, and may capture some untested/untreated diabetics, but will miss patients with otherwise undiagnosed diabetes and stress hyperglycemia. It is also subject to the variable accuracy of billing codes.
-
Patients with a certain number of point‐of‐care (POC) glucose measurements: this group is also easy to identify, easy to measure, and will include patients with hyperglycemia without a previous diagnosis of diabetes, but will miss patients with untested/untreated hyperglycemia. Also, if glucose levels are checked on normoglycemic, nondiabetic patients, these values may dilute the overall assessment of glycemic control.
-
Patients treated with insulin in the hospital: this is a good choice if the purpose is mainly drug safety and avoidance of hypoglycemia, but by definition excludes most untreated patients.
-
Patients with 2 or more BG values (laboratory and/or POC) over a certain threshold (eg, >180 mg/dL). This will likely capture more patients with inpatient hyperglycemia, whether or not detected by the medical team, but is subject to wide variations in the frequency and timing of laboratory glucose testing, including whether or not the values are pre‐prandial (note that even preprandial POC glucose measurements are not always in fact fasting values).
Other considerations include the following:
-
Are there natural patient subgroups that should be measured and analyzed separately because of different guidelines? For example, there probably should be separate/emndependent inclusion criteria and analyses for critical care and noncritical care units because their glycemic targets and management considerations differ.
-
Which patients should be excluded? For example, if targeting subcutaneous insulin use in general hospitalized patients, one might eliminate those patients who are admitted specifically as the result of a diabetes emergency (eg, diabetic ketoacidosis [DKA] and hyperglycemic hyperosmolar state [HHS]), as their marked and prolonged hyperglycemia will skew BG data. Pregnant women should generally be excluded from broad‐based analyses or considered as a discrete category because they have very different targets for BG therapy. Patients with short lengths of stay may be less likely to benefit from tight glucose control and may also be considered for post hoc exclusion. One might also exclude patients with very few evaluable glucose readings (eg, fewer than 5) to ensure that measurement is meaningful for a given patient, keeping in mind that this may also exclude patients with undetected hyperglycemia, as mentioned above. Finally, patients receiving palliative care should also be considered for exclusion if feasible.
Recommendation: Do not limit analyses to only those patients with a diagnosis of diabetes or only those on insulin, which will lead to biased results.
-
For noncritical care patients, we recommend a combined approach: adult patients with a diagnosis of diabetes (e. g. using diagnosis‐related group [DRG] codes 294 or 295 or International Classification of Diseases 9th edition [ICD9] codes 250.xx) or with hyperglycemia (eg, 2 or more random laboratory and/or point of care (POC) BG values >180 mg/dL or 2 or more fasting BG values >130 mg/dL), excluding patients with DKA or HHS or who are pregnant.
-
For critical care units, we recommend either all patients, or patients with at least mild hyperglycemia (eg, 2 random glucose levels >140 mg/dL). Critical care patients with DKA, HHS, and pregnancy should be evaluated separately if possible.
Which Glucose Values to Include and Exclude
To answer this question, we first need to decide which method to use for BG measurement. There are several ways to measure BG, including the type of sample collected (capillary [fingerstick], arterial, and venous) and the technique used (central laboratory analyzing plasma, central laboratory analyzing whole blood [eg, from an arterial blood gas sample], glucose meter [usually calibrated to plasma], etc.). The POC (eg, capillary, glucose meter) glucose measurements alone are often preferred in the non‐ICU setting because laboratory plasma values generally provide little additional information and typically lower the mean glucose by including redundant fasting values.1 In critical care units, several different methods are often used together, and each merits inclusion. The inherent differences in calibration between the methods do not generally require separate analyses, especially given the frequency of testing in the ICU setting.
The next question is which values to include in analyses. In some situations, it may be most useful to focus on a certain period of hospitalization, such as the day of a procedure and the next 2 days in assessing the impact of the quality of perioperative care, or the first 14 days of a noncritical care stay to keep outliers for length of stay (LOS) from skewing the data. In the non‐ICU setting, it may be reasonable to exclude the first day of hospitalization, as early BG control is impacted by multiple variables beyond direct control of the clinician (eg, glucose control prior to admission, severity of presenting illness) and may not realistically reflect your interventions. (Keep in mind, however, that it may be useful to adjust for the admission glucose value in multivariable models given its importance to clinical outcomes and its strong relationship to subsequent inpatient glucose control.) However, in critical care units, it is reasonable to include the first day's readings in analyses given the high frequency of glucose measurements in this setting and the expectation that glucose control should be achieved within a few hours of starting an intravenous insulin infusion.
If feasible to do so with your institution's data capture methods, you may wish to select only the regularly scheduled (before each meal [qAC] and at bedtime [qHS], or every 6 hours [q6h]) glucose readings for inclusion in the summary data of glycemic control in the non‐ICU setting, thereby reducing bias caused by repeated measurements around extremes of glycemic excursions. An alternative in the non‐ICU setting is to censor glucose readings within 60 minutes of a previous reading.
Recommendation:
-
In the non‐ICU setting, we recommend first looking at all POC glucose values and if possible repeating the analyses excluding hospital day 1 and hospital day 15 and beyond, and also excluding glucose values measured within 60 minutes of a previous value.
-
In critical care units, we recommend evaluating all glucose readings used to guide care.
Units of Analysis
There are several different units of analysis, each with its own advantages and disadvantages:
-
Glucose value: this is the simplest measure and the one with the most statistical power. All glucose values for all patients of interest comprise the denominator. A report might say, for example, that 1% of the 1000 glucose values were 70 mg/dL during a certain period or that the mean of all glucose values collected for the month from patients in noncritical care areas was 160 mg/dL. The potential disadvantages of this approach are that these analyses are less clinically relevant than patient‐level analyses and that patients with many glucose readings and long hospitalizations may skew the data.
-
Patient (or the Patient Stay, [ie, the entire hospitalization]): all patients who are monitored make up the denominator. The numerator may be the percentage of patients with any hypoglycemia during their hospital stay or the percentage of patients achieving a certain mean glucose during their hospitalization, for example. This is inherently more clinically meaningful than using glucose value as a unit of analysis. A major disadvantage is not controlling for LOS effects. For example, a hospitalized patient with a long LOS is much more likely to be characterized as having at least 1 hypoglycemic value than is a patient with a shorter LOS. Another shortcoming is that this approach does not correct for uneven distribution of testing. A patient's mean glucose might be calculated on the basis of 8 glucose values on the first day of hospitalization, 4 on the second day, and 1 on the third day. Despite all these shortcomings, reporting by patient remains a popular and valid method of presenting glycemic control results, particularly when complemented by other views and refined to control for the number of readings per day.
-
Monitored Patient‐Day: The denominator in this setting is the total number of days a patient glucose level is monitored. The benefits of this method have been described and advocated in the literature.1 As with patient‐level analyses, this measure will be more rigorous and meaningful if the BG measures to be evaluated have been standardized. Typical reports might include percentage of monitored days with any hypoglycemia, or percentage of monitored days with all glucose values in the desired range. This unit of analysis may be considered more difficult to generate and to interpret. On the other hand, it is clinically relevant, less biased by LOS effects, and may be considered the most actionable metric by clinicians. This method provides a good balance when presented with data organized by patient.
The following example uses all 3 units of measurement, in this case to determine the rate of hypoglycemia, demonstrating the different but complementary information that each method provides:
-
In 1 month, 3900 POC glucose measurements were obtained from 286 patients representing 986 monitored patient‐days. With hypoglycemia defined as POC BG 60 mg/dL, the results showed the following:
-
50 of 3900 measurements (1.4%) were hypoglycemic 22 of 286 patients (7.7%) had 1 hypoglycemic episodes
-
40 of 986 monitored days (4.4%) had 1 hypoglycemic episodes.
The metric based on the number of glucose readings could be considered the least clinically relevant because it is unclear how many patients were affected; moreover, it may be based on variable testing patterns among patients, and could be influenced disproportionately by 1 patient with frequent hypoglycemia, many glucose readings, and/or a long LOS. One could argue that the patient‐stay metric is artificially elevated because a single hypoglycemic episode characterizes the entire stay as hypoglycemic. On the other hand, at least it acknowledges the number of patients affected by hypoglycemia. The patient‐day unit of analysis likely provides the most balanced view, one that is clinically relevant and measured over a standard period of time, and less biased by LOS and frequency of testing.
One way to express patient‐day glycemic control that deserves special mention is the patient‐day weighted mean. A mean glucose is calculated for each patient‐day, and then the mean is calculated across all patient‐days. The advantage of this approach is that it corrects for variation in the number of glucose readings each day; all hospital days are weighted equally.
Recommendation:
-
In noncritical care units, we recommend a combination of patient‐day and patient‐stay measures.
-
In critical care units, it is acceptable to also use glucose reading as the unit of measurement given more frequent and uniform data collection, but it should be complemented by more meaningful patient‐day and patient‐stay measures.
Measures of Control
In addition to deciding the unit(s) of analysis, another issue concerns which measures of control to use. These could include rates of hypoglycemia and hyperglycemia, percentage of glucose readings within various ranges (eg, 70, 70180, >180 mg/dL), mean glucose value, percentage of patient‐days during which the mean glucose is within various ranges, or the in control rate (ie, when all glucose values are within a certain range).
As with the various units of analysis, each of these measures of control has various advantages and disadvantages. For example, mean glucose is easy to report and understand, but masks extreme values. Percentage of glucose values within a certain range (eg, per patient, averaged across patients) presents a more complete picture but is a little harder to understand and will vary depending on the frequency of glucose monitoring. As mentioned above, this latter problem can be corrected in part by including only certain glucose values. Percent of glucose values within range may also be less sensitive to change than mean glucose (eg, a glucose that is lowered from 300 mg/dL to 200 mg/dL is still out of range). We recommend choosing a few, but not all, measures of control in order to get a complete picture of glycemic control. Over time one can then refine the measures being used to meet the needs of the glycemic control team and provide data that will drive the performance improvement process.
In critical care and perioperative settings, interest in glycemic control is often more intense around the time of a particular event such as major surgery or after admission to the ICU. Some measures commonly used in performing such analyses are:
-
All values outside a target range within a designated crucial period. For example, the University Healthcare Consortium and other organizations use a simple metric to gauge perioperative glycemic control. They collect the fasting glucose on postoperative days 1 and 2 and then calculate the percentage of postoperative days with any fasting glucose >200 mg/dL. Of course, this is a very liberal target, but it can always be lowered in a stepwise fashion once it is regularly being reached.
-
Three‐day blood glucose average. The Portland group uses the mean glucose of each patient for the period that includes the day of coronary artery bypass graft (CABG) surgery and the following 2 days. The 3‐day BG average (3‐BG) correlates very well with patient outcomes and can serve as a well‐defined target.2 It is likely that use of the 3‐BG would work well in other perioperative/trauma settings and could work in the medical ICU as well, with admission to the ICU as the starting point for calculation of the 3‐BG.
Hyperglycemic Index
Measuring the hyperglycemic index (HGI) is a validated method of summarizing glycemic control of ICU patients.3 It is designed to take into account the sometimes uneven distribution of patient testing. Time is plotted on the x‐axis and glucose values on the y‐axis. The HGI is calculated the area under the curve of glycemic values but above the upper limit of normal (ie, 110 mg/dL). Glucose values in the normal or hypoglycemic range are not included in the AUC. Mortality correlated well with this glycemic index. However, a recent observational study of glucometrics in patients hospitalized with acute myocardial infarction found that the simple mean of each patient's glucose values over the entire hospitalization was as predictive of in‐hospital mortality as the HGI or the time‐averaged glucose (AUC for all glucose values).4 In this study, metrics derived from glucose readings for the entire hospitalization were more predictive than those based on the first 24 or 48 hours or on the admission glucose.
Analyses Describing Change in Glycemic Control Over Time in the Hospital
In the critical care setting, this unit of analysis may be as simple as the mean time to reach the glycemic target on your insulin infusion protocol. On noncritical care wards, it is a bit more challenging to characterize the improvement (or clinical inertia) implied by failure of hyperglycemia to lessen as an inpatient stay progresses. One method is to calculate the mean glucose (or percentage of glucose values in a given range) for each patient on hospital day (HD) 1, and repeat for each HD (up to some reasonable limit, such as 5 or 7 days).
Recommendations:
-
In noncritical units, we recommend a limited set of complementary measures, such as the patient‐day weighted mean glucose, mean percent of glucose readings per patient that are within a certain range, and percentage of patients whose mean glucose is within a certain range on each hospital day.
-
In critical care units, it is often useful to focus measures around a certain critical event such as the 3‐day blood glucose average and to use measures such as the HGI that take advantage of more frequent blood glucose testing.
Definitions of Hyperglycemia and Hypoglycemia
Glucometrics outcomes will obviously depend on the thresholds established for hyperglycemia and hypoglycemia. Many centers define hypoglycemia as 60 mg/dL, whereas the ADA definition, based on physiologic changes that may take place, defines hypoglycemia (at least in the outpatient setting) as 70 mg/dL. Hypoglycemia may be further stratified by severity, with any glucose 40 mg/dL, for instance, defined as severe hypoglycemia.
Similarly, the definition of hyperglycemia (and therefore good control) must also be defined. Based on definitions developed by the ADA and AACE, the state of the medical literature, and current understanding of the pathophysiology of hyperglycemia, thresholds for critical care units include 110 mg/dL, 130 mg/dL, and 140 mg/dL, and options in noncritical care units include 130 mg/dL, 140 mg/dL, and 180 mg/dL. Because these thresholds implicitly assume adverse effects when glucose levels are above them, these levels are subject to revision as data become available confirming the benefits and safety of targeted glycemic control in various settings and patient populations.
Introducing optimal BG targets in a stepped fashion over time should also be considered. Furnary et al.2 have done this in the Portland Project, which tracks glycemic control in cardiac surgery patients receiving intravenous insulin therapy. The initial BG target for this project was 200 mg/dL; it was subsequently lowered stepwise over several years to 150 mg/dL, then to 120 mg/dL, and most recently to 110 mg/dL. This approach allows the safe introduction of targeted glycemic control and promotes acceptance of the concept by physicians and the allied nursing and medical staff.
Recommendations:
-
In noncritical care units, it is reasonable to use 40 mg/dL for severe hypoglycemia, 70 mg/dL for hypoglycemia, 130 mg/dL for fasting hyperglycemia, 180 mg/dL for random or postprandial hyperglycemia, and 300 mg/dL for severe hyperglycemia, keeping in mind that these thresholds are arbitrary. In critical care units, values from 110 mg/dL to 140 mg/dL might be better thresholds for hyperglycemia, but it may take time to safely and effectively move an organization toward these lower targets.
Other Considerations Relative to Glucometrics
Yale Glucometrics Website
The Yale Informatics group has put together a Web‐based resource (
Other Analytic Resources
Commercially available software, such as the RALS system (Medical Automation Systems, Inc., Charlottesville, VA) can gather POC glucose measurements directly from devices and provide real‐time reports of glycemic control, stratified by inpatient unit, using user‐defined targets for hypoglycemia and hyperglycemia. While they are no substitute for a dedicated, on‐site data analyst, such systems can be very useful for smaller hospitals with minimal data or information technology support staff.
APPROACHES TO ANALYSIS: RUN CHARTS
Most conventional clinical trials hold interventions fixed for a period of time and compare results with and without the intervention. For quality improvement studies, this is still a valid way to proceed, especially if studied as a randomized controlled trial. Such methods may be preferred when the clinical question is Does this type of intervention work in general? and the desired output is publication in peer‐reviewed journals so that others can learn about and adopt the intervention to their own institution. A before and after study with a similar analytic approach may also be valid, although concerns about temporal trends and cointerventions potentially compromise the validity of such studies. This approach again assumes that an intervention is held fixed over time such that it is clear what patients received during each time period.
If the desired result is improvement at a given institution (the question is Did we improve care?) then it may be preferable to present results over time using run‐charts. In a run chart, the x‐axis is time and the y‐axis the desired metric, such as patient‐day weighted mean glucose. Points in time when interventions were introduced or modified can be highlighted. Run charts have several advantages over before‐and‐after summaries: they do not require interventions remaining fixed and are more compatible with continuous quality improvement methods, it is easier to see the effect of different aspects of the interventions as they occur, one can get a quicker picture of whether something is working, and it is easier to separate out the impact of the intervention from secular trends. Finally, the use of run charts does not imply the absence of statistical rigor. Run charts with statistical process control (SPC) limits5 can easily convey when the observed time trend is unlikely to be due to chance using prespecified P values. (A full discussion of SPC and other methods to study quality improvement interventions is beyond the scope of this article.)
ASSESSING PATTERNS OF INSULIN USE AND ORDER SET UTILIZATION
Besides measuring the impact of quality improvement interventions on glucose control, it is important to measure processes such as proper insulin use. As mentioned in other articles in this supplement, processes are much more sensitive to change than outcomes. Failure to change processes should lead one to make changes to the intervention.
ICU and Perioperative Settings
For ICU and perioperative settings, the major process measure will likely be use of the insulin infusion order set. Designation of BG levels that trigger insulin infusion in these settings should be agreed upon in advance. The number of patients who meet the predefined glycemic criteria would make up the denominator, and the number of patients on the insulin infusion order set would make up the numerator.
NonCritical Care Units
On noncritical care units, measuring the percentage of subcutaneous insulin regimens that contain a basal insulin is a useful way to monitor the impact of an intervention. A more detailed analysis could examine the percentage of patients on simultaneous basal and nutritional insulin (if applicable). An important measure of clinical inertia is to track the percentage of patients who had changes in their insulin regimens on days after hypoglycemic or hyperglycemic excursions. Another important measure is the frequency with which the standardized order set is being used, analogous to the measure of insulin infusion use in the ICU. A final process measure, indirectly related to insulin use, is the frequency of use of oral diabetes agents, especially by patients for whom their use is contraindicated (eg, patients with congestive heart failure who are on thiazolidinediones and patients with renal insufficiency or receiving intravenous contrast continued on metformin).
OTHER CONSIDERATIONS AND METRICS
Examples of other metrics that can be used to track the success of quality improvement efforts include:
-
Glucose measurement within 8 hours of hospital admission.
-
Glycated hemoglobin (A1C) measurement obtained or available within 30 days of admission to help guide inpatient and especially discharge management.
-
Appropriate glucose testing in patients with diabetes or hyperglycemia (eg, 4 times per day in patients not on insulin infusion protocols, at least until 24 hours of euglycemia is documented).
-
The percentage of patients on insulin with on‐time tray delivery.
-
The timing of subcutaneous insulin administration in relation to glucose testing and nutrition delivery.
-
Documentation of carbohydrate intake among patients who are eating.
-
Satisfaction of physicians and nurses with order sets or protocols, using standard surveys.
-
Physician and nurse knowledge, attitudes, and beliefs about insulin administration, fear of hypoglycemia, treatment of hypoglycemia, and glycemic control in the hospital.
-
Patient satisfaction with their diabetes care in the hospital, including the education they received.
-
Nursing and physician education/certification in insulin prescribing, insulin administration, and other diabetes care issues.
-
Patient outcomes strongly associated with glycemic control, (eg, surgical wound infections, ICU LOS, catheter‐related bloodstream infections).
-
Appropriate treatment and documentation of hypoglycemia (eg, in accordance with hospital policy).
-
Documentation of severe hypoglycemic events through the hospital's adverse events reporting system (these may actually increase as change comes to the organization and as clinical personnel are more attuned to glycemic control).
-
Root causes of hypoglycemic events, which can be used to understand and prevent future events.
-
Appropriate transitions from IV to SC insulin regimens, (eg, starting basal insulin prior to discontinuing infusion in patients who have been on an insulin infusion of at least 2 units/hour or who have a known diagnosis of diabetes or A1C >7).
(Survey instruments and other measurement tools are available from the authors upon request.)
SHM GLYCEMIC CONTROL TASK FORCE SUMMARY RECOMMENDATIONS
The SHM Glycemic Control Task Force is working to develop standardized measures of inpatient glucose control and related indicators to track progress of hospital glycemic control initiatives (see the introduction to this supplement for a description of the charge and membership of this task force). The goals of the Task Force's metrics recommendations (Table 1) are several‐fold: (1) create a set of measurements that are complete but not overly burdensome; (2) create realistic measures that can be applied to institutions with different data management capabilities; and (3) allow for comparison across institutions for benchmarking purposes, evaluation of quality improvement projects, and reporting of results for formal research studies in this field.
| Measurement Issue | NonCritical Care Units | Critical Care Units | ||
|---|---|---|---|---|
| Tier 1 Recommendations | Tier 2 Recommendations | Tier 1 Recommendations | Tier 2 Recommendations | |
| ||||
| Patient inclusion and exclusion criteria | All adult patients with POC glucose testing (sampling acceptable). Exclude patients with DKA or HHS or who are pregnant. | All adult patients with diagnosis of diabetes by ICD‐9 code* or by glucose testing: random glucose (POC or laboratory) >180 mg/dL 2 or fasting glucose >130 mg/dL 2, excluding patients with DKA or HHS or who are pregnant. Additional analysis: exclude patients with 5 evaluable glucose readings, patients with LOS 2 days, or receiving palliative care. | All patients in every critical care unit (sampling acceptable). | Patients with DKA, HHS, or pregnancy in separate analyses. All patients in every critical care unit with random glucose (POC or laboratory) >140 mg/dL 2. |
| Glucose reading inclusion and exclusion criteria | All POC glucose values. | Additional analysis: exclude glucose values on hospital day 1 and on hospital day 15 and after. Additional analysis: exclude glucose values measured within 60 minutes of a previous value. | All POC and other glucose values used to guide care. | |
| Measures of safety | Analysis by patient‐day: Percentage of patient‐days with 1 or more values 40, 70, and >300 mg/dL. | Analysis by patient‐day: Percentage of patient‐days with 1 or more values 40, 70, and >300 mg/dL. | ||
| Measures of glucose control | Analysis by patient‐day: Percentage of patient‐days with mean 140, 180 mg/dL and/or Percentage of patient‐days with all values 180 mg/dL. | Analysis by patient‐day: Patient day‐weighted mean glucose. | Analysis by glucose reading: Percentage of readings 110, 140 mg/dL. | 3‐BG as above for all patients in critical care units.∥ Hyperglycemic index for all patients in critical care units (AUC of glucose values above target). |
| Analysis by patient stay: Percentage of patient stays with mean 140, 180 mg/dL. | Analysis by patient stay: Mean percentage of glucose readings of each patient 180 mg/dL. | Analysis by patient‐day: Percentage of patient‐days with mean 110, 140 mg/dL, and/or Percentage of patient‐days with all values 110, 140 mg/dL. | ||
| Analysis by hospital day: Percentage of patients with mean glucose readings 140, 180 mg/dL by hospital day (days 17). | Analysis by patient stay: 3‐day blood glucose average (3‐BG) for selected perioperative patients: Percentage of patients with 3‐BG 110, 140 mg/dL. Mean time (hours) to reach glycemic target (BG 110 or 140 mg/dL) on insulin infusion. | |||
| Measures of insulin use | Percentage of patients on any subcutaneous insulin that has a scheduled basal insulin component (glargine, NPH, or detemir). | Percentage of patients with at least 2 POC and/or laboratory glucose readings >180 mg/dL who have a scheduled basal insulin component. Percentage of eating patients with hyperglycemia as defined above with scheduled basal insulin and nutritional insulin. Percentage of patients and patient‐days with any changes in insulin orders the day after 2 or more episodes of hypoglycemia or hyperglycemia (ie, 70 or >180 mg/dL). | Percentage of patients with 2 POC or laboratory glucose readings >140 mg/dL placed on insulin infusion protocol. | |
| Other process measures | Glucose measured within 8 hours of hospital admission. | POC glucose testing at least 4 times a day for all patients with diabetes or hyperglycemia as defined above. | Glucose measured within 8 hours of hospital admission. | Appropriateness of hypoglycemia treatment and documentation. |
| A1C measurement obtained or available within 30 days of admission. | Measures of adherence to specific components of management protocol. | Frequency of BG testing (eg, per protocol if on insulin infusion; every 68 hours if not). | Clinical events of severe hypoglycemia reported through the organization's critical events reporting tool. | |
| Appropriateness of hypoglycemia treatment and documentation. | Root causes of hypoglycemia. | |||
| Clinical events of severe hypoglycemia reported through the organization's critical events reporting tool. | Appropriate use of IV‐to‐SC insulin transition protocol. | |||
| Root causes of hypoglycemia. | ||||
For each domain of glycemic management (glycemic control, safety, and insulin use), the task force chose a set of best measures. They are presented as two tiers of measurement standards, depending on the capabilities of the institution and the planned uses of the data. Tier 1 includes measures that, although they do take time and resources to collect, are feasible for most institutions. Tier 2 measures are recommended for hospitals with easy manipulation of electronic sources of data and for reporting quality‐of‐care measures for widespread publication, that is, in the context of a research study. It should be emphasized that these recommendations are only meant as a guide: the actual measures chosen should meet the needs and capabilities of each institution.
We recognize that few data support the recommendations made by this task force, that such data are needed, and that the field of data collection and analysis for hospital glycemic management is rapidly evolving. The hope is to begin the standardization process, promote dialogue in this field, and eventually reach a consensus in collaboration with the ADA, AACE, and other pertinent stakeholders.
CONCLUSIONS
Like the field of inpatient glycemic management itself, the field of devising metrics to measure the quality of inpatient glycemic control is also in its infancy and quickly evolving. One should not be paralyzed by the lack of consensus regarding measurementthe important point is to pick a few complementary metrics and begin the process. The table of recommendations can hopefully serve as a starting point for many institutions, with a focus on efficacy (glycemic control), safety (hypoglycemia), and process (insulin use patterns). As your institution gains experience with measurement and the field evolves, your metrics will likely change. We recommend keeping all process and outcome data in its raw form so that it can be summarized in different ways over time. It is also important not to wait for the perfect data collection tool before beginning to analyze data: sampling and paper processes are acceptable if automated data collection is not yet possible. Eventually, blood glucose meter readings should be downloaded into a central database that interfaces with hospital data repositories so data can be analyzed in conjunction with patient, service, and unit‐level information. Only with a rigorous measurement process can institutions hope to know whether their changes are resulting in improved care for patients.
- ,,, et al.“Glucometrics”—assessing the quality of inpatient glucose management.Diabetes Technol Ther.2006;8:560–569.
- ,,.Effect of hyperglycemia and continuous intravenous insulin infusions on outcomes of cardiac surgical procedures: the Portland Diabetic Project.Endocr Pract.2004;10(suppl 2):21–33.
- ,,.Hyperglycaemic index as a tool to assess glucose control: a retrospective study.Crit Care.2004;8:R122–R127.
- ,,, et al.Glucometrics in patients hospitalized with acute myocardial infarction: defining the optimal outcomes‐based measure of risk.Circulation.2008;117:1018–1027.
- ,,.Statistical process control as a tool for research and healthcare improvement.Qual Saf Health Care.2003;12:458–464.
Introduction
The articles on these pages represent the culmination of 3 years of effort by the Society of Hospital Medicine (SHM) Glycemic Control Task Force. In this brief introduction, we share a few insights and comments about this multidisciplinary collaborative effort to address the care of inpatients with hyperglycemia.
The SHM Glycemic Control Task Force was assembled in 2005, with the intent of improving the care of inpatients with diabetes. We wished to provide hospitalists and quality improvement teams with an understanding of the best practices to achieve safe glycemic control in the hospital. Additionally, this task force sought to identify tools and strategies to obtain improved communication, medication safety, education, and other aspects of care. A distinguished panel of experts attended their inaugural meeting in Chicago, Illinois, in October 2005, including hospitalists, endocrinologists, nurses, case managers, diabetes educators, and pharmacists. A roster of the individuals and organizations is given in the Appendix.
Many members of the SHM Glycemic Control Task Force also participated in the Call to Action consensus conference1 hosted by the American Association of Clinical Endocrinologists (AACE) and the American Diabetes Association (ADA) in January 2006. Both groups identified several barriers to improvement, and methods to overcome these barriers were summarized in this quote from the Consensus Conference,
Successful implementation of a program to improve glycemic control in the inpatient setting should include the following components:
-
An appropriate level of administrative support.
-
Formation of a multidisciplinary steering committee to drive the development of initiatives.
-
Assessment of current processes, quality of care, and barriers to practice change.
-
Development and implementation of interventions including standardized order sets, protocols, policies, and algorithms with associated educational programs.
-
Metrics for evaluation.
Both groups also called for a web‐based compendium of tested tools and strategies to assist local improvement teams.
After countless hours of development and revision by the SHM Glycemic Task Force and the Resource Room team, such a compendium addressing all of these components was launched on the SHM web site in the form of the SHM Glycemic Control Resource Room.2 A comprehensive implementation guide3 is available for downloading free of charge, and serves as the centerpiece of the Resource Room. Subsequently, this comprehensive but somewhat sprawling implementation guide evolved into these more sophisticated and concise articles.410 The topics include a review of the rationale for improving inpatient glycemic control,4 an important call for standardizing the metrics of glycemic control,9 subcutaneous insulin regimens and order sets,5, 6 insulin infusion protocols,7 transitions of care,8 and the business case for glycemic control.10 It has been a long but rewarding and educational journey, drawing on the collective experience from dozens of institutions in all kinds of inpatient care settings. A few key points and insights seem worth sharing.
THE IMPROVEMENT EFFORT IS NOT JUST ABOUT REACHING A GLYCEMIC TARGET
The term glycemic control team and the label for the SHM Glycemic Control Task Force itself are somewhat misnomers. Task Force members agree that desirable institutional glycemic target ranges should be established, but many among us believe the glycemic targets endorsed by national guidelines (ref ADA and AACE guidelines)11, 12 are too stringent. Furthermore, we believe that achieving glycemic control is just one small part of the needed improvement efforts. Uncontrolled hyperglycemia is common, potentially dangerous, and largely preventable with safe and proven methodsbut so are the iatrogenic hypoglycemia episodes, substandard education, poor communication, lack of care coordination, and inadequate monitoring that typify care of the hyperglycemic inpatient. We address all of these issues and urge the adoption of this broader perspective.
THE EVIDENCE IS INCOMPLETEBUT ACTION IS REQUIRED
We acknowledge gaps and inconsistencies in the literature surrounding inpatient diabetes management and the controversy around tight glycemic control. In many cases, high level evidence is not available to guide the formulation of protocols, order sets, or other improvement tools. We are all struck by how pervasive the lack of evidence is. What is the best metric for inpatient glycemic control or hypoglycemia? What is the best regimen for a patient on continuous tube feedings? Which insulin infusion protocol is superior in reaching and maintaining a glycemic target range?
Rather than make no recommendations or accept negative inertia on the basis of less than perfect evidence, we make recommendations based on the best evidence available. When we make recommendations based on consensus opinion or the collective experience from dozens of medical centers, rather than randomized trials, we have made every effort to make this clear in the text of the articles. In our view, incomplete evidence is not an adequate excuse to persist in the unacceptable status quo, clinging on to methods (such as sliding scale insulin regimens) that have been shown to be ineffective and potentially dangerous.1315
COLLABORATION PAYS DIVIDENDS
It takes a multidisciplinary approach to make substantial improvement in glycemic control of hospitalized patients. By the same token, it is unlikely that any one group can advance the national agenda for improved care as well as a multidisciplinary coordinated effort. Team members, especially the endocrinologists and hospitalists, collaborated skillfully throughout this effort. The hospitalists learned a tremendous amount from the expertise, insight, and mastery of the literature, offered by the endocrinology members, whereas the endocrinologists appreciated the front line expertise and practical quality improvement approach of the hospitalist members. This collaboration serves as a model for making guidelines and best practices become more of a practical reality for a variety of important clinical problems. Hospitalists can partner with and learn from a variety of other disciplines, while they assist these disciplines on effective improvement and implementation efforts. On a more personal note, this work has fostered mutual respect, friendship, and career long collaborative opportunities. The potential for these same opportunities with nursing, pharmacy, and all medical and surgical fields seems compelling and exciting.
THERE'S MORE!
By the time this is published, these articles will be integrated into the third iteration of the SHM Glycemic Control Resource Room. This online resource has already undergone 2 major revisions since its inception just a few years ago, reflecting SHM's dedication to the continuous improvement of the products and services that it offers. The Glycemic Control Implementation Guide and Resource Room will continue to be a work in progress. We highly encourage and welcome constructive criticism and feedback via E‐mail to
NEXT STEPS
More research and demonstration projects are obviously needed in this field. Local collaborative activities have sprung up in several cities and regions, as well as Glycemic Control Champions courses. A longitudinal mentoring program (similar to the SHM Venous Thromboembolism Prevention collaborative) would undoubtedly be beneficial, and may become available within the next year or so. These items and more will be promoted and posted in the resource room whenever possible.
Finally, the next step is up to you and the institutions in which you workyou have to decide, as individuals and institutions, if you believe the status quo is good enough. We believe that if you look, you'll find the care of our inpatients with diabetes and hyperglycemia disturbingly suboptimal, and hope that the work of the SHM Glycemic Control Task Force can help you rapidly improve on this state of affairs.
APPENDIX: GLYCEMIC CONTROL TASK FORCE
The Society of Hospital Medicine thanks all the members of the Glycemic Control Task Force, who encompass a distinguished panel of experts with representation from the AACE, ADA, ACP, and other organizations whose expertise was essential to the construction of the Glycemic Control Resource Room and the Implementation Guide for Glycemic Control and Prevention of Hypoglycemia.
Hospitalists
Representing the Society of Hospital Medicine
-
Gregory Maynard, MD. Lead Author and Editor of Glycemic Control Implementation Guide (web product); Glycemic Control Initiative Project Director; Clinical Professor of Medicine and Chief, Division of Hospital Medicine. University of California, San Diego (UCSD) Medical Center, San Diego, California.
-
David H. Wesorick, MD. Co‐editor of Glycemic Control Implementation Guide (web product); Clinical Assistant Professor of Internal Medicine, University of Michigan, Ann Arbor, Michigan.
-
Cheryl O'Malley, MD. Associate Program Director, Internal Medicine Faculty, Medicine/Pediatrics Banner, Good Samaritan Medical Center; Clinical Assistant Professor of Medicine, University of Arizona College of Medicine, Phoenix, Arizona.
-
Kevin Larsen, MD. Assistant Professor of Internal Medicine, University of Minnesota; Associate Program Director, Internal Medicine Residency, Hennepin County Medical Center, Minneapolis, Minnesota.
-
Jeffrey L. Schnipper, MD, MPH. Associate Physician, Brigham and Women's Hospital, Boston, Massachusetts
-
Alpesh Amin, MD, MBA, FACP. Executive Director and Vice Chair, University of California (UC) Irvine Hospitalist Program, Irvine, California.
-
Lakshmi Halasyamani, MD. Associate Chair, Department of Medicine, St. Joseph Mercy Medical Center, Ann Arbor, Michigan.
-
Mitchell J. Wilson, MD. Associate Professor of Medicine, University of North Carolina, Chapel Hill, North Carolina.
Representing the American College of Physicians
-
Doren Schneider, MD. Associate Program Director, Internal Medicine Residency Director, Ambulatory Service Unit, Abington Adult Medical Associates; Assistant Professor of Medicine, Temple University School of Medicine, Abington, Pennsylvania.
Endocrinologists
Representing the American Diabetes Association
-
Andrew J. Ahmann, MD. Associate Professor of Medicine, Director, Diabetes Center, Oregon Health & Science University, Portland, Oregon.
-
Michelle F. Magee, MD. Associate Professor of Medicine, Georgetown University School of Medicine Medstar Diabetes and Research Institutes, Washington Hospital Center, Washington, DC.
Representing the American Association of Clinical Endocrinologists
-
Richard Hellman, MD, FACP, FACE. Clinical Professor of Medicine, University of MissouriKansas City, North Kansas City, Missouri.
Endocringology Expert Panel
-
Susan Shapiro Braithwaite, MD, FACP, FACE. Clinical Professor of Medicine, University of North Carolina, Chapel Hill, North Carolina.
-
Mary Ann Emanuele, MD, FACP. Professor of Medicine, Endocrinology, Cell Biology, Neurobiology, and Anatomy Biochemistry, Loyola University Medical Center, Maywood, Illinois.
-
Irl B. Hirsch, MD. Professor of Medicine, University of Washington, Seattle, Washington.
-
Robert Rushakoff, MD. Clinical Professor of Medicine, Director, Diabetes Program, University of California, San Francisco (UCSF)/Mt. Zion, San Francisco, California.
-
Silvio E. Inzucchi, MD. Professor of Medicine, Clinical Director, Section of Endocrinology, Yale University School of Medicine, New Haven, Connecticut.
Education
-
Marcia D. Draheim, RN, CDE. Program Supervisor, Diabetes Center, St Luke's Hospital, Cedar Rapids, Iowa.
-
Sharon Mahowald, RN, CDE. Inpatient Diabetes Coordinator, Hennepin County Medical Center, Minneapolis, Minnesota.
Financial
-
Adam Beck, MHS, FABC. MedStar Research Institute, Washington, DC.
Pharmacists
-
Stuart T. Haines, PharmD, FASHP, FCCP, BCPS. Associate Professor/Vice Chair for Education, University of Maryland School of Pharmacy Baltimore, Maryland.
Representing the American Society of Consultant Pharmacists
-
Donald K. Zettervall, RPh, CDE, CDM. Owner/Director, The Diabetes Education Center, Old Saybrook, Connecticut.
Case Management
Representing the Case Management Society of America
-
Cheri Lattimer, RN, BSN. Executive Director, Case Management Society of America, Little Rock, Arkansas.
-
Nancy Skinner, RN, CCM. Director, Case Management Society of America Principle Consultant, Riverside HealthCare Consulting, Whitwell, Tennessee.
Dietetics
-
Carrie Swift, MS, RD, BC‐ADM. Dietetics Coordinator, Veterans Affairs Medical Center, Walla Walla, Washington.
SHM Staff Members
-
Geri Barnes and Joy Wittnebert.
Glycemic Control Resource Room Project Team
-
Greg Maynard, Jason Stein, David Wesorick, Mary Ann Emanuele, Kevin Larsen, Geri Barnes, Joy Wittnebert, and Bruce Hansen.
- Inpatient Diabetes and Glycemic Control: A Call to Action Conference. Position statement. AACE, February 2006. Available at: http://www.aace.com/meetings/consensus/IIDC/IDGC0207.pdf. Accessed October 2006. Garber et al. Endocr Pract.2006;12(suppl 3):3–13.
- Society of Hospital Medicine. Glycemic Control Resource Room. Available at: http://www.hospitalmedicine.org/ResourceRoomRedesign/GlycemicControl.cfm. Accessed May2008.
- Society of Hospital Medicine Glycemic Control Task Force. Implementation guide: improving glycemic control, preventing hypoglycemia, and optimizing care of the inpatient with hyperglycemia and diabetes. Published January 2007 on the Society of Hospital Medicine Website. Available at: http://www.hospitalmedicine.org. Accessed May2008.
- ,,,,,.The case for supporting inpatient glycemic control programs now: the evidence and beyond.J Hosp Med.2008;3(5 suppl 5)( ):S6–S16.
- ,,,,.Management of diabetes and hyperglycemia in the hospital: a practical guide to subcutaneous insulin use in the non‐critically ill adult patient.J Hosp Med.2008;3(5 suppl 5)( ):S17–S28.
- ,,,.Subcutaneous insulin order sets and protocols: effective design and implementation strategies.J Hosp Med.2008;3(5 suppl 5)( ):S29–S41.
- ,.Designing and implementing insulin infusion protocols and order sets.J Hosp Med.2008;3(5 suppl 5)( ):S42–S54.
- ,,,.Bridge over troubled waters: safe and effective transitions of the inpatient with hyperglycemia.J Hosp Med.2008;3(5 suppl 5)( ):S55–S65.
- ,,,,,.Society of Hospital Medicine glycemic control task force summary: practical recommendations for assessing the impact of glycemic control efforts.J Hosp Med.2008;3(suppl 5):S66–S75.
- ,.Practical strategies for developing the business case for hospital glycemic control teams.J Hosp Med.2008;3(suppl 5):S76–S83.
- ,,, et al.American College of Endocrinology position statement on inpatient diabetes and metabolic control.Endocr Pract.2004;10(1):77–82.
- Standards of medical care in diabetes‐‐2008.Diabetes Care.2008;31(suppl 1):S12–S54.
- ,,.Glycemic control and sliding scale insulin use in medical inpatients with diabetes mellitus.Arch Intern Med.1997;157(5):545–552.
- ,,, et al.Randomized study of basal‐bolus insulin therapy in the inpatient management of patients with type 2 diabetes (RABBIT 2 trial).Diabetes Care.2007;30(9):2181–2186.
- ,.Glycemic chaos (not glycemic control) still the rule for inpatient care: how do we stop the insanity?J Hosp Med.2006;1(3):141–144.
The articles on these pages represent the culmination of 3 years of effort by the Society of Hospital Medicine (SHM) Glycemic Control Task Force. In this brief introduction, we share a few insights and comments about this multidisciplinary collaborative effort to address the care of inpatients with hyperglycemia.
The SHM Glycemic Control Task Force was assembled in 2005, with the intent of improving the care of inpatients with diabetes. We wished to provide hospitalists and quality improvement teams with an understanding of the best practices to achieve safe glycemic control in the hospital. Additionally, this task force sought to identify tools and strategies to obtain improved communication, medication safety, education, and other aspects of care. A distinguished panel of experts attended their inaugural meeting in Chicago, Illinois, in October 2005, including hospitalists, endocrinologists, nurses, case managers, diabetes educators, and pharmacists. A roster of the individuals and organizations is given in the Appendix.
Many members of the SHM Glycemic Control Task Force also participated in the Call to Action consensus conference1 hosted by the American Association of Clinical Endocrinologists (AACE) and the American Diabetes Association (ADA) in January 2006. Both groups identified several barriers to improvement, and methods to overcome these barriers were summarized in this quote from the Consensus Conference,
Successful implementation of a program to improve glycemic control in the inpatient setting should include the following components:
-
An appropriate level of administrative support.
-
Formation of a multidisciplinary steering committee to drive the development of initiatives.
-
Assessment of current processes, quality of care, and barriers to practice change.
-
Development and implementation of interventions including standardized order sets, protocols, policies, and algorithms with associated educational programs.
-
Metrics for evaluation.
Both groups also called for a web‐based compendium of tested tools and strategies to assist local improvement teams.
After countless hours of development and revision by the SHM Glycemic Task Force and the Resource Room team, such a compendium addressing all of these components was launched on the SHM web site in the form of the SHM Glycemic Control Resource Room.2 A comprehensive implementation guide3 is available for downloading free of charge, and serves as the centerpiece of the Resource Room. Subsequently, this comprehensive but somewhat sprawling implementation guide evolved into these more sophisticated and concise articles.410 The topics include a review of the rationale for improving inpatient glycemic control,4 an important call for standardizing the metrics of glycemic control,9 subcutaneous insulin regimens and order sets,5, 6 insulin infusion protocols,7 transitions of care,8 and the business case for glycemic control.10 It has been a long but rewarding and educational journey, drawing on the collective experience from dozens of institutions in all kinds of inpatient care settings. A few key points and insights seem worth sharing.
THE IMPROVEMENT EFFORT IS NOT JUST ABOUT REACHING A GLYCEMIC TARGET
The term glycemic control team and the label for the SHM Glycemic Control Task Force itself are somewhat misnomers. Task Force members agree that desirable institutional glycemic target ranges should be established, but many among us believe the glycemic targets endorsed by national guidelines (ref ADA and AACE guidelines)11, 12 are too stringent. Furthermore, we believe that achieving glycemic control is just one small part of the needed improvement efforts. Uncontrolled hyperglycemia is common, potentially dangerous, and largely preventable with safe and proven methodsbut so are the iatrogenic hypoglycemia episodes, substandard education, poor communication, lack of care coordination, and inadequate monitoring that typify care of the hyperglycemic inpatient. We address all of these issues and urge the adoption of this broader perspective.
THE EVIDENCE IS INCOMPLETEBUT ACTION IS REQUIRED
We acknowledge gaps and inconsistencies in the literature surrounding inpatient diabetes management and the controversy around tight glycemic control. In many cases, high level evidence is not available to guide the formulation of protocols, order sets, or other improvement tools. We are all struck by how pervasive the lack of evidence is. What is the best metric for inpatient glycemic control or hypoglycemia? What is the best regimen for a patient on continuous tube feedings? Which insulin infusion protocol is superior in reaching and maintaining a glycemic target range?
Rather than make no recommendations or accept negative inertia on the basis of less than perfect evidence, we make recommendations based on the best evidence available. When we make recommendations based on consensus opinion or the collective experience from dozens of medical centers, rather than randomized trials, we have made every effort to make this clear in the text of the articles. In our view, incomplete evidence is not an adequate excuse to persist in the unacceptable status quo, clinging on to methods (such as sliding scale insulin regimens) that have been shown to be ineffective and potentially dangerous.1315
COLLABORATION PAYS DIVIDENDS
It takes a multidisciplinary approach to make substantial improvement in glycemic control of hospitalized patients. By the same token, it is unlikely that any one group can advance the national agenda for improved care as well as a multidisciplinary coordinated effort. Team members, especially the endocrinologists and hospitalists, collaborated skillfully throughout this effort. The hospitalists learned a tremendous amount from the expertise, insight, and mastery of the literature, offered by the endocrinology members, whereas the endocrinologists appreciated the front line expertise and practical quality improvement approach of the hospitalist members. This collaboration serves as a model for making guidelines and best practices become more of a practical reality for a variety of important clinical problems. Hospitalists can partner with and learn from a variety of other disciplines, while they assist these disciplines on effective improvement and implementation efforts. On a more personal note, this work has fostered mutual respect, friendship, and career long collaborative opportunities. The potential for these same opportunities with nursing, pharmacy, and all medical and surgical fields seems compelling and exciting.
THERE'S MORE!
By the time this is published, these articles will be integrated into the third iteration of the SHM Glycemic Control Resource Room. This online resource has already undergone 2 major revisions since its inception just a few years ago, reflecting SHM's dedication to the continuous improvement of the products and services that it offers. The Glycemic Control Implementation Guide and Resource Room will continue to be a work in progress. We highly encourage and welcome constructive criticism and feedback via E‐mail to
NEXT STEPS
More research and demonstration projects are obviously needed in this field. Local collaborative activities have sprung up in several cities and regions, as well as Glycemic Control Champions courses. A longitudinal mentoring program (similar to the SHM Venous Thromboembolism Prevention collaborative) would undoubtedly be beneficial, and may become available within the next year or so. These items and more will be promoted and posted in the resource room whenever possible.
Finally, the next step is up to you and the institutions in which you workyou have to decide, as individuals and institutions, if you believe the status quo is good enough. We believe that if you look, you'll find the care of our inpatients with diabetes and hyperglycemia disturbingly suboptimal, and hope that the work of the SHM Glycemic Control Task Force can help you rapidly improve on this state of affairs.
APPENDIX: GLYCEMIC CONTROL TASK FORCE
The Society of Hospital Medicine thanks all the members of the Glycemic Control Task Force, who encompass a distinguished panel of experts with representation from the AACE, ADA, ACP, and other organizations whose expertise was essential to the construction of the Glycemic Control Resource Room and the Implementation Guide for Glycemic Control and Prevention of Hypoglycemia.
Hospitalists
Representing the Society of Hospital Medicine
-
Gregory Maynard, MD. Lead Author and Editor of Glycemic Control Implementation Guide (web product); Glycemic Control Initiative Project Director; Clinical Professor of Medicine and Chief, Division of Hospital Medicine. University of California, San Diego (UCSD) Medical Center, San Diego, California.
-
David H. Wesorick, MD. Co‐editor of Glycemic Control Implementation Guide (web product); Clinical Assistant Professor of Internal Medicine, University of Michigan, Ann Arbor, Michigan.
-
Cheryl O'Malley, MD. Associate Program Director, Internal Medicine Faculty, Medicine/Pediatrics Banner, Good Samaritan Medical Center; Clinical Assistant Professor of Medicine, University of Arizona College of Medicine, Phoenix, Arizona.
-
Kevin Larsen, MD. Assistant Professor of Internal Medicine, University of Minnesota; Associate Program Director, Internal Medicine Residency, Hennepin County Medical Center, Minneapolis, Minnesota.
-
Jeffrey L. Schnipper, MD, MPH. Associate Physician, Brigham and Women's Hospital, Boston, Massachusetts
-
Alpesh Amin, MD, MBA, FACP. Executive Director and Vice Chair, University of California (UC) Irvine Hospitalist Program, Irvine, California.
-
Lakshmi Halasyamani, MD. Associate Chair, Department of Medicine, St. Joseph Mercy Medical Center, Ann Arbor, Michigan.
-
Mitchell J. Wilson, MD. Associate Professor of Medicine, University of North Carolina, Chapel Hill, North Carolina.
Representing the American College of Physicians
-
Doren Schneider, MD. Associate Program Director, Internal Medicine Residency Director, Ambulatory Service Unit, Abington Adult Medical Associates; Assistant Professor of Medicine, Temple University School of Medicine, Abington, Pennsylvania.
Endocrinologists
Representing the American Diabetes Association
-
Andrew J. Ahmann, MD. Associate Professor of Medicine, Director, Diabetes Center, Oregon Health & Science University, Portland, Oregon.
-
Michelle F. Magee, MD. Associate Professor of Medicine, Georgetown University School of Medicine Medstar Diabetes and Research Institutes, Washington Hospital Center, Washington, DC.
Representing the American Association of Clinical Endocrinologists
-
Richard Hellman, MD, FACP, FACE. Clinical Professor of Medicine, University of MissouriKansas City, North Kansas City, Missouri.
Endocringology Expert Panel
-
Susan Shapiro Braithwaite, MD, FACP, FACE. Clinical Professor of Medicine, University of North Carolina, Chapel Hill, North Carolina.
-
Mary Ann Emanuele, MD, FACP. Professor of Medicine, Endocrinology, Cell Biology, Neurobiology, and Anatomy Biochemistry, Loyola University Medical Center, Maywood, Illinois.
-
Irl B. Hirsch, MD. Professor of Medicine, University of Washington, Seattle, Washington.
-
Robert Rushakoff, MD. Clinical Professor of Medicine, Director, Diabetes Program, University of California, San Francisco (UCSF)/Mt. Zion, San Francisco, California.
-
Silvio E. Inzucchi, MD. Professor of Medicine, Clinical Director, Section of Endocrinology, Yale University School of Medicine, New Haven, Connecticut.
Education
-
Marcia D. Draheim, RN, CDE. Program Supervisor, Diabetes Center, St Luke's Hospital, Cedar Rapids, Iowa.
-
Sharon Mahowald, RN, CDE. Inpatient Diabetes Coordinator, Hennepin County Medical Center, Minneapolis, Minnesota.
Financial
-
Adam Beck, MHS, FABC. MedStar Research Institute, Washington, DC.
Pharmacists
-
Stuart T. Haines, PharmD, FASHP, FCCP, BCPS. Associate Professor/Vice Chair for Education, University of Maryland School of Pharmacy Baltimore, Maryland.
Representing the American Society of Consultant Pharmacists
-
Donald K. Zettervall, RPh, CDE, CDM. Owner/Director, The Diabetes Education Center, Old Saybrook, Connecticut.
Case Management
Representing the Case Management Society of America
-
Cheri Lattimer, RN, BSN. Executive Director, Case Management Society of America, Little Rock, Arkansas.
-
Nancy Skinner, RN, CCM. Director, Case Management Society of America Principle Consultant, Riverside HealthCare Consulting, Whitwell, Tennessee.
Dietetics
-
Carrie Swift, MS, RD, BC‐ADM. Dietetics Coordinator, Veterans Affairs Medical Center, Walla Walla, Washington.
SHM Staff Members
-
Geri Barnes and Joy Wittnebert.
Glycemic Control Resource Room Project Team
-
Greg Maynard, Jason Stein, David Wesorick, Mary Ann Emanuele, Kevin Larsen, Geri Barnes, Joy Wittnebert, and Bruce Hansen.
- Inpatient Diabetes and Glycemic Control: A Call to Action Conference. Position statement. AACE, February 2006. Available at: http://www.aace.com/meetings/consensus/IIDC/IDGC0207.pdf. Accessed October 2006. Garber et al. Endocr Pract.2006;12(suppl 3):3–13.
- Society of Hospital Medicine. Glycemic Control Resource Room. Available at: http://www.hospitalmedicine.org/ResourceRoomRedesign/GlycemicControl.cfm. Accessed May2008.
- Society of Hospital Medicine Glycemic Control Task Force. Implementation guide: improving glycemic control, preventing hypoglycemia, and optimizing care of the inpatient with hyperglycemia and diabetes. Published January 2007 on the Society of Hospital Medicine Website. Available at: http://www.hospitalmedicine.org. Accessed May2008.
- ,,,,,.The case for supporting inpatient glycemic control programs now: the evidence and beyond.J Hosp Med.2008;3(5 suppl 5)( ):S6–S16.
- ,,,,.Management of diabetes and hyperglycemia in the hospital: a practical guide to subcutaneous insulin use in the non‐critically ill adult patient.J Hosp Med.2008;3(5 suppl 5)( ):S17–S28.
- ,,,.Subcutaneous insulin order sets and protocols: effective design and implementation strategies.J Hosp Med.2008;3(5 suppl 5)( ):S29–S41.
- ,.Designing and implementing insulin infusion protocols and order sets.J Hosp Med.2008;3(5 suppl 5)( ):S42–S54.
- ,,,.Bridge over troubled waters: safe and effective transitions of the inpatient with hyperglycemia.J Hosp Med.2008;3(5 suppl 5)( ):S55–S65.
- ,,,,,.Society of Hospital Medicine glycemic control task force summary: practical recommendations for assessing the impact of glycemic control efforts.J Hosp Med.2008;3(suppl 5):S66–S75.
- ,.Practical strategies for developing the business case for hospital glycemic control teams.J Hosp Med.2008;3(suppl 5):S76–S83.
- ,,, et al.American College of Endocrinology position statement on inpatient diabetes and metabolic control.Endocr Pract.2004;10(1):77–82.
- Standards of medical care in diabetes‐‐2008.Diabetes Care.2008;31(suppl 1):S12–S54.
- ,,.Glycemic control and sliding scale insulin use in medical inpatients with diabetes mellitus.Arch Intern Med.1997;157(5):545–552.
- ,,, et al.Randomized study of basal‐bolus insulin therapy in the inpatient management of patients with type 2 diabetes (RABBIT 2 trial).Diabetes Care.2007;30(9):2181–2186.
- ,.Glycemic chaos (not glycemic control) still the rule for inpatient care: how do we stop the insanity?J Hosp Med.2006;1(3):141–144.
Management of Diabetes and Hyperglycemia
Recently, there has been a heightened interest in improving the quality and safety of the management of diabetes and hyperglycemia in the hospital.1 While observational data strongly suggests an association of hyperglycemia with morbidity and mortality in adults on general medicine and surgery units, clinical research has not yet defined the best practices for managing hyperglycemia in the hospital outside the intensive care unit (ICU). As a result, many physicians do not have a well‐formulated approach to managing hyperglycemia in the noncritically ill hospital patient, and the use of insulin therapy to attain targeted blood glucose (BG) control is often subject to practice variability, leading to suboptimal glycemic outcomes.
Practical guidelines for the management of this common clinical problem have been formulated by experts in the field, based on understanding of the physiology of glucose and insulin dynamics, the characteristics of currently available insulin preparations, and clinical experience. In 2004, in Clement et al.,2 the American Diabetes Association published a technical review promoting the use of physiologic (basal‐nutritional‐correction dose) insulin regimens in the hospital to achieve targeted glycemic outcomes. This approach has been disseminated via review articles,3 and more recently, a randomized, controlled trial demonstrated that hospitalized type 2 diabetes patients experienced better glycemic control when treated with a physiologic insulin regimen than when treated with sliding‐scale insulin alone.4 The Society of Hospital Medicine has assembled a Glycemic Control Task Force, which is charged with providing physicians and hospitals with practical tools to improve the safety and efficacy of diabetes management in the hospital. One product of this work is an educational module that serves as a tutorial on the best practice for the management of diabetes and hyperglycemia in the noncritically ill hospital patient.5 This article is based on that module, and provides a practical summary of the key concepts that will allow clinicians to confidently employ physiologic insulin regimens when caring for their hospital patients.
Case: Ms. X is a 56‐year‐old obese woman with type 2 diabetes mellitus who is admitted for treatment of an infected diabetes‐related foot ulcer. The patient will be allowed to eat dinner in a couple of hours, but the surgeons have requested that she be kept nothing by mouth (NPO) after midnight for surgical debridement in the morning. Her current weight is 100 kg, and her recent glycemic control can be summarized as having BG values that are usually in the mid‐200s (mg/dL) and a recent glycosylated hemoglobin (HbA1C) measurement of 10.9%. Her home medical regimen includes glipizide 10 mg daily, metformin 1000 mg twice daily, and 20 units of neutral protamine hagadorn (NPH) insulin at bedtime. Her blood glucose in the Emergency Department is 289 mg/dL. How should this patient's blood glucose be managed in the hospital?
PHARMACOLOGIC CONTROL OF BG IN THE HOSPITAL: INSULIN IS THE ANTIHYPERGLYCEMIC AGENT OF CHOICE
Although oral antihyperglycemic agents are frequently used in the outpatient setting, there are many potential disadvantages to using these medications in acutely ill hospital patients, as shown in Figure 1.2, 3 Oral antihyperglycemic agents, in general, are difficult to quickly titrate to effect, and have side effects that can limit their use in the hospital. Metformin can lead to lactic acidosis when it is used in clinical situations that predispose to lactate production (eg, renal failure, circulatory failure, hypoxemia). Therefore, metformin should be held in patients who have, or are at risk for, these conditions, each of which may be encountered in the hospital. Also, agents that stimulate the release of insulin, such as sulfonylureas, should be held in patients with variable nutritional intake, to prevent hypoglycemia. In contrast, insulin acts rapidly, responds in a timely fashion to dose titrations, and can be used effectively in virtually all patients and clinical situations to control BG levels. This makes insulin the treatment of choice for hyperglycemia in the hospital. Insulin can be administered via subcutaneous doses or as an intravenous infusion for cases in which rapid titration is the goal. Intravenous insulin infusions are the preferred mode of insulin delivery in the ICU setting, and may be appropriate for some noncritically ill patients in hospitals that have developed systems to safely provide them on general wards. Subcutaneous insulin is most commonly used in the noncritically ill patient population and is the focus of this article.
Although insulin is the drug of choice for managing hyperglycemia in the hospital, there are some situations when it is appropriate to continue oral antihyperglycemic medications in the hospital. These agents may be continued in hospitalized patients who are clinically stable, and who have normal nutritional intake, normal BG levels, and stable renal and cardiac function. They may also be started or resumed in the hospital if they are to be included in the discharge medication regimen once the patient is clinically stable and if it has been assured that contraindications to their use no longer exist.
Ms. X should be treated with a more robust (physiologic) insulin regimen. This statement would be true, even if she were not an inpatient with a foot infection. Her glycemic control is currently poor, as evidenced by her high HbA1C and her elevated admission BG, and is unlikely to be appreciably improved with the addition of any pharmacologic agent other than insulin. The glipizide should be held, as the patient will be NPO after midnight. Most experts would recommend holding the metformin at this time as well, since the patient will be undergoing a surgical procedure in the morning that places her at risk for predisposing factors to lactic acidosis.
INPATIENT GLYCEMIC TARGETS
At present, recommended glycemic targets for noncritically ill hospital patients are based entirely on expert opinion, as there have been no clinical studies directly comparing different glycemic targets in this patient population. However, the American College of Endocrinology, the American Association of Clinical Endocrinologists, and the American Diabetes Association do provide recommendations about glycemic targets for inpatients (Table 1).6, 7 Although controversial, these recommendations make it clear that uncontrolled hyperglycemia is no longer the accepted standard of care for hospitalized patients, and illustrate the consensus of expert opinion on the subject. Of note, many hospitals are adopting glycemic targets that are less stringent than those shown in Table 1, recognizing the challenges of controlling BG levels in hospitalized patients, and the potential risk for hypoglycemia when lower BG targets are used. Each hospital's glycemic control champions must reach consensus on a target BG range for their institution. In practice this range has been 90110 mg/dL for the lower BG limit and 140180 mg/dL for the upper BG limit. It is also important to note that the recommendations from professional organizations emphasize the need to individualize BG targets, based on the clinical circumstances of each patient.
| Organization | ICU(mg/dL) | Non‐ICU, Preprandial (mg/dL)* | Non‐ICU, Maximum(mg/dL)* |
|---|---|---|---|
| |||
| ACCE/ACE | 110 | 110 | 180 |
| ADA | 110 | 90‐130 | 180 |
Ms. X is exhibiting glycemic values far outside of the recommended upper limit of 180 mg/dL, and treatment with insulin monotherapy is the most appropriate strategy in this case.
PHYSIOLOGIC (BASAL‐BOLUS, PLUS CORRECTION DOSE) INSULIN
The management of hyperglycemia and diabetes in the inpatient setting is challenging due to the many changes that patients experience in the hospital. Hospitalized patients often experience changes in their nutritional intake and their medication regimen. In addition, hospitalized patients usually experience the stress of acute illness and are treated with medications that might impact glycemic control. Figure 2 lists some of the barriers to achieving glycemic control in hospitalized patients. The inpatient insulin program needs to be flexible enough to allow for maintenance of glycemic control in the face of tumultuous circumstances. This can best be accomplished by the use of a physiologic insulin program. This means using exogenous insulin to mimic normal physiologic insulin activity by providing the correct types and doses of insulin at the correct times.
A physiologic insulin regimen can be conceptualized as having 3 separate components: basal insulin, nutritional (or prandial/meal) insulin, and correction dose (or supplemental) insulin.2 A patient's total daily dose (TDD) of insulin is the sum of all of these, and represents the amount of insulin that a patient requires over the course of 1 day while receiving adequate nutrition. Basal insulin is the insulin normally released continuously by the pancreas, even when fasting. This serves to suppress glucose and ketone production. When nutrition is ingested, there is a surge in the level of glucose in the blood, and this surge is accompanied by rapid secretion of additional insulin to allow for the appropriate utilization of the glucose. The insulin that is secreted in response to nutritional intake is referred to as nutritional insulin. About one‐half of the total daily insulin secreted by a healthy normal human serves a basal function, and about one‐half is secreted in response to nutritional intake.8 Understanding this bit of physiology (the 50/50 rule) is very helpful for creating flexible regimens using exogenous insulin. Although the 50/50 rule is useful in many circumstances, there are some notable exceptions. In some cases, basal insulin might be expected to be less than one‐half of the TDD (eg, enteral feeds, as discussed below). Additional correction dose insulin is given to correct hyperglycemia that occurs despite scheduled doses of basal and nutritional insulin.
It is an important practical consideration to note that when a person with diabetes is acutely ill or stressed, as is commonly the case in the hospital setting, total daily insulin requirements increase. This is due to the action of insulin counterregulatory hormones such as catecholamines, cortisol, growth hormone, and glucagon. The hospitalized patient is therefore likely to require a TDD that is higher than that required when well. This is particularly true for the basal insulin dose. Conversely, insulin requirements will decrease as a patient recovers from acute illness, and it may be necessary to lower insulin doses as BG levels decrease during convalescence.
Exogenous basal insulin is provided as a long‐acting or intermediate‐acting, low‐peaking or nonpeaking insulin (eg, glargine or detemir), that allows for a consistent level of basal insulin (Figure 3). This insulin is provided even when the person is not receiving any nutrition. Although twice daily NPH insulin can be used to provide basal insulin, the peak (as shown in Figure 3) is likely to exceed the level of insulin that is truly required for basal needs, which can result in hypoglycemia. In theory, NPH insulin would be less physiologic than glargine or detemir, although no studies have compared these insulins in the hospital setting. When using NPH insulin as a basal insulin in a patient who is designated NPO, the dose should be reduced by one‐third to one‐half to avoid hypoglycemia that may occur when it peaks.2
Exogenous nutritional insulin must be provided in a way that matches the nutrition that is being provided to the patient. For example, a patient who is receiving nutritional boluses (ie, meals or bolus tube feeds) can be given rapid‐acting insulin (eg, aspart, glulisine, lispro) along with each nutritional bolus to cover the glycemic peak that is caused by the meal. The rapid‐acting analog insulins can also be given at the end of a meal or bolus tube feed for cases in which it is not clear if the nutrition will be well tolerated. A reduction in the insulin dose proportionate to the amount of nutrition actually taken can then be made to decrease the risk of subsequent hypoglycemia. Regular insulin can also be given in anticipation of a meal or tube feed, but its later peak (as shown in Figure 3) requires that it be given 30 minutes before a meal is ingested, the timing of which is a challenge on most nursing units. Patients who are not receiving any nutrition should not receive nutritional insulin. And, patients receiving alternative forms of nutrition will require different nutritional insulin regimens to adequately cover their nutritional glycemic loads, as discussed below.
The separate provision of basal and nutritional insulin results in a highly‐flexible insulin program that can provide basal insulin to patients even when they are not receiving significant nutrition, and can be easily adjusted to provide appropriate nutritional insulin to match actual nutritional delivery.
Correction‐dose insulin is the small amount of insulin that is given to patients, in addition to basal and nutritional insulin, to correct hyperglycemia. Correction‐dose insulin is usually provided as rapid‐acting or regular insulin (usually the same type as the nutritional insulin), and is given in a dose that is specifically designed to reduce the patient's BG back into the target range. It is usually given at the same time as the nutritional insulin in patients who are receiving nutrition (or every 4 to 6 hours in patients who are not). Correction‐dose insulin is often written in a stepped format, to provide the appropriate amount of insulin for a given BG value. It differs from the traditional sliding‐scale in that it is not used alone (but rather as 1 component of a physiologic program), and in that it is customized to match the insulin sensitivity for each patient. Most standardized order sets for subcutaneous insulin provide several different correction‐dose scales to choose from, depending on the patient's weight or total daily insulin requirement.
If correction‐dose insulin is required consistently, or in high doses, it suggests a need to modify the basal and/or nutritional insulin. A proportion of the total number of units of correction‐dose insulin given in the preceding 24 hours can be distributed into basal and nutritional insulin doses for the next day if there is ongoing need for significant correction‐doses of insulin. A well‐designed, physiologic insulin regimen should provide targeted glycemic control, without a need for constantly adding large correctional boluses.
Some insulins do not fit neatly into either basal or nutritional insulin categories. For example, mixed insulins (eg, 70/30, rapid‐analog/NPH mixtures) combine basal and nutritional insulins to form either a double‐peaking insulin or an intermediate‐peaking insulin. The use of this type of insulin makes it impossible to manipulate the basal and nutritional components separately to enable attainment of BG targets. Therefore, the role of this type of insulin is limited in the hospital setting. Mixed insulins may, however, be started once the patient is clinically stable if they will be part of the discharge regimen.
Diabetes and hyperglycemia in the hospitalized patient require active management, and there are no autopilot insulin regimens. The use of sliding scale insulin alone to manage hyperglycemia is a common practice in hospitals.9 However, this is an historic practice that is based on the erroneous idea that BG can be managed with a reactive strategy. When sliding‐scale insulin is used as the sole modality of insulin therapy, insulin is provided only after metabolic control has been lost, and usually does not provide an appropriate dose of insulin, considering basal, nutritional, and correctional needs. The end result is poor glycemic control.9, 10 A recent randomized, controlled trial demonstrated that a physiologic insulin regimen is indeed superior to a standardized insulin sliding‐scale for managing inpatient hyperglycemia.4
Ms. X should be given an insulin regimen that includes basal, nutritional, and correctional components. The provision of separate basal and nutritional insulin will allow the clinicians to provide the patient with basal insulin even when her nutritional insulin is held, and to easily modify her nutritional insulin, depending on her nutritional intake.
PHYSIOLOGIC INSULIN: A PRACTICAL APPROACH
The use of physiologic insulin in the hospital can be facilitated by considering a stepwise approach (Figure 4).5 The first step is to estimate the amount of insulin that the patient will require over the course of a day if taking adequate nutrition (this is the TDD). If the patient has been treated with subcutaneous insulin before being admitted to the hospital, the clinician can use the outpatient TDD to gauge the insulin needs. To do this, the clinician simply adds up the total number of units of insulin that a patient takes at home in a day. Using this method to estimate the patient's TDD can be very helpful, even if the clinician plans to use different types of insulin while the patient is hospitalized. When using this approach, one should consider the patient's prior metabolic control on the existing regimen (ie, if the patient's glycemic control was poor on the preexisting regimen, an increase in the TDD would be necessary). In addition, clinicians should recognize that insulin requirements usually increase when patients are acutely ill, as discussed above. Managing diabetes and hyperglycemia in the hospital is very different than doing so in the outpatient arena, and hospitalists should not feel bound by the outpatient regimen.
In addition, a weight‐based estimation of the TDD can be very helpful in determining a starting dose of insulin in a hospitalized patient (see Figure 5). An estimate of 0.4 units/kg of body weight provides a conservative starting point for the TDD for most patients. Occasionally, a lower starting dose of 0.3 units/kg of body weight might be safer for those patients who are likely to be very sensitive to insulin, or who are otherwise at increased at risk for hypoglycemia (see Figure 5). Patients who are overweight or obese often require considerably higher TDDs in the range of 0.5‐0.6 (or even more) units/kg of body weight. Some may require over 1 unit/kg of body weight for their TDD. Therefore, the doses provided by these calculations represent conservative estimates in most patients. Hospitalists should be able to confidently make these dose estimates and avoid dependence on nonphysiologic regimens such as sliding‐scale insulin alone.
The presence of risk factors for hypoglycemia or hyperglycemia should temper the dose calculations. Clinical conditions associated with hyperglycemia include obesity, certain medications (eg, glucocorticoids, catecholamines, tacrolimus, cyclosporine), and changes in nutritional intake (Figure 2). Clinical conditions associated with hypoglycemia are summarized in Figure 6. It is important to recognize that these calculations are intended to give the clinician a safe and rational starting point for insulin dosing. More important than the calculations is the careful monitoring of BG levels and timely modifications of the insulin regimen that follow.
The second step in developing a physiologic insulin regimen is to determine the patient's nutritional regimen. The third step, then, is to decide how the TDD will be distributed into basal and nutritional insulins, and which insulin will be used for each. As noted above, for most patients, approximately one‐half of the TDD will be provided as basal insulin, and the other one‐half given as nutritional insulin. When patients are receiving nutrition, the insulin must be given in a way that matches the timing of nutrition delivery (eg, with each meal or bolus tube feeding), and provides appropriate insulin coverage for the nutrition that is being provided.
Nutritional insulin will not be given if the patient is not receiving any nutrition, in which case basal insulin and correction‐dose insulin will usually be continued. Table 2 shows the preferred insulin regimens for a variety of different nutritional circumstances, as put forth by the Society of Hospital Medicine (SHM) Glycemic Control Task Force.5
| Nutritional Situation | Necessary Insulin Components | Preferred Regimen* |
|---|---|---|
| ||
| NPO (or clear liquids) | Basal insulin: 50% of TDD. Nutritional insulin: None. | Basal insulin: glargine given once daily or detemir given twice daily. Nutritional insulin: None. Correctional insulin: Regular insulin q 6 hours or RAA insulin q 4 hours. Other comments: Dextrose infusion (eg, D5 containing solution at 75‐150 cc/hour) recommended when nutrition is held. An IV insulin infusion is preferred for management of prolonged fasts or fasting type 1 diabetes patients. |
| Eating meals | Basal insulin: 50% of TDD. Nutritional insulin: 50% of TDD, divided equally before each meal. | Basal insulin: glargine given once daily or detemir given twice daily. Nutritional insulin: RAA insulin with meals. Correctional insulin: RAA insulin q AC and HS (reduced dose at HS). |
| Bolus tube feeds | Basal insulin: 40% of TDD. Nutritional insulin: 60% of the TDD, divided equally before each bolus feed. | Basal insulin: glargine given once daily or detemir given twice daily. Nutritional insulin: RAA insulin with each bolus. Correctional insulin: RAA insulin with each bolus. |
| Continuous tube feeds | Basal insulin: 40% (conservative) of TDD. Nutritional insulin: 60% of the TDD in divided doses. | Basal insulin: glargine given once daily or detemir given twice daily. Nutritional insulin: RAA insulin q 4 hours or regular insulin q 6 hours. Correctional insulin: Should match nutritional insulin choice. |
| Parenteral nutrition | Insulin is usually given parenterally, with the nutrition | Initially, a separate insulin drip allows for accurate dose‐finding. Then, 80% of amount determined as TDD using drip is added to subsequent TPN bags as regular insulin. Use correctional subcutaneous insulin doses cautiously, in addition |
For Ms. X, the first step is to determine a TDD estimate. This patient weighs 100 kg, and is obese. Therefore, a TDD of 0.5 units/kg (50 units) is appropriate. This dose may be an underestimate of her insulin needs, but it is a conservative, reasonable starting point. The patient's basal insulin could be provided by giving one‐half of the TDD as basal insulin, such as glargine, 25 units daily. In this case, the patient will be eating dinner soon, but then will be NPO after midnight for surgery. Appropriate nutritional insulin could be provided by giving one‐third of her total nutritional insulin before this meal as a rapid‐acting insulin analog (25 units nutritional insulin per day divided by 3 meals results in a dose of 8 units per meal). After she eats dinner, additional nutritional insulin will not be given until she resumes her diet postoperatively. While NPO, her basal insulin should be continued, and her blood glucose should be checked every 4‐6 hours. An appropriate correction‐dose insulin scale should be chosen to provide a supplemental insulin dose with each bedside test of the blood glucose level, if and only if, hyperglycemia is present.
Case continued: The patient is given 8 units of lispro insulin before her dinner, and is also given a dose of 25 units of glargine insulin. She is held NPO after midnight and dextrose‐containing fluid is provided intravenously overnight at a maintenance rate. In the morning her blood glucose is 161 mg/dL before surgery. Surgery goes well, and at lunch her blood glucose is 179 mg/dL, and she is given a food tray. However, the patient says that she feels mildly nauseated, and is not sure that she will be able to eat her lunch. How should her nutritional insulin be managed in this situation?
MATCHING NUTRITION AND NUTRITIONAL INSULIN: A DIFFICULT CHALLENGE
It is the provision of the correct type and amount of nutritional insulin at the right time that is most challenging in the hospital. In the hospital, a patient's nutritional intake is often interrupted. Patients might be made NPO as part of the treatment plan, or may not be able to take nutrition by mouth because of specific medical conditions. In some cases, enteral or parenteral feeding is used to replace or enhance oral feeding. Even when alternate routes of nutrition are employed, sudden interruptions in nutrition still remain common (eg, the feeding tube falls out). Ultimately, to provide the best possible care to a diabetes patient, the nutritional insulin that is delivered must match the actual nutritional delivery (Table 2). Ideally, each institution should choose a preferred, standardized approach for each nutritional situation.
Even if institutions standardize their approach to nutritional insulin delivery in general, clinicians must be able to accurately respond to the unplanned variations in nutrition that occur in the hospital. One example of this is the patient who is expected to eat meals, but who becomes suddenly unable to do so, such as in the case above. In cases like this, the best approach is to hold the patient's nutritional insulin and allow the patient to attempt to eat the provided meal. Then, a rapid‐acting insulin analog can be given just after the meal, in proportion to the amount of the meal that was eaten. If the patient really is unable to tolerate any of the meal, then no nutritional insulin is provided. If the patient does tolerate a portion of the meal (eg, 50% of the meal is consumed), then a corresponding amount of insulin is given (eg, 50% of the scheduled nutritional insulin is given). The quick onset of the rapid‐acting insulin analogs allows near‐physiologic effect, even when they are given after the meal.
Ms. X should be allowed to eat as much of the meal as she can tolerate. Afterward, her intake can be assessed, and insulin can be provided in proportion to the amount of the meal that was eaten, as described above.
Bolus Tube Feeds
Patients who are given bolus enteral feeds are typically treated like patients who are eating meals. Like meals, bolus tube feeds are nutritional boluses that should be covered with nutritional insulin boluses. Because the hyperglycemia that sometimes accompanies bolus tube feeds is partly related to the glycemic load of this type of feedings, it is reasonable to provide 60% of the TDD of insulin as nutritional insulin when using this type of nutrition.
Continuous Tube Feeds
Patients who are given continuous enteral nutrition are somewhat different than patients who are eating meals. Continuous tube feed patients receive nutrition on a continuous basis. Therefore, these patients must also receive nutritional insulin in a way that provides continuous coverage. There is no proven superior insulin regimen for the continuously tube fed patient. Because the nutrition is being provided continuously, providing all of the TDD of insulin as a long‐acting, nonpeaking insulin might be considered the most physiologic regimen. However, if such a strategy is used and the tube feeding is interrupted for some reason, the patient will be in danger of hypoglycemia for the duration of action of the basal insulin. For this reason, the SHM Glycemic Control Task Force and many endocrinologists recommend using a long‐acting basal insulin at a dose that would provide a conservative estimate of the basal component (eg, 40% or less of the TDD), and dividing the remainder of the insulin and giving it as scheduled regular (every 6 hours) or rapid‐acting insulin (every 4 hours) for the nutritional coverage.
If tube feeds are interrupted, an infusion of 10% dextrose given intravenously at the same rate as the tube feed had been running (or the equivalent) can be provided to avoid hypoglycemia until the effect of the nutritional insulin has dissipated. It is reasonable to create a standing order to notify the physician, or start an alternate source of dextrose, in the case of tube feed interruption.
Parenteral Nutrition
For patients receiving parenteral nutrition, regular insulin, mixed with the parenteral nutrition, is safe and effective. Subcutaneous correction‐dose insulin is often used, in addition to the insulin that is mixed with the nutrition. When starting parenteral nutrition, the initial use of a separate insulin infusion can help in estimating the TDD of insulin that will be required.
TYPE 1 DIABETES
Because type 2 diabetes is more prevalent than type 1 diabetes, hospitalists will manage this form of diabetes most often. However, it is crucial that hospitalists are also able to manage type 1 diabetes in the hospital. For the most part, the principles presented in this article apply to all types of diabetes patients. This section outlines some special considerations to remember when caring for type 1 diabetes patients in the hospital that will assure prevention of diabetic ketoacidosis in patients with type 1 diabetes.
Type 1 diabetes patients completely lack endogenous insulin production. Therefore, these patients require exogenous insulin to be provided at all times. Type 1 diabetes patients need to be provided continuous, exogenous basal insulin, even when fasting, to suppress gluconeogenesis and ketone production. Failure to provide basal insulin to a type 1 diabetes patient can lead to the rapid development (in hours) of ketoacidosis. When receiving nutrition, the patient with type 1 diabetes must also be provided with nutritional insulin to control postprandial BGs. Whereas many type 2 diabetes patients may produce sufficient endogenous insulin to meet basal requirements when fasting (ie, they produce enough basal insulin to maintain metabolic stability when they are not taking in nutrition), this is never the case for type 1 diabetes patients.
In addition, type 1 diabetes patients typically exhibit less insulin resistance than type 2 diabetes patients, especially if they are not obese. Therefore, type 1 diabetes patients often have TDDs of insulin that are lower than those of type 2 patients. This is reflected in the recommendations in Figure 5, with the TDD of insulin estimate for a lean type 1 diabetes patient of 0.3 units/kg/day.
CONTINUOUS SUBCUTANEOUS INSULIN INFUSIONS (INSULIN PUMPS) IN THE HOSPITAL
Continuous subcutaneous insulin infusion therapy (CSII), often referred to as insulin pump therapy, involves the use of a pump to provide a continuous flow of subcutaneous basal insulin (usually a rapid‐acting analog) through a needle that is left in place. This basal rate is adjustable, and therefore can be customized to meet variable needs over a 24‐hour period. When the patient takes in nutrition, a bolus of the same insulin is given, via the pump, at a dose that is appropriate to cover the nutritional intake. The advantages of CSII therapy are the capacity for precision and flexibility of the basal insulin delivery (compared to the use of a once‐daily or twice‐daily dose of long‐acting insulin analog), and the lack of a need to inject insulin boluses (which are delivered via the pump). This type of therapy is preferred by some diabetes patients, and although it is not highly prevalent in most areas, it is common enough that hospitalists must have a plan for managing it in their practices.
There are many barriers to the use of CSII in the hospital. Most of these barriers are related to the need for constant management of the pump. Most hospitalists and nurses do not have the expertise to manage this therapy in the hospital. Although the patient (or caregiver) might have the expertise to manage the pump, this is an acceptable option only if the patient is competent to manage the pump. Patient competence to use the pump must be formally assessed and documented, and the patient must agree to perform the many components of care related to managing the pump (eg, documenting the basal rate and boluses given, documenting BGs, providing tubing and other supplies).
Many hospitals currently choose a policy of converting insulin pump therapy to standard subcutaneous insulin treatment for most hospitalized patients. Usually the conversion of CSII to a physiologic subcutaneous insulin regimen (as detailed in this article) is fairly straightforwardthe basal insulin will be given as long‐acting, low‐peaking insulin, and nutritional and correction‐dose insulin can then be added as a rapid‐acting analog, in accord with the patient's needs.
Hospitals that admit a large number of insulin pump patients, or those that choose to use pumps routinely in the hospital, should create a formal policy for pump use.11 It has been suggested that the policy should assure that there is formal assessment of the patient's competence to manage the pump, that there is professional oversight of the pump management (usually via endocrinology and diabetes educator consultation), that contraindications for CSII use are clearly stated, and that there is a formal mechanism for engaging the patient and informing him of his roles and responsibilities (eg, a written agreement). The clinician must write insulin orders in the medical record that specify the basal and bolus insulin doses which are being used. Pump use may be limited to floors where nurses receive at least basic education in the principles of CSII pumps.
CARE TRANSITIONS IN THE HOSPITAL
Transitioning from an Intravenous Insulin Infusion to a Subcutaneous Insulin Regimen
In the hospital, it is often necessary to switch a patient from an intravenous (IV) insulin infusion to a subcutaneous (SC) insulin regimen. When doing this, the clinician must decide how much SC insulin the patient will require. As discussed earlier, the TDD may be estimated based on home insulin doses or the patient's weight. However, for a patient who is treated with an IV insulin infusion, current insulin requirements can be estimated based on the recent IV drip rate. This is the preferred method for identifying a TDD in these patients, as the insulin delivery rate at the time of drip discontinuation provides a way of determining current insulin requirements.
Regardless of the dose of SC insulin that is chosen, it is important that SC insulin be delivered well in advance of the discontinuation of the IV insulin. Because the duration of action of IV insulin is on the order of 7 minutes, the patient may become rapidly hyperglycemic or develop ketoacidosis (in type 1 diabetes) in a matter of hours if the IV insulin infusion is discontinued before the SC insulin is active. Insulin infusion should not be stopped for at least 1 hour after the SC delivery of rapid‐acting or regular insulin, and at least 2‐3 hours after the SC delivery of intermediate‐acting or long‐acting insulin.2
Discharge Transition
The hospital discharge is another challenging transition for the patient with diabetes. While hospitalized, a diabetes patient's medication regimen will likely be altered to maintain metabolic control. At the time of discharge, the patient should be provided with an appropriate medication regimen. Moreover, the patient must be educated about any new medication or other changes that will be part of the new outpatient management routine. It is also important to assure that the patient does not have knowledge deficits related to diabetes survival skills. The Joint Commission has recently put forth the expectation that such education will be provided prior to hospital discharge.12 Areas outlined for this core diabetes self‐management education include: the definition of diabetes; finger‐stick BG monitoring; glycemic targets; insulin self‐administration; hypoglycemia prevention, recognition, and treatment; hyperglycemia recognition; sick day guidelines; and when to call a clinician for help. Communication of the discharge diabetes management plan to the patient's primary care provider should also be undertaken.
Please see the article entitled Bridge Over Troubled Waters: Safe and Effective Transitions for the Inpatient with Hyperglycemia in this supplement for additional details about both the IV to SC transition and the discharge transition.
CONCLUSIONS
Understanding the basic principles of the physiologic (basal, nutritional, and correction‐dose) insulin regimen will allow clinicians to formulate safe and effective insulin regimens in virtually any clinical situation. Simple steps can allow safe estimates of initial doses and titration toward glycemic goals. Additional information and case studies can be found in a Society of Hospital Medicine Task Force Educational Module,5 available online.
Additional resources for improving glycemic control in hospital patients are available online at the Glycemic Control Resource Room (
- ACE/ADA Task Force on Inpatient Diabetes.American College of Endocrinology and American Diabetes Association Consensus Statement on Inpatient Diabetes and Glycemic Control: A call to action.Diabetes Care.2006:29:1955–1962.
- ,,, et al.Management of diabetes and hyperglycemia in hospitals.Diabetes Care.2004;27:553–591.
- .Management of hyperglycemia in the hospital setting.N Engl J Med.2006;355:1903–1911.
- ,,, et al.Randomized study of basal‐bolus insulin therapy in the inpatient management of patients with type 2 diabetes (Rabbit 2 trial).Diabetes Care.2007;30:2181–2186.
- ,; for the Society of Hospital Medicine Glycemic Control Task Force. Educational module: management of diabetes and hyperglycemia in the hospital patient: focus on subcutaneous insulin use in the non‐critically ill, adult patient. Published January 2007 on the Society of Hospital Medicine Website. Available at:http://www.hospitalmedicine.org/ResourceRoomRedesign/html/11Ed_Resources/01_Teaching_Slide.cfm. Accessed August2008.
- American College of Endocrinology Task Force on Inpatient Diabetes and Metabolic Control.American College of Endocrinology Position Statement on Inpatient Diabetes and Metabolic Control.Endocr Pract.2004;10:77–82.
- American Diabetes Association.Standards of Medical Care in Diabetes, 2006.Diabetes Care.2006;29(supp 1):s4–s42.
- Larsen PR,Kronenberg HM,Melmed S,Polonsky KS, editors.Williams Textbook of Endocrinology.10th ed.Philadelphia, PA:Elsevier Science;2003.
- ,,,,.Inpatient management of diabetes and hyperglycemia among general medicine patients at a large teaching hospital.J Hosp Med.2006;1:145–150.
- ,,.Glycemic control and sliding scale use in medical inpatients with diabetes mellitus.Arch Intern Med.1997;157:545–552.
- ,,, et al.Use of continuous subcutaneous insulin infusion therapy in the hospital setting: Proposed guidelines and outcome measures.Diabetes Educ.2005;31:849–857.
- Inpatient Diabetes Certification. Joint Commission. Available at:http://www.jointcommission.org/CertificationPrograms/Inpatient+Diabetes. Accessed April2008.
Recently, there has been a heightened interest in improving the quality and safety of the management of diabetes and hyperglycemia in the hospital.1 While observational data strongly suggests an association of hyperglycemia with morbidity and mortality in adults on general medicine and surgery units, clinical research has not yet defined the best practices for managing hyperglycemia in the hospital outside the intensive care unit (ICU). As a result, many physicians do not have a well‐formulated approach to managing hyperglycemia in the noncritically ill hospital patient, and the use of insulin therapy to attain targeted blood glucose (BG) control is often subject to practice variability, leading to suboptimal glycemic outcomes.
Practical guidelines for the management of this common clinical problem have been formulated by experts in the field, based on understanding of the physiology of glucose and insulin dynamics, the characteristics of currently available insulin preparations, and clinical experience. In 2004, in Clement et al.,2 the American Diabetes Association published a technical review promoting the use of physiologic (basal‐nutritional‐correction dose) insulin regimens in the hospital to achieve targeted glycemic outcomes. This approach has been disseminated via review articles,3 and more recently, a randomized, controlled trial demonstrated that hospitalized type 2 diabetes patients experienced better glycemic control when treated with a physiologic insulin regimen than when treated with sliding‐scale insulin alone.4 The Society of Hospital Medicine has assembled a Glycemic Control Task Force, which is charged with providing physicians and hospitals with practical tools to improve the safety and efficacy of diabetes management in the hospital. One product of this work is an educational module that serves as a tutorial on the best practice for the management of diabetes and hyperglycemia in the noncritically ill hospital patient.5 This article is based on that module, and provides a practical summary of the key concepts that will allow clinicians to confidently employ physiologic insulin regimens when caring for their hospital patients.
Case: Ms. X is a 56‐year‐old obese woman with type 2 diabetes mellitus who is admitted for treatment of an infected diabetes‐related foot ulcer. The patient will be allowed to eat dinner in a couple of hours, but the surgeons have requested that she be kept nothing by mouth (NPO) after midnight for surgical debridement in the morning. Her current weight is 100 kg, and her recent glycemic control can be summarized as having BG values that are usually in the mid‐200s (mg/dL) and a recent glycosylated hemoglobin (HbA1C) measurement of 10.9%. Her home medical regimen includes glipizide 10 mg daily, metformin 1000 mg twice daily, and 20 units of neutral protamine hagadorn (NPH) insulin at bedtime. Her blood glucose in the Emergency Department is 289 mg/dL. How should this patient's blood glucose be managed in the hospital?
PHARMACOLOGIC CONTROL OF BG IN THE HOSPITAL: INSULIN IS THE ANTIHYPERGLYCEMIC AGENT OF CHOICE
Although oral antihyperglycemic agents are frequently used in the outpatient setting, there are many potential disadvantages to using these medications in acutely ill hospital patients, as shown in Figure 1.2, 3 Oral antihyperglycemic agents, in general, are difficult to quickly titrate to effect, and have side effects that can limit their use in the hospital. Metformin can lead to lactic acidosis when it is used in clinical situations that predispose to lactate production (eg, renal failure, circulatory failure, hypoxemia). Therefore, metformin should be held in patients who have, or are at risk for, these conditions, each of which may be encountered in the hospital. Also, agents that stimulate the release of insulin, such as sulfonylureas, should be held in patients with variable nutritional intake, to prevent hypoglycemia. In contrast, insulin acts rapidly, responds in a timely fashion to dose titrations, and can be used effectively in virtually all patients and clinical situations to control BG levels. This makes insulin the treatment of choice for hyperglycemia in the hospital. Insulin can be administered via subcutaneous doses or as an intravenous infusion for cases in which rapid titration is the goal. Intravenous insulin infusions are the preferred mode of insulin delivery in the ICU setting, and may be appropriate for some noncritically ill patients in hospitals that have developed systems to safely provide them on general wards. Subcutaneous insulin is most commonly used in the noncritically ill patient population and is the focus of this article.
Although insulin is the drug of choice for managing hyperglycemia in the hospital, there are some situations when it is appropriate to continue oral antihyperglycemic medications in the hospital. These agents may be continued in hospitalized patients who are clinically stable, and who have normal nutritional intake, normal BG levels, and stable renal and cardiac function. They may also be started or resumed in the hospital if they are to be included in the discharge medication regimen once the patient is clinically stable and if it has been assured that contraindications to their use no longer exist.
Ms. X should be treated with a more robust (physiologic) insulin regimen. This statement would be true, even if she were not an inpatient with a foot infection. Her glycemic control is currently poor, as evidenced by her high HbA1C and her elevated admission BG, and is unlikely to be appreciably improved with the addition of any pharmacologic agent other than insulin. The glipizide should be held, as the patient will be NPO after midnight. Most experts would recommend holding the metformin at this time as well, since the patient will be undergoing a surgical procedure in the morning that places her at risk for predisposing factors to lactic acidosis.
INPATIENT GLYCEMIC TARGETS
At present, recommended glycemic targets for noncritically ill hospital patients are based entirely on expert opinion, as there have been no clinical studies directly comparing different glycemic targets in this patient population. However, the American College of Endocrinology, the American Association of Clinical Endocrinologists, and the American Diabetes Association do provide recommendations about glycemic targets for inpatients (Table 1).6, 7 Although controversial, these recommendations make it clear that uncontrolled hyperglycemia is no longer the accepted standard of care for hospitalized patients, and illustrate the consensus of expert opinion on the subject. Of note, many hospitals are adopting glycemic targets that are less stringent than those shown in Table 1, recognizing the challenges of controlling BG levels in hospitalized patients, and the potential risk for hypoglycemia when lower BG targets are used. Each hospital's glycemic control champions must reach consensus on a target BG range for their institution. In practice this range has been 90110 mg/dL for the lower BG limit and 140180 mg/dL for the upper BG limit. It is also important to note that the recommendations from professional organizations emphasize the need to individualize BG targets, based on the clinical circumstances of each patient.
| Organization | ICU(mg/dL) | Non‐ICU, Preprandial (mg/dL)* | Non‐ICU, Maximum(mg/dL)* |
|---|---|---|---|
| |||
| ACCE/ACE | 110 | 110 | 180 |
| ADA | 110 | 90‐130 | 180 |
Ms. X is exhibiting glycemic values far outside of the recommended upper limit of 180 mg/dL, and treatment with insulin monotherapy is the most appropriate strategy in this case.
PHYSIOLOGIC (BASAL‐BOLUS, PLUS CORRECTION DOSE) INSULIN
The management of hyperglycemia and diabetes in the inpatient setting is challenging due to the many changes that patients experience in the hospital. Hospitalized patients often experience changes in their nutritional intake and their medication regimen. In addition, hospitalized patients usually experience the stress of acute illness and are treated with medications that might impact glycemic control. Figure 2 lists some of the barriers to achieving glycemic control in hospitalized patients. The inpatient insulin program needs to be flexible enough to allow for maintenance of glycemic control in the face of tumultuous circumstances. This can best be accomplished by the use of a physiologic insulin program. This means using exogenous insulin to mimic normal physiologic insulin activity by providing the correct types and doses of insulin at the correct times.
A physiologic insulin regimen can be conceptualized as having 3 separate components: basal insulin, nutritional (or prandial/meal) insulin, and correction dose (or supplemental) insulin.2 A patient's total daily dose (TDD) of insulin is the sum of all of these, and represents the amount of insulin that a patient requires over the course of 1 day while receiving adequate nutrition. Basal insulin is the insulin normally released continuously by the pancreas, even when fasting. This serves to suppress glucose and ketone production. When nutrition is ingested, there is a surge in the level of glucose in the blood, and this surge is accompanied by rapid secretion of additional insulin to allow for the appropriate utilization of the glucose. The insulin that is secreted in response to nutritional intake is referred to as nutritional insulin. About one‐half of the total daily insulin secreted by a healthy normal human serves a basal function, and about one‐half is secreted in response to nutritional intake.8 Understanding this bit of physiology (the 50/50 rule) is very helpful for creating flexible regimens using exogenous insulin. Although the 50/50 rule is useful in many circumstances, there are some notable exceptions. In some cases, basal insulin might be expected to be less than one‐half of the TDD (eg, enteral feeds, as discussed below). Additional correction dose insulin is given to correct hyperglycemia that occurs despite scheduled doses of basal and nutritional insulin.
It is an important practical consideration to note that when a person with diabetes is acutely ill or stressed, as is commonly the case in the hospital setting, total daily insulin requirements increase. This is due to the action of insulin counterregulatory hormones such as catecholamines, cortisol, growth hormone, and glucagon. The hospitalized patient is therefore likely to require a TDD that is higher than that required when well. This is particularly true for the basal insulin dose. Conversely, insulin requirements will decrease as a patient recovers from acute illness, and it may be necessary to lower insulin doses as BG levels decrease during convalescence.
Exogenous basal insulin is provided as a long‐acting or intermediate‐acting, low‐peaking or nonpeaking insulin (eg, glargine or detemir), that allows for a consistent level of basal insulin (Figure 3). This insulin is provided even when the person is not receiving any nutrition. Although twice daily NPH insulin can be used to provide basal insulin, the peak (as shown in Figure 3) is likely to exceed the level of insulin that is truly required for basal needs, which can result in hypoglycemia. In theory, NPH insulin would be less physiologic than glargine or detemir, although no studies have compared these insulins in the hospital setting. When using NPH insulin as a basal insulin in a patient who is designated NPO, the dose should be reduced by one‐third to one‐half to avoid hypoglycemia that may occur when it peaks.2
Exogenous nutritional insulin must be provided in a way that matches the nutrition that is being provided to the patient. For example, a patient who is receiving nutritional boluses (ie, meals or bolus tube feeds) can be given rapid‐acting insulin (eg, aspart, glulisine, lispro) along with each nutritional bolus to cover the glycemic peak that is caused by the meal. The rapid‐acting analog insulins can also be given at the end of a meal or bolus tube feed for cases in which it is not clear if the nutrition will be well tolerated. A reduction in the insulin dose proportionate to the amount of nutrition actually taken can then be made to decrease the risk of subsequent hypoglycemia. Regular insulin can also be given in anticipation of a meal or tube feed, but its later peak (as shown in Figure 3) requires that it be given 30 minutes before a meal is ingested, the timing of which is a challenge on most nursing units. Patients who are not receiving any nutrition should not receive nutritional insulin. And, patients receiving alternative forms of nutrition will require different nutritional insulin regimens to adequately cover their nutritional glycemic loads, as discussed below.
The separate provision of basal and nutritional insulin results in a highly‐flexible insulin program that can provide basal insulin to patients even when they are not receiving significant nutrition, and can be easily adjusted to provide appropriate nutritional insulin to match actual nutritional delivery.
Correction‐dose insulin is the small amount of insulin that is given to patients, in addition to basal and nutritional insulin, to correct hyperglycemia. Correction‐dose insulin is usually provided as rapid‐acting or regular insulin (usually the same type as the nutritional insulin), and is given in a dose that is specifically designed to reduce the patient's BG back into the target range. It is usually given at the same time as the nutritional insulin in patients who are receiving nutrition (or every 4 to 6 hours in patients who are not). Correction‐dose insulin is often written in a stepped format, to provide the appropriate amount of insulin for a given BG value. It differs from the traditional sliding‐scale in that it is not used alone (but rather as 1 component of a physiologic program), and in that it is customized to match the insulin sensitivity for each patient. Most standardized order sets for subcutaneous insulin provide several different correction‐dose scales to choose from, depending on the patient's weight or total daily insulin requirement.
If correction‐dose insulin is required consistently, or in high doses, it suggests a need to modify the basal and/or nutritional insulin. A proportion of the total number of units of correction‐dose insulin given in the preceding 24 hours can be distributed into basal and nutritional insulin doses for the next day if there is ongoing need for significant correction‐doses of insulin. A well‐designed, physiologic insulin regimen should provide targeted glycemic control, without a need for constantly adding large correctional boluses.
Some insulins do not fit neatly into either basal or nutritional insulin categories. For example, mixed insulins (eg, 70/30, rapid‐analog/NPH mixtures) combine basal and nutritional insulins to form either a double‐peaking insulin or an intermediate‐peaking insulin. The use of this type of insulin makes it impossible to manipulate the basal and nutritional components separately to enable attainment of BG targets. Therefore, the role of this type of insulin is limited in the hospital setting. Mixed insulins may, however, be started once the patient is clinically stable if they will be part of the discharge regimen.
Diabetes and hyperglycemia in the hospitalized patient require active management, and there are no autopilot insulin regimens. The use of sliding scale insulin alone to manage hyperglycemia is a common practice in hospitals.9 However, this is an historic practice that is based on the erroneous idea that BG can be managed with a reactive strategy. When sliding‐scale insulin is used as the sole modality of insulin therapy, insulin is provided only after metabolic control has been lost, and usually does not provide an appropriate dose of insulin, considering basal, nutritional, and correctional needs. The end result is poor glycemic control.9, 10 A recent randomized, controlled trial demonstrated that a physiologic insulin regimen is indeed superior to a standardized insulin sliding‐scale for managing inpatient hyperglycemia.4
Ms. X should be given an insulin regimen that includes basal, nutritional, and correctional components. The provision of separate basal and nutritional insulin will allow the clinicians to provide the patient with basal insulin even when her nutritional insulin is held, and to easily modify her nutritional insulin, depending on her nutritional intake.
PHYSIOLOGIC INSULIN: A PRACTICAL APPROACH
The use of physiologic insulin in the hospital can be facilitated by considering a stepwise approach (Figure 4).5 The first step is to estimate the amount of insulin that the patient will require over the course of a day if taking adequate nutrition (this is the TDD). If the patient has been treated with subcutaneous insulin before being admitted to the hospital, the clinician can use the outpatient TDD to gauge the insulin needs. To do this, the clinician simply adds up the total number of units of insulin that a patient takes at home in a day. Using this method to estimate the patient's TDD can be very helpful, even if the clinician plans to use different types of insulin while the patient is hospitalized. When using this approach, one should consider the patient's prior metabolic control on the existing regimen (ie, if the patient's glycemic control was poor on the preexisting regimen, an increase in the TDD would be necessary). In addition, clinicians should recognize that insulin requirements usually increase when patients are acutely ill, as discussed above. Managing diabetes and hyperglycemia in the hospital is very different than doing so in the outpatient arena, and hospitalists should not feel bound by the outpatient regimen.
In addition, a weight‐based estimation of the TDD can be very helpful in determining a starting dose of insulin in a hospitalized patient (see Figure 5). An estimate of 0.4 units/kg of body weight provides a conservative starting point for the TDD for most patients. Occasionally, a lower starting dose of 0.3 units/kg of body weight might be safer for those patients who are likely to be very sensitive to insulin, or who are otherwise at increased at risk for hypoglycemia (see Figure 5). Patients who are overweight or obese often require considerably higher TDDs in the range of 0.5‐0.6 (or even more) units/kg of body weight. Some may require over 1 unit/kg of body weight for their TDD. Therefore, the doses provided by these calculations represent conservative estimates in most patients. Hospitalists should be able to confidently make these dose estimates and avoid dependence on nonphysiologic regimens such as sliding‐scale insulin alone.
The presence of risk factors for hypoglycemia or hyperglycemia should temper the dose calculations. Clinical conditions associated with hyperglycemia include obesity, certain medications (eg, glucocorticoids, catecholamines, tacrolimus, cyclosporine), and changes in nutritional intake (Figure 2). Clinical conditions associated with hypoglycemia are summarized in Figure 6. It is important to recognize that these calculations are intended to give the clinician a safe and rational starting point for insulin dosing. More important than the calculations is the careful monitoring of BG levels and timely modifications of the insulin regimen that follow.
The second step in developing a physiologic insulin regimen is to determine the patient's nutritional regimen. The third step, then, is to decide how the TDD will be distributed into basal and nutritional insulins, and which insulin will be used for each. As noted above, for most patients, approximately one‐half of the TDD will be provided as basal insulin, and the other one‐half given as nutritional insulin. When patients are receiving nutrition, the insulin must be given in a way that matches the timing of nutrition delivery (eg, with each meal or bolus tube feeding), and provides appropriate insulin coverage for the nutrition that is being provided.
Nutritional insulin will not be given if the patient is not receiving any nutrition, in which case basal insulin and correction‐dose insulin will usually be continued. Table 2 shows the preferred insulin regimens for a variety of different nutritional circumstances, as put forth by the Society of Hospital Medicine (SHM) Glycemic Control Task Force.5
| Nutritional Situation | Necessary Insulin Components | Preferred Regimen* |
|---|---|---|
| ||
| NPO (or clear liquids) | Basal insulin: 50% of TDD. Nutritional insulin: None. | Basal insulin: glargine given once daily or detemir given twice daily. Nutritional insulin: None. Correctional insulin: Regular insulin q 6 hours or RAA insulin q 4 hours. Other comments: Dextrose infusion (eg, D5 containing solution at 75‐150 cc/hour) recommended when nutrition is held. An IV insulin infusion is preferred for management of prolonged fasts or fasting type 1 diabetes patients. |
| Eating meals | Basal insulin: 50% of TDD. Nutritional insulin: 50% of TDD, divided equally before each meal. | Basal insulin: glargine given once daily or detemir given twice daily. Nutritional insulin: RAA insulin with meals. Correctional insulin: RAA insulin q AC and HS (reduced dose at HS). |
| Bolus tube feeds | Basal insulin: 40% of TDD. Nutritional insulin: 60% of the TDD, divided equally before each bolus feed. | Basal insulin: glargine given once daily or detemir given twice daily. Nutritional insulin: RAA insulin with each bolus. Correctional insulin: RAA insulin with each bolus. |
| Continuous tube feeds | Basal insulin: 40% (conservative) of TDD. Nutritional insulin: 60% of the TDD in divided doses. | Basal insulin: glargine given once daily or detemir given twice daily. Nutritional insulin: RAA insulin q 4 hours or regular insulin q 6 hours. Correctional insulin: Should match nutritional insulin choice. |
| Parenteral nutrition | Insulin is usually given parenterally, with the nutrition | Initially, a separate insulin drip allows for accurate dose‐finding. Then, 80% of amount determined as TDD using drip is added to subsequent TPN bags as regular insulin. Use correctional subcutaneous insulin doses cautiously, in addition |
For Ms. X, the first step is to determine a TDD estimate. This patient weighs 100 kg, and is obese. Therefore, a TDD of 0.5 units/kg (50 units) is appropriate. This dose may be an underestimate of her insulin needs, but it is a conservative, reasonable starting point. The patient's basal insulin could be provided by giving one‐half of the TDD as basal insulin, such as glargine, 25 units daily. In this case, the patient will be eating dinner soon, but then will be NPO after midnight for surgery. Appropriate nutritional insulin could be provided by giving one‐third of her total nutritional insulin before this meal as a rapid‐acting insulin analog (25 units nutritional insulin per day divided by 3 meals results in a dose of 8 units per meal). After she eats dinner, additional nutritional insulin will not be given until she resumes her diet postoperatively. While NPO, her basal insulin should be continued, and her blood glucose should be checked every 4‐6 hours. An appropriate correction‐dose insulin scale should be chosen to provide a supplemental insulin dose with each bedside test of the blood glucose level, if and only if, hyperglycemia is present.
Case continued: The patient is given 8 units of lispro insulin before her dinner, and is also given a dose of 25 units of glargine insulin. She is held NPO after midnight and dextrose‐containing fluid is provided intravenously overnight at a maintenance rate. In the morning her blood glucose is 161 mg/dL before surgery. Surgery goes well, and at lunch her blood glucose is 179 mg/dL, and she is given a food tray. However, the patient says that she feels mildly nauseated, and is not sure that she will be able to eat her lunch. How should her nutritional insulin be managed in this situation?
MATCHING NUTRITION AND NUTRITIONAL INSULIN: A DIFFICULT CHALLENGE
It is the provision of the correct type and amount of nutritional insulin at the right time that is most challenging in the hospital. In the hospital, a patient's nutritional intake is often interrupted. Patients might be made NPO as part of the treatment plan, or may not be able to take nutrition by mouth because of specific medical conditions. In some cases, enteral or parenteral feeding is used to replace or enhance oral feeding. Even when alternate routes of nutrition are employed, sudden interruptions in nutrition still remain common (eg, the feeding tube falls out). Ultimately, to provide the best possible care to a diabetes patient, the nutritional insulin that is delivered must match the actual nutritional delivery (Table 2). Ideally, each institution should choose a preferred, standardized approach for each nutritional situation.
Even if institutions standardize their approach to nutritional insulin delivery in general, clinicians must be able to accurately respond to the unplanned variations in nutrition that occur in the hospital. One example of this is the patient who is expected to eat meals, but who becomes suddenly unable to do so, such as in the case above. In cases like this, the best approach is to hold the patient's nutritional insulin and allow the patient to attempt to eat the provided meal. Then, a rapid‐acting insulin analog can be given just after the meal, in proportion to the amount of the meal that was eaten. If the patient really is unable to tolerate any of the meal, then no nutritional insulin is provided. If the patient does tolerate a portion of the meal (eg, 50% of the meal is consumed), then a corresponding amount of insulin is given (eg, 50% of the scheduled nutritional insulin is given). The quick onset of the rapid‐acting insulin analogs allows near‐physiologic effect, even when they are given after the meal.
Ms. X should be allowed to eat as much of the meal as she can tolerate. Afterward, her intake can be assessed, and insulin can be provided in proportion to the amount of the meal that was eaten, as described above.
Bolus Tube Feeds
Patients who are given bolus enteral feeds are typically treated like patients who are eating meals. Like meals, bolus tube feeds are nutritional boluses that should be covered with nutritional insulin boluses. Because the hyperglycemia that sometimes accompanies bolus tube feeds is partly related to the glycemic load of this type of feedings, it is reasonable to provide 60% of the TDD of insulin as nutritional insulin when using this type of nutrition.
Continuous Tube Feeds
Patients who are given continuous enteral nutrition are somewhat different than patients who are eating meals. Continuous tube feed patients receive nutrition on a continuous basis. Therefore, these patients must also receive nutritional insulin in a way that provides continuous coverage. There is no proven superior insulin regimen for the continuously tube fed patient. Because the nutrition is being provided continuously, providing all of the TDD of insulin as a long‐acting, nonpeaking insulin might be considered the most physiologic regimen. However, if such a strategy is used and the tube feeding is interrupted for some reason, the patient will be in danger of hypoglycemia for the duration of action of the basal insulin. For this reason, the SHM Glycemic Control Task Force and many endocrinologists recommend using a long‐acting basal insulin at a dose that would provide a conservative estimate of the basal component (eg, 40% or less of the TDD), and dividing the remainder of the insulin and giving it as scheduled regular (every 6 hours) or rapid‐acting insulin (every 4 hours) for the nutritional coverage.
If tube feeds are interrupted, an infusion of 10% dextrose given intravenously at the same rate as the tube feed had been running (or the equivalent) can be provided to avoid hypoglycemia until the effect of the nutritional insulin has dissipated. It is reasonable to create a standing order to notify the physician, or start an alternate source of dextrose, in the case of tube feed interruption.
Parenteral Nutrition
For patients receiving parenteral nutrition, regular insulin, mixed with the parenteral nutrition, is safe and effective. Subcutaneous correction‐dose insulin is often used, in addition to the insulin that is mixed with the nutrition. When starting parenteral nutrition, the initial use of a separate insulin infusion can help in estimating the TDD of insulin that will be required.
TYPE 1 DIABETES
Because type 2 diabetes is more prevalent than type 1 diabetes, hospitalists will manage this form of diabetes most often. However, it is crucial that hospitalists are also able to manage type 1 diabetes in the hospital. For the most part, the principles presented in this article apply to all types of diabetes patients. This section outlines some special considerations to remember when caring for type 1 diabetes patients in the hospital that will assure prevention of diabetic ketoacidosis in patients with type 1 diabetes.
Type 1 diabetes patients completely lack endogenous insulin production. Therefore, these patients require exogenous insulin to be provided at all times. Type 1 diabetes patients need to be provided continuous, exogenous basal insulin, even when fasting, to suppress gluconeogenesis and ketone production. Failure to provide basal insulin to a type 1 diabetes patient can lead to the rapid development (in hours) of ketoacidosis. When receiving nutrition, the patient with type 1 diabetes must also be provided with nutritional insulin to control postprandial BGs. Whereas many type 2 diabetes patients may produce sufficient endogenous insulin to meet basal requirements when fasting (ie, they produce enough basal insulin to maintain metabolic stability when they are not taking in nutrition), this is never the case for type 1 diabetes patients.
In addition, type 1 diabetes patients typically exhibit less insulin resistance than type 2 diabetes patients, especially if they are not obese. Therefore, type 1 diabetes patients often have TDDs of insulin that are lower than those of type 2 patients. This is reflected in the recommendations in Figure 5, with the TDD of insulin estimate for a lean type 1 diabetes patient of 0.3 units/kg/day.
CONTINUOUS SUBCUTANEOUS INSULIN INFUSIONS (INSULIN PUMPS) IN THE HOSPITAL
Continuous subcutaneous insulin infusion therapy (CSII), often referred to as insulin pump therapy, involves the use of a pump to provide a continuous flow of subcutaneous basal insulin (usually a rapid‐acting analog) through a needle that is left in place. This basal rate is adjustable, and therefore can be customized to meet variable needs over a 24‐hour period. When the patient takes in nutrition, a bolus of the same insulin is given, via the pump, at a dose that is appropriate to cover the nutritional intake. The advantages of CSII therapy are the capacity for precision and flexibility of the basal insulin delivery (compared to the use of a once‐daily or twice‐daily dose of long‐acting insulin analog), and the lack of a need to inject insulin boluses (which are delivered via the pump). This type of therapy is preferred by some diabetes patients, and although it is not highly prevalent in most areas, it is common enough that hospitalists must have a plan for managing it in their practices.
There are many barriers to the use of CSII in the hospital. Most of these barriers are related to the need for constant management of the pump. Most hospitalists and nurses do not have the expertise to manage this therapy in the hospital. Although the patient (or caregiver) might have the expertise to manage the pump, this is an acceptable option only if the patient is competent to manage the pump. Patient competence to use the pump must be formally assessed and documented, and the patient must agree to perform the many components of care related to managing the pump (eg, documenting the basal rate and boluses given, documenting BGs, providing tubing and other supplies).
Many hospitals currently choose a policy of converting insulin pump therapy to standard subcutaneous insulin treatment for most hospitalized patients. Usually the conversion of CSII to a physiologic subcutaneous insulin regimen (as detailed in this article) is fairly straightforwardthe basal insulin will be given as long‐acting, low‐peaking insulin, and nutritional and correction‐dose insulin can then be added as a rapid‐acting analog, in accord with the patient's needs.
Hospitals that admit a large number of insulin pump patients, or those that choose to use pumps routinely in the hospital, should create a formal policy for pump use.11 It has been suggested that the policy should assure that there is formal assessment of the patient's competence to manage the pump, that there is professional oversight of the pump management (usually via endocrinology and diabetes educator consultation), that contraindications for CSII use are clearly stated, and that there is a formal mechanism for engaging the patient and informing him of his roles and responsibilities (eg, a written agreement). The clinician must write insulin orders in the medical record that specify the basal and bolus insulin doses which are being used. Pump use may be limited to floors where nurses receive at least basic education in the principles of CSII pumps.
CARE TRANSITIONS IN THE HOSPITAL
Transitioning from an Intravenous Insulin Infusion to a Subcutaneous Insulin Regimen
In the hospital, it is often necessary to switch a patient from an intravenous (IV) insulin infusion to a subcutaneous (SC) insulin regimen. When doing this, the clinician must decide how much SC insulin the patient will require. As discussed earlier, the TDD may be estimated based on home insulin doses or the patient's weight. However, for a patient who is treated with an IV insulin infusion, current insulin requirements can be estimated based on the recent IV drip rate. This is the preferred method for identifying a TDD in these patients, as the insulin delivery rate at the time of drip discontinuation provides a way of determining current insulin requirements.
Regardless of the dose of SC insulin that is chosen, it is important that SC insulin be delivered well in advance of the discontinuation of the IV insulin. Because the duration of action of IV insulin is on the order of 7 minutes, the patient may become rapidly hyperglycemic or develop ketoacidosis (in type 1 diabetes) in a matter of hours if the IV insulin infusion is discontinued before the SC insulin is active. Insulin infusion should not be stopped for at least 1 hour after the SC delivery of rapid‐acting or regular insulin, and at least 2‐3 hours after the SC delivery of intermediate‐acting or long‐acting insulin.2
Discharge Transition
The hospital discharge is another challenging transition for the patient with diabetes. While hospitalized, a diabetes patient's medication regimen will likely be altered to maintain metabolic control. At the time of discharge, the patient should be provided with an appropriate medication regimen. Moreover, the patient must be educated about any new medication or other changes that will be part of the new outpatient management routine. It is also important to assure that the patient does not have knowledge deficits related to diabetes survival skills. The Joint Commission has recently put forth the expectation that such education will be provided prior to hospital discharge.12 Areas outlined for this core diabetes self‐management education include: the definition of diabetes; finger‐stick BG monitoring; glycemic targets; insulin self‐administration; hypoglycemia prevention, recognition, and treatment; hyperglycemia recognition; sick day guidelines; and when to call a clinician for help. Communication of the discharge diabetes management plan to the patient's primary care provider should also be undertaken.
Please see the article entitled Bridge Over Troubled Waters: Safe and Effective Transitions for the Inpatient with Hyperglycemia in this supplement for additional details about both the IV to SC transition and the discharge transition.
CONCLUSIONS
Understanding the basic principles of the physiologic (basal, nutritional, and correction‐dose) insulin regimen will allow clinicians to formulate safe and effective insulin regimens in virtually any clinical situation. Simple steps can allow safe estimates of initial doses and titration toward glycemic goals. Additional information and case studies can be found in a Society of Hospital Medicine Task Force Educational Module,5 available online.
Additional resources for improving glycemic control in hospital patients are available online at the Glycemic Control Resource Room (
- ACE/ADA Task Force on Inpatient Diabetes.American College of Endocrinology and American Diabetes Association Consensus Statement on Inpatient Diabetes and Glycemic Control: A call to action.Diabetes Care.2006:29:1955–1962.
- ,,, et al.Management of diabetes and hyperglycemia in hospitals.Diabetes Care.2004;27:553–591.
- .Management of hyperglycemia in the hospital setting.N Engl J Med.2006;355:1903–1911.
- ,,, et al.Randomized study of basal‐bolus insulin therapy in the inpatient management of patients with type 2 diabetes (Rabbit 2 trial).Diabetes Care.2007;30:2181–2186.
- ,; for the Society of Hospital Medicine Glycemic Control Task Force. Educational module: management of diabetes and hyperglycemia in the hospital patient: focus on subcutaneous insulin use in the non‐critically ill, adult patient. Published January 2007 on the Society of Hospital Medicine Website. Available at:http://www.hospitalmedicine.org/ResourceRoomRedesign/html/11Ed_Resources/01_Teaching_Slide.cfm. Accessed August2008.
- American College of Endocrinology Task Force on Inpatient Diabetes and Metabolic Control.American College of Endocrinology Position Statement on Inpatient Diabetes and Metabolic Control.Endocr Pract.2004;10:77–82.
- American Diabetes Association.Standards of Medical Care in Diabetes, 2006.Diabetes Care.2006;29(supp 1):s4–s42.
- Larsen PR,Kronenberg HM,Melmed S,Polonsky KS, editors.Williams Textbook of Endocrinology.10th ed.Philadelphia, PA:Elsevier Science;2003.
- ,,,,.Inpatient management of diabetes and hyperglycemia among general medicine patients at a large teaching hospital.J Hosp Med.2006;1:145–150.
- ,,.Glycemic control and sliding scale use in medical inpatients with diabetes mellitus.Arch Intern Med.1997;157:545–552.
- ,,, et al.Use of continuous subcutaneous insulin infusion therapy in the hospital setting: Proposed guidelines and outcome measures.Diabetes Educ.2005;31:849–857.
- Inpatient Diabetes Certification. Joint Commission. Available at:http://www.jointcommission.org/CertificationPrograms/Inpatient+Diabetes. Accessed April2008.

Implementing Insulin Infusion Protocols
The delayed and variable absorption of subcutaneous (SC) insulin has always provided challenges for the rapid and predictable control of hyperglycemia in the acute care setting. Conversely, intravenous infusion of human regular insulin provides a continuous and essentially immediate delivery mechanism. Once in the circulation, insulin has a very short half‐life of about 5 to 7 minutes and a biological effect of about 20 minutes.1 Intravenous insulin infusions are well‐established in several acute care settings including hyperglycemic emergencies, perioperative glucose management, and glucose control during labor and delivery.2, 3
The beneficial effects seen in early trials of strict glycemic control involving intensive care unit (ICU) patients47 (particularly cardiac surgery patients) and guidelines for inpatient glycemic control8 stimulated widespread interest in adopting insulin infusion protocols (IIPs) focused on achieving strict glycemic targets. The initial enthusiasm has been tempered by uneven results in trials of tight glycemic control, concerns about the effects of excessive hypoglycemia, and the resources needed to implement and maintain an IIP.9 Although considerable controversy about the ideal glycemic target for different patient populations exists, and will likely continue for some time, this article is not a review of the evidence for supporting 1 glycemic target versus another. Regardless of the glycemic target chosen, a standardized algorithm and accompanying program of monitoring are widely endorsed for both safety and quality reasons.1014 Most medical centers are at least attempting to implement nurse‐driven protocols that have demonstrated better perfomance than SC regimens15 and physician‐driven insulin infusions.16, 17 In this article, we outline several variables in IIP design and implementation and endorse several aspects of design and implementation that will likely result in improved staff acceptance and, ultimately, a more safe and effective IIP.
PREPARING TO IMPLEMENT AN IIP
Building The Team
Implementing a medical centerwide standardized insulin infusion order set with supporting policies, protocols, monitoring standards, and the requisite educational programs is a major task for any hospital. This is not a simple maneuver involving only 1 or 2 interested individuals and requires much more than selecting a published protocol and disseminating it to various patient care units. Instead, to manage the full spectrum of diabetes programs and protocols, an institution must convene a multidisciplinary steering committee or task force. This should include representation from nursing, nursing administration, pharmacy, nutrition services, and the quality improvement department. Physicians should include hospitalists, intensivists, and endocrinologists but may also involve anesthesiologists and surgeons, as applicable. At times, additional members may need to be recruited according to project needs.
Identifying the Stakeholders and Current Practices
In developing or improving currently utilized IIPs, the multidisciplinary committee would benefit from careful background work before moving forward. First, administrative and institutional support must be secured to endorse uniform standards for insulin infusions, and to provide the important infrastructure needed to facilitate the work involved. Clinical and administrative stakeholders from the key departments then need to be identified.
All insulin infusion orders and policies/procedures presently used in the institution should be identified and examined. The developers and/or users of these order sets should be engaged in a dialogue and encouraged to share their experiences regarding their current practice and the attendant work flow, glucose monitoring, and data collection and reporting. Immediate concerns should be clearly addressed. Measurement systems for glycemic control, hypoglycemia, and insulin use patterns should assess current practice and the impact of subsequent modifications of the protocol or initiation of new protocols. We recommend using glucometrics consistent with those endorsed by the Society of Hospital Medicine (SHM) Glycemic Control Task Force elsewhere in this supplement.18
Addressing the Burden of Change
Through this process, the committee will uncover barriers, dysfunctional and inconsistent practices, and individuals who will pose challenges. Identifying these issues should not discourage the team, but rather it should guide the interventional strategies, and help build consensus that change may be required. There must be caution not to exclude significant individuals simply because they resist changes. Indeed, if they are included and have the opportunity to contribute to the process, success is much more likely.
It is important for process leaders to understand the implications of what is proposed, particularly for nursing services.19 For example, it has been shown that IIPs require about 5 minutes per patient per hour for glucose monitoring and dose adjustments.20 Acknowledging and attempting to address this burden proactively (often well over 2 hours per day) can gain staff acceptance more effectively than a laissez faire approach. In this regard, some effort should be invested in nursing education of the benefits of tight glycemic management on critical care outcomes. The difficult‐to‐quantify work involved when patients' blood glucose is not well controlled (eg, paging physicians for stat insulin orders) should also be part of this discussion.
Identifying and Addressing Barriers to IIP implementation
There are numerous potential barriers to implementation of IIPs. Table 1 identifies some of the most frequent ones along with potential strategies or solutions. Very common barriers include skepticism surrounding the benefits of tight glycemic control, fear of hypoglycemia, and difficulty agreeing on glycemic targets.
| Barrier | Strategy/Solution |
|---|---|
| Insufficient glucose meters to accommodate the increased testing needs | Purchase additional glucose meters. |
| Ask the vendor to provide extra on‐site replacement meters at no charge until they are activated. | |
| Nursing time requirements involved in monitoring and adjustments. | Get ancillary help to check glucose values |
| ○eg, nurse assistants | |
| Make extra efforts to make protocols clear with few required calculations | |
| Avoid duplicate recording | |
| Consider meters requiring shorter time and a smaller sample (to avoid need for re‐sampling) | |
| Requirement for uncomfortable frequent sticks | Utilize central lines or arterial lines. |
| ○These tend to vary by 10% from POC readings | |
| ○May not be available in noncritical care settings | |
| Staff fear of hypoglycemia | Educate on the benefit of glucose control and the true definition of hypoglycemia |
| ○Measure staff fasting glucose levels to demonstrate normal range. | |
| Establish metrics and publicly report hypoglycemia event rates. | |
| Pilot IIP on small scale. | |
| Protocol and education for prevention of hypoglycemia. | |
| Difficulty gaining consensus on glycemic target | Compromise if needed on the glucose target |
| ○eg, start with a higher goal such as 90‐140 mg/dL. | |
| ○Others will be willing to lower the goal when feasibility is seen. | |
| Allow for different targets in different units if indicated | |
| ○maintain consistency in other respects. | |
| Focal points of resistance | Identify a local nurse or physician champion within resistant site. |
| Pilot the protocol in an area with least resistance | |
| ○Will gain momentum with initial success and adjustments | |
| Lack of integrated information and reporting systems | Incorporate information systems personnel onto team |
| Advocate for improved reporting capability with administrative leaders | |
| Use sampling methods to collect data until automated systems are available. | |
| Multiple providers, hand offs, and opportunities for error and communication breakdown, diffusion of responsibility for glycemic control | Involvement of varied front line providers |
| Check lists for important items to communicate on transfer/transport | |
| Common protocols/education for similar units |
Whereas the national guidelines call for a glycemic target in critical care areas with an upper limit of 110 mg/dL, there is room for debate, and tailoring of the glycemic target to fit individual patient circumstances is often advisable. Starting with a less aggressive glycemic target can be good politics (and perhaps good medicine as well). Once the higher glycemic targets are achieved safely, it can pave the way for a more aggressive approach.
Fear of hypoglycemia is one of the most potent barriers to intensive insulin infusion implementation. Because hyperglycemia is such a common condition in critical care units, nursing and physician staff may have developed a skewed view of the definition of hypoglycemia, at times fearing for their patient when the glucose values reach a level of 100 mg/dL or so. Polling the nurses on what they think their own fasting glucose levels are, and then actually measuring them can be an effective strategy (the nurses may be surprised that the patient's scary 90 mg/dL reading is higher than their own). It should also be emphasized that properly designed and implemented protocols may actually decrease the incidence of hypoglycemia when compared to standard care which may involve individually and sometimes improperly adjusted intravenous (IV) insulin (discussed further below).
CHOOSING AN IIP FOR YOUR HOSPITAL
See Table 2 for a comparison of several features identified in selected published protocols.7, 2127 This is not a comprehensive list of all protocols found in the literature. Rather, the authors consider it representative of the various types of IIPs or best recognized IIPs in the literature. Note that there is variability in study population, the glucose targets, hypoglycemia, the time to reach the target, and the time spent in the target range. Other practical factors to consider in reviewing the literature and selecting an IIP design are the complexity of the protocol, the required process steps or calculations, the evidence for staff acceptance, and the level of resources supporting the published protocol.
| Author (reference) | IIP Description | Patient population | Glucose Target (mg/dL) | Mean Glucose (mg/dL) | Time to Reach Target | Hypoglycemia |
|---|---|---|---|---|---|---|
| Van den Berghe7 | Initial and subsequent rates based on BG | Surgical ICU | 80‐110 | 6 AM glucose 103 19 | Not reported | 5.1% of patient 41 mg/dL |
| Nurses had latitude | ||||||
| Van den Berghe21 | TPN standard with IIP | Medical ICU | 80‐110 | 6 AM glucose 105 | Not reported | 19% of patients 41 mg/dL |
| Furnary22 (2001‐2003 version) | Initial dose determined by BG and type of DM | CABG | 100‐150 (there is a newer protocol with lower targets) | Not mentioned. Appears to be 150 | 94% within 3 hours | 0.5% 60 (% of readings?) Not reported with any specificity |
| Changes based on present BG and last change | ||||||
| Relatively complex | ||||||
| Goldberg23 | Dosing based on: | MICU | 100‐139 | Not specified | 10.1 hours | 0.3% of readings 60 BG 60 in 5.4% of patient days |
| ○Current BG | ||||||
| ○Velocity of glucose change | ||||||
| Goldberg24 | ○Infusion rate | CT Surgery | 100‐139 | 122 17 Once target attained. | 5 hours | 0.2% of all BGs 60 mg/Dl BG 60 in 2.9% of patient days |
| Uses 3 tables | ||||||
| Relatively complex | ||||||
| DeSantis25 | Initial dose based on BG | Mostly surgical ICU and CVICU (75% surgical) | 80‐110 | 135 49 (higher in SICU and CVICU alone) | 10.6 hours | 1.5% of readings |
| 60 mg/dL (lower for CVICU & SICU alone) | ||||||
| Changes based on present glucose and rate of change. | ||||||
| IV bolus used with changes. | ||||||
| Braithwaite26 | 6‐column method | Trauma ICU | 110 mg/dL | 129 25 | 16.7 hours | 2.4% of readings 70 mg/dL |
| Davidson27 | Computer‐directed algorithm (similar to column method) | Full spectrum | Varied by year and situation | Not reported (approximately 125 mg/dL when stable) | 90% 150 mg/dL in 3 hours | 0.6% of readings 50 mg/dL 2.6% of patients |
Structural Differences in Protocols
Protocols that vary by level of insulin sensitivity generally use column methods with the individual columns representing different categories of insulin sensitivity, placing the most sensitive category on the left with the highest level of insulin resistance on the far right. These methods use a multiplier to adjust for sensitivity. They are constructed according to the rule of 1500, 1700, or 1800, thereby adjusting for changes in insulin sensitivity that follow surgery or other changes in physiologic stress in the acute setting. Rate of change is addressed by shifting to the right if correction of hyperglycemia is too slow and to the left if the glucose is dropping too rapidly.
Most institutions using the column/emnsulin sensitivity method, implement paper orders as first published by Markovitz.28 The same concepts have been used to develop computer‐assisted insulin infusion protocols. One published method is the Glucommander,27 but a number of institutions are using similar computer‐assisted methods developed locally.
Other methods use the present glucose and change from last glucose to constantly adjust to any situation.7, 2125 They usually involve 2 or 3 steps and often require more calculations by the nurse. These methods are purported to be more agile or flexible but there have been no direct comparisons with the column methods looking at effectiveness, nursing errors, or hypoglycemic risk. The Yale Protocol23, 24 and the Portland Protocol22 are 2 prominent examples of this type of protocol. Adjustments are defined as units, percent change, or a combination of both.
Limitations of the IIP Literature
There had been few published insulin protocols aimed at reaching specific glucose goals when the Leuven surgical ICU experience7 was published in 2001. These early publications featured algorithms that adjusted insulin infusions solely on the basis of glucose level, and did not take the velocity of change, direction of change, proximity to glycemic target, or different insulin sensitivities into account. Also, the targeted glucose goals in those reports were not consistent with the present standards.2931 Other published protocols featured glucose‐insulin‐potassium infusion (GIK) protocols that focused on the amount of insulin administered and failed to attain appropriately defined glucose targets.32, 33 These publications offer no real guidance in crafting a modern glycemic targetoriented protocol.
Whereas more than 20 modern IIPs directed at glycemic targets have been published,7, 1517, 2127, 3450 many of the published protocols represent local modifications of ones previously published elsewhere, and no published, prospective, head‐to‐head comparisons of the best‐known IIPs are available.
Several reviews of previous published reports include comparisons of IIPs with varied areas of emphasis.5154 The reliability of such comparisons is limited by the inconsistency in methodology between studies and the different populations studied. For example, medical populations are generally harder to control and are more prone to hypoglycemia than surgical populations,7, 21, 23, 24, 50 and some studies include only patients with diabetes.4, 5, 38 In addition, definitions of hypoglycemia and methods of analyzing glycemic control are highly variable, making comparisons of IIPs challenging.39 As a result, attempts to compare published IIP results without consideration of the population studied could lead to erroneous conclusions.
In spite of the aforementioned limitations, there are several lessons we can learn from the IIP literature and accumulated clinical experience at a variety of centers.
Glycemic Targets and Other IIP Features Can Evolve over Time
Revisions of protocol details, including glycemic targets, often evolve over time. This deliberate approach can facilitate staff acceptance by demonstrating safe achievement of higher glycemic targets. The Yale team initially selected a conservative glycemic target of 100‐139 mg/dL, as depicted in Table 1.23, 24 They subsequently lowered the target range to 90‐119 mg/dL and increased the initial insulin bolus amount by 40%.50 The modified protocol displayed improved performance and yet retained safety, with only 1 glucose reading 40 mg/dL in 101 patients over 117 runs of insulin infusion.
The Portland Protocol, used primarily in cardiac surgery patients, has also evolved over time. This group has altered the IIP in a number of ways at least 4 times. These protocols, including the most recent protocol targeting glucose levels of 70‐110 mg/dL, is found at
Medical and Surgical Patients Are Different
The most convincing evidence for stringent glycemic control evolved from studies of surgical patients.4, 5, 7 Acknowledging this fact, along with the greater degree of difficulty in achieving glycemic targets safely in critically ill medical patients, have led many to endorse higher glycemic targets for certain populations than others.57 Although we generally favor a uniform glycemic target for a unit serving a particular patient population, adopting a less stringent glycemic target in medical ICU settings compared to surgical ICU settings is reasonable and prudent in many institutional settings. However, the accompanying challenges regarding boarding patients and floating nurses between units would also need to be considered.
Local Factors and Implementation Methods Matter
The success or failure of a protocol likely depends on local factors and implementation methods as much as it does on the structure of the protocol itself. IIP development and implementation is a process that must be approached systematically and with attention to detail.19 Errors in approach can delay or abort the implementation, or potentially lead to an ineffective or unsafe protocol for the institution.
The Yale experience again provides us with a salient example.58 Initial efforts to implement an IIP failed due to a number of factors: a complicated protocol, insufficient nursing involvement, and inadequate training and education led to incomplete buy‐in, and nursing concerns over hypoglycemia that actually was within the goal range of the protocol. Successful implementation was not achieved until the leaders learned from their mistakes. Nurses and other clinical allies were involved and educated. Important stakeholders, who were not included earlier, were now involved, and front‐line nursing staff were engaged in proactive troubleshooting.
In another example, multisite studies like VISEP59 and Glucontrol9 have tried to adapt the Leuven protocol, only to struggle with excessive hypoglycemia and an inability to replicate the tight glycemic control enjoyed by van den Berghe and colleagues.7, 21 The Leuven care team augmented the performance of the IIP by their experience with the protocol, physician involvement, and adjustments made by the nursing staff.
Some IIPs Have Lower Hypoglycemia Rates than Others
Recent articles have highlighted the association of intensive insulin treatment, hypoglycemia, and mortality in the medical ICU population.60 Concerns that excessive hypoglycemia could reduce or reverse the overall benefits of intensive insulin therapy has led some to call for moderation of critical care glycemic targets.61 Comparisons of IIPs5254, 61 that include information about the propensity of the IIP to produce hypoglycemia are therefore important.
The Leuven IIP has been reported to yield high rates of hypoglycemia with almost 20% of patients suffering from severe hypoglycemia (glucose 40 mg/dL) in some studies.9, 21, 59 By way of contrast, several different IIP regimens have frequently achieved identical or very similar glycemic control with less than 5% of the patients experiencing severe hypoglycemia.27, 50, 62 Although implementation factors, severity of illness, and other population factors play some role, some protocols have an inherent structural propensity to produce more hypoglycemia than others. In the case of the Leuven protocol, there is more of a role for clinician adjustment, and the written protocol itself does not call for much active adjustment as the patient enters into the hypoglycemic range.52 In contrast, more sophisticated and complicated regimens adjust more aggressively in this range and consistently induce less hypoglycemia.
Successful Methods to Manage the Complexity of an IIP
Many modern IIPs use bolus insulin to expedite control and adjust the infusion rate based on the velocity and direction of glucose change, not just the glucose value.52 Insulin resistance is taken into account in some models, and multiple calculation steps are required in several reported protocols.52 The improved automation and control refinements come at a cost of increased complexity.
Intensive implementation efforts and strong leadership can overcome some issues, as demonstrated by the Yale experience, but 2 other strategies have commonly demonstrated success. First, focused expert glycemic management teams that directly oversee many aspects of the IIP, or even assume direct management roles, can be quite effective,25 especially during early implementation.
Automation of calculations and computerization is another method to consider, and many recent reports involve applications of web‐based or other computerized models.27, 40, 42, 43, 46, 48, 63 Comparisons of computerized versus manual methods, computerized versus column methods, and a computerized nomogram‐versus‐chart method are now available.42, 45, 46, 48, 62 Computerized protocols show significant promise and would be expected to reduce dosing errors. These instruments generally present the nurse with a specific infusion rate after each monitored glucose and then recommend an interval for the next glucose determination. In direct comparisons, they tend to perform as well or often better than conventional methods. For example, in the most recent randomized trial comparing the Glucommander to a paper‐based column method in an ICU, Newton and colleagues found the computerized method reached the goal more rapidly and reached a lower mean glucose without increasing the rate of severe hypoglycemia ( 40 mg/dL).62 Computerized methods also facilitate data collection for analytical purposes.
Computerized systems (both commercial and home‐grown versions) are becoming more common and appear to hold significant benefits as long as they are backed by a validated algorithm. Whereas many institutions are not yet in a position to integrate such protocols into their standard or electronic record systems, we expect the trend for increased implementation to continue.
ENHANCING THE DESIGN OF YOUR IIP
Once the improvement team has identified and examined current order sets and protocols in the context of the literature, we encourage consolidation of institutional insulin infusion orders into a common basic structure. This basic structure should be enhanced by incorporating a variety of elements designed to enhance the reliability of use and safety of the IIP. These design features are outlined in Table 3. Randomized trial evidence of the effectiveness of these design features are largely lacking, but they are well grounded in reliability principles and common experience, and have also been recommended by others.1013, 58
| □Identifies the glycemic target range |
| □Includes clear dosing instructions with acceptable calculation requirements for nurses |
| □Incorporates glucose monitoring expectations |
| □Easy physician ordering, check box simplicity |
| □Criteria for calling the physician |
| □Includes guidance on steps to follow for interruption of nutrition |
| □States guidelines on when to initiate the infusion and when to stop |
| □Defines the insulin concentration clearly and consistently |
| □Considers changing insulin sensitivity as well as the current glucose value and rate of change in attempting to reach goal and avoid hypoglycemia |
| □Includes or refers to a standardized hypoglycemia treatment protocol and prevention protocol. |
| □Incorporates guidelines and cautions for transition to subcutaneous insulin |
| □Ideally adaptable outside of critical care unitclear definition of locations where order set is to be used. |
The orders should require a single physician signature and limited physician choices as the vehicle initiating the nurse‐driven protocol. The glycemic target range should be explicitly identified, and guidance for calling the physician and how to handle interruptions in nutrition should be embedded in the order set. Frequent monitoring of glucose levels is necessary for the safe infusion of insulin. Guidance for how often the monitoring is required must be explicit and included in the infusion order set, and standardization of documentation of the infusion rates and glucose values is highly desirable. IIPs that adjust based on the velocity of glucose change and insulin sensitivity are desirable. Certain elements may be more appropriate for some institutions than others, partly based on previous protocols and methods of practice. For example, the hypoglycemia protocol may be embedded or referred to as a separate standard of care with clear presence in the chart. The intended timing of conversion from IV to SC insulin should be included, but the actual method may be the subject of a separate order set. At other times, the conversion formula will be part of the initial intravenous order set.
IMPLEMENTATION: ADDRESSING SAFETY ISSUES
The use of insulin infusions comes with several potential hazards. Many of these potential complications can be proactively addressed, thereby minimizing accidental injuries to the patient on an insulin infusion.
Standardizing Insulin Infusion Preparations and Priming New Tubing
Varied concentrations or types of insulin for insulin infusions can lead to serious errors. Insulin infusions should generally be centrally prepared with a standard concentration of regular insulin in the pharmacy (usually 1 unit/cc), and the infusion concentration should be included in your infusion order set. Insulin binding to IV tubing can lead to false elevation of insulin requirements, potentially followed by serious hypoglycemia. When nurses change IV tubing or initially set up an insulin drip, education/emnstructions on priming new tubing with a small amount of insulin infusion to saturate the binding to the polyvinyl chloride tubing should be incorporated into their routine. Although 50 mL has often been recommended for priming, a recent study64 found that 20 mL of insulin infusion is enough to reach the saturation point.
Avoiding Over‐Reliance on the Insulin Protocol
Nurse‐driven insulin infusion protocols automate frequent insulin adjustment and reduce unnecessary calls to the physician. Although this is generally a decided advantage, the care team can be lulled into a sense of false security by the presence of orders that allow for such adjustment. Increasing the rate of an insulin infusion without thoughtful attention to factors that may be playing a role in this increased requirement (such as developing sepsis, other medical decompensation, steroid boluses, or an increase in carbohydrate intake) can have serious consequences. By the same token, an unanticipated rapid decrease in insulin requirement should lead to a reassessment of the infusion, and an inquiry about cessation of glucocorticoid therapy or nutrition. Rarely, a pharmacy or nursing error may induce a pseudo‐change in insulin requirements. The protocol should lead the nurse to seek advice and alert the physician to review potential causes of dramatic changes in insulin requirements, rather than simply adjusting insulin or nutrition to correct the present abnormal value.
Interruption of the Insulin Infusion
Interruption of insulin infusions may occur for many reasons, either intended or unintended. At times, the doctors or nurses may temporarily stop the protocol to allow for delivery of blood products or medications when IV access is limited. Infusions may mistakenly not be restarted, or deliberate discontinuation may not be adequately communicated, potentially leading to worsening hyperglycemia or even the development of ketoacidosis, and other adverse clinical outcomes. Therefore, the algorithm should have clear orders for the nurses to contact the ordering physician if the infusion is stopped for any reason, other than protocol‐driven cessation due to falling blood glucose concentrations.
Interruption of Nutrition, Field Trips, and Communication
Insulin infusion commonly provides both basal and nutritional insulin requirements. Interruptions in nutritional intake are extremely common in the inpatient setting, with a potential to cause serious hypoglycemia. Feeding tubes are often pulled out without warning; enteral nutrition may also need be halted if high gastric residuals are noted or during certain diagnostic tests. At times, IV carbohydrate sources (dextrose, partial parenteral nutrition, total parenteral nutrition) may be interrupted as well. In some cases, field trips out of the critical care units to the operating room, imaging studies, or other hospital locations add another layer of challenges to managing the IIP. Staff in these various areas may not be familiar with the IIP or monitoring standards and techniques, and potentially may not even be aware that the patient is on an insulin infusion. It is therefore crucial to anticipate these pitfalls and develop effective institutional procedures for addressing them. For example, many institutions use D10 solution to replace the carbohydrate calories that are lost when tube feedings have to be interrupted in a gram‐per‐gram fashion. Patients should be clearly identified as being on an insulin infusion. The requirement for consistent glucose monitoring, hypoglycemia recognition and treatment, and insulin infusion adjustment requires either critical care nurse care of the patient on the field trip, or training in the same skills in areas such as endoscopy, interventional radiology, and operating rooms including the preoperative and postoperative care units. In any case, all services should be involved in crafting solutions that will ensure a consistent approach to glycemic control as the patient travels off‐unit. Monitoring and treatment equipment needs to be readily available in all sites, and hypoglycemia protocols need to be distributed and supported in all areas.
Preventing and Treating Hypoglycemia
Some hypoglycemia will occur with infusion protocols, no matter how carefully a protocol is crafted and how well it is administered. Hypoglycemia protocols should therefore be incorporated directly into an infusion order set. Treatment of hypoglycemic events with a full 50 mL of D50 solution is equivalent to 25 g of carbohydrate, which will raise glucose levels in the average patient by 125 mg/dL. Many institutions discourage the overcorrection of hypoglycemic events by encouraging giving lesser aliquots of D50 based on the degree of hypoglycemia.
Preventing hypoglycemia by recognizing hypoglycemia risk factors, proper monitoring, and anticipating reductions in insulin requirements from decreasing severity of illness, nutritional intake, or steroid dosing can also reduce the frequency of hypoglycemic events.
IMPLEMENTATION: EDUCATING AND ENGAGING NURSING AND PHYSICIAN STAFF
Nursing staff generally bear the brunt of the burden on the front line of implementing intensive IIPs. Educational efforts for nurses should include the rationale for intensive insulin therapy and use of an IIP. Additionally, detailed, case‐based instruction on utilization of the IIP is required. Properly educated, nursing staff often become the strongest advocates of the IIP. In addition, they can frequently provide important input when situations arise that require troubleshooting. Regular feedback sessions early in implementation that address ease of use, clarity of orders, and difficulties encountered by nurses can be invaluable. Improvement teams need to provide frequent in‐service training and updates on the IIP selected after implementation. This is imperative to promote nursing acceptance and adherence to the IIP chosen, particularly with consideration for traveling nurses. The importance of nursing champions to design and carry out this work cannot be overstated. Educational programs focusing on the physician staff can also be very useful, particularly when focused on high‐volume physicians and influential thought leaders.
IMPLEMENTATION: ADDRESSING COMMON CLINICAL SITUATIONS
Steroids
Steroid boluses are commonly an integral part of regimens targeting a variety of conditions, such as transplant rejection, reactive airways disease, certain infections, cancer, and a variety of autoimmune disorders. This can lead to glycemic excursions and rapidly varying insulin requirements. Educational efforts and treatment regimens should address the disproportionate impact that steroids have on postprandial glycemic excursions. To minimize the glycemic impact of glucocorticoid therapy, a team should investigate promoting the use of steroid infusions in situations when a bolus is not absolutely necessary.
Dealing with the Eating Patient and Other Sources of Carbohydrate‐Induced Glycemic Excursions
Glucose levels can be difficult to control in patients who are eating while on insulin infusion, because the infusion chases the glycemic excursions through frequent adjustments, often with a late overshoot and inappropriate reduction in dose. We instead recommend providing bolus nutritional insulin to cover the expected glycemic excursion caused by carbohydrate ingestion. Carbohydrate counting and using a unit of insulin for each 10‐15 g of carbohydrate consumed can smooth out the rapid fluctuations in glucose. Guidance for this should be incorporated into the order set.
Transition Off of Insulin Infusion
Rational strategies for dealing with this transition are covered in detail elsewhere in this supplement.65 Guidance for managing this transition should be integrated into your insulin infusion and SC order sets. The transition to SC insulin may represent a separate order set but is sometimes best integrated into the IV insulin infusion order set itself.
IIPs Outside of the Critical Care Setting
IIPs are most commonly used in the critical care setting. In some institutions, IV insulin protocols are safely and effectively employed outside the ICU. Obviously, the number of nurses and other personnel who must be familiar with such protocols is much higher outside the ICU, and protocol errors are therefore likely to be somewhat higher. In addition the nurse‐per‐patient ratio is usually lower outside of the critical care setting. As a result, suggestions for safe implementation of insulin infusion regimens outside of the critical care setting include:
-
Choose an infusion protocol with a higher glycemic target.
-
Limit the medical and surgical units where this expertise will be developed.
-
Consider simplified infusion protocols but stay consistent with format.
-
Automated or computerized assistance of calculations may reduce human error and nursing burden.
ASSESSING THE IMPACT OF YOUR EFFORTS: FOLLOW‐UP AND FOLLOW‐THROUGH
Monitoring, Recording, and Analyzing Glycemic Control Data
Once the IIP is implemented, it is critical that the impact on glycemic control, hypoglycemia, insulin use, and other factors be analyzed and used for improving the IIP and care delivery. Frequent monitoring of glucose levels is necessary for the safe infusion of insulin. Guidance for how often the monitoring is required must be explicit and included in the infusion order set. Intermittent auditing for compliance with the frequency of glucose testing and appropriate dose selection is good practice. Attention should be paid to how the glucose level is obtained, recorded, and made available to the health care team in your institution. All glucose readings should be recorded electronically for ongoing analyses and retrieval, and ideally, this could be done in an automated or single‐step method. Try to eliminate duplication of effort, such as asking the nurse to record the glucose level and their reaction to it on paper and again in an electronic format. Your team should also provide guidance about the potential problems of using point‐of‐care glucose testing in settings with hypotension, sepsis, pressor use, and other conditions that may impair the accuracy of capillary glucose readings.
Reports on the time to reach the glycemic target, glycemic control while on infusion, and the incidence of hypoglycemia should be reviewed by the multidisciplinary steering committee. The Society of Hospital Medicine Glycemic Control Task Force recommends analysis by patient day and by patient stay (or insulin infusion run) as preferred methodologies for analysis of glycemic control and hypoglycemia rates over the method of using each individual glucose reading as the unit of analysis. (The latter tends to under‐value the frequency of hypoglycemia.) Detailed practical recommendations for analyzing and summarizing glycemic control data are available elsewhere in this supplement.18 These data should drive decisions on modification of glycemic targets and the protocol structure. Patients meeting prespecified criteria should be referred to the improvement team for review. For example, patients who experience any glucose readings of 40 mg/dL, or who take more than 12 hours to reach the upper limit glycemic target should be referred to the team for a case review.
Assessing Adherence to the Protocol and Ease‐of‐Use Issues
Focused audits in the pilot and early implementation phases should look for nonadherence to the protocol. Deviations should be evaluated according to the patterns identified. For example, variation in application in some cases is specific for an individual and in others is characteristic of a specific group or the whole. Accordingly, this may point to gaps in education or attitudes about the importance of this endeavor. Front‐line staff may deviate from the protocol because they find it ineffective, unsafe, or impractical for certain situations or specific patients. Many IIPs are the subject of nursing errors related to the knowledge and acceptance of the nurse but also the complexity of the protocol. Appropriate modifications to the protocol based on these cases can frequently improve the ease of use and effectiveness of the protocol. The ongoing review process should identify issues that must be addressed with permanent solutions rather than accepting frequent individual alterations to meet goals. Revisions require supplementary education and rapid and wide dissemination. Although educational efforts and monitoring are often most intense in the early implementation phase, periodic retraining should continue to achieve optimal results and safety. Educational tools must consider nursing time commitments and will often include an interactive web‐based module that gives more flexibility for trainers and clinical nurses alike.
CONCLUSIONS
Insulin infusions are a powerful clinical tool in the inpatient setting to maintain glycemic control. Many IIPs have been developed and used successfully. The institutional challenge is to select, modify, and implement the IIP to reduce hyperglycemia and improve outcomes without excess hypoglycemia. In order to accomplish this goal safely and efficiently, standardized processes and collaboration between physicians, nurses, and pharmacists are needed. The keys to minimizing errors include developing a culture of safety and cooperation, back‐up checks, standardization, automation, and robust training for all those who are involved in the care of a patient on an insulin infusion. Although we encourage standardization and the use of protocols, providers always need to consider the unique clinical circumstances and potential problems presented by each individual patient. It is important to recognize the many barriers to successful implementation of an IIP, but strategies exist to overcome these. Finally, remember that the process does not end with the development phase. Continued review is paramount to success. Note variations in use, analyze them, and learn from them, in order to continually improve the process of care.
- ,,,,,.A comparison of the activity and disposal of semi‐synthetic human insulin and porcine insulin in normal man by the glucose clamp technique.Diabetologia.1982;22(1):41–45.
- .Perioperative management of the diabetic patient.Endocrinol Metab Clin North Am.1992;21(2):457–475.
- ,.Pregnancy in the diabetic woman. Guidelines for a successful outcome.Endocrinol Metab Clin North Am.1992;21(2):433–456.
- ,,,.Continuous intravenous insulin infusion reduces the incidence of deep sternal wound infection in diabetic patients after cardiac surgical procedures.Ann Thorac Surg.1999;67(2):352–360; discussion 360–362.
- ,,, et al.Continuous insulin infusion reduces mortality in patients with diabetes undergoing coronary artery bypass grafting.J Thorac Cardiovasc Surg.2003;125(5):1007–1021.
- .Effect of an intensive glucose management protocol on the mortality of critically ill adult patients.Mayo Clin Proc.2004;79(8):992–1000.
- ,,, et al.Intensive insulin therapy in the critically ill patients.N Engl J Med.2001;345(19):1359–1367.
- American College of Endocrinology Position Statement on Inpatient Diabetes and Metobolic Control.Endocr Pract.2004;10(suppl 2):5–9.
- ,.Current controversies around tight glucose control in critically ill patients.Curr Opin Clin Nutr Metab Care.2007;10(2):206–209.
- American Society of Health‐System Pharmacists and the Hospital and Health‐System Association of Pennsylvania. Recommendations for Safe Use of Insulin in Hospitals. http://www.ashp.org/s_ashp/docs/files/Safe_Use_of_Insulin.pdf. Accessed September 5,2008.
- ,,, et al.Management of diabetes and hyperglycemia in hospitals.Diabetes Care.2004;27(2):553–591.
- Joint Commission. Disease Specific‐Care Certification. http://www.jointcommission.org/CertificationPrograms. Accessed September 5,2008.
- American College of Endocrinology and American Diabetes Association consensus statement on inpatient diabetes and glycemic control: a call to action.Diabetes Care2006;29(8):1955–1962.
- Standards of medical care in diabetes–2008.Diabetes Care2008;31(Suppl 1):S12–S54.
- ,,.Continuous insulin infusion improves postoperative glucose control in patients with diabetes mellitus undergoing coronary artery bypass surgery.Tex Heart Inst J.2006;33(4):445–451.
- ,,,,.A practical approach to hyperglycemia management in the intensive care unit: evaluation of an intensive insulin infusion protocol.Pharmacotherapy.2006;26(10):1410–1420.
- ,,,,,.Standardization of intravenous insulin therapy improves the efficiency and safety of blood glucose control in critically ill adults.Intensive Care Med.2004;30(5):804–810.
- ,,,,,.SHM Glycemic Control Task Force summary: practical recommendations for assessing the impact of glycemic control efforts.J Hosp Med supplement. In press.
- ,,,.Introducing intensive insulin therapy: the nursing perspective.Nurs Crit Care.2006;11(2):75–79.
- .Evaluation of nursing work effort and perceptions about blood glucose testing in tight glycemic control.Am J Crit Care. Jul2006;15(4):370–377.
- ,,, et al.Intensive insulin therapy in the medical ICU.N Engl J Med.2006;354(5):449–461.
- ,,.Effect of hyperglycemia and continuous intravenous insulin infusions on outcomes of cardiac surgical procedures: the Portland Diabetic Project.Endocr Pract.2004;10(Suppl 2):21–33.
- ,,, et al.Implementation of a safe and effective insulin infusion protocol in a medical intensive care unit.Diabetes Care.2004;27(2):461–467.
- ,,, et al.Improving glycemic control in the cardiothoracic intensive care unit: clinical experience in two hospital settings.J Cardiothorac Vasc Anesth.2004;18(6):690–697.
- ,,, et al.Inpatient management of hyperglycemia: the Northwestern experience.Endocr Pract.2006;12(5):491–505.
- ,,, et al.Performance of a dose‐defining insulin infusion protocol among trauma service intensive care unit admissions.Diabetes Technol Ther.2006;8(4):476–488.
- ,,.Glucommander: a computer‐directed intravenous insulin system shown to be safe, simple, and effective in 120,618 h of operation.Diabetes Care.2005;28(10):2418–2423.
- ,,, et al.Description and evaluation of a glycemic management protocol for patients with diabetes undergoing heart surgery.Endocr Pract.2002;8(1):10–18.
- ,,,,,.Tight glycemic control in diabetic coronary artery bypass graft patients improves perioperative outcomes and decreases recurrent ischemic events.Circulation.2004;109(12):1497–1502.
- ,,,.Practical management of diabetes in critically ill patients.Am J Respir Crit Care Med.2001;164(10 Pt 1):1763–1767.
- ,,,.Postoperative management of diabetes mellitus: steady‐state glucose control with bedside algorithm for insulin adjustment.Diabetes Care.1987;10(6):722–728.
- ,,,,.Glucose‐insulin‐potassium solutions improve outcomes in diabetics who have coronary artery operations.Ann Thorac Surg.2000;70(1):145–150.
- ,,, et al.Randomized trial of insulin‐glucose infusion followed by subcutaneous insulin treatment in diabetic patients with acute myocardial infarction (DIGAMI study): effects on mortality at 1 year.J Am Coll Cardiol.1995;26(1):57–65.
- ,.Eliminating the diabetic disadvantage: the Portland Diabetic Project.Semin Thorac Cardiovasc Surg.2006;18(4):302–308.
- ,,.Validation of an insulin infusion nomogram for intensive glucose control in critically ill patients.Pharmacotherapy.2005;25(3):352–359.
- ,,,,.Achieving tight glycemic control in the operating room: lessons learned from 12 years in the trenches of a paradigm shift in anesthetic care.Semin Thorac Cardiovasc Surg.2006;18(4):339–345.
- ,,.The rationale and management of hyperglycemia for in‐patients with cardiovascular disease: time for change.J Clin Endocrinol Metab.2003;88(6):2430–2437.
- ,,,,.An insulin infusion protocol in critically ill cardiothoracic surgery patients.Ann Pharmacother.2004;38(7–8):1123–1129.
- ,,, et al.Efficacy and safety of an insulin infusion protocol in a surgical ICU.J Am Coll Surg.2006;202(1):1–9.
- ,,,.Implementation of a tight glycaemic control protocol using a web‐based insulin dose calculator.Anaesthesia.2005;60(11):1093–1100.
- ,,,.Intensive insulin therapy to non‐cardiac ICU patients: a prospective study.Eur J Anaesthesiol.2006;23(8):705–709.
- ,,, et al.Blood glucose control by a model predictive control algorithm with variable sampling rate versus a routine glucose management protocol in cardiac surgery patients: a randomized controlled trial.J Clin Endocrinol Metab.2007;92(8):2960–2964.
- ,,, et al.Outcomes of a cardiothoracic intensive care web‐based online intravenous insulin infusion calculator study at a medical university hospital.Diabetes Technol Ther.2007;9(6):523–534.
- ,,,.Rush University guidelines and protocols for the management of hyperglycemia in hospitalized patients: elimination of the sliding scale and improvement of glycemic control throughout the hospital.Diabetes Educ.2006;32(6):954–962.
- ,,,.Collaborative development of an insulin nomogram for intensive insulin therapy.Crit Care Nurs Q.2006;29(1):96–105.
- ,,, et al.Computer‐based insulin infusion protocol improves glycemia control over manual protocol.J Am Med Inform Assoc.2007;14(3):278–287.
- ,,, et al.Implementing an intravenous insulin infusion protocol in the intensive care unit.Am J Health Syst Pharm.2007;64(4):385–395.
- ,,,,.Use of a computerized guideline for glucose regulation in the intensive care unit improved both guideline adherence and glucose regulation.J Am Med Inform Assoc.2005;12(2):172–180.
- ,,, et al.Improving hyperglycemia management in the intensive care unit: preliminary report of a nurse‐driven quality improvement project using a redesigned insulin infusion algorithm.Diabetes Educ.2006;32(3):394–403.
- ,,.Clinical results of an updated insulin infusion protocol in critically ill patients.Diabetes Spectrum.2005;18(1):28–33.
- ,,.Insulin therapy for critically ill hospitalized patients: a meta‐analysis of randomized controlled trials.Arch Intern Med.2004;164(18):2005–2011.
- ,,.Intensive insulin therapy in critical care: a review of 12 protocols.Diabetes Care.2007;30(4):1005–1011.
- ,,.Hypoglycemia in the intensive care unit.Curr Opin Clin Nutr Metab Care.2007;10(2):193–196.
- ,,.Insulin infusion protocols for critically ill patients: a highlight of differences and similarities.Endocr Pract.2007;13(2):137–146.
- ,,.Effect of hyperglycemia and continuous intravenous insulin infusions on outcomes of cardiac surgical procedures: the Portland Diabetic Project.Endocr Pract.2004;10(Suppl 2):21–33.
- Providence Health 10(Suppl 2):71–80.
- .Memoirs of a root canal salesman: the successful implementation of a hospital‐wide intravenous insulin infusion protocol.Endocr Pract.2006;12(Suppl 3):79–85.
- ,,, et al.Intensive insulin therapy and pentastarch resuscitation in severe sepsis.N Engl J Med.2008;358(2):125–139.
- ,.Severe hypoglycemia in critically ill patients: risk factors and outcomes.Crit Care Med.2007;35(10):2262–2267.
- ,,.Evidence for strict inpatient blood glucose control: time to revise glycemic goals in hospitalized patients.Metabolism.2008;57(1):116–120.
- ,,, et al.Comparison of insulin infusion protocols in the ICU: computer‐guided versus standard column‐based insulin regimens [Abstract]. American Diabetes Association abstract,2008.
- ,,.Design and implementation of GRIP: a computerized glucose control system at a surgical intensive care unit.BMC Med Inform Decis Mak.2005;5:38.
- ,,, et al.“Waste not, want not”: determining the optimal priming volume for intravenous infusions.Diabetes Technol Ther.2006;8(5):598–601.
- ,,,.Bridge over troubled waters: safe and effective transitions of the inpatient with hyperglycemia.J Hosp Med supplement. In press.
The delayed and variable absorption of subcutaneous (SC) insulin has always provided challenges for the rapid and predictable control of hyperglycemia in the acute care setting. Conversely, intravenous infusion of human regular insulin provides a continuous and essentially immediate delivery mechanism. Once in the circulation, insulin has a very short half‐life of about 5 to 7 minutes and a biological effect of about 20 minutes.1 Intravenous insulin infusions are well‐established in several acute care settings including hyperglycemic emergencies, perioperative glucose management, and glucose control during labor and delivery.2, 3
The beneficial effects seen in early trials of strict glycemic control involving intensive care unit (ICU) patients47 (particularly cardiac surgery patients) and guidelines for inpatient glycemic control8 stimulated widespread interest in adopting insulin infusion protocols (IIPs) focused on achieving strict glycemic targets. The initial enthusiasm has been tempered by uneven results in trials of tight glycemic control, concerns about the effects of excessive hypoglycemia, and the resources needed to implement and maintain an IIP.9 Although considerable controversy about the ideal glycemic target for different patient populations exists, and will likely continue for some time, this article is not a review of the evidence for supporting 1 glycemic target versus another. Regardless of the glycemic target chosen, a standardized algorithm and accompanying program of monitoring are widely endorsed for both safety and quality reasons.1014 Most medical centers are at least attempting to implement nurse‐driven protocols that have demonstrated better perfomance than SC regimens15 and physician‐driven insulin infusions.16, 17 In this article, we outline several variables in IIP design and implementation and endorse several aspects of design and implementation that will likely result in improved staff acceptance and, ultimately, a more safe and effective IIP.
PREPARING TO IMPLEMENT AN IIP
Building The Team
Implementing a medical centerwide standardized insulin infusion order set with supporting policies, protocols, monitoring standards, and the requisite educational programs is a major task for any hospital. This is not a simple maneuver involving only 1 or 2 interested individuals and requires much more than selecting a published protocol and disseminating it to various patient care units. Instead, to manage the full spectrum of diabetes programs and protocols, an institution must convene a multidisciplinary steering committee or task force. This should include representation from nursing, nursing administration, pharmacy, nutrition services, and the quality improvement department. Physicians should include hospitalists, intensivists, and endocrinologists but may also involve anesthesiologists and surgeons, as applicable. At times, additional members may need to be recruited according to project needs.
Identifying the Stakeholders and Current Practices
In developing or improving currently utilized IIPs, the multidisciplinary committee would benefit from careful background work before moving forward. First, administrative and institutional support must be secured to endorse uniform standards for insulin infusions, and to provide the important infrastructure needed to facilitate the work involved. Clinical and administrative stakeholders from the key departments then need to be identified.
All insulin infusion orders and policies/procedures presently used in the institution should be identified and examined. The developers and/or users of these order sets should be engaged in a dialogue and encouraged to share their experiences regarding their current practice and the attendant work flow, glucose monitoring, and data collection and reporting. Immediate concerns should be clearly addressed. Measurement systems for glycemic control, hypoglycemia, and insulin use patterns should assess current practice and the impact of subsequent modifications of the protocol or initiation of new protocols. We recommend using glucometrics consistent with those endorsed by the Society of Hospital Medicine (SHM) Glycemic Control Task Force elsewhere in this supplement.18
Addressing the Burden of Change
Through this process, the committee will uncover barriers, dysfunctional and inconsistent practices, and individuals who will pose challenges. Identifying these issues should not discourage the team, but rather it should guide the interventional strategies, and help build consensus that change may be required. There must be caution not to exclude significant individuals simply because they resist changes. Indeed, if they are included and have the opportunity to contribute to the process, success is much more likely.
It is important for process leaders to understand the implications of what is proposed, particularly for nursing services.19 For example, it has been shown that IIPs require about 5 minutes per patient per hour for glucose monitoring and dose adjustments.20 Acknowledging and attempting to address this burden proactively (often well over 2 hours per day) can gain staff acceptance more effectively than a laissez faire approach. In this regard, some effort should be invested in nursing education of the benefits of tight glycemic management on critical care outcomes. The difficult‐to‐quantify work involved when patients' blood glucose is not well controlled (eg, paging physicians for stat insulin orders) should also be part of this discussion.
Identifying and Addressing Barriers to IIP implementation
There are numerous potential barriers to implementation of IIPs. Table 1 identifies some of the most frequent ones along with potential strategies or solutions. Very common barriers include skepticism surrounding the benefits of tight glycemic control, fear of hypoglycemia, and difficulty agreeing on glycemic targets.
| Barrier | Strategy/Solution |
|---|---|
| Insufficient glucose meters to accommodate the increased testing needs | Purchase additional glucose meters. |
| Ask the vendor to provide extra on‐site replacement meters at no charge until they are activated. | |
| Nursing time requirements involved in monitoring and adjustments. | Get ancillary help to check glucose values |
| ○eg, nurse assistants | |
| Make extra efforts to make protocols clear with few required calculations | |
| Avoid duplicate recording | |
| Consider meters requiring shorter time and a smaller sample (to avoid need for re‐sampling) | |
| Requirement for uncomfortable frequent sticks | Utilize central lines or arterial lines. |
| ○These tend to vary by 10% from POC readings | |
| ○May not be available in noncritical care settings | |
| Staff fear of hypoglycemia | Educate on the benefit of glucose control and the true definition of hypoglycemia |
| ○Measure staff fasting glucose levels to demonstrate normal range. | |
| Establish metrics and publicly report hypoglycemia event rates. | |
| Pilot IIP on small scale. | |
| Protocol and education for prevention of hypoglycemia. | |
| Difficulty gaining consensus on glycemic target | Compromise if needed on the glucose target |
| ○eg, start with a higher goal such as 90‐140 mg/dL. | |
| ○Others will be willing to lower the goal when feasibility is seen. | |
| Allow for different targets in different units if indicated | |
| ○maintain consistency in other respects. | |
| Focal points of resistance | Identify a local nurse or physician champion within resistant site. |
| Pilot the protocol in an area with least resistance | |
| ○Will gain momentum with initial success and adjustments | |
| Lack of integrated information and reporting systems | Incorporate information systems personnel onto team |
| Advocate for improved reporting capability with administrative leaders | |
| Use sampling methods to collect data until automated systems are available. | |
| Multiple providers, hand offs, and opportunities for error and communication breakdown, diffusion of responsibility for glycemic control | Involvement of varied front line providers |
| Check lists for important items to communicate on transfer/transport | |
| Common protocols/education for similar units |
Whereas the national guidelines call for a glycemic target in critical care areas with an upper limit of 110 mg/dL, there is room for debate, and tailoring of the glycemic target to fit individual patient circumstances is often advisable. Starting with a less aggressive glycemic target can be good politics (and perhaps good medicine as well). Once the higher glycemic targets are achieved safely, it can pave the way for a more aggressive approach.
Fear of hypoglycemia is one of the most potent barriers to intensive insulin infusion implementation. Because hyperglycemia is such a common condition in critical care units, nursing and physician staff may have developed a skewed view of the definition of hypoglycemia, at times fearing for their patient when the glucose values reach a level of 100 mg/dL or so. Polling the nurses on what they think their own fasting glucose levels are, and then actually measuring them can be an effective strategy (the nurses may be surprised that the patient's scary 90 mg/dL reading is higher than their own). It should also be emphasized that properly designed and implemented protocols may actually decrease the incidence of hypoglycemia when compared to standard care which may involve individually and sometimes improperly adjusted intravenous (IV) insulin (discussed further below).
CHOOSING AN IIP FOR YOUR HOSPITAL
See Table 2 for a comparison of several features identified in selected published protocols.7, 2127 This is not a comprehensive list of all protocols found in the literature. Rather, the authors consider it representative of the various types of IIPs or best recognized IIPs in the literature. Note that there is variability in study population, the glucose targets, hypoglycemia, the time to reach the target, and the time spent in the target range. Other practical factors to consider in reviewing the literature and selecting an IIP design are the complexity of the protocol, the required process steps or calculations, the evidence for staff acceptance, and the level of resources supporting the published protocol.
| Author (reference) | IIP Description | Patient population | Glucose Target (mg/dL) | Mean Glucose (mg/dL) | Time to Reach Target | Hypoglycemia |
|---|---|---|---|---|---|---|
| Van den Berghe7 | Initial and subsequent rates based on BG | Surgical ICU | 80‐110 | 6 AM glucose 103 19 | Not reported | 5.1% of patient 41 mg/dL |
| Nurses had latitude | ||||||
| Van den Berghe21 | TPN standard with IIP | Medical ICU | 80‐110 | 6 AM glucose 105 | Not reported | 19% of patients 41 mg/dL |
| Furnary22 (2001‐2003 version) | Initial dose determined by BG and type of DM | CABG | 100‐150 (there is a newer protocol with lower targets) | Not mentioned. Appears to be 150 | 94% within 3 hours | 0.5% 60 (% of readings?) Not reported with any specificity |
| Changes based on present BG and last change | ||||||
| Relatively complex | ||||||
| Goldberg23 | Dosing based on: | MICU | 100‐139 | Not specified | 10.1 hours | 0.3% of readings 60 BG 60 in 5.4% of patient days |
| ○Current BG | ||||||
| ○Velocity of glucose change | ||||||
| Goldberg24 | ○Infusion rate | CT Surgery | 100‐139 | 122 17 Once target attained. | 5 hours | 0.2% of all BGs 60 mg/Dl BG 60 in 2.9% of patient days |
| Uses 3 tables | ||||||
| Relatively complex | ||||||
| DeSantis25 | Initial dose based on BG | Mostly surgical ICU and CVICU (75% surgical) | 80‐110 | 135 49 (higher in SICU and CVICU alone) | 10.6 hours | 1.5% of readings |
| 60 mg/dL (lower for CVICU & SICU alone) | ||||||
| Changes based on present glucose and rate of change. | ||||||
| IV bolus used with changes. | ||||||
| Braithwaite26 | 6‐column method | Trauma ICU | 110 mg/dL | 129 25 | 16.7 hours | 2.4% of readings 70 mg/dL |
| Davidson27 | Computer‐directed algorithm (similar to column method) | Full spectrum | Varied by year and situation | Not reported (approximately 125 mg/dL when stable) | 90% 150 mg/dL in 3 hours | 0.6% of readings 50 mg/dL 2.6% of patients |
Structural Differences in Protocols
Protocols that vary by level of insulin sensitivity generally use column methods with the individual columns representing different categories of insulin sensitivity, placing the most sensitive category on the left with the highest level of insulin resistance on the far right. These methods use a multiplier to adjust for sensitivity. They are constructed according to the rule of 1500, 1700, or 1800, thereby adjusting for changes in insulin sensitivity that follow surgery or other changes in physiologic stress in the acute setting. Rate of change is addressed by shifting to the right if correction of hyperglycemia is too slow and to the left if the glucose is dropping too rapidly.
Most institutions using the column/emnsulin sensitivity method, implement paper orders as first published by Markovitz.28 The same concepts have been used to develop computer‐assisted insulin infusion protocols. One published method is the Glucommander,27 but a number of institutions are using similar computer‐assisted methods developed locally.
Other methods use the present glucose and change from last glucose to constantly adjust to any situation.7, 2125 They usually involve 2 or 3 steps and often require more calculations by the nurse. These methods are purported to be more agile or flexible but there have been no direct comparisons with the column methods looking at effectiveness, nursing errors, or hypoglycemic risk. The Yale Protocol23, 24 and the Portland Protocol22 are 2 prominent examples of this type of protocol. Adjustments are defined as units, percent change, or a combination of both.
Limitations of the IIP Literature
There had been few published insulin protocols aimed at reaching specific glucose goals when the Leuven surgical ICU experience7 was published in 2001. These early publications featured algorithms that adjusted insulin infusions solely on the basis of glucose level, and did not take the velocity of change, direction of change, proximity to glycemic target, or different insulin sensitivities into account. Also, the targeted glucose goals in those reports were not consistent with the present standards.2931 Other published protocols featured glucose‐insulin‐potassium infusion (GIK) protocols that focused on the amount of insulin administered and failed to attain appropriately defined glucose targets.32, 33 These publications offer no real guidance in crafting a modern glycemic targetoriented protocol.
Whereas more than 20 modern IIPs directed at glycemic targets have been published,7, 1517, 2127, 3450 many of the published protocols represent local modifications of ones previously published elsewhere, and no published, prospective, head‐to‐head comparisons of the best‐known IIPs are available.
Several reviews of previous published reports include comparisons of IIPs with varied areas of emphasis.5154 The reliability of such comparisons is limited by the inconsistency in methodology between studies and the different populations studied. For example, medical populations are generally harder to control and are more prone to hypoglycemia than surgical populations,7, 21, 23, 24, 50 and some studies include only patients with diabetes.4, 5, 38 In addition, definitions of hypoglycemia and methods of analyzing glycemic control are highly variable, making comparisons of IIPs challenging.39 As a result, attempts to compare published IIP results without consideration of the population studied could lead to erroneous conclusions.
In spite of the aforementioned limitations, there are several lessons we can learn from the IIP literature and accumulated clinical experience at a variety of centers.
Glycemic Targets and Other IIP Features Can Evolve over Time
Revisions of protocol details, including glycemic targets, often evolve over time. This deliberate approach can facilitate staff acceptance by demonstrating safe achievement of higher glycemic targets. The Yale team initially selected a conservative glycemic target of 100‐139 mg/dL, as depicted in Table 1.23, 24 They subsequently lowered the target range to 90‐119 mg/dL and increased the initial insulin bolus amount by 40%.50 The modified protocol displayed improved performance and yet retained safety, with only 1 glucose reading 40 mg/dL in 101 patients over 117 runs of insulin infusion.
The Portland Protocol, used primarily in cardiac surgery patients, has also evolved over time. This group has altered the IIP in a number of ways at least 4 times. These protocols, including the most recent protocol targeting glucose levels of 70‐110 mg/dL, is found at
Medical and Surgical Patients Are Different
The most convincing evidence for stringent glycemic control evolved from studies of surgical patients.4, 5, 7 Acknowledging this fact, along with the greater degree of difficulty in achieving glycemic targets safely in critically ill medical patients, have led many to endorse higher glycemic targets for certain populations than others.57 Although we generally favor a uniform glycemic target for a unit serving a particular patient population, adopting a less stringent glycemic target in medical ICU settings compared to surgical ICU settings is reasonable and prudent in many institutional settings. However, the accompanying challenges regarding boarding patients and floating nurses between units would also need to be considered.
Local Factors and Implementation Methods Matter
The success or failure of a protocol likely depends on local factors and implementation methods as much as it does on the structure of the protocol itself. IIP development and implementation is a process that must be approached systematically and with attention to detail.19 Errors in approach can delay or abort the implementation, or potentially lead to an ineffective or unsafe protocol for the institution.
The Yale experience again provides us with a salient example.58 Initial efforts to implement an IIP failed due to a number of factors: a complicated protocol, insufficient nursing involvement, and inadequate training and education led to incomplete buy‐in, and nursing concerns over hypoglycemia that actually was within the goal range of the protocol. Successful implementation was not achieved until the leaders learned from their mistakes. Nurses and other clinical allies were involved and educated. Important stakeholders, who were not included earlier, were now involved, and front‐line nursing staff were engaged in proactive troubleshooting.
In another example, multisite studies like VISEP59 and Glucontrol9 have tried to adapt the Leuven protocol, only to struggle with excessive hypoglycemia and an inability to replicate the tight glycemic control enjoyed by van den Berghe and colleagues.7, 21 The Leuven care team augmented the performance of the IIP by their experience with the protocol, physician involvement, and adjustments made by the nursing staff.
Some IIPs Have Lower Hypoglycemia Rates than Others
Recent articles have highlighted the association of intensive insulin treatment, hypoglycemia, and mortality in the medical ICU population.60 Concerns that excessive hypoglycemia could reduce or reverse the overall benefits of intensive insulin therapy has led some to call for moderation of critical care glycemic targets.61 Comparisons of IIPs5254, 61 that include information about the propensity of the IIP to produce hypoglycemia are therefore important.
The Leuven IIP has been reported to yield high rates of hypoglycemia with almost 20% of patients suffering from severe hypoglycemia (glucose 40 mg/dL) in some studies.9, 21, 59 By way of contrast, several different IIP regimens have frequently achieved identical or very similar glycemic control with less than 5% of the patients experiencing severe hypoglycemia.27, 50, 62 Although implementation factors, severity of illness, and other population factors play some role, some protocols have an inherent structural propensity to produce more hypoglycemia than others. In the case of the Leuven protocol, there is more of a role for clinician adjustment, and the written protocol itself does not call for much active adjustment as the patient enters into the hypoglycemic range.52 In contrast, more sophisticated and complicated regimens adjust more aggressively in this range and consistently induce less hypoglycemia.
Successful Methods to Manage the Complexity of an IIP
Many modern IIPs use bolus insulin to expedite control and adjust the infusion rate based on the velocity and direction of glucose change, not just the glucose value.52 Insulin resistance is taken into account in some models, and multiple calculation steps are required in several reported protocols.52 The improved automation and control refinements come at a cost of increased complexity.
Intensive implementation efforts and strong leadership can overcome some issues, as demonstrated by the Yale experience, but 2 other strategies have commonly demonstrated success. First, focused expert glycemic management teams that directly oversee many aspects of the IIP, or even assume direct management roles, can be quite effective,25 especially during early implementation.
Automation of calculations and computerization is another method to consider, and many recent reports involve applications of web‐based or other computerized models.27, 40, 42, 43, 46, 48, 63 Comparisons of computerized versus manual methods, computerized versus column methods, and a computerized nomogram‐versus‐chart method are now available.42, 45, 46, 48, 62 Computerized protocols show significant promise and would be expected to reduce dosing errors. These instruments generally present the nurse with a specific infusion rate after each monitored glucose and then recommend an interval for the next glucose determination. In direct comparisons, they tend to perform as well or often better than conventional methods. For example, in the most recent randomized trial comparing the Glucommander to a paper‐based column method in an ICU, Newton and colleagues found the computerized method reached the goal more rapidly and reached a lower mean glucose without increasing the rate of severe hypoglycemia ( 40 mg/dL).62 Computerized methods also facilitate data collection for analytical purposes.
Computerized systems (both commercial and home‐grown versions) are becoming more common and appear to hold significant benefits as long as they are backed by a validated algorithm. Whereas many institutions are not yet in a position to integrate such protocols into their standard or electronic record systems, we expect the trend for increased implementation to continue.
ENHANCING THE DESIGN OF YOUR IIP
Once the improvement team has identified and examined current order sets and protocols in the context of the literature, we encourage consolidation of institutional insulin infusion orders into a common basic structure. This basic structure should be enhanced by incorporating a variety of elements designed to enhance the reliability of use and safety of the IIP. These design features are outlined in Table 3. Randomized trial evidence of the effectiveness of these design features are largely lacking, but they are well grounded in reliability principles and common experience, and have also been recommended by others.1013, 58
| □Identifies the glycemic target range |
| □Includes clear dosing instructions with acceptable calculation requirements for nurses |
| □Incorporates glucose monitoring expectations |
| □Easy physician ordering, check box simplicity |
| □Criteria for calling the physician |
| □Includes guidance on steps to follow for interruption of nutrition |
| □States guidelines on when to initiate the infusion and when to stop |
| □Defines the insulin concentration clearly and consistently |
| □Considers changing insulin sensitivity as well as the current glucose value and rate of change in attempting to reach goal and avoid hypoglycemia |
| □Includes or refers to a standardized hypoglycemia treatment protocol and prevention protocol. |
| □Incorporates guidelines and cautions for transition to subcutaneous insulin |
| □Ideally adaptable outside of critical care unitclear definition of locations where order set is to be used. |
The orders should require a single physician signature and limited physician choices as the vehicle initiating the nurse‐driven protocol. The glycemic target range should be explicitly identified, and guidance for calling the physician and how to handle interruptions in nutrition should be embedded in the order set. Frequent monitoring of glucose levels is necessary for the safe infusion of insulin. Guidance for how often the monitoring is required must be explicit and included in the infusion order set, and standardization of documentation of the infusion rates and glucose values is highly desirable. IIPs that adjust based on the velocity of glucose change and insulin sensitivity are desirable. Certain elements may be more appropriate for some institutions than others, partly based on previous protocols and methods of practice. For example, the hypoglycemia protocol may be embedded or referred to as a separate standard of care with clear presence in the chart. The intended timing of conversion from IV to SC insulin should be included, but the actual method may be the subject of a separate order set. At other times, the conversion formula will be part of the initial intravenous order set.
IMPLEMENTATION: ADDRESSING SAFETY ISSUES
The use of insulin infusions comes with several potential hazards. Many of these potential complications can be proactively addressed, thereby minimizing accidental injuries to the patient on an insulin infusion.
Standardizing Insulin Infusion Preparations and Priming New Tubing
Varied concentrations or types of insulin for insulin infusions can lead to serious errors. Insulin infusions should generally be centrally prepared with a standard concentration of regular insulin in the pharmacy (usually 1 unit/cc), and the infusion concentration should be included in your infusion order set. Insulin binding to IV tubing can lead to false elevation of insulin requirements, potentially followed by serious hypoglycemia. When nurses change IV tubing or initially set up an insulin drip, education/emnstructions on priming new tubing with a small amount of insulin infusion to saturate the binding to the polyvinyl chloride tubing should be incorporated into their routine. Although 50 mL has often been recommended for priming, a recent study64 found that 20 mL of insulin infusion is enough to reach the saturation point.
Avoiding Over‐Reliance on the Insulin Protocol
Nurse‐driven insulin infusion protocols automate frequent insulin adjustment and reduce unnecessary calls to the physician. Although this is generally a decided advantage, the care team can be lulled into a sense of false security by the presence of orders that allow for such adjustment. Increasing the rate of an insulin infusion without thoughtful attention to factors that may be playing a role in this increased requirement (such as developing sepsis, other medical decompensation, steroid boluses, or an increase in carbohydrate intake) can have serious consequences. By the same token, an unanticipated rapid decrease in insulin requirement should lead to a reassessment of the infusion, and an inquiry about cessation of glucocorticoid therapy or nutrition. Rarely, a pharmacy or nursing error may induce a pseudo‐change in insulin requirements. The protocol should lead the nurse to seek advice and alert the physician to review potential causes of dramatic changes in insulin requirements, rather than simply adjusting insulin or nutrition to correct the present abnormal value.
Interruption of the Insulin Infusion
Interruption of insulin infusions may occur for many reasons, either intended or unintended. At times, the doctors or nurses may temporarily stop the protocol to allow for delivery of blood products or medications when IV access is limited. Infusions may mistakenly not be restarted, or deliberate discontinuation may not be adequately communicated, potentially leading to worsening hyperglycemia or even the development of ketoacidosis, and other adverse clinical outcomes. Therefore, the algorithm should have clear orders for the nurses to contact the ordering physician if the infusion is stopped for any reason, other than protocol‐driven cessation due to falling blood glucose concentrations.
Interruption of Nutrition, Field Trips, and Communication
Insulin infusion commonly provides both basal and nutritional insulin requirements. Interruptions in nutritional intake are extremely common in the inpatient setting, with a potential to cause serious hypoglycemia. Feeding tubes are often pulled out without warning; enteral nutrition may also need be halted if high gastric residuals are noted or during certain diagnostic tests. At times, IV carbohydrate sources (dextrose, partial parenteral nutrition, total parenteral nutrition) may be interrupted as well. In some cases, field trips out of the critical care units to the operating room, imaging studies, or other hospital locations add another layer of challenges to managing the IIP. Staff in these various areas may not be familiar with the IIP or monitoring standards and techniques, and potentially may not even be aware that the patient is on an insulin infusion. It is therefore crucial to anticipate these pitfalls and develop effective institutional procedures for addressing them. For example, many institutions use D10 solution to replace the carbohydrate calories that are lost when tube feedings have to be interrupted in a gram‐per‐gram fashion. Patients should be clearly identified as being on an insulin infusion. The requirement for consistent glucose monitoring, hypoglycemia recognition and treatment, and insulin infusion adjustment requires either critical care nurse care of the patient on the field trip, or training in the same skills in areas such as endoscopy, interventional radiology, and operating rooms including the preoperative and postoperative care units. In any case, all services should be involved in crafting solutions that will ensure a consistent approach to glycemic control as the patient travels off‐unit. Monitoring and treatment equipment needs to be readily available in all sites, and hypoglycemia protocols need to be distributed and supported in all areas.
Preventing and Treating Hypoglycemia
Some hypoglycemia will occur with infusion protocols, no matter how carefully a protocol is crafted and how well it is administered. Hypoglycemia protocols should therefore be incorporated directly into an infusion order set. Treatment of hypoglycemic events with a full 50 mL of D50 solution is equivalent to 25 g of carbohydrate, which will raise glucose levels in the average patient by 125 mg/dL. Many institutions discourage the overcorrection of hypoglycemic events by encouraging giving lesser aliquots of D50 based on the degree of hypoglycemia.
Preventing hypoglycemia by recognizing hypoglycemia risk factors, proper monitoring, and anticipating reductions in insulin requirements from decreasing severity of illness, nutritional intake, or steroid dosing can also reduce the frequency of hypoglycemic events.
IMPLEMENTATION: EDUCATING AND ENGAGING NURSING AND PHYSICIAN STAFF
Nursing staff generally bear the brunt of the burden on the front line of implementing intensive IIPs. Educational efforts for nurses should include the rationale for intensive insulin therapy and use of an IIP. Additionally, detailed, case‐based instruction on utilization of the IIP is required. Properly educated, nursing staff often become the strongest advocates of the IIP. In addition, they can frequently provide important input when situations arise that require troubleshooting. Regular feedback sessions early in implementation that address ease of use, clarity of orders, and difficulties encountered by nurses can be invaluable. Improvement teams need to provide frequent in‐service training and updates on the IIP selected after implementation. This is imperative to promote nursing acceptance and adherence to the IIP chosen, particularly with consideration for traveling nurses. The importance of nursing champions to design and carry out this work cannot be overstated. Educational programs focusing on the physician staff can also be very useful, particularly when focused on high‐volume physicians and influential thought leaders.
IMPLEMENTATION: ADDRESSING COMMON CLINICAL SITUATIONS
Steroids
Steroid boluses are commonly an integral part of regimens targeting a variety of conditions, such as transplant rejection, reactive airways disease, certain infections, cancer, and a variety of autoimmune disorders. This can lead to glycemic excursions and rapidly varying insulin requirements. Educational efforts and treatment regimens should address the disproportionate impact that steroids have on postprandial glycemic excursions. To minimize the glycemic impact of glucocorticoid therapy, a team should investigate promoting the use of steroid infusions in situations when a bolus is not absolutely necessary.
Dealing with the Eating Patient and Other Sources of Carbohydrate‐Induced Glycemic Excursions
Glucose levels can be difficult to control in patients who are eating while on insulin infusion, because the infusion chases the glycemic excursions through frequent adjustments, often with a late overshoot and inappropriate reduction in dose. We instead recommend providing bolus nutritional insulin to cover the expected glycemic excursion caused by carbohydrate ingestion. Carbohydrate counting and using a unit of insulin for each 10‐15 g of carbohydrate consumed can smooth out the rapid fluctuations in glucose. Guidance for this should be incorporated into the order set.
Transition Off of Insulin Infusion
Rational strategies for dealing with this transition are covered in detail elsewhere in this supplement.65 Guidance for managing this transition should be integrated into your insulin infusion and SC order sets. The transition to SC insulin may represent a separate order set but is sometimes best integrated into the IV insulin infusion order set itself.
IIPs Outside of the Critical Care Setting
IIPs are most commonly used in the critical care setting. In some institutions, IV insulin protocols are safely and effectively employed outside the ICU. Obviously, the number of nurses and other personnel who must be familiar with such protocols is much higher outside the ICU, and protocol errors are therefore likely to be somewhat higher. In addition the nurse‐per‐patient ratio is usually lower outside of the critical care setting. As a result, suggestions for safe implementation of insulin infusion regimens outside of the critical care setting include:
-
Choose an infusion protocol with a higher glycemic target.
-
Limit the medical and surgical units where this expertise will be developed.
-
Consider simplified infusion protocols but stay consistent with format.
-
Automated or computerized assistance of calculations may reduce human error and nursing burden.
ASSESSING THE IMPACT OF YOUR EFFORTS: FOLLOW‐UP AND FOLLOW‐THROUGH
Monitoring, Recording, and Analyzing Glycemic Control Data
Once the IIP is implemented, it is critical that the impact on glycemic control, hypoglycemia, insulin use, and other factors be analyzed and used for improving the IIP and care delivery. Frequent monitoring of glucose levels is necessary for the safe infusion of insulin. Guidance for how often the monitoring is required must be explicit and included in the infusion order set. Intermittent auditing for compliance with the frequency of glucose testing and appropriate dose selection is good practice. Attention should be paid to how the glucose level is obtained, recorded, and made available to the health care team in your institution. All glucose readings should be recorded electronically for ongoing analyses and retrieval, and ideally, this could be done in an automated or single‐step method. Try to eliminate duplication of effort, such as asking the nurse to record the glucose level and their reaction to it on paper and again in an electronic format. Your team should also provide guidance about the potential problems of using point‐of‐care glucose testing in settings with hypotension, sepsis, pressor use, and other conditions that may impair the accuracy of capillary glucose readings.
Reports on the time to reach the glycemic target, glycemic control while on infusion, and the incidence of hypoglycemia should be reviewed by the multidisciplinary steering committee. The Society of Hospital Medicine Glycemic Control Task Force recommends analysis by patient day and by patient stay (or insulin infusion run) as preferred methodologies for analysis of glycemic control and hypoglycemia rates over the method of using each individual glucose reading as the unit of analysis. (The latter tends to under‐value the frequency of hypoglycemia.) Detailed practical recommendations for analyzing and summarizing glycemic control data are available elsewhere in this supplement.18 These data should drive decisions on modification of glycemic targets and the protocol structure. Patients meeting prespecified criteria should be referred to the improvement team for review. For example, patients who experience any glucose readings of 40 mg/dL, or who take more than 12 hours to reach the upper limit glycemic target should be referred to the team for a case review.
Assessing Adherence to the Protocol and Ease‐of‐Use Issues
Focused audits in the pilot and early implementation phases should look for nonadherence to the protocol. Deviations should be evaluated according to the patterns identified. For example, variation in application in some cases is specific for an individual and in others is characteristic of a specific group or the whole. Accordingly, this may point to gaps in education or attitudes about the importance of this endeavor. Front‐line staff may deviate from the protocol because they find it ineffective, unsafe, or impractical for certain situations or specific patients. Many IIPs are the subject of nursing errors related to the knowledge and acceptance of the nurse but also the complexity of the protocol. Appropriate modifications to the protocol based on these cases can frequently improve the ease of use and effectiveness of the protocol. The ongoing review process should identify issues that must be addressed with permanent solutions rather than accepting frequent individual alterations to meet goals. Revisions require supplementary education and rapid and wide dissemination. Although educational efforts and monitoring are often most intense in the early implementation phase, periodic retraining should continue to achieve optimal results and safety. Educational tools must consider nursing time commitments and will often include an interactive web‐based module that gives more flexibility for trainers and clinical nurses alike.
CONCLUSIONS
Insulin infusions are a powerful clinical tool in the inpatient setting to maintain glycemic control. Many IIPs have been developed and used successfully. The institutional challenge is to select, modify, and implement the IIP to reduce hyperglycemia and improve outcomes without excess hypoglycemia. In order to accomplish this goal safely and efficiently, standardized processes and collaboration between physicians, nurses, and pharmacists are needed. The keys to minimizing errors include developing a culture of safety and cooperation, back‐up checks, standardization, automation, and robust training for all those who are involved in the care of a patient on an insulin infusion. Although we encourage standardization and the use of protocols, providers always need to consider the unique clinical circumstances and potential problems presented by each individual patient. It is important to recognize the many barriers to successful implementation of an IIP, but strategies exist to overcome these. Finally, remember that the process does not end with the development phase. Continued review is paramount to success. Note variations in use, analyze them, and learn from them, in order to continually improve the process of care.
- ,,,,,.A comparison of the activity and disposal of semi‐synthetic human insulin and porcine insulin in normal man by the glucose clamp technique.Diabetologia.1982;22(1):41–45.
- .Perioperative management of the diabetic patient.Endocrinol Metab Clin North Am.1992;21(2):457–475.
- ,.Pregnancy in the diabetic woman. Guidelines for a successful outcome.Endocrinol Metab Clin North Am.1992;21(2):433–456.
- ,,,.Continuous intravenous insulin infusion reduces the incidence of deep sternal wound infection in diabetic patients after cardiac surgical procedures.Ann Thorac Surg.1999;67(2):352–360; discussion 360–362.
- ,,, et al.Continuous insulin infusion reduces mortality in patients with diabetes undergoing coronary artery bypass grafting.J Thorac Cardiovasc Surg.2003;125(5):1007–1021.
- .Effect of an intensive glucose management protocol on the mortality of critically ill adult patients.Mayo Clin Proc.2004;79(8):992–1000.
- ,,, et al.Intensive insulin therapy in the critically ill patients.N Engl J Med.2001;345(19):1359–1367.
- American College of Endocrinology Position Statement on Inpatient Diabetes and Metobolic Control.Endocr Pract.2004;10(suppl 2):5–9.
- ,.Current controversies around tight glucose control in critically ill patients.Curr Opin Clin Nutr Metab Care.2007;10(2):206–209.
- American Society of Health‐System Pharmacists and the Hospital and Health‐System Association of Pennsylvania. Recommendations for Safe Use of Insulin in Hospitals. http://www.ashp.org/s_ashp/docs/files/Safe_Use_of_Insulin.pdf. Accessed September 5,2008.
- ,,, et al.Management of diabetes and hyperglycemia in hospitals.Diabetes Care.2004;27(2):553–591.
- Joint Commission. Disease Specific‐Care Certification. http://www.jointcommission.org/CertificationPrograms. Accessed September 5,2008.
- American College of Endocrinology and American Diabetes Association consensus statement on inpatient diabetes and glycemic control: a call to action.Diabetes Care2006;29(8):1955–1962.
- Standards of medical care in diabetes–2008.Diabetes Care2008;31(Suppl 1):S12–S54.
- ,,.Continuous insulin infusion improves postoperative glucose control in patients with diabetes mellitus undergoing coronary artery bypass surgery.Tex Heart Inst J.2006;33(4):445–451.
- ,,,,.A practical approach to hyperglycemia management in the intensive care unit: evaluation of an intensive insulin infusion protocol.Pharmacotherapy.2006;26(10):1410–1420.
- ,,,,,.Standardization of intravenous insulin therapy improves the efficiency and safety of blood glucose control in critically ill adults.Intensive Care Med.2004;30(5):804–810.
- ,,,,,.SHM Glycemic Control Task Force summary: practical recommendations for assessing the impact of glycemic control efforts.J Hosp Med supplement. In press.
- ,,,.Introducing intensive insulin therapy: the nursing perspective.Nurs Crit Care.2006;11(2):75–79.
- .Evaluation of nursing work effort and perceptions about blood glucose testing in tight glycemic control.Am J Crit Care. Jul2006;15(4):370–377.
- ,,, et al.Intensive insulin therapy in the medical ICU.N Engl J Med.2006;354(5):449–461.
- ,,.Effect of hyperglycemia and continuous intravenous insulin infusions on outcomes of cardiac surgical procedures: the Portland Diabetic Project.Endocr Pract.2004;10(Suppl 2):21–33.
- ,,, et al.Implementation of a safe and effective insulin infusion protocol in a medical intensive care unit.Diabetes Care.2004;27(2):461–467.
- ,,, et al.Improving glycemic control in the cardiothoracic intensive care unit: clinical experience in two hospital settings.J Cardiothorac Vasc Anesth.2004;18(6):690–697.
- ,,, et al.Inpatient management of hyperglycemia: the Northwestern experience.Endocr Pract.2006;12(5):491–505.
- ,,, et al.Performance of a dose‐defining insulin infusion protocol among trauma service intensive care unit admissions.Diabetes Technol Ther.2006;8(4):476–488.
- ,,.Glucommander: a computer‐directed intravenous insulin system shown to be safe, simple, and effective in 120,618 h of operation.Diabetes Care.2005;28(10):2418–2423.
- ,,, et al.Description and evaluation of a glycemic management protocol for patients with diabetes undergoing heart surgery.Endocr Pract.2002;8(1):10–18.
- ,,,,,.Tight glycemic control in diabetic coronary artery bypass graft patients improves perioperative outcomes and decreases recurrent ischemic events.Circulation.2004;109(12):1497–1502.
- ,,,.Practical management of diabetes in critically ill patients.Am J Respir Crit Care Med.2001;164(10 Pt 1):1763–1767.
- ,,,.Postoperative management of diabetes mellitus: steady‐state glucose control with bedside algorithm for insulin adjustment.Diabetes Care.1987;10(6):722–728.
- ,,,,.Glucose‐insulin‐potassium solutions improve outcomes in diabetics who have coronary artery operations.Ann Thorac Surg.2000;70(1):145–150.
- ,,, et al.Randomized trial of insulin‐glucose infusion followed by subcutaneous insulin treatment in diabetic patients with acute myocardial infarction (DIGAMI study): effects on mortality at 1 year.J Am Coll Cardiol.1995;26(1):57–65.
- ,.Eliminating the diabetic disadvantage: the Portland Diabetic Project.Semin Thorac Cardiovasc Surg.2006;18(4):302–308.
- ,,.Validation of an insulin infusion nomogram for intensive glucose control in critically ill patients.Pharmacotherapy.2005;25(3):352–359.
- ,,,,.Achieving tight glycemic control in the operating room: lessons learned from 12 years in the trenches of a paradigm shift in anesthetic care.Semin Thorac Cardiovasc Surg.2006;18(4):339–345.
- ,,.The rationale and management of hyperglycemia for in‐patients with cardiovascular disease: time for change.J Clin Endocrinol Metab.2003;88(6):2430–2437.
- ,,,,.An insulin infusion protocol in critically ill cardiothoracic surgery patients.Ann Pharmacother.2004;38(7–8):1123–1129.
- ,,, et al.Efficacy and safety of an insulin infusion protocol in a surgical ICU.J Am Coll Surg.2006;202(1):1–9.
- ,,,.Implementation of a tight glycaemic control protocol using a web‐based insulin dose calculator.Anaesthesia.2005;60(11):1093–1100.
- ,,,.Intensive insulin therapy to non‐cardiac ICU patients: a prospective study.Eur J Anaesthesiol.2006;23(8):705–709.
- ,,, et al.Blood glucose control by a model predictive control algorithm with variable sampling rate versus a routine glucose management protocol in cardiac surgery patients: a randomized controlled trial.J Clin Endocrinol Metab.2007;92(8):2960–2964.
- ,,, et al.Outcomes of a cardiothoracic intensive care web‐based online intravenous insulin infusion calculator study at a medical university hospital.Diabetes Technol Ther.2007;9(6):523–534.
- ,,,.Rush University guidelines and protocols for the management of hyperglycemia in hospitalized patients: elimination of the sliding scale and improvement of glycemic control throughout the hospital.Diabetes Educ.2006;32(6):954–962.
- ,,,.Collaborative development of an insulin nomogram for intensive insulin therapy.Crit Care Nurs Q.2006;29(1):96–105.
- ,,, et al.Computer‐based insulin infusion protocol improves glycemia control over manual protocol.J Am Med Inform Assoc.2007;14(3):278–287.
- ,,, et al.Implementing an intravenous insulin infusion protocol in the intensive care unit.Am J Health Syst Pharm.2007;64(4):385–395.
- ,,,,.Use of a computerized guideline for glucose regulation in the intensive care unit improved both guideline adherence and glucose regulation.J Am Med Inform Assoc.2005;12(2):172–180.
- ,,, et al.Improving hyperglycemia management in the intensive care unit: preliminary report of a nurse‐driven quality improvement project using a redesigned insulin infusion algorithm.Diabetes Educ.2006;32(3):394–403.
- ,,.Clinical results of an updated insulin infusion protocol in critically ill patients.Diabetes Spectrum.2005;18(1):28–33.
- ,,.Insulin therapy for critically ill hospitalized patients: a meta‐analysis of randomized controlled trials.Arch Intern Med.2004;164(18):2005–2011.
- ,,.Intensive insulin therapy in critical care: a review of 12 protocols.Diabetes Care.2007;30(4):1005–1011.
- ,,.Hypoglycemia in the intensive care unit.Curr Opin Clin Nutr Metab Care.2007;10(2):193–196.
- ,,.Insulin infusion protocols for critically ill patients: a highlight of differences and similarities.Endocr Pract.2007;13(2):137–146.
- ,,.Effect of hyperglycemia and continuous intravenous insulin infusions on outcomes of cardiac surgical procedures: the Portland Diabetic Project.Endocr Pract.2004;10(Suppl 2):21–33.
- Providence Health 10(Suppl 2):71–80.
- .Memoirs of a root canal salesman: the successful implementation of a hospital‐wide intravenous insulin infusion protocol.Endocr Pract.2006;12(Suppl 3):79–85.
- ,,, et al.Intensive insulin therapy and pentastarch resuscitation in severe sepsis.N Engl J Med.2008;358(2):125–139.
- ,.Severe hypoglycemia in critically ill patients: risk factors and outcomes.Crit Care Med.2007;35(10):2262–2267.
- ,,.Evidence for strict inpatient blood glucose control: time to revise glycemic goals in hospitalized patients.Metabolism.2008;57(1):116–120.
- ,,, et al.Comparison of insulin infusion protocols in the ICU: computer‐guided versus standard column‐based insulin regimens [Abstract]. American Diabetes Association abstract,2008.
- ,,.Design and implementation of GRIP: a computerized glucose control system at a surgical intensive care unit.BMC Med Inform Decis Mak.2005;5:38.
- ,,, et al.“Waste not, want not”: determining the optimal priming volume for intravenous infusions.Diabetes Technol Ther.2006;8(5):598–601.
- ,,,.Bridge over troubled waters: safe and effective transitions of the inpatient with hyperglycemia.J Hosp Med supplement. In press.
SC Insulin Order Sets and Protocols
Inpatient glycemic control and hypoglycemia are issues with well deserved increased attention in recent years. Prominent guidelines and technical reviews have been published,13 and a recent, randomized controlled trial demonstrated the superiority of basal bolus insulin regimens compared to sliding‐scale regimens.4 Effective glycemic control for inpatients has remained elusive in most medical centers. Recent reports57 detail clinical inertia and the continued widespread use of sliding‐scale subcutaneous insulin regimens, as opposed to the anticipatory, physiologic basal‐nutrition‐correction dose insulin regimens endorsed by these reviews.
Inpatient glycemic control faces a number of barriers, including fears of inducing hypoglycemia, uneven knowledge and training among staff, and competing institutional and patient priorities. These barriers occur in the background of an inherently complex inpatient environment that poses unique challenges in maintaining safe glycemic control. Patients frequently move across a variety of care teams and geographic locations during a single inpatient stay, giving rise to multiple opportunities for failed communication, incomplete handoffs, and inconsistent treatment. In addition, insulin requirements may change dramatically due to variations in the stress of illness, exposure to medications that effect glucose levels, and varied forms of nutritional intake with frequent interruption. Although insulin is recognized as one of the medications most likely to be associated with adverse events in the hospital, many hospitals do not have protocols or order sets in place to standardize its use.
A Call to Action consensus conference,8, 9 hosted by the American Association of Clinical Endocrinologists (AACE) and the American Diabetes Association (ADA), brought together many thought leaders and organizations, including representation from the Society of Hospital Medicine (SHM), to address these barriers and to outline components necessary for successful implementation of a program to improve inpatient glycemic control in the face of these difficulties. Institutional insulin management protocols and standardized insulin order sets (supported by appropriate educational efforts) were identified as key interventions. It may be tempting to quickly deploy a generic insulin order set in an effort to improve care. This often results in mediocre results, due to inadequate incorporation of standardization and guidance into the order set and other documentation tools, and uneven use of the order set.
The SHM Glycemic Control Task Force (GCTF) recommends the following steps for developing and implementing successful protocols and order sets addressing the needs of the noncritical care inpatient with diabetes/hyperglycemia.
-
Form a steering committee for this work, and assess the current processes of care.
-
Identify best practices and preferred regimens to manage diabetes and hyperglycemia in the hospital.
-
Integrate best practices and preferred institutional choices into an inpatient glycemic control protocol. Crystallize your protocol into a one page summary.
-
Place guidance from your protocol into the flow of work, by integrating it into standardized subcutaneous insulin order sets and other documentation and treatment tools.
-
Monitor the use of your order sets and protocol. Intervene actively on nonadherents to your protocol and those with poor glycemic control, and revise your protocol/order sets as needed.
IDENTIFYING AND INCORPORATING KEY CONCEPTS AND BEST PRACTICES
A protocol is a document that endorses specific monitoring and treatment strategies in a given institution. This potentially extensive document should provide guidance for transitions, special situations (like steroids and total parenteral nutrition [TPN]) and should outline preferred insulin regimens for all of the most common nutritional situations. One of the most difficult parts of creating a protocol is the assimilation of all of the important information on which to base decisions. Your protocol and order set will be promoting a set of clinical practices. Fortunately, the current best practice for noncritical care hyperglycemic patients has been summarized by several authoritative sources,13, 811 including references from the SHM Glycemic Task Force published in this supplement.4, 12
Table 1 summarizes the key concepts that should be emphasized in a protocol for subcutaneous insulin management in the hospital. We recommend embedding guidance from your protocol into order sets, the medication administration record, and educational materials. Although the details contained in a protocol and order set might vary from one institution to another, the key concepts should not. The remainder of this article provides practical information about how these concepts and guidance for how preferred insulin regimens should be included in these tools. Appendices 1 and 2 give examples of an institutional one‐page summary protocol and subcutaneous insulin order set, respectively.
| 1. Establish a target range for blood glucose levels. |
| 2. Standardize monitoring of glucose levels and assessment of long‐term control (HbA1c). |
| 3. Incorporate nutritional management. |
| 4. Prompt clinicians to consider discontinuing oral antihyperglycemic medications. |
| 5. Prescribe physiologic (basal‐nutrition‐correction) insulin regimens. |
| a. Choose a total daily dose (TDD). |
| b. Divide the TDD into physiologic components of insulin therapy and provide basal and nutritional/correction separately. |
| c. Choose and dose a basal insulin. |
| d. Choose and dose a nutritional (prandial) insulin |
|
i. Match exactly to nutritional intake (see Table 2). |
| ii. Include standing orders to allow nurses to hold nutritional insulin for nutritional interruptions and to modify nutritional insulin depending on the actual nutritional intake. |
| e. Add correction insulin |
| i. Match to an estimate of the patients insulin sensitivity using prefabricated scales. |
| ii. Use the same insulin as nutritional insulin. |
| 6. Miscellaneous |
| a. Manage hypoglycemia in a standardized fashion and adjust regimen to prevent recurrences. |
| b. Provide diabetes education and appropriate consultation. |
| c. Coordinate glucose testing, nutrition delivery, and insulin administration. |
| d. Tailor discharge treatment regimens to the patient's individual circumstances and arrange for proper follow‐up. |
Standardize the Monitoring of Blood Glucose Values and Glucosylated Hemoglobin
Guidance for the coordination of glucose testing, nutrition delivery, and insulin administration, should be integrated into your protocols, and order sets. For noncritical care areas, the minimal frequency for blood glucose monitoring for patients who are eating is before meals and at bedtime. For the patient designated nothing by mouth (NPO) or the patient on continuous tube feeding, the type of nutritional/correction insulin used should drive the minimum frequency (every 4‐6 hours if rapid acting analog insulins [RAA‐I] are used, and every 6 hours if regular insulin is used). Directions for administering scheduled RAA‐I immediately before or immediately after nutrition delivery should be incorporated into protocols, order sets, and medication administration records. Unfortunately, having this guidance in the order sets and protocols does not automatically translate into its being carried out in the real world. Wide variability in the coordination of glucose monitoring, nutritional delivery, and insulin administration is common, so monitoring the process to make sure the protocol is followed is important.
Obtaining a glucosylated hemoglobin (HbA1c) level is important in gauging how well the patient's outpatient regimen is maintaining glycemic control, distinguishing stress hyperglycemia from established diabetes, and guiding the inpatient approach to glycemic control. ADA guidelines2, 3 endorse obtaining HbA1c levels of inpatients if these levels are not already available from the month prior to admission.
Establish a Target Range for Blood Glucose in NonCritical Care Areas
It is important to adopt a glycemic target that is institution‐wide, for critical care areas and noncritical care areas alike. Your glycemic target need not be identical to the ADA/AACE glycemic targets, but should be similar to them.
Examples of institutional glycemic targets for noncritical care areas:
-
Preprandial target 90‐130 mg/dL, maximum random glucose 180 mg/dL (ADA/AACE consensus target)
-
90‐150 mg/dL (a target used in some hospitals)
-
Preprandial target 90‐130 mg/dL for most patients, 100‐150 mg/dL if there are hypoglycemia risk factors, and 180 mg/dL if comfort‐care or end‐of‐life care (a more refined target, allowing for customization based on patient characteristics).
Your multidisciplinary glycemic control steering committee should pick the glycemic target it can most successfully implement and disseminate. It is fine to start with a conservative target and then ratchet down the goals as the environment becomes more accepting of the concept of tighter control of blood glucose in the hospital.
Although the choice of glycemic target is somewhat arbitrary, establishing an institutional glycemic target is critical to motivate clinical action. Your committee should design interventions, for instances when a patient's glycemic target is consistently not being met, including an assignment of responsibility.
Prompt Clinicians to Consider Discontinuing Oral Agents
Oral antihyperglycemic agents, in general, are difficult to quickly titrate to effect, and have side effects that limit their use in the hospital. In contrast, insulin acts rapidly and can be used in virtually all patients and clinical situations, making it the treatment of choice for treatment of hyperglycemia in the hospital.3, 11, 12 In certain circumstances, it may be entirely appropriate to continue a well‐controlled patient on his or her prior outpatient oral regimen. It is often also reasonable to resume oral agents in some patients when preparing for hospital discharge.
Incorporate Nutritional Management
Because diet is so integral to the management of diabetes and hyperglycemia, diet orders should be embedded in all diabetes or insulin‐related order sets. Diets with the same amount of carbohydrate with each meal should be the default rule for patients with diabetes. Nutritionist consultation should be considered and easy to access for patients with malnutrition, obesity, and other common conditions of the inpatient with diabetes.
Access Diabetes Education and Appropriate Consultation
Diabetes education should be offered to all hyperglycemic patients with normal mental status, complete with written materials, a listing of community resources, and survival skills. Consultation with physicians in internal medicine or endocrinology for difficult‐to‐control cases, or for cases in which the primary physician of record is not familiar with (or not adherent to) principles of inpatient glycemic management, should be very easy to obtain, or perhaps mandated, depending on your institution‐specific environment.
Prescribe Physiologic (Basal‐Nutritional‐Correction Dose) Insulin Regimens
Physiologic insulin use is the backbone of the recommended best practice for diabetes and hyperglycemia management in the hospital. The principles of such regimens are summarized elsewhere in this supplement.12 These principles will not be reiterated in detail here, but the major concepts that should be integrated into the protocols and order sets will be highlighted.
Choose a Total Daily Dose
Clinicians need guidance on how much subcutaneous insulin they should give a patient. These doses are well known from clinical experience and the published literature. The fear of hypoglycemia usually results in substantial underdosing of insulin, or total avoidance of scheduled insulin on admission. Your team should provide guidance for how much insulin to start a patient on when it is unclear from past experience how much insulin the patient needs. Waiting a few days to see how much insulin is required via sliding‐scale‐only regimens is a bad practice that should be discouraged for patients whose glucose values are substantially above the glycemic target. The total daily dose (TDD) can be estimated in several different ways (as demonstrated in Appendix 1 and 2), and protocols should make this step very clear for clinicians. Providing a specific location on the order set to declare the TDD may help ensure this step gets done more reliably. Some institutions with computer physician order entry (CPOE) provide assistance with calculating the TDD and the allocation of basal and nutritional components, based on data the ordering physician inputs into the system.
Select and Dose a Basal Insulin
Your protocol should describe how the TDD should be divided between basal and nutritional insulin. We generally recommend 50% of the TDD be given as basal insulin, with the other 50% administered on a scheduled basis to cover glycemic excursions from nutritional intake. The 50/50 rule is simple and generally works well, and should be widely promoted. However, there are exceptions to this rule that should be incorporated into your full protocol and educational programs. The order set should have separate steps for ordering basal insulin, nutritional insulin, and correction insulin. The advantage to providing these insulin components separately is that it allows them to be independently manipulated (eg, if a patient is unable to tolerate a meal, nutritional insulin is held, but basal insulin and correction insulin are continued).
The SHM GCTF specifically endorses long acting insulin (glargine and detemir) as the preferred basal insulin in the hospital setting, thus discouraging the use of neutral protamine Hagedorn (NPH) insulin and fixed combination insulin formulations (Table 2). In the absence of randomized controlled trials demonstrating superiority of the glargine or detemir to NPH insulin in the hospital, this endorsement deserves some further explanation. Although we believe that correctly dosed NPH containing insulin regimens can attain effective and safe glycemic control in the hospital setting, it is more difficult to standardize their use and adjust for fluctuations in nutritional intake. Glargine and detemir have much less pronounced spikes in their effect than NPH, rendering them relatively peakless in comparison. This pharmacokinetic profile allows for continued dosing with minimal or no correction when nutrition intake is variable, and allow for consistent reinforcement of the basal‐nutritional‐correction insulin concept.
| Nutritional situation | Necessary insulin components | Preferred regimen* |
|---|---|---|
| ||
| NPO (or clear liquids) | Basal insulin: 50% of TDD. Nutritional insulin: None. | Basal insulin: glargine given once daily or detemir given twice daily. Nutritional insulin: None. Correctional insulin: Regular insulin q 6 hours or RAA insulin q 4 hours. Other comments: Dextrose infusion (e.g., D5 containing solution at 75‐150 cc/hour) recommended when nutrition is held. An IV insulin infusion is preferred for management of prolonged fasts or fasting type 1 diabetes patients. |
| Eating meals | Basal insulin: 50% of TDD. Nutritional insulin: 50% of TDD, divided equally before each meal. | Basal insulin: glargine given once daily or detemir given twice daily. Nutritional insulin: RAA insulin with meals. Correctional insulin: RAA insulin q AC and HS (reduced dose at HS). |
| Bolus tube feeds | Basal insulin: 40% of TDD. Nutritional insulin: 60% of the TDD, divided equally before each bolus feed. | Basal insulin: glargine given once daily or detemir given twice daily. Nutritional insulin: RAA insulin with each bolus. Correctional insulin: RAA insulin with each bolus. |
| Continuous tube feeds | Basal insulin: 40% (conservative) of TDD. Nutritional insulin: 60% of the TDD in divided doses. | Basal insulin: glargine given once daily or detemir given twice daily. Nutritional insulin: RAA insulin q 4 hours or regular insulin q 6 hours. Correctional insulin: Should match nutritional insulin choice. |
| Parenteral nutrition | Insulin is usually given parenterally, with the nutrition | Initially, a separate insulin drip allows for accurate dose‐finding. Then, 80% of amount determined as TDD using drip is added to subsequent TPN bags as regular insulin. Use correctional subcutaneous insulin doses cautiously, in addition. |
There are some caveats to this general recommendation. First, patients who are well controlled on home regimens with NPH basal insulin can (and sometimes should) stay on the regimen that has worked well for them. However, extra vigilance in reducing the dose for reductions in nutrition is required, because NPH is generally used to cover both nutritional and basal requirements. Second, extensive experience with glargine and detemir are not available in obstetric populations. They are not U.S. Food and Drug Administration (FDA) approved for use in pregnant patients and formally carry a Class C rating, whereas NPH insulin has been used safely in obstetric populations for decades. Third, the insulin regimen used as an inpatient is not necessarily the preferred regimen to prescribe at discharge: cost, patient preferences, HbA1c level, and other factors should be considered in making this choice.
Select and Dose a Nutritional (Prandial) Insulin
The step for ordering nutritional insulin should assist the clinician in matching the insulin to the type of nutrition that the patient is receiving. For example, rapid‐acting insulin analogs are preferred over regular insulin in the eating patient, in view of their more physiologic profile, which averts the insulin stacking that can occur with regular insulin. If regular insulin is used as the preferred institutional choice for eating patients, the lunchtime dose should be reduced or eliminated altogether, to eliminate insulin stacking.
Table 2 outlines the SHM GCTF preferred regimens for different nutritional situations.
There should be a standing order for nutritional insulin to be held when nutrition is interrupted, whether intentional or unintentional. Patients with interrupted tube feedings could have standing orders for a dextrose infusion to replace the tube feeding carbohydrate load and prevent hypoglycemia. Ideally, there should also be a standing order allowing for real‐time management of the patient with uncertain nutritional intake. For example, when a patient's premeal assessment reveals that she may not tolerate the meal, the patient should be allowed to attempt to eat, and then the nutritional insulin should be given after the meal, in proportion to the amount of food that was eaten. This type of order will require significant nursing education and process redesign in many hospitals, but is essential for matching nutritional insulin to actual intake.
Add Correction Insulin
There is no convincing evidence for the benefit of correction (sliding‐scale) insulin in the inpatient setting, although a randomized trial demonstrating the superiority of basal/nutritional insulin regimens to sliding‐scale only regimens did incorporate a correction insulin scale as an adjunct to the superior basal/nutritional regimen.4 The SHM GCTF again emphasizes that control of hyperglycemia should be proactive and anticipatory of insulin needs, rather than reactive to hyperglycemia. Nonetheless, unexpected hyperglycemic excursions are common, and the use of correction insulin remains a pervasive and arguably logical practice. If correction insulin is used, it should be ordered as a separate step after considering basal and nutrition insulin needs. The doses of scheduled insulin should be adjusted regularly if correction insulin is consistently being required. Ideally, the prescriber should choose a preformatted corrective insulin scale, based on the patient's insulin sensitivity (Appendix 2). There should be a prompt to use the same type of insulin that is being used for nutritional insulin, and there should be instructions that this insulin is given in addition to the basal and nutritional insulin to correct for hyperglycemia. Nocturnal correction‐dose scales should be reduced in the eating patient.
Even after limiting insulin regimens to those in Table 2, multidisciplinary glycemic control teams are still left with several options within these SHM‐preferred regimens. We recommend that your team choose a single, institutionally‐preferred basal‐nutritional‐correction insulin combination for each situation.
Choosing one preferred option for these situations is advantageous because:
-
You can communicate preferred regimens more simply and succinctly to all staff.
-
You eliminate all inappropriate choices for insulin regimens for that situation, as well as some other less preferred, but acceptable choices.
-
You can encourage regimens that are most economical (by promoting the insulin regimens that reflect your hospital formulary choices).
-
Staff members can become very familiar with a few regimens, instead of being confused by a multitude of them. They can identify variations from your preferred choices and target these patients for extra scrutiny and actions should they fail to meet glycemic targets.
Although virtually every institution can provide specific guidance on insulin management in a protocol, there are tradeoffs inherent in how restrictive you can be in pushing these preferred choices in your order sets. Should you eliminate alternate basal or nutritional insulin choices from your order sets? As you integrate more and more of your preferred algorithm and regimens into your order set, you will gain incremental improvement in the standardization of inpatient insulin management. However, you reduce not only variability in ordering, but also the choices available to your prescribers and patients, and in effect you are pushing the providers to use an insulin regimen that often differs from the patient's outpatient regimen. If your institution is not yet ready to go with a single preferred insulin, simply listing your preferred insulin first with the annotation preferred can be enough to increase the use of the preferred insulin.
We endorse building the most protocol‐driven, proscriptive, insulin order set that the Glycemic Control Steering Committee believes their medical staff will accept. There are some caveats to this endorsement. First, there must be extra efforts on the backend of the admission, to ensure that the antihyperglycemic regimen is tailored to the unique needs of the patient (this is discussed further below). Second, a protocol‐driven approach is not a substitute for a good educational program for health care providers or well‐informed clinical judgment. Education should reinforce major concepts driving the protocol and should also highlight exceptions to the rule. Variance from the protocol endorsed choices should be allowed (and even encouraged) when the variance is driven by patient factors (as opposed to provider whim). Learning from this variance is a key concept in refining protocols. Education ideally should not be limited to only protocol‐endorsed choices, as staff should be familiar with the full range of antihyperglycemia regimens seen in inpatient and outpatient settings.
Special Situations
Most of the preferred regimens for different situations are outlined in Table 2 in a straightforward manner, and can be depicted in your protocols and order sets in the same way. Some conditions have enough complexity, however, that you will have difficulty placing all of the details into your one‐page protocol and order set. Details should be placed on your more detailed protocol, and educational programs should include the topics outlined below. Although insulin infusion is often the option that would provide the most reliable and expedient control of hyperglycemia in these special situations, it is an option not available in many noncritical care settings. Therefore, the discussion is limited to subcutaneous insulin control regimens.
Patient on Continuous Tube Feeding
The SHM GCTF endorses glargine or detemir as the basal insulin of choice for this setting. The nutritional and correction insulin of choice is either an RAA‐I every 4 hours (q4h), or regular insulin every 6 hours (q6h). We endorse this choice because it retains the basal‐nutritional‐correction dose concept, generally allows for continued basal insulin use if the tube feedings become interrupted, and is amenable to building a consistent institutional protocol.
There are some important caveats to this recommendation. First, realize that almost any regimen that provides a stable insulin supply would be acceptable, and many institutions will use glargine or detemir to cover both basal and nutritional needs. The downside to using large boluses of long‐acting insulin in this clinical situation is that any unexpected interruption of the feedings will necessitate prolonged infusions of dextrate 10% solution (D10) to avoid hypoglycemia
Second, because of the glycemic load inherent in tube feedings, maintenance of glycemic control in the setting of enteral feeding may be best managed by providing a higher percentage of the TDD as nutritional insulin. In these cases, ratios of basal to nutritional insulin of 40:60, or even less basal insulin, may be appropriate.
Glucocorticoid Therapy
High‐dose glucocorticoids are strongly associated with increased insulin requirements. The degree of hyperglycemia induced by steroids varies significantly from patient to patient, and the pattern of hyperglycemia will vary depending on the pattern of steroid administration. The general principle to keep in mind is that the hyperglycemia induced by a steroid dose will peak 8‐12 hours after it is given, so insulin regimens to address this should take this effect into account. For example, giving a long‐acting basal insulin like glargine to accommodate the hyperglycemic effect of a steroid bolus given in the morning would be inappropriate because the steroid effect would wane and then disappear overnight, leading to insulin‐induced hypoglycemia. NPH insulin can be ideal in this setting, either by itself, or by layering it on top of an existing regimen.
Another caveat: glucocorticoids exert their predominate effect on insulin sensitivity in muscle (as opposed to the liver), and as a result, have their most notable effect on postprandial glucose. For this reason, the best insulin regimens for this situation may use proportionally less basal insulin and more nutritional insulin. One common regimen calls for keeping the basal insulin dose the same as the preglucocorticoid dose, while escalating the RAA insulin dose at lunch and dinner.
Given the complexities of covering steroid‐induced hyperglycemia and its high prevalence in certain populations (such as transplantation patients and patients undergoing chemotherapy), this would be an excellent area on which to focus expertise. Examples include routine endocrinology consultation, intervention by a special glycemic control team, or incorporating routine glucose monitoring and triggers for initiating insulin infusion into the protocols for chemotherapy and transplantation patients.
Regiment the Management of Hypoglycemia
Hypoglycemia is defined by the ADA as a blood glucose of 70 mg/dL or less, based on the physiologic changes that can occur at this glucose level, even in subjectively asymptomatic patients.3 Protocols for management of hypoglycemia should be linked to your diabetes/hyperglycemia protocols. There are many hypoglycemia protocols available for review in the SHM Glycemic Control Resource Room and Glycemic Control Implementation Guide.10 Some common themes for effective implementation stand out. First, the protocols need to walk the balance between simplicity of use, and the need to provide instructions that will provide guidance in a variety of patient situations. Second, the protocols need to be nurse driven, so that nurses can initiate treatment without waiting for a physician order. Third, education and instruction regarding recognition of risk factors, and avoidance of hypoglycemia are needed to support a successful protocol. Importantly, any hypoglycemic event should lead to a reconsideration of the current anti‐hyperglycemic regimen so that future events can be prevented.
Plan for Discharge and Provide Guidance for the Transition
Your institution should have policies and procedures outlining all the steps needed to complete the important transition out of the hospital. At a minimum, this planning should include adequate education (including a learner assessment), appropriate follow‐up, referral to community resources, and a discharge glycemic control regimen that is tailored to the educational, financial, and motivational profile of a patient. The more your inpatient insulin management is driven by protocol, the more likely it is the patient will be on an inpatient treatment plan that differs from their outpatient regimen; therefore, it is even more important to plan this transition carefully and reliably.
Communicating the accurate hyperglycemia related diagnosis and related problems to the primary care provider is important for good care, perhaps even more so for patients who had hyperglycemia while hospitalized without a prior diagnosis of diabetes. Some centers place a prompt for hyperglycemia related diagnosis in the order set and/or discharge paperwork, to remind the clinician to convey the diagnosis to the primary provider, and to encourage more complete documentation. Improved documentation can also improve the business case for glycemic control, along with other strategies outlined elsewhere in this supplement.13
Transitions in care (including transitions out of the hospital and off of infusion insulin) are discussed in more detail14, 15 elsewhere in this supplement. The principles outlined in these references should be incorporated into your institutional protocol. Briefly, not all patients require or are capable of intensive basal‐bolus regimens upon discharge. The HbA1c can be very valuable in arriving at the optimal outpatient regimen.14 The capacities and preferences of the patient and the context of his or her outpatient care environment (including the preferences of the primary care provider) must be taken into consideration as an outpatient management program is planned.
PULLING IT ALL TOGETHER: MAKE SURE YOUR PROTOCOL/ORDER SET IS EASY TO USE AND WIDELY UTILIZED
When standardizing hospital management of diabetes and hyperglycemia, we recommend building the full protocol first, then crystallizing the protocol into a one‐page summary that can be widely disseminated. The protocol guidance is then incorporated into the order set and nursing medical administration record (MAR). Again, we recommend the most proscriptive and protocol‐driven order set feasible within the constraints of medical staff support. The example order set in Appendix 2 illustrates this approach along with other desirable features:
-
Check‐box simplicity on when to order appropriate glucose monitoring.
-
Prompt for the proper hyperglycemia‐related diagnosis.
-
Prompts to document diagnosis and to order HbA1c level.
-
Use of encouraged insulin terminology: basal, prandial (or nutritional), and correction. Language is a powerful thing, and just getting staff to use these terms goes a long way toward the more physiologic prescribing of insulin.
-
Statement/reminder of a glycemic goal.
-
Prompts and contact information for appropriate consultation.
-
Elimination of unapproved abbreviations (such as U for units).
-
Stating both generic and brand names of insulin preparations.
-
Important timing cues for administration of insulin.
-
Several correction‐dose scales suitable for different insulin sensitivities. One size does NOT fit all.
-
Incorporation of a simple hypoglycemia protocol into the order set.
-
Insulin dosing guidelines available at the point of care (in this case, on the back of the order set).
Additional nursing‐specific cues (such as an admonition to never mix glargine insulin with other types of insulin) can also be included in the MAR whenever glargine is ordered.
Once you have protocols and order sets to guide providers, you need to assure that they are used for the majority of hyperglycemic patients. Educational programs should introduce your interventions and the rationale for them. In order to make your method the default method of care, your team should survey all preprinted or CPOE insulin order sets of your institution. A review of postoperative, transfer, and admission order sets that all services use may reveal a half‐dozen or more embedded sliding‐scale insulin order sets that should be removed, with prompts to use the standardized insulin order set being placed in their stead.
Computerized order sets present both challenges and opportunities. Wording limitations and the scrolling nature can make concepts less clear, yet there is a capability for incorporating a hierarchical structure that allows for guiding the user through a more algorithmic approach. There is also a capacity to provide assistance with dosing calculations that do not exist in the paper world. Education remains of key importance for both methods.
MONITOR THE USE AND EFFECTIVENESS OF YOUR PROTOCOLS AND ORDER SETS
Creating and implementing protocols, order sets, and other tools is not the end of the journey to improve care. It is important to monitor order set utilization, insulin use patterns, and parameters measuring glycemic control and hypoglycemia, as outlined in more detail in another article in this supplement.16 In addition to summary data every month or so, we recommend daily reports that spur action in near real time. Triggers such as uncontrolled hyperglycemia, markedly elevated HbA1c levels, and nonphysiologic insulin regimens should initiate consultation, extra diabetes education, or referral to a glucose control team. If appropriate consultation is not readily available, the glycemic control steering group should lobby the administration to bolster this capability. Qualitative feedback from the frontline caregivers, as well as this quantitative data, can assist the local glycemic control champions in designing even more effective protocols, order sets, focused educational efforts, and concurrent mitigation of suboptimal care.
CONCLUSION
Diabetes, hyperglycemia, and iatrogenic hypoglycemia are common and important conditions affecting the noncritically ill inpatient. Interventional trials to validate the recommended noncritical care unit glycemic targets are needed. Although there is a growing consensus on best practices to care for these patients, numerous barriers and the complexity of caring for inpatients hamper the reliability of best practice delivery. Institutional protocols and protocol driven subcutaneous insulin orders, when implemented with the strategies outlined here, can be the key to delivering these best practices more reliably.
Appendix
- American College of Endocrinology Task Force on Inpatient Diabetes and Metabolic Control.American College of Endocrinology Position Statement on Inpatient Diabetes and Metabolic Control.Endocr Pract.2004;10:77–82.
- ,,,,,,.Management of diabetes and hyperglycemia in hospitals.Diabetes Care.2004;27:553–591.
- American Diabetes Association.Standards of Medical Carein Diabetes‐2006.Diabetes Care.2006;29(suppl 1):s4–s42.
- ,,, et al.Randomized study of basal‐bolus insulin therapy in the inpatient management of patients with type 2 diabetes (RABBIT 2 Trial).Diabetes Care.2007;30:2181–2186.
- ,,,,.Inpatient management of diabetes and hyperglycemia among general medicine patients at a large teaching hospital.J Hosp Med.2006;1:145–150.
- ,,, et al.Diabetes care in the hospital: is there clinical inertia?J Hosp Med.2006;1:151–160.
- ,,, et al.Diabetes care in hospitalized non‐critically ill patients: more evidence for clinical inertia and negative therapeutic momentum.JHosp Med.2007;2:203–211.
- Inpatient Diabetes and Glycemic Control: A Call to Action Conference. Position Statement. AACE, February2006. Available at: http://www.aace.com/meetings/consensus/IIDC/IDGC0207.pdf. Accessed October, 2006.
- Proceedings of the American College of Endocrinology and American Diabetes Association Consensus Conference, Washington, DC, January 30–31, 2006. Endocr Pract.2006; 12(suppl 3):3–13.
- Society of Hospital Medicine Glycemic Control Task Force. Implementation Guide: Improving Glycemic Control, Preventing Hypoglycemia, and Optimizing Care of the Inpatient with Hyperglycemia and Diabetes. Published January 2007 on the Society of Hospital Medicine website. Available at: http://www.hospitalmedicine.org. Accessed August,2007.
- .Management of hyperglycemia in the hospital setting.N Engl J Med.2006;355:1903–1911.
- ,,,,.Management of diabetes and hyperglycemia in the hospital: a practical guide to subcutaneous insulin use in the non‐critically ill adult patient.J Hosp Med.2008;3(5):S17–S28.
- ,.Practical strategies for developing the business case for hospital glycemic control teams.J Hosp Med2008;3(5):S76–S83.
- ,,,.Bridge over troubled waters: safe and effective transitions of the inpatient with hyperglycemia.J Hosp Med.2008;3(5):S55–S65.
- ,,,.Designing and implementing insulin infusion protocols and order sets.J Hosp Med.2008;3(5):S42–S54.
- ,,,,,.SHM Glycemic Control Task Force summary: practical recommendations for assessing the impact of glycemic control efforts.J Hosp Med.2008;3(5):S66–S75.
Inpatient glycemic control and hypoglycemia are issues with well deserved increased attention in recent years. Prominent guidelines and technical reviews have been published,13 and a recent, randomized controlled trial demonstrated the superiority of basal bolus insulin regimens compared to sliding‐scale regimens.4 Effective glycemic control for inpatients has remained elusive in most medical centers. Recent reports57 detail clinical inertia and the continued widespread use of sliding‐scale subcutaneous insulin regimens, as opposed to the anticipatory, physiologic basal‐nutrition‐correction dose insulin regimens endorsed by these reviews.
Inpatient glycemic control faces a number of barriers, including fears of inducing hypoglycemia, uneven knowledge and training among staff, and competing institutional and patient priorities. These barriers occur in the background of an inherently complex inpatient environment that poses unique challenges in maintaining safe glycemic control. Patients frequently move across a variety of care teams and geographic locations during a single inpatient stay, giving rise to multiple opportunities for failed communication, incomplete handoffs, and inconsistent treatment. In addition, insulin requirements may change dramatically due to variations in the stress of illness, exposure to medications that effect glucose levels, and varied forms of nutritional intake with frequent interruption. Although insulin is recognized as one of the medications most likely to be associated with adverse events in the hospital, many hospitals do not have protocols or order sets in place to standardize its use.
A Call to Action consensus conference,8, 9 hosted by the American Association of Clinical Endocrinologists (AACE) and the American Diabetes Association (ADA), brought together many thought leaders and organizations, including representation from the Society of Hospital Medicine (SHM), to address these barriers and to outline components necessary for successful implementation of a program to improve inpatient glycemic control in the face of these difficulties. Institutional insulin management protocols and standardized insulin order sets (supported by appropriate educational efforts) were identified as key interventions. It may be tempting to quickly deploy a generic insulin order set in an effort to improve care. This often results in mediocre results, due to inadequate incorporation of standardization and guidance into the order set and other documentation tools, and uneven use of the order set.
The SHM Glycemic Control Task Force (GCTF) recommends the following steps for developing and implementing successful protocols and order sets addressing the needs of the noncritical care inpatient with diabetes/hyperglycemia.
-
Form a steering committee for this work, and assess the current processes of care.
-
Identify best practices and preferred regimens to manage diabetes and hyperglycemia in the hospital.
-
Integrate best practices and preferred institutional choices into an inpatient glycemic control protocol. Crystallize your protocol into a one page summary.
-
Place guidance from your protocol into the flow of work, by integrating it into standardized subcutaneous insulin order sets and other documentation and treatment tools.
-
Monitor the use of your order sets and protocol. Intervene actively on nonadherents to your protocol and those with poor glycemic control, and revise your protocol/order sets as needed.
IDENTIFYING AND INCORPORATING KEY CONCEPTS AND BEST PRACTICES
A protocol is a document that endorses specific monitoring and treatment strategies in a given institution. This potentially extensive document should provide guidance for transitions, special situations (like steroids and total parenteral nutrition [TPN]) and should outline preferred insulin regimens for all of the most common nutritional situations. One of the most difficult parts of creating a protocol is the assimilation of all of the important information on which to base decisions. Your protocol and order set will be promoting a set of clinical practices. Fortunately, the current best practice for noncritical care hyperglycemic patients has been summarized by several authoritative sources,13, 811 including references from the SHM Glycemic Task Force published in this supplement.4, 12
Table 1 summarizes the key concepts that should be emphasized in a protocol for subcutaneous insulin management in the hospital. We recommend embedding guidance from your protocol into order sets, the medication administration record, and educational materials. Although the details contained in a protocol and order set might vary from one institution to another, the key concepts should not. The remainder of this article provides practical information about how these concepts and guidance for how preferred insulin regimens should be included in these tools. Appendices 1 and 2 give examples of an institutional one‐page summary protocol and subcutaneous insulin order set, respectively.
| 1. Establish a target range for blood glucose levels. |
| 2. Standardize monitoring of glucose levels and assessment of long‐term control (HbA1c). |
| 3. Incorporate nutritional management. |
| 4. Prompt clinicians to consider discontinuing oral antihyperglycemic medications. |
| 5. Prescribe physiologic (basal‐nutrition‐correction) insulin regimens. |
| a. Choose a total daily dose (TDD). |
| b. Divide the TDD into physiologic components of insulin therapy and provide basal and nutritional/correction separately. |
| c. Choose and dose a basal insulin. |
| d. Choose and dose a nutritional (prandial) insulin |
|
i. Match exactly to nutritional intake (see Table 2). |
| ii. Include standing orders to allow nurses to hold nutritional insulin for nutritional interruptions and to modify nutritional insulin depending on the actual nutritional intake. |
| e. Add correction insulin |
| i. Match to an estimate of the patients insulin sensitivity using prefabricated scales. |
| ii. Use the same insulin as nutritional insulin. |
| 6. Miscellaneous |
| a. Manage hypoglycemia in a standardized fashion and adjust regimen to prevent recurrences. |
| b. Provide diabetes education and appropriate consultation. |
| c. Coordinate glucose testing, nutrition delivery, and insulin administration. |
| d. Tailor discharge treatment regimens to the patient's individual circumstances and arrange for proper follow‐up. |
Standardize the Monitoring of Blood Glucose Values and Glucosylated Hemoglobin
Guidance for the coordination of glucose testing, nutrition delivery, and insulin administration, should be integrated into your protocols, and order sets. For noncritical care areas, the minimal frequency for blood glucose monitoring for patients who are eating is before meals and at bedtime. For the patient designated nothing by mouth (NPO) or the patient on continuous tube feeding, the type of nutritional/correction insulin used should drive the minimum frequency (every 4‐6 hours if rapid acting analog insulins [RAA‐I] are used, and every 6 hours if regular insulin is used). Directions for administering scheduled RAA‐I immediately before or immediately after nutrition delivery should be incorporated into protocols, order sets, and medication administration records. Unfortunately, having this guidance in the order sets and protocols does not automatically translate into its being carried out in the real world. Wide variability in the coordination of glucose monitoring, nutritional delivery, and insulin administration is common, so monitoring the process to make sure the protocol is followed is important.
Obtaining a glucosylated hemoglobin (HbA1c) level is important in gauging how well the patient's outpatient regimen is maintaining glycemic control, distinguishing stress hyperglycemia from established diabetes, and guiding the inpatient approach to glycemic control. ADA guidelines2, 3 endorse obtaining HbA1c levels of inpatients if these levels are not already available from the month prior to admission.
Establish a Target Range for Blood Glucose in NonCritical Care Areas
It is important to adopt a glycemic target that is institution‐wide, for critical care areas and noncritical care areas alike. Your glycemic target need not be identical to the ADA/AACE glycemic targets, but should be similar to them.
Examples of institutional glycemic targets for noncritical care areas:
-
Preprandial target 90‐130 mg/dL, maximum random glucose 180 mg/dL (ADA/AACE consensus target)
-
90‐150 mg/dL (a target used in some hospitals)
-
Preprandial target 90‐130 mg/dL for most patients, 100‐150 mg/dL if there are hypoglycemia risk factors, and 180 mg/dL if comfort‐care or end‐of‐life care (a more refined target, allowing for customization based on patient characteristics).
Your multidisciplinary glycemic control steering committee should pick the glycemic target it can most successfully implement and disseminate. It is fine to start with a conservative target and then ratchet down the goals as the environment becomes more accepting of the concept of tighter control of blood glucose in the hospital.
Although the choice of glycemic target is somewhat arbitrary, establishing an institutional glycemic target is critical to motivate clinical action. Your committee should design interventions, for instances when a patient's glycemic target is consistently not being met, including an assignment of responsibility.
Prompt Clinicians to Consider Discontinuing Oral Agents
Oral antihyperglycemic agents, in general, are difficult to quickly titrate to effect, and have side effects that limit their use in the hospital. In contrast, insulin acts rapidly and can be used in virtually all patients and clinical situations, making it the treatment of choice for treatment of hyperglycemia in the hospital.3, 11, 12 In certain circumstances, it may be entirely appropriate to continue a well‐controlled patient on his or her prior outpatient oral regimen. It is often also reasonable to resume oral agents in some patients when preparing for hospital discharge.
Incorporate Nutritional Management
Because diet is so integral to the management of diabetes and hyperglycemia, diet orders should be embedded in all diabetes or insulin‐related order sets. Diets with the same amount of carbohydrate with each meal should be the default rule for patients with diabetes. Nutritionist consultation should be considered and easy to access for patients with malnutrition, obesity, and other common conditions of the inpatient with diabetes.
Access Diabetes Education and Appropriate Consultation
Diabetes education should be offered to all hyperglycemic patients with normal mental status, complete with written materials, a listing of community resources, and survival skills. Consultation with physicians in internal medicine or endocrinology for difficult‐to‐control cases, or for cases in which the primary physician of record is not familiar with (or not adherent to) principles of inpatient glycemic management, should be very easy to obtain, or perhaps mandated, depending on your institution‐specific environment.
Prescribe Physiologic (Basal‐Nutritional‐Correction Dose) Insulin Regimens
Physiologic insulin use is the backbone of the recommended best practice for diabetes and hyperglycemia management in the hospital. The principles of such regimens are summarized elsewhere in this supplement.12 These principles will not be reiterated in detail here, but the major concepts that should be integrated into the protocols and order sets will be highlighted.
Choose a Total Daily Dose
Clinicians need guidance on how much subcutaneous insulin they should give a patient. These doses are well known from clinical experience and the published literature. The fear of hypoglycemia usually results in substantial underdosing of insulin, or total avoidance of scheduled insulin on admission. Your team should provide guidance for how much insulin to start a patient on when it is unclear from past experience how much insulin the patient needs. Waiting a few days to see how much insulin is required via sliding‐scale‐only regimens is a bad practice that should be discouraged for patients whose glucose values are substantially above the glycemic target. The total daily dose (TDD) can be estimated in several different ways (as demonstrated in Appendix 1 and 2), and protocols should make this step very clear for clinicians. Providing a specific location on the order set to declare the TDD may help ensure this step gets done more reliably. Some institutions with computer physician order entry (CPOE) provide assistance with calculating the TDD and the allocation of basal and nutritional components, based on data the ordering physician inputs into the system.
Select and Dose a Basal Insulin
Your protocol should describe how the TDD should be divided between basal and nutritional insulin. We generally recommend 50% of the TDD be given as basal insulin, with the other 50% administered on a scheduled basis to cover glycemic excursions from nutritional intake. The 50/50 rule is simple and generally works well, and should be widely promoted. However, there are exceptions to this rule that should be incorporated into your full protocol and educational programs. The order set should have separate steps for ordering basal insulin, nutritional insulin, and correction insulin. The advantage to providing these insulin components separately is that it allows them to be independently manipulated (eg, if a patient is unable to tolerate a meal, nutritional insulin is held, but basal insulin and correction insulin are continued).
The SHM GCTF specifically endorses long acting insulin (glargine and detemir) as the preferred basal insulin in the hospital setting, thus discouraging the use of neutral protamine Hagedorn (NPH) insulin and fixed combination insulin formulations (Table 2). In the absence of randomized controlled trials demonstrating superiority of the glargine or detemir to NPH insulin in the hospital, this endorsement deserves some further explanation. Although we believe that correctly dosed NPH containing insulin regimens can attain effective and safe glycemic control in the hospital setting, it is more difficult to standardize their use and adjust for fluctuations in nutritional intake. Glargine and detemir have much less pronounced spikes in their effect than NPH, rendering them relatively peakless in comparison. This pharmacokinetic profile allows for continued dosing with minimal or no correction when nutrition intake is variable, and allow for consistent reinforcement of the basal‐nutritional‐correction insulin concept.
| Nutritional situation | Necessary insulin components | Preferred regimen* |
|---|---|---|
| ||
| NPO (or clear liquids) | Basal insulin: 50% of TDD. Nutritional insulin: None. | Basal insulin: glargine given once daily or detemir given twice daily. Nutritional insulin: None. Correctional insulin: Regular insulin q 6 hours or RAA insulin q 4 hours. Other comments: Dextrose infusion (e.g., D5 containing solution at 75‐150 cc/hour) recommended when nutrition is held. An IV insulin infusion is preferred for management of prolonged fasts or fasting type 1 diabetes patients. |
| Eating meals | Basal insulin: 50% of TDD. Nutritional insulin: 50% of TDD, divided equally before each meal. | Basal insulin: glargine given once daily or detemir given twice daily. Nutritional insulin: RAA insulin with meals. Correctional insulin: RAA insulin q AC and HS (reduced dose at HS). |
| Bolus tube feeds | Basal insulin: 40% of TDD. Nutritional insulin: 60% of the TDD, divided equally before each bolus feed. | Basal insulin: glargine given once daily or detemir given twice daily. Nutritional insulin: RAA insulin with each bolus. Correctional insulin: RAA insulin with each bolus. |
| Continuous tube feeds | Basal insulin: 40% (conservative) of TDD. Nutritional insulin: 60% of the TDD in divided doses. | Basal insulin: glargine given once daily or detemir given twice daily. Nutritional insulin: RAA insulin q 4 hours or regular insulin q 6 hours. Correctional insulin: Should match nutritional insulin choice. |
| Parenteral nutrition | Insulin is usually given parenterally, with the nutrition | Initially, a separate insulin drip allows for accurate dose‐finding. Then, 80% of amount determined as TDD using drip is added to subsequent TPN bags as regular insulin. Use correctional subcutaneous insulin doses cautiously, in addition. |
There are some caveats to this general recommendation. First, patients who are well controlled on home regimens with NPH basal insulin can (and sometimes should) stay on the regimen that has worked well for them. However, extra vigilance in reducing the dose for reductions in nutrition is required, because NPH is generally used to cover both nutritional and basal requirements. Second, extensive experience with glargine and detemir are not available in obstetric populations. They are not U.S. Food and Drug Administration (FDA) approved for use in pregnant patients and formally carry a Class C rating, whereas NPH insulin has been used safely in obstetric populations for decades. Third, the insulin regimen used as an inpatient is not necessarily the preferred regimen to prescribe at discharge: cost, patient preferences, HbA1c level, and other factors should be considered in making this choice.
Select and Dose a Nutritional (Prandial) Insulin
The step for ordering nutritional insulin should assist the clinician in matching the insulin to the type of nutrition that the patient is receiving. For example, rapid‐acting insulin analogs are preferred over regular insulin in the eating patient, in view of their more physiologic profile, which averts the insulin stacking that can occur with regular insulin. If regular insulin is used as the preferred institutional choice for eating patients, the lunchtime dose should be reduced or eliminated altogether, to eliminate insulin stacking.
Table 2 outlines the SHM GCTF preferred regimens for different nutritional situations.
There should be a standing order for nutritional insulin to be held when nutrition is interrupted, whether intentional or unintentional. Patients with interrupted tube feedings could have standing orders for a dextrose infusion to replace the tube feeding carbohydrate load and prevent hypoglycemia. Ideally, there should also be a standing order allowing for real‐time management of the patient with uncertain nutritional intake. For example, when a patient's premeal assessment reveals that she may not tolerate the meal, the patient should be allowed to attempt to eat, and then the nutritional insulin should be given after the meal, in proportion to the amount of food that was eaten. This type of order will require significant nursing education and process redesign in many hospitals, but is essential for matching nutritional insulin to actual intake.
Add Correction Insulin
There is no convincing evidence for the benefit of correction (sliding‐scale) insulin in the inpatient setting, although a randomized trial demonstrating the superiority of basal/nutritional insulin regimens to sliding‐scale only regimens did incorporate a correction insulin scale as an adjunct to the superior basal/nutritional regimen.4 The SHM GCTF again emphasizes that control of hyperglycemia should be proactive and anticipatory of insulin needs, rather than reactive to hyperglycemia. Nonetheless, unexpected hyperglycemic excursions are common, and the use of correction insulin remains a pervasive and arguably logical practice. If correction insulin is used, it should be ordered as a separate step after considering basal and nutrition insulin needs. The doses of scheduled insulin should be adjusted regularly if correction insulin is consistently being required. Ideally, the prescriber should choose a preformatted corrective insulin scale, based on the patient's insulin sensitivity (Appendix 2). There should be a prompt to use the same type of insulin that is being used for nutritional insulin, and there should be instructions that this insulin is given in addition to the basal and nutritional insulin to correct for hyperglycemia. Nocturnal correction‐dose scales should be reduced in the eating patient.
Even after limiting insulin regimens to those in Table 2, multidisciplinary glycemic control teams are still left with several options within these SHM‐preferred regimens. We recommend that your team choose a single, institutionally‐preferred basal‐nutritional‐correction insulin combination for each situation.
Choosing one preferred option for these situations is advantageous because:
-
You can communicate preferred regimens more simply and succinctly to all staff.
-
You eliminate all inappropriate choices for insulin regimens for that situation, as well as some other less preferred, but acceptable choices.
-
You can encourage regimens that are most economical (by promoting the insulin regimens that reflect your hospital formulary choices).
-
Staff members can become very familiar with a few regimens, instead of being confused by a multitude of them. They can identify variations from your preferred choices and target these patients for extra scrutiny and actions should they fail to meet glycemic targets.
Although virtually every institution can provide specific guidance on insulin management in a protocol, there are tradeoffs inherent in how restrictive you can be in pushing these preferred choices in your order sets. Should you eliminate alternate basal or nutritional insulin choices from your order sets? As you integrate more and more of your preferred algorithm and regimens into your order set, you will gain incremental improvement in the standardization of inpatient insulin management. However, you reduce not only variability in ordering, but also the choices available to your prescribers and patients, and in effect you are pushing the providers to use an insulin regimen that often differs from the patient's outpatient regimen. If your institution is not yet ready to go with a single preferred insulin, simply listing your preferred insulin first with the annotation preferred can be enough to increase the use of the preferred insulin.
We endorse building the most protocol‐driven, proscriptive, insulin order set that the Glycemic Control Steering Committee believes their medical staff will accept. There are some caveats to this endorsement. First, there must be extra efforts on the backend of the admission, to ensure that the antihyperglycemic regimen is tailored to the unique needs of the patient (this is discussed further below). Second, a protocol‐driven approach is not a substitute for a good educational program for health care providers or well‐informed clinical judgment. Education should reinforce major concepts driving the protocol and should also highlight exceptions to the rule. Variance from the protocol endorsed choices should be allowed (and even encouraged) when the variance is driven by patient factors (as opposed to provider whim). Learning from this variance is a key concept in refining protocols. Education ideally should not be limited to only protocol‐endorsed choices, as staff should be familiar with the full range of antihyperglycemia regimens seen in inpatient and outpatient settings.
Special Situations
Most of the preferred regimens for different situations are outlined in Table 2 in a straightforward manner, and can be depicted in your protocols and order sets in the same way. Some conditions have enough complexity, however, that you will have difficulty placing all of the details into your one‐page protocol and order set. Details should be placed on your more detailed protocol, and educational programs should include the topics outlined below. Although insulin infusion is often the option that would provide the most reliable and expedient control of hyperglycemia in these special situations, it is an option not available in many noncritical care settings. Therefore, the discussion is limited to subcutaneous insulin control regimens.
Patient on Continuous Tube Feeding
The SHM GCTF endorses glargine or detemir as the basal insulin of choice for this setting. The nutritional and correction insulin of choice is either an RAA‐I every 4 hours (q4h), or regular insulin every 6 hours (q6h). We endorse this choice because it retains the basal‐nutritional‐correction dose concept, generally allows for continued basal insulin use if the tube feedings become interrupted, and is amenable to building a consistent institutional protocol.
There are some important caveats to this recommendation. First, realize that almost any regimen that provides a stable insulin supply would be acceptable, and many institutions will use glargine or detemir to cover both basal and nutritional needs. The downside to using large boluses of long‐acting insulin in this clinical situation is that any unexpected interruption of the feedings will necessitate prolonged infusions of dextrate 10% solution (D10) to avoid hypoglycemia
Second, because of the glycemic load inherent in tube feedings, maintenance of glycemic control in the setting of enteral feeding may be best managed by providing a higher percentage of the TDD as nutritional insulin. In these cases, ratios of basal to nutritional insulin of 40:60, or even less basal insulin, may be appropriate.
Glucocorticoid Therapy
High‐dose glucocorticoids are strongly associated with increased insulin requirements. The degree of hyperglycemia induced by steroids varies significantly from patient to patient, and the pattern of hyperglycemia will vary depending on the pattern of steroid administration. The general principle to keep in mind is that the hyperglycemia induced by a steroid dose will peak 8‐12 hours after it is given, so insulin regimens to address this should take this effect into account. For example, giving a long‐acting basal insulin like glargine to accommodate the hyperglycemic effect of a steroid bolus given in the morning would be inappropriate because the steroid effect would wane and then disappear overnight, leading to insulin‐induced hypoglycemia. NPH insulin can be ideal in this setting, either by itself, or by layering it on top of an existing regimen.
Another caveat: glucocorticoids exert their predominate effect on insulin sensitivity in muscle (as opposed to the liver), and as a result, have their most notable effect on postprandial glucose. For this reason, the best insulin regimens for this situation may use proportionally less basal insulin and more nutritional insulin. One common regimen calls for keeping the basal insulin dose the same as the preglucocorticoid dose, while escalating the RAA insulin dose at lunch and dinner.
Given the complexities of covering steroid‐induced hyperglycemia and its high prevalence in certain populations (such as transplantation patients and patients undergoing chemotherapy), this would be an excellent area on which to focus expertise. Examples include routine endocrinology consultation, intervention by a special glycemic control team, or incorporating routine glucose monitoring and triggers for initiating insulin infusion into the protocols for chemotherapy and transplantation patients.
Regiment the Management of Hypoglycemia
Hypoglycemia is defined by the ADA as a blood glucose of 70 mg/dL or less, based on the physiologic changes that can occur at this glucose level, even in subjectively asymptomatic patients.3 Protocols for management of hypoglycemia should be linked to your diabetes/hyperglycemia protocols. There are many hypoglycemia protocols available for review in the SHM Glycemic Control Resource Room and Glycemic Control Implementation Guide.10 Some common themes for effective implementation stand out. First, the protocols need to walk the balance between simplicity of use, and the need to provide instructions that will provide guidance in a variety of patient situations. Second, the protocols need to be nurse driven, so that nurses can initiate treatment without waiting for a physician order. Third, education and instruction regarding recognition of risk factors, and avoidance of hypoglycemia are needed to support a successful protocol. Importantly, any hypoglycemic event should lead to a reconsideration of the current anti‐hyperglycemic regimen so that future events can be prevented.
Plan for Discharge and Provide Guidance for the Transition
Your institution should have policies and procedures outlining all the steps needed to complete the important transition out of the hospital. At a minimum, this planning should include adequate education (including a learner assessment), appropriate follow‐up, referral to community resources, and a discharge glycemic control regimen that is tailored to the educational, financial, and motivational profile of a patient. The more your inpatient insulin management is driven by protocol, the more likely it is the patient will be on an inpatient treatment plan that differs from their outpatient regimen; therefore, it is even more important to plan this transition carefully and reliably.
Communicating the accurate hyperglycemia related diagnosis and related problems to the primary care provider is important for good care, perhaps even more so for patients who had hyperglycemia while hospitalized without a prior diagnosis of diabetes. Some centers place a prompt for hyperglycemia related diagnosis in the order set and/or discharge paperwork, to remind the clinician to convey the diagnosis to the primary provider, and to encourage more complete documentation. Improved documentation can also improve the business case for glycemic control, along with other strategies outlined elsewhere in this supplement.13
Transitions in care (including transitions out of the hospital and off of infusion insulin) are discussed in more detail14, 15 elsewhere in this supplement. The principles outlined in these references should be incorporated into your institutional protocol. Briefly, not all patients require or are capable of intensive basal‐bolus regimens upon discharge. The HbA1c can be very valuable in arriving at the optimal outpatient regimen.14 The capacities and preferences of the patient and the context of his or her outpatient care environment (including the preferences of the primary care provider) must be taken into consideration as an outpatient management program is planned.
PULLING IT ALL TOGETHER: MAKE SURE YOUR PROTOCOL/ORDER SET IS EASY TO USE AND WIDELY UTILIZED
When standardizing hospital management of diabetes and hyperglycemia, we recommend building the full protocol first, then crystallizing the protocol into a one‐page summary that can be widely disseminated. The protocol guidance is then incorporated into the order set and nursing medical administration record (MAR). Again, we recommend the most proscriptive and protocol‐driven order set feasible within the constraints of medical staff support. The example order set in Appendix 2 illustrates this approach along with other desirable features:
-
Check‐box simplicity on when to order appropriate glucose monitoring.
-
Prompt for the proper hyperglycemia‐related diagnosis.
-
Prompts to document diagnosis and to order HbA1c level.
-
Use of encouraged insulin terminology: basal, prandial (or nutritional), and correction. Language is a powerful thing, and just getting staff to use these terms goes a long way toward the more physiologic prescribing of insulin.
-
Statement/reminder of a glycemic goal.
-
Prompts and contact information for appropriate consultation.
-
Elimination of unapproved abbreviations (such as U for units).
-
Stating both generic and brand names of insulin preparations.
-
Important timing cues for administration of insulin.
-
Several correction‐dose scales suitable for different insulin sensitivities. One size does NOT fit all.
-
Incorporation of a simple hypoglycemia protocol into the order set.
-
Insulin dosing guidelines available at the point of care (in this case, on the back of the order set).
Additional nursing‐specific cues (such as an admonition to never mix glargine insulin with other types of insulin) can also be included in the MAR whenever glargine is ordered.
Once you have protocols and order sets to guide providers, you need to assure that they are used for the majority of hyperglycemic patients. Educational programs should introduce your interventions and the rationale for them. In order to make your method the default method of care, your team should survey all preprinted or CPOE insulin order sets of your institution. A review of postoperative, transfer, and admission order sets that all services use may reveal a half‐dozen or more embedded sliding‐scale insulin order sets that should be removed, with prompts to use the standardized insulin order set being placed in their stead.
Computerized order sets present both challenges and opportunities. Wording limitations and the scrolling nature can make concepts less clear, yet there is a capability for incorporating a hierarchical structure that allows for guiding the user through a more algorithmic approach. There is also a capacity to provide assistance with dosing calculations that do not exist in the paper world. Education remains of key importance for both methods.
MONITOR THE USE AND EFFECTIVENESS OF YOUR PROTOCOLS AND ORDER SETS
Creating and implementing protocols, order sets, and other tools is not the end of the journey to improve care. It is important to monitor order set utilization, insulin use patterns, and parameters measuring glycemic control and hypoglycemia, as outlined in more detail in another article in this supplement.16 In addition to summary data every month or so, we recommend daily reports that spur action in near real time. Triggers such as uncontrolled hyperglycemia, markedly elevated HbA1c levels, and nonphysiologic insulin regimens should initiate consultation, extra diabetes education, or referral to a glucose control team. If appropriate consultation is not readily available, the glycemic control steering group should lobby the administration to bolster this capability. Qualitative feedback from the frontline caregivers, as well as this quantitative data, can assist the local glycemic control champions in designing even more effective protocols, order sets, focused educational efforts, and concurrent mitigation of suboptimal care.
CONCLUSION
Diabetes, hyperglycemia, and iatrogenic hypoglycemia are common and important conditions affecting the noncritically ill inpatient. Interventional trials to validate the recommended noncritical care unit glycemic targets are needed. Although there is a growing consensus on best practices to care for these patients, numerous barriers and the complexity of caring for inpatients hamper the reliability of best practice delivery. Institutional protocols and protocol driven subcutaneous insulin orders, when implemented with the strategies outlined here, can be the key to delivering these best practices more reliably.
Appendix
- American College of Endocrinology Task Force on Inpatient Diabetes and Metabolic Control.American College of Endocrinology Position Statement on Inpatient Diabetes and Metabolic Control.Endocr Pract.2004;10:77–82.
- ,,,,,,.Management of diabetes and hyperglycemia in hospitals.Diabetes Care.2004;27:553–591.
- American Diabetes Association.Standards of Medical Carein Diabetes‐2006.Diabetes Care.2006;29(suppl 1):s4–s42.
- ,,, et al.Randomized study of basal‐bolus insulin therapy in the inpatient management of patients with type 2 diabetes (RABBIT 2 Trial).Diabetes Care.2007;30:2181–2186.
- ,,,,.Inpatient management of diabetes and hyperglycemia among general medicine patients at a large teaching hospital.J Hosp Med.2006;1:145–150.
- ,,, et al.Diabetes care in the hospital: is there clinical inertia?J Hosp Med.2006;1:151–160.
- ,,, et al.Diabetes care in hospitalized non‐critically ill patients: more evidence for clinical inertia and negative therapeutic momentum.JHosp Med.2007;2:203–211.
- Inpatient Diabetes and Glycemic Control: A Call to Action Conference. Position Statement. AACE, February2006. Available at: http://www.aace.com/meetings/consensus/IIDC/IDGC0207.pdf. Accessed October, 2006.
- Proceedings of the American College of Endocrinology and American Diabetes Association Consensus Conference, Washington, DC, January 30–31, 2006. Endocr Pract.2006; 12(suppl 3):3–13.
- Society of Hospital Medicine Glycemic Control Task Force. Implementation Guide: Improving Glycemic Control, Preventing Hypoglycemia, and Optimizing Care of the Inpatient with Hyperglycemia and Diabetes. Published January 2007 on the Society of Hospital Medicine website. Available at: http://www.hospitalmedicine.org. Accessed August,2007.
- .Management of hyperglycemia in the hospital setting.N Engl J Med.2006;355:1903–1911.
- ,,,,.Management of diabetes and hyperglycemia in the hospital: a practical guide to subcutaneous insulin use in the non‐critically ill adult patient.J Hosp Med.2008;3(5):S17–S28.
- ,.Practical strategies for developing the business case for hospital glycemic control teams.J Hosp Med2008;3(5):S76–S83.
- ,,,.Bridge over troubled waters: safe and effective transitions of the inpatient with hyperglycemia.J Hosp Med.2008;3(5):S55–S65.
- ,,,.Designing and implementing insulin infusion protocols and order sets.J Hosp Med.2008;3(5):S42–S54.
- ,,,,,.SHM Glycemic Control Task Force summary: practical recommendations for assessing the impact of glycemic control efforts.J Hosp Med.2008;3(5):S66–S75.
Transitions in Inpatient Hyperglycemia
Professional and patient safety organizations have recognized the importance of safe transitions as patients move through the health care system, and such attention is even more critical when attempting to achieve glycemic control.14 Since the publication of the Diabetes Control and Complications Trial (DCCT)5 and the United Kingdom Prospective Diabetes Study (UKPDS),6 we have known that intensive glycemic control in the ambulatory setting prevents complications in both type 1 and type 2 diabetes mellitus (DM). Despite the increased risk of hypoglycemia, these trials changed practice patterns in the outpatient settings in favor of intensification of diabetes therapy. In the same way, randomized, prospective trials using intravenous (IV) insulin therapy have revolutionized our thinking about inpatient care by showing that tight glycemic control in the critically ill7 and patients with acute myocardial infarction8 reduces mortality and morbidity. These, as well as additional observational studies associating hyperglycemia with poor outcomes in a variety of medical and surgical patients,915 have led to increased attention on glycemic control in all venues of care.16, 17 Concerns over excessive hypoglycemia and a nonsignificant increase in mortality in certain populations of medical intensive care unit (ICU) patients have raised questions over whether the initial studies can be reproduced or generalized to other groups of inpatients.18, 19 Additional studies are underway to clarify these questions but consensus exists that blood glucose values should at least be less than 180 mg/dL and that the traditional practice of ignoring hyperglycemia is no longer acceptable.
While a uniform focus on glycemic control will allow our patients to receive a consistent message about diabetes, the unique limitations inherent to each practice setting requires different therapeutic regimens and intentional focus on the risks as patients transition from one care area to another. This work addresses several areas of care transition that are particularly important in safely achieving glycemic control including: transition into the hospital for patients on a variety of home regimens, transitions within the hospital (related to changes in dietary intake, change from IV to subcutaneous [SC] therapy, and the perioperative setting), and the transition from the hospital to home or another healthcare facility.
TRANSITION INTO THE HOSPITAL
Until recently, most patients with diabetes admitted to the hospital were managed with sliding‐scale‐only regimens.20, 21 Unfortunately, this led to a variety of complications, including hyperglycemia, hypoglycemia, iatrogenic ketoacidosis, and an inconsistent message to patients on the importance of glycemic control.22 Some outpatient clinicians and patients combated this tradition by creating in‐hospital glucose control plans with orders, which patients would bring with them to the hospital.23 This practice continues to be a helpful way to guide inpatient therapy and is encouraged when available. Glycemic‐controlrelated documents from outpatient clinicians should include the most recent glycosylated hemoglobin (HbA1c) value, diagnosis and known complications, current names and doses of medications, and other patient‐specific preferences or needs (eg, compliance, financial, fear of needles). If the last HbA1c was performed more than 30 days before admission or is not available, one should be obtained upon hospital admission to help guide discharge therapy.24 By knowing the HbA1c, one can determine the level of diabetic control achieved with the current regimen and can help the inpatient team (clinician and patient) determine if a more aggressive glycemic control regimen is necessary at the time of discharge. It is important to note that if the patient has received a transfusion of red blood cells prior to HbA1c measurement or has a hemoglobinopathy, the HbA1c value may not be accurate.25, 26
In general, the outpatient regimen will need to be modified at admission to achieve the appropriate flexibility needed for the changing nutritional intake and insulin requirements that invariably accompany hospitalization. Sulfonylureas and dipeptidyl peptidase 4 inhibitors (DPP4), such as sitagliptin, have most of their effect immediately, but the other oral antihyperglycemic agents have a relatively long delay between treatment and effect, thus they are not a flexible enough method to achieve glycemic control in the hospital. Additionally, inpatients may have transient contraindications to their prior oral antihyperglycemic medications. Metformin is almost always on hold in the hospital setting, at least initially, due to concerns about lactic acidosis. Sulfonylureas can cause hypoglycemia in the setting of worsening renal function or reduced oral intake. Thiazoladinediones (TZDs) are often withheld due to concerns about fluid retention and should be avoided in patients admitted with heart failure. There is little experience in the hospital with the use of newer agents like exenatide, pramlintide, glinides, and DPP4 inhibitors.
Overall, it is generally recommended that oral antihyperglycemic agents be discontinued upon hospital admission and replaced with insulin infusions or scheduled SC insulin. An estimate of 0.4 to 0.5 units/kg of body weight provides a conservative starting point for the total daily dose of insulin (TDD) for most patients. This TDD should then be divided into basal and nutritional components to match the patients' caloric intake. Additional correction doses of insulin should be prescribed to cover episodes of hyperglycemia that develop despite the provision of anticipatory‐physiologic insulin. Further discussion of insulin dosing and SC regimens is available in detail elsewhere.27, 28 The recommendation for these insulin‐only regimens is made regardless of the glycemic control in the outpatient setting and is not meant to imply that they should be continued at discharge. In fact, most patients will return to their home regimen or to one that is intensified but less labor intensive than the basal‐nutritional‐correction insulin used in the hospital. The antihyperglycemic regimen planned for discharge should be anticipated as early as possible and clearly communicated to the patient and/or caregivers to allow for optimal education.
Outpatient insulin regimens that have a high percentage of basal insulin need to be modified during hospital admission to avoid hypoglycemia that may occur from variable nutritional intake. While hospitalized, the basal portion of the estimated TDD generally should not be more than 50% to 60%. The total number of units of all types of insulin used daily as an outpatient can be used as a starting point for determining the inpatient TDD by a 1:1 conversion. Adjustments up or down based on glycemic control, nutritional intake, and other factors are then necessary. If patients are on regimens with insulin plus oral agents at home, the inpatient TDD should either be the home insulin dose or the dose calculated based on their weight, whichever is greater. Patients who use carbohydrate counting to determine nutritional insulin doses as an outpatient might be continued on this regimen if they have a strong understanding of the methods, they are coherent enough to determine their doses, nursing staff are well educated, and dietary services provides the carbohydrate content for the hospital menu. If patients are on insulin pumps at home, these should be managed according to a uniform hospital policy to assure safety. If conversion to multiple daily injections is needed, the same 1:1 conversion is safe.29
Transitions Within the Hospital
General Issues
Within the hospital itself, there are several transitions that have important quality and safety implications regarding glycemic control. The handoffs between providers should follow a standardized format.4, 30, 31 Essential information will vary depending on the setting but should universally include recent hypoglycemia, insulin type and doses, and hypoglycemic risk factors such as changes in insulin doses, the development of renal insufficiency, inability of the patient to self‐report symptoms, tapering of steroids, and cessation or interruption of nutritional intake.32
One of the greatest risks for hypoglycemia in the hospital comes from the unpredictable nutritional interruptions that occur. Unplanned changes are best handled by nurses having an existing order to hold scheduled nutritional insulin if patients are classified nothing by mouth (NPO) or eat 50% of their meal. Additionally, nursing staff should have orders or policies that allow flexibility in the time of administering scheduled rapid‐acting nutritional insulin so that it may be given during or immediately following the meal in patients at higher risk for poor oral intake. Tube feedings also place patients at high risk for hypoglycemia because the tube may become dislodged or they may begin to have feeding intolerance. For these reasons, a measure of safety would be to have standing orders to substitute IV 10% dextrose in water (D10W) at the same rate as the prior tube feeds, hold nutritional insulin, and begin more frequent monitoring whenever tube feeds are stopped.33 Orders that rely on nursing staff to notify a physician when tube feedings are stopped are generally not directive enough because providers may be distracted by other changes or forget the patient is on long‐acting insulin. The need for this flexibility around nutritional dosing emphasizes the importance of avoiding excessive doses of basal insulin. If the total dose of basal insulin is 40% to 50% of the TDD, it can safely be continued at its usual dose despite changing nutritional intake. The only exception is neutral protamine Hagedorn (NPH) insulin, which should be reduced when patients are NPO due to its peak. Generally, a 50% reduction in NPH is recommended for morning doses, but bedtime doses may be given with little to no reduction. Because of the complexity of these issues, standardized order sets are the best way to reliably communicate all the necessary standing orders to nursing staff (Table 1).
|
| Nutritional insulin |
| Hold if patients are NPO or eat less than 50% of their meal. |
| Administer scheduled rapid acting nutritional insulin during or immediately following the meal if oral intake is questionable (ie, nausea, emesis, or newly advancing diet). |
| Tube feedings: When tube feeds are stopped unexpectedly |
| Start dextrose containing IV fluids (many institutions use D10W at the same rate as the prior tube feeds). |
| Hold scheduled nutritional insulin. |
| Notify physician. |
| Basal insulin |
| Continue if NPO. |
| Reduce morning dose of NPH by 50% if NPO and may need to reduce the dose of bedtime NPH. |
| IV to subcutaneous transition |
| Timing for discontinuing IV infusion in relation to first dose of subcutaneous insulin. |
| Prompts for verbal communication between ICU and general ward staff. |
Transitioning the Patient Off of IV Insulin
The strongest evidence for tight glycemic control derives from studies in the surgical ICU.7 Many hospitals have robust, effective IV‐insulin protocols. The frequency of monitoring and rapidity of action of IV insulin allow quick achievement of blood glucose control. As patients begin to eat, the layering of SC nutritional insulin on top of the insulin infusion may reduce the lability of the infusion rate and prevent excursions in glycemic control. When the patient is ready to leave the ICU or start a full oral diet, it is recommended that they transition off of the IV insulin to a basal‐nutritional‐correction regimen.33, 34
The amount of insulin needed with IV infusion is a useful estimate of the TDD of insulin.28, 33, 35, 36 There are important general steps to take when making this transition; but, due to the lack of conclusive data proving the advantage of one regimen over another, there are a variety of acceptable specific protocols (Table 2).3739 First, it should be determined if patients are expected to require ongoing scheduled SC insulin or not. Certainly, all patients with type 1 DM will require scheduled SC insulin, but patients with type 2 DM on low insulin infusion rates or some patients with new hyperglycemia can appropriately be managed with sliding‐scale alone. Next, the average hourly rate of the infusion over the preceding 6 to 8 hours should be determined because it most accurately reflects current insulin needs during the changing stress, nutrition, and medications in critical care patients. This hourly rate will then be converted to a TDD using a safety factor to anticipate decreasing insulin requirements. Some portion of this daily total will then be assigned to be basal insulin. As patients' clinical conditions approach baseline, so will their insulin requirements, and the dose will need to be revised.24
|
| Step 1: Is patient stable enough for transition? Hypotension, active sepsis, vasopressors, and intubation are contraindications to transition due to unreliable subcutaneous insulin absorption and continued need for the most flexible dosing due to frequently changing insulin requirements. |
| Step 2: Does this patient need a transition to scheduled subcutaneous (SC) insulin? |
| Yes |
| All patients with type 1 DM. |
| Type 2 DM patients on insulin as outpatient. |
| Type 2 DM patients with a recent mean infusion rate of 0.5 units/hour.* |
| No |
| Type 2 DM patients with infusion rate 0.5 units/hour.* |
| Stress hyperglycemia or previously unrecognized DM if infusion rate 1 unit/hour, or if HbA1c near normal. |
| Some institutions exclude all stress hyperglycemia patients from transition to a SC insulin regimen, regardless of drip rate. |
| Step 3: If transition is needed, calculate a total daily dose (TDD) of insulin. The TDD is an estimate of the 24‐hour insulin requirement when the patient is receiving full nutrition. |
| Determine mean insulin infusion rate from last 6 to 8 hours. |
| Calculate 24‐hour insulin dose based on this, and reduce this 24‐hour dose by some safety factor. There are several options for this step. |
| Multiply hourly rate by 24, then multiply by 0.7 or 0.8 to arrive at a safety‐adjusted 24 hour insulin dose. |
| OR |
| Multiply hourly infusion rate by 20 (80% of 24). |
| Determine if this total is the TDD or basal dose based on current nutrition. There are several options for this step for you or your institution to choose. |
| If infusion was serving basal AND nutritional needs of patient (such as a patient on 24‐hour tube feedings) this will be your TDD. |
| OR |
| If the infusion insulin was not covering significant nutrition, this could be the BASAL insulin dose. |
| Step 4: Construct a regimen tailored to the patient's nutritional situation, building in safeguards for any changes in nutritional intake and uncertainties about reliability of intake. Several options are again available. |
| Basal: should be ordered as basal glargine or detemir (these are preferred by SHM GCTF but NPH is also an option). |
| Dose is 40% to 50% of TDD. |
| OR |
| Adjusted 24‐hour IV requirement given all as basal. |
| Nutritional: The remainder of the TDD is scheduled nutritional insulin in divided doses. In general, these doses need to be adjusted down for 100% nutritional intake and the orders should allow for administering nutritional insulin just AFTER observed meals to allow an assessment of intake. There are several options for estimating the initial doses: |
| Use 50% of the TDD as nutritional coverage and divide this amount by 3 to determine the scheduled meal dose. Hold if they do not eat more than 50% of their meal. |
| Use a more conservative start of 10% to 20% of the basal dose scheduled with each meal. |
| Use carbohydrate counting to cover nutritional intake. |
| Step 5: Be sure to give SC insulin BEFORE the infusion stops |
| Basal glargine or detemir are ideally given at least 2 hours before infusion is discontinued. |
| Shorter lead times (30 minutes) are possible if rapid acting insulin is given with basal insulin. |
SC insulin should be given before the drip is discontinued to allow an overlap that takes into consideration the onset of action. The first dose of basal insulin should be given 2 hours before the insulin infusion is discontinued.24, 40 However, because this is not always feasible, (ie, the patient needs to leave the ICU sooner), another option is to turn off the drip and give 10% of the basal dose as rapid acting insulin along with the basal dose.39 The timing of subsequent doses will depend on the specific basal insulin that is ordered as well as institutional consideration of usual care delivery and nursing workflow. Given that there are several options to achieve this important overlap between IV and SC insulin, it is best for a multidisciplinary team to choose some preferred way that is the institutional standard. Having a standard allows targeted education and tracking of adherence to best practices.
Because conversion to SC insulin is a complex task and the opportunity may arise while physicians are busy with other clinical priorities, there are several options to assure that the necessary steps take place. Some institutions may build a protocol for this transition on paper or computerized order entry, build cues and dosing charts into order sets, and/or develop nursing documentation and nursing process to influence physician and nurse behavior. This critical juncture is also a good place to focus expertise with a glycemic control team, pharmacist, specially trained nurses, or some other dedicated team to take over this transition for all patients.36 The complexity and aggressiveness of the specific institutional protocol used will depend on the confidence and experience of those individuals responsible for determining the transition doses.
The transition from IV to SC insulin often coincides with a change in patient location, (ie, from the ICU to general medical ward). It is imperative that appropriate communication occurs between the transferring and receiving nurses and physicians to continue with the care plan for glycemic management. This communication can be encouraged through provider education and automated into the standardized order process.
Perioperative Transitions
Patients undergoing surgery present a special challenge. They are faced with not only the physiologic and mental stress of surgery but also the hazards of multiple handoffs across several care teams, all with different priorities and cultures. As in other areas, standardized protocols specific to this area of transition are important in assuring safe and effective perioperative glycemic control. Procedures should preferably be scheduled for the early morning to have the least impact on insulin dosing. Patients who are admitted only for the procedure will have to manage this transition on their own and need to be given specific instructions along with the general preoperative orders.24, 41 In general, the usual dose of glargine can be given the day prior to the procedure if it is approximately 50% of their TDD. This is an important caution because some outpatient regimens use large doses of glargine, which essentially provide both basal and nutritional coverage. In those patients, the glargine dose should be reduced by 20% to 50% to provide a safety margin. As with any patient who is NPO, the morning dose of NPH should be one‐half of the usual dose, scheduled nutritional insulin should be held, and the usual doses of correction insulin should be reduced. The appropriate preoperative dose adjustments also depend on whether the individual patient is ketosis‐prone and how tight their glycemic control is as an outpatient.
Upon arrival to the hospital or during the time that the inpatient is NPO, dextrose containing IV fluids should be administered to minimize the risk of hypoglycemia and prevent ketosis. Given the risks for wide variation, blood glucose monitoring should occur every 1 to 2 hours before, during, and initially after the procedure. Infusion insulin allows the most rapid titration and reliable delivery (compared with SC infusions or injections) and is therefore the preferred regimen for major surgery requiring prolonged NPO status or prolonged surgery in patients with type 1 diabetes. Basal‐nutritional‐correction SC insulin is preferred in other surgical inpatients because their nutritional intake is variable and the stress of surgery affects insulin requirements.
Oral antihyperglycemic agents should be held around the time of surgery. If patients are on an oral agent that can result in hypoglycemia, (ie, sulfonylurea or other insulin secretagogue), it should be held on the day of the procedure. Metformin must be held for safety concerns, given the possible decrease in renal function around surgery. It should be held beginning on the day of the procedure or the day before in the case of the sustained‐release formulation. It can then be resumed 48 hours postoperation after normal renal function is secured and the patient is discharged home. Alpha‐glucosidase inhibitors should be held whenever patients are NPO because they only work when taken with meals. Thiazoladinediones have a long duration of action and so can be continued or stopped around surgery. Finally, glucagon‐like peptide (GLP‐1) agonists (exenatide) should be held until the patient is eating normally and discharged home due to the high incidence of gastrointestinal side effects.
TRANSITIONING FROM THE HOSPITAL
The final but perhaps most important transition is the one from the hospital. With much attention on glycemic control in the hospital, it will become clear to many clinicians that the outpatient regimen needs to be modified. However, any changes in medications increase the chances of hypoglycemia and the possibility of error. The postdischarge time frame has been poorly studied and was specifically identified by the Association for Clinical Endocrinologists (ACE) and American Diabetes Association (ADA) as an area in need of future research.36
Patients may be discharged to a nursing home, hospice, or home, and numerous factors need to be considered to determine the optimal discharge regimen. Important considerations are the HbA1c at admission, home medications, medication interactions, current medical problems, nutritional status, physical disabilities, frequency of self‐monitoring, hypoglycemic risk factors, contraindications to oral medications, goals of care/life expectancy, and financial and other resources. If there are temporary physical or self‐care limitations, then a visiting nurse may need to be arranged to assure a safe transition home with the optimal therapy. If patients are going to a skilled nursing facility or other acute care hospital, the formulary, processes, and staffing issues of that facility will be additional important considerations in determining whether therapy is the same as in the hospital or more like what it will be at home.
An algorithm for outpatient therapy for type 2 DM was recommended in a consensus statement from the ADA and European Association for the Study of Diabetes.42, 43 This has been modified using additional recommendations from the AACE44 and is depicted in Figure 1. While the delineation of these steps is helpful, it must be emphasized that both the choice of regimen and dose will need to be individualized. Prescribing the ideal frequently falls short if there is no way for the patient to implement the recommendations. Intensive insulin therapy requires training in food intake/emnsulin matching, motivation of the patient and outpatient clinician, 4 times daily self‐monitoring of blood glucose, and considerable expense. Some patients may be temporarily continued on basal‐nutritional‐correction regimens as their insulin requirements are rapidly changing and later converted to regimens that involve less frequent insulin doses, (ie, twice daily premixed insulin or basal insulin with oral agents or oral agents alone).45, 46 Other patients who may be medically appropriate for intensive insulin therapy may first need to gain confidence with more simple insulin regimens. There are numerous additional resources on initiating insulin that the reader is referred to for more detail.4448
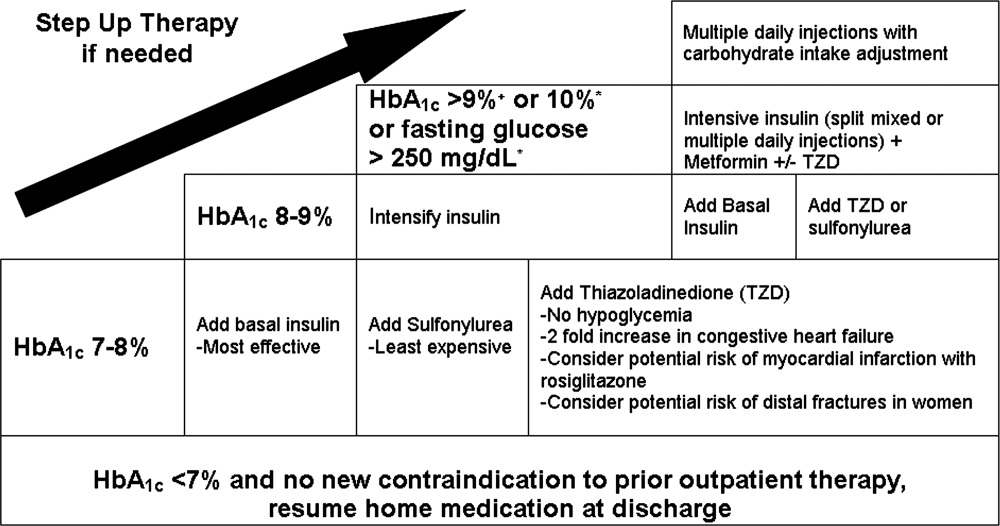
Oral antihyperglycemic drugs are usually held while a patient is admitted to the hospital but once medical conditions are improved, oral intake is established, and renal function stabilized, these drugs can be restarted. If a patient has a new contraindication to metformin or sulfonylureas but does not need insulin, a TZD or DPP4 inhibitor should be considered. Elderly patients and those with renal or liver disease are at increased risk for developing hypoglycemia.49, 50 Glyburide should be avoided, and doses of other sulfonylureas may need to be adjusted. Other options that may be considered in this situation include sitagliptin and exenatide.51 When patients will be discharged on oral diabetic medications alone, discontinue the basal insulin 12 to 24 hours before and the scheduled nutritional insulin at the same time oral agents are restarted. Sulfonylureas, metformin, DPP4 inhibitors, and exenatide will have most of their effect in the first day, but TZDs have a delayed onset and may not be a good bridge for immediate control at discharge.
If patients are going to be discharged on basal insulin in addition to oral agents, several options exist for determining the dose. Because of the risk of hypoglycemia after discharge, it is advised to either reduce the doses of oral agents or choose more conservative insulin starting doses.52 One possibility is to discontinue the nutritional and correction doses, continue the hospital dose of basal insulin, and restart the oral antidiabetes medications. If the dose of basal insulin was more than 50% of the TDD of insulin, it may need to be reduced. A more conservative option for patients at a higher risk of hypoglycemia is to start 0.2 units/kg or 10 units of NPH, glargine, or detemir at bedtime (Figure 2). Once discharged, blood glucose should be measured 1 to 4 times a day and the basal dose titrated by several different validated methods.53, 54 Appropriate orders for necessary supplies for insulin therapy include a meter with test strips, lancets, syringes, needles, and glucagon kit.55
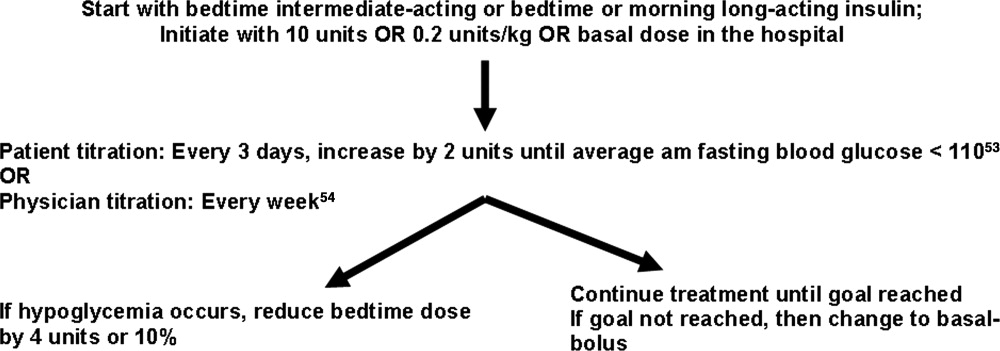
With a large number of patients with diabetes remaining undiagnosed, it is important to use the information available during hospitalization to identify previously unrecognized diabetes or prediabetes.24 Because there are no unique criteria for the diagnosis of DM in the stressed state, patients may have a presumptive diagnosis made in the hospital and/or follow‐up testing with fasting glucose or an oral glucose tolerance test. No ADA diagnostic thresholds for the HbA1c currently exist, but it can be a useful marker in making this distinction.56 Among patients with new hyperglycemia, an HbA1c of 6% or greater was 100% specific for predicting a future diagnosis of diabetes in the small prospective cohort study by Greci et al.,57 but many endocrinologists use a cutoff of 7%. For all hyperglycemic patients, lifestyle interventions that promote weight loss and increased activity levels should be encouraged. New hyperglycemia should be clearly identified as a diagnosis in discharge communication.
There are many barriers to diabetes self‐management education in the inpatient setting but there are also numerous resources and opportunities. New information will be available regarding patients' understanding of their disease and glycemic control and there may be plans for changes in the home medication regimen. Most of the focus of inpatient education sessions is on survival skills such as taking medications, performing blood glucose monitoring, basic meal planning, identification and treatment of hypoglycemia, sick‐day management, how to access further diabetes education as an outpatient, and when to call the healthcare team.58 The most effective way to accomplish all of this is to identify the discharge regimen early and include nurses and staff in a plan to educate all patients. An inpatient diabetes educator can provide additional help with newly‐diagnosed or uncontrolled patients. Dividing the material over the hospitalization makes it less overwhelming for patients, reinforces previously taught concepts, spreads the responsibility to more providers, and offers it in conjunction with the correlating clinical care. Throughout their hospital stay, patients can begin to practice new skills, including blood glucose monitoring and logbook use, drawing up and administering insulin, sharps disposal, basic diabetic diet information, and sick‐day management. The specific topics addressed in each session can be tracked as part of an interdisciplinary education record that allows coordination among the individuals involved in teaching.59 It is important to give patients the basics, support them with minimal written information, and provide them appropriate follow‐up diabetes education.60 Furthermore, the inpatient team should view the patient's glycemic control education as something that needs to continue across the continuum of care and develop communication strategies that connect with the follow‐up clinical team.
At the time of discharge, it is essential that written documentation and communication with outpatient care providers be completed.61, 62 The more standardized the inpatient insulin regimens are, the more likely the patient is to be on a much different glycemic control regimen than the one on admission; therefore, it is even more important to assure that the admission medication list is accurate and reconciled completely with the modified list at discharge. Discharge check lists and tools for assessing patient acceptance of the discharge plan help with this process.63 Follow‐up with the primary care physician should occur within 7 to 14 days if patients are new to insulin, had medication changes, or are elderly. An increased likelihood of keeping posthospitalization appointments with a diabetes specialty clinic has been associated with being discharged on insulin, a new diagnosis of diabetes, and direct referral.64 Additional attention should be paid to barriers to follow‐up, including lack of health insurance, prior difficulty with follow‐up, and transportation problems.65
SUMMARY
A variety of factors have contributed to difficulty in achieving inpatient and outpatient glucose control. These include care complexity, the lack of standardized protocols, limited knowledge about glucose control, and clinical inertia. Inpatient clinicians have a tendency toward keeping patients on their home regimen in hopes that they might test its effectiveness. Furthermore, there has been the notion of why optimize the glycemic regimen of inpatients because their diabetic needs will change in the outpatient setting. However, because the insulin requirements during acute illness are different and nutritional intake is variable, nearly all inpatients should be placed on multiple daily doses of scheduled insulin or IV insulin to allow the necessary flexibility for rapid titration and abrupt changes in nutrition. This intensive regimen is only appropriate for a minority of outpatients. This difference illustrates that a regimen that works perfectly in one clinical setting will not necessarily be optimal in the next. The patient's outpatient treatment regimen should be reassessed based on HbA1c, self‐monitoring prior to admission, and new contraindications based on medical issues. If a change is indicated and the inpatient physician is motivated, there are numerous helpful resources to aid in addressing all the necessary factors surrounding intensification of therapy.
Despite requiring different glycemic control regimens, the information gained from the needs in each setting guide the next, making communication and planning paramount. Important transitions that must be given attention are: (1) admission to the hospital; (2) in‐hospital transitions, including the perioperative period and IV‐to‐SC insulin; and (3) the hospital to outpatient transition. The complexity of such frequent transitions requires planning, education, and clear communication that are best handled with a systems approach and the development of standardized protocols and order sets. Hospitalists, endocrinologists, and other members of the healthcare team should take an aggressive role in developing systems and facilitating optimal transitions to maximize glycemic control. Further studies are needed to determine the best practices among the variety of options discussed in this article.
- ACE/ADA Task Force on Inpatient Diabetes.American College of Endocrinology and American Diabetes Association Consensus Statement on Inpatient Diabetes and Glycemic Control.Endocr Pract.2006;12:458–468.
- American Board of Internal Medicine Foundation Stepping Up to the Plate Alliance. Available at: http://www.abimfoundation.org/quality/suttp.shtm. Accessed November2007.
- National Transitions of Care Coalition. Available at: http://www.ntocc.org. Accessed November2007.
- JCAHO 2008 National Patient Safety Goals. Availableat: http://www.jointcommission.org/PatientSafety/NationalPatientSafetyGoals/08_hap_npsgs.htm. Accessed November2007.
- Diabetes Control and Complications Trial Research Group.The effect of intensive treatment of diabetes on the development and progression of long‐term complications in insulin‐dependent diabetes mellitus.N Engl J Med.1993;329:977–986.
- UK Prospective Diabetes Study (UKPDS) Group.Intensive blood‐glucose control with sulphonylureas or insulin compared with conventional treatment and risk of complications in patients with type 2 diabetes: UK Prospective Diabetes Study (UKPDS) Group.Lancet.1998;352:837–853.
- ,,, et al.,Intensive insulin therapy in critically ill patients.N Engl J Med.2001;345:1359–1367.
- ,,,.Glycometabolic state at admission: important risk marker of mortality in conventionally treated patients with diabetes mellitus and acute myocardial infarction: long‐term results from the Diabetes and Insulin‐Glucose Infusion in Acute Myocardial Infarction (DIGAMI) study.Circulation.1999;99:2626–2632.
- ,,,,.Relationship of early hyperglycemia to mortality in trauma patients.J Trauma.2004;56:1058–1062.
- ,,,,.Early peri‐operative glycaemic control and allograft rejection in patients with diabetes mellitus: a pilot study.Transplantation.2001;72:1321–1324.
- ,,, et al.Relation between the duration of remission and hyperglycemia in induction chemotherapy for acute lymphocytic leukemia with a hyperfractionated cyclophosphamide, vincristine, doxorubicin and dexamethasone/methotrexate cytarabine regimen.Cancer.2004;100:1179–1185.
- ,,,,.Stress hyperglycemia and prognosis of stroke in nondiabetic and diabetic patients: a systematic overview.Stroke.2001;32:2426–2432.
- ,,,,,.Diabetes and outcome of community‐acquired pneumococcal bacteriemia.Diabetes Care.2004;27:70–76.
- ,,.Early postoperative glucose control predicts nosocomial infection rate in diabetic patients.JPEN J Parenter Enteral Nutr.1998;22:77–81.
- ,,,,.Early post‐operative glucose levels are an independent risk factor for infection after peripheral vascular surgery. A retrospective study.Eur J Vasc Endovasc Surg.2004;28:520–525.
- American Diabetes Association.Standards of medical care in diabetes, 2006.Diabetes Care.2006;29(suppl 1):s4–s42.
- American College of Endocrinology Task Force on Inpatient Diabetes and Metabolic Control.American College of Endocrinology Position Statement on Inpatient Diabetes and Metabolic Control.Endocr Pract.2004;10:77–82.
- ,,, et al.Intensive insulin therapy in the medical ICU.N Engl J Med.2006;354:449–461
- ,,, et al.Intensive insulin therapy and pentastarch resuscitation in severe sepsis.N Engl J Med.2008;358(2):125–139.
- ,,,,.Inpatient management of diabetes and hyperglycemia among general medicine patients at a large teaching hospital.J Hosp Med.2006;1:145–150.
- ,,, et al.,Diabetes care in hospitalized noncritically ill patients: More evidence for clinical inertia and negative therapeutic momentum.J Hosp Med.2007;2:203–211.
- ,,.Glycemic control and sliding scale insulin use in medical inpatients with diabetes mellitus.Arch Intern Med.1997;157:545–552.
- ,.Hospital management of hyperglycemia.Clin Diabetes.2004;22:81–88.
- ,,, et al.Management of diabetes and hyperglycemia in hospitals. [Erratum appears in Diabetes Care. 2005; 28: 1990. Dosage error in text].Diabetes Care.2004;27:553–591.
- ,.Hemoglobinopathies and HbA(1c) measurement.Diabetes Care.2000;23(8):1197–1198.
- ,,,,,.Evaluation of HbA1c determination methods in patients with hemoglobinopathiesDiabetes Care.2000;23(3):339–344.
- ,,,.Subcutaneous insulin order sets and protocols: effective design and implementation strategies.J Hosp Med.2008;3.
- ,,,,.Management of diabetes and hyperglycemia in the hospital: a practical guide to subcutaneous insulin use in the non‐critically ill, adult patient.J Hosp Med.2008;3.PMID:8675920.
- ,,,.Switch to multiple daily injections with insulin glargine and insulin lispro from continuous subcutaneous insulin infusion with insulin lispro: a randomized, open‐label study using a continuous glucose monitoring system.Endocr Pract.2005;11:157–164.
- SBAR technique for communication: a situational briefing model. Available at: http://www.ihi.org/IHI/Topics/PatientSafety/SafetyGeneral/Tools/SBARTechniqueforCommunicationASituationalBriefingModel.htm. Accessed December2007.
- . Promising quality improvement initiatives: reports from the field. AHRQ Summit—Improving Health Care Quality for All Americans: Celebrating Success, Measuring Progress, Moving Forward 2004. Available at: http://www.ahrq.gov/qual/qsummit/qsummit4.htm#sentara. Accessed December2007.
- ,,, et al.Hospital hypoglycemia: not only treatment but also prevention.Endocr Pract.2004;10(suppl 2):89–99.
- American Association of Clinical Endocrinologists Inpatient Glycemic Control Resource Center. Available at: http://resources.aace.com/PDF/Section_05‐Final‐Inpatient_Non‐ICU/Hyperglycemia_Non‐ICU_Protocols/Transition_from_ Intravenous_to_Subcutaneous_Insulin.PDF. Accessed November2007.
- Recommendations for safe use of insulin in hospitals. American Society of Health System Pharmacists and the Hospital and Health System Association of Pennsylvania. 2005. Available at: http://www.premierinc.com/safety/safety‐share/01–06‐downloads/01‐safe‐use‐insulin‐ashp.pdf. Accessed December2007.
- ,,, for the Society of Hospital Medicine Glycemic Control Taskforce. Glycemic control resource room: improving reliability of care across transitions and in the perioperative setting. Available at: http://www.hospitalmedicine.org/ResourceRoomRedesign/html/07Layer_Inter/06_Transitions.cfm. Accessed August2008.
- ACE/ADA Task Force on Inpatient Diabetes American College of Endocrinology and American Diabetes Association Consensus Statement on Inpatient Diabetes and Glycemic Control: a call to action.Diabetes Care.2006;29:1955–1962.
- ,,, et al.Conversion of intravenous insulin infusions to subcutaneously administered insulin glargine in patients with hyperglycemia.Endocr Pract.2006;12:641–650.
- ,,,.Intravenous insulin infusion therapy: indications, methods, and transition to subcutaneous insulin therapy.Endocr Pract.2004;10(suppl 2):71–80.
- ,,, et al.Inpatient management of hyperglycemia: the northwestern experience.Endocr Pract.2006;12(5):491–505.
- American Diabetes Association.Position statement: standards of medical care in diabetes‐2007.Diabetes Care.2007;30(suppl 1):S4–S41.
- American Association of Clinical Endocrinologists Inpatient Glycemic Control Resource Center. Available at: http://resources.aace.com/PDF/Section_05‐Final‐Inpatient_Non‐ICU/Hyperglycemia_Non‐ICU_Protocols/Pre‐Operative_Instructions_for_Patients_with_Diabetes.PDF Accessed November2007.
- ,,, et al.Management of hyperglycemia in type 2 diabetes: a consensus algorithm for the initiation and adjustment of therapy: a consensus statement from the American Diabetes Association and the European Association for the Study of Diabetes.Diabetes Care.2006;29:1963–1972.
- ,,, et al.Management of hyperglycemia in type 2 diabetes: a consensus algorithm for the initiation and adjustment of therapy: update regarding thiazoladinediones.Diabetes Care.2008;31:173–175.
- American Association of Clinical Endocrinologists Inpatient Glycemic Control Resource Center. Challenges in Effective Discharge Planning for Hospitalized Patients with Diabetes. Available at: http://resources.aace.com/PDF/Section_07‐Final‐Transition‐Inpatient_to_Outpatient/Challenges_in_Effective_Discharge_for_Diabetes_Patients.PPT. Accessed December2007.
- ,,.Initiating insulin therapy in type 2 diabetes: a comparison of biphasic and basal insulin analogs.Diabetes Care.2005;28:260–265.
- ,,, et al.Addition of biphasic, prandial, or basal insulin to oral therapy in type 2 diabetes.N Engl J Med.2007;357:1716–1730.
- ,,.Narrative review: a rational approach to starting insulin therapy.Ann Intern Med.2006;145:125–134.
- ,,,,.A real‐world approach to insulin therapy in primary care practice.Clin Diabetes.2005;23:78–86.
- ,,,.Individual sulfonylureas and serious hypoglycemia in older persons.J Am Geriatr Soc.1996;44:751–755.
- ,,,.Incidence and risk factors for serious hypoglycemia in older persons using insulin or sulfonylureas.Arch Intern Med.1997;157(15):1681–1686.
- ,,, et al.Exenatide versus insulin glargine in patients with suboptimally controlled type 2 diabetes: a randomized trial.Ann Intern Med.2005;143:559–569.
- .The transition from insulin infusions to long‐term diabetes therapy: the argument for insulin analogs.Semin Thorac Cardiovasc Surg.2006;18:366–378.
- ,,,,.ATLANTUS Study Group. Improvement of glycemic control in subjects with poorly controlled type 2 diabetes.Diabetes Care.2005;28:1282–1288.
- ,,.Investigators Insulin Glargine 4002 Study. The Treat‐to Target trial: randomized addition of glargine or human NPH insulin to oral therapy of type 2 diabetes patients.Diabetes Care.2003;26:3080–3086.
- American Association of Clinical Endocrinologists Inpatient Glycemic Control Resource Center. Available at: http://resources.aace.com/PDF/Section_07‐Final‐Transition‐Inpatient_to_Outpatient/Effective_Discharge_Planning‐Sample_Discharge_Plans/Inpatient_Diabetes_Discharge_Prescription.PDF. Accessed November2007.
- American Diabetes Association.Diagnosis and classification of diabetes mellitus.Diabetes Care.2007;30(suppl):S42–S47.
- ,,, et al.Utility of HbA1c levels for diabetes case finding in hospitalized patients with hyperglycemia.Diabetes Care.2003;26:1064–1068.
- ,,, et al.National standards for diabetes self‐management education.Diabetes Care.2006;29(suppl 1):S78–S85.
- Society of Hospital Medicine Glycemic Control Task Force. Workbook for improvement: improving glycemic control, preventing hypoglycemia and optimizing care of the inpatient with diabetes and hyperglycemia. page 105. Available at: http://www.hospitalmedicine.org/ResourceRoomRedesign/pdf/GC_Workbook.pdf. Accessed December,2007.
- Joslin Diabetes Center. EZ Start Patient Information Handouts. Available at: http://www.joslin.org/ezstart. Accessed December2007.
- ,,,.Promoting effective transitions of care at hospital discharge: a review of key issues for hospitalists.J Hosp Med.2007;2:314–323.
- ,,,,,.Deficits in communication and information transfer between hospital‐based and primary care physicians: implications for patient safety and continuity of care.JAMA.2007;297:831–841.
- Society of Hospital Medicine On‐line Clinical Tools. Ideal discharge for the elderly patient: a hospitalist checklist. Available at: http://www.hospitalmedicine.org/AM/Template.cfm?Section=QI_Clinical_Toolsemplate=/CM/ContentDisplay.cfmContentID=10303. Accessed December2007.
- ,,, et al.Inpatient to outpatient transfer of care in urban patients with diabetes: patterns and determinants of immediate post‐discharge follow‐up.Arch Intern Med.2004;164:447–453.
- ,,,,,.Inpatient to outpatient transfer of diabetes care: perceptions of barriers to postdischarge follow‐up in urban African American patients.Ethn Dis.2007;17:238–243.
Professional and patient safety organizations have recognized the importance of safe transitions as patients move through the health care system, and such attention is even more critical when attempting to achieve glycemic control.14 Since the publication of the Diabetes Control and Complications Trial (DCCT)5 and the United Kingdom Prospective Diabetes Study (UKPDS),6 we have known that intensive glycemic control in the ambulatory setting prevents complications in both type 1 and type 2 diabetes mellitus (DM). Despite the increased risk of hypoglycemia, these trials changed practice patterns in the outpatient settings in favor of intensification of diabetes therapy. In the same way, randomized, prospective trials using intravenous (IV) insulin therapy have revolutionized our thinking about inpatient care by showing that tight glycemic control in the critically ill7 and patients with acute myocardial infarction8 reduces mortality and morbidity. These, as well as additional observational studies associating hyperglycemia with poor outcomes in a variety of medical and surgical patients,915 have led to increased attention on glycemic control in all venues of care.16, 17 Concerns over excessive hypoglycemia and a nonsignificant increase in mortality in certain populations of medical intensive care unit (ICU) patients have raised questions over whether the initial studies can be reproduced or generalized to other groups of inpatients.18, 19 Additional studies are underway to clarify these questions but consensus exists that blood glucose values should at least be less than 180 mg/dL and that the traditional practice of ignoring hyperglycemia is no longer acceptable.
While a uniform focus on glycemic control will allow our patients to receive a consistent message about diabetes, the unique limitations inherent to each practice setting requires different therapeutic regimens and intentional focus on the risks as patients transition from one care area to another. This work addresses several areas of care transition that are particularly important in safely achieving glycemic control including: transition into the hospital for patients on a variety of home regimens, transitions within the hospital (related to changes in dietary intake, change from IV to subcutaneous [SC] therapy, and the perioperative setting), and the transition from the hospital to home or another healthcare facility.
TRANSITION INTO THE HOSPITAL
Until recently, most patients with diabetes admitted to the hospital were managed with sliding‐scale‐only regimens.20, 21 Unfortunately, this led to a variety of complications, including hyperglycemia, hypoglycemia, iatrogenic ketoacidosis, and an inconsistent message to patients on the importance of glycemic control.22 Some outpatient clinicians and patients combated this tradition by creating in‐hospital glucose control plans with orders, which patients would bring with them to the hospital.23 This practice continues to be a helpful way to guide inpatient therapy and is encouraged when available. Glycemic‐controlrelated documents from outpatient clinicians should include the most recent glycosylated hemoglobin (HbA1c) value, diagnosis and known complications, current names and doses of medications, and other patient‐specific preferences or needs (eg, compliance, financial, fear of needles). If the last HbA1c was performed more than 30 days before admission or is not available, one should be obtained upon hospital admission to help guide discharge therapy.24 By knowing the HbA1c, one can determine the level of diabetic control achieved with the current regimen and can help the inpatient team (clinician and patient) determine if a more aggressive glycemic control regimen is necessary at the time of discharge. It is important to note that if the patient has received a transfusion of red blood cells prior to HbA1c measurement or has a hemoglobinopathy, the HbA1c value may not be accurate.25, 26
In general, the outpatient regimen will need to be modified at admission to achieve the appropriate flexibility needed for the changing nutritional intake and insulin requirements that invariably accompany hospitalization. Sulfonylureas and dipeptidyl peptidase 4 inhibitors (DPP4), such as sitagliptin, have most of their effect immediately, but the other oral antihyperglycemic agents have a relatively long delay between treatment and effect, thus they are not a flexible enough method to achieve glycemic control in the hospital. Additionally, inpatients may have transient contraindications to their prior oral antihyperglycemic medications. Metformin is almost always on hold in the hospital setting, at least initially, due to concerns about lactic acidosis. Sulfonylureas can cause hypoglycemia in the setting of worsening renal function or reduced oral intake. Thiazoladinediones (TZDs) are often withheld due to concerns about fluid retention and should be avoided in patients admitted with heart failure. There is little experience in the hospital with the use of newer agents like exenatide, pramlintide, glinides, and DPP4 inhibitors.
Overall, it is generally recommended that oral antihyperglycemic agents be discontinued upon hospital admission and replaced with insulin infusions or scheduled SC insulin. An estimate of 0.4 to 0.5 units/kg of body weight provides a conservative starting point for the total daily dose of insulin (TDD) for most patients. This TDD should then be divided into basal and nutritional components to match the patients' caloric intake. Additional correction doses of insulin should be prescribed to cover episodes of hyperglycemia that develop despite the provision of anticipatory‐physiologic insulin. Further discussion of insulin dosing and SC regimens is available in detail elsewhere.27, 28 The recommendation for these insulin‐only regimens is made regardless of the glycemic control in the outpatient setting and is not meant to imply that they should be continued at discharge. In fact, most patients will return to their home regimen or to one that is intensified but less labor intensive than the basal‐nutritional‐correction insulin used in the hospital. The antihyperglycemic regimen planned for discharge should be anticipated as early as possible and clearly communicated to the patient and/or caregivers to allow for optimal education.
Outpatient insulin regimens that have a high percentage of basal insulin need to be modified during hospital admission to avoid hypoglycemia that may occur from variable nutritional intake. While hospitalized, the basal portion of the estimated TDD generally should not be more than 50% to 60%. The total number of units of all types of insulin used daily as an outpatient can be used as a starting point for determining the inpatient TDD by a 1:1 conversion. Adjustments up or down based on glycemic control, nutritional intake, and other factors are then necessary. If patients are on regimens with insulin plus oral agents at home, the inpatient TDD should either be the home insulin dose or the dose calculated based on their weight, whichever is greater. Patients who use carbohydrate counting to determine nutritional insulin doses as an outpatient might be continued on this regimen if they have a strong understanding of the methods, they are coherent enough to determine their doses, nursing staff are well educated, and dietary services provides the carbohydrate content for the hospital menu. If patients are on insulin pumps at home, these should be managed according to a uniform hospital policy to assure safety. If conversion to multiple daily injections is needed, the same 1:1 conversion is safe.29
Transitions Within the Hospital
General Issues
Within the hospital itself, there are several transitions that have important quality and safety implications regarding glycemic control. The handoffs between providers should follow a standardized format.4, 30, 31 Essential information will vary depending on the setting but should universally include recent hypoglycemia, insulin type and doses, and hypoglycemic risk factors such as changes in insulin doses, the development of renal insufficiency, inability of the patient to self‐report symptoms, tapering of steroids, and cessation or interruption of nutritional intake.32
One of the greatest risks for hypoglycemia in the hospital comes from the unpredictable nutritional interruptions that occur. Unplanned changes are best handled by nurses having an existing order to hold scheduled nutritional insulin if patients are classified nothing by mouth (NPO) or eat 50% of their meal. Additionally, nursing staff should have orders or policies that allow flexibility in the time of administering scheduled rapid‐acting nutritional insulin so that it may be given during or immediately following the meal in patients at higher risk for poor oral intake. Tube feedings also place patients at high risk for hypoglycemia because the tube may become dislodged or they may begin to have feeding intolerance. For these reasons, a measure of safety would be to have standing orders to substitute IV 10% dextrose in water (D10W) at the same rate as the prior tube feeds, hold nutritional insulin, and begin more frequent monitoring whenever tube feeds are stopped.33 Orders that rely on nursing staff to notify a physician when tube feedings are stopped are generally not directive enough because providers may be distracted by other changes or forget the patient is on long‐acting insulin. The need for this flexibility around nutritional dosing emphasizes the importance of avoiding excessive doses of basal insulin. If the total dose of basal insulin is 40% to 50% of the TDD, it can safely be continued at its usual dose despite changing nutritional intake. The only exception is neutral protamine Hagedorn (NPH) insulin, which should be reduced when patients are NPO due to its peak. Generally, a 50% reduction in NPH is recommended for morning doses, but bedtime doses may be given with little to no reduction. Because of the complexity of these issues, standardized order sets are the best way to reliably communicate all the necessary standing orders to nursing staff (Table 1).
|
| Nutritional insulin |
| Hold if patients are NPO or eat less than 50% of their meal. |
| Administer scheduled rapid acting nutritional insulin during or immediately following the meal if oral intake is questionable (ie, nausea, emesis, or newly advancing diet). |
| Tube feedings: When tube feeds are stopped unexpectedly |
| Start dextrose containing IV fluids (many institutions use D10W at the same rate as the prior tube feeds). |
| Hold scheduled nutritional insulin. |
| Notify physician. |
| Basal insulin |
| Continue if NPO. |
| Reduce morning dose of NPH by 50% if NPO and may need to reduce the dose of bedtime NPH. |
| IV to subcutaneous transition |
| Timing for discontinuing IV infusion in relation to first dose of subcutaneous insulin. |
| Prompts for verbal communication between ICU and general ward staff. |
Transitioning the Patient Off of IV Insulin
The strongest evidence for tight glycemic control derives from studies in the surgical ICU.7 Many hospitals have robust, effective IV‐insulin protocols. The frequency of monitoring and rapidity of action of IV insulin allow quick achievement of blood glucose control. As patients begin to eat, the layering of SC nutritional insulin on top of the insulin infusion may reduce the lability of the infusion rate and prevent excursions in glycemic control. When the patient is ready to leave the ICU or start a full oral diet, it is recommended that they transition off of the IV insulin to a basal‐nutritional‐correction regimen.33, 34
The amount of insulin needed with IV infusion is a useful estimate of the TDD of insulin.28, 33, 35, 36 There are important general steps to take when making this transition; but, due to the lack of conclusive data proving the advantage of one regimen over another, there are a variety of acceptable specific protocols (Table 2).3739 First, it should be determined if patients are expected to require ongoing scheduled SC insulin or not. Certainly, all patients with type 1 DM will require scheduled SC insulin, but patients with type 2 DM on low insulin infusion rates or some patients with new hyperglycemia can appropriately be managed with sliding‐scale alone. Next, the average hourly rate of the infusion over the preceding 6 to 8 hours should be determined because it most accurately reflects current insulin needs during the changing stress, nutrition, and medications in critical care patients. This hourly rate will then be converted to a TDD using a safety factor to anticipate decreasing insulin requirements. Some portion of this daily total will then be assigned to be basal insulin. As patients' clinical conditions approach baseline, so will their insulin requirements, and the dose will need to be revised.24
|
| Step 1: Is patient stable enough for transition? Hypotension, active sepsis, vasopressors, and intubation are contraindications to transition due to unreliable subcutaneous insulin absorption and continued need for the most flexible dosing due to frequently changing insulin requirements. |
| Step 2: Does this patient need a transition to scheduled subcutaneous (SC) insulin? |
| Yes |
| All patients with type 1 DM. |
| Type 2 DM patients on insulin as outpatient. |
| Type 2 DM patients with a recent mean infusion rate of 0.5 units/hour.* |
| No |
| Type 2 DM patients with infusion rate 0.5 units/hour.* |
| Stress hyperglycemia or previously unrecognized DM if infusion rate 1 unit/hour, or if HbA1c near normal. |
| Some institutions exclude all stress hyperglycemia patients from transition to a SC insulin regimen, regardless of drip rate. |
| Step 3: If transition is needed, calculate a total daily dose (TDD) of insulin. The TDD is an estimate of the 24‐hour insulin requirement when the patient is receiving full nutrition. |
| Determine mean insulin infusion rate from last 6 to 8 hours. |
| Calculate 24‐hour insulin dose based on this, and reduce this 24‐hour dose by some safety factor. There are several options for this step. |
| Multiply hourly rate by 24, then multiply by 0.7 or 0.8 to arrive at a safety‐adjusted 24 hour insulin dose. |
| OR |
| Multiply hourly infusion rate by 20 (80% of 24). |
| Determine if this total is the TDD or basal dose based on current nutrition. There are several options for this step for you or your institution to choose. |
| If infusion was serving basal AND nutritional needs of patient (such as a patient on 24‐hour tube feedings) this will be your TDD. |
| OR |
| If the infusion insulin was not covering significant nutrition, this could be the BASAL insulin dose. |
| Step 4: Construct a regimen tailored to the patient's nutritional situation, building in safeguards for any changes in nutritional intake and uncertainties about reliability of intake. Several options are again available. |
| Basal: should be ordered as basal glargine or detemir (these are preferred by SHM GCTF but NPH is also an option). |
| Dose is 40% to 50% of TDD. |
| OR |
| Adjusted 24‐hour IV requirement given all as basal. |
| Nutritional: The remainder of the TDD is scheduled nutritional insulin in divided doses. In general, these doses need to be adjusted down for 100% nutritional intake and the orders should allow for administering nutritional insulin just AFTER observed meals to allow an assessment of intake. There are several options for estimating the initial doses: |
| Use 50% of the TDD as nutritional coverage and divide this amount by 3 to determine the scheduled meal dose. Hold if they do not eat more than 50% of their meal. |
| Use a more conservative start of 10% to 20% of the basal dose scheduled with each meal. |
| Use carbohydrate counting to cover nutritional intake. |
| Step 5: Be sure to give SC insulin BEFORE the infusion stops |
| Basal glargine or detemir are ideally given at least 2 hours before infusion is discontinued. |
| Shorter lead times (30 minutes) are possible if rapid acting insulin is given with basal insulin. |
SC insulin should be given before the drip is discontinued to allow an overlap that takes into consideration the onset of action. The first dose of basal insulin should be given 2 hours before the insulin infusion is discontinued.24, 40 However, because this is not always feasible, (ie, the patient needs to leave the ICU sooner), another option is to turn off the drip and give 10% of the basal dose as rapid acting insulin along with the basal dose.39 The timing of subsequent doses will depend on the specific basal insulin that is ordered as well as institutional consideration of usual care delivery and nursing workflow. Given that there are several options to achieve this important overlap between IV and SC insulin, it is best for a multidisciplinary team to choose some preferred way that is the institutional standard. Having a standard allows targeted education and tracking of adherence to best practices.
Because conversion to SC insulin is a complex task and the opportunity may arise while physicians are busy with other clinical priorities, there are several options to assure that the necessary steps take place. Some institutions may build a protocol for this transition on paper or computerized order entry, build cues and dosing charts into order sets, and/or develop nursing documentation and nursing process to influence physician and nurse behavior. This critical juncture is also a good place to focus expertise with a glycemic control team, pharmacist, specially trained nurses, or some other dedicated team to take over this transition for all patients.36 The complexity and aggressiveness of the specific institutional protocol used will depend on the confidence and experience of those individuals responsible for determining the transition doses.
The transition from IV to SC insulin often coincides with a change in patient location, (ie, from the ICU to general medical ward). It is imperative that appropriate communication occurs between the transferring and receiving nurses and physicians to continue with the care plan for glycemic management. This communication can be encouraged through provider education and automated into the standardized order process.
Perioperative Transitions
Patients undergoing surgery present a special challenge. They are faced with not only the physiologic and mental stress of surgery but also the hazards of multiple handoffs across several care teams, all with different priorities and cultures. As in other areas, standardized protocols specific to this area of transition are important in assuring safe and effective perioperative glycemic control. Procedures should preferably be scheduled for the early morning to have the least impact on insulin dosing. Patients who are admitted only for the procedure will have to manage this transition on their own and need to be given specific instructions along with the general preoperative orders.24, 41 In general, the usual dose of glargine can be given the day prior to the procedure if it is approximately 50% of their TDD. This is an important caution because some outpatient regimens use large doses of glargine, which essentially provide both basal and nutritional coverage. In those patients, the glargine dose should be reduced by 20% to 50% to provide a safety margin. As with any patient who is NPO, the morning dose of NPH should be one‐half of the usual dose, scheduled nutritional insulin should be held, and the usual doses of correction insulin should be reduced. The appropriate preoperative dose adjustments also depend on whether the individual patient is ketosis‐prone and how tight their glycemic control is as an outpatient.
Upon arrival to the hospital or during the time that the inpatient is NPO, dextrose containing IV fluids should be administered to minimize the risk of hypoglycemia and prevent ketosis. Given the risks for wide variation, blood glucose monitoring should occur every 1 to 2 hours before, during, and initially after the procedure. Infusion insulin allows the most rapid titration and reliable delivery (compared with SC infusions or injections) and is therefore the preferred regimen for major surgery requiring prolonged NPO status or prolonged surgery in patients with type 1 diabetes. Basal‐nutritional‐correction SC insulin is preferred in other surgical inpatients because their nutritional intake is variable and the stress of surgery affects insulin requirements.
Oral antihyperglycemic agents should be held around the time of surgery. If patients are on an oral agent that can result in hypoglycemia, (ie, sulfonylurea or other insulin secretagogue), it should be held on the day of the procedure. Metformin must be held for safety concerns, given the possible decrease in renal function around surgery. It should be held beginning on the day of the procedure or the day before in the case of the sustained‐release formulation. It can then be resumed 48 hours postoperation after normal renal function is secured and the patient is discharged home. Alpha‐glucosidase inhibitors should be held whenever patients are NPO because they only work when taken with meals. Thiazoladinediones have a long duration of action and so can be continued or stopped around surgery. Finally, glucagon‐like peptide (GLP‐1) agonists (exenatide) should be held until the patient is eating normally and discharged home due to the high incidence of gastrointestinal side effects.
TRANSITIONING FROM THE HOSPITAL
The final but perhaps most important transition is the one from the hospital. With much attention on glycemic control in the hospital, it will become clear to many clinicians that the outpatient regimen needs to be modified. However, any changes in medications increase the chances of hypoglycemia and the possibility of error. The postdischarge time frame has been poorly studied and was specifically identified by the Association for Clinical Endocrinologists (ACE) and American Diabetes Association (ADA) as an area in need of future research.36
Patients may be discharged to a nursing home, hospice, or home, and numerous factors need to be considered to determine the optimal discharge regimen. Important considerations are the HbA1c at admission, home medications, medication interactions, current medical problems, nutritional status, physical disabilities, frequency of self‐monitoring, hypoglycemic risk factors, contraindications to oral medications, goals of care/life expectancy, and financial and other resources. If there are temporary physical or self‐care limitations, then a visiting nurse may need to be arranged to assure a safe transition home with the optimal therapy. If patients are going to a skilled nursing facility or other acute care hospital, the formulary, processes, and staffing issues of that facility will be additional important considerations in determining whether therapy is the same as in the hospital or more like what it will be at home.
An algorithm for outpatient therapy for type 2 DM was recommended in a consensus statement from the ADA and European Association for the Study of Diabetes.42, 43 This has been modified using additional recommendations from the AACE44 and is depicted in Figure 1. While the delineation of these steps is helpful, it must be emphasized that both the choice of regimen and dose will need to be individualized. Prescribing the ideal frequently falls short if there is no way for the patient to implement the recommendations. Intensive insulin therapy requires training in food intake/emnsulin matching, motivation of the patient and outpatient clinician, 4 times daily self‐monitoring of blood glucose, and considerable expense. Some patients may be temporarily continued on basal‐nutritional‐correction regimens as their insulin requirements are rapidly changing and later converted to regimens that involve less frequent insulin doses, (ie, twice daily premixed insulin or basal insulin with oral agents or oral agents alone).45, 46 Other patients who may be medically appropriate for intensive insulin therapy may first need to gain confidence with more simple insulin regimens. There are numerous additional resources on initiating insulin that the reader is referred to for more detail.4448
Oral antihyperglycemic drugs are usually held while a patient is admitted to the hospital but once medical conditions are improved, oral intake is established, and renal function stabilized, these drugs can be restarted. If a patient has a new contraindication to metformin or sulfonylureas but does not need insulin, a TZD or DPP4 inhibitor should be considered. Elderly patients and those with renal or liver disease are at increased risk for developing hypoglycemia.49, 50 Glyburide should be avoided, and doses of other sulfonylureas may need to be adjusted. Other options that may be considered in this situation include sitagliptin and exenatide.51 When patients will be discharged on oral diabetic medications alone, discontinue the basal insulin 12 to 24 hours before and the scheduled nutritional insulin at the same time oral agents are restarted. Sulfonylureas, metformin, DPP4 inhibitors, and exenatide will have most of their effect in the first day, but TZDs have a delayed onset and may not be a good bridge for immediate control at discharge.
If patients are going to be discharged on basal insulin in addition to oral agents, several options exist for determining the dose. Because of the risk of hypoglycemia after discharge, it is advised to either reduce the doses of oral agents or choose more conservative insulin starting doses.52 One possibility is to discontinue the nutritional and correction doses, continue the hospital dose of basal insulin, and restart the oral antidiabetes medications. If the dose of basal insulin was more than 50% of the TDD of insulin, it may need to be reduced. A more conservative option for patients at a higher risk of hypoglycemia is to start 0.2 units/kg or 10 units of NPH, glargine, or detemir at bedtime (Figure 2). Once discharged, blood glucose should be measured 1 to 4 times a day and the basal dose titrated by several different validated methods.53, 54 Appropriate orders for necessary supplies for insulin therapy include a meter with test strips, lancets, syringes, needles, and glucagon kit.55
With a large number of patients with diabetes remaining undiagnosed, it is important to use the information available during hospitalization to identify previously unrecognized diabetes or prediabetes.24 Because there are no unique criteria for the diagnosis of DM in the stressed state, patients may have a presumptive diagnosis made in the hospital and/or follow‐up testing with fasting glucose or an oral glucose tolerance test. No ADA diagnostic thresholds for the HbA1c currently exist, but it can be a useful marker in making this distinction.56 Among patients with new hyperglycemia, an HbA1c of 6% or greater was 100% specific for predicting a future diagnosis of diabetes in the small prospective cohort study by Greci et al.,57 but many endocrinologists use a cutoff of 7%. For all hyperglycemic patients, lifestyle interventions that promote weight loss and increased activity levels should be encouraged. New hyperglycemia should be clearly identified as a diagnosis in discharge communication.
There are many barriers to diabetes self‐management education in the inpatient setting but there are also numerous resources and opportunities. New information will be available regarding patients' understanding of their disease and glycemic control and there may be plans for changes in the home medication regimen. Most of the focus of inpatient education sessions is on survival skills such as taking medications, performing blood glucose monitoring, basic meal planning, identification and treatment of hypoglycemia, sick‐day management, how to access further diabetes education as an outpatient, and when to call the healthcare team.58 The most effective way to accomplish all of this is to identify the discharge regimen early and include nurses and staff in a plan to educate all patients. An inpatient diabetes educator can provide additional help with newly‐diagnosed or uncontrolled patients. Dividing the material over the hospitalization makes it less overwhelming for patients, reinforces previously taught concepts, spreads the responsibility to more providers, and offers it in conjunction with the correlating clinical care. Throughout their hospital stay, patients can begin to practice new skills, including blood glucose monitoring and logbook use, drawing up and administering insulin, sharps disposal, basic diabetic diet information, and sick‐day management. The specific topics addressed in each session can be tracked as part of an interdisciplinary education record that allows coordination among the individuals involved in teaching.59 It is important to give patients the basics, support them with minimal written information, and provide them appropriate follow‐up diabetes education.60 Furthermore, the inpatient team should view the patient's glycemic control education as something that needs to continue across the continuum of care and develop communication strategies that connect with the follow‐up clinical team.
At the time of discharge, it is essential that written documentation and communication with outpatient care providers be completed.61, 62 The more standardized the inpatient insulin regimens are, the more likely the patient is to be on a much different glycemic control regimen than the one on admission; therefore, it is even more important to assure that the admission medication list is accurate and reconciled completely with the modified list at discharge. Discharge check lists and tools for assessing patient acceptance of the discharge plan help with this process.63 Follow‐up with the primary care physician should occur within 7 to 14 days if patients are new to insulin, had medication changes, or are elderly. An increased likelihood of keeping posthospitalization appointments with a diabetes specialty clinic has been associated with being discharged on insulin, a new diagnosis of diabetes, and direct referral.64 Additional attention should be paid to barriers to follow‐up, including lack of health insurance, prior difficulty with follow‐up, and transportation problems.65
SUMMARY
A variety of factors have contributed to difficulty in achieving inpatient and outpatient glucose control. These include care complexity, the lack of standardized protocols, limited knowledge about glucose control, and clinical inertia. Inpatient clinicians have a tendency toward keeping patients on their home regimen in hopes that they might test its effectiveness. Furthermore, there has been the notion of why optimize the glycemic regimen of inpatients because their diabetic needs will change in the outpatient setting. However, because the insulin requirements during acute illness are different and nutritional intake is variable, nearly all inpatients should be placed on multiple daily doses of scheduled insulin or IV insulin to allow the necessary flexibility for rapid titration and abrupt changes in nutrition. This intensive regimen is only appropriate for a minority of outpatients. This difference illustrates that a regimen that works perfectly in one clinical setting will not necessarily be optimal in the next. The patient's outpatient treatment regimen should be reassessed based on HbA1c, self‐monitoring prior to admission, and new contraindications based on medical issues. If a change is indicated and the inpatient physician is motivated, there are numerous helpful resources to aid in addressing all the necessary factors surrounding intensification of therapy.
Despite requiring different glycemic control regimens, the information gained from the needs in each setting guide the next, making communication and planning paramount. Important transitions that must be given attention are: (1) admission to the hospital; (2) in‐hospital transitions, including the perioperative period and IV‐to‐SC insulin; and (3) the hospital to outpatient transition. The complexity of such frequent transitions requires planning, education, and clear communication that are best handled with a systems approach and the development of standardized protocols and order sets. Hospitalists, endocrinologists, and other members of the healthcare team should take an aggressive role in developing systems and facilitating optimal transitions to maximize glycemic control. Further studies are needed to determine the best practices among the variety of options discussed in this article.
- ACE/ADA Task Force on Inpatient Diabetes.American College of Endocrinology and American Diabetes Association Consensus Statement on Inpatient Diabetes and Glycemic Control.Endocr Pract.2006;12:458–468.
- American Board of Internal Medicine Foundation Stepping Up to the Plate Alliance. Available at: http://www.abimfoundation.org/quality/suttp.shtm. Accessed November2007.
- National Transitions of Care Coalition. Available at: http://www.ntocc.org. Accessed November2007.
- JCAHO 2008 National Patient Safety Goals. Availableat: http://www.jointcommission.org/PatientSafety/NationalPatientSafetyGoals/08_hap_npsgs.htm. Accessed November2007.
- Diabetes Control and Complications Trial Research Group.The effect of intensive treatment of diabetes on the development and progression of long‐term complications in insulin‐dependent diabetes mellitus.N Engl J Med.1993;329:977–986.
- UK Prospective Diabetes Study (UKPDS) Group.Intensive blood‐glucose control with sulphonylureas or insulin compared with conventional treatment and risk of complications in patients with type 2 diabetes: UK Prospective Diabetes Study (UKPDS) Group.Lancet.1998;352:837–853.
- ,,, et al.,Intensive insulin therapy in critically ill patients.N Engl J Med.2001;345:1359–1367.
- ,,,.Glycometabolic state at admission: important risk marker of mortality in conventionally treated patients with diabetes mellitus and acute myocardial infarction: long‐term results from the Diabetes and Insulin‐Glucose Infusion in Acute Myocardial Infarction (DIGAMI) study.Circulation.1999;99:2626–2632.
- ,,,,.Relationship of early hyperglycemia to mortality in trauma patients.J Trauma.2004;56:1058–1062.
- ,,,,.Early peri‐operative glycaemic control and allograft rejection in patients with diabetes mellitus: a pilot study.Transplantation.2001;72:1321–1324.
- ,,, et al.Relation between the duration of remission and hyperglycemia in induction chemotherapy for acute lymphocytic leukemia with a hyperfractionated cyclophosphamide, vincristine, doxorubicin and dexamethasone/methotrexate cytarabine regimen.Cancer.2004;100:1179–1185.
- ,,,,.Stress hyperglycemia and prognosis of stroke in nondiabetic and diabetic patients: a systematic overview.Stroke.2001;32:2426–2432.
- ,,,,,.Diabetes and outcome of community‐acquired pneumococcal bacteriemia.Diabetes Care.2004;27:70–76.
- ,,.Early postoperative glucose control predicts nosocomial infection rate in diabetic patients.JPEN J Parenter Enteral Nutr.1998;22:77–81.
- ,,,,.Early post‐operative glucose levels are an independent risk factor for infection after peripheral vascular surgery. A retrospective study.Eur J Vasc Endovasc Surg.2004;28:520–525.
- American Diabetes Association.Standards of medical care in diabetes, 2006.Diabetes Care.2006;29(suppl 1):s4–s42.
- American College of Endocrinology Task Force on Inpatient Diabetes and Metabolic Control.American College of Endocrinology Position Statement on Inpatient Diabetes and Metabolic Control.Endocr Pract.2004;10:77–82.
- ,,, et al.Intensive insulin therapy in the medical ICU.N Engl J Med.2006;354:449–461
- ,,, et al.Intensive insulin therapy and pentastarch resuscitation in severe sepsis.N Engl J Med.2008;358(2):125–139.
- ,,,,.Inpatient management of diabetes and hyperglycemia among general medicine patients at a large teaching hospital.J Hosp Med.2006;1:145–150.
- ,,, et al.,Diabetes care in hospitalized noncritically ill patients: More evidence for clinical inertia and negative therapeutic momentum.J Hosp Med.2007;2:203–211.
- ,,.Glycemic control and sliding scale insulin use in medical inpatients with diabetes mellitus.Arch Intern Med.1997;157:545–552.
- ,.Hospital management of hyperglycemia.Clin Diabetes.2004;22:81–88.
- ,,, et al.Management of diabetes and hyperglycemia in hospitals. [Erratum appears in Diabetes Care. 2005; 28: 1990. Dosage error in text].Diabetes Care.2004;27:553–591.
- ,.Hemoglobinopathies and HbA(1c) measurement.Diabetes Care.2000;23(8):1197–1198.
- ,,,,,.Evaluation of HbA1c determination methods in patients with hemoglobinopathiesDiabetes Care.2000;23(3):339–344.
- ,,,.Subcutaneous insulin order sets and protocols: effective design and implementation strategies.J Hosp Med.2008;3.
- ,,,,.Management of diabetes and hyperglycemia in the hospital: a practical guide to subcutaneous insulin use in the non‐critically ill, adult patient.J Hosp Med.2008;3.PMID:8675920.
- ,,,.Switch to multiple daily injections with insulin glargine and insulin lispro from continuous subcutaneous insulin infusion with insulin lispro: a randomized, open‐label study using a continuous glucose monitoring system.Endocr Pract.2005;11:157–164.
- SBAR technique for communication: a situational briefing model. Available at: http://www.ihi.org/IHI/Topics/PatientSafety/SafetyGeneral/Tools/SBARTechniqueforCommunicationASituationalBriefingModel.htm. Accessed December2007.
- . Promising quality improvement initiatives: reports from the field. AHRQ Summit—Improving Health Care Quality for All Americans: Celebrating Success, Measuring Progress, Moving Forward 2004. Available at: http://www.ahrq.gov/qual/qsummit/qsummit4.htm#sentara. Accessed December2007.
- ,,, et al.Hospital hypoglycemia: not only treatment but also prevention.Endocr Pract.2004;10(suppl 2):89–99.
- American Association of Clinical Endocrinologists Inpatient Glycemic Control Resource Center. Available at: http://resources.aace.com/PDF/Section_05‐Final‐Inpatient_Non‐ICU/Hyperglycemia_Non‐ICU_Protocols/Transition_from_ Intravenous_to_Subcutaneous_Insulin.PDF. Accessed November2007.
- Recommendations for safe use of insulin in hospitals. American Society of Health System Pharmacists and the Hospital and Health System Association of Pennsylvania. 2005. Available at: http://www.premierinc.com/safety/safety‐share/01–06‐downloads/01‐safe‐use‐insulin‐ashp.pdf. Accessed December2007.
- ,,, for the Society of Hospital Medicine Glycemic Control Taskforce. Glycemic control resource room: improving reliability of care across transitions and in the perioperative setting. Available at: http://www.hospitalmedicine.org/ResourceRoomRedesign/html/07Layer_Inter/06_Transitions.cfm. Accessed August2008.
- ACE/ADA Task Force on Inpatient Diabetes American College of Endocrinology and American Diabetes Association Consensus Statement on Inpatient Diabetes and Glycemic Control: a call to action.Diabetes Care.2006;29:1955–1962.
- ,,, et al.Conversion of intravenous insulin infusions to subcutaneously administered insulin glargine in patients with hyperglycemia.Endocr Pract.2006;12:641–650.
- ,,,.Intravenous insulin infusion therapy: indications, methods, and transition to subcutaneous insulin therapy.Endocr Pract.2004;10(suppl 2):71–80.
- ,,, et al.Inpatient management of hyperglycemia: the northwestern experience.Endocr Pract.2006;12(5):491–505.
- American Diabetes Association.Position statement: standards of medical care in diabetes‐2007.Diabetes Care.2007;30(suppl 1):S4–S41.
- American Association of Clinical Endocrinologists Inpatient Glycemic Control Resource Center. Available at: http://resources.aace.com/PDF/Section_05‐Final‐Inpatient_Non‐ICU/Hyperglycemia_Non‐ICU_Protocols/Pre‐Operative_Instructions_for_Patients_with_Diabetes.PDF Accessed November2007.
- ,,, et al.Management of hyperglycemia in type 2 diabetes: a consensus algorithm for the initiation and adjustment of therapy: a consensus statement from the American Diabetes Association and the European Association for the Study of Diabetes.Diabetes Care.2006;29:1963–1972.
- ,,, et al.Management of hyperglycemia in type 2 diabetes: a consensus algorithm for the initiation and adjustment of therapy: update regarding thiazoladinediones.Diabetes Care.2008;31:173–175.
- American Association of Clinical Endocrinologists Inpatient Glycemic Control Resource Center. Challenges in Effective Discharge Planning for Hospitalized Patients with Diabetes. Available at: http://resources.aace.com/PDF/Section_07‐Final‐Transition‐Inpatient_to_Outpatient/Challenges_in_Effective_Discharge_for_Diabetes_Patients.PPT. Accessed December2007.
- ,,.Initiating insulin therapy in type 2 diabetes: a comparison of biphasic and basal insulin analogs.Diabetes Care.2005;28:260–265.
- ,,, et al.Addition of biphasic, prandial, or basal insulin to oral therapy in type 2 diabetes.N Engl J Med.2007;357:1716–1730.
- ,,.Narrative review: a rational approach to starting insulin therapy.Ann Intern Med.2006;145:125–134.
- ,,,,.A real‐world approach to insulin therapy in primary care practice.Clin Diabetes.2005;23:78–86.
- ,,,.Individual sulfonylureas and serious hypoglycemia in older persons.J Am Geriatr Soc.1996;44:751–755.
- ,,,.Incidence and risk factors for serious hypoglycemia in older persons using insulin or sulfonylureas.Arch Intern Med.1997;157(15):1681–1686.
- ,,, et al.Exenatide versus insulin glargine in patients with suboptimally controlled type 2 diabetes: a randomized trial.Ann Intern Med.2005;143:559–569.
- .The transition from insulin infusions to long‐term diabetes therapy: the argument for insulin analogs.Semin Thorac Cardiovasc Surg.2006;18:366–378.
- ,,,,.ATLANTUS Study Group. Improvement of glycemic control in subjects with poorly controlled type 2 diabetes.Diabetes Care.2005;28:1282–1288.
- ,,.Investigators Insulin Glargine 4002 Study. The Treat‐to Target trial: randomized addition of glargine or human NPH insulin to oral therapy of type 2 diabetes patients.Diabetes Care.2003;26:3080–3086.
- American Association of Clinical Endocrinologists Inpatient Glycemic Control Resource Center. Available at: http://resources.aace.com/PDF/Section_07‐Final‐Transition‐Inpatient_to_Outpatient/Effective_Discharge_Planning‐Sample_Discharge_Plans/Inpatient_Diabetes_Discharge_Prescription.PDF. Accessed November2007.
- American Diabetes Association.Diagnosis and classification of diabetes mellitus.Diabetes Care.2007;30(suppl):S42–S47.
- ,,, et al.Utility of HbA1c levels for diabetes case finding in hospitalized patients with hyperglycemia.Diabetes Care.2003;26:1064–1068.
- ,,, et al.National standards for diabetes self‐management education.Diabetes Care.2006;29(suppl 1):S78–S85.
- Society of Hospital Medicine Glycemic Control Task Force. Workbook for improvement: improving glycemic control, preventing hypoglycemia and optimizing care of the inpatient with diabetes and hyperglycemia. page 105. Available at: http://www.hospitalmedicine.org/ResourceRoomRedesign/pdf/GC_Workbook.pdf. Accessed December,2007.
- Joslin Diabetes Center. EZ Start Patient Information Handouts. Available at: http://www.joslin.org/ezstart. Accessed December2007.
- ,,,.Promoting effective transitions of care at hospital discharge: a review of key issues for hospitalists.J Hosp Med.2007;2:314–323.
- ,,,,,.Deficits in communication and information transfer between hospital‐based and primary care physicians: implications for patient safety and continuity of care.JAMA.2007;297:831–841.
- Society of Hospital Medicine On‐line Clinical Tools. Ideal discharge for the elderly patient: a hospitalist checklist. Available at: http://www.hospitalmedicine.org/AM/Template.cfm?Section=QI_Clinical_Toolsemplate=/CM/ContentDisplay.cfmContentID=10303. Accessed December2007.
- ,,, et al.Inpatient to outpatient transfer of care in urban patients with diabetes: patterns and determinants of immediate post‐discharge follow‐up.Arch Intern Med.2004;164:447–453.
- ,,,,,.Inpatient to outpatient transfer of diabetes care: perceptions of barriers to postdischarge follow‐up in urban African American patients.Ethn Dis.2007;17:238–243.
