User login
Fewer acute GvHD cases after stem-cell transplant with vorinostat
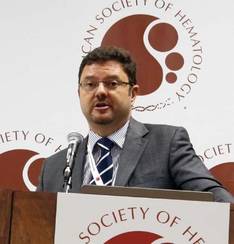
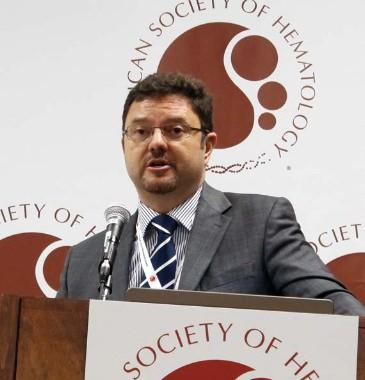
ATLANTA – The antilymphoma drug vorinostat may help to reduce the incidence of serious acute graft-versus-host disease in patients who have undergone blood and bone marrow transplants, said researchers at the annual meeting of the American Society of Hematology.
In a first-in-humans phase I/II trial, adults with hematologic malignancies who underwent hematopoietic stem-cell transplants (HSCTs) with reduced-intensity conditioning and also received vorinostat (Zolinza) before, during, and after transplant had significantly fewer episodes of graft-versus-host disease (GvHD) than did historical controls who received standard GvHD prophylaxis but not vorinostat, reported Dr. Pavan Reddy of the University of Michigan, Ann Arbor.

"From a biological standpoint, we found that using this drug, just as we did in our experimental mouse models, we were able to reduce inflammation." The results were based on measurement of different cytokines, as well as increased acetylation of certain proteins, said Dr. Reddy at a media briefing.
Vorinostat treatment also increased the population of regulatory T cells, "which really have salutary effects on graft-versus-host disease outcomes," he added.
Vorinostat is a histone deacetylase (HDAC) inhibitor approved as a third-line therapy for the treatment of progressive, persistent, or recurrent cutaneous T-cell lymphoma.
In animal studies, Dr. Reddy and his colleague Dr. Sung W. Choi, as well as other groups, have shown that HDAC inhibitors are effective against experimental GvHD, suppress the production of proinflammatory cytokines, and alter the immune response by modulating antigen-presenting cells and by enhancing the production and function of regulatory T cells.
With investigators at Washington University in St. Louis, the Michigan researchers enrolled adult patients scheduled to undergo allogeneic HSCT from donors matched by at least 7 of 8 HLA factors. The patients could be in either complete or partial remission or have progressive disease.
A total of 47 patients were available for the analysis presented at the meeting. In phase I, 10 patients received 100 mg of vorinostat twice daily, and nine additional patients underwent dose escalation to 200 mg twice daily. The remaining 28 patients were treated in phase II at the 100-mg b.i.d. dose. All patients also received standard GvHD prophylaxis with tacrolimus and mycophenolate mofetil. Patients received vorinostat beginning 10 days before transplant and continuing through day 100, when the incidence of grade 2-4 GvHD, the primary endpoint, was assessed.
The results were compared with those of 25 historical controls. Both neutrophil and platelet engraftment occurred at a median of 12 days on study, compared with 11 days each for controls.
The cumulative incidence of grade 2-4 GvHD at day 100 was 22% for patients on vorinostat, compared with 48% for controls (P = .03). There was also a nonsignificant trend favoring vorinostat for prevention of grade 3-4 GvHD, Dr. Reddy noted.
There were nine cases of thrombocytopenia among patients on vorinostat, six among patients on the 200-mg b.i.d. dose, and three at the 100-mg b.i.d. dose. Ten patients on the drug had nausea. There were no significant differences in adverse event profiles, infectious complications, or causes of death between patients in the study and historical controls.
A hematologist who was not involved in the study commented that with vorinostat, investigators seemed to have found a balance between preventing serious GvHD, which significantly increases the risk of death, and mild or moderate GvHD, which is helpful for mounting an immune defense against malignant cells.
"We have seen in some biological studies that this kind of drug – and not only this drug but this group of drugs – can increase some cells in the blood of patients that will in fact decrease the probability of acute graft-versus-host disease and at the same time can also fight against the cancer cells," said Dr. Vanderson Rocha from the University of Oxford (England). Dr. Rocha moderated the briefing where Dr. Reddy presented the data.
The study was supported by the National Institutes of Health. Dr. Reddy, Dr. Choi, and Dr. Rocha all declared having no relevant conflicts of interest to disclose.
ATLANTA – The antilymphoma drug vorinostat may help to reduce the incidence of serious acute graft-versus-host disease in patients who have undergone blood and bone marrow transplants, said researchers at the annual meeting of the American Society of Hematology.
In a first-in-humans phase I/II trial, adults with hematologic malignancies who underwent hematopoietic stem-cell transplants (HSCTs) with reduced-intensity conditioning and also received vorinostat (Zolinza) before, during, and after transplant had significantly fewer episodes of graft-versus-host disease (GvHD) than did historical controls who received standard GvHD prophylaxis but not vorinostat, reported Dr. Pavan Reddy of the University of Michigan, Ann Arbor.
"From a biological standpoint, we found that using this drug, just as we did in our experimental mouse models, we were able to reduce inflammation." The results were based on measurement of different cytokines, as well as increased acetylation of certain proteins, said Dr. Reddy at a media briefing.
Vorinostat treatment also increased the population of regulatory T cells, "which really have salutary effects on graft-versus-host disease outcomes," he added.
Vorinostat is a histone deacetylase (HDAC) inhibitor approved as a third-line therapy for the treatment of progressive, persistent, or recurrent cutaneous T-cell lymphoma.
In animal studies, Dr. Reddy and his colleague Dr. Sung W. Choi, as well as other groups, have shown that HDAC inhibitors are effective against experimental GvHD, suppress the production of proinflammatory cytokines, and alter the immune response by modulating antigen-presenting cells and by enhancing the production and function of regulatory T cells.
With investigators at Washington University in St. Louis, the Michigan researchers enrolled adult patients scheduled to undergo allogeneic HSCT from donors matched by at least 7 of 8 HLA factors. The patients could be in either complete or partial remission or have progressive disease.
A total of 47 patients were available for the analysis presented at the meeting. In phase I, 10 patients received 100 mg of vorinostat twice daily, and nine additional patients underwent dose escalation to 200 mg twice daily. The remaining 28 patients were treated in phase II at the 100-mg b.i.d. dose. All patients also received standard GvHD prophylaxis with tacrolimus and mycophenolate mofetil. Patients received vorinostat beginning 10 days before transplant and continuing through day 100, when the incidence of grade 2-4 GvHD, the primary endpoint, was assessed.
The results were compared with those of 25 historical controls. Both neutrophil and platelet engraftment occurred at a median of 12 days on study, compared with 11 days each for controls.
The cumulative incidence of grade 2-4 GvHD at day 100 was 22% for patients on vorinostat, compared with 48% for controls (P = .03). There was also a nonsignificant trend favoring vorinostat for prevention of grade 3-4 GvHD, Dr. Reddy noted.
There were nine cases of thrombocytopenia among patients on vorinostat, six among patients on the 200-mg b.i.d. dose, and three at the 100-mg b.i.d. dose. Ten patients on the drug had nausea. There were no significant differences in adverse event profiles, infectious complications, or causes of death between patients in the study and historical controls.
A hematologist who was not involved in the study commented that with vorinostat, investigators seemed to have found a balance between preventing serious GvHD, which significantly increases the risk of death, and mild or moderate GvHD, which is helpful for mounting an immune defense against malignant cells.
"We have seen in some biological studies that this kind of drug – and not only this drug but this group of drugs – can increase some cells in the blood of patients that will in fact decrease the probability of acute graft-versus-host disease and at the same time can also fight against the cancer cells," said Dr. Vanderson Rocha from the University of Oxford (England). Dr. Rocha moderated the briefing where Dr. Reddy presented the data.
The study was supported by the National Institutes of Health. Dr. Reddy, Dr. Choi, and Dr. Rocha all declared having no relevant conflicts of interest to disclose.
ATLANTA – The antilymphoma drug vorinostat may help to reduce the incidence of serious acute graft-versus-host disease in patients who have undergone blood and bone marrow transplants, said researchers at the annual meeting of the American Society of Hematology.
In a first-in-humans phase I/II trial, adults with hematologic malignancies who underwent hematopoietic stem-cell transplants (HSCTs) with reduced-intensity conditioning and also received vorinostat (Zolinza) before, during, and after transplant had significantly fewer episodes of graft-versus-host disease (GvHD) than did historical controls who received standard GvHD prophylaxis but not vorinostat, reported Dr. Pavan Reddy of the University of Michigan, Ann Arbor.
"From a biological standpoint, we found that using this drug, just as we did in our experimental mouse models, we were able to reduce inflammation." The results were based on measurement of different cytokines, as well as increased acetylation of certain proteins, said Dr. Reddy at a media briefing.
Vorinostat treatment also increased the population of regulatory T cells, "which really have salutary effects on graft-versus-host disease outcomes," he added.
Vorinostat is a histone deacetylase (HDAC) inhibitor approved as a third-line therapy for the treatment of progressive, persistent, or recurrent cutaneous T-cell lymphoma.
In animal studies, Dr. Reddy and his colleague Dr. Sung W. Choi, as well as other groups, have shown that HDAC inhibitors are effective against experimental GvHD, suppress the production of proinflammatory cytokines, and alter the immune response by modulating antigen-presenting cells and by enhancing the production and function of regulatory T cells.
With investigators at Washington University in St. Louis, the Michigan researchers enrolled adult patients scheduled to undergo allogeneic HSCT from donors matched by at least 7 of 8 HLA factors. The patients could be in either complete or partial remission or have progressive disease.
A total of 47 patients were available for the analysis presented at the meeting. In phase I, 10 patients received 100 mg of vorinostat twice daily, and nine additional patients underwent dose escalation to 200 mg twice daily. The remaining 28 patients were treated in phase II at the 100-mg b.i.d. dose. All patients also received standard GvHD prophylaxis with tacrolimus and mycophenolate mofetil. Patients received vorinostat beginning 10 days before transplant and continuing through day 100, when the incidence of grade 2-4 GvHD, the primary endpoint, was assessed.
The results were compared with those of 25 historical controls. Both neutrophil and platelet engraftment occurred at a median of 12 days on study, compared with 11 days each for controls.
The cumulative incidence of grade 2-4 GvHD at day 100 was 22% for patients on vorinostat, compared with 48% for controls (P = .03). There was also a nonsignificant trend favoring vorinostat for prevention of grade 3-4 GvHD, Dr. Reddy noted.
There were nine cases of thrombocytopenia among patients on vorinostat, six among patients on the 200-mg b.i.d. dose, and three at the 100-mg b.i.d. dose. Ten patients on the drug had nausea. There were no significant differences in adverse event profiles, infectious complications, or causes of death between patients in the study and historical controls.
A hematologist who was not involved in the study commented that with vorinostat, investigators seemed to have found a balance between preventing serious GvHD, which significantly increases the risk of death, and mild or moderate GvHD, which is helpful for mounting an immune defense against malignant cells.
"We have seen in some biological studies that this kind of drug – and not only this drug but this group of drugs – can increase some cells in the blood of patients that will in fact decrease the probability of acute graft-versus-host disease and at the same time can also fight against the cancer cells," said Dr. Vanderson Rocha from the University of Oxford (England). Dr. Rocha moderated the briefing where Dr. Reddy presented the data.
The study was supported by the National Institutes of Health. Dr. Reddy, Dr. Choi, and Dr. Rocha all declared having no relevant conflicts of interest to disclose.
AT THE ANNUAL MEETING OF THE AMERICAN SOCIETY OF HEMATOLOGY
Major Finding: The cumulative incidence of grade 2-4 acute graft-versus-host disease at day 100 after hematopoietic stem-cell transplant was 22% for patients on vorinostat, compared with 48% for controls.
Data Source: Open-label clinical trial with historical controls
Disclosures: The study was supported by the National Institutes of Health. Dr. Reddy, Dr. Choi, and Dr. Rocha all declared having no relevant conflicts of interest to disclose.
When workload clashes with quality
In 2000, the Institute of Medicine published an oft-cited report, "To Err Is Human: Building a Safer Health System – A Report of The Committee on Quality of Health Care in America." The report estimated that up to 98,000 patients die from preventable medical errors each year.
Many of us can remember the boot camp–like conditions of residency: working incredibly long shifts that made every part of our bodies (and brains) cry out for rest – even a 10-minute nap could bring much-needed relief.
I remember sometimes working 48- to 72-hour shifts, between my regular residency responsibilities and moonlighting in the VA emergency room. That seems like a lifetime ago, a lifetime I would not want to relive.
While we may have been trained to believe we can perform at our peak despite sleep deprivation, in reality many of us made mistakes, whether great or small, as a result of our highly stressed, sleep-deprived state. And if we are honest with ourselves, we would not want to be a patient who is cared for by any doctor whose mental facilities have been impaired due to lack of sleep. Finally, wisdom defeated pride and custom, and residents’ shifts have been limited, which was a true victory for patients and residents alike.
Subsequently, it was acknowledged that nurses also made errors when working in suboptimal conditions. A study in the New England Journal of Medicine found a significant association between low staffing and patient mortality ("Nurse Staffing and Inpatient Hospital Mortality," N. Engl. J. Med. 2011;364:1037-45).
Truth be told, we already knew that nurses and inexperienced resident physicians make mistakes when overwhelmed and overworked, but what about seasoned hospitalists? What about us? Do we honestly believe we are somehow immune to making medical errors because of years of experience?
A piece in the Jan. 28 edition of JAMA – "Impact of Attending Physician Workload on Patient Care: A Survey of Hospitalists" – sheds light on how we really feel. The survey assessed hospitalists’ perceptions of the association between their workload and patient safety and quality-of-care measures during daytime shifts. The respondents’ average age was 38 years, median time in practice was 6 years, and median annual compensation was $180,000 (doi: 10.1001/jamainternmed.2013.1864).
Important study findings include the following:
• Forty percent of respondents reported that at least once per month, their census exceeded safe levels, and 36% of these noted they experienced unsafe levels multiple times per week.
• Fifteen patients per shift was the magic number that would optimize patient safety, regardless of any assistance doctors received, and that was assuming their shift was a purely clinical shift.
• More than 20% of hospitalists believe their average workload likely contributed to patient transfers, patient suffering, or even the death of patients. That was the most sobering finding of the study.
This study has profound implications for patient safety, and less importantly, patient satisfaction. The potential for unnecessary suffering, excessive medical costs, and unnecessary death is staggering. The actual number of physicians who are willing to admit their limitations is likely far lower than the actual number who experience these adverse effects, even if they are oblivious to their understandable limitations.
When the pager is going off incessantly while you are answering another call, and nurses are lined up to ask you questions about their patients, and, of course, you have a patient or two in the ER who need your attention, it is easy to get sidetracked. To err is human.
The bottom line is patients are the bottom line. They depend on us to provide safe, compassionate, high-quality health care. They literally entrust their lives to us, and we must honor that trust by speaking up if we feel like their safety is in jeopardy, and work with hospitalist directors and hospital administrators to create an environment in which patient safety is valued above all.
Dr. Hester is a hospitalist with Baltimore-Washington Medical Center, Glen Burnie, Md., who has a passion for empowering patients to partner in their health care.
In 2000, the Institute of Medicine published an oft-cited report, "To Err Is Human: Building a Safer Health System – A Report of The Committee on Quality of Health Care in America." The report estimated that up to 98,000 patients die from preventable medical errors each year.
Many of us can remember the boot camp–like conditions of residency: working incredibly long shifts that made every part of our bodies (and brains) cry out for rest – even a 10-minute nap could bring much-needed relief.
I remember sometimes working 48- to 72-hour shifts, between my regular residency responsibilities and moonlighting in the VA emergency room. That seems like a lifetime ago, a lifetime I would not want to relive.
While we may have been trained to believe we can perform at our peak despite sleep deprivation, in reality many of us made mistakes, whether great or small, as a result of our highly stressed, sleep-deprived state. And if we are honest with ourselves, we would not want to be a patient who is cared for by any doctor whose mental facilities have been impaired due to lack of sleep. Finally, wisdom defeated pride and custom, and residents’ shifts have been limited, which was a true victory for patients and residents alike.
Subsequently, it was acknowledged that nurses also made errors when working in suboptimal conditions. A study in the New England Journal of Medicine found a significant association between low staffing and patient mortality ("Nurse Staffing and Inpatient Hospital Mortality," N. Engl. J. Med. 2011;364:1037-45).
Truth be told, we already knew that nurses and inexperienced resident physicians make mistakes when overwhelmed and overworked, but what about seasoned hospitalists? What about us? Do we honestly believe we are somehow immune to making medical errors because of years of experience?
A piece in the Jan. 28 edition of JAMA – "Impact of Attending Physician Workload on Patient Care: A Survey of Hospitalists" – sheds light on how we really feel. The survey assessed hospitalists’ perceptions of the association between their workload and patient safety and quality-of-care measures during daytime shifts. The respondents’ average age was 38 years, median time in practice was 6 years, and median annual compensation was $180,000 (doi: 10.1001/jamainternmed.2013.1864).
Important study findings include the following:
• Forty percent of respondents reported that at least once per month, their census exceeded safe levels, and 36% of these noted they experienced unsafe levels multiple times per week.
• Fifteen patients per shift was the magic number that would optimize patient safety, regardless of any assistance doctors received, and that was assuming their shift was a purely clinical shift.
• More than 20% of hospitalists believe their average workload likely contributed to patient transfers, patient suffering, or even the death of patients. That was the most sobering finding of the study.
This study has profound implications for patient safety, and less importantly, patient satisfaction. The potential for unnecessary suffering, excessive medical costs, and unnecessary death is staggering. The actual number of physicians who are willing to admit their limitations is likely far lower than the actual number who experience these adverse effects, even if they are oblivious to their understandable limitations.
When the pager is going off incessantly while you are answering another call, and nurses are lined up to ask you questions about their patients, and, of course, you have a patient or two in the ER who need your attention, it is easy to get sidetracked. To err is human.
The bottom line is patients are the bottom line. They depend on us to provide safe, compassionate, high-quality health care. They literally entrust their lives to us, and we must honor that trust by speaking up if we feel like their safety is in jeopardy, and work with hospitalist directors and hospital administrators to create an environment in which patient safety is valued above all.
Dr. Hester is a hospitalist with Baltimore-Washington Medical Center, Glen Burnie, Md., who has a passion for empowering patients to partner in their health care.
In 2000, the Institute of Medicine published an oft-cited report, "To Err Is Human: Building a Safer Health System – A Report of The Committee on Quality of Health Care in America." The report estimated that up to 98,000 patients die from preventable medical errors each year.
Many of us can remember the boot camp–like conditions of residency: working incredibly long shifts that made every part of our bodies (and brains) cry out for rest – even a 10-minute nap could bring much-needed relief.
I remember sometimes working 48- to 72-hour shifts, between my regular residency responsibilities and moonlighting in the VA emergency room. That seems like a lifetime ago, a lifetime I would not want to relive.
While we may have been trained to believe we can perform at our peak despite sleep deprivation, in reality many of us made mistakes, whether great or small, as a result of our highly stressed, sleep-deprived state. And if we are honest with ourselves, we would not want to be a patient who is cared for by any doctor whose mental facilities have been impaired due to lack of sleep. Finally, wisdom defeated pride and custom, and residents’ shifts have been limited, which was a true victory for patients and residents alike.
Subsequently, it was acknowledged that nurses also made errors when working in suboptimal conditions. A study in the New England Journal of Medicine found a significant association between low staffing and patient mortality ("Nurse Staffing and Inpatient Hospital Mortality," N. Engl. J. Med. 2011;364:1037-45).
Truth be told, we already knew that nurses and inexperienced resident physicians make mistakes when overwhelmed and overworked, but what about seasoned hospitalists? What about us? Do we honestly believe we are somehow immune to making medical errors because of years of experience?
A piece in the Jan. 28 edition of JAMA – "Impact of Attending Physician Workload on Patient Care: A Survey of Hospitalists" – sheds light on how we really feel. The survey assessed hospitalists’ perceptions of the association between their workload and patient safety and quality-of-care measures during daytime shifts. The respondents’ average age was 38 years, median time in practice was 6 years, and median annual compensation was $180,000 (doi: 10.1001/jamainternmed.2013.1864).
Important study findings include the following:
• Forty percent of respondents reported that at least once per month, their census exceeded safe levels, and 36% of these noted they experienced unsafe levels multiple times per week.
• Fifteen patients per shift was the magic number that would optimize patient safety, regardless of any assistance doctors received, and that was assuming their shift was a purely clinical shift.
• More than 20% of hospitalists believe their average workload likely contributed to patient transfers, patient suffering, or even the death of patients. That was the most sobering finding of the study.
This study has profound implications for patient safety, and less importantly, patient satisfaction. The potential for unnecessary suffering, excessive medical costs, and unnecessary death is staggering. The actual number of physicians who are willing to admit their limitations is likely far lower than the actual number who experience these adverse effects, even if they are oblivious to their understandable limitations.
When the pager is going off incessantly while you are answering another call, and nurses are lined up to ask you questions about their patients, and, of course, you have a patient or two in the ER who need your attention, it is easy to get sidetracked. To err is human.
The bottom line is patients are the bottom line. They depend on us to provide safe, compassionate, high-quality health care. They literally entrust their lives to us, and we must honor that trust by speaking up if we feel like their safety is in jeopardy, and work with hospitalist directors and hospital administrators to create an environment in which patient safety is valued above all.
Dr. Hester is a hospitalist with Baltimore-Washington Medical Center, Glen Burnie, Md., who has a passion for empowering patients to partner in their health care.
Chest Wall and Knee Pain Following Motor Vehicle Collision
ANSWER
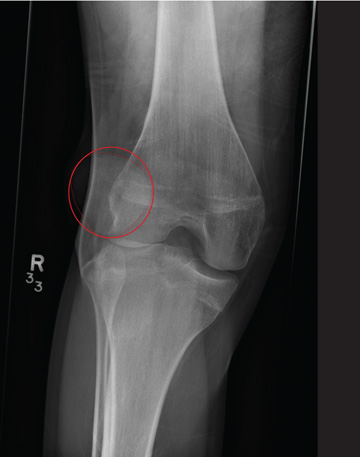
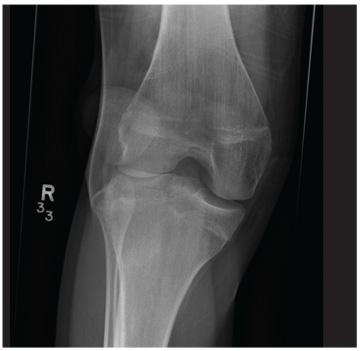
The radiograph demonstrates lateral dislocation of the patella, with no evidence of an acute fracture of any surrounding bones. The patella was easily reduced in the emergency department, and the patient was placed in a knee immobilizer. Orthopedic consultation was obtained.
ANSWER
The radiograph demonstrates lateral dislocation of the patella, with no evidence of an acute fracture of any surrounding bones. The patella was easily reduced in the emergency department, and the patient was placed in a knee immobilizer. Orthopedic consultation was obtained.
ANSWER
The radiograph demonstrates lateral dislocation of the patella, with no evidence of an acute fracture of any surrounding bones. The patella was easily reduced in the emergency department, and the patient was placed in a knee immobilizer. Orthopedic consultation was obtained.
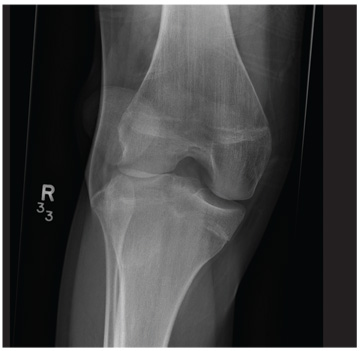
A 20-year-old man presents following a motor vehicle collision in which the car he was driving was broadsided by another vehicle. His air bag deployed, and the patient is now complaining of right-sided chest wall pain and right knee pain. His medical history is unremarkable. In a primary survey, the patient appears stable, with normal vital signs. Inspection of his right knee shows some deformity of the joint, with mild swelling and moderate tenderness. The patient is unable to perform flexion with his right knee. Good distal pulses are present, and sensation is intact. Radiograph of the right knee is obtained. What is your impression?
Man Waits Until Follow-up to Reveal Chest Pain
ANSWER
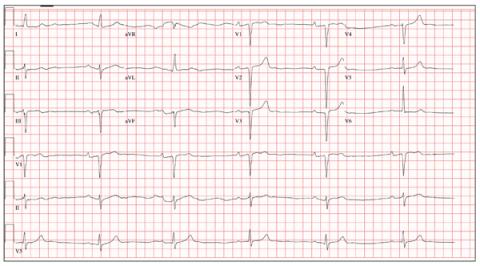
The correct interpretation includes marked sinus bradycardia with a first-degree atrioventricular (AV) block, left anterior fascicular block, and evidence of an anteroseptal MI. Marked sinus bradycardia is evidenced by a heart rate significantly less than 60 beats/min (in this case, almost half the rate). A first-degree AV block is apparent by the presence of a PR interval > 200 ms. The presence of a left anterior fascicular block (or left anterior hemiblock) includes a left-axis deviation between –45° and –90°, small Q waves with tall R waves in leads I and aVL, small R waves with deep S waves in leads II, III, and aVF, and a normal or slightly prolonged QRS duration. Finally, an anteroseptal MI is evident from the presence of deep S waves in leads V1 to V3.
The patient was directly admitted to the cardiology service for definitive workup and treatment.
ANSWER
The correct interpretation includes marked sinus bradycardia with a first-degree atrioventricular (AV) block, left anterior fascicular block, and evidence of an anteroseptal MI. Marked sinus bradycardia is evidenced by a heart rate significantly less than 60 beats/min (in this case, almost half the rate). A first-degree AV block is apparent by the presence of a PR interval > 200 ms. The presence of a left anterior fascicular block (or left anterior hemiblock) includes a left-axis deviation between –45° and –90°, small Q waves with tall R waves in leads I and aVL, small R waves with deep S waves in leads II, III, and aVF, and a normal or slightly prolonged QRS duration. Finally, an anteroseptal MI is evident from the presence of deep S waves in leads V1 to V3.
The patient was directly admitted to the cardiology service for definitive workup and treatment.
ANSWER
The correct interpretation includes marked sinus bradycardia with a first-degree atrioventricular (AV) block, left anterior fascicular block, and evidence of an anteroseptal MI. Marked sinus bradycardia is evidenced by a heart rate significantly less than 60 beats/min (in this case, almost half the rate). A first-degree AV block is apparent by the presence of a PR interval > 200 ms. The presence of a left anterior fascicular block (or left anterior hemiblock) includes a left-axis deviation between –45° and –90°, small Q waves with tall R waves in leads I and aVL, small R waves with deep S waves in leads II, III, and aVF, and a normal or slightly prolonged QRS duration. Finally, an anteroseptal MI is evident from the presence of deep S waves in leads V1 to V3.
The patient was directly admitted to the cardiology service for definitive workup and treatment.
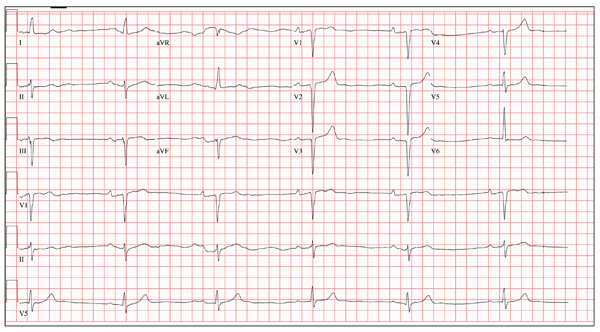
A 64-year-old man presents for follow-up to an appointment one month ago in which he reported a history of acute-onset shortness of breath, fatigue, and exercise intolerance. His health prior to that visit was described as “normal”; he had not seen a clinician since having his tonsils out at age 14. At the previous visit, a complete history documented that the patient is a rancher and farmer who makes his living from his crops and animals. He has never been married and lives out in the country. He has a history of several broken bones that he set himself, with no resultant sequelae. Aside from routine colds and flu, he has not been ill. He stopped smoking 10 years ago when it “got to be too expensive,” and he drinks one shot of whiskey at bedtime each night. He denies any drug allergies; he was taking no medications when he presented for that visit. A physical examination during that appointment revealed the presence of an irregularly irregular rhythm with a ventricular rate of 120 beats/min, a grade II/VI decrescendo diastolic murmur best heard at the right upper sternal border, a grade II/VI mid-systolic murmur best heard at the apex, a large point of maximum impulse (PMI) palpable at the anterior axillary line, and 3+ pitting edema to the level of the knees in both lower extremities. Subsequent workup, including an ECG, echocardiogram, chest x-ray, complete blood count, and chemistry panel, was performed—much to the patient’s displeasure. Pertinent results included a diagnosis of atrial fibrillation, a bicuspid aortic valve, aortic insufficiency, and mitral regurgitation. He was prescribed metoprolol and warfarin and referred to a cardiologist. During the current visit, you learn that he did not continue to take his warfarin, because his shortness of breath went away the day after the previous appointment. He states he doesn’t always remember to take his metoprolol, but when he does, he’ll often take enough to “catch up on” his dosage. He did not follow up with a cardiologist as scheduled. Additionally, he reveals that he experienced chest pain two weeks ago, which he describes as a “sharp, sticking” pain in his left chest. He did not come in because he thought he’d wait until this appointment to discuss it. He remembers being “all sweaty” when he had his chest pain, but adds that it hasn’t happened again. His review of symptoms is remarkable for fatigue since his chest pain. Physical exam reveals cardiac changes. His rhythm is now regular, but at a rate of 40 beats/min. His murmurs are unchanged from the previous visit. Another ECG is obtained, which reveals the following: a ventricular rate of 35 beats/min; PR interval, 258 ms; QRS duration, 116 ms; QT/QTc interval, 532/406 ms; P axis, 74°; R axis, –47°; and T axis, 45°. What is your interpretation of this ECG?
Why This Child Hates to Put On Socks
ANSWER
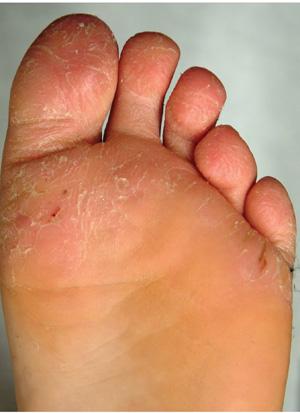
The correct answer is juvenile plantar dermatosis (JPD; choice “b”). It is a condition related to having thin, dry, hyperreactive skin exposed to friction, wetting and drying, and constant exposure to the nonpermeable surfaces of shoes.
Pitted keratolysis (choice “a”) is a condition caused by sweating and increased warmth. The plantar keratin is broken down with the help of bacteria that overgrow in affected areas; this eventuates in focal loss of keratin in arcuate patterns. It is quite unlikely to occur prior to puberty.
Tinea pedis (choice “c”) is dermatophytosis, or fungal infection of the foot. It is also unusual prior to puberty, unlikely to present in the manner seen in this case, and likely to have responded at least partially to antifungal creams.
Psoriasis (choice “d”) seldom presents with fissuring, would not be confined to weight-bearing surfaces, and would probably have involved other areas, such as the scalp, elbows, knees, or nails.
DISCUSSION
JPD, also known as juvenile plantar dermatitis, is found almost exclusively on the weight-bearing surfaces of the feet of children ages 4 to 8—mostly boys, for whom this represents a manifestation of the atopic diathesis. Seen mostly in the summer, it is thought to be triggered by friction, wetting and drying, and shoe selection (ie, plastic rather than leather soles).
Affected children not only have dry, sensitive skin; their skin is actually thin and fragile as well. Plastic or other synthetic shoe surfaces worn in the summertime are thought to contribute to the friction, heat, and sweating necessary to produce these changes.
As in this case, JPD is often mistaken for tinea pedis but has nothing to do with infection of any kind. Tinea pedis is uncommon in children this young, and it would present in completely different ways, such as between the toes (especially the fourth and fifth) or with blisters on the instep.
Psoriasis, though not unknown in this age-group, does not resemble JPD clinically at all. When suspected, the diagnosis of psoriasis can be corroborated by finding it elsewhere (eg, through a positive family history or biopsy).
Pitted keratolyis is common enough, but is seen in older teens and men whose feet are prone to sweat a great deal. The choice of shoes and occupation are often crucial factors in its development. The clinical hallmark is arcuate whitish maceration on weight-bearing surfaces, which are often malodorous as well.
TREATMENT
The first treatment for JPD is education of parents and patients, reassuring them about the relatively benign nature of the problem. Moisturizing frequently with petrolatum-based moisturizers is necessary for prevention, but changing the type of shoes worn is the most effective step to take; it is also the most difficult, since children this age favor cheap, plastic flip-flops or shoes in the summer.
For the fissures, spraying on a flexible spray bandage can be helpful in protecting them and allowing them to heal. With significant inflammation, the use of mild steroid ointments, such as hydrocortisone 2.5%, can help. But by far, the best relief comes with the change in season and the choice of shoe (leather-soled).
ANSWER
The correct answer is juvenile plantar dermatosis (JPD; choice “b”). It is a condition related to having thin, dry, hyperreactive skin exposed to friction, wetting and drying, and constant exposure to the nonpermeable surfaces of shoes.
Pitted keratolysis (choice “a”) is a condition caused by sweating and increased warmth. The plantar keratin is broken down with the help of bacteria that overgrow in affected areas; this eventuates in focal loss of keratin in arcuate patterns. It is quite unlikely to occur prior to puberty.
Tinea pedis (choice “c”) is dermatophytosis, or fungal infection of the foot. It is also unusual prior to puberty, unlikely to present in the manner seen in this case, and likely to have responded at least partially to antifungal creams.
Psoriasis (choice “d”) seldom presents with fissuring, would not be confined to weight-bearing surfaces, and would probably have involved other areas, such as the scalp, elbows, knees, or nails.
DISCUSSION
JPD, also known as juvenile plantar dermatitis, is found almost exclusively on the weight-bearing surfaces of the feet of children ages 4 to 8—mostly boys, for whom this represents a manifestation of the atopic diathesis. Seen mostly in the summer, it is thought to be triggered by friction, wetting and drying, and shoe selection (ie, plastic rather than leather soles).
Affected children not only have dry, sensitive skin; their skin is actually thin and fragile as well. Plastic or other synthetic shoe surfaces worn in the summertime are thought to contribute to the friction, heat, and sweating necessary to produce these changes.
As in this case, JPD is often mistaken for tinea pedis but has nothing to do with infection of any kind. Tinea pedis is uncommon in children this young, and it would present in completely different ways, such as between the toes (especially the fourth and fifth) or with blisters on the instep.
Psoriasis, though not unknown in this age-group, does not resemble JPD clinically at all. When suspected, the diagnosis of psoriasis can be corroborated by finding it elsewhere (eg, through a positive family history or biopsy).
Pitted keratolyis is common enough, but is seen in older teens and men whose feet are prone to sweat a great deal. The choice of shoes and occupation are often crucial factors in its development. The clinical hallmark is arcuate whitish maceration on weight-bearing surfaces, which are often malodorous as well.
TREATMENT
The first treatment for JPD is education of parents and patients, reassuring them about the relatively benign nature of the problem. Moisturizing frequently with petrolatum-based moisturizers is necessary for prevention, but changing the type of shoes worn is the most effective step to take; it is also the most difficult, since children this age favor cheap, plastic flip-flops or shoes in the summer.
For the fissures, spraying on a flexible spray bandage can be helpful in protecting them and allowing them to heal. With significant inflammation, the use of mild steroid ointments, such as hydrocortisone 2.5%, can help. But by far, the best relief comes with the change in season and the choice of shoe (leather-soled).
ANSWER
The correct answer is juvenile plantar dermatosis (JPD; choice “b”). It is a condition related to having thin, dry, hyperreactive skin exposed to friction, wetting and drying, and constant exposure to the nonpermeable surfaces of shoes.
Pitted keratolysis (choice “a”) is a condition caused by sweating and increased warmth. The plantar keratin is broken down with the help of bacteria that overgrow in affected areas; this eventuates in focal loss of keratin in arcuate patterns. It is quite unlikely to occur prior to puberty.
Tinea pedis (choice “c”) is dermatophytosis, or fungal infection of the foot. It is also unusual prior to puberty, unlikely to present in the manner seen in this case, and likely to have responded at least partially to antifungal creams.
Psoriasis (choice “d”) seldom presents with fissuring, would not be confined to weight-bearing surfaces, and would probably have involved other areas, such as the scalp, elbows, knees, or nails.
DISCUSSION
JPD, also known as juvenile plantar dermatitis, is found almost exclusively on the weight-bearing surfaces of the feet of children ages 4 to 8—mostly boys, for whom this represents a manifestation of the atopic diathesis. Seen mostly in the summer, it is thought to be triggered by friction, wetting and drying, and shoe selection (ie, plastic rather than leather soles).
Affected children not only have dry, sensitive skin; their skin is actually thin and fragile as well. Plastic or other synthetic shoe surfaces worn in the summertime are thought to contribute to the friction, heat, and sweating necessary to produce these changes.
As in this case, JPD is often mistaken for tinea pedis but has nothing to do with infection of any kind. Tinea pedis is uncommon in children this young, and it would present in completely different ways, such as between the toes (especially the fourth and fifth) or with blisters on the instep.
Psoriasis, though not unknown in this age-group, does not resemble JPD clinically at all. When suspected, the diagnosis of psoriasis can be corroborated by finding it elsewhere (eg, through a positive family history or biopsy).
Pitted keratolyis is common enough, but is seen in older teens and men whose feet are prone to sweat a great deal. The choice of shoes and occupation are often crucial factors in its development. The clinical hallmark is arcuate whitish maceration on weight-bearing surfaces, which are often malodorous as well.
TREATMENT
The first treatment for JPD is education of parents and patients, reassuring them about the relatively benign nature of the problem. Moisturizing frequently with petrolatum-based moisturizers is necessary for prevention, but changing the type of shoes worn is the most effective step to take; it is also the most difficult, since children this age favor cheap, plastic flip-flops or shoes in the summer.
For the fissures, spraying on a flexible spray bandage can be helpful in protecting them and allowing them to heal. With significant inflammation, the use of mild steroid ointments, such as hydrocortisone 2.5%, can help. But by far, the best relief comes with the change in season and the choice of shoe (leather-soled).
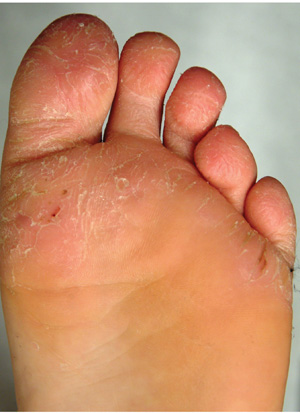
The distraught mother of an 8-year-old boy brings him urgently to dermatology for evaluation of a condition that has affected his feet for the past two summers. Convinced he has “caught” athlete’s foot, she tried several OTC antifungal creams and sprays, with no good effect. The patient denies symptoms except occasional stinging. In his view, the biggest problem is that the bottoms of his feet are so rough that he hates to put on socks. Additional history taking reveals that the child is markedly atopic, with seasonal allergies, asthma, dry, sensitive skin, and eczema. As an infant, his diaper rashes were so severe that he was hospitalized twice. On inspection, the weight-bearing surfaces of both feet are fissured and shiny, with modest inflammation evident. The plantar aspects of both big toes are especially affected. Though these areas are rough and dry, there is no edema, increased warmth, or tenderness on palpation. His skin elsewhere, though dry, is free of obvious lesions.
New Onset of in Hospitalized Patients
A 78‐year‐old otherwise healthy man with longstanding hypertension is admitted to the hospital with pneumonia. During the second hospital day, he develops atrial fibrillation (AF) with rapid ventricular response, but his hemodynamics remain stable. He is given oral metoprolol for rate control. A transthoracic echocardiogram (TTE) shows mild concentric left ventricular hypertrophy, normal left ventricular size and function, and mild left atrial enlargement. The AF spontaneously terminates after 24 hours and does not recur during the hospitalization. What treatment and monitoring are recommended at the time of discharge for this patient's AF?
BACKGROUND
AF is a common dysrhythmia that clinicians often encounter while caring for hospitalized patients. Although many patients will have carried a diagnosis of AF prior to hospital admission, this review will pertain to patients for whom a first documented episode of AF occurs during hospitalization. These patients can be conceptually separated into 2 categories: those who have had undiagnosed AF for some time (and are now diagnosed due to continuous inpatient telemetry monitoring) and those whose AF is secondary to their acute medical illness. Although practically speaking, this distinction is not easy to make, markers of chronic AF may include left atrial enlargement and a clinical history of longstanding palpitations.
INCIDENCE
The prevalence of AF in the general population is estimated at 0.4% to 1.0%.[1, 2] Prevalence increases with advancing age. Compared to the general population, the population of hospitalized patients is inherently older and enriched for comorbidities that are known risk factors for the development of AF (such as congestive heart failure, hypertension, and obstructive sleep apnea) or are associated with paroxysmal AF (such as stroke or transient ischemic attack [TIA]). As a result, the prevalence of occult AF is necessarily higher in this population than that of a general cohort. The risk of developing AF is further increased in hospitalized patients simply by the acute illness (or postoperative state), whose associated catecholamine surge and systemic proinflammatory state are well‐known precipitants for AF.[3] AF is common after cardiac surgery (25%30%)[4, 5] and occurs in about 3% of patients undergoing major noncardiac surgery.[6]
In the setting of severe medical illness such as sepsis, the incidence of new onset AF has recently been estimated at around 6%.[7] Among patients hospitalized with stroke, 2% to 5% will have a new diagnosis of AF made by the admission electrocardiogram (ECG).[8, 9, 10] Subsequent cardiac monitoring with inpatient telemetry or Holter monitoring will detect previously undiagnosed AF in another 5% to 8% of patients admitted with stroke.[11, 12]
PATHOPHYSIOLOGY
AF is a supraventricular tachyarrhythmia characterized by uncoordinated atrial activation; this chaotic atrial activation translates into atrial mechanical dysfunction. [13] Patients who develop AF may have atrial substrate, such as patchy atrial myocyte fibrosis, that increases their propensity to develop atrial dysrhythmias.[14] Other factors contributing to the likelihood of developing AF are anisotropic conduction, atrial chamber dilation, systemic inflammation, hyperadrenergic state, and atrial ischemia.[3, 15, 16, 17] Atrial flutter, on the other hand, is an organized macro‐reentrant supraventricular arrhythmia that typically rotates around the tricuspid annulus.
RISK FACTORS
Risk factors for the development of AF are well defined. The risk factors in the chronic setting remain the same as those for the development of AF in the setting of medical illness or in the postoperative state: advancing age, male gender, prior diagnosis of AF, congestive heart failure, hypertension, and obstructive sleep apnea.[1, 5, 18] Surgical procedures, due to the sympathetic surge and proinflammatory state that occur in the postoperative period, increase the risk of AF. Cardiac and thoracic procedures, which involve direct manipulation of the heart and adjacent structures, proffer the highest risk of AF.[19, 20] Although not necessarily a risk factor for the development of AF, patients with recent ischemic stroke are at high risk of harboring AF; up to 7% of patients are diagnosed with AF in the 3 months following ischemic stroke.[21]
DIAGNOSIS
In the inpatient setting, the diagnosis of AF is typically made through telemetry monitoring, which reveals irregularly spaced QRS complexes and an absence of organized atrial activity (ie, no discernible P waves or flutter waves). For patients not on a continuous cardiac monitor, the diagnosis of AF is made by 12‐lead ECG, which is triggered by patient complaint (palpitations, lightheadedness, dyspnea, or chest pain), physical exam findings, or review of vital sign measurements (ie, sudden changes in heart rate). The dysrhythmia should sustain for at least 30 seconds for a diagnosis of AF to be made.
INITIAL WORKUP
When AF is suspected (or has been diagnosed by telemetry), a 12‐lead ECG should be immediately obtained (Table 1). This will help to confirm the diagnosis of AF (as distinct from atrial flutter) and begin the investigation for underlying causes (ie, analysis of ST‐segment shifts for evidence of myocardial ischemia or pericarditis). A focused history, physical exam, and review of vital signs can quickly determine if there are any urgent indications for cardioversion, such as the development of pulmonary edema, the presence of angina pectoris, or rhythm‐related hypotension. A TTE should be obtained to assess for structural heart disease (left atrial enlargement, valvular disease, cardiac tumor) that may serve as a substrate for AF. The echocardiogram will also provide an assessment of left ventricular function, which will inform the treating physician regarding the safety of using atrioventricular (AV) nodal blocking agents, such as ‐blockers and nondihydropyridine calcium channel blockers, which may also act as negative inotropes. Although occult hyperthyroidism is a rare cause of AF,[22] a serum thyroid‐stimulating hormone test should be obtained to rule out this reversible cause. Electrolytes should be monitored and serum potassium and magnesium levels should be maintained at >4.0 mmol/L and >2.0 mEq mmol/L, respectively. Measurement of serum B‐type natriuretic peptide can be helpful in determining prognosis and likelihood of left ventricular dysfunction in patients with AF.[23, 24]
|
| Confirmatory study |
| 12‐lead electrocardiogram |
| Assessment of clinical stability |
| History (chest pain, shortness of breath, syncope/presyncope) |
| Physical exam (blood pressure, heart rate, pulmonary rales, jugular venous distension) |
| Evaluation for structural heart disease |
| Physical exam (pathologic murmurs, third heart sound, abnormal PMI, friction rub) |
| Transthoracic echocardiogram |
| Metabolic triggers |
| Serum potassium and magnesium |
| Serum thyroid stimulating hormone |
| Prognostic indicators |
| Serum brain natriuretic peptide |
| Other investigations (as guided by clinical suspicion) |
| Chest CT angiogram |
| Serum troponin |
| Blood cultures |
Other investigations should be guided by the clinical suspicion for other secondary causes. Examples include assessment for infection in the postoperative patient, ruling out myocardial infarction in patients with chest pain and risk factors for coronary artery disease, evaluating for pericarditis following cardiac surgery, and having a high suspicion for pulmonary embolism in patients with prolonged immobilization, hypercoagulable state, or recent knee/hip replacement surgery.
STRATEGIES FOR PREVENTION/SCREENING
AF prevention and screening strategies are not practical for patients admitted for medical illnesses. When used for perioperative prophylaxis, however, amiodarone has been shown to clearly reduce postoperative AF (and shorten hospitalizations) after coronary artery bypass graft surgery.[4, 25] Statin use has been associated with a decrease in postoperative AF following major noncardiac surgery.[26] Patients hospitalized with acute ischemic stroke or TIA should undergo cardiac monitoring throughout their hospitalization if feasible, or for at least 24 hours.[27] Recent data indicate that either Holter monitoring or continuous cardiac telemetry are acceptable methods of screening stroke patients for underlying AF.[11]
THERAPIES
In all cases of AF, underlying causes of the dysrhythmia (such as heart failure, infection, electrolyte disturbances, and pain) should be sought and treated.
AF associated with unstable symptoms (heart failure, angina, hypotension) calls for urgent rhythm control. In this setting, cardioversion should be performed immediately; anticoagulation should be initiated concomitantly unless a contraindication to anticoagulation exists. Stable patients should be assessed for indications for elective cardioversion and acute anticoagulation. Generally speaking, it is desirable to perform transesophageal echocardiography (TEE) and cardioversion prior to discharge from the hospital in patients whose new‐onset AF has persisted, assuming that they are candidates for therapeutic anticoagulation. This is particularly true for patients who are at all symptomatic from their AF. Allowing patients to remain in AF for weeks to months will increase their risk of developing long‐standing persistent AF.
AF is a well‐recognized risk factor for the development of atrial thrombi and resultant thromboembolic events. Thrombus formation is thought to be a result of stasis of blood in the atria during AF as well as a localized hypercoagulable state in the left atrium in patients with AF.[28] Left atrial thrombus can develop in patients with AF of duration 3 days.[29] Echocardiographic evidence suggests that left atrial appendage function can be transiently depressed following cardioversion, which may help to explain the finding of increased risk of thromboembolism immediately after cardioversion.[30, 31] In fact, 98% of thromboembolic events after cardioversion occur within 10 days.[31] Studies using serial TEE show that atrial thrombi typically resolve after 3 to 4 weeks of anticoagulation.[28] These data are the basis for the recommendation that patients with AF that has lasted 48 hours or more should receive 4 weeks of therapeutic anticoagulation prior to cardioversion that is not TEE guided. Importantly, administration of antiarrhythmic agents, such as amiodarone, should be considered an attempt at rhythm control, and therefore anticoagulation should be used in the same way during antiarrhythmic drug initiation as with direct‐current cardioversion. Medications most commonly used to acutely terminate AF are ibutilide, propafenone, and flecainide.
In the inpatient setting, nonemergent cardioversion in patients who have had AF for more than 48 hours should be TEE guided, unless the onset of the arrhythmia was clearly documented and therapeutic anticoagulation was initiated within 48 hours of the onset. Patients should be receiving therapeutic anticoagulation at the time of the TEE. Contrast‐enhanced magnetic resonance imaging is a promising noninvasive option for assessing for intracardiac thrombus, but this modality has not yet been widely adopted as an acceptable alternative to TEE.[32]
Anticoagulation in the short term can be rapidly achieved using heparins (intravenous unfractionated heparin, subcutaneous enoxaparin) or the newer oral anticoagulants such as dabigatran (a thrombin inhibitor) or rivaroxaban and apixaban (factor Xa inhibitors). Importantly, should significant bleeding occur, options for reversal of these new oral anticoagulant agents are limited.[33] Vitamin K antagonists such as warfarin remain a viable option for long‐term anticoagulation, but usually require 4 to 5 days to reach peak effect; the goal international normalized ratio (INR) is 2.0 to 3.0. In patients with chronic kidney disease, the newer oral anticoagulants (dabigatran, rivaroxiban, and apixaban), as well as low molecular weight heparins, should be dose adjusted in patients with moderate renal dysfunction and avoided altogether in patients with severe renal dysfunction.
Ventricular response rate control, rather than rhythm control, is a reasonable initial strategy for patients who do not have significant symptoms from AF. Rate control can be achieved using traditional AV nodal blocking agents (‐blockers and nondihydropyridine calcium channel blockers). Initially, the use of intravenous (IV) agents is reasonable. IV metoprolol and IV diltiazem are useful because they both have a rapid onset of action, which allows for repeated bolus dosing at closely spaced intervals. Both IV agents have a 2‐ to 4‐hour half‐life. Once rate control has been achieved, the amount of IV drug required to achieve heart rate control can be tallied and converted into oral dosing. Cardiac glycosides can also be used to rate‐control AF; digitalis works by exerting a vagotonic effect via alterations in calcium handling in the AV node. Digoxin is most effective in the rate control of patients with persistent AF rather than those with recent onset AF.[34] Even in patients with persistent AF, digoxin only lowers average heart rate during rest and not during exertion/stress.[35] In patients with marginal blood pressure, digoxin can be safely used because it does not have any negative inotropic effects. In patients receiving a rate control strategy, the decision of whether to anticoagulate should be based on the risk of thromboembolic stroke as determined by clinical risk factors. In general, patients with a CHADS2 score[36] of 0 can be treated with aspirin (325 mg daily)[37] for thromboembolism prevention, and those with a score of 2 or more should receive therapeutic anticoagulation. Patients with a CHADS2 score of 1 can reasonably be treated with either regimen, and a more nuanced assessment of bleeding and stroke risk is required. The more recently described CHA2DS2‐VASc score allows for better stroke risk discrimination among patients with low CHADS2 scores (Table 2).[38]
| CHADS2 Elements | CHADS2 Score | Annual Stroke Risk |
|---|---|---|
| ||
| CHF | 0 | 1.2% |
| Hypertension | 1 | 2.8% |
| Age 75 years | 2 | 3.6% |
| Diabetes | 3 | 6.4% |
| Stroke/TIA (2 points) | 4 | 8.0% |
| 56 | 11.4% | |
| CHA2DS2‐VASc Elements | CHA2DS2‐VASc Score | Annual Stroke Risk a |
| CHF | 0 | 0.0% |
| Hypertension | 1 | 0.7% |
| Age 75 years (2 points) | 2 | 1.9% |
| Age 6574 years | 3 | 4.7% |
| Diabetes | 4 | 2.3% |
| Stroke/TIA (2) | 5 | 3.9% |
| Vascular disease | 6 | 4.5% |
| Female gender | 7 | 10.1% |
| 89 | 20% | |
Additionally, the HAS‐BLED scoring system (which incorporates hypertension, abnormal renal/liver function, stroke, bleeding history, labile INR, and drugs/alcohol) provides a convenient method for estimating a patient's risk of major bleeding with therapeutic anticoagulation.[39]
Patients who are hospitalized with acute stroke and are found to have new onset AF require special consideration in regard to the timing of anticoagulation and rate‐control strategies. Although these patients are at risk for recurrent cardioembolism during their hospitalization, they are also at increased risk of hemorrhagic conversion of their cerebral infarct. Randomized studies comparing lowmolecular‐weight heparins versus antiplatelet agents for acute cardioembolic stroke indicate no net benefit of anticoagulation in thefirst 2 weeks after stroke.[40, 41] However, anticoagulation is probably safe within 14 days for patients with minor stroke because they are at less risk of hemorrhagic conversion.[27] Therefore, a reasonable approach is to start anticoagulation immediately after TIA, 5 to 7 days after a minor stroke, and 10 to 14 days after a major stroke. Furthermore, patients with acute ischemic stroke are particularly susceptible to infarct extension from even minor degrees of blood pressure reduction,[42] and therefore their AF must be managed with this hemodynamic consideration in mind.
SHORT‐TERM SEQUELAE
Increased hospital stay length, hospital cost, and morbidity have been well described to be increased in patients with postoperative AF following cardiac surgery[5] and noncardiac surgery.[43] In a recent study of patients with severe sepsis, those who developed new onset AF had a significantly increased risk of stroke and in‐hospital mortality.[7]
LONG‐TERM THERAPIES/MONITORING
Among patients with newly diagnosed AF during a hospitalization, those with multiple major risk factors for stroke (CHADS2 score >1 or CHA2DS2VASc score >2) should receive long‐term anticoagulation, unless monitoring is performed (Holter monitor, event monitor, implantable loop recorder) and shows an absence of AF. In patients with hypertension or coronary artery disease, prescription of a ‐blocker should be considered. Outpatient clinic follow‐up with a general cardiologist or electrophysiologist is important to help guide these decisions regarding rhythm monitoring, continuation of anticoagulation, and continuation of any antiarrhythmic drugs that were prescribed.
LONG‐TERM SEQUELAE
AF has recently been shown to have adverse long‐term consequences, even in a relatively healthy cohort of patients.[44] Postoperative AF has been associated with poor neurocognitive outcomes following CABG surgery.[45] Although data are lacking with regard to the prognostic significance of AF in the setting of hospitalization, it is reasonable to presume that it is a predictor for future episodes of AF. We know that 15% to 20% of all strokes occur in patients with AF,[2] and the group of patients with a new diagnosis of AF during hospital admission is almost certainly enriched for stroke risk. This underscores the importance of either starting long‐term anticoagulation upon discharge in patients at medium‐high risk of stroke, or ensuring timely communication of a new AF diagnosis to patients' outpatient physicians so that appropriate antithrombotic drugs can be started soon after discharge.
CONCLUSIONS
AF is a common problem among patients hospitalized for medical illness or in the postoperative state. Diagnosis of the dysrhythmia and identification of any reversible causes are the key first steps in management. Oftentimes, rate and rhythm control strategies are both reasonable courses of action, although it is important to include appropriate anticoagulation as part of both approaches. Cardiology consultation can be helpful in the decision‐making process.
In the vignette described at the beginning, we have a patient with a CHADS2 score of 2 (age, hypertension) and newly diagnosed paroxysmal AF during hospitalization. The dysrhythmia was likely triggered by his medical illness, but we have no way of knowing whether he has had asymptomatic paroxysms of AF in the past. Oral anticoagulation along with a ‐blocker should be prescribed at discharge. Clinic follow‐up with a cardiologist should be arranged prior to discharge, and consideration of withdrawing anticoagulation in the future should be guided by outpatient rhythm monitoring.
Disclosure
Nothing to report.
- , , , et al. Prevalence of diagnosed atrial fibrillation in adults: national implications for rhythm management and stroke prevention: the AnTicoagulation and Risk Factors in Atrial Fibrillation (ATRIA) Study. JAMA. 2001;285:2370–2375.
- , , , , . Prevalence, age distribution, and gender of patients with atrial fibrillation. Analysis and implications. Arch Intern Med. 1995;155:469–473.
- , , , et al. Inflammation as a risk factor for atrial fibrillation. Circulation. 2003;108:3006–3010.
- , , , et al. Prophylactic Oral Amiodarone for the Prevention of Arrhythmias that Begin Early After Revascularization, Valve Replacement, or Repair: PAPABEAR: a randomized controlled trial. JAMA. 2005;294:3093–3100.
- , , , et al. Atrial fibrillation following coronary artery bypass graft surgery: predictors, outcomes, and resource utilization. MultiCenter Study of Perioperative Ischemia Research Group. JAMA. 1996;276:300–306.
- , , , , . Incidence, predictors, and outcomes associated with postoperative atrial fibrillation after major noncardiac surgery. Am Heart J. 2012;164: 918–924.
- , , , , . Incident stroke and mortality associated with new‐onset atrial fibrillation in patients hospitalized with severe sepsis. JAMA. 2011;306:2248–2254.
- , , . Usefulness of cardiovascular investigations in stroke management: clinical relevance and economic implications. Stroke. 2007;38:1956–1958.
- , , , . Value of cardiac monitoring and echocardiography in TIA and stroke patients. Stroke. 1985;16:950–956.
- , , . Ambulatory electrocardiographic monitoring in patients with transient focal cerebral ischaemia. J Neurol Neurosurg Psychiatry. 1984;47:256–259.
- , , , et al. Continuous stroke unit electrocardiographic monitoring versus 24‐hour holter electrocardiography for detection of paroxysmal atrial fibrillation after stroke. Stroke. 2012;43:2689–2694.
- , , , , . Noninvasive cardiac monitoring for detecting paroxysmal atrial fibrillation or flutter after acute ischemic stroke: a systematic review. Stroke. 2007;38:2935–2940.
- , , , et al. ACC/AHA/ESC 2006 guidelines for the management of patients with atrial fibrillation: full text: a report of the American College of Cardiology/American Heart Association Task Force on practice guidelines and the European Society of Cardiology Committee for Practice Guidelines (Writing Committee to Revise the 2001 guidelines for the management of patients with atrial fibrillation) developed in collaboration with the European Heart Rhythm Association and the Heart Rhythm Society. Europace. 2006;8:651–745.
- , , , , , . Histological substrate of atrial biopsies in patients with lone atrial fibrillation. Circulation. 1997;96:1180–1184.
- , , . Role of inflammation in initiation and perpetuation of atrial fibrillation: a systematic review of the published data. J Am Coll Cardiol. 2007;50:2021–2028.
- , , , et al. Atrial fibrillation after coronary artery bypass grafting is associated with sympathetic activation. Ann Thorac Surg. 1995;60:1709–1715.
- , , , et al. Inflammation of atrium after cardiac surgery is associated with inhomogeneity of atrial conduction and atrial fibrillation. Circulation. 2005;111:2881–2888.
- , , , et al. Obstructive sleep apnea, obesity, and the risk of incident atrial fibrillation. J Am Coll Cardiol. 2007;49:565–571.
- , , , . Mechanisms, prevention, and treatment of atrial fibrillation after cardiac surgery. J Am Coll Cardiol. 2008;51:793–801.
- , , , . Incidence of arrhythmias after thoracic surgery: thoracotomy versus video‐assisted thoracoscopy. J Cardiothorac Vasc Anesth. 1998;12:659–661.
- , , , et al. Delayed detection of atrial fibrillation after ischemic stroke. J Stroke Cerebrovasc Dis. 2009;18:453–457.
- , , , et al. How useful is thyroid function testing in patients with recent‐onset atrial fibrillation? The Canadian Registry of Atrial Fibrillation Investigators. Arch Intern Med. 1996;156:2221–2224.
- , , , , , . Natriuretic peptide levels in atrial fibrillation: a prospective hormonal and Doppler‐echocardiographic study. J Am Coll Cardiol. 2000;35:1256–1262.
- , , . Relationship between brain natriuretic peptide and recurrence of atrial fibrillation after successful electrical cardioversion: a meta‐analysis. J Int Med Res. 2011;39:1618–1624.
- , , , et al. Amiodarone prophylaxis for atrial fibrillation of high‐risk patients after coronary bypass grafting: a prospective, double‐blinded, placebo‐controlled, randomized study. Eur Heart J. 2006;27:1584–1591.
- , , , , . Statin use and postoperative atrial fibrillation after major noncardiac surgery. Heart Rhythm. 2012;9:163–169.
- , , , et al. Guidelines for the prevention of stroke in patients with stroke or transient ischemic attack: a guideline for healthcare professionals from the American Heart Association/American Stroke Association. Stroke. 2011;42:227–276.
- , , , . Cardioversion of nonrheumatic atrial fibrillation. Reduced thromboembolic complications with 4 weeks of precardioversion anticoagulation are related to atrial thrombus resolution. Circulation. 1995;92:160–163.
- , , , . Left atrial appendage thrombus is not uncommon in patients with acute atrial fibrillation and a recent embolic event: a transesophageal echocardiographic study. J Am Coll Cardiol. 1995;25:452–459.
- , , , et al. Impact of electrical cardioversion for atrial fibrillation on left atrial appendage function and spontaneous echo contrast: characterization by simultaneous transesophageal echocardiography. J Am Coll Cardiol. 1993;22:1359–1366.
- , , , . Pulsed Doppler evaluation of atrial mechanical function after electrical cardioversion of atrial fibrillation. J Am Coll Cardiol. 1989;13:617–623.
- , , , et al. Detection and characterization of intracardiac thrombi on MR imaging. AJR Am J Roentgenol. 2002;179:1539–1544.
- , , , , , . Reversal of rivaroxaban and dabigatran by prothrombin complex concentrate: a randomized, placebo‐controlled, crossover study in healthy subjects. Circulation. 2011;124:1573–1579.
- , , , et al. Conversion of atrial fibrillation to sinus rhythm and rate control by digoxin in comparison to placebo. Eur Heart J. 1997;18:643–648.
- , , , et al. The evidence regarding the drugs used for ventricular rate control. J Fam Pract. 2000;49:47–59.
- , , , , , . Validation of clinical classification schemes for predicting stroke: results from the National Registry of Atrial Fibrillation. JAMA. 2001;285:2864–2870.
- Stroke prevention in atrial fibrillation study. Final results. Circulation. 1991;84:527–539.
- , , , , . Refining clinical risk stratification for predicting stroke and thromboembolism in atrial fibrillation using a novel risk factor‐based approach: the Euro Heart Survey on atrial fibrillation. Chest. 2010;137:263–272.
- , , , , , . A novel user‐friendly score (HAS‐BLED) to assess 1‐year risk of major bleeding in patients with atrial fibrillation: the Euro Heart Survey. Chest. 2010;138:1093–1100.
- , , , . Low molecular‐weight heparin versus aspirin in patients with acute ischaemic stroke and atrial fibrillation: a double‐blind randomised study. HAEST Study Group. Heparin in Acute Embolic Stroke Trial. Lancet. 2000;355:1205–1210.
- The International Stroke Trial (IST): a randomised trial of aspirin, subcutaneous heparin, both, or neither among 19435 patients with acute ischaemic stroke. International Stroke Trial Collaborative Group. Lancet. 1997;349:1569–1581.
- , , , et al. The angiotensin‐receptor blocker candesartan for treatment of acute stroke (SCAST): a randomised, placebo‐controlled, double‐blind trial. Lancet. 2011;377:741–750.
- , , , , . Supraventricular arrhythmia in patients having noncardiac surgery: clinical correlates and effect on length of stay. Ann Intern Med. 1998;129:279–285.
- , , , et al. Risk of death and cardiovascular events in initially healthy women with new‐onset atrial fibrillation. JAMA. 2011;305:2080–2087.
- , , , et al. The impact of postoperative atrial fibrillation on neurocognitive outcome after coronary artery bypass graft surgery. Anesth Analg. 2002;94:290–295, table of contents.
A 78‐year‐old otherwise healthy man with longstanding hypertension is admitted to the hospital with pneumonia. During the second hospital day, he develops atrial fibrillation (AF) with rapid ventricular response, but his hemodynamics remain stable. He is given oral metoprolol for rate control. A transthoracic echocardiogram (TTE) shows mild concentric left ventricular hypertrophy, normal left ventricular size and function, and mild left atrial enlargement. The AF spontaneously terminates after 24 hours and does not recur during the hospitalization. What treatment and monitoring are recommended at the time of discharge for this patient's AF?
BACKGROUND
AF is a common dysrhythmia that clinicians often encounter while caring for hospitalized patients. Although many patients will have carried a diagnosis of AF prior to hospital admission, this review will pertain to patients for whom a first documented episode of AF occurs during hospitalization. These patients can be conceptually separated into 2 categories: those who have had undiagnosed AF for some time (and are now diagnosed due to continuous inpatient telemetry monitoring) and those whose AF is secondary to their acute medical illness. Although practically speaking, this distinction is not easy to make, markers of chronic AF may include left atrial enlargement and a clinical history of longstanding palpitations.
INCIDENCE
The prevalence of AF in the general population is estimated at 0.4% to 1.0%.[1, 2] Prevalence increases with advancing age. Compared to the general population, the population of hospitalized patients is inherently older and enriched for comorbidities that are known risk factors for the development of AF (such as congestive heart failure, hypertension, and obstructive sleep apnea) or are associated with paroxysmal AF (such as stroke or transient ischemic attack [TIA]). As a result, the prevalence of occult AF is necessarily higher in this population than that of a general cohort. The risk of developing AF is further increased in hospitalized patients simply by the acute illness (or postoperative state), whose associated catecholamine surge and systemic proinflammatory state are well‐known precipitants for AF.[3] AF is common after cardiac surgery (25%30%)[4, 5] and occurs in about 3% of patients undergoing major noncardiac surgery.[6]
In the setting of severe medical illness such as sepsis, the incidence of new onset AF has recently been estimated at around 6%.[7] Among patients hospitalized with stroke, 2% to 5% will have a new diagnosis of AF made by the admission electrocardiogram (ECG).[8, 9, 10] Subsequent cardiac monitoring with inpatient telemetry or Holter monitoring will detect previously undiagnosed AF in another 5% to 8% of patients admitted with stroke.[11, 12]
PATHOPHYSIOLOGY
AF is a supraventricular tachyarrhythmia characterized by uncoordinated atrial activation; this chaotic atrial activation translates into atrial mechanical dysfunction. [13] Patients who develop AF may have atrial substrate, such as patchy atrial myocyte fibrosis, that increases their propensity to develop atrial dysrhythmias.[14] Other factors contributing to the likelihood of developing AF are anisotropic conduction, atrial chamber dilation, systemic inflammation, hyperadrenergic state, and atrial ischemia.[3, 15, 16, 17] Atrial flutter, on the other hand, is an organized macro‐reentrant supraventricular arrhythmia that typically rotates around the tricuspid annulus.
RISK FACTORS
Risk factors for the development of AF are well defined. The risk factors in the chronic setting remain the same as those for the development of AF in the setting of medical illness or in the postoperative state: advancing age, male gender, prior diagnosis of AF, congestive heart failure, hypertension, and obstructive sleep apnea.[1, 5, 18] Surgical procedures, due to the sympathetic surge and proinflammatory state that occur in the postoperative period, increase the risk of AF. Cardiac and thoracic procedures, which involve direct manipulation of the heart and adjacent structures, proffer the highest risk of AF.[19, 20] Although not necessarily a risk factor for the development of AF, patients with recent ischemic stroke are at high risk of harboring AF; up to 7% of patients are diagnosed with AF in the 3 months following ischemic stroke.[21]
DIAGNOSIS
In the inpatient setting, the diagnosis of AF is typically made through telemetry monitoring, which reveals irregularly spaced QRS complexes and an absence of organized atrial activity (ie, no discernible P waves or flutter waves). For patients not on a continuous cardiac monitor, the diagnosis of AF is made by 12‐lead ECG, which is triggered by patient complaint (palpitations, lightheadedness, dyspnea, or chest pain), physical exam findings, or review of vital sign measurements (ie, sudden changes in heart rate). The dysrhythmia should sustain for at least 30 seconds for a diagnosis of AF to be made.
INITIAL WORKUP
When AF is suspected (or has been diagnosed by telemetry), a 12‐lead ECG should be immediately obtained (Table 1). This will help to confirm the diagnosis of AF (as distinct from atrial flutter) and begin the investigation for underlying causes (ie, analysis of ST‐segment shifts for evidence of myocardial ischemia or pericarditis). A focused history, physical exam, and review of vital signs can quickly determine if there are any urgent indications for cardioversion, such as the development of pulmonary edema, the presence of angina pectoris, or rhythm‐related hypotension. A TTE should be obtained to assess for structural heart disease (left atrial enlargement, valvular disease, cardiac tumor) that may serve as a substrate for AF. The echocardiogram will also provide an assessment of left ventricular function, which will inform the treating physician regarding the safety of using atrioventricular (AV) nodal blocking agents, such as ‐blockers and nondihydropyridine calcium channel blockers, which may also act as negative inotropes. Although occult hyperthyroidism is a rare cause of AF,[22] a serum thyroid‐stimulating hormone test should be obtained to rule out this reversible cause. Electrolytes should be monitored and serum potassium and magnesium levels should be maintained at >4.0 mmol/L and >2.0 mEq mmol/L, respectively. Measurement of serum B‐type natriuretic peptide can be helpful in determining prognosis and likelihood of left ventricular dysfunction in patients with AF.[23, 24]
|
| Confirmatory study |
| 12‐lead electrocardiogram |
| Assessment of clinical stability |
| History (chest pain, shortness of breath, syncope/presyncope) |
| Physical exam (blood pressure, heart rate, pulmonary rales, jugular venous distension) |
| Evaluation for structural heart disease |
| Physical exam (pathologic murmurs, third heart sound, abnormal PMI, friction rub) |
| Transthoracic echocardiogram |
| Metabolic triggers |
| Serum potassium and magnesium |
| Serum thyroid stimulating hormone |
| Prognostic indicators |
| Serum brain natriuretic peptide |
| Other investigations (as guided by clinical suspicion) |
| Chest CT angiogram |
| Serum troponin |
| Blood cultures |
Other investigations should be guided by the clinical suspicion for other secondary causes. Examples include assessment for infection in the postoperative patient, ruling out myocardial infarction in patients with chest pain and risk factors for coronary artery disease, evaluating for pericarditis following cardiac surgery, and having a high suspicion for pulmonary embolism in patients with prolonged immobilization, hypercoagulable state, or recent knee/hip replacement surgery.
STRATEGIES FOR PREVENTION/SCREENING
AF prevention and screening strategies are not practical for patients admitted for medical illnesses. When used for perioperative prophylaxis, however, amiodarone has been shown to clearly reduce postoperative AF (and shorten hospitalizations) after coronary artery bypass graft surgery.[4, 25] Statin use has been associated with a decrease in postoperative AF following major noncardiac surgery.[26] Patients hospitalized with acute ischemic stroke or TIA should undergo cardiac monitoring throughout their hospitalization if feasible, or for at least 24 hours.[27] Recent data indicate that either Holter monitoring or continuous cardiac telemetry are acceptable methods of screening stroke patients for underlying AF.[11]
THERAPIES
In all cases of AF, underlying causes of the dysrhythmia (such as heart failure, infection, electrolyte disturbances, and pain) should be sought and treated.
AF associated with unstable symptoms (heart failure, angina, hypotension) calls for urgent rhythm control. In this setting, cardioversion should be performed immediately; anticoagulation should be initiated concomitantly unless a contraindication to anticoagulation exists. Stable patients should be assessed for indications for elective cardioversion and acute anticoagulation. Generally speaking, it is desirable to perform transesophageal echocardiography (TEE) and cardioversion prior to discharge from the hospital in patients whose new‐onset AF has persisted, assuming that they are candidates for therapeutic anticoagulation. This is particularly true for patients who are at all symptomatic from their AF. Allowing patients to remain in AF for weeks to months will increase their risk of developing long‐standing persistent AF.
AF is a well‐recognized risk factor for the development of atrial thrombi and resultant thromboembolic events. Thrombus formation is thought to be a result of stasis of blood in the atria during AF as well as a localized hypercoagulable state in the left atrium in patients with AF.[28] Left atrial thrombus can develop in patients with AF of duration 3 days.[29] Echocardiographic evidence suggests that left atrial appendage function can be transiently depressed following cardioversion, which may help to explain the finding of increased risk of thromboembolism immediately after cardioversion.[30, 31] In fact, 98% of thromboembolic events after cardioversion occur within 10 days.[31] Studies using serial TEE show that atrial thrombi typically resolve after 3 to 4 weeks of anticoagulation.[28] These data are the basis for the recommendation that patients with AF that has lasted 48 hours or more should receive 4 weeks of therapeutic anticoagulation prior to cardioversion that is not TEE guided. Importantly, administration of antiarrhythmic agents, such as amiodarone, should be considered an attempt at rhythm control, and therefore anticoagulation should be used in the same way during antiarrhythmic drug initiation as with direct‐current cardioversion. Medications most commonly used to acutely terminate AF are ibutilide, propafenone, and flecainide.
In the inpatient setting, nonemergent cardioversion in patients who have had AF for more than 48 hours should be TEE guided, unless the onset of the arrhythmia was clearly documented and therapeutic anticoagulation was initiated within 48 hours of the onset. Patients should be receiving therapeutic anticoagulation at the time of the TEE. Contrast‐enhanced magnetic resonance imaging is a promising noninvasive option for assessing for intracardiac thrombus, but this modality has not yet been widely adopted as an acceptable alternative to TEE.[32]
Anticoagulation in the short term can be rapidly achieved using heparins (intravenous unfractionated heparin, subcutaneous enoxaparin) or the newer oral anticoagulants such as dabigatran (a thrombin inhibitor) or rivaroxaban and apixaban (factor Xa inhibitors). Importantly, should significant bleeding occur, options for reversal of these new oral anticoagulant agents are limited.[33] Vitamin K antagonists such as warfarin remain a viable option for long‐term anticoagulation, but usually require 4 to 5 days to reach peak effect; the goal international normalized ratio (INR) is 2.0 to 3.0. In patients with chronic kidney disease, the newer oral anticoagulants (dabigatran, rivaroxiban, and apixaban), as well as low molecular weight heparins, should be dose adjusted in patients with moderate renal dysfunction and avoided altogether in patients with severe renal dysfunction.
Ventricular response rate control, rather than rhythm control, is a reasonable initial strategy for patients who do not have significant symptoms from AF. Rate control can be achieved using traditional AV nodal blocking agents (‐blockers and nondihydropyridine calcium channel blockers). Initially, the use of intravenous (IV) agents is reasonable. IV metoprolol and IV diltiazem are useful because they both have a rapid onset of action, which allows for repeated bolus dosing at closely spaced intervals. Both IV agents have a 2‐ to 4‐hour half‐life. Once rate control has been achieved, the amount of IV drug required to achieve heart rate control can be tallied and converted into oral dosing. Cardiac glycosides can also be used to rate‐control AF; digitalis works by exerting a vagotonic effect via alterations in calcium handling in the AV node. Digoxin is most effective in the rate control of patients with persistent AF rather than those with recent onset AF.[34] Even in patients with persistent AF, digoxin only lowers average heart rate during rest and not during exertion/stress.[35] In patients with marginal blood pressure, digoxin can be safely used because it does not have any negative inotropic effects. In patients receiving a rate control strategy, the decision of whether to anticoagulate should be based on the risk of thromboembolic stroke as determined by clinical risk factors. In general, patients with a CHADS2 score[36] of 0 can be treated with aspirin (325 mg daily)[37] for thromboembolism prevention, and those with a score of 2 or more should receive therapeutic anticoagulation. Patients with a CHADS2 score of 1 can reasonably be treated with either regimen, and a more nuanced assessment of bleeding and stroke risk is required. The more recently described CHA2DS2‐VASc score allows for better stroke risk discrimination among patients with low CHADS2 scores (Table 2).[38]
| CHADS2 Elements | CHADS2 Score | Annual Stroke Risk |
|---|---|---|
| ||
| CHF | 0 | 1.2% |
| Hypertension | 1 | 2.8% |
| Age 75 years | 2 | 3.6% |
| Diabetes | 3 | 6.4% |
| Stroke/TIA (2 points) | 4 | 8.0% |
| 56 | 11.4% | |
| CHA2DS2‐VASc Elements | CHA2DS2‐VASc Score | Annual Stroke Risk a |
| CHF | 0 | 0.0% |
| Hypertension | 1 | 0.7% |
| Age 75 years (2 points) | 2 | 1.9% |
| Age 6574 years | 3 | 4.7% |
| Diabetes | 4 | 2.3% |
| Stroke/TIA (2) | 5 | 3.9% |
| Vascular disease | 6 | 4.5% |
| Female gender | 7 | 10.1% |
| 89 | 20% | |
Additionally, the HAS‐BLED scoring system (which incorporates hypertension, abnormal renal/liver function, stroke, bleeding history, labile INR, and drugs/alcohol) provides a convenient method for estimating a patient's risk of major bleeding with therapeutic anticoagulation.[39]
Patients who are hospitalized with acute stroke and are found to have new onset AF require special consideration in regard to the timing of anticoagulation and rate‐control strategies. Although these patients are at risk for recurrent cardioembolism during their hospitalization, they are also at increased risk of hemorrhagic conversion of their cerebral infarct. Randomized studies comparing lowmolecular‐weight heparins versus antiplatelet agents for acute cardioembolic stroke indicate no net benefit of anticoagulation in thefirst 2 weeks after stroke.[40, 41] However, anticoagulation is probably safe within 14 days for patients with minor stroke because they are at less risk of hemorrhagic conversion.[27] Therefore, a reasonable approach is to start anticoagulation immediately after TIA, 5 to 7 days after a minor stroke, and 10 to 14 days after a major stroke. Furthermore, patients with acute ischemic stroke are particularly susceptible to infarct extension from even minor degrees of blood pressure reduction,[42] and therefore their AF must be managed with this hemodynamic consideration in mind.
SHORT‐TERM SEQUELAE
Increased hospital stay length, hospital cost, and morbidity have been well described to be increased in patients with postoperative AF following cardiac surgery[5] and noncardiac surgery.[43] In a recent study of patients with severe sepsis, those who developed new onset AF had a significantly increased risk of stroke and in‐hospital mortality.[7]
LONG‐TERM THERAPIES/MONITORING
Among patients with newly diagnosed AF during a hospitalization, those with multiple major risk factors for stroke (CHADS2 score >1 or CHA2DS2VASc score >2) should receive long‐term anticoagulation, unless monitoring is performed (Holter monitor, event monitor, implantable loop recorder) and shows an absence of AF. In patients with hypertension or coronary artery disease, prescription of a ‐blocker should be considered. Outpatient clinic follow‐up with a general cardiologist or electrophysiologist is important to help guide these decisions regarding rhythm monitoring, continuation of anticoagulation, and continuation of any antiarrhythmic drugs that were prescribed.
LONG‐TERM SEQUELAE
AF has recently been shown to have adverse long‐term consequences, even in a relatively healthy cohort of patients.[44] Postoperative AF has been associated with poor neurocognitive outcomes following CABG surgery.[45] Although data are lacking with regard to the prognostic significance of AF in the setting of hospitalization, it is reasonable to presume that it is a predictor for future episodes of AF. We know that 15% to 20% of all strokes occur in patients with AF,[2] and the group of patients with a new diagnosis of AF during hospital admission is almost certainly enriched for stroke risk. This underscores the importance of either starting long‐term anticoagulation upon discharge in patients at medium‐high risk of stroke, or ensuring timely communication of a new AF diagnosis to patients' outpatient physicians so that appropriate antithrombotic drugs can be started soon after discharge.
CONCLUSIONS
AF is a common problem among patients hospitalized for medical illness or in the postoperative state. Diagnosis of the dysrhythmia and identification of any reversible causes are the key first steps in management. Oftentimes, rate and rhythm control strategies are both reasonable courses of action, although it is important to include appropriate anticoagulation as part of both approaches. Cardiology consultation can be helpful in the decision‐making process.
In the vignette described at the beginning, we have a patient with a CHADS2 score of 2 (age, hypertension) and newly diagnosed paroxysmal AF during hospitalization. The dysrhythmia was likely triggered by his medical illness, but we have no way of knowing whether he has had asymptomatic paroxysms of AF in the past. Oral anticoagulation along with a ‐blocker should be prescribed at discharge. Clinic follow‐up with a cardiologist should be arranged prior to discharge, and consideration of withdrawing anticoagulation in the future should be guided by outpatient rhythm monitoring.
Disclosure
Nothing to report.
A 78‐year‐old otherwise healthy man with longstanding hypertension is admitted to the hospital with pneumonia. During the second hospital day, he develops atrial fibrillation (AF) with rapid ventricular response, but his hemodynamics remain stable. He is given oral metoprolol for rate control. A transthoracic echocardiogram (TTE) shows mild concentric left ventricular hypertrophy, normal left ventricular size and function, and mild left atrial enlargement. The AF spontaneously terminates after 24 hours and does not recur during the hospitalization. What treatment and monitoring are recommended at the time of discharge for this patient's AF?
BACKGROUND
AF is a common dysrhythmia that clinicians often encounter while caring for hospitalized patients. Although many patients will have carried a diagnosis of AF prior to hospital admission, this review will pertain to patients for whom a first documented episode of AF occurs during hospitalization. These patients can be conceptually separated into 2 categories: those who have had undiagnosed AF for some time (and are now diagnosed due to continuous inpatient telemetry monitoring) and those whose AF is secondary to their acute medical illness. Although practically speaking, this distinction is not easy to make, markers of chronic AF may include left atrial enlargement and a clinical history of longstanding palpitations.
INCIDENCE
The prevalence of AF in the general population is estimated at 0.4% to 1.0%.[1, 2] Prevalence increases with advancing age. Compared to the general population, the population of hospitalized patients is inherently older and enriched for comorbidities that are known risk factors for the development of AF (such as congestive heart failure, hypertension, and obstructive sleep apnea) or are associated with paroxysmal AF (such as stroke or transient ischemic attack [TIA]). As a result, the prevalence of occult AF is necessarily higher in this population than that of a general cohort. The risk of developing AF is further increased in hospitalized patients simply by the acute illness (or postoperative state), whose associated catecholamine surge and systemic proinflammatory state are well‐known precipitants for AF.[3] AF is common after cardiac surgery (25%30%)[4, 5] and occurs in about 3% of patients undergoing major noncardiac surgery.[6]
In the setting of severe medical illness such as sepsis, the incidence of new onset AF has recently been estimated at around 6%.[7] Among patients hospitalized with stroke, 2% to 5% will have a new diagnosis of AF made by the admission electrocardiogram (ECG).[8, 9, 10] Subsequent cardiac monitoring with inpatient telemetry or Holter monitoring will detect previously undiagnosed AF in another 5% to 8% of patients admitted with stroke.[11, 12]
PATHOPHYSIOLOGY
AF is a supraventricular tachyarrhythmia characterized by uncoordinated atrial activation; this chaotic atrial activation translates into atrial mechanical dysfunction. [13] Patients who develop AF may have atrial substrate, such as patchy atrial myocyte fibrosis, that increases their propensity to develop atrial dysrhythmias.[14] Other factors contributing to the likelihood of developing AF are anisotropic conduction, atrial chamber dilation, systemic inflammation, hyperadrenergic state, and atrial ischemia.[3, 15, 16, 17] Atrial flutter, on the other hand, is an organized macro‐reentrant supraventricular arrhythmia that typically rotates around the tricuspid annulus.
RISK FACTORS
Risk factors for the development of AF are well defined. The risk factors in the chronic setting remain the same as those for the development of AF in the setting of medical illness or in the postoperative state: advancing age, male gender, prior diagnosis of AF, congestive heart failure, hypertension, and obstructive sleep apnea.[1, 5, 18] Surgical procedures, due to the sympathetic surge and proinflammatory state that occur in the postoperative period, increase the risk of AF. Cardiac and thoracic procedures, which involve direct manipulation of the heart and adjacent structures, proffer the highest risk of AF.[19, 20] Although not necessarily a risk factor for the development of AF, patients with recent ischemic stroke are at high risk of harboring AF; up to 7% of patients are diagnosed with AF in the 3 months following ischemic stroke.[21]
DIAGNOSIS
In the inpatient setting, the diagnosis of AF is typically made through telemetry monitoring, which reveals irregularly spaced QRS complexes and an absence of organized atrial activity (ie, no discernible P waves or flutter waves). For patients not on a continuous cardiac monitor, the diagnosis of AF is made by 12‐lead ECG, which is triggered by patient complaint (palpitations, lightheadedness, dyspnea, or chest pain), physical exam findings, or review of vital sign measurements (ie, sudden changes in heart rate). The dysrhythmia should sustain for at least 30 seconds for a diagnosis of AF to be made.
INITIAL WORKUP
When AF is suspected (or has been diagnosed by telemetry), a 12‐lead ECG should be immediately obtained (Table 1). This will help to confirm the diagnosis of AF (as distinct from atrial flutter) and begin the investigation for underlying causes (ie, analysis of ST‐segment shifts for evidence of myocardial ischemia or pericarditis). A focused history, physical exam, and review of vital signs can quickly determine if there are any urgent indications for cardioversion, such as the development of pulmonary edema, the presence of angina pectoris, or rhythm‐related hypotension. A TTE should be obtained to assess for structural heart disease (left atrial enlargement, valvular disease, cardiac tumor) that may serve as a substrate for AF. The echocardiogram will also provide an assessment of left ventricular function, which will inform the treating physician regarding the safety of using atrioventricular (AV) nodal blocking agents, such as ‐blockers and nondihydropyridine calcium channel blockers, which may also act as negative inotropes. Although occult hyperthyroidism is a rare cause of AF,[22] a serum thyroid‐stimulating hormone test should be obtained to rule out this reversible cause. Electrolytes should be monitored and serum potassium and magnesium levels should be maintained at >4.0 mmol/L and >2.0 mEq mmol/L, respectively. Measurement of serum B‐type natriuretic peptide can be helpful in determining prognosis and likelihood of left ventricular dysfunction in patients with AF.[23, 24]
|
| Confirmatory study |
| 12‐lead electrocardiogram |
| Assessment of clinical stability |
| History (chest pain, shortness of breath, syncope/presyncope) |
| Physical exam (blood pressure, heart rate, pulmonary rales, jugular venous distension) |
| Evaluation for structural heart disease |
| Physical exam (pathologic murmurs, third heart sound, abnormal PMI, friction rub) |
| Transthoracic echocardiogram |
| Metabolic triggers |
| Serum potassium and magnesium |
| Serum thyroid stimulating hormone |
| Prognostic indicators |
| Serum brain natriuretic peptide |
| Other investigations (as guided by clinical suspicion) |
| Chest CT angiogram |
| Serum troponin |
| Blood cultures |
Other investigations should be guided by the clinical suspicion for other secondary causes. Examples include assessment for infection in the postoperative patient, ruling out myocardial infarction in patients with chest pain and risk factors for coronary artery disease, evaluating for pericarditis following cardiac surgery, and having a high suspicion for pulmonary embolism in patients with prolonged immobilization, hypercoagulable state, or recent knee/hip replacement surgery.
STRATEGIES FOR PREVENTION/SCREENING
AF prevention and screening strategies are not practical for patients admitted for medical illnesses. When used for perioperative prophylaxis, however, amiodarone has been shown to clearly reduce postoperative AF (and shorten hospitalizations) after coronary artery bypass graft surgery.[4, 25] Statin use has been associated with a decrease in postoperative AF following major noncardiac surgery.[26] Patients hospitalized with acute ischemic stroke or TIA should undergo cardiac monitoring throughout their hospitalization if feasible, or for at least 24 hours.[27] Recent data indicate that either Holter monitoring or continuous cardiac telemetry are acceptable methods of screening stroke patients for underlying AF.[11]
THERAPIES
In all cases of AF, underlying causes of the dysrhythmia (such as heart failure, infection, electrolyte disturbances, and pain) should be sought and treated.
AF associated with unstable symptoms (heart failure, angina, hypotension) calls for urgent rhythm control. In this setting, cardioversion should be performed immediately; anticoagulation should be initiated concomitantly unless a contraindication to anticoagulation exists. Stable patients should be assessed for indications for elective cardioversion and acute anticoagulation. Generally speaking, it is desirable to perform transesophageal echocardiography (TEE) and cardioversion prior to discharge from the hospital in patients whose new‐onset AF has persisted, assuming that they are candidates for therapeutic anticoagulation. This is particularly true for patients who are at all symptomatic from their AF. Allowing patients to remain in AF for weeks to months will increase their risk of developing long‐standing persistent AF.
AF is a well‐recognized risk factor for the development of atrial thrombi and resultant thromboembolic events. Thrombus formation is thought to be a result of stasis of blood in the atria during AF as well as a localized hypercoagulable state in the left atrium in patients with AF.[28] Left atrial thrombus can develop in patients with AF of duration 3 days.[29] Echocardiographic evidence suggests that left atrial appendage function can be transiently depressed following cardioversion, which may help to explain the finding of increased risk of thromboembolism immediately after cardioversion.[30, 31] In fact, 98% of thromboembolic events after cardioversion occur within 10 days.[31] Studies using serial TEE show that atrial thrombi typically resolve after 3 to 4 weeks of anticoagulation.[28] These data are the basis for the recommendation that patients with AF that has lasted 48 hours or more should receive 4 weeks of therapeutic anticoagulation prior to cardioversion that is not TEE guided. Importantly, administration of antiarrhythmic agents, such as amiodarone, should be considered an attempt at rhythm control, and therefore anticoagulation should be used in the same way during antiarrhythmic drug initiation as with direct‐current cardioversion. Medications most commonly used to acutely terminate AF are ibutilide, propafenone, and flecainide.
In the inpatient setting, nonemergent cardioversion in patients who have had AF for more than 48 hours should be TEE guided, unless the onset of the arrhythmia was clearly documented and therapeutic anticoagulation was initiated within 48 hours of the onset. Patients should be receiving therapeutic anticoagulation at the time of the TEE. Contrast‐enhanced magnetic resonance imaging is a promising noninvasive option for assessing for intracardiac thrombus, but this modality has not yet been widely adopted as an acceptable alternative to TEE.[32]
Anticoagulation in the short term can be rapidly achieved using heparins (intravenous unfractionated heparin, subcutaneous enoxaparin) or the newer oral anticoagulants such as dabigatran (a thrombin inhibitor) or rivaroxaban and apixaban (factor Xa inhibitors). Importantly, should significant bleeding occur, options for reversal of these new oral anticoagulant agents are limited.[33] Vitamin K antagonists such as warfarin remain a viable option for long‐term anticoagulation, but usually require 4 to 5 days to reach peak effect; the goal international normalized ratio (INR) is 2.0 to 3.0. In patients with chronic kidney disease, the newer oral anticoagulants (dabigatran, rivaroxiban, and apixaban), as well as low molecular weight heparins, should be dose adjusted in patients with moderate renal dysfunction and avoided altogether in patients with severe renal dysfunction.
Ventricular response rate control, rather than rhythm control, is a reasonable initial strategy for patients who do not have significant symptoms from AF. Rate control can be achieved using traditional AV nodal blocking agents (‐blockers and nondihydropyridine calcium channel blockers). Initially, the use of intravenous (IV) agents is reasonable. IV metoprolol and IV diltiazem are useful because they both have a rapid onset of action, which allows for repeated bolus dosing at closely spaced intervals. Both IV agents have a 2‐ to 4‐hour half‐life. Once rate control has been achieved, the amount of IV drug required to achieve heart rate control can be tallied and converted into oral dosing. Cardiac glycosides can also be used to rate‐control AF; digitalis works by exerting a vagotonic effect via alterations in calcium handling in the AV node. Digoxin is most effective in the rate control of patients with persistent AF rather than those with recent onset AF.[34] Even in patients with persistent AF, digoxin only lowers average heart rate during rest and not during exertion/stress.[35] In patients with marginal blood pressure, digoxin can be safely used because it does not have any negative inotropic effects. In patients receiving a rate control strategy, the decision of whether to anticoagulate should be based on the risk of thromboembolic stroke as determined by clinical risk factors. In general, patients with a CHADS2 score[36] of 0 can be treated with aspirin (325 mg daily)[37] for thromboembolism prevention, and those with a score of 2 or more should receive therapeutic anticoagulation. Patients with a CHADS2 score of 1 can reasonably be treated with either regimen, and a more nuanced assessment of bleeding and stroke risk is required. The more recently described CHA2DS2‐VASc score allows for better stroke risk discrimination among patients with low CHADS2 scores (Table 2).[38]
| CHADS2 Elements | CHADS2 Score | Annual Stroke Risk |
|---|---|---|
| ||
| CHF | 0 | 1.2% |
| Hypertension | 1 | 2.8% |
| Age 75 years | 2 | 3.6% |
| Diabetes | 3 | 6.4% |
| Stroke/TIA (2 points) | 4 | 8.0% |
| 56 | 11.4% | |
| CHA2DS2‐VASc Elements | CHA2DS2‐VASc Score | Annual Stroke Risk a |
| CHF | 0 | 0.0% |
| Hypertension | 1 | 0.7% |
| Age 75 years (2 points) | 2 | 1.9% |
| Age 6574 years | 3 | 4.7% |
| Diabetes | 4 | 2.3% |
| Stroke/TIA (2) | 5 | 3.9% |
| Vascular disease | 6 | 4.5% |
| Female gender | 7 | 10.1% |
| 89 | 20% | |
Additionally, the HAS‐BLED scoring system (which incorporates hypertension, abnormal renal/liver function, stroke, bleeding history, labile INR, and drugs/alcohol) provides a convenient method for estimating a patient's risk of major bleeding with therapeutic anticoagulation.[39]
Patients who are hospitalized with acute stroke and are found to have new onset AF require special consideration in regard to the timing of anticoagulation and rate‐control strategies. Although these patients are at risk for recurrent cardioembolism during their hospitalization, they are also at increased risk of hemorrhagic conversion of their cerebral infarct. Randomized studies comparing lowmolecular‐weight heparins versus antiplatelet agents for acute cardioembolic stroke indicate no net benefit of anticoagulation in thefirst 2 weeks after stroke.[40, 41] However, anticoagulation is probably safe within 14 days for patients with minor stroke because they are at less risk of hemorrhagic conversion.[27] Therefore, a reasonable approach is to start anticoagulation immediately after TIA, 5 to 7 days after a minor stroke, and 10 to 14 days after a major stroke. Furthermore, patients with acute ischemic stroke are particularly susceptible to infarct extension from even minor degrees of blood pressure reduction,[42] and therefore their AF must be managed with this hemodynamic consideration in mind.
SHORT‐TERM SEQUELAE
Increased hospital stay length, hospital cost, and morbidity have been well described to be increased in patients with postoperative AF following cardiac surgery[5] and noncardiac surgery.[43] In a recent study of patients with severe sepsis, those who developed new onset AF had a significantly increased risk of stroke and in‐hospital mortality.[7]
LONG‐TERM THERAPIES/MONITORING
Among patients with newly diagnosed AF during a hospitalization, those with multiple major risk factors for stroke (CHADS2 score >1 or CHA2DS2VASc score >2) should receive long‐term anticoagulation, unless monitoring is performed (Holter monitor, event monitor, implantable loop recorder) and shows an absence of AF. In patients with hypertension or coronary artery disease, prescription of a ‐blocker should be considered. Outpatient clinic follow‐up with a general cardiologist or electrophysiologist is important to help guide these decisions regarding rhythm monitoring, continuation of anticoagulation, and continuation of any antiarrhythmic drugs that were prescribed.
LONG‐TERM SEQUELAE
AF has recently been shown to have adverse long‐term consequences, even in a relatively healthy cohort of patients.[44] Postoperative AF has been associated with poor neurocognitive outcomes following CABG surgery.[45] Although data are lacking with regard to the prognostic significance of AF in the setting of hospitalization, it is reasonable to presume that it is a predictor for future episodes of AF. We know that 15% to 20% of all strokes occur in patients with AF,[2] and the group of patients with a new diagnosis of AF during hospital admission is almost certainly enriched for stroke risk. This underscores the importance of either starting long‐term anticoagulation upon discharge in patients at medium‐high risk of stroke, or ensuring timely communication of a new AF diagnosis to patients' outpatient physicians so that appropriate antithrombotic drugs can be started soon after discharge.
CONCLUSIONS
AF is a common problem among patients hospitalized for medical illness or in the postoperative state. Diagnosis of the dysrhythmia and identification of any reversible causes are the key first steps in management. Oftentimes, rate and rhythm control strategies are both reasonable courses of action, although it is important to include appropriate anticoagulation as part of both approaches. Cardiology consultation can be helpful in the decision‐making process.
In the vignette described at the beginning, we have a patient with a CHADS2 score of 2 (age, hypertension) and newly diagnosed paroxysmal AF during hospitalization. The dysrhythmia was likely triggered by his medical illness, but we have no way of knowing whether he has had asymptomatic paroxysms of AF in the past. Oral anticoagulation along with a ‐blocker should be prescribed at discharge. Clinic follow‐up with a cardiologist should be arranged prior to discharge, and consideration of withdrawing anticoagulation in the future should be guided by outpatient rhythm monitoring.
Disclosure
Nothing to report.
- , , , et al. Prevalence of diagnosed atrial fibrillation in adults: national implications for rhythm management and stroke prevention: the AnTicoagulation and Risk Factors in Atrial Fibrillation (ATRIA) Study. JAMA. 2001;285:2370–2375.
- , , , , . Prevalence, age distribution, and gender of patients with atrial fibrillation. Analysis and implications. Arch Intern Med. 1995;155:469–473.
- , , , et al. Inflammation as a risk factor for atrial fibrillation. Circulation. 2003;108:3006–3010.
- , , , et al. Prophylactic Oral Amiodarone for the Prevention of Arrhythmias that Begin Early After Revascularization, Valve Replacement, or Repair: PAPABEAR: a randomized controlled trial. JAMA. 2005;294:3093–3100.
- , , , et al. Atrial fibrillation following coronary artery bypass graft surgery: predictors, outcomes, and resource utilization. MultiCenter Study of Perioperative Ischemia Research Group. JAMA. 1996;276:300–306.
- , , , , . Incidence, predictors, and outcomes associated with postoperative atrial fibrillation after major noncardiac surgery. Am Heart J. 2012;164: 918–924.
- , , , , . Incident stroke and mortality associated with new‐onset atrial fibrillation in patients hospitalized with severe sepsis. JAMA. 2011;306:2248–2254.
- , , . Usefulness of cardiovascular investigations in stroke management: clinical relevance and economic implications. Stroke. 2007;38:1956–1958.
- , , , . Value of cardiac monitoring and echocardiography in TIA and stroke patients. Stroke. 1985;16:950–956.
- , , . Ambulatory electrocardiographic monitoring in patients with transient focal cerebral ischaemia. J Neurol Neurosurg Psychiatry. 1984;47:256–259.
- , , , et al. Continuous stroke unit electrocardiographic monitoring versus 24‐hour holter electrocardiography for detection of paroxysmal atrial fibrillation after stroke. Stroke. 2012;43:2689–2694.
- , , , , . Noninvasive cardiac monitoring for detecting paroxysmal atrial fibrillation or flutter after acute ischemic stroke: a systematic review. Stroke. 2007;38:2935–2940.
- , , , et al. ACC/AHA/ESC 2006 guidelines for the management of patients with atrial fibrillation: full text: a report of the American College of Cardiology/American Heart Association Task Force on practice guidelines and the European Society of Cardiology Committee for Practice Guidelines (Writing Committee to Revise the 2001 guidelines for the management of patients with atrial fibrillation) developed in collaboration with the European Heart Rhythm Association and the Heart Rhythm Society. Europace. 2006;8:651–745.
- , , , , , . Histological substrate of atrial biopsies in patients with lone atrial fibrillation. Circulation. 1997;96:1180–1184.
- , , . Role of inflammation in initiation and perpetuation of atrial fibrillation: a systematic review of the published data. J Am Coll Cardiol. 2007;50:2021–2028.
- , , , et al. Atrial fibrillation after coronary artery bypass grafting is associated with sympathetic activation. Ann Thorac Surg. 1995;60:1709–1715.
- , , , et al. Inflammation of atrium after cardiac surgery is associated with inhomogeneity of atrial conduction and atrial fibrillation. Circulation. 2005;111:2881–2888.
- , , , et al. Obstructive sleep apnea, obesity, and the risk of incident atrial fibrillation. J Am Coll Cardiol. 2007;49:565–571.
- , , , . Mechanisms, prevention, and treatment of atrial fibrillation after cardiac surgery. J Am Coll Cardiol. 2008;51:793–801.
- , , , . Incidence of arrhythmias after thoracic surgery: thoracotomy versus video‐assisted thoracoscopy. J Cardiothorac Vasc Anesth. 1998;12:659–661.
- , , , et al. Delayed detection of atrial fibrillation after ischemic stroke. J Stroke Cerebrovasc Dis. 2009;18:453–457.
- , , , et al. How useful is thyroid function testing in patients with recent‐onset atrial fibrillation? The Canadian Registry of Atrial Fibrillation Investigators. Arch Intern Med. 1996;156:2221–2224.
- , , , , , . Natriuretic peptide levels in atrial fibrillation: a prospective hormonal and Doppler‐echocardiographic study. J Am Coll Cardiol. 2000;35:1256–1262.
- , , . Relationship between brain natriuretic peptide and recurrence of atrial fibrillation after successful electrical cardioversion: a meta‐analysis. J Int Med Res. 2011;39:1618–1624.
- , , , et al. Amiodarone prophylaxis for atrial fibrillation of high‐risk patients after coronary bypass grafting: a prospective, double‐blinded, placebo‐controlled, randomized study. Eur Heart J. 2006;27:1584–1591.
- , , , , . Statin use and postoperative atrial fibrillation after major noncardiac surgery. Heart Rhythm. 2012;9:163–169.
- , , , et al. Guidelines for the prevention of stroke in patients with stroke or transient ischemic attack: a guideline for healthcare professionals from the American Heart Association/American Stroke Association. Stroke. 2011;42:227–276.
- , , , . Cardioversion of nonrheumatic atrial fibrillation. Reduced thromboembolic complications with 4 weeks of precardioversion anticoagulation are related to atrial thrombus resolution. Circulation. 1995;92:160–163.
- , , , . Left atrial appendage thrombus is not uncommon in patients with acute atrial fibrillation and a recent embolic event: a transesophageal echocardiographic study. J Am Coll Cardiol. 1995;25:452–459.
- , , , et al. Impact of electrical cardioversion for atrial fibrillation on left atrial appendage function and spontaneous echo contrast: characterization by simultaneous transesophageal echocardiography. J Am Coll Cardiol. 1993;22:1359–1366.
- , , , . Pulsed Doppler evaluation of atrial mechanical function after electrical cardioversion of atrial fibrillation. J Am Coll Cardiol. 1989;13:617–623.
- , , , et al. Detection and characterization of intracardiac thrombi on MR imaging. AJR Am J Roentgenol. 2002;179:1539–1544.
- , , , , , . Reversal of rivaroxaban and dabigatran by prothrombin complex concentrate: a randomized, placebo‐controlled, crossover study in healthy subjects. Circulation. 2011;124:1573–1579.
- , , , et al. Conversion of atrial fibrillation to sinus rhythm and rate control by digoxin in comparison to placebo. Eur Heart J. 1997;18:643–648.
- , , , et al. The evidence regarding the drugs used for ventricular rate control. J Fam Pract. 2000;49:47–59.
- , , , , , . Validation of clinical classification schemes for predicting stroke: results from the National Registry of Atrial Fibrillation. JAMA. 2001;285:2864–2870.
- Stroke prevention in atrial fibrillation study. Final results. Circulation. 1991;84:527–539.
- , , , , . Refining clinical risk stratification for predicting stroke and thromboembolism in atrial fibrillation using a novel risk factor‐based approach: the Euro Heart Survey on atrial fibrillation. Chest. 2010;137:263–272.
- , , , , , . A novel user‐friendly score (HAS‐BLED) to assess 1‐year risk of major bleeding in patients with atrial fibrillation: the Euro Heart Survey. Chest. 2010;138:1093–1100.
- , , , . Low molecular‐weight heparin versus aspirin in patients with acute ischaemic stroke and atrial fibrillation: a double‐blind randomised study. HAEST Study Group. Heparin in Acute Embolic Stroke Trial. Lancet. 2000;355:1205–1210.
- The International Stroke Trial (IST): a randomised trial of aspirin, subcutaneous heparin, both, or neither among 19435 patients with acute ischaemic stroke. International Stroke Trial Collaborative Group. Lancet. 1997;349:1569–1581.
- , , , et al. The angiotensin‐receptor blocker candesartan for treatment of acute stroke (SCAST): a randomised, placebo‐controlled, double‐blind trial. Lancet. 2011;377:741–750.
- , , , , . Supraventricular arrhythmia in patients having noncardiac surgery: clinical correlates and effect on length of stay. Ann Intern Med. 1998;129:279–285.
- , , , et al. Risk of death and cardiovascular events in initially healthy women with new‐onset atrial fibrillation. JAMA. 2011;305:2080–2087.
- , , , et al. The impact of postoperative atrial fibrillation on neurocognitive outcome after coronary artery bypass graft surgery. Anesth Analg. 2002;94:290–295, table of contents.
- , , , et al. Prevalence of diagnosed atrial fibrillation in adults: national implications for rhythm management and stroke prevention: the AnTicoagulation and Risk Factors in Atrial Fibrillation (ATRIA) Study. JAMA. 2001;285:2370–2375.
- , , , , . Prevalence, age distribution, and gender of patients with atrial fibrillation. Analysis and implications. Arch Intern Med. 1995;155:469–473.
- , , , et al. Inflammation as a risk factor for atrial fibrillation. Circulation. 2003;108:3006–3010.
- , , , et al. Prophylactic Oral Amiodarone for the Prevention of Arrhythmias that Begin Early After Revascularization, Valve Replacement, or Repair: PAPABEAR: a randomized controlled trial. JAMA. 2005;294:3093–3100.
- , , , et al. Atrial fibrillation following coronary artery bypass graft surgery: predictors, outcomes, and resource utilization. MultiCenter Study of Perioperative Ischemia Research Group. JAMA. 1996;276:300–306.
- , , , , . Incidence, predictors, and outcomes associated with postoperative atrial fibrillation after major noncardiac surgery. Am Heart J. 2012;164: 918–924.
- , , , , . Incident stroke and mortality associated with new‐onset atrial fibrillation in patients hospitalized with severe sepsis. JAMA. 2011;306:2248–2254.
- , , . Usefulness of cardiovascular investigations in stroke management: clinical relevance and economic implications. Stroke. 2007;38:1956–1958.
- , , , . Value of cardiac monitoring and echocardiography in TIA and stroke patients. Stroke. 1985;16:950–956.
- , , . Ambulatory electrocardiographic monitoring in patients with transient focal cerebral ischaemia. J Neurol Neurosurg Psychiatry. 1984;47:256–259.
- , , , et al. Continuous stroke unit electrocardiographic monitoring versus 24‐hour holter electrocardiography for detection of paroxysmal atrial fibrillation after stroke. Stroke. 2012;43:2689–2694.
- , , , , . Noninvasive cardiac monitoring for detecting paroxysmal atrial fibrillation or flutter after acute ischemic stroke: a systematic review. Stroke. 2007;38:2935–2940.
- , , , et al. ACC/AHA/ESC 2006 guidelines for the management of patients with atrial fibrillation: full text: a report of the American College of Cardiology/American Heart Association Task Force on practice guidelines and the European Society of Cardiology Committee for Practice Guidelines (Writing Committee to Revise the 2001 guidelines for the management of patients with atrial fibrillation) developed in collaboration with the European Heart Rhythm Association and the Heart Rhythm Society. Europace. 2006;8:651–745.
- , , , , , . Histological substrate of atrial biopsies in patients with lone atrial fibrillation. Circulation. 1997;96:1180–1184.
- , , . Role of inflammation in initiation and perpetuation of atrial fibrillation: a systematic review of the published data. J Am Coll Cardiol. 2007;50:2021–2028.
- , , , et al. Atrial fibrillation after coronary artery bypass grafting is associated with sympathetic activation. Ann Thorac Surg. 1995;60:1709–1715.
- , , , et al. Inflammation of atrium after cardiac surgery is associated with inhomogeneity of atrial conduction and atrial fibrillation. Circulation. 2005;111:2881–2888.
- , , , et al. Obstructive sleep apnea, obesity, and the risk of incident atrial fibrillation. J Am Coll Cardiol. 2007;49:565–571.
- , , , . Mechanisms, prevention, and treatment of atrial fibrillation after cardiac surgery. J Am Coll Cardiol. 2008;51:793–801.
- , , , . Incidence of arrhythmias after thoracic surgery: thoracotomy versus video‐assisted thoracoscopy. J Cardiothorac Vasc Anesth. 1998;12:659–661.
- , , , et al. Delayed detection of atrial fibrillation after ischemic stroke. J Stroke Cerebrovasc Dis. 2009;18:453–457.
- , , , et al. How useful is thyroid function testing in patients with recent‐onset atrial fibrillation? The Canadian Registry of Atrial Fibrillation Investigators. Arch Intern Med. 1996;156:2221–2224.
- , , , , , . Natriuretic peptide levels in atrial fibrillation: a prospective hormonal and Doppler‐echocardiographic study. J Am Coll Cardiol. 2000;35:1256–1262.
- , , . Relationship between brain natriuretic peptide and recurrence of atrial fibrillation after successful electrical cardioversion: a meta‐analysis. J Int Med Res. 2011;39:1618–1624.
- , , , et al. Amiodarone prophylaxis for atrial fibrillation of high‐risk patients after coronary bypass grafting: a prospective, double‐blinded, placebo‐controlled, randomized study. Eur Heart J. 2006;27:1584–1591.
- , , , , . Statin use and postoperative atrial fibrillation after major noncardiac surgery. Heart Rhythm. 2012;9:163–169.
- , , , et al. Guidelines for the prevention of stroke in patients with stroke or transient ischemic attack: a guideline for healthcare professionals from the American Heart Association/American Stroke Association. Stroke. 2011;42:227–276.
- , , , . Cardioversion of nonrheumatic atrial fibrillation. Reduced thromboembolic complications with 4 weeks of precardioversion anticoagulation are related to atrial thrombus resolution. Circulation. 1995;92:160–163.
- , , , . Left atrial appendage thrombus is not uncommon in patients with acute atrial fibrillation and a recent embolic event: a transesophageal echocardiographic study. J Am Coll Cardiol. 1995;25:452–459.
- , , , et al. Impact of electrical cardioversion for atrial fibrillation on left atrial appendage function and spontaneous echo contrast: characterization by simultaneous transesophageal echocardiography. J Am Coll Cardiol. 1993;22:1359–1366.
- , , , . Pulsed Doppler evaluation of atrial mechanical function after electrical cardioversion of atrial fibrillation. J Am Coll Cardiol. 1989;13:617–623.
- , , , et al. Detection and characterization of intracardiac thrombi on MR imaging. AJR Am J Roentgenol. 2002;179:1539–1544.
- , , , , , . Reversal of rivaroxaban and dabigatran by prothrombin complex concentrate: a randomized, placebo‐controlled, crossover study in healthy subjects. Circulation. 2011;124:1573–1579.
- , , , et al. Conversion of atrial fibrillation to sinus rhythm and rate control by digoxin in comparison to placebo. Eur Heart J. 1997;18:643–648.
- , , , et al. The evidence regarding the drugs used for ventricular rate control. J Fam Pract. 2000;49:47–59.
- , , , , , . Validation of clinical classification schemes for predicting stroke: results from the National Registry of Atrial Fibrillation. JAMA. 2001;285:2864–2870.
- Stroke prevention in atrial fibrillation study. Final results. Circulation. 1991;84:527–539.
- , , , , . Refining clinical risk stratification for predicting stroke and thromboembolism in atrial fibrillation using a novel risk factor‐based approach: the Euro Heart Survey on atrial fibrillation. Chest. 2010;137:263–272.
- , , , , , . A novel user‐friendly score (HAS‐BLED) to assess 1‐year risk of major bleeding in patients with atrial fibrillation: the Euro Heart Survey. Chest. 2010;138:1093–1100.
- , , , . Low molecular‐weight heparin versus aspirin in patients with acute ischaemic stroke and atrial fibrillation: a double‐blind randomised study. HAEST Study Group. Heparin in Acute Embolic Stroke Trial. Lancet. 2000;355:1205–1210.
- The International Stroke Trial (IST): a randomised trial of aspirin, subcutaneous heparin, both, or neither among 19435 patients with acute ischaemic stroke. International Stroke Trial Collaborative Group. Lancet. 1997;349:1569–1581.
- , , , et al. The angiotensin‐receptor blocker candesartan for treatment of acute stroke (SCAST): a randomised, placebo‐controlled, double‐blind trial. Lancet. 2011;377:741–750.
- , , , , . Supraventricular arrhythmia in patients having noncardiac surgery: clinical correlates and effect on length of stay. Ann Intern Med. 1998;129:279–285.
- , , , et al. Risk of death and cardiovascular events in initially healthy women with new‐onset atrial fibrillation. JAMA. 2011;305:2080–2087.
- , , , et al. The impact of postoperative atrial fibrillation on neurocognitive outcome after coronary artery bypass graft surgery. Anesth Analg. 2002;94:290–295, table of contents.
New strain of norovirus wreaks havoc
A new strain of norovirus, identified last March in Australia, has swept through the United States, causing more than half of the 2012 outbreaks.
GII.4 Sydney is implicated in 53% of the outbreaks that occurred from September to December, Leslie Barclay and her colleagues reported in the Jan. 24 issue of the Morbidity and Mortality Weekly Report (2013;62:55).

The other outbreaks were caused by 10 different GI and GII genotypes, including GII.4 New Orleans, said Ms. Barclay of the National Calicivirus Laboratory at the Centers for Disease Control and Prevention, and her coauthors. However, she noted, the GII.4 Sydney virus appears to have replaced the New Orleans strain as the predominant pathogen.
GII.4 Sydney was implicated in 19% of the September norovirus outbreaks; 46% of the October outbreaks; and 58% of outbreaks in both November and December, Ms. Barclay and her coinvestigators said.
The report noted that 51% of the outbreaks were direct, person-to-person transmission; 20% were foodborne; and 1% waterborne. For the other outbreaks, the mode of transmission remains unknown.
The sudden appearance of a new norovirus strain isn’t unusual or unexpected, Dr. Aron J. Hall said in an interview.
"This group of viruses is constantly evolving. New strains develop all the time," said Dr. Hall, an epidemiologist with CDC’s Division of Viral Diseases. "This is following the same pattern we’ve seen for the past 10 years, with a new strain evolving every 2-3 years."
Since the norovirus season doesn’t normally peak until January, it’s too soon to say whether GII.4 Sydney is more virulent, either in the number or severity of cases it causes.
"Every time a new strain emerges, there’s a potential for increased disease activity, numbers of outbreaks, and severity. But sometimes they simply replace the predominant strain with no increases. We have to wait until we’ve tallied all the numbers before we can get an assessment of this season’s magnitude and impact," he said.
GII.4 Sydney was first identified in Australia, and rapidly moved to Japan, the Netherlands, and the United Kingdom, according to a Jan. 4 report (Eurosurv. 2013;18:1)
In early December and late November, the ProMed disease reporting system reported a 64% increase in confirmed norovirus lab reports in England and Wales, and increased deaths in elderly Japanese patients. Molecular assays pinpointed the cause as the new variant of norovirus, the Eurosurveillance researchers noted.
The virus is highly transmissible; exposure to as few as 18 viral particles can cause illness, according to a presentation by Jan Vinjé, Ph.D., head of the National Calicivirus Laboratory. And since about 30% of cases are asymptomatic, the transmission rate can be extremely high.
"These are the two characteristics that explain why norovirus is such a serious public health challenge," Dr. Hall said. "It takes a very tiny amount of exposure to make someone sick, and someone who is sick is shedding billions of viral particles. They can shed virus without any symptoms, so they don’t know they have it and there’s no way to advise them about how to avoid spreading it."
The illness is characterized by vomiting and/or diarrhea with abdominal cramps and low-grade fever. Most patients recover within 12-72 hours, but about 10% need hospitalization and fluid therapy. Severe illness and/or death are most common among the elderly and people with chronic illnesses.
The United States sees about 21 million cases annually; 800 will result in death. A norovirus outbreak can overwhelm local medical resources; the virus causes nearly 2 million outpatient visits and 400,000 emergency department visits each year. The combined annual cost reaches $2 billion, according to the CDC.
As federal employees, Dr. Hall and Ms. Barclay have no financial disclosures.
GII.4 Sydney, Leslie Barclay, Morbidity and Mortality Weekly Report, GII.4 New Orleans, National Calicivirus Laboratory at the Centers for Disease Control and Prevention, Dr. Aron J. Hall, CDC’s Division of Viral Diseases,
A new strain of norovirus, identified last March in Australia, has swept through the United States, causing more than half of the 2012 outbreaks.
GII.4 Sydney is implicated in 53% of the outbreaks that occurred from September to December, Leslie Barclay and her colleagues reported in the Jan. 24 issue of the Morbidity and Mortality Weekly Report (2013;62:55).
The other outbreaks were caused by 10 different GI and GII genotypes, including GII.4 New Orleans, said Ms. Barclay of the National Calicivirus Laboratory at the Centers for Disease Control and Prevention, and her coauthors. However, she noted, the GII.4 Sydney virus appears to have replaced the New Orleans strain as the predominant pathogen.
GII.4 Sydney was implicated in 19% of the September norovirus outbreaks; 46% of the October outbreaks; and 58% of outbreaks in both November and December, Ms. Barclay and her coinvestigators said.
The report noted that 51% of the outbreaks were direct, person-to-person transmission; 20% were foodborne; and 1% waterborne. For the other outbreaks, the mode of transmission remains unknown.
The sudden appearance of a new norovirus strain isn’t unusual or unexpected, Dr. Aron J. Hall said in an interview.
"This group of viruses is constantly evolving. New strains develop all the time," said Dr. Hall, an epidemiologist with CDC’s Division of Viral Diseases. "This is following the same pattern we’ve seen for the past 10 years, with a new strain evolving every 2-3 years."
Since the norovirus season doesn’t normally peak until January, it’s too soon to say whether GII.4 Sydney is more virulent, either in the number or severity of cases it causes.
"Every time a new strain emerges, there’s a potential for increased disease activity, numbers of outbreaks, and severity. But sometimes they simply replace the predominant strain with no increases. We have to wait until we’ve tallied all the numbers before we can get an assessment of this season’s magnitude and impact," he said.
GII.4 Sydney was first identified in Australia, and rapidly moved to Japan, the Netherlands, and the United Kingdom, according to a Jan. 4 report (Eurosurv. 2013;18:1)
In early December and late November, the ProMed disease reporting system reported a 64% increase in confirmed norovirus lab reports in England and Wales, and increased deaths in elderly Japanese patients. Molecular assays pinpointed the cause as the new variant of norovirus, the Eurosurveillance researchers noted.
The virus is highly transmissible; exposure to as few as 18 viral particles can cause illness, according to a presentation by Jan Vinjé, Ph.D., head of the National Calicivirus Laboratory. And since about 30% of cases are asymptomatic, the transmission rate can be extremely high.
"These are the two characteristics that explain why norovirus is such a serious public health challenge," Dr. Hall said. "It takes a very tiny amount of exposure to make someone sick, and someone who is sick is shedding billions of viral particles. They can shed virus without any symptoms, so they don’t know they have it and there’s no way to advise them about how to avoid spreading it."
The illness is characterized by vomiting and/or diarrhea with abdominal cramps and low-grade fever. Most patients recover within 12-72 hours, but about 10% need hospitalization and fluid therapy. Severe illness and/or death are most common among the elderly and people with chronic illnesses.
The United States sees about 21 million cases annually; 800 will result in death. A norovirus outbreak can overwhelm local medical resources; the virus causes nearly 2 million outpatient visits and 400,000 emergency department visits each year. The combined annual cost reaches $2 billion, according to the CDC.
As federal employees, Dr. Hall and Ms. Barclay have no financial disclosures.
A new strain of norovirus, identified last March in Australia, has swept through the United States, causing more than half of the 2012 outbreaks.
GII.4 Sydney is implicated in 53% of the outbreaks that occurred from September to December, Leslie Barclay and her colleagues reported in the Jan. 24 issue of the Morbidity and Mortality Weekly Report (2013;62:55).
The other outbreaks were caused by 10 different GI and GII genotypes, including GII.4 New Orleans, said Ms. Barclay of the National Calicivirus Laboratory at the Centers for Disease Control and Prevention, and her coauthors. However, she noted, the GII.4 Sydney virus appears to have replaced the New Orleans strain as the predominant pathogen.
GII.4 Sydney was implicated in 19% of the September norovirus outbreaks; 46% of the October outbreaks; and 58% of outbreaks in both November and December, Ms. Barclay and her coinvestigators said.
The report noted that 51% of the outbreaks were direct, person-to-person transmission; 20% were foodborne; and 1% waterborne. For the other outbreaks, the mode of transmission remains unknown.
The sudden appearance of a new norovirus strain isn’t unusual or unexpected, Dr. Aron J. Hall said in an interview.
"This group of viruses is constantly evolving. New strains develop all the time," said Dr. Hall, an epidemiologist with CDC’s Division of Viral Diseases. "This is following the same pattern we’ve seen for the past 10 years, with a new strain evolving every 2-3 years."
Since the norovirus season doesn’t normally peak until January, it’s too soon to say whether GII.4 Sydney is more virulent, either in the number or severity of cases it causes.
"Every time a new strain emerges, there’s a potential for increased disease activity, numbers of outbreaks, and severity. But sometimes they simply replace the predominant strain with no increases. We have to wait until we’ve tallied all the numbers before we can get an assessment of this season’s magnitude and impact," he said.
GII.4 Sydney was first identified in Australia, and rapidly moved to Japan, the Netherlands, and the United Kingdom, according to a Jan. 4 report (Eurosurv. 2013;18:1)
In early December and late November, the ProMed disease reporting system reported a 64% increase in confirmed norovirus lab reports in England and Wales, and increased deaths in elderly Japanese patients. Molecular assays pinpointed the cause as the new variant of norovirus, the Eurosurveillance researchers noted.
The virus is highly transmissible; exposure to as few as 18 viral particles can cause illness, according to a presentation by Jan Vinjé, Ph.D., head of the National Calicivirus Laboratory. And since about 30% of cases are asymptomatic, the transmission rate can be extremely high.
"These are the two characteristics that explain why norovirus is such a serious public health challenge," Dr. Hall said. "It takes a very tiny amount of exposure to make someone sick, and someone who is sick is shedding billions of viral particles. They can shed virus without any symptoms, so they don’t know they have it and there’s no way to advise them about how to avoid spreading it."
The illness is characterized by vomiting and/or diarrhea with abdominal cramps and low-grade fever. Most patients recover within 12-72 hours, but about 10% need hospitalization and fluid therapy. Severe illness and/or death are most common among the elderly and people with chronic illnesses.
The United States sees about 21 million cases annually; 800 will result in death. A norovirus outbreak can overwhelm local medical resources; the virus causes nearly 2 million outpatient visits and 400,000 emergency department visits each year. The combined annual cost reaches $2 billion, according to the CDC.
As federal employees, Dr. Hall and Ms. Barclay have no financial disclosures.
GII.4 Sydney, Leslie Barclay, Morbidity and Mortality Weekly Report, GII.4 New Orleans, National Calicivirus Laboratory at the Centers for Disease Control and Prevention, Dr. Aron J. Hall, CDC’s Division of Viral Diseases,
GII.4 Sydney, Leslie Barclay, Morbidity and Mortality Weekly Report, GII.4 New Orleans, National Calicivirus Laboratory at the Centers for Disease Control and Prevention, Dr. Aron J. Hall, CDC’s Division of Viral Diseases,
FROM THE MORBIDITY AND MORTALITY WEEKLY REPORT
Major Finding: A new strain of norovirus caused 53% of outbreaks in the United States from September-December 2012.
Data Source: These statistics were obtained from the Centers for Disease Control and Prevention’s National Calicivirus Laboratory
Disclosures: As federal employees, Dr. Hall and Ms. Barclay have no financial disclosures.

Resecting residual gastrointestinal stromal tumors improved survival
SAN FRANCISCO – Surgically removing residual gastrointestinal stromal tumors in patients who respond to imatinib therapy significantly increased time to tumor progression to 88 months, compared with 43 months using imatinib alone, based on findings from a retrospective study of 134 patients.
After controlling for the effects of other risk factors, the surgery decreased threefold the likelihood of disease progression and decreased fivefold the risk of death, Dr. Seong Joon Park reported in a press briefing sponsored by the American Society of Clinical Oncology (ASCO). The press conference was held in advance of at a meeting on gastrointestinal cancers sponsored by ASCO and three other cancer organizations.
The findings support the widely adopted practice of removing residual tumors in these patients, despite the retrospective and observational design of the study, Dr. Park said. A prospective European study of similar design to this one terminated early due to poor patient enrollment. "It’s really hard to conduct a prospective study of this design," said Dr. Park of Asan Medical Center, Seoul, South Korea.
He and his associates reviewed the records of patients who showed at least 6 months of disease stabilization or response to imatinib (Gleevec) treatment, 92 of whom got the drug treatment alone and 42 of whom underwent surgery to remove residual tumors after a median of 19 months of imatinib therapy. The imatinib therapy was restarted after surgery. Median follow-up for the cohort as a whole was 59 months.
"This treatment strategy is worth trying as a clinical practice if the medical center is large enough to have an experienced multidisciplinary team and to have low morbidity and mortality associated with surgery," he said.
Each year, approximately 5,000 new cases of gastrointestinal stromal tumors are diagnosed in the United States, most often in the stomach and small intestine, though they can occur anywhere in or near the GI tract. Imatinib typically is first-line therapy, and 80%-85% of patients will respond to the treatment, he said. A majority of patients who respond to imatinib will have residual tumors, however, which are believed to contribute to the development of drug resistance, leading to the hypothesis that removing the residual tumors would improve survival.
In general, one-third of patients are candidates for surgical removal of residual lesions, depending on the tumor size and other tumor and patient characteristics, Dr. Park said.
The two patient groups in the study were similar except that the surgery group was significantly younger (51 vs. 58 years) and was less likely to have metastases in the peritoneum (41% in the surgery group vs. 61% in the control group).
As it is an aggressive and difficult treatment, surgery is more likely to be considered and recommended to younger patients who have a good performance status and, thus, less likely to be recommended in patients with multiple peritoneal metastases.
Factors associated with longer progression-free and overall survival included surgery and having an initial tumor size less than 150 mm, multivariate analyses showed. Female sex and having the KIT exon 11 mutation also were associated with longer progression-free survival. The researchers used propensity scores and inverse-probability-weighting adjustments to account for the effects of factors other than surgery.
The gastrointestinal cancers meeting, where Dr. Park will present the results, is cosponsored by ASCO, the American Gastroenterological Association Institute, the American Society for Radiation Oncology, and the Society of Surgical Oncology.
Dr. Park reported having no financial disclosures.
On Twitter @sherryboschert
GI stromal tumors are an uncommon type of gastrointestinal tumor that can arise at many different places within the GI tract. This disease is notable because it’s really been a triumph of molecularly targeted therapy with imatinib (Gleevec), a drug that targets a particular molecular abnormality present in GI stromal tumors. Because of this, there is an extremely high response rate in patients with GI stromal tumors and drug therapy can control the disease for years.
Unfortunately, resistance ultimately develops to imatinib. This study provides provocative evidence that taking an aggressive approach surgically in addition to medical treatment with imatinib may result in longer survival of patients with GI stromal tumors.
Dr. Neal J. Meropol is chief of hematology and oncology at Case Western Reserve University, Cleveland. He gave these comments as moderator of the press briefing. He has been a consultant or advisor to Precision Therapeutics.
GI stromal tumors are an uncommon type of gastrointestinal tumor that can arise at many different places within the GI tract. This disease is notable because it’s really been a triumph of molecularly targeted therapy with imatinib (Gleevec), a drug that targets a particular molecular abnormality present in GI stromal tumors. Because of this, there is an extremely high response rate in patients with GI stromal tumors and drug therapy can control the disease for years.
Unfortunately, resistance ultimately develops to imatinib. This study provides provocative evidence that taking an aggressive approach surgically in addition to medical treatment with imatinib may result in longer survival of patients with GI stromal tumors.
Dr. Neal J. Meropol is chief of hematology and oncology at Case Western Reserve University, Cleveland. He gave these comments as moderator of the press briefing. He has been a consultant or advisor to Precision Therapeutics.
GI stromal tumors are an uncommon type of gastrointestinal tumor that can arise at many different places within the GI tract. This disease is notable because it’s really been a triumph of molecularly targeted therapy with imatinib (Gleevec), a drug that targets a particular molecular abnormality present in GI stromal tumors. Because of this, there is an extremely high response rate in patients with GI stromal tumors and drug therapy can control the disease for years.
Unfortunately, resistance ultimately develops to imatinib. This study provides provocative evidence that taking an aggressive approach surgically in addition to medical treatment with imatinib may result in longer survival of patients with GI stromal tumors.
Dr. Neal J. Meropol is chief of hematology and oncology at Case Western Reserve University, Cleveland. He gave these comments as moderator of the press briefing. He has been a consultant or advisor to Precision Therapeutics.
SAN FRANCISCO – Surgically removing residual gastrointestinal stromal tumors in patients who respond to imatinib therapy significantly increased time to tumor progression to 88 months, compared with 43 months using imatinib alone, based on findings from a retrospective study of 134 patients.
After controlling for the effects of other risk factors, the surgery decreased threefold the likelihood of disease progression and decreased fivefold the risk of death, Dr. Seong Joon Park reported in a press briefing sponsored by the American Society of Clinical Oncology (ASCO). The press conference was held in advance of at a meeting on gastrointestinal cancers sponsored by ASCO and three other cancer organizations.
The findings support the widely adopted practice of removing residual tumors in these patients, despite the retrospective and observational design of the study, Dr. Park said. A prospective European study of similar design to this one terminated early due to poor patient enrollment. "It’s really hard to conduct a prospective study of this design," said Dr. Park of Asan Medical Center, Seoul, South Korea.
He and his associates reviewed the records of patients who showed at least 6 months of disease stabilization or response to imatinib (Gleevec) treatment, 92 of whom got the drug treatment alone and 42 of whom underwent surgery to remove residual tumors after a median of 19 months of imatinib therapy. The imatinib therapy was restarted after surgery. Median follow-up for the cohort as a whole was 59 months.
"This treatment strategy is worth trying as a clinical practice if the medical center is large enough to have an experienced multidisciplinary team and to have low morbidity and mortality associated with surgery," he said.
Each year, approximately 5,000 new cases of gastrointestinal stromal tumors are diagnosed in the United States, most often in the stomach and small intestine, though they can occur anywhere in or near the GI tract. Imatinib typically is first-line therapy, and 80%-85% of patients will respond to the treatment, he said. A majority of patients who respond to imatinib will have residual tumors, however, which are believed to contribute to the development of drug resistance, leading to the hypothesis that removing the residual tumors would improve survival.
In general, one-third of patients are candidates for surgical removal of residual lesions, depending on the tumor size and other tumor and patient characteristics, Dr. Park said.
The two patient groups in the study were similar except that the surgery group was significantly younger (51 vs. 58 years) and was less likely to have metastases in the peritoneum (41% in the surgery group vs. 61% in the control group).
As it is an aggressive and difficult treatment, surgery is more likely to be considered and recommended to younger patients who have a good performance status and, thus, less likely to be recommended in patients with multiple peritoneal metastases.
Factors associated with longer progression-free and overall survival included surgery and having an initial tumor size less than 150 mm, multivariate analyses showed. Female sex and having the KIT exon 11 mutation also were associated with longer progression-free survival. The researchers used propensity scores and inverse-probability-weighting adjustments to account for the effects of factors other than surgery.
The gastrointestinal cancers meeting, where Dr. Park will present the results, is cosponsored by ASCO, the American Gastroenterological Association Institute, the American Society for Radiation Oncology, and the Society of Surgical Oncology.
Dr. Park reported having no financial disclosures.
On Twitter @sherryboschert
SAN FRANCISCO – Surgically removing residual gastrointestinal stromal tumors in patients who respond to imatinib therapy significantly increased time to tumor progression to 88 months, compared with 43 months using imatinib alone, based on findings from a retrospective study of 134 patients.
After controlling for the effects of other risk factors, the surgery decreased threefold the likelihood of disease progression and decreased fivefold the risk of death, Dr. Seong Joon Park reported in a press briefing sponsored by the American Society of Clinical Oncology (ASCO). The press conference was held in advance of at a meeting on gastrointestinal cancers sponsored by ASCO and three other cancer organizations.
The findings support the widely adopted practice of removing residual tumors in these patients, despite the retrospective and observational design of the study, Dr. Park said. A prospective European study of similar design to this one terminated early due to poor patient enrollment. "It’s really hard to conduct a prospective study of this design," said Dr. Park of Asan Medical Center, Seoul, South Korea.
He and his associates reviewed the records of patients who showed at least 6 months of disease stabilization or response to imatinib (Gleevec) treatment, 92 of whom got the drug treatment alone and 42 of whom underwent surgery to remove residual tumors after a median of 19 months of imatinib therapy. The imatinib therapy was restarted after surgery. Median follow-up for the cohort as a whole was 59 months.
"This treatment strategy is worth trying as a clinical practice if the medical center is large enough to have an experienced multidisciplinary team and to have low morbidity and mortality associated with surgery," he said.
Each year, approximately 5,000 new cases of gastrointestinal stromal tumors are diagnosed in the United States, most often in the stomach and small intestine, though they can occur anywhere in or near the GI tract. Imatinib typically is first-line therapy, and 80%-85% of patients will respond to the treatment, he said. A majority of patients who respond to imatinib will have residual tumors, however, which are believed to contribute to the development of drug resistance, leading to the hypothesis that removing the residual tumors would improve survival.
In general, one-third of patients are candidates for surgical removal of residual lesions, depending on the tumor size and other tumor and patient characteristics, Dr. Park said.
The two patient groups in the study were similar except that the surgery group was significantly younger (51 vs. 58 years) and was less likely to have metastases in the peritoneum (41% in the surgery group vs. 61% in the control group).
As it is an aggressive and difficult treatment, surgery is more likely to be considered and recommended to younger patients who have a good performance status and, thus, less likely to be recommended in patients with multiple peritoneal metastases.
Factors associated with longer progression-free and overall survival included surgery and having an initial tumor size less than 150 mm, multivariate analyses showed. Female sex and having the KIT exon 11 mutation also were associated with longer progression-free survival. The researchers used propensity scores and inverse-probability-weighting adjustments to account for the effects of factors other than surgery.
The gastrointestinal cancers meeting, where Dr. Park will present the results, is cosponsored by ASCO, the American Gastroenterological Association Institute, the American Society for Radiation Oncology, and the Society of Surgical Oncology.
Dr. Park reported having no financial disclosures.
On Twitter @sherryboschert
FROM A PRESS BRIEFING SPONSORED BY THE AMERICAN SOCIETY OF CLINICAL ONCOLOGY
Major Finding: Time to tumor progression was 88 months in 42 patients who had surgery for residual disease and 42 months in 92 patients given imatinib alone. Metastases in the peritoneum were present in 41% of the imatinib-and-surgery group and 61% of the imatinib-only group.
Data Source: Retrospective study of 134 patients with metastatic or recurrent gastrointestinal tumors who showed at least 6 months of disease stabilization or response to imatinib, 42 of whom had residual tumors resected.
Disclosures: Dr. Park reported having no financial disclosures.
Helping patients cope with traumatic loss
When tragedies like the Aurora, Colo., and Newtown, Conn., shootings occur, we wonder whether people can ever overcome their grief and find a way to move on with their lives. Froma Walsh, Ph.D., a leading authority on family resilience, has developed an approach that can be used to strengthen families and communities that have suffered such tragedies.
Dr. Walsh is the codirector and cofounder of the Chicago Center for Family Health, and the Mose and Sylvia Firestone Professor Emerita in the school of social service administration and department of psychiatry at the University of Chicago.

Resilience originally was described as individual resilience. Dr. Walsh, who has broadened that concept, provides us with important steps to understand how to help heal families and communities that suffer from unimaginable trauma and loss.
Individual resilience
Beginning in the 1960s, British psychiatrist Sir Michael Rutter studied youth from inner-city London and on the Isle of Wight. Even though they experienced many risk factors, 25% of the children had a good outcome. The children who showed individual resilience had the following characteristics: an easy temperament; female; a positive school climate; self-mastery; self-efficacy; planning skills; and a warm, close, personal relationship with an adult.
From 1955 to 1985, American researchers Emmy E. Werner, Ph.D., and Ruth S. Smith, Ph.D., studied a high-risk population of children in Hawaii and found that 36% showed individual resilience, despite their risk factors. Resilient personal characteristics found in this study were similar: being female, socially responsible, adaptable, tolerant, achievement oriented, a good communicator, and having good self-esteem as well as a caring environment inside and outside the family.
Acquiring resilient qualities
After traumatic events happen, how do people cope? How does the coping process result in growth? We are all familiar with the saying: "What doesn’t break you makes you stronger." This is resilience. How can we help families and communities become stronger?
Family resilience
Dr. Walsh developed the concept of family resilience and a practice framework, identifying key family processes that clinicians can target to strengthen family resilience. She is quick to point out that resilience does not lie in specific characteristics, but rather in family processes that promote resilience. These family processes include a family belief system that pulls family members together and forward, the ability to have hope, a spiritual or value orientation to draw meaning and new purpose out of a tragedy, being able to organize family life to meet challenges, reaching out to extended kin and community networks, collaborative problem solving, and clear communication between members.
Her article, "Traumatic loss and major disasters: strengthening family and community resilience," identifies ways that professionals can help families cope with traumatic loss (Fam. Process 2007;46:207-27). She identifies nine aspects of family life as being key factors in families being able to cope well with traumatic loss:.
• Making meaning of traumatic loss experience. Families ask "Why us?" Families need to make sense of their experiences in a way that allows them to live on. "New meaning" highlights the strengths of the survivors and shows a "new way" of relating to the world and to others. As psychiatrists, we can support the family in finding their own meaning, by helping them examine their beliefs about blame, responsibility, or negligence; and helping them come to terms with accountability and limits of control in the situation.
• Hope. Families need to regain hope in their future possibilities. How does this family want to continue and what does this family want to become? Although they cannot change what has happened, we can support their efforts to "master the possible" by promoting active agency in doing all they can as they move forward.
• Transcendence and spirituality. Families can use their personal values and faith communities for support and to help with forgiveness. Honoring those who died with memorials, anniversary remembrances, and celebrations of milestones in recovery will facilitate healing and growth. These rituals help affirm social values of goodness and compassion. "Recovery is a journey of the heart and spirit, bringing survivors back to the fullness of life," Dr. Walsh wrote in her article.
• Flexibility and stability. Flexibility allows adaptation in the family and allows it to stabilize. Families need to buffer the upheaval and restore security, reliability, and continuity in daily routines. They might need to construct a "new normal" in their lives.
• Connectedness. Each family member has her own adaptation to loss, but family members need to remain mutually supportive. If relationships have prior unresolved conflicts, distress can be worse. Family therapy can prove helpful.
• Extended kin and social resources. Reach out to friends, neighbors, health care providers, clergy and congregational support, school teachers and counselors, employers and coworkers, and neighborhood or community organizations. Multifamily community support groups can help families exchange information, share painful memories and feelings, provide mutual support, and encourage hope and efforts for recovery.
• Clear, consistent information. Families often need help to clarify facts and circumstances of traumatic events and to help their children understand, as age appropriate.
• Emotional sharing and support. Families and the community will experience a wide range of feelings. It is important to allow painful or unacceptable feelings to be expressed and supported, even when differences are viewed as threatening, to avoid the risk of future somatic and emotional disturbance, destructive behavior, or substance abuse. Journals and artwork are helpful, especially with children.
• Collaborative problem solving. Family and communities can coordinate collaborative efforts to promote recovery and resilience. Learning from their experience, they can take steps proactively to prevent future tragedies. One mother who lost a child in the Newtown massacre said she wanted her family and her community to be defined not by their tragedy and suffering, but by the way they are responding, by galvanizing action to stop gun violence.
Community resilience
Community resilience is promoted by Dr. Judith Landau and Jack Saul, Ph.D. in a book edited by Dr. Walsh and Monica McGoldrick, Ph.D., called "Living Beyond Loss: Death in the Family" (see list of further reading below). Community members can create a support system that connects individuals and families. Community support provides a highly connected and reality based understanding. Ongoing support groups can respond accurately to the community needs. Perhaps the community might create a neighborhood resource center or a public space to gather, a witness project, or a community website. Such interventions can have a long-lasting positive impact on the community and the families.
Professional resilience
Compassion fatigue can occur when witnessing trauma and in experiencing ongoing distress. Mental health professionals cannot heal all wounds, but we can create a safe haven for family and community members to share pain and their seeking a new path.
Kaethe Weingarten, Ph.D., has developed a compassionate witnessing project aimed at helping professionals understand the importance of "witnessing" suffering and struggle. She encourages professionals to become aware of their own responses to witnessing trauma and to develop tools to cope with the effects of witnessing trauma.
A family resilience approach is a very positive and constructive way that we can use to teach families how to make sense of what has happened and how to move forward, as difficult as that may currently seem to be.
Further reading:
Here is a list of additional reading you can do to help patients who are facing unimaginable loss:
• "Common Shock: Witnessing Violence Every Day," (New York: Dutton, 2003)
• "Family Resilience: A Framework for Clinical Practice," (Family Process 2003;42:1-18)
• "Living Beyond Loss: Death in the Family," (New York: Norton, 2004, 2nd ed.).
• "Resilience Concepts and Findings: Implications for Family Therapy," (J. Family Therapy 1999;21:119-44).
• "Strengthening Family Resilience," (New York: Guilford Press, 2006)
Dr. Heru is with the department of psychiatry at the University of Colorado at Denver, Aurora. E-mail Dr. Heru at cpnews@elsevier.com.
When tragedies like the Aurora, Colo., and Newtown, Conn., shootings occur, we wonder whether people can ever overcome their grief and find a way to move on with their lives. Froma Walsh, Ph.D., a leading authority on family resilience, has developed an approach that can be used to strengthen families and communities that have suffered such tragedies.
Dr. Walsh is the codirector and cofounder of the Chicago Center for Family Health, and the Mose and Sylvia Firestone Professor Emerita in the school of social service administration and department of psychiatry at the University of Chicago.
Resilience originally was described as individual resilience. Dr. Walsh, who has broadened that concept, provides us with important steps to understand how to help heal families and communities that suffer from unimaginable trauma and loss.
Individual resilience
Beginning in the 1960s, British psychiatrist Sir Michael Rutter studied youth from inner-city London and on the Isle of Wight. Even though they experienced many risk factors, 25% of the children had a good outcome. The children who showed individual resilience had the following characteristics: an easy temperament; female; a positive school climate; self-mastery; self-efficacy; planning skills; and a warm, close, personal relationship with an adult.
From 1955 to 1985, American researchers Emmy E. Werner, Ph.D., and Ruth S. Smith, Ph.D., studied a high-risk population of children in Hawaii and found that 36% showed individual resilience, despite their risk factors. Resilient personal characteristics found in this study were similar: being female, socially responsible, adaptable, tolerant, achievement oriented, a good communicator, and having good self-esteem as well as a caring environment inside and outside the family.
Acquiring resilient qualities
After traumatic events happen, how do people cope? How does the coping process result in growth? We are all familiar with the saying: "What doesn’t break you makes you stronger." This is resilience. How can we help families and communities become stronger?
Family resilience
Dr. Walsh developed the concept of family resilience and a practice framework, identifying key family processes that clinicians can target to strengthen family resilience. She is quick to point out that resilience does not lie in specific characteristics, but rather in family processes that promote resilience. These family processes include a family belief system that pulls family members together and forward, the ability to have hope, a spiritual or value orientation to draw meaning and new purpose out of a tragedy, being able to organize family life to meet challenges, reaching out to extended kin and community networks, collaborative problem solving, and clear communication between members.
Her article, "Traumatic loss and major disasters: strengthening family and community resilience," identifies ways that professionals can help families cope with traumatic loss (Fam. Process 2007;46:207-27). She identifies nine aspects of family life as being key factors in families being able to cope well with traumatic loss:.
• Making meaning of traumatic loss experience. Families ask "Why us?" Families need to make sense of their experiences in a way that allows them to live on. "New meaning" highlights the strengths of the survivors and shows a "new way" of relating to the world and to others. As psychiatrists, we can support the family in finding their own meaning, by helping them examine their beliefs about blame, responsibility, or negligence; and helping them come to terms with accountability and limits of control in the situation.
• Hope. Families need to regain hope in their future possibilities. How does this family want to continue and what does this family want to become? Although they cannot change what has happened, we can support their efforts to "master the possible" by promoting active agency in doing all they can as they move forward.
• Transcendence and spirituality. Families can use their personal values and faith communities for support and to help with forgiveness. Honoring those who died with memorials, anniversary remembrances, and celebrations of milestones in recovery will facilitate healing and growth. These rituals help affirm social values of goodness and compassion. "Recovery is a journey of the heart and spirit, bringing survivors back to the fullness of life," Dr. Walsh wrote in her article.
• Flexibility and stability. Flexibility allows adaptation in the family and allows it to stabilize. Families need to buffer the upheaval and restore security, reliability, and continuity in daily routines. They might need to construct a "new normal" in their lives.
• Connectedness. Each family member has her own adaptation to loss, but family members need to remain mutually supportive. If relationships have prior unresolved conflicts, distress can be worse. Family therapy can prove helpful.
• Extended kin and social resources. Reach out to friends, neighbors, health care providers, clergy and congregational support, school teachers and counselors, employers and coworkers, and neighborhood or community organizations. Multifamily community support groups can help families exchange information, share painful memories and feelings, provide mutual support, and encourage hope and efforts for recovery.
• Clear, consistent information. Families often need help to clarify facts and circumstances of traumatic events and to help their children understand, as age appropriate.
• Emotional sharing and support. Families and the community will experience a wide range of feelings. It is important to allow painful or unacceptable feelings to be expressed and supported, even when differences are viewed as threatening, to avoid the risk of future somatic and emotional disturbance, destructive behavior, or substance abuse. Journals and artwork are helpful, especially with children.
• Collaborative problem solving. Family and communities can coordinate collaborative efforts to promote recovery and resilience. Learning from their experience, they can take steps proactively to prevent future tragedies. One mother who lost a child in the Newtown massacre said she wanted her family and her community to be defined not by their tragedy and suffering, but by the way they are responding, by galvanizing action to stop gun violence.
Community resilience
Community resilience is promoted by Dr. Judith Landau and Jack Saul, Ph.D. in a book edited by Dr. Walsh and Monica McGoldrick, Ph.D., called "Living Beyond Loss: Death in the Family" (see list of further reading below). Community members can create a support system that connects individuals and families. Community support provides a highly connected and reality based understanding. Ongoing support groups can respond accurately to the community needs. Perhaps the community might create a neighborhood resource center or a public space to gather, a witness project, or a community website. Such interventions can have a long-lasting positive impact on the community and the families.
Professional resilience
Compassion fatigue can occur when witnessing trauma and in experiencing ongoing distress. Mental health professionals cannot heal all wounds, but we can create a safe haven for family and community members to share pain and their seeking a new path.
Kaethe Weingarten, Ph.D., has developed a compassionate witnessing project aimed at helping professionals understand the importance of "witnessing" suffering and struggle. She encourages professionals to become aware of their own responses to witnessing trauma and to develop tools to cope with the effects of witnessing trauma.
A family resilience approach is a very positive and constructive way that we can use to teach families how to make sense of what has happened and how to move forward, as difficult as that may currently seem to be.
Further reading:
Here is a list of additional reading you can do to help patients who are facing unimaginable loss:
• "Common Shock: Witnessing Violence Every Day," (New York: Dutton, 2003)
• "Family Resilience: A Framework for Clinical Practice," (Family Process 2003;42:1-18)
• "Living Beyond Loss: Death in the Family," (New York: Norton, 2004, 2nd ed.).
• "Resilience Concepts and Findings: Implications for Family Therapy," (J. Family Therapy 1999;21:119-44).
• "Strengthening Family Resilience," (New York: Guilford Press, 2006)
Dr. Heru is with the department of psychiatry at the University of Colorado at Denver, Aurora. E-mail Dr. Heru at cpnews@elsevier.com.
When tragedies like the Aurora, Colo., and Newtown, Conn., shootings occur, we wonder whether people can ever overcome their grief and find a way to move on with their lives. Froma Walsh, Ph.D., a leading authority on family resilience, has developed an approach that can be used to strengthen families and communities that have suffered such tragedies.
Dr. Walsh is the codirector and cofounder of the Chicago Center for Family Health, and the Mose and Sylvia Firestone Professor Emerita in the school of social service administration and department of psychiatry at the University of Chicago.
Resilience originally was described as individual resilience. Dr. Walsh, who has broadened that concept, provides us with important steps to understand how to help heal families and communities that suffer from unimaginable trauma and loss.
Individual resilience
Beginning in the 1960s, British psychiatrist Sir Michael Rutter studied youth from inner-city London and on the Isle of Wight. Even though they experienced many risk factors, 25% of the children had a good outcome. The children who showed individual resilience had the following characteristics: an easy temperament; female; a positive school climate; self-mastery; self-efficacy; planning skills; and a warm, close, personal relationship with an adult.
From 1955 to 1985, American researchers Emmy E. Werner, Ph.D., and Ruth S. Smith, Ph.D., studied a high-risk population of children in Hawaii and found that 36% showed individual resilience, despite their risk factors. Resilient personal characteristics found in this study were similar: being female, socially responsible, adaptable, tolerant, achievement oriented, a good communicator, and having good self-esteem as well as a caring environment inside and outside the family.
Acquiring resilient qualities
After traumatic events happen, how do people cope? How does the coping process result in growth? We are all familiar with the saying: "What doesn’t break you makes you stronger." This is resilience. How can we help families and communities become stronger?
Family resilience
Dr. Walsh developed the concept of family resilience and a practice framework, identifying key family processes that clinicians can target to strengthen family resilience. She is quick to point out that resilience does not lie in specific characteristics, but rather in family processes that promote resilience. These family processes include a family belief system that pulls family members together and forward, the ability to have hope, a spiritual or value orientation to draw meaning and new purpose out of a tragedy, being able to organize family life to meet challenges, reaching out to extended kin and community networks, collaborative problem solving, and clear communication between members.
Her article, "Traumatic loss and major disasters: strengthening family and community resilience," identifies ways that professionals can help families cope with traumatic loss (Fam. Process 2007;46:207-27). She identifies nine aspects of family life as being key factors in families being able to cope well with traumatic loss:.
• Making meaning of traumatic loss experience. Families ask "Why us?" Families need to make sense of their experiences in a way that allows them to live on. "New meaning" highlights the strengths of the survivors and shows a "new way" of relating to the world and to others. As psychiatrists, we can support the family in finding their own meaning, by helping them examine their beliefs about blame, responsibility, or negligence; and helping them come to terms with accountability and limits of control in the situation.
• Hope. Families need to regain hope in their future possibilities. How does this family want to continue and what does this family want to become? Although they cannot change what has happened, we can support their efforts to "master the possible" by promoting active agency in doing all they can as they move forward.
• Transcendence and spirituality. Families can use their personal values and faith communities for support and to help with forgiveness. Honoring those who died with memorials, anniversary remembrances, and celebrations of milestones in recovery will facilitate healing and growth. These rituals help affirm social values of goodness and compassion. "Recovery is a journey of the heart and spirit, bringing survivors back to the fullness of life," Dr. Walsh wrote in her article.
• Flexibility and stability. Flexibility allows adaptation in the family and allows it to stabilize. Families need to buffer the upheaval and restore security, reliability, and continuity in daily routines. They might need to construct a "new normal" in their lives.
• Connectedness. Each family member has her own adaptation to loss, but family members need to remain mutually supportive. If relationships have prior unresolved conflicts, distress can be worse. Family therapy can prove helpful.
• Extended kin and social resources. Reach out to friends, neighbors, health care providers, clergy and congregational support, school teachers and counselors, employers and coworkers, and neighborhood or community organizations. Multifamily community support groups can help families exchange information, share painful memories and feelings, provide mutual support, and encourage hope and efforts for recovery.
• Clear, consistent information. Families often need help to clarify facts and circumstances of traumatic events and to help their children understand, as age appropriate.
• Emotional sharing and support. Families and the community will experience a wide range of feelings. It is important to allow painful or unacceptable feelings to be expressed and supported, even when differences are viewed as threatening, to avoid the risk of future somatic and emotional disturbance, destructive behavior, or substance abuse. Journals and artwork are helpful, especially with children.
• Collaborative problem solving. Family and communities can coordinate collaborative efforts to promote recovery and resilience. Learning from their experience, they can take steps proactively to prevent future tragedies. One mother who lost a child in the Newtown massacre said she wanted her family and her community to be defined not by their tragedy and suffering, but by the way they are responding, by galvanizing action to stop gun violence.
Community resilience
Community resilience is promoted by Dr. Judith Landau and Jack Saul, Ph.D. in a book edited by Dr. Walsh and Monica McGoldrick, Ph.D., called "Living Beyond Loss: Death in the Family" (see list of further reading below). Community members can create a support system that connects individuals and families. Community support provides a highly connected and reality based understanding. Ongoing support groups can respond accurately to the community needs. Perhaps the community might create a neighborhood resource center or a public space to gather, a witness project, or a community website. Such interventions can have a long-lasting positive impact on the community and the families.
Professional resilience
Compassion fatigue can occur when witnessing trauma and in experiencing ongoing distress. Mental health professionals cannot heal all wounds, but we can create a safe haven for family and community members to share pain and their seeking a new path.
Kaethe Weingarten, Ph.D., has developed a compassionate witnessing project aimed at helping professionals understand the importance of "witnessing" suffering and struggle. She encourages professionals to become aware of their own responses to witnessing trauma and to develop tools to cope with the effects of witnessing trauma.
A family resilience approach is a very positive and constructive way that we can use to teach families how to make sense of what has happened and how to move forward, as difficult as that may currently seem to be.
Further reading:
Here is a list of additional reading you can do to help patients who are facing unimaginable loss:
• "Common Shock: Witnessing Violence Every Day," (New York: Dutton, 2003)
• "Family Resilience: A Framework for Clinical Practice," (Family Process 2003;42:1-18)
• "Living Beyond Loss: Death in the Family," (New York: Norton, 2004, 2nd ed.).
• "Resilience Concepts and Findings: Implications for Family Therapy," (J. Family Therapy 1999;21:119-44).
• "Strengthening Family Resilience," (New York: Guilford Press, 2006)
Dr. Heru is with the department of psychiatry at the University of Colorado at Denver, Aurora. E-mail Dr. Heru at cpnews@elsevier.com.
Paclitaxel-eluting stent approved for PAD
The Food and Drug Administration has approved a new paclitaxel-eluting stent indciated for the treatment of peripheral artery disease.
The Zilver PTX Drug-Eluting Peripheral Stent, which is manufactured by Cook Medical of Bloomington, Ind., is the first drug-eluting stent to win approval for this indication.
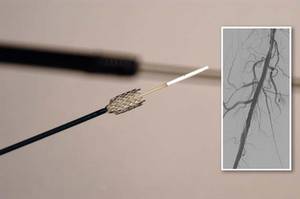
The approval was based on findings from both a randomized controlled trial and on a registry study, which together comprised more than 1,200 patients.
According to an FDA press statement, the studies indicate that treatment with the stent "is at least as safe as treatment with percutaneous transluminal angioplasty (PTA) and significantly more effective."
The randomized trial included a total of 479 patients who had a single stenotic lesion less than 140 mm in one or both of the femoropopliteal arteries.
The patients were randomized to the paclitaxel-eluting stent or to PTA. If the transluminal procedure failed, then the patients received either the paclitaxel-eluting stent or a bare-metal stent.
After 12 months, 83% of the arteries treated with the drug-eluting stent were still open, compared with 33% of those in the PTA group.
In those patients who had the stent placed after a failed PTA, 90% of arteries were open, compared with 73% in those who got the bare-metal stent.
In October 2011, the FDA's Circulatory System Devices Panel voted 11 to 0 that the benefits of the Zilver PTX stent outweighed its risks as a treatment for patients with symptomatic atherosclerotic stenosis of the femoropopliteal arteries on the basis of that trial.
This past October, the 3-year results of the study were presented at the Vascular Interventional Advances 2012 meeting in Las Vegas. The results showed that there was a 70.7% primary patency seen for the paclitaxel-eluting stent, compared with 49.1% for PTA and bare-metal stents.
The registry study followed 767 patients for 24 months. These patients had a maximum of four stents placed; the stents could be utilized to treat a single lesion or to treat multiple lesions.
At 12 months, the fracture rate was 1.5%; fractures were not associated with any clinical problems. The rate of stent thrombosis was 2.8% at 12 months and 3.5% at 24 months.
"The clinical study demonstrated that the [the paclitaxel-eluting stent] is more effective than the use of balloon angioplasty for the treatment of symptomatic peripheral artery disease in above-the-knee femoropopliteal artery," Christy Foreman, director of the Office of Device Evaluation at the FDA's Center for Devices and Radiological Health, said in the statement.
"This approval expands the treatment options for patients suffering from symptomatic peripheral artery disease," she added.
In both studies, the most common major adverse event was restenosis requiring additional treatment to reestablish adequate flow in the artery.
The device is contraindicated in patients with stenoses that cannot be dilated to permit passage of the catheter or proper placement of the stent.
It is also contraindicated in patients who cannot receive recommended drug therapy due to bleeding disorders, or women who are pregnant, breastfeeding, or planning to become pregnant in the next 5 years.
The FDA will now require the manufacturer to conduct a 5-year postapproval study of 900 patients to further evaluate the stent's safety and efficacy.
The banging noise you hear emanating from your radiologic imaging area is not the MRI machine, but nails being pounded into the coffin of the fem-pop bypass graft operation. Incremental but significant progress has been made in treating SFA occlusive disease over the last decade from POBA to tools that facilitate crossing/reentry of CTOs to bare-metal/covered stenting to DES. The Zilver PTX trial and registry have resulted in commercial approval of a long enough, large enough self-expanding stent to be useful in peripheral interventions.
| Dr. Brian Rubin |
Treated lesions included ISRs as well as primary atherosclerotic lesions, and data from both trials showed near-identical 12 and 24 month results, with Zilver PTX resulting in primary patency rates 15-20% higher than results with bare-metal stenting alone. As of mid-November 2012, the complete FDA 57-page PDF of both studies is available online and should be required reading While most surgeons would claim their 12 month fem-AK pop bypass patency to be better than the 83% primary patency reported for Zilver PTX, multiple recent published reports suggest otherwise.
A number of important issues remain unresolved including: 1. how much will each stent cost? (the grapevine has it that the pricing will be surprisingly low) 2. am I really limited to a maximum of 14 cm treated length per leg? (probably not since paclitaxel levels peaked at less than 30 minutes, were gone within a few hours and were very low anyway 3. what antiplatelet therapy is required? (still to be determined- ASA alone is probably adequate) and 4. how do I treat smaller diameter vessels? (Zilver PTX is only approved in 6-8 mm diameters). Although 3-year data have recently been reported, the long-term outcomes after DES remain unknown at this time.
While fem-pop bypass may still find limited utility and needs to remain in the surgical armamentarium, the commercial approval of Zilver PTX stents has nibbled away again at the difference in outcomes between endovascular and open surgical therapy for SFA occlusive disease.
If other studies including long-term outcome reports confirm these initial salutary results, the fem-pop graft will soon follow the utilization curve of open aortic surgery and become an endangered operation.
Dr. Brian Rubin is a professor of the department of surgery at the Washington University School of Medicine, St. Louis.
The banging noise you hear emanating from your radiologic imaging area is not the MRI machine, but nails being pounded into the coffin of the fem-pop bypass graft operation. Incremental but significant progress has been made in treating SFA occlusive disease over the last decade from POBA to tools that facilitate crossing/reentry of CTOs to bare-metal/covered stenting to DES. The Zilver PTX trial and registry have resulted in commercial approval of a long enough, large enough self-expanding stent to be useful in peripheral interventions.
| Dr. Brian Rubin |
Treated lesions included ISRs as well as primary atherosclerotic lesions, and data from both trials showed near-identical 12 and 24 month results, with Zilver PTX resulting in primary patency rates 15-20% higher than results with bare-metal stenting alone. As of mid-November 2012, the complete FDA 57-page PDF of both studies is available online and should be required reading While most surgeons would claim their 12 month fem-AK pop bypass patency to be better than the 83% primary patency reported for Zilver PTX, multiple recent published reports suggest otherwise.
A number of important issues remain unresolved including: 1. how much will each stent cost? (the grapevine has it that the pricing will be surprisingly low) 2. am I really limited to a maximum of 14 cm treated length per leg? (probably not since paclitaxel levels peaked at less than 30 minutes, were gone within a few hours and were very low anyway 3. what antiplatelet therapy is required? (still to be determined- ASA alone is probably adequate) and 4. how do I treat smaller diameter vessels? (Zilver PTX is only approved in 6-8 mm diameters). Although 3-year data have recently been reported, the long-term outcomes after DES remain unknown at this time.
While fem-pop bypass may still find limited utility and needs to remain in the surgical armamentarium, the commercial approval of Zilver PTX stents has nibbled away again at the difference in outcomes between endovascular and open surgical therapy for SFA occlusive disease.
If other studies including long-term outcome reports confirm these initial salutary results, the fem-pop graft will soon follow the utilization curve of open aortic surgery and become an endangered operation.
Dr. Brian Rubin is a professor of the department of surgery at the Washington University School of Medicine, St. Louis.
The banging noise you hear emanating from your radiologic imaging area is not the MRI machine, but nails being pounded into the coffin of the fem-pop bypass graft operation. Incremental but significant progress has been made in treating SFA occlusive disease over the last decade from POBA to tools that facilitate crossing/reentry of CTOs to bare-metal/covered stenting to DES. The Zilver PTX trial and registry have resulted in commercial approval of a long enough, large enough self-expanding stent to be useful in peripheral interventions.
| Dr. Brian Rubin |
Treated lesions included ISRs as well as primary atherosclerotic lesions, and data from both trials showed near-identical 12 and 24 month results, with Zilver PTX resulting in primary patency rates 15-20% higher than results with bare-metal stenting alone. As of mid-November 2012, the complete FDA 57-page PDF of both studies is available online and should be required reading While most surgeons would claim their 12 month fem-AK pop bypass patency to be better than the 83% primary patency reported for Zilver PTX, multiple recent published reports suggest otherwise.
A number of important issues remain unresolved including: 1. how much will each stent cost? (the grapevine has it that the pricing will be surprisingly low) 2. am I really limited to a maximum of 14 cm treated length per leg? (probably not since paclitaxel levels peaked at less than 30 minutes, were gone within a few hours and were very low anyway 3. what antiplatelet therapy is required? (still to be determined- ASA alone is probably adequate) and 4. how do I treat smaller diameter vessels? (Zilver PTX is only approved in 6-8 mm diameters). Although 3-year data have recently been reported, the long-term outcomes after DES remain unknown at this time.
While fem-pop bypass may still find limited utility and needs to remain in the surgical armamentarium, the commercial approval of Zilver PTX stents has nibbled away again at the difference in outcomes between endovascular and open surgical therapy for SFA occlusive disease.
If other studies including long-term outcome reports confirm these initial salutary results, the fem-pop graft will soon follow the utilization curve of open aortic surgery and become an endangered operation.
Dr. Brian Rubin is a professor of the department of surgery at the Washington University School of Medicine, St. Louis.
The Food and Drug Administration has approved a new paclitaxel-eluting stent indciated for the treatment of peripheral artery disease.
The Zilver PTX Drug-Eluting Peripheral Stent, which is manufactured by Cook Medical of Bloomington, Ind., is the first drug-eluting stent to win approval for this indication.
The approval was based on findings from both a randomized controlled trial and on a registry study, which together comprised more than 1,200 patients.
According to an FDA press statement, the studies indicate that treatment with the stent "is at least as safe as treatment with percutaneous transluminal angioplasty (PTA) and significantly more effective."
The randomized trial included a total of 479 patients who had a single stenotic lesion less than 140 mm in one or both of the femoropopliteal arteries.
The patients were randomized to the paclitaxel-eluting stent or to PTA. If the transluminal procedure failed, then the patients received either the paclitaxel-eluting stent or a bare-metal stent.
After 12 months, 83% of the arteries treated with the drug-eluting stent were still open, compared with 33% of those in the PTA group.
In those patients who had the stent placed after a failed PTA, 90% of arteries were open, compared with 73% in those who got the bare-metal stent.
In October 2011, the FDA's Circulatory System Devices Panel voted 11 to 0 that the benefits of the Zilver PTX stent outweighed its risks as a treatment for patients with symptomatic atherosclerotic stenosis of the femoropopliteal arteries on the basis of that trial.
This past October, the 3-year results of the study were presented at the Vascular Interventional Advances 2012 meeting in Las Vegas. The results showed that there was a 70.7% primary patency seen for the paclitaxel-eluting stent, compared with 49.1% for PTA and bare-metal stents.
The registry study followed 767 patients for 24 months. These patients had a maximum of four stents placed; the stents could be utilized to treat a single lesion or to treat multiple lesions.
At 12 months, the fracture rate was 1.5%; fractures were not associated with any clinical problems. The rate of stent thrombosis was 2.8% at 12 months and 3.5% at 24 months.
"The clinical study demonstrated that the [the paclitaxel-eluting stent] is more effective than the use of balloon angioplasty for the treatment of symptomatic peripheral artery disease in above-the-knee femoropopliteal artery," Christy Foreman, director of the Office of Device Evaluation at the FDA's Center for Devices and Radiological Health, said in the statement.
"This approval expands the treatment options for patients suffering from symptomatic peripheral artery disease," she added.
In both studies, the most common major adverse event was restenosis requiring additional treatment to reestablish adequate flow in the artery.
The device is contraindicated in patients with stenoses that cannot be dilated to permit passage of the catheter or proper placement of the stent.
It is also contraindicated in patients who cannot receive recommended drug therapy due to bleeding disorders, or women who are pregnant, breastfeeding, or planning to become pregnant in the next 5 years.
The FDA will now require the manufacturer to conduct a 5-year postapproval study of 900 patients to further evaluate the stent's safety and efficacy.
The Food and Drug Administration has approved a new paclitaxel-eluting stent indciated for the treatment of peripheral artery disease.
The Zilver PTX Drug-Eluting Peripheral Stent, which is manufactured by Cook Medical of Bloomington, Ind., is the first drug-eluting stent to win approval for this indication.
The approval was based on findings from both a randomized controlled trial and on a registry study, which together comprised more than 1,200 patients.
According to an FDA press statement, the studies indicate that treatment with the stent "is at least as safe as treatment with percutaneous transluminal angioplasty (PTA) and significantly more effective."
The randomized trial included a total of 479 patients who had a single stenotic lesion less than 140 mm in one or both of the femoropopliteal arteries.
The patients were randomized to the paclitaxel-eluting stent or to PTA. If the transluminal procedure failed, then the patients received either the paclitaxel-eluting stent or a bare-metal stent.
After 12 months, 83% of the arteries treated with the drug-eluting stent were still open, compared with 33% of those in the PTA group.
In those patients who had the stent placed after a failed PTA, 90% of arteries were open, compared with 73% in those who got the bare-metal stent.
In October 2011, the FDA's Circulatory System Devices Panel voted 11 to 0 that the benefits of the Zilver PTX stent outweighed its risks as a treatment for patients with symptomatic atherosclerotic stenosis of the femoropopliteal arteries on the basis of that trial.
This past October, the 3-year results of the study were presented at the Vascular Interventional Advances 2012 meeting in Las Vegas. The results showed that there was a 70.7% primary patency seen for the paclitaxel-eluting stent, compared with 49.1% for PTA and bare-metal stents.
The registry study followed 767 patients for 24 months. These patients had a maximum of four stents placed; the stents could be utilized to treat a single lesion or to treat multiple lesions.
At 12 months, the fracture rate was 1.5%; fractures were not associated with any clinical problems. The rate of stent thrombosis was 2.8% at 12 months and 3.5% at 24 months.
"The clinical study demonstrated that the [the paclitaxel-eluting stent] is more effective than the use of balloon angioplasty for the treatment of symptomatic peripheral artery disease in above-the-knee femoropopliteal artery," Christy Foreman, director of the Office of Device Evaluation at the FDA's Center for Devices and Radiological Health, said in the statement.
"This approval expands the treatment options for patients suffering from symptomatic peripheral artery disease," she added.
In both studies, the most common major adverse event was restenosis requiring additional treatment to reestablish adequate flow in the artery.
The device is contraindicated in patients with stenoses that cannot be dilated to permit passage of the catheter or proper placement of the stent.
It is also contraindicated in patients who cannot receive recommended drug therapy due to bleeding disorders, or women who are pregnant, breastfeeding, or planning to become pregnant in the next 5 years.
The FDA will now require the manufacturer to conduct a 5-year postapproval study of 900 patients to further evaluate the stent's safety and efficacy.