User login
PICC and Venous Catheter Appropriateness
Vascular access devices (VADs), including peripherally inserted central venous catheters (PICCs) and traditional central venous catheters (CVCs), remain a cornerstone for the delivery of necessary therapy. VADs are used routinely to treat inpatients and increasingly outpatients too. PICCs possess characteristics that are often favorable in a variety of clinical settings when compared to traditional CVCs. However, a paucity of evidence regarding the indication, selection, application, duration, and risks associated with these devices exists. PICCs are often used in situations when peripheral venous catheters (PIVsincluding ultrasound‐guided peripheral intravenous catheters and midline catheters [midlines]) would meet patient needs and confer a lower risk of complications. An unmet need to define indications and promote utilization that conforms to optimal use currently exists. The purpose of this article was to highlight for hospitalists the methodology and subsequent key recommendations published recently[1] regarding appropriateness of PICCs as they pertain to other vascular access device use.
BACKGROUND
Greater utilization of PICCs to meet a variety of clinical needs has recently emerged in hospital‐based medicine.[2, 3] This phenomenon is likely a function of favorable characteristics when comparing PICCs with traditional CVCs. PICCs are often favored because of safety with insertion in the arm, compatibility with inpatient and outpatient therapies, ease of protocolization for insertion by vascular access nursing services, patient tolerability, and cost savings.[4, 5, 6, 7, 8] Yet limitations of PICCs exist and complications including malpositioning, dislodgement, and luminal occlusion[9, 10, 11] affect patient safety and outcomes. Most notably, PICCs are strongly associated with risk for thrombosis and infection, complications that are most frequent in hospitalized and critically ill patients.[12, 13, 14, 15, 16]
Vascular access devices and particularly PICCs pose a substantial risk for thrombosis.[16, 17, 18, 19, 20] PICCs represent the greatest risk factor for upper extremity deep vein thrombosis (DVT), and in one study, PICC‐associated DVT risk was double that with traditional CVCs.[17] Risk factors for the development of PICC‐associated DVT include ipsilateral paresis,[21] infection,[22] PICC diameter,[19, 20] and prolonged surgery (procedure duration >1 hour) with a PICC in place.[23] Recently, PICCs placed in the upper extremity have been described as a possible risk factor for lower extremity venous thrombosis as well.[24, 25]
Infection complicating CVCs is well described,[12, 15] and guidelines for the prevention of catheter‐associated blood stream infections exist.[26, 27] However, the magnitude of the risk of infection associated with PICCs compared with traditional CVCs remains uncertain. Some reports suggest a decrease risk for infection with the utilization of PICCs[28]; others suggest a similar risk.[29] Existing guidelines, however, do not recommend substituting PICCs for CVCs as a technique to reduce infection, especially in general medical patients.[30]
It is not surprising that variability in the clinical use of PICCs and inappropriate PICC utilization has been described[31, 32] given the heterogeneity of patients and clinical situations in which PICCs are used. Simple awareness of medical devices in place is central to optimizing care. Important to the hospitalist physician is a recent study that found that 1 in 5 physicians were unaware of a CVC being present in their patient.[33] Indeed, emphasis has been placed on optimizing the use of PICC lines nationally through the Choosing Wisely initiative.[34, 35]
A panel of experts was convened at the University of Michigan in an effort to further clarify the appropriate use of VADs. Panelists engaged in a RAND Corporation/University of California Los Angeles (RAND/UCLA) Appropriateness Methodology review[36] to provide guidance regarding VAD use. The RAND/UCLA methodology is a validated way to assess the appropriateness of medical and surgical resource utilization, and details of this methodology are published elsewhere.[1] In brief, each panelist was provided a series of clinical scenarios associated with the use of central venous catheters purposefully including areas of consensus, controversy, and ambiguity. Using a standardized method for rating appropriateness, whereby median ratings on opposite ends of a 1 to 9 scale were used to indicate preference of one device over another (for example 9 reflected appropriate and 13 reflected inappropriate), the methodology classified consensus results into three levels of appropriateness. These three levels are: appropriate when the panel median is between 7 and 9 and without disagreement, uncertain/neutral when the panel median is between 4 and 6 or disagreement exists regardless of the median, or inappropriate when the panel median is between 1 and 3 without disagreement.
RESULTS
Comprehensive results regarding appropriateness ratings are reported elsewhere.[1] Results especially key to hospital‐based practitioners are summarized below. Table 1 highlights common scenarios when PICC placement is considered appropriate and inappropriate.
|
| A. Appropriate indications for PICC use |
| Delivery of peripherally compatible infusates when the proposed duration is 6 or more days* |
| Delivery of nonperipherally compatible infusates (eg, irritants/vesicants) regardless of proposed duration of use |
| Delivery of cyclical or episodic chemotherapy that can be administered through a peripheral vein in patients with active cancer, provided the proposed duration of such treatment is 3 or more months |
| Invasive hemodynamic monitoring or necessary central venous access in a critically ill patient, provided the proposed duration is 15 or more days |
| Frequent phlebotomy (every 8 hours) in a hospitalized patient provided the proposed duration is 6 or more days |
| Intermittent infusions or infrequent phlebotomy in patients with poor/difficult peripheral venous access, provided that the proposed duration is 6 or more days |
| Intermittent infusions or infrequent phlebotomy in patients with poor/difficult peripheral venous access, provided that the proposed duration is 6 or more days |
| For infusions or palliative treatment during end‐of‐life care∥ |
| Delivery of peripherally compatible infusates for patients residing in skilled nursing facilities or transitioning from hospital to home, provided that the proposed duration is at least 15 or more days |
| B. Inappropriate indications for PICC use |
| Placement for any indication other than infusion of nonperipherally compatible infusates (eg, irritants/vesicants) when the proposed duration is 5 or fewer days |
| Placement in a patient with active cancer for cyclical chemotherapy that can be administered through a peripheral vein, when the proposed duration of treatment is 3 or fewer months and peripheral veins are available |
| Placement in a patient with stage 3b or greater chronic kidney disease (estimated glomerular filtration rate 44 mL/min) or in patients currently receiving renal replacement therapy via any modality |
| Insertion for nonfrequent phlebotomy if the proposed duration is 5 or fewer days |
| Patient or family request in a patient that is not actively dying/on hospice for comfort from daily lab draws |
| Medical or nursing provider request in the absence of other appropriate criteria for PICC use |
Appropriateness of PICCs in General Hospitalized Medical Patients
The appropriateness of PICCs when compared to other VADs among hospitalized medical patients can be broadly characterized based upon the planned infusate and the anticipated duration of use. PICCs were the preferred VAD when the anticipated duration of infusion was greater than 15 days or for any duration if the infusion was an irritant/vesicant (such as parenteral nutrition or chemotherapy). PICCs were considered appropriate if the proposed duration of use was 6 to 14 days, though preference for a midline or an ultrasound‐guided PIV was noted for this time‐frame. Tunneled catheters were considered appropriate only for the infusion of an irritant/vesicant when the anticipated duration was 15 days; similarly, implanted ports were rated as appropriate when an irritant/vesicant infusion was planned for 31 days. Both tunneled catheters and ports were rated as appropriate when episodic infusion over the duration of several months was necessary. Disagreement existed between the panelists regarding the appropriateness of PICC placement for the indication of frequent blood draws (3 phlebotomies per day) and among patients with difficult venous access, when phlebotomy would be needed for 5 days. In these cases an individualized patient‐centered approach was recommended. PICC placement was considered appropriate in these situations if venous access was required 6 days, but ultrasound‐guided and midline PIVs were again preferred to PICCs when the expected duration of use was 14 days.
Appropriateness of PICCs in Patients With Chronic Kidney Disease
The appropriateness of PICC use among patients with chronic kidney disease (CKD) takes into consideration disease stage as defined by the Kidney Disease: Improving Global Outcomes workgroup.[37] Although panelist recommendations did not differ for patients with stage 1 to 3a CKD (estimated GFR 45 mL/min) from those noted above, for patient's stage 3b or greater CKD, insertion of devices into an arm vein was rated as inappropriate (valuing the preservation of peripheral and central veins for possible hemodialysis/creation of arteriovenous fistulae and grafts). Among patients with stage 3b or greater CKD, PIV access in the dorsum of the hand was recommended for an expected duration of use 5 days. In consultation with a nephrologist, the use of a tunneled small‐bore central catheter (4 French or 5 French) inserted into the jugular vein was rated as appropriate in stage 3b or greater CKD patients requiring venous access for a longer duration.
Appropriateness of PICC Use in Patients with Cancer
The panelists' acknowledged the heterogeneity of thrombosis risk based on cancer type; recommendations reflect the assumption of cancer as a solid tumor. Vascular access choice among cancer patients is complicated by the cyclic nature of therapy frequently administered, the diversity of infusate (eg, nonirritant or nonvesicant versus irritant/vesicant), and uncertainties surrounding duration of therapy. To address this, the panelists chose a pragmatic approach considering the infusate (irritant/vesicant or not), and dichotomized treatment duration (3 months or not). Among cancer patients requiring nonvesicant/nonirritant chemotherapy for a duration 3 months, interval placement of PIVs was rated as appropriate, and disagreement existed among the panelists regarding the appropriateness of PICCs. If 3 months of chemotherapy was necessary, then PICCs or tunneled‐cuffed catheters were considered appropriate. Ports were rated as appropriate if the expected use was 6 months. Among cancer patients requiring vesicant/emrritant chemotherapy, PICCs and tunneled‐cuffed catheters were rated as appropriate for all time intervals, and ports were rated as neutral for 3‐ to 6‐month durations of infusion, and appropriate for durations greater than 6 months. When acceptable, PICCs were favored over tunneled‐cuffed catheters among cancer patients with coagulopathy (eg, severe thrombocytopenia, elevated international normalized ratios).
Appropriateness of PICCs in Patients With Critical Illness
Among critically ill patients, PIVs and midline catheters were rated as appropriate for infusion of 5 days, and 6 to 14 days, respectively, whereas PICCs were considered appropriate only when use 15 days was anticipated. Although both CVCs and PICCs were rated as appropriate among hemodynamically unstable patients in scenarios where invasive cardiovascular monitoring is necessary for durations of 14 days and 15 days, respectively, CVCs were favored over PICCs among patients who are hemodynamically unstable or requiring vasopressors.
Appropriateness of PICC Use In Special Populations
The existence of patients who require lifelong, often intermittent, intravenous access (eg, sickle cell anemia, short‐gut syndrome, cystic fibrosis) necessitates distinct recommendations for venous access. In this population, recommendations were categorized based on frequency of hospitalization. In patients that were hospitalized infrequently (5 hospitalizations per year), use of midlines was preferred to PICCs when the hospitalization was expected to last 5 days; PICCs were rated as appropriate for a duration of use 15 days. However, in patients who require frequent hospitalization (6 hospitalizations annually), tunneled‐cuffed catheters were rated as appropriate and preferred over PICCs when the expected duration of use was 15 days per session.
For long‐term residents in skilled nursing facilities, PICCs were rated as appropriate for an expected duration of use 15 days, but uncertain for a duration of 6 to 14 days (when midlines were rated as appropriate). For venous access of 5 days, PIVs were rated as most appropriate.
How, When, by Whom, and Which PICCs Should Be Inserted
Societal recommendations[26] and guidelines[38] for routine placement and positioning of PICCs by dedicated nursing services exist.[39, 40] Panelists favored consultation with the specialists ordering vascular access devices (eg, infectious disease, nephrology, hematology, oncology) within the first few days of admission for optimal device selection and timing of insertion. For example, PICCs were rated as appropriate to be placed within 2 to 3 days of hospital admission for patients requiring longterm antimicrobial infusion (in the absence of bacteremia). Preferential PICC placement by interventional radiology was rated as appropriate if portable ultrasound did not identify a suitable target vein, the catheter fails to advance over the guidewire during a bedside attempt, or the patient requires sedation not appropriate for bedside placement. Interventional radiology insertion was also preferred in patients with bilateral mastectomy, altered chest anatomy, and for patients with permanent pacemakers or defibrillators if the contralateral arm is was not amenable for insertion. PICCs are generally placed at the bedside (with radiographic confirmation of catheter position, or with electrocardiography guidance when proficiency with this technique exists) or under direct visualization in the interventional radiology suite. As recommended elsewhere,[21, 26, 41] panelists rated the placement of the PICC catheter tip in the lower one‐third of the superior vena cava, at the cavoatrial junction, or in the right atrium as being appropriate. Nuanced recommendations surrounding PICC adjustment under varying circumstances can be found in the parent document.[1] Single‐lumen devices, which are associated with fewer complications, were rated as the appropriate default lumen of choice in the absence of a documented rationale for a multilumen PICC as a mechanism to decrease possible complications.[19, 20, 42] The insertion of multilumen PICCs for separating blood draws from infusions or ensuring a backup lumen is available was rated as inappropriate. Consistent with recent recommendations,[43, 44] normal saline rather than heparin was rated as appropriate to maintain catheter patency. The advancement of a migrated PICC was rated as inappropriate under all circumstances.
CONCLUSIONS
In‐hospital healthcare providers are routinely confronted with dilemmas surrounding choice of VAD. The Michigan Appropriateness Guide for Intravenous Catheters (MAGIC) initiative is a multidisciplinary effort to clarify decision‐making related to VAD use. The systematic literature review and RAND/UCLA appropriateness method applied by the MAGIC panelists identifies areas of broad consensus surrounding the use of PICCs in relation to other VADs, and highlights uncertainties regarding the best practice to guide clinical care. Appropriateness statements facilitate standardization for the use, care, and discontinuation of VADs. These recommendations may be important to healthcare quality officers and payers as they allow for measurement of, and adherence to, standardized practice. In an era of electronic medical records and embedded clinical decision support, these recommendations may facilitate a just‐in‐time resource for optimal VAD management, outcomes measurement, and patient follow‐up. In addition to directing clinical care, these recommendations may serve as a lattice for the formation of future randomized clinical trials to further clarify important areas of the uncertainty surrounding VAD use.
Disclosures: Drs. Woller and Stevens disclose financial support paid to their institution of employment (Intermountain Medical Center) for conducting clinical research (with no financial support paid to either investigator). Dr. Woller discloses serving as an expert panelist for the Michigan Appropriateness Guide for Intravenous Catheters (MAGIC) initiative. The authors report no other conflicts of interest.
- , , , et al. The Michigan Appropriateness Guide for Intravenous Catheters (MAGIC): results from a multispecialty panel using the RAND/UCLA appropriateness method. Ann Intern Med. 2015;163(6 suppl):S1–S40.
- , , , et al. Peripherally inserted central venous catheters in the acute care setting: a safe alternative to high‐risk short‐term central venous catheters. Am J Infect Control. 2010;38(2):149–153.
- , , , , , . Peripherally inserted central catheters may lower the incidence of catheter‐related blood stream infections in patients in surgical intensive care units. Surg Infect (Larchmt). 2011;12(4):279–282.
- . Developing an alternative workflow model for peripherally inserted central catheter placement. J Infus Nurs. 2012;35(1):34–42.
- , . Nurse‐led PICC insertion: is it cost effective? Br J Nurs. 2013;22(19):S9–S15.
- , . Facility wide benefits of radiology vascular access teams, part 2. Radiol Manage. 2010;32(3):39–43.
- , . Facility wide benefits of radiology vascular access teams. Radiol Manage. 2010;32(1):28–32; quiz 3–4.
- , , , . Advantages and disadvantages of peripherally inserted central venous catheters (PICC) compared to other central venous lines: a systematic review of the literature. Acta Oncol. 2013;52(5):886–892.
- , , . The problem with peripherally inserted central catheters. JAMA. 2012;308(15):1527–1528.
- , . Malposition of peripherally inserted central catheter: experience from 3,012 patients with cancer. Exp Ther Med. 2013;6(4):891–893.
- , , . Complications associated with peripheral or central routes for central venous cannulation. Anaesthesia. 2012;67(1):65–71.
- , , , , . Bloodstream infection, venous thrombosis, and peripherally inserted central catheters: reappraising the evidence. Am J Med. 2012;125(8):733–741.
- , , , et al. A randomised, controlled trial comparing the long‐term effects of peripherally inserted central catheter placement in chemotherapy patients using B‐mode ultrasound with modified Seldinger technique versus blind puncture. Eur J Oncol Nurs. 2014;18(1):94–103.
- , , , , . A retrospective study on the long‐term placement of peripherally inserted central catheters and the importance of nursing care and education. Cancer Nurs. 2011;34(1):E25–E30.
- , , , , . The risk of bloodstream infection associated with peripherally inserted central catheters compared with central venous catheters in adults: a systematic review and meta‐analysis. Infect Control Hosp Epidemiol. 2013;34(9):908–918.
- , , , et al. Risk of venous thromboembolism associated with peripherally inserted central catheters: a systematic review and meta‐analysis. Lancet. 2013;382(9889):311–325.
- , , , et al. Risk factors for catheter‐related thrombosis (CRT) in cancer patients: a patient‐level data (IPD) meta‐analysis of clinical trials and prospective studies. J Thromb Haemost. 2011;9(2):312–319.
- , , , . Upper extremity deep vein thrombosis: a community‐based perspective. Am J Med. 2007;120(8):678–684.
- , , , et al. Risk of symptomatic DVT associated with peripherally inserted central catheters. Chest. 2010;138(4):803–810.
- , , , et al. Reduction of peripherally inserted central catheter associated deep venous thrombosis. Chest. 2013;143(3):627–633.
- , , , , , . Risk factors associated with peripherally inserted central venous catheter‐related large vein thrombosis in neurological intensive care patients. Intensive Care Med. 2012;38(2):272–278.
- , , , , . Upper extremity venous thrombosis in patients with cancer with peripherally inserted central venous catheters: a retrospective analysis of risk factors. J Oncol Pract. 2013;9(1):e8–e12.
- , , , et al. 2008 Standards, Options and Recommendations (SOR) guidelines for the prevention and treatment of thrombosis associated with central venous catheters in patients with cancer: report from the working group. Ann Oncol. 2009;20(9):1459–1471.
- , , , , . The association between picc use and venous thromboembolism in upper and lower extremities. Am J Med. 2015;128(9):986–993.e1.
- , , , et al. VTE Incidence and risk factors in patients with severe sepsis and septic shock. Chest. 2015;148(5):1224–1230.
- Infusion Nurses Society. Infusion nursing standards of practice. J Infus Nurs. 2011;34(1S).
- , , , , , , et al. Healthcare Infection Control Practices Advisory Committee (HICPAC) (Appendix 1). Summary of recommendations: Guidelines for the Prevention of Intravascular Catheter‐related Infections. Clin Infect Dis. 2011;52:1087–1099.
- , , , et al. Catheter‐associated bloodstream infection incidence and risk factors in adults with cancer: a prospective cohort study. J Hosp Infect. 2011;78(1):26–30.
- , . Risk of catheter‐related bloodstream infection with peripherally inserted central venous catheters used in hospitalized patients. Chest. 2005;128(2):489–495.
- , , , et al. Guidelines for the prevention of intravascular catheter‐related infections. Clin Infect Dis. 2011;52(9):e162–e193.
- , , , et al. Temporary central venous catheter utilization patterns in a large tertiary care center: tracking the “idle central venous catheter”. Infect Control Hosp Epidemiol. 2012;33(1):50–57.
- , , , , , . Peripherally inserted central catheters: use at a tertiary care pediatric center. J Vasc Interv Radiol. 2013;24(9):1323–1331.
- , , , et al. Do clinicians know which of their patients have central venous catheters?: a multicenter observational study. Ann Intern Med. 2014;161(8):562–567.
- Choosing Wisely. American Society of Nephrology. Don't place peripherally inserted central catheters (PICC) in stage III‐V CKD patients without consulting nephrology. Available at: http://www.choosingwisely.org/clinician‐lists/american‐society‐nephrology‐peripherally‐inserted‐central‐catheters‐in‐stage‐iii‐iv‐ckd‐patients. Accessed November 3, 2015.
- Society of General Internal Medicine. Don't place, or leave in place, peripherally inserted central catheters for patient or provider convenience. Available at: http://www.choosingwisely.org/clinician‐lists/society‐general‐internal‐medicine‐peripherally‐inserted‐central‐catheters‐for‐patient‐provider‐convenience. Accessed November 3, 2015.
- , , , et al. The RAND/UCLA appropriateness method user's manual. Santa Monica, CA: RAND; 2001. Available at: http://www.rand.org/pubs/monograph_reports/MR1269.html.
- National Kidney Foundation/Kidney Disease Outcomes Quality Initiative. KDOQI 2012 clinical practice guidelines for chronic kidney disease. Kidney Inter. 2013;(suppl 3):1–150. Accessed November 3, 2015.
- , , , et al. Practice guidelines for central venous access: a report by the American Society of Anesthesiologists Task Force on Central Venous Access. Anesthesiology. 2012;116(3):539–573.
- , , , , . Improved care and reduced costs for patients requiring peripherally inserted central catheters: the role of bedside ultrasound and a dedicated team. JPEN J Parenter Enteral Nutr. 2005;29(5):374–379.
- , , , . Analysis of tip malposition and correction in peripherally inserted central catheters placed at bedside by a dedicated nursing team. J Vasc Interv Radiol. 2007;18(4):513–518.
- Food and Drug Administration Task Force. Precautions necessary with central venous catheters. FDA Drug Bull. 1989:15–16.
- , , , . Insertion of PICCs with minimum number of lumens reduces complications and costs. J Am Coll Radiol. 2013;10(11):864–868.
- , , , et al. Flushing the central venous catheter: is heparin necessary? J Vasc Access. 2014;15(4):241–248.
- , , , , , . Heparin versus 0.9% sodium chloride intermittent flushing for prevention of occlusion in central venous catheters in adults. Cochrane Database Syst Rev. 2014;10:CD008462.
Vascular access devices (VADs), including peripherally inserted central venous catheters (PICCs) and traditional central venous catheters (CVCs), remain a cornerstone for the delivery of necessary therapy. VADs are used routinely to treat inpatients and increasingly outpatients too. PICCs possess characteristics that are often favorable in a variety of clinical settings when compared to traditional CVCs. However, a paucity of evidence regarding the indication, selection, application, duration, and risks associated with these devices exists. PICCs are often used in situations when peripheral venous catheters (PIVsincluding ultrasound‐guided peripheral intravenous catheters and midline catheters [midlines]) would meet patient needs and confer a lower risk of complications. An unmet need to define indications and promote utilization that conforms to optimal use currently exists. The purpose of this article was to highlight for hospitalists the methodology and subsequent key recommendations published recently[1] regarding appropriateness of PICCs as they pertain to other vascular access device use.
BACKGROUND
Greater utilization of PICCs to meet a variety of clinical needs has recently emerged in hospital‐based medicine.[2, 3] This phenomenon is likely a function of favorable characteristics when comparing PICCs with traditional CVCs. PICCs are often favored because of safety with insertion in the arm, compatibility with inpatient and outpatient therapies, ease of protocolization for insertion by vascular access nursing services, patient tolerability, and cost savings.[4, 5, 6, 7, 8] Yet limitations of PICCs exist and complications including malpositioning, dislodgement, and luminal occlusion[9, 10, 11] affect patient safety and outcomes. Most notably, PICCs are strongly associated with risk for thrombosis and infection, complications that are most frequent in hospitalized and critically ill patients.[12, 13, 14, 15, 16]
Vascular access devices and particularly PICCs pose a substantial risk for thrombosis.[16, 17, 18, 19, 20] PICCs represent the greatest risk factor for upper extremity deep vein thrombosis (DVT), and in one study, PICC‐associated DVT risk was double that with traditional CVCs.[17] Risk factors for the development of PICC‐associated DVT include ipsilateral paresis,[21] infection,[22] PICC diameter,[19, 20] and prolonged surgery (procedure duration >1 hour) with a PICC in place.[23] Recently, PICCs placed in the upper extremity have been described as a possible risk factor for lower extremity venous thrombosis as well.[24, 25]
Infection complicating CVCs is well described,[12, 15] and guidelines for the prevention of catheter‐associated blood stream infections exist.[26, 27] However, the magnitude of the risk of infection associated with PICCs compared with traditional CVCs remains uncertain. Some reports suggest a decrease risk for infection with the utilization of PICCs[28]; others suggest a similar risk.[29] Existing guidelines, however, do not recommend substituting PICCs for CVCs as a technique to reduce infection, especially in general medical patients.[30]
It is not surprising that variability in the clinical use of PICCs and inappropriate PICC utilization has been described[31, 32] given the heterogeneity of patients and clinical situations in which PICCs are used. Simple awareness of medical devices in place is central to optimizing care. Important to the hospitalist physician is a recent study that found that 1 in 5 physicians were unaware of a CVC being present in their patient.[33] Indeed, emphasis has been placed on optimizing the use of PICC lines nationally through the Choosing Wisely initiative.[34, 35]
A panel of experts was convened at the University of Michigan in an effort to further clarify the appropriate use of VADs. Panelists engaged in a RAND Corporation/University of California Los Angeles (RAND/UCLA) Appropriateness Methodology review[36] to provide guidance regarding VAD use. The RAND/UCLA methodology is a validated way to assess the appropriateness of medical and surgical resource utilization, and details of this methodology are published elsewhere.[1] In brief, each panelist was provided a series of clinical scenarios associated with the use of central venous catheters purposefully including areas of consensus, controversy, and ambiguity. Using a standardized method for rating appropriateness, whereby median ratings on opposite ends of a 1 to 9 scale were used to indicate preference of one device over another (for example 9 reflected appropriate and 13 reflected inappropriate), the methodology classified consensus results into three levels of appropriateness. These three levels are: appropriate when the panel median is between 7 and 9 and without disagreement, uncertain/neutral when the panel median is between 4 and 6 or disagreement exists regardless of the median, or inappropriate when the panel median is between 1 and 3 without disagreement.
RESULTS
Comprehensive results regarding appropriateness ratings are reported elsewhere.[1] Results especially key to hospital‐based practitioners are summarized below. Table 1 highlights common scenarios when PICC placement is considered appropriate and inappropriate.
|
| A. Appropriate indications for PICC use |
| Delivery of peripherally compatible infusates when the proposed duration is 6 or more days* |
| Delivery of nonperipherally compatible infusates (eg, irritants/vesicants) regardless of proposed duration of use |
| Delivery of cyclical or episodic chemotherapy that can be administered through a peripheral vein in patients with active cancer, provided the proposed duration of such treatment is 3 or more months |
| Invasive hemodynamic monitoring or necessary central venous access in a critically ill patient, provided the proposed duration is 15 or more days |
| Frequent phlebotomy (every 8 hours) in a hospitalized patient provided the proposed duration is 6 or more days |
| Intermittent infusions or infrequent phlebotomy in patients with poor/difficult peripheral venous access, provided that the proposed duration is 6 or more days |
| Intermittent infusions or infrequent phlebotomy in patients with poor/difficult peripheral venous access, provided that the proposed duration is 6 or more days |
| For infusions or palliative treatment during end‐of‐life care∥ |
| Delivery of peripherally compatible infusates for patients residing in skilled nursing facilities or transitioning from hospital to home, provided that the proposed duration is at least 15 or more days |
| B. Inappropriate indications for PICC use |
| Placement for any indication other than infusion of nonperipherally compatible infusates (eg, irritants/vesicants) when the proposed duration is 5 or fewer days |
| Placement in a patient with active cancer for cyclical chemotherapy that can be administered through a peripheral vein, when the proposed duration of treatment is 3 or fewer months and peripheral veins are available |
| Placement in a patient with stage 3b or greater chronic kidney disease (estimated glomerular filtration rate 44 mL/min) or in patients currently receiving renal replacement therapy via any modality |
| Insertion for nonfrequent phlebotomy if the proposed duration is 5 or fewer days |
| Patient or family request in a patient that is not actively dying/on hospice for comfort from daily lab draws |
| Medical or nursing provider request in the absence of other appropriate criteria for PICC use |
Appropriateness of PICCs in General Hospitalized Medical Patients
The appropriateness of PICCs when compared to other VADs among hospitalized medical patients can be broadly characterized based upon the planned infusate and the anticipated duration of use. PICCs were the preferred VAD when the anticipated duration of infusion was greater than 15 days or for any duration if the infusion was an irritant/vesicant (such as parenteral nutrition or chemotherapy). PICCs were considered appropriate if the proposed duration of use was 6 to 14 days, though preference for a midline or an ultrasound‐guided PIV was noted for this time‐frame. Tunneled catheters were considered appropriate only for the infusion of an irritant/vesicant when the anticipated duration was 15 days; similarly, implanted ports were rated as appropriate when an irritant/vesicant infusion was planned for 31 days. Both tunneled catheters and ports were rated as appropriate when episodic infusion over the duration of several months was necessary. Disagreement existed between the panelists regarding the appropriateness of PICC placement for the indication of frequent blood draws (3 phlebotomies per day) and among patients with difficult venous access, when phlebotomy would be needed for 5 days. In these cases an individualized patient‐centered approach was recommended. PICC placement was considered appropriate in these situations if venous access was required 6 days, but ultrasound‐guided and midline PIVs were again preferred to PICCs when the expected duration of use was 14 days.
Appropriateness of PICCs in Patients With Chronic Kidney Disease
The appropriateness of PICC use among patients with chronic kidney disease (CKD) takes into consideration disease stage as defined by the Kidney Disease: Improving Global Outcomes workgroup.[37] Although panelist recommendations did not differ for patients with stage 1 to 3a CKD (estimated GFR 45 mL/min) from those noted above, for patient's stage 3b or greater CKD, insertion of devices into an arm vein was rated as inappropriate (valuing the preservation of peripheral and central veins for possible hemodialysis/creation of arteriovenous fistulae and grafts). Among patients with stage 3b or greater CKD, PIV access in the dorsum of the hand was recommended for an expected duration of use 5 days. In consultation with a nephrologist, the use of a tunneled small‐bore central catheter (4 French or 5 French) inserted into the jugular vein was rated as appropriate in stage 3b or greater CKD patients requiring venous access for a longer duration.
Appropriateness of PICC Use in Patients with Cancer
The panelists' acknowledged the heterogeneity of thrombosis risk based on cancer type; recommendations reflect the assumption of cancer as a solid tumor. Vascular access choice among cancer patients is complicated by the cyclic nature of therapy frequently administered, the diversity of infusate (eg, nonirritant or nonvesicant versus irritant/vesicant), and uncertainties surrounding duration of therapy. To address this, the panelists chose a pragmatic approach considering the infusate (irritant/vesicant or not), and dichotomized treatment duration (3 months or not). Among cancer patients requiring nonvesicant/nonirritant chemotherapy for a duration 3 months, interval placement of PIVs was rated as appropriate, and disagreement existed among the panelists regarding the appropriateness of PICCs. If 3 months of chemotherapy was necessary, then PICCs or tunneled‐cuffed catheters were considered appropriate. Ports were rated as appropriate if the expected use was 6 months. Among cancer patients requiring vesicant/emrritant chemotherapy, PICCs and tunneled‐cuffed catheters were rated as appropriate for all time intervals, and ports were rated as neutral for 3‐ to 6‐month durations of infusion, and appropriate for durations greater than 6 months. When acceptable, PICCs were favored over tunneled‐cuffed catheters among cancer patients with coagulopathy (eg, severe thrombocytopenia, elevated international normalized ratios).
Appropriateness of PICCs in Patients With Critical Illness
Among critically ill patients, PIVs and midline catheters were rated as appropriate for infusion of 5 days, and 6 to 14 days, respectively, whereas PICCs were considered appropriate only when use 15 days was anticipated. Although both CVCs and PICCs were rated as appropriate among hemodynamically unstable patients in scenarios where invasive cardiovascular monitoring is necessary for durations of 14 days and 15 days, respectively, CVCs were favored over PICCs among patients who are hemodynamically unstable or requiring vasopressors.
Appropriateness of PICC Use In Special Populations
The existence of patients who require lifelong, often intermittent, intravenous access (eg, sickle cell anemia, short‐gut syndrome, cystic fibrosis) necessitates distinct recommendations for venous access. In this population, recommendations were categorized based on frequency of hospitalization. In patients that were hospitalized infrequently (5 hospitalizations per year), use of midlines was preferred to PICCs when the hospitalization was expected to last 5 days; PICCs were rated as appropriate for a duration of use 15 days. However, in patients who require frequent hospitalization (6 hospitalizations annually), tunneled‐cuffed catheters were rated as appropriate and preferred over PICCs when the expected duration of use was 15 days per session.
For long‐term residents in skilled nursing facilities, PICCs were rated as appropriate for an expected duration of use 15 days, but uncertain for a duration of 6 to 14 days (when midlines were rated as appropriate). For venous access of 5 days, PIVs were rated as most appropriate.
How, When, by Whom, and Which PICCs Should Be Inserted
Societal recommendations[26] and guidelines[38] for routine placement and positioning of PICCs by dedicated nursing services exist.[39, 40] Panelists favored consultation with the specialists ordering vascular access devices (eg, infectious disease, nephrology, hematology, oncology) within the first few days of admission for optimal device selection and timing of insertion. For example, PICCs were rated as appropriate to be placed within 2 to 3 days of hospital admission for patients requiring longterm antimicrobial infusion (in the absence of bacteremia). Preferential PICC placement by interventional radiology was rated as appropriate if portable ultrasound did not identify a suitable target vein, the catheter fails to advance over the guidewire during a bedside attempt, or the patient requires sedation not appropriate for bedside placement. Interventional radiology insertion was also preferred in patients with bilateral mastectomy, altered chest anatomy, and for patients with permanent pacemakers or defibrillators if the contralateral arm is was not amenable for insertion. PICCs are generally placed at the bedside (with radiographic confirmation of catheter position, or with electrocardiography guidance when proficiency with this technique exists) or under direct visualization in the interventional radiology suite. As recommended elsewhere,[21, 26, 41] panelists rated the placement of the PICC catheter tip in the lower one‐third of the superior vena cava, at the cavoatrial junction, or in the right atrium as being appropriate. Nuanced recommendations surrounding PICC adjustment under varying circumstances can be found in the parent document.[1] Single‐lumen devices, which are associated with fewer complications, were rated as the appropriate default lumen of choice in the absence of a documented rationale for a multilumen PICC as a mechanism to decrease possible complications.[19, 20, 42] The insertion of multilumen PICCs for separating blood draws from infusions or ensuring a backup lumen is available was rated as inappropriate. Consistent with recent recommendations,[43, 44] normal saline rather than heparin was rated as appropriate to maintain catheter patency. The advancement of a migrated PICC was rated as inappropriate under all circumstances.
CONCLUSIONS
In‐hospital healthcare providers are routinely confronted with dilemmas surrounding choice of VAD. The Michigan Appropriateness Guide for Intravenous Catheters (MAGIC) initiative is a multidisciplinary effort to clarify decision‐making related to VAD use. The systematic literature review and RAND/UCLA appropriateness method applied by the MAGIC panelists identifies areas of broad consensus surrounding the use of PICCs in relation to other VADs, and highlights uncertainties regarding the best practice to guide clinical care. Appropriateness statements facilitate standardization for the use, care, and discontinuation of VADs. These recommendations may be important to healthcare quality officers and payers as they allow for measurement of, and adherence to, standardized practice. In an era of electronic medical records and embedded clinical decision support, these recommendations may facilitate a just‐in‐time resource for optimal VAD management, outcomes measurement, and patient follow‐up. In addition to directing clinical care, these recommendations may serve as a lattice for the formation of future randomized clinical trials to further clarify important areas of the uncertainty surrounding VAD use.
Disclosures: Drs. Woller and Stevens disclose financial support paid to their institution of employment (Intermountain Medical Center) for conducting clinical research (with no financial support paid to either investigator). Dr. Woller discloses serving as an expert panelist for the Michigan Appropriateness Guide for Intravenous Catheters (MAGIC) initiative. The authors report no other conflicts of interest.
- , , , et al. The Michigan Appropriateness Guide for Intravenous Catheters (MAGIC): results from a multispecialty panel using the RAND/UCLA appropriateness method. Ann Intern Med. 2015;163(6 suppl):S1–S40.
- , , , et al. Peripherally inserted central venous catheters in the acute care setting: a safe alternative to high‐risk short‐term central venous catheters. Am J Infect Control. 2010;38(2):149–153.
- , , , , , . Peripherally inserted central catheters may lower the incidence of catheter‐related blood stream infections in patients in surgical intensive care units. Surg Infect (Larchmt). 2011;12(4):279–282.
- . Developing an alternative workflow model for peripherally inserted central catheter placement. J Infus Nurs. 2012;35(1):34–42.
- , . Nurse‐led PICC insertion: is it cost effective? Br J Nurs. 2013;22(19):S9–S15.
- , . Facility wide benefits of radiology vascular access teams, part 2. Radiol Manage. 2010;32(3):39–43.
- , . Facility wide benefits of radiology vascular access teams. Radiol Manage. 2010;32(1):28–32; quiz 3–4.
- , , , . Advantages and disadvantages of peripherally inserted central venous catheters (PICC) compared to other central venous lines: a systematic review of the literature. Acta Oncol. 2013;52(5):886–892.
- , , . The problem with peripherally inserted central catheters. JAMA. 2012;308(15):1527–1528.
- , . Malposition of peripherally inserted central catheter: experience from 3,012 patients with cancer. Exp Ther Med. 2013;6(4):891–893.
- , , . Complications associated with peripheral or central routes for central venous cannulation. Anaesthesia. 2012;67(1):65–71.
- , , , , . Bloodstream infection, venous thrombosis, and peripherally inserted central catheters: reappraising the evidence. Am J Med. 2012;125(8):733–741.
- , , , et al. A randomised, controlled trial comparing the long‐term effects of peripherally inserted central catheter placement in chemotherapy patients using B‐mode ultrasound with modified Seldinger technique versus blind puncture. Eur J Oncol Nurs. 2014;18(1):94–103.
- , , , , . A retrospective study on the long‐term placement of peripherally inserted central catheters and the importance of nursing care and education. Cancer Nurs. 2011;34(1):E25–E30.
- , , , , . The risk of bloodstream infection associated with peripherally inserted central catheters compared with central venous catheters in adults: a systematic review and meta‐analysis. Infect Control Hosp Epidemiol. 2013;34(9):908–918.
- , , , et al. Risk of venous thromboembolism associated with peripherally inserted central catheters: a systematic review and meta‐analysis. Lancet. 2013;382(9889):311–325.
- , , , et al. Risk factors for catheter‐related thrombosis (CRT) in cancer patients: a patient‐level data (IPD) meta‐analysis of clinical trials and prospective studies. J Thromb Haemost. 2011;9(2):312–319.
- , , , . Upper extremity deep vein thrombosis: a community‐based perspective. Am J Med. 2007;120(8):678–684.
- , , , et al. Risk of symptomatic DVT associated with peripherally inserted central catheters. Chest. 2010;138(4):803–810.
- , , , et al. Reduction of peripherally inserted central catheter associated deep venous thrombosis. Chest. 2013;143(3):627–633.
- , , , , , . Risk factors associated with peripherally inserted central venous catheter‐related large vein thrombosis in neurological intensive care patients. Intensive Care Med. 2012;38(2):272–278.
- , , , , . Upper extremity venous thrombosis in patients with cancer with peripherally inserted central venous catheters: a retrospective analysis of risk factors. J Oncol Pract. 2013;9(1):e8–e12.
- , , , et al. 2008 Standards, Options and Recommendations (SOR) guidelines for the prevention and treatment of thrombosis associated with central venous catheters in patients with cancer: report from the working group. Ann Oncol. 2009;20(9):1459–1471.
- , , , , . The association between picc use and venous thromboembolism in upper and lower extremities. Am J Med. 2015;128(9):986–993.e1.
- , , , et al. VTE Incidence and risk factors in patients with severe sepsis and septic shock. Chest. 2015;148(5):1224–1230.
- Infusion Nurses Society. Infusion nursing standards of practice. J Infus Nurs. 2011;34(1S).
- , , , , , , et al. Healthcare Infection Control Practices Advisory Committee (HICPAC) (Appendix 1). Summary of recommendations: Guidelines for the Prevention of Intravascular Catheter‐related Infections. Clin Infect Dis. 2011;52:1087–1099.
- , , , et al. Catheter‐associated bloodstream infection incidence and risk factors in adults with cancer: a prospective cohort study. J Hosp Infect. 2011;78(1):26–30.
- , . Risk of catheter‐related bloodstream infection with peripherally inserted central venous catheters used in hospitalized patients. Chest. 2005;128(2):489–495.
- , , , et al. Guidelines for the prevention of intravascular catheter‐related infections. Clin Infect Dis. 2011;52(9):e162–e193.
- , , , et al. Temporary central venous catheter utilization patterns in a large tertiary care center: tracking the “idle central venous catheter”. Infect Control Hosp Epidemiol. 2012;33(1):50–57.
- , , , , , . Peripherally inserted central catheters: use at a tertiary care pediatric center. J Vasc Interv Radiol. 2013;24(9):1323–1331.
- , , , et al. Do clinicians know which of their patients have central venous catheters?: a multicenter observational study. Ann Intern Med. 2014;161(8):562–567.
- Choosing Wisely. American Society of Nephrology. Don't place peripherally inserted central catheters (PICC) in stage III‐V CKD patients without consulting nephrology. Available at: http://www.choosingwisely.org/clinician‐lists/american‐society‐nephrology‐peripherally‐inserted‐central‐catheters‐in‐stage‐iii‐iv‐ckd‐patients. Accessed November 3, 2015.
- Society of General Internal Medicine. Don't place, or leave in place, peripherally inserted central catheters for patient or provider convenience. Available at: http://www.choosingwisely.org/clinician‐lists/society‐general‐internal‐medicine‐peripherally‐inserted‐central‐catheters‐for‐patient‐provider‐convenience. Accessed November 3, 2015.
- , , , et al. The RAND/UCLA appropriateness method user's manual. Santa Monica, CA: RAND; 2001. Available at: http://www.rand.org/pubs/monograph_reports/MR1269.html.
- National Kidney Foundation/Kidney Disease Outcomes Quality Initiative. KDOQI 2012 clinical practice guidelines for chronic kidney disease. Kidney Inter. 2013;(suppl 3):1–150. Accessed November 3, 2015.
- , , , et al. Practice guidelines for central venous access: a report by the American Society of Anesthesiologists Task Force on Central Venous Access. Anesthesiology. 2012;116(3):539–573.
- , , , , . Improved care and reduced costs for patients requiring peripherally inserted central catheters: the role of bedside ultrasound and a dedicated team. JPEN J Parenter Enteral Nutr. 2005;29(5):374–379.
- , , , . Analysis of tip malposition and correction in peripherally inserted central catheters placed at bedside by a dedicated nursing team. J Vasc Interv Radiol. 2007;18(4):513–518.
- Food and Drug Administration Task Force. Precautions necessary with central venous catheters. FDA Drug Bull. 1989:15–16.
- , , , . Insertion of PICCs with minimum number of lumens reduces complications and costs. J Am Coll Radiol. 2013;10(11):864–868.
- , , , et al. Flushing the central venous catheter: is heparin necessary? J Vasc Access. 2014;15(4):241–248.
- , , , , , . Heparin versus 0.9% sodium chloride intermittent flushing for prevention of occlusion in central venous catheters in adults. Cochrane Database Syst Rev. 2014;10:CD008462.
Warfarin‐Associated Adverse Events
Warfarin is 1 of the most common causes of adverse drug events, with hospitalized patients being particularly at risk compared to outpatients.[1] Despite the availability of new oral anticoagulants (NOACs), physicians commonly prescribe warfarin to hospitalized patients,[2] likely in part due to the greater difficulty in reversing NOACs compared to warfarin. Furthermore, uptake of the NOACs is likely to be slow in resource‐poor countries due to the lower cost of warfarin.[3] However, the narrow therapeutic index, frequent drug‐drug interactions, and patient variability in metabolism of warfarin makes management challenging.[4] Thus, warfarin remains a significant cause of adverse events in hospitalized patients, occurring in approximately 3% to 8% of exposed patients, depending on underlying condition.[2, 5]
An elevated international normalized ratio (INR) is a strong predictor of drug‐associated adverse events (patient harm). In a study employing 21 different electronic triggers to identify potential adverse events, an elevated INR had the highest yield for events associated with harm (96% of INRs >5.0 associated with harm).[6] Although pharmacist‐managed inpatient anticoagulation services have been shown to improve warfarin management,[7, 8] there are evidence gaps regarding the causes of warfarin‐related adverse events and practice changes that could decrease their frequency. Although overanticoagulation is a well‐known risk factor for warfarin‐related adverse events,[9, 10] there are few evidence‐based warfarin monitoring and dosing recommendations for hospitalized patients.[10] For example, the 2012 American College of Chest Physicians Antithrombotic Guidelines[11] provide a weak recommendation on initial dosing of warfarin, but no recommendations on how frequently to monitor the INR, or appropriate dosing responses to INR levels. Although many hospitals employ protocols that suggest daily INR monitoring until stable, there are no evidence‐based guidelines to support this practice.[12] Conversely, there are reports of flags to order an INR level that are not activated unless greater than 2[13] or 3 days[14] pass since the prior INR. Protocols from some major academic medical centers suggest that after a therapeutic INR is reached, INR levels can be measured intermittently, as infrequently as twice a week.[15, 16]
The 2015 Joint Commission anticoagulant‐focused National Patient Safety Goal[17] (initially issued in 2008) mandates the assessment of baseline coagulation status before starting warfarin, and warfarin dosing based on a current INR; however, current is not defined. Neither the extent to which the mandate for assessing baseline coagulation status is adhered to nor the relationship between this process of care and patient outcomes is known. The importance of adverse drug events associated with anticoagulants, included warfarin, was also recently highlighted in the 2014 federal National Action Plan for Adverse Drug Event Prevention. In this document, the prevention of adverse drug events associated with anticoagulants was 1 of the 3 areas selected for special national attention and action.[18]
The Medicare Patient Safety Monitoring System (MPSMS) is a national chart abstraction‐based system that includes 21 in‐hospital adverse event measures, including warfarin‐associated adverse drug events.[2] Because of the importance of warfarin‐associated bleeding in hospitalized patients, we analyzed MPSMS data to determine what factors related to INR monitoring practices place patients at risk for these events. We were particularly interested in determining if we could detect potentially modifiable predictors of overanticoagulation and warfarin‐associated adverse events.
METHODS
Study Sample
We combined 2009 to 2013 MPSMS all payer data from the Centers for Medicare & Medicaid Services Hospital Inpatient Quality Reporting program for 4 common medical conditions: (1) acute myocardial infarction, (2) heart failure, (3) pneumonia, and (4) major surgery (as defined by the national Surgical Care Improvement Project).[19] To increase the sample size for cardiac patients, we combined myocardial infarction patients and heart failure patients into 1 group: acute cardiovascular disease. Patients under 18 years of age are excluded from the MPSMS sample, and we excluded patients whose INR never exceeded 1.5 after the initiation of warfarin therapy.
Patient Characteristics
Patient characteristics included demographics (age, sex, race [white, black, and other race]) and comorbidities. Comorbidities abstracted from medical records included: histories at the time of hospital admission of heart failure, obesity, coronary artery disease, renal disease, cerebrovascular disease, chronic obstructive pulmonary disease, cancer, diabetes, and smoking. The use of anticoagulants other than warfarin was also captured.
INRs
The INR measurement period for each patient started from the initial date of warfarin administration and ended on the date the maximum INR occurred. If a patient had more than 1 INR value on any day, the higher INR value was selected. A day without an INR measurement was defined as no INR value documented for a calendar day within the INR measurement period, starting on the third day of warfarin and ending on the day of the maximum INR level.
Outcomes
The study was performed to assess the association between the number of days on which a patient did not have an INR measured while receiving warfarin and the occurrence of (1) an INR 6.0[20, 21] (intermediate outcome) and (2) a warfarin‐associated adverse event. A description of the MPSMS measure of warfarin‐associated adverse events has been previously published.[2] Warfarin‐associated adverse events must have occurred within 48 hours of predefined triggers: an INR 4.0, cessation of warfarin therapy, administration of vitamin K or fresh frozen plasma, or transfusion of packed red blood cells other than in the setting of a surgical procedure. Warfarin‐associated adverse events were divided into minor and major events for this analysis. Minor events were defined as bleeding, drop in hematocrit of 3 points (occurring more than 48 hours after admission and not associated with surgery), or development of a hematoma. Major events were death, intracranial bleeding, or cardiac arrest. A patient who had both a major and a minor event was considered as having had a major event.
To assess the relationship between a rapidly rising INR and a subsequent INR 5.0 or 6.0, we determined the increase in INR between the measurement done 2 days prior to the maximum INR and 1 day prior to the maximum INR. This analysis was performed only on patients whose INR was 2.0 and 3.5 on the day prior to the maximum INR. In doing so, we sought to determine if the INR rise could predict the occurrence of a subsequent severely elevated INR in patients whose INR was within or near the therapeutic range.
Statistical Analysis
We conducted bivariate analysis to quantify the associations between lapses in measurement of the INR and subsequent warfarin‐associated adverse events, using the Mantel‐Haenszel 2 test for categorical variables. We fitted a generalized linear model with a logit link function to estimate the association of days on which an INR was not measured and the occurrence of the composite adverse event measure or the occurrence of an INR 6.0, adjusting for baseline patient characteristics, the number of days on warfarin, and receipt of heparin and low‐molecular‐weight heparin (LMWH). To account for potential imbalances in baseline patient characteristics and warfarin use prior to admission, we conducted a second analysis using the stabilized inverse probability weights approach. Specifically, we weighted each patient by the patient's inverse propensity scores of having only 1 day, at least 1 day, and at least 2 days without an INR measurement while receiving warfarin.[22, 23, 24, 25] To obtain the propensity scores, we fitted 3 logistic models with all variables included in the above primary mixed models except receipt of LMWH, heparin, and the number of days on warfarin as predictors, but 3 different outcomes, 1 day without an INR measurement, 1 or more days without an INR measurement, and 2 or more days without an INR measurement. Analyses were conducted using SAS version 9.2 (SAS Institute Inc., Cary, NC). All statistical testing was 2‐sided, at a significance level of 0.05. The institutional review board at Solutions IRB (Little Rock, AR) determined that the requirement for informed consent could be waived based on the nature of the study.
RESULTS
There were 130,828 patients included in the 2009 to 2013 MPSMS sample, of whom 19,445 (14.9%) received warfarin during their hospital stay and had at least 1 INR measurement. Among these patients, 5228 (26.9%) had no INR level above 1.5 and were excluded from further analysis, leaving 14,217 included patients. Of these patients, 1055 (7.4%) developed a warfarin‐associated adverse event. Table 1 demonstrates the baseline demographics and comorbidities of the included patients.
| Characteristics | Acute Cardiovascular Disease, No. (%), N = 6,394 | Pneumonia, No. (%), N = 3,668 | Major Surgery, No. (%), N = 4,155 | All, No. (%), N = 14,217 |
|---|---|---|---|---|
| ||||
| Age, mean [SD] | 75.3 [12.4] | 74.5 [13.3] | 69.4 [11.8] | 73.4 [12.7] |
| Sex, female | 3,175 (49.7) | 1,741 (47.5) | 2,639 (63.5) | 7,555 (53.1) |
| Race | ||||
| White | 5,388 (84.3) | 3,268 (89.1) | 3,760 (90.5) | 12,416 (87.3) |
| Other | 1,006 (15.7) | 400 (10.9) | 395 (9.5) | 1,801 (12.7) |
| Comorbidities | ||||
| Cancer | 1,186 (18.6) | 939 (25.6) | 708 (17.0) | 2,833 (19.9) |
| Diabetes | 3,043 (47.6) | 1,536 (41.9) | 1,080 (26.0) | 5,659 (39.8) |
| Obesity | 1,938 (30.3) | 896 (24.4) | 1,260 (30.3) | 4,094 (28.8) |
| Cerebrovascular disease | 1,664 (26.0) | 910 (24.8) | 498 (12.0) | 3,072 (21.6) |
| Heart failure/pulmonary edema | 5,882 (92.0) | 2,052 (55.9) | 607 (14.6) | 8,541 (60.1) |
| Chronic obstructive pulmonary disease | 2,636 (41.2) | 1,929 (52.6) | 672 (16.2) | 5,237 (36.8) |
| Smoking | 895 (14.0) | 662 (18.1) | 623 (15.0) | 2,180 (15.3) |
| Corticosteroids | 490 (7.7) | 568 (15.5) | 147 (3.5) | 1,205 (8.5) |
| Coronary artery disease | 4,628 (72.4) | 1,875 (51.1) | 1,228 (29.6) | 7,731 (54.4) |
| Renal disease | 3,000 (46.9) | 1,320 (36.0) | 565 (13.6) | 4,885 (34.4) |
| Warfarin prior to arrival | 5,074 (79.4) | 3,020 (82.3) | 898 (21.6) | 8,992 (63.3) |
| Heparin given during hospitalization | 850 (13.3) | 282 (7.7) | 314 (7.6) | 1,446 (10.7) |
| LMWH given during hospitalization | 1,591 (24.9) | 1,070 (29.2) | 1,431 (34.4) | 4,092 (28.8) |
Warfarin was started on hospital day 1 for 6825 (48.0%) of 14,217 patients. Among these patients, 6539 (95.8%) had an INR measured within 1 calendar day. We were unable to determine how many patients who started warfarin later in their hospital stay had a baseline INR, as we did not capture INRs performed prior to the day that warfarin was initiated.
Supporting Table 1 in the online version of this article demonstrates the association between an INR 6.0 and the occurrence of warfarin‐associated adverse events. A maximum INR 6.0 occurred in 469 (3.3%) of the patients included in the study, and among those patients, 133 (28.4%) experienced a warfarin‐associated adverse event compared to 922 (6.7%) adverse events in the 13,748 patients who did not develop an INR 6.0 (P < 0.001).
Among 8529 patients who received warfarin for at least 3 days, beginning on the third day of warfarin, 1549 patients (18.2%) did not have INR measured at least once each day that they received warfarin. Table 2 demonstrates that patients who had 2 or more days on which the INR was not measured had higher rates of INR 6.0 than patients for whom the INR was measured daily. A similar association was seen for warfarin‐associated adverse events (Table 2).
| No. of Patients, No. (%), N = 8,529 | Patients With INR on All Days, No. (%), N = 6,980 | Patients With 1 Day Without an INR, No. (%), N = 968 | Patients With 2 or More Days Without an INR, No. (%), N = 581 | P Value | |
|---|---|---|---|---|---|
| |||||
| Maximum INR | <0.01* | ||||
| 1.515.99 | 8,183 | 6,748 (96.7) | 911 (94.1) | 524 (90.2) | |
| 6.0 | 346 | 232 (3.3) | 57 (5.9) | 57 (9.8) | |
| Warfarin‐associated adverse events | <0.01* | ||||
| No adverse events | 7,689 (90.2) | 6,331 (90.7) | 872 (90.1) | 486 (83.6) | |
| Minor adverse events | 792 (9.3) | 617 (8.8) | 86 (8.9) | 89 (15.3) | |
| Major adverse events | 48 (0.6) | 32 (0.5) | 10 (1.0) | 6 (1.0) | |
Figure 1A demonstrates the association between the number of days without an INR measurement and the subsequent development of an INR 6.0 or a warfarin‐associated adverse event, adjusted for baseline patient characteristics, receipt of heparin and LMWH, and number of days on warfarin. Patients with 1 or more days without an INR measurement had higher risk‐adjusted ORs of a subsequent INR 6.0, although the difference was not statistically significant for surgical patients. The analysis results based on inverse propensity scoring are seen in Figure 1B. Cardiac and surgical patients with 2 or more days without an INR measurement were at higher risk of having a warfarin‐associated adverse event, whereas cardiac and pneumonia patients with 1 or more days without an INR measurement were at higher risk of developing an INR 6.0.
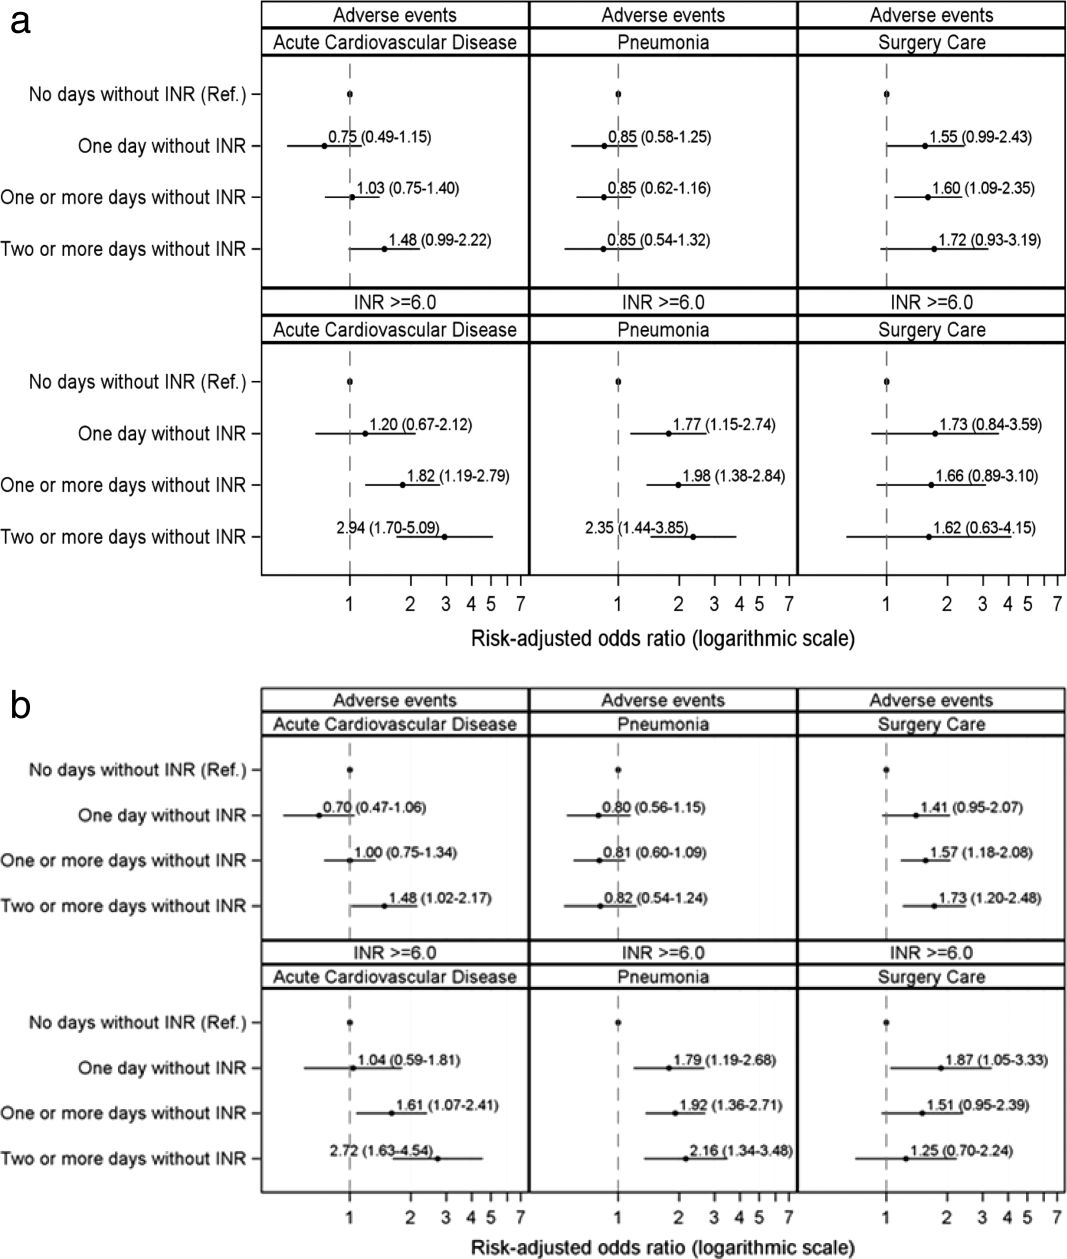
Supporting Table 2 in the online version of this article demonstrates the relationship between patient characteristics and the occurrence of an INR 6.0 or a warfarin‐related adverse event. The only characteristic that was associated with either of these outcomes for all 3 patient conditions was renal disease, which was positively associated with a warfarin‐associated adverse event. Warfarin use prior to arrival was associated with lower risks of both an INR 6.0 and a warfarin‐associated adverse event, except for among surgical patients. Supporting Table 3 in the online version of this article demonstrates the differences in patient characteristics between patients who had daily INR measurement and those who had at least 1 day without an INR measurement.
Figure 2 illustrates the relationship of the maximum INR to the prior 1‐day change in INR in 4963 patients whose INR on the day prior to the maximum INR was 2.0 to 3.5. When the increase in INR was <0.9, the risk of the next day's INR being 6.0 was 0.7%, and if the increase was 0.9, the risk was 5.2%. The risk of developing an INR 5.0 was 1.9% if the preceding day's INR increase was <0.9 and 15.3% if the prior day's INR rise was 0.9. Overall, 51% of INRs 6.0 and 55% of INRs 5.0 were immediately preceded by an INR increase of 0.9. The positive likelihood ratio (LR) for a 0.9 rise in INR predicting an INR of 6.0 was 4.2, and the positive LR was 4.9 for predicting an INR 5.0.
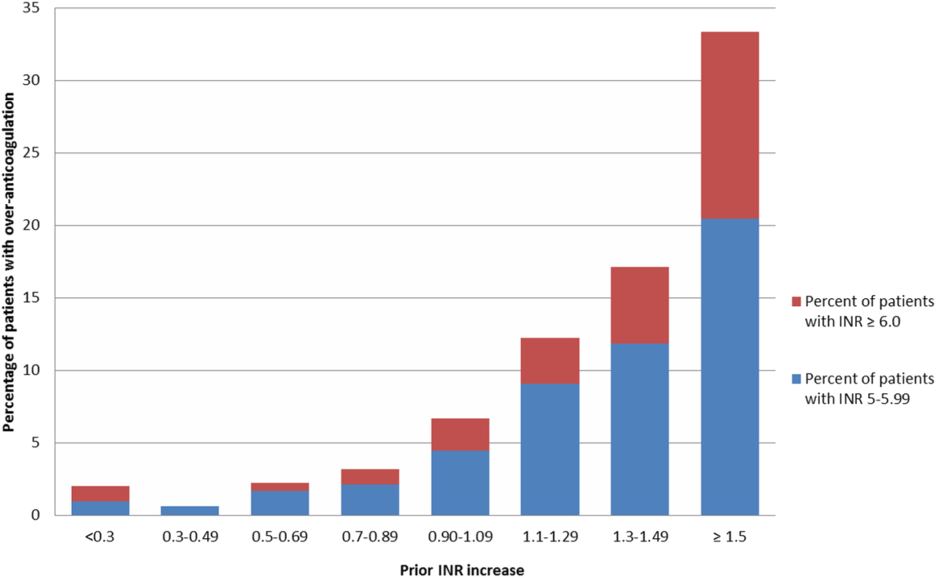
There was no decline in the frequency of warfarin use among the patients in the MPSMS sample during the study period (16.7% in 2009 and 17.3% in 2013).
DISCUSSION
We studied warfarin‐associated adverse events in a nationally representative study of patients who received warfarin while in an acute care hospital for a primary diagnosis of cardiac disease, pneumonia, or major surgery. Several findings resulted from our analysis. First, warfarin is still commonly prescribed to hospitalized patients and remains a frequent cause of adverse events; 7.4% of the 2009 to 2013 MPSMS population who received warfarin and had at least 1 INR >1.5 developed a warfarin‐associated adverse event.
Over 95% of patients who received warfarin on the day of hospital admission had an INR performed within 1 day. This is similar to the results from a 2006 single center study in which 95% of patients had an INR measured prior to their first dose of warfarin.[10] Since 2008, The Joint Commission's National Patient Safety Goal has required the assessment of coagulation status before starting warfarin.[17] The high level of adherence to this standard suggests that further attention to this process of care is unlikely to significantly improve patient safety.
We also found that the lack of daily INR measurements was associated with an increased risk of an INR 6.0 and warfarin‐associated adverse events in some patient populations. There is limited evidence addressing the appropriate frequency of INR measurement in hospitalized patients receiving warfarin. The Joint Commission National Patient Safety Goal requires use of a current INR to adjust this therapy, but provides no specifics.[17] Although some experts believe that INRs should be monitored daily in hospitalized patients, this does not appear to be uniformly accepted. In some reports, 2[13] or 3[14] consecutive days without the performance of an INR was required to activate a reminder. Protocols from some major teaching hospitals specify intermittent monitoring once the INR is therapeutic.[15, 16] Because our results suggest that lapses in INR measurement lead to overanticoagulation and warfarin‐related adverse events, it may be appropriate to measure INRs daily in most hospitalized patients receiving warfarin. This would be consistent with the many known causes of INR instability in patients admitted to the hospital, including drug‐drug interactions, hepatic dysfunction, and changes in volume of distribution, such that truly stable hospitalized patients are likely rare. Indeed, hospital admission is a well‐known predictor of instability of warfarin effect. [9] Although our results suggest that daily INR measurement is associated with a lower rate of overanticoagulation, future studies might better define lower risk patients for whom daily INR measurement would not be necessary.
A prior INR increase 0.9 in 1 day was associated with an increased risk of subsequent overanticoagulation. Although a rapidly rising INR is known to predict overanticoagulation[10, 14] we could find no evidence as to what specific rate of rise confers this risk. Our results suggest that use of a warfarin dosing protocol that considers both the absolute value of the INR and the rate of rise could reduce warfarin‐related adverse events.
There are important limitations of our study. We did not abstract warfarin dosages, which precluded study of the appropriateness of both initial warfarin dosing and adjustment of the warfarin dose based on INR results. MPSMS does not reliably capture antiplatelet agents or other agents that result in drug‐drug interactions with warfarin, such as antibiotics, so this factor could theoretically have confounded our results. Antibiotic use seems unlikely to be a major confounder, because patients with acute cardiovascular disease demonstrated a similar relationship between INR measurement and an INR 6.0 to that seen with pneumonia and surgical patients, despite the latter patients likely having greater antibiotics exposure. Furthermore, MPSMS does not capture indices of severity of illness, so other unmeasured confounders could have influenced our results. Although we have data for patients admitted to the hospital for only 4 conditions, these are conditions that represent approximately 22% of hospital admissions in the United States.[2] Strengths of our study include the nationally representative and randomly selected cases and use of data that were obtained from chart abstraction as opposed to administrative data. Through the use of centralized data abstraction, we avoided the potential bias introduced when hospitals self‐report adverse events.
In summary, in a national sample of patients admitted to the hospital for 4 common conditions, warfarin‐associated adverse events were detected in 7.4% of patients who received warfarin. Lack of daily INR measurement was associated with an increased risk of overanticoagulation and warfarin‐associated adverse events in certain patient populations. A 1‐day increase in the INR of 0.9 predicted subsequent overanticoagulation. These results provide actionable opportunities to improve safety in some hospitalized patients receiving warfarin.
Acknowledgements
The authors express their appreciation to Dan Budnitz, MD, MPH, for his advice regarding study design and his review and comments on a draft of this manuscript.
Disclosures: This work was supported by contract HHSA290201200003C from the Agency for Healthcare Research and Quality, United States Department of Health and Human Services, Rockville, Maryland. Qualidigm was the contractor. The authors assume full responsibility for the accuracy and completeness of the ideas. Dr. Metersky has worked on various quality improvement and patient safety projects with Qualidigm, Centers for Medicare & Medicaid Services, and the Agency for Healthcare Research and Quality. His employer has received remuneration for this work. Dr. Krumholz works under contract with the Centers for Medicare & Medicaid Services to develop and maintain performance measures. Dr. Krumholz is the chair of a cardiac scientific advisory board for UnitedHealth and the recipient of a research grant from Medtronic, Inc. through Yale University. The other authors report no conflicts of interest.
- , , , , , . Delivery of optimized inpatient anticoagulation therapy: consensus statement from the anticoagulation forum. Ann Pharmacother. 2013;47:714–724.
- , , , et al. National trends in patient safety for four common conditions, 2005–2011. N Engl J Med. 2014;370:341–351.
- , . Update on antithrombotic therapy: new anticoagulants. Circulation. 2010;121:1523–1532
- , , , . The pharmacogenetics of coumarin therapy. Pharmacogenomics. 2005;6:503–513.
- , , . Adverse drug events among hospitalized Medicare patients: epidemiology and national estimates from a new approach to surveillance. Jt Comm J Qual Patient Saf. 2010;36:12–21.
- , , , et al. Active surveillance using electronic triggers to detect adverse events in hospitalized patients. Qual Saf Health Care. 2006;15:184–190.
- , , , et al. Inpatient warfarin management: pharmacist management using a detailed dosing protocol. J Thromb Thrombolysis. 2012;33:178–184.
- , , , , . Efficacy and safety of a pharmacist‐managed inpatient anticoagulation service for warfarin initiation and titration. J Clin Pharm Ther. 2011;36:585–591.
- , , , et al. Bleeding complications of oral anticoagulant treatment: an inception‐cohort, prospective collaborative study (ISCOAT). Italian Study on Complications of Oral Anticoagulant Therapy. Lancet. 1996;348:423–428.
- , , , , , . Oral anticoagulation in the hospital: analysis of patients at risk. J Thromb Thrombolysis. 2011;31:22–26.
- , , , et al. Evidence‐based management of anticoagulant therapy: Antithrombotic Therapy and Prevention of Thrombosis, 9th ed: American College of Chest Physicians Evidence‐Based Clinical Practice Guidelines. Chest. 2012;141:e152S–e184S.
- Agency for Healthcare Research and Quality. National Guideline Clearinghouse. Available at: http://www.guideline.gov. Accessed April 30, 2015.
- , . Reduction in anticoagulation‐related adverse drug events using a trigger‐based methodology. Jt Comm J Qual Patient Saf. 2005;31:313–318.
- , , . Use of specific indicators to detect warfarin‐related adverse events. Am J Health Syst Pharm. 2005;62:1683–1688.
- University of Wisconsin Health. Warfarin management– adult–inpatient clinical practice guideline. Available at: http://www.uwhealth.org/files/uwhealth/docs/pdf3/Inpatient_Warfarin_Guideline.pdf. Accessed April 30, 2015
- Anticoagulation Guidelines ‐ LSU Health Shreveport. Available at: http://myhsc.lsuhscshreveport.edu/pharmacy/PT%20Policies/Anticoagulation_Safety.pdf. Accessed November 29, 2015.
- The Joint Commission. National patient safety goals effective January 1, 2015. Available at: http://www.jointcommission.org/assets/1/6/2015_NPSG_HAP.pdf. Accessed November 29, 2015.
- U.S. Department of Health and Human Services. Office of Disease Prevention and Health Promotion. Available at: http://health.gov/hcq/pdfs/ade-action-plan-508c.pdf. Accessed November 29, 2015.
- The Joint Commission. Surgical care improvement project. Available at: http://www.jointcommission.org/surgical_care_improvement_project. Accessed May 5, 2015.
- , , , et al. Optimization of inpatient warfarin therapy: Impact of daily consultation by a pharmacist‐managed anticoagulation service. Ann Pharmacother. 2000;34:567–572.
- , , . Effects of requiring a baseline International Normalized Ratio for inpatients treated with warfarin. Am J Health Syst Pharm. 2010;67:17–22.
- , . Weighting regressions by propensity scores. Eval Rev. 2008;32:392–409.
- . An introduction to propensity score methods for reducing the effects of confounding in observational studies. Multivar Behav Res. 2011;46:399–424.
- . Propensity score methods for bias reduction in the comparison of a treatment to a non‐randomized control group. Stat Med. 1998;17:2265–2281.
- , . The central role of the propensity score in observational studies for causal effects. Biometrika. 1983;70:41–55.
Warfarin is 1 of the most common causes of adverse drug events, with hospitalized patients being particularly at risk compared to outpatients.[1] Despite the availability of new oral anticoagulants (NOACs), physicians commonly prescribe warfarin to hospitalized patients,[2] likely in part due to the greater difficulty in reversing NOACs compared to warfarin. Furthermore, uptake of the NOACs is likely to be slow in resource‐poor countries due to the lower cost of warfarin.[3] However, the narrow therapeutic index, frequent drug‐drug interactions, and patient variability in metabolism of warfarin makes management challenging.[4] Thus, warfarin remains a significant cause of adverse events in hospitalized patients, occurring in approximately 3% to 8% of exposed patients, depending on underlying condition.[2, 5]
An elevated international normalized ratio (INR) is a strong predictor of drug‐associated adverse events (patient harm). In a study employing 21 different electronic triggers to identify potential adverse events, an elevated INR had the highest yield for events associated with harm (96% of INRs >5.0 associated with harm).[6] Although pharmacist‐managed inpatient anticoagulation services have been shown to improve warfarin management,[7, 8] there are evidence gaps regarding the causes of warfarin‐related adverse events and practice changes that could decrease their frequency. Although overanticoagulation is a well‐known risk factor for warfarin‐related adverse events,[9, 10] there are few evidence‐based warfarin monitoring and dosing recommendations for hospitalized patients.[10] For example, the 2012 American College of Chest Physicians Antithrombotic Guidelines[11] provide a weak recommendation on initial dosing of warfarin, but no recommendations on how frequently to monitor the INR, or appropriate dosing responses to INR levels. Although many hospitals employ protocols that suggest daily INR monitoring until stable, there are no evidence‐based guidelines to support this practice.[12] Conversely, there are reports of flags to order an INR level that are not activated unless greater than 2[13] or 3 days[14] pass since the prior INR. Protocols from some major academic medical centers suggest that after a therapeutic INR is reached, INR levels can be measured intermittently, as infrequently as twice a week.[15, 16]
The 2015 Joint Commission anticoagulant‐focused National Patient Safety Goal[17] (initially issued in 2008) mandates the assessment of baseline coagulation status before starting warfarin, and warfarin dosing based on a current INR; however, current is not defined. Neither the extent to which the mandate for assessing baseline coagulation status is adhered to nor the relationship between this process of care and patient outcomes is known. The importance of adverse drug events associated with anticoagulants, included warfarin, was also recently highlighted in the 2014 federal National Action Plan for Adverse Drug Event Prevention. In this document, the prevention of adverse drug events associated with anticoagulants was 1 of the 3 areas selected for special national attention and action.[18]
The Medicare Patient Safety Monitoring System (MPSMS) is a national chart abstraction‐based system that includes 21 in‐hospital adverse event measures, including warfarin‐associated adverse drug events.[2] Because of the importance of warfarin‐associated bleeding in hospitalized patients, we analyzed MPSMS data to determine what factors related to INR monitoring practices place patients at risk for these events. We were particularly interested in determining if we could detect potentially modifiable predictors of overanticoagulation and warfarin‐associated adverse events.
METHODS
Study Sample
We combined 2009 to 2013 MPSMS all payer data from the Centers for Medicare & Medicaid Services Hospital Inpatient Quality Reporting program for 4 common medical conditions: (1) acute myocardial infarction, (2) heart failure, (3) pneumonia, and (4) major surgery (as defined by the national Surgical Care Improvement Project).[19] To increase the sample size for cardiac patients, we combined myocardial infarction patients and heart failure patients into 1 group: acute cardiovascular disease. Patients under 18 years of age are excluded from the MPSMS sample, and we excluded patients whose INR never exceeded 1.5 after the initiation of warfarin therapy.
Patient Characteristics
Patient characteristics included demographics (age, sex, race [white, black, and other race]) and comorbidities. Comorbidities abstracted from medical records included: histories at the time of hospital admission of heart failure, obesity, coronary artery disease, renal disease, cerebrovascular disease, chronic obstructive pulmonary disease, cancer, diabetes, and smoking. The use of anticoagulants other than warfarin was also captured.
INRs
The INR measurement period for each patient started from the initial date of warfarin administration and ended on the date the maximum INR occurred. If a patient had more than 1 INR value on any day, the higher INR value was selected. A day without an INR measurement was defined as no INR value documented for a calendar day within the INR measurement period, starting on the third day of warfarin and ending on the day of the maximum INR level.
Outcomes
The study was performed to assess the association between the number of days on which a patient did not have an INR measured while receiving warfarin and the occurrence of (1) an INR 6.0[20, 21] (intermediate outcome) and (2) a warfarin‐associated adverse event. A description of the MPSMS measure of warfarin‐associated adverse events has been previously published.[2] Warfarin‐associated adverse events must have occurred within 48 hours of predefined triggers: an INR 4.0, cessation of warfarin therapy, administration of vitamin K or fresh frozen plasma, or transfusion of packed red blood cells other than in the setting of a surgical procedure. Warfarin‐associated adverse events were divided into minor and major events for this analysis. Minor events were defined as bleeding, drop in hematocrit of 3 points (occurring more than 48 hours after admission and not associated with surgery), or development of a hematoma. Major events were death, intracranial bleeding, or cardiac arrest. A patient who had both a major and a minor event was considered as having had a major event.
To assess the relationship between a rapidly rising INR and a subsequent INR 5.0 or 6.0, we determined the increase in INR between the measurement done 2 days prior to the maximum INR and 1 day prior to the maximum INR. This analysis was performed only on patients whose INR was 2.0 and 3.5 on the day prior to the maximum INR. In doing so, we sought to determine if the INR rise could predict the occurrence of a subsequent severely elevated INR in patients whose INR was within or near the therapeutic range.
Statistical Analysis
We conducted bivariate analysis to quantify the associations between lapses in measurement of the INR and subsequent warfarin‐associated adverse events, using the Mantel‐Haenszel 2 test for categorical variables. We fitted a generalized linear model with a logit link function to estimate the association of days on which an INR was not measured and the occurrence of the composite adverse event measure or the occurrence of an INR 6.0, adjusting for baseline patient characteristics, the number of days on warfarin, and receipt of heparin and low‐molecular‐weight heparin (LMWH). To account for potential imbalances in baseline patient characteristics and warfarin use prior to admission, we conducted a second analysis using the stabilized inverse probability weights approach. Specifically, we weighted each patient by the patient's inverse propensity scores of having only 1 day, at least 1 day, and at least 2 days without an INR measurement while receiving warfarin.[22, 23, 24, 25] To obtain the propensity scores, we fitted 3 logistic models with all variables included in the above primary mixed models except receipt of LMWH, heparin, and the number of days on warfarin as predictors, but 3 different outcomes, 1 day without an INR measurement, 1 or more days without an INR measurement, and 2 or more days without an INR measurement. Analyses were conducted using SAS version 9.2 (SAS Institute Inc., Cary, NC). All statistical testing was 2‐sided, at a significance level of 0.05. The institutional review board at Solutions IRB (Little Rock, AR) determined that the requirement for informed consent could be waived based on the nature of the study.
RESULTS
There were 130,828 patients included in the 2009 to 2013 MPSMS sample, of whom 19,445 (14.9%) received warfarin during their hospital stay and had at least 1 INR measurement. Among these patients, 5228 (26.9%) had no INR level above 1.5 and were excluded from further analysis, leaving 14,217 included patients. Of these patients, 1055 (7.4%) developed a warfarin‐associated adverse event. Table 1 demonstrates the baseline demographics and comorbidities of the included patients.
| Characteristics | Acute Cardiovascular Disease, No. (%), N = 6,394 | Pneumonia, No. (%), N = 3,668 | Major Surgery, No. (%), N = 4,155 | All, No. (%), N = 14,217 |
|---|---|---|---|---|
| ||||
| Age, mean [SD] | 75.3 [12.4] | 74.5 [13.3] | 69.4 [11.8] | 73.4 [12.7] |
| Sex, female | 3,175 (49.7) | 1,741 (47.5) | 2,639 (63.5) | 7,555 (53.1) |
| Race | ||||
| White | 5,388 (84.3) | 3,268 (89.1) | 3,760 (90.5) | 12,416 (87.3) |
| Other | 1,006 (15.7) | 400 (10.9) | 395 (9.5) | 1,801 (12.7) |
| Comorbidities | ||||
| Cancer | 1,186 (18.6) | 939 (25.6) | 708 (17.0) | 2,833 (19.9) |
| Diabetes | 3,043 (47.6) | 1,536 (41.9) | 1,080 (26.0) | 5,659 (39.8) |
| Obesity | 1,938 (30.3) | 896 (24.4) | 1,260 (30.3) | 4,094 (28.8) |
| Cerebrovascular disease | 1,664 (26.0) | 910 (24.8) | 498 (12.0) | 3,072 (21.6) |
| Heart failure/pulmonary edema | 5,882 (92.0) | 2,052 (55.9) | 607 (14.6) | 8,541 (60.1) |
| Chronic obstructive pulmonary disease | 2,636 (41.2) | 1,929 (52.6) | 672 (16.2) | 5,237 (36.8) |
| Smoking | 895 (14.0) | 662 (18.1) | 623 (15.0) | 2,180 (15.3) |
| Corticosteroids | 490 (7.7) | 568 (15.5) | 147 (3.5) | 1,205 (8.5) |
| Coronary artery disease | 4,628 (72.4) | 1,875 (51.1) | 1,228 (29.6) | 7,731 (54.4) |
| Renal disease | 3,000 (46.9) | 1,320 (36.0) | 565 (13.6) | 4,885 (34.4) |
| Warfarin prior to arrival | 5,074 (79.4) | 3,020 (82.3) | 898 (21.6) | 8,992 (63.3) |
| Heparin given during hospitalization | 850 (13.3) | 282 (7.7) | 314 (7.6) | 1,446 (10.7) |
| LMWH given during hospitalization | 1,591 (24.9) | 1,070 (29.2) | 1,431 (34.4) | 4,092 (28.8) |
Warfarin was started on hospital day 1 for 6825 (48.0%) of 14,217 patients. Among these patients, 6539 (95.8%) had an INR measured within 1 calendar day. We were unable to determine how many patients who started warfarin later in their hospital stay had a baseline INR, as we did not capture INRs performed prior to the day that warfarin was initiated.
Supporting Table 1 in the online version of this article demonstrates the association between an INR 6.0 and the occurrence of warfarin‐associated adverse events. A maximum INR 6.0 occurred in 469 (3.3%) of the patients included in the study, and among those patients, 133 (28.4%) experienced a warfarin‐associated adverse event compared to 922 (6.7%) adverse events in the 13,748 patients who did not develop an INR 6.0 (P < 0.001).
Among 8529 patients who received warfarin for at least 3 days, beginning on the third day of warfarin, 1549 patients (18.2%) did not have INR measured at least once each day that they received warfarin. Table 2 demonstrates that patients who had 2 or more days on which the INR was not measured had higher rates of INR 6.0 than patients for whom the INR was measured daily. A similar association was seen for warfarin‐associated adverse events (Table 2).
| No. of Patients, No. (%), N = 8,529 | Patients With INR on All Days, No. (%), N = 6,980 | Patients With 1 Day Without an INR, No. (%), N = 968 | Patients With 2 or More Days Without an INR, No. (%), N = 581 | P Value | |
|---|---|---|---|---|---|
| |||||
| Maximum INR | <0.01* | ||||
| 1.515.99 | 8,183 | 6,748 (96.7) | 911 (94.1) | 524 (90.2) | |
| 6.0 | 346 | 232 (3.3) | 57 (5.9) | 57 (9.8) | |
| Warfarin‐associated adverse events | <0.01* | ||||
| No adverse events | 7,689 (90.2) | 6,331 (90.7) | 872 (90.1) | 486 (83.6) | |
| Minor adverse events | 792 (9.3) | 617 (8.8) | 86 (8.9) | 89 (15.3) | |
| Major adverse events | 48 (0.6) | 32 (0.5) | 10 (1.0) | 6 (1.0) | |
Figure 1A demonstrates the association between the number of days without an INR measurement and the subsequent development of an INR 6.0 or a warfarin‐associated adverse event, adjusted for baseline patient characteristics, receipt of heparin and LMWH, and number of days on warfarin. Patients with 1 or more days without an INR measurement had higher risk‐adjusted ORs of a subsequent INR 6.0, although the difference was not statistically significant for surgical patients. The analysis results based on inverse propensity scoring are seen in Figure 1B. Cardiac and surgical patients with 2 or more days without an INR measurement were at higher risk of having a warfarin‐associated adverse event, whereas cardiac and pneumonia patients with 1 or more days without an INR measurement were at higher risk of developing an INR 6.0.
Supporting Table 2 in the online version of this article demonstrates the relationship between patient characteristics and the occurrence of an INR 6.0 or a warfarin‐related adverse event. The only characteristic that was associated with either of these outcomes for all 3 patient conditions was renal disease, which was positively associated with a warfarin‐associated adverse event. Warfarin use prior to arrival was associated with lower risks of both an INR 6.0 and a warfarin‐associated adverse event, except for among surgical patients. Supporting Table 3 in the online version of this article demonstrates the differences in patient characteristics between patients who had daily INR measurement and those who had at least 1 day without an INR measurement.
Figure 2 illustrates the relationship of the maximum INR to the prior 1‐day change in INR in 4963 patients whose INR on the day prior to the maximum INR was 2.0 to 3.5. When the increase in INR was <0.9, the risk of the next day's INR being 6.0 was 0.7%, and if the increase was 0.9, the risk was 5.2%. The risk of developing an INR 5.0 was 1.9% if the preceding day's INR increase was <0.9 and 15.3% if the prior day's INR rise was 0.9. Overall, 51% of INRs 6.0 and 55% of INRs 5.0 were immediately preceded by an INR increase of 0.9. The positive likelihood ratio (LR) for a 0.9 rise in INR predicting an INR of 6.0 was 4.2, and the positive LR was 4.9 for predicting an INR 5.0.
There was no decline in the frequency of warfarin use among the patients in the MPSMS sample during the study period (16.7% in 2009 and 17.3% in 2013).
DISCUSSION
We studied warfarin‐associated adverse events in a nationally representative study of patients who received warfarin while in an acute care hospital for a primary diagnosis of cardiac disease, pneumonia, or major surgery. Several findings resulted from our analysis. First, warfarin is still commonly prescribed to hospitalized patients and remains a frequent cause of adverse events; 7.4% of the 2009 to 2013 MPSMS population who received warfarin and had at least 1 INR >1.5 developed a warfarin‐associated adverse event.
Over 95% of patients who received warfarin on the day of hospital admission had an INR performed within 1 day. This is similar to the results from a 2006 single center study in which 95% of patients had an INR measured prior to their first dose of warfarin.[10] Since 2008, The Joint Commission's National Patient Safety Goal has required the assessment of coagulation status before starting warfarin.[17] The high level of adherence to this standard suggests that further attention to this process of care is unlikely to significantly improve patient safety.
We also found that the lack of daily INR measurements was associated with an increased risk of an INR 6.0 and warfarin‐associated adverse events in some patient populations. There is limited evidence addressing the appropriate frequency of INR measurement in hospitalized patients receiving warfarin. The Joint Commission National Patient Safety Goal requires use of a current INR to adjust this therapy, but provides no specifics.[17] Although some experts believe that INRs should be monitored daily in hospitalized patients, this does not appear to be uniformly accepted. In some reports, 2[13] or 3[14] consecutive days without the performance of an INR was required to activate a reminder. Protocols from some major teaching hospitals specify intermittent monitoring once the INR is therapeutic.[15, 16] Because our results suggest that lapses in INR measurement lead to overanticoagulation and warfarin‐related adverse events, it may be appropriate to measure INRs daily in most hospitalized patients receiving warfarin. This would be consistent with the many known causes of INR instability in patients admitted to the hospital, including drug‐drug interactions, hepatic dysfunction, and changes in volume of distribution, such that truly stable hospitalized patients are likely rare. Indeed, hospital admission is a well‐known predictor of instability of warfarin effect. [9] Although our results suggest that daily INR measurement is associated with a lower rate of overanticoagulation, future studies might better define lower risk patients for whom daily INR measurement would not be necessary.
A prior INR increase 0.9 in 1 day was associated with an increased risk of subsequent overanticoagulation. Although a rapidly rising INR is known to predict overanticoagulation[10, 14] we could find no evidence as to what specific rate of rise confers this risk. Our results suggest that use of a warfarin dosing protocol that considers both the absolute value of the INR and the rate of rise could reduce warfarin‐related adverse events.
There are important limitations of our study. We did not abstract warfarin dosages, which precluded study of the appropriateness of both initial warfarin dosing and adjustment of the warfarin dose based on INR results. MPSMS does not reliably capture antiplatelet agents or other agents that result in drug‐drug interactions with warfarin, such as antibiotics, so this factor could theoretically have confounded our results. Antibiotic use seems unlikely to be a major confounder, because patients with acute cardiovascular disease demonstrated a similar relationship between INR measurement and an INR 6.0 to that seen with pneumonia and surgical patients, despite the latter patients likely having greater antibiotics exposure. Furthermore, MPSMS does not capture indices of severity of illness, so other unmeasured confounders could have influenced our results. Although we have data for patients admitted to the hospital for only 4 conditions, these are conditions that represent approximately 22% of hospital admissions in the United States.[2] Strengths of our study include the nationally representative and randomly selected cases and use of data that were obtained from chart abstraction as opposed to administrative data. Through the use of centralized data abstraction, we avoided the potential bias introduced when hospitals self‐report adverse events.
In summary, in a national sample of patients admitted to the hospital for 4 common conditions, warfarin‐associated adverse events were detected in 7.4% of patients who received warfarin. Lack of daily INR measurement was associated with an increased risk of overanticoagulation and warfarin‐associated adverse events in certain patient populations. A 1‐day increase in the INR of 0.9 predicted subsequent overanticoagulation. These results provide actionable opportunities to improve safety in some hospitalized patients receiving warfarin.
Acknowledgements
The authors express their appreciation to Dan Budnitz, MD, MPH, for his advice regarding study design and his review and comments on a draft of this manuscript.
Disclosures: This work was supported by contract HHSA290201200003C from the Agency for Healthcare Research and Quality, United States Department of Health and Human Services, Rockville, Maryland. Qualidigm was the contractor. The authors assume full responsibility for the accuracy and completeness of the ideas. Dr. Metersky has worked on various quality improvement and patient safety projects with Qualidigm, Centers for Medicare & Medicaid Services, and the Agency for Healthcare Research and Quality. His employer has received remuneration for this work. Dr. Krumholz works under contract with the Centers for Medicare & Medicaid Services to develop and maintain performance measures. Dr. Krumholz is the chair of a cardiac scientific advisory board for UnitedHealth and the recipient of a research grant from Medtronic, Inc. through Yale University. The other authors report no conflicts of interest.
- , , , , , . Delivery of optimized inpatient anticoagulation therapy: consensus statement from the anticoagulation forum. Ann Pharmacother. 2013;47:714–724.
- , , , et al. National trends in patient safety for four common conditions, 2005–2011. N Engl J Med. 2014;370:341–351.
- , . Update on antithrombotic therapy: new anticoagulants. Circulation. 2010;121:1523–1532
- , , , . The pharmacogenetics of coumarin therapy. Pharmacogenomics. 2005;6:503–513.
- , , . Adverse drug events among hospitalized Medicare patients: epidemiology and national estimates from a new approach to surveillance. Jt Comm J Qual Patient Saf. 2010;36:12–21.
- , , , et al. Active surveillance using electronic triggers to detect adverse events in hospitalized patients. Qual Saf Health Care. 2006;15:184–190.
- , , , et al. Inpatient warfarin management: pharmacist management using a detailed dosing protocol. J Thromb Thrombolysis. 2012;33:178–184.
- , , , , . Efficacy and safety of a pharmacist‐managed inpatient anticoagulation service for warfarin initiation and titration. J Clin Pharm Ther. 2011;36:585–591.
- , , , et al. Bleeding complications of oral anticoagulant treatment: an inception‐cohort, prospective collaborative study (ISCOAT). Italian Study on Complications of Oral Anticoagulant Therapy. Lancet. 1996;348:423–428.
- , , , , , . Oral anticoagulation in the hospital: analysis of patients at risk. J Thromb Thrombolysis. 2011;31:22–26.
- , , , et al. Evidence‐based management of anticoagulant therapy: Antithrombotic Therapy and Prevention of Thrombosis, 9th ed: American College of Chest Physicians Evidence‐Based Clinical Practice Guidelines. Chest. 2012;141:e152S–e184S.
- Agency for Healthcare Research and Quality. National Guideline Clearinghouse. Available at: http://www.guideline.gov. Accessed April 30, 2015.
- , . Reduction in anticoagulation‐related adverse drug events using a trigger‐based methodology. Jt Comm J Qual Patient Saf. 2005;31:313–318.
- , , . Use of specific indicators to detect warfarin‐related adverse events. Am J Health Syst Pharm. 2005;62:1683–1688.
- University of Wisconsin Health. Warfarin management– adult–inpatient clinical practice guideline. Available at: http://www.uwhealth.org/files/uwhealth/docs/pdf3/Inpatient_Warfarin_Guideline.pdf. Accessed April 30, 2015
- Anticoagulation Guidelines ‐ LSU Health Shreveport. Available at: http://myhsc.lsuhscshreveport.edu/pharmacy/PT%20Policies/Anticoagulation_Safety.pdf. Accessed November 29, 2015.
- The Joint Commission. National patient safety goals effective January 1, 2015. Available at: http://www.jointcommission.org/assets/1/6/2015_NPSG_HAP.pdf. Accessed November 29, 2015.
- U.S. Department of Health and Human Services. Office of Disease Prevention and Health Promotion. Available at: http://health.gov/hcq/pdfs/ade-action-plan-508c.pdf. Accessed November 29, 2015.
- The Joint Commission. Surgical care improvement project. Available at: http://www.jointcommission.org/surgical_care_improvement_project. Accessed May 5, 2015.
- , , , et al. Optimization of inpatient warfarin therapy: Impact of daily consultation by a pharmacist‐managed anticoagulation service. Ann Pharmacother. 2000;34:567–572.
- , , . Effects of requiring a baseline International Normalized Ratio for inpatients treated with warfarin. Am J Health Syst Pharm. 2010;67:17–22.
- , . Weighting regressions by propensity scores. Eval Rev. 2008;32:392–409.
- . An introduction to propensity score methods for reducing the effects of confounding in observational studies. Multivar Behav Res. 2011;46:399–424.
- . Propensity score methods for bias reduction in the comparison of a treatment to a non‐randomized control group. Stat Med. 1998;17:2265–2281.
- , . The central role of the propensity score in observational studies for causal effects. Biometrika. 1983;70:41–55.
© 2015 Society of Hospital Medicine

Functional dependence linked to risk of complications after spine surgery
SAN DIEGO – Functional dependence following elective cervical spine procedures was associated with a significantly increased risk of almost all 30-day complications analyzed, including mortality, a large retrospective analysis of national data demonstrated.
The findings suggest that physicians should “include the patient’s level of functional independence, in addition to more traditional medical comorbidities, in the risk-benefit analysis of surgical decision making,” Dr. Alpesh A. Patel said in an interview in advance of the annual meeting of the Cervical Spine Research Society. “Those individuals with dependence need to be counseled appropriately about their increased risk of complications including mortality.”

Dr. Patel, professor and director of orthopedic spine surgery at Northwestern University Feinberg School of Medicine, Chicago, and his associates retrospectively reviewed the American College of Surgeons National Surgical Quality Improvement Program (ACS NSQIP) data files from 2006 to 2013 and limited their analysis to patients undergoing elective anterior cervical fusions, posterior cervical fusions, cervical laminectomy, cervical laminotomy, cervical discectomy, or corpectomy. They divided patients into one of three groups based on the following preoperative functional status parameters: independent, comprising those not requiring assistance or any equipment for activities of daily living (ADLs); partially dependent, including those with equipment such as prosthetics, equipment, or devices and requiring some assistance from another person for ADLs; and totally dependent, in which patients require total assistance for all ADLs. The researchers used univariate analysis to compare patient demographics, comorbidities, and 30-day postoperative complications among the three groups, followed by multivariate logistic regression to analyze the independent association of functional dependence on 30-day complications when controlling for procedure and comorbidity variances.
Dr. Patel reported findings from 24,357 patients: 23,620 (97.0%) functionally independent, 664 (2.7%) partially dependent, and 73 (0.3%) totally dependent. Dependent patients were significantly older and had higher rates of all comorbidities (P less than .001), with the exception of obesity (P = .214). In addition, 30-day complication rates were higher for all complications (P less than .001) other than neurological (P =.060) and surgical site complications (P =.668). When the researchers controlled for type of procedure and for disparities in patient preoperative variables, multivariate analyses demonstrated that functional dependence was independently associated with sepsis (odds ratio 6.40; P less than .001), pulmonary (OR 4.13; P less than .001), venous thromboembolism (OR 4.27, P less than .001), renal (OR 3.32; P less than .001), and cardiac complications (OR 4.68; P =.001), along with mortality (OR 8.31; P less than .001).
“The very strong association between functional dependence and mortality was quite surprising,” Dr. Patel said. “It was, to the contrary, also surprising to see that, despite wide variance in medical comorbidities and functional status, surgical complications such as infection and neurological injury were similar in all groups.” He characterized the study as “the first large-scale assessment of functional status as a predictor of patient outcomes after cervical spine surgery. It fits in line with other studies utilizing large databases. Big data analysis of outcomes can be used to identify risk factors for complications including death after surgery. Identifying these factors is important if we are going to improve the care we provide. Accurately quantifying the impact of these risk factors is also critical when we risk stratify and compare hospitals and physicians.”
He acknowledged certain limitations of the study, including the fact that it is a retrospective study “with a heterogeneous population of patients, surgeons, hospitals, and procedures. This adds uncertainty to the analysis at the level of the individual patient but does provide generalizability to a broader patient population.”
Dr. Patel reported having no conflicts of interest.
SAN DIEGO – Functional dependence following elective cervical spine procedures was associated with a significantly increased risk of almost all 30-day complications analyzed, including mortality, a large retrospective analysis of national data demonstrated.
The findings suggest that physicians should “include the patient’s level of functional independence, in addition to more traditional medical comorbidities, in the risk-benefit analysis of surgical decision making,” Dr. Alpesh A. Patel said in an interview in advance of the annual meeting of the Cervical Spine Research Society. “Those individuals with dependence need to be counseled appropriately about their increased risk of complications including mortality.”
Dr. Patel, professor and director of orthopedic spine surgery at Northwestern University Feinberg School of Medicine, Chicago, and his associates retrospectively reviewed the American College of Surgeons National Surgical Quality Improvement Program (ACS NSQIP) data files from 2006 to 2013 and limited their analysis to patients undergoing elective anterior cervical fusions, posterior cervical fusions, cervical laminectomy, cervical laminotomy, cervical discectomy, or corpectomy. They divided patients into one of three groups based on the following preoperative functional status parameters: independent, comprising those not requiring assistance or any equipment for activities of daily living (ADLs); partially dependent, including those with equipment such as prosthetics, equipment, or devices and requiring some assistance from another person for ADLs; and totally dependent, in which patients require total assistance for all ADLs. The researchers used univariate analysis to compare patient demographics, comorbidities, and 30-day postoperative complications among the three groups, followed by multivariate logistic regression to analyze the independent association of functional dependence on 30-day complications when controlling for procedure and comorbidity variances.
Dr. Patel reported findings from 24,357 patients: 23,620 (97.0%) functionally independent, 664 (2.7%) partially dependent, and 73 (0.3%) totally dependent. Dependent patients were significantly older and had higher rates of all comorbidities (P less than .001), with the exception of obesity (P = .214). In addition, 30-day complication rates were higher for all complications (P less than .001) other than neurological (P =.060) and surgical site complications (P =.668). When the researchers controlled for type of procedure and for disparities in patient preoperative variables, multivariate analyses demonstrated that functional dependence was independently associated with sepsis (odds ratio 6.40; P less than .001), pulmonary (OR 4.13; P less than .001), venous thromboembolism (OR 4.27, P less than .001), renal (OR 3.32; P less than .001), and cardiac complications (OR 4.68; P =.001), along with mortality (OR 8.31; P less than .001).
“The very strong association between functional dependence and mortality was quite surprising,” Dr. Patel said. “It was, to the contrary, also surprising to see that, despite wide variance in medical comorbidities and functional status, surgical complications such as infection and neurological injury were similar in all groups.” He characterized the study as “the first large-scale assessment of functional status as a predictor of patient outcomes after cervical spine surgery. It fits in line with other studies utilizing large databases. Big data analysis of outcomes can be used to identify risk factors for complications including death after surgery. Identifying these factors is important if we are going to improve the care we provide. Accurately quantifying the impact of these risk factors is also critical when we risk stratify and compare hospitals and physicians.”
He acknowledged certain limitations of the study, including the fact that it is a retrospective study “with a heterogeneous population of patients, surgeons, hospitals, and procedures. This adds uncertainty to the analysis at the level of the individual patient but does provide generalizability to a broader patient population.”
Dr. Patel reported having no conflicts of interest.
AT CSRS 2015
Key clinical point: Preoperative functional status is predictive of morbidity and mortality following elective cervical spine surgery.
Major finding: Patients who were dependent from a functional standpoint were significantly older and had higher rates of all comorbidities, compared with their counterparts who were partially dependent or functionally independent (P less than .001).
Data source: A retrospective analysis of 24,357 patient files from the American College of Surgeons National Surgical Quality Improvement Program (ACS NSQIP).
Disclosures: Dr. Patel reported having no conflicts of interest.

Half of hospitals penalized in 2015 by CMS quality program will pay again in 2016
More than half of hospitals penalized under the Hospital-Acquired Condition Reduction Program in fiscal year 2015 will be penalized again in FY 2016, the Centers for Medicare & Medicaid Services reported.
The program, instituted as part of the Affordable Care Act, penalizes the lowest quartile of qualifying non-Maryland hospitals with the worst risk-adjusted HAC quality measures by reducing payments related to those discharges by 1%. Maryland hospitals are currently excluded from the program because of insufficient data.

The CMS reported that in FY2016, 758 out of the 3,308 hospitals subject to the program will face the payment reduction, up from 724 in FY 2015. “Out of the 758 hospitals in the worst performing quartile in FY 2016, approximately 53.7 percent were also in the worst performing quartile in FY 2015,” the agency said in a fact sheet.*
In general, the average performance improved on two of the three measures in both years of the program: the mean Patient Safety Indicator 90 Composite Index Value (tracking pressure ulcer, iatrogenic pneumothorax, central venous catheter-related bloodstream infections, postoperative hip fractures, perioperative pulmonary embolism or deep vein thrombosis, postoperative sepsis, postoperative wound dehiscence, and accident puncture or laceration) and the mean Central Line-Associated Blood Stream Infection Standardized Infection Ratio (SIR), the agency noted. The mean Catheter-Associated Urinary Tract Infection SIR increased slightly. A fourth measure, the mean Surgical Site Infection SIR, was added as measure for fiscal 2016.
gtwachtman@frontlinemedcom.com
*CORRECTION, 1/7/2016: An earlier version of this article did not clearly state the percentage of hospitals that were also in the worst performing quartile in FY 2015.
More than half of hospitals penalized under the Hospital-Acquired Condition Reduction Program in fiscal year 2015 will be penalized again in FY 2016, the Centers for Medicare & Medicaid Services reported.
The program, instituted as part of the Affordable Care Act, penalizes the lowest quartile of qualifying non-Maryland hospitals with the worst risk-adjusted HAC quality measures by reducing payments related to those discharges by 1%. Maryland hospitals are currently excluded from the program because of insufficient data.
The CMS reported that in FY2016, 758 out of the 3,308 hospitals subject to the program will face the payment reduction, up from 724 in FY 2015. “Out of the 758 hospitals in the worst performing quartile in FY 2016, approximately 53.7 percent were also in the worst performing quartile in FY 2015,” the agency said in a fact sheet.*
In general, the average performance improved on two of the three measures in both years of the program: the mean Patient Safety Indicator 90 Composite Index Value (tracking pressure ulcer, iatrogenic pneumothorax, central venous catheter-related bloodstream infections, postoperative hip fractures, perioperative pulmonary embolism or deep vein thrombosis, postoperative sepsis, postoperative wound dehiscence, and accident puncture or laceration) and the mean Central Line-Associated Blood Stream Infection Standardized Infection Ratio (SIR), the agency noted. The mean Catheter-Associated Urinary Tract Infection SIR increased slightly. A fourth measure, the mean Surgical Site Infection SIR, was added as measure for fiscal 2016.
gtwachtman@frontlinemedcom.com
*CORRECTION, 1/7/2016: An earlier version of this article did not clearly state the percentage of hospitals that were also in the worst performing quartile in FY 2015.

Combination offers ‘important new option’ for CLL, team says

Photo courtesy of ASH
ORLANDO, FL—Idelalisib, the first-in-class PI3Kδ inhibitor, combined with bendamustine and rituximab (BR) for relapsed/refractory chronic
lymphocytic leukemia (CLL) offers “an important new option over the standard of care,” according to Andrew Zelenetz, MD, a member of the
international research team that conducted the phase 3 study of this combination.
Patients who received idelalisib plus BR experienced a much longer progression-free survival (PFS) than those who received BR alone, 23.1
months versus 11.1 months, respectively.
“And the benefit was seen across risk groups,” Dr Zelenetz said.
He pointed out that the trial was stopped early in October because of the “overwhelming benefit” of idelalisib compared to the conventional therapy arm.
Dr Zelenetz, of Memorial Sloan Kettering Cancer Center in New York, New York, presented the findings at the 2015 ASH Annual Meeting as LBA-5.
Idelalisib had already been approved by the US Food and Drug Administration for the treatment of relapsed/refractory CLL.
“Many people refer to this [idelalisib] as a B-cell receptor drug,” Dr Zelenetz said, “but it is more than that. It is involved in signaling of very key pathways in cell survival and migration.”
The investigators hoped that by combining idelalisib with BR, they would be able to improve PFS and maintain tolerable toxicity. So they conducted Study 115 to find out.
Study 115 design and population
Study 115 was a double-blind, placebo-controlled phase 3 study.
The idelalisib arm consisted of 207 patients randomized to receive bendamustine at 70 mg/m2 on days 1 and 2 every 4 weeks for 6 cycles, rituximab at 375 mg/m2 during cycle 1 and 500 mg/m2 cycles 2 through 6, and idelalisib at 150 mg twice daily until progression.
The BR arm consisted of 209 patients randomized to the same BR regimen plus placebo twice daily until progression.
Investigators stratified patients according to 17p deletion and/or TP52 mutation, IGHV mutation status, and refractory versus relapsed disease.
The primary endpoint was PFS and the secondary endpoints were overall response rate (ORR), nodal response, overall survival (OS), and complete response (CR) rate.
Patients had to have disease progression within less than 36 months from their last therapy, measurable disease, and no history of CLL transformation. They could not have progressed in less than 6 months from their last bendamustine treatment and they could not have had any prior inhibitors of BTK, PI3Kδ, or SYK.
Patient disposition and demographics
One hundred fifteen patients (56%) in the idelalisib arm are still on study, and 52% are on treatment. In the BR arm, 63 patients (30%) are still on study, and 29% are on treatment.
Patient characteristics were well balanced between the arms. Most patients (76%) were male, 58% were younger than 65 years and 42% were 65 or older. About half were Rai stage III/IV and the median number of prior regimens was 2 (range, 1–13).
The most common prior regimens in both arms were fludarabine/cyclophosphamide/rituximab, fludarabine/cyclophosphamide, and chlorambucil. Fifteen percent of patients in the idelalisib arm and 8% in the BR arm had prior BR.
A third of patients in each arm had either 17p deletion or TP53 mutation, and two-thirds had neither. Most patients did not have IGHV mutation—84% in the idelalisib group and 83% in the BR group.
Thirty-one percent of the idelalisib-treated patients and 29% of the placebo patients had refractory disease, and 69% and 71%, respectively, had relapsed disease.
Efficacy
Median PFS, as assessed by independent review committee, “was highly statistically significant,” Dr Zelenetz said, at 23.1 months for idelalisib and 11.1 for BR (P<0.0001).
In addition, all subgroups analyzed favored idelalisib—refractory or relapsed disease, mutation status, cytogenetics, gender, age, and race.
Patients with neither deletion 17p nor TP53 had a hazard ratio of 0.22 favoring the idelalisib group, and patients with either one or the other of those mutations had a hazard ratio of 0.50 favoring idelalisib.
ORR was 68% and 45% for idelalisib and placebo, respectively, with 5% in the idelalisib arm and none in the placebo arm achieving a CR.
Dr Zelenetz pointed out that the CR rate was low largely due to missing confirmatory biopsies.
Ninety-six percent of patients in the idelalisib arm experienced 50% or more reduction in lymph nodes, compared with 61% in the placebo arm.
Patients in the idelalisib arm also experienced a significant improvement in OS of P=0.008 when stratified and P=0.023 when unstratified. Median OS has not been reached in either arm.
There was no difference in survival benefit in patients with refractory disease.
Safety
All patients in the idelalisib arm and 97% in the BR arm experienced an adverse event (AE), with 93% and 76% grade 3 or higher in the idelalisib and BR arms, respectively.
Serious AEs occurred in 66% of idelalisib-treated patients and 44% of placebo patients.
Fifty-four patients (26%) in the idelalisib arm discontinued the study drug due to AEs, and 22 (11%) required a study drug dose reduction. This was compared with 28 patients (13%) discontinuing and 13 patients requiring dose reductions in the placebo arm.
The most frequent AE occurring in more than 10% of patients was neutropenia. Grade 3 or higher neutropenia occurred in 60% of idelalisib patients and 46% of placebo patients.
Most AEs were higher in the idelalisib arm compared with the BR arm, including grade 3 or higher events, such as febrile neutropenia (20%, 6%), anemia (15%, 12%), thrombocytopenia (13%, 12%), pneumonia (11%, 6%), ALT increase (11%, <1%), pyrexia (7%, 3%), diarrhea (7%, 2%), and rash (3%, 0), among others.
Serious AEs occurring in more than 2% of patients were also higher in the idelalisib arm than the BR arm, and included febrile neutropenia (18%, 5%), pneumonia (14%, 6%), pyrexia (12%, 6%), neutropenia (4%, 1%), sepsis (4%, 1%), anemia (2%, 2%), lower respiratory tract infection (2%, 2%), diarrhea (4%, <1%), and neutropenic sepsis (1%, 3%).
The remainder of the serious AEs—urinary tract infection, bronchitis, septic shock, and squamous cell carcinoma—occurred in 2% or fewer patients in either arm.
Dr Zelenetz pointed out that the safety profile is consistent with previously reported studies.
Gilead Sciences developed idelalisib and funded Study 115. ![]()
*Data in the abstract differ slightly from data presented at the meeting.
Anti-PD-1, IMiD combo immunotherapy active in heavily pretreated myeloma
ORLANDO – Partnering the PD-1 antibody pembrolizumab with pomalidomide and dexamethasone induced responses in 60% of 27 patients with heavily pretreated relapsed and/or refractory multiple myeloma in a phase II trial.
This included 1 stringent complete response, 4 very good partial responses (VGPR), and 11 partial responses (PR). Eight patients had stable disease and 3 progressed.
Further, the overall response rate was 55% (2 VGPR, 9 PR) in patients double-refractory to immunomodulatory drugs (IMiDs) and proteasome inhibitors (PIs) and 50% (1 VGPR and 5 PR) in those with high-risk cytogenetics.

“The regimen shows promising anti-myeloma activity in heavily pretreated patients” and had a “predictable and manageable side-effect profile,” Dr. Asraf Badros of University of Maryland Marlene and Stewart Greenebaum Cancer Center, Baltimore, said at the annual meeting of the American Society of Hematology.
The investigators hypothesized that blocking signaling of the programmed cell death protein 1 (PD-1) and its ligand PD-L1 with pembrolizumab (Keytruda) would activate multiple myeloma-specific cytotoxic T cells that could be further enhanced by the immunomodulator pomalidomide (Pomalyst).
The primary goal of the ongoing study is to establish the safety of the combination therapy.
In all, 33 patients received 28-day cycles of pembrolizumab 200 mg intravenous every 2 weeks plus pomalidomide 4 mg daily for 21 days and dexamethasone 40 mg weekly (20 mg for patients older than 70 years). After 24 months, responders will continue pomalidomide and dexamethasone alone until progression.
At enrollment, patients had to have relapsed and/or refractory disease after at least two lines of prior therapy including an IMiD and a PI, an ECOG performance status of less than 2, and adequate organ function.
Key exclusion criteria are an active autoimmune disease requiring systemic treatment or a history of severe autoimmune disease such as interstitial lung disease or active, non-infectious pneumonitis.
Patients received a median of three prior lines of therapy, 67% had prior autologous transplant, 89% were refractory to lenalidomide, and 70% were double-refractory to both IMiDs and PIs. The median age was 65 years (range 42-81 years), 73% were male, and 42% had high-risk deletion 17p and/or a translocation of chromosomes 14 and 16 [t(14;16)].
The median number of cycles was six and median follow-up short at 7.4 months.
The most common adverse events reported in 10% of all grades were fatigue and hypoglycemia, mostly grades 1 and 2.
The most serious adverse events in the study were pneumonia and infection, including one death due to sepsis, Dr. Badros said. Two other patients died as a result of disease progression and one because of a cardiac event.
“We reported a lot, actually, of immune-related adverse events,” he said.
In 10% of patients, the investigators noted pneumonitis, one of which was grade 3, as well as hyperthyroidism and autoimmune hepatitis. Pembrolizumab was not stopped and the pneumonitis was treated with steroids until symptoms resolved. Patients resumed the assigned doses, though one patient withdrew consent.
The pneumonitis did not appear to be associated with prior therapy and it “responded extremely quickly and well to the steroids, indicating it might be a cytokine release issue,” Dr. Badros said.
Five patients required pomalidomide dose reductions due to neutropenia in two, and one case each of rash, palpitations, and fatigue. After the septic death, antibiotic prophylaxis was started in all patients, he said.
A total of 22 patients remain on study, with 7 patients discontinuing because of disease progression.
Given the short follow-up, it is “too early to talk about progression-free and overall-survival, but the signal we are getting is quite impressive,” Dr. Badros said.
The investigators also tried to look at PD-L1 expression in bone marrow samples collected at screening and on day 1 of cycle 3. No PD-L1 expression was found on plasma cells in the first patient, about 40% expression in the second, and 100% expression in the third, which is consistent with the heterogeneity of PD-L1 expression reported previously in the literature, Dr. Badros said. PD-L1 expression on bone marrow biopsies was very hard to standardize and they are exploring various methods to assess the impact of fixation and decalcification on level of expression, he added.
Dr. Badros disclosed off-label use of pembrolizumab and no relevant conflicts of interest.
ORLANDO – Partnering the PD-1 antibody pembrolizumab with pomalidomide and dexamethasone induced responses in 60% of 27 patients with heavily pretreated relapsed and/or refractory multiple myeloma in a phase II trial.
This included 1 stringent complete response, 4 very good partial responses (VGPR), and 11 partial responses (PR). Eight patients had stable disease and 3 progressed.
Further, the overall response rate was 55% (2 VGPR, 9 PR) in patients double-refractory to immunomodulatory drugs (IMiDs) and proteasome inhibitors (PIs) and 50% (1 VGPR and 5 PR) in those with high-risk cytogenetics.
“The regimen shows promising anti-myeloma activity in heavily pretreated patients” and had a “predictable and manageable side-effect profile,” Dr. Asraf Badros of University of Maryland Marlene and Stewart Greenebaum Cancer Center, Baltimore, said at the annual meeting of the American Society of Hematology.
The investigators hypothesized that blocking signaling of the programmed cell death protein 1 (PD-1) and its ligand PD-L1 with pembrolizumab (Keytruda) would activate multiple myeloma-specific cytotoxic T cells that could be further enhanced by the immunomodulator pomalidomide (Pomalyst).
The primary goal of the ongoing study is to establish the safety of the combination therapy.
In all, 33 patients received 28-day cycles of pembrolizumab 200 mg intravenous every 2 weeks plus pomalidomide 4 mg daily for 21 days and dexamethasone 40 mg weekly (20 mg for patients older than 70 years). After 24 months, responders will continue pomalidomide and dexamethasone alone until progression.
At enrollment, patients had to have relapsed and/or refractory disease after at least two lines of prior therapy including an IMiD and a PI, an ECOG performance status of less than 2, and adequate organ function.
Key exclusion criteria are an active autoimmune disease requiring systemic treatment or a history of severe autoimmune disease such as interstitial lung disease or active, non-infectious pneumonitis.
Patients received a median of three prior lines of therapy, 67% had prior autologous transplant, 89% were refractory to lenalidomide, and 70% were double-refractory to both IMiDs and PIs. The median age was 65 years (range 42-81 years), 73% were male, and 42% had high-risk deletion 17p and/or a translocation of chromosomes 14 and 16 [t(14;16)].
The median number of cycles was six and median follow-up short at 7.4 months.
The most common adverse events reported in 10% of all grades were fatigue and hypoglycemia, mostly grades 1 and 2.
The most serious adverse events in the study were pneumonia and infection, including one death due to sepsis, Dr. Badros said. Two other patients died as a result of disease progression and one because of a cardiac event.
“We reported a lot, actually, of immune-related adverse events,” he said.
In 10% of patients, the investigators noted pneumonitis, one of which was grade 3, as well as hyperthyroidism and autoimmune hepatitis. Pembrolizumab was not stopped and the pneumonitis was treated with steroids until symptoms resolved. Patients resumed the assigned doses, though one patient withdrew consent.
The pneumonitis did not appear to be associated with prior therapy and it “responded extremely quickly and well to the steroids, indicating it might be a cytokine release issue,” Dr. Badros said.
Five patients required pomalidomide dose reductions due to neutropenia in two, and one case each of rash, palpitations, and fatigue. After the septic death, antibiotic prophylaxis was started in all patients, he said.
A total of 22 patients remain on study, with 7 patients discontinuing because of disease progression.
Given the short follow-up, it is “too early to talk about progression-free and overall-survival, but the signal we are getting is quite impressive,” Dr. Badros said.
The investigators also tried to look at PD-L1 expression in bone marrow samples collected at screening and on day 1 of cycle 3. No PD-L1 expression was found on plasma cells in the first patient, about 40% expression in the second, and 100% expression in the third, which is consistent with the heterogeneity of PD-L1 expression reported previously in the literature, Dr. Badros said. PD-L1 expression on bone marrow biopsies was very hard to standardize and they are exploring various methods to assess the impact of fixation and decalcification on level of expression, he added.
Dr. Badros disclosed off-label use of pembrolizumab and no relevant conflicts of interest.
AT ASH 2015
Key clinical point: Pembrolizumab in combination with pomalidomide and dexamethasone has shown strong clinical activity in heavily pretreated relapsed or refractory multiple myeloma.
Major finding: The overall response rate was 60% in 27 evaluable patients.
Data source: Ongoing phase II study of 33 patients with relapsed/refractory multiple myeloma.
Disclosures: Dr. Badros disclosed off-label use of pembrolizumab and no relevant conflicts of interest.

Study characterizes injury risk in cervical myelopathy patients
SAN DIEGO – Compared with age-matched controls, patients with cervical spondylotic myelopathy had a significantly increased incidence of falls, hip fractures, and other injuries, preliminary results from a study of Medicare data suggest.
“Cervical myelopathy is the most common cause of spinal cord dysfunction in patients over age 55,” Dr. Daniel J. Blizzard said at the annual meeting of the Cervical Spine Research Society. “In general, it’s cord compression secondary to their ossification of posterior latitudinal ligament, congenital stenosis, and/or degenerative changes to vertebral bodies, discs, and facet joints. These create an upper motor neuron lesion, which causes gait disturbances, imbalance, loss of manual dexterity and coordination, and sensory changes and weakness.”

Dr. Blizzard, an orthopedic surgery resident at Duke University, Durham, N.C., noted that myelopathy gait is the most common presenting symptom in cervical spondylotic myelopathy (CSM), affecting almost 30% of patients. “It’s present in three-quarters of CSM patients undergoing decompression,” he said. “Cord compression can lead to impaired proprioception, spasticity, and stiffness. We know that this gait dysfunction is multifactorial. Imbalance and unsteadiness lead to compensatory broad-based arrhythmic shuffling and clumsy-appearing gait to maintain balance.”
An estimated one-third of people over age 65 fall at least once per year and this may lead to significant morbidity, including institutionalization, loss of independence, and mortality, Dr. Blizzard continued. “We know that gait dysfunction is a significant risk factor for falls,” he said. “This can be CSM, lower extremity osteoarthritis, deconditioning, or poor vision. The primary cause of a gait disturbance may not be accurately identified, especially if a more obvious cause is already known.”
The researchers set out to determine the fall and injury risk of patients with CSM, “with the goal of guiding attention to what we thought might be a potentially underestimated disease with regard to morbidity, and to provide data to consider when determining the type and timing of CSM treatment,” Dr. Blizzard said. They used the PearlDiver database to search the Medicare sample during 2005-2012, and used ICD-9 codes to identify patients with CSM. They also identified a subpopulation of CSM patients that underwent decompression, “not for the purpose of comparing the effect of decompression, but to identify a population with more severe disease,” he explained. They included a control population with no CSM, vestibular disease, or Parkinson’s disease.
Dr. Blizzard reported preliminary results from a total of 601,390 patients with CSM, 77,346 patients with CSM plus decompression, and 49,550,651 controls. They looked at the incidence of falls, head injuries, skull fractures, subdural hematomas, and other orthopedic injuries including fractures of the hip, femur, leg, ankle, pelvis, and lower extremity sprains. The researchers found that when compared with controls, patients with CSM had a statistically significant increased incidence of all injuries, including hip fracture (risk ratio, 2.62), head injury (RR, 7.34), and fall (RR, 8.08). The incidence of hip fracture, head injury, and fall was also increased among the subset of CSM patients who had undergone decompression (RR of 2.25, 8.34, and 9.62, respectively).
Dr. Blizzard acknowledged certain limitations of the study, including its retrospective design. “Statistical and clinical significance are two very different things,” he emphasized. “When we get numbers this big, everything will become statistically significant, but whether things are clinically significant is up to interpretation. The presence of disease and complications is contingent upon proper coding and recognition by providers. We have no measures of severity, extent, or chronicity of disease.”
Despite such limitations, he concluded that the findings suggest that impact of CSM on morbidity “is probably underestimated by many. Symptoms of CSM can be insidious or masked. Patients can often attribute these to normal effects of aging, and often primary care physicians will not recognize these initial symptoms, especially if there is another confounding presenting complaint.”
Conservative interventions for CSM patients, he said, include gait training/physical therapy, assistive aids, hip pads, exercise programs with balance training, and an assessment of hazards in the home environment. From a surgical standpoint, the findings raise the possibility that surgeons may want to “be more aggressive” in their decision to operate on patients with CSM. “This dataset is in no way able to address this question, but I think it provides interesting information regarding the true morbidity of the disease,” Dr. Blizzard said. “There is clear risk and morbidity with cervical compression. Studies show improvement in patients regardless of age, severity, and chronicity.”
Dr. Blizzard reported having no financial disclosures.
SAN DIEGO – Compared with age-matched controls, patients with cervical spondylotic myelopathy had a significantly increased incidence of falls, hip fractures, and other injuries, preliminary results from a study of Medicare data suggest.
“Cervical myelopathy is the most common cause of spinal cord dysfunction in patients over age 55,” Dr. Daniel J. Blizzard said at the annual meeting of the Cervical Spine Research Society. “In general, it’s cord compression secondary to their ossification of posterior latitudinal ligament, congenital stenosis, and/or degenerative changes to vertebral bodies, discs, and facet joints. These create an upper motor neuron lesion, which causes gait disturbances, imbalance, loss of manual dexterity and coordination, and sensory changes and weakness.”
Dr. Blizzard, an orthopedic surgery resident at Duke University, Durham, N.C., noted that myelopathy gait is the most common presenting symptom in cervical spondylotic myelopathy (CSM), affecting almost 30% of patients. “It’s present in three-quarters of CSM patients undergoing decompression,” he said. “Cord compression can lead to impaired proprioception, spasticity, and stiffness. We know that this gait dysfunction is multifactorial. Imbalance and unsteadiness lead to compensatory broad-based arrhythmic shuffling and clumsy-appearing gait to maintain balance.”
An estimated one-third of people over age 65 fall at least once per year and this may lead to significant morbidity, including institutionalization, loss of independence, and mortality, Dr. Blizzard continued. “We know that gait dysfunction is a significant risk factor for falls,” he said. “This can be CSM, lower extremity osteoarthritis, deconditioning, or poor vision. The primary cause of a gait disturbance may not be accurately identified, especially if a more obvious cause is already known.”
The researchers set out to determine the fall and injury risk of patients with CSM, “with the goal of guiding attention to what we thought might be a potentially underestimated disease with regard to morbidity, and to provide data to consider when determining the type and timing of CSM treatment,” Dr. Blizzard said. They used the PearlDiver database to search the Medicare sample during 2005-2012, and used ICD-9 codes to identify patients with CSM. They also identified a subpopulation of CSM patients that underwent decompression, “not for the purpose of comparing the effect of decompression, but to identify a population with more severe disease,” he explained. They included a control population with no CSM, vestibular disease, or Parkinson’s disease.
Dr. Blizzard reported preliminary results from a total of 601,390 patients with CSM, 77,346 patients with CSM plus decompression, and 49,550,651 controls. They looked at the incidence of falls, head injuries, skull fractures, subdural hematomas, and other orthopedic injuries including fractures of the hip, femur, leg, ankle, pelvis, and lower extremity sprains. The researchers found that when compared with controls, patients with CSM had a statistically significant increased incidence of all injuries, including hip fracture (risk ratio, 2.62), head injury (RR, 7.34), and fall (RR, 8.08). The incidence of hip fracture, head injury, and fall was also increased among the subset of CSM patients who had undergone decompression (RR of 2.25, 8.34, and 9.62, respectively).
Dr. Blizzard acknowledged certain limitations of the study, including its retrospective design. “Statistical and clinical significance are two very different things,” he emphasized. “When we get numbers this big, everything will become statistically significant, but whether things are clinically significant is up to interpretation. The presence of disease and complications is contingent upon proper coding and recognition by providers. We have no measures of severity, extent, or chronicity of disease.”
Despite such limitations, he concluded that the findings suggest that impact of CSM on morbidity “is probably underestimated by many. Symptoms of CSM can be insidious or masked. Patients can often attribute these to normal effects of aging, and often primary care physicians will not recognize these initial symptoms, especially if there is another confounding presenting complaint.”
Conservative interventions for CSM patients, he said, include gait training/physical therapy, assistive aids, hip pads, exercise programs with balance training, and an assessment of hazards in the home environment. From a surgical standpoint, the findings raise the possibility that surgeons may want to “be more aggressive” in their decision to operate on patients with CSM. “This dataset is in no way able to address this question, but I think it provides interesting information regarding the true morbidity of the disease,” Dr. Blizzard said. “There is clear risk and morbidity with cervical compression. Studies show improvement in patients regardless of age, severity, and chronicity.”
Dr. Blizzard reported having no financial disclosures.
AT CSRS 2015
Key clinical point: Medicare patients with cervical spondylotic myelopathy face an increased risk of falls and fractures.
Major finding: Compared with controls, patients with CSM had a statistically significant increased incidence of all injuries, including hip fracture (risk ratio, 2.62), head injury (RR, 7.34), and fall (RR, 8.08).
Data source: A retrospective analysis of Medicare patients during 2005-2012, including 601,390 patients with CSM, 77,346 patients with CSM plus decompression, and 49,550,651 controls.
Disclosures: Dr. Blizzard reported having no financial disclosures.

Group recommends adding rituximab to ALL therapy

Photo courtesy of ASH
ORLANDO, FL—Investigators from the Group for Research on Adult Lymphoblastic Leukemia (GRAALL) recommend integrating rituximab into the treatment of adult patients with acute lymphoblastic leukemia (ALL) based on results of the GRAALL-R 2005 study.
Patients who received rituximab as part of their therapy had a median event-free survival (EFS) at 2 years of 65%, compared to 52% for patients who did not receive rituximab. After censoring for stem cell transplant in first complete remission, the benefit was even greater.
Sébastien Maury, MD, PhD, of Hȏpital Hénri Mondor in Creteil, France, presented the results during the plenary session of the 2015 ASH Annual Meeting as abstract 1.
Dr Maury said GRAALL-R 2005 is the first phase 3, randomized study to evaluate the role of rituximab in the treatment of B-cell precursor (BCP) ALL.
Only one previous study, he said, suggested a potential benefit of adding rituximab compared to historic controls of chemotherapy alone.
He explained that, because the CD20 antigen is expressed at diagnosis in 30% to 40% of patients with BCP-ALL, investigators undertook to evaluate whether adding the anti-CD20 monoclonal antibody rituximab to the ALL treatment regimen could be beneficial for newly diagnosed Ph-negative BCP-ALL patients.
Study design & population
Investigators randomized 105 patients to receive the pediatric-inspired GRAALL protocol plus rituximab and 104 patients to the same regimen without rituximab.
Patients had to have 20% or more CD20-positive leukemic blasts.
Patients in the rituximab arm received 375 mg/m2 during induction on days 1 and 7, during salvage reinduction (if needed) on days 1 and 7, during consolidation blocks (6 infusions), during late intensification on days 1 and 7, and during the first year of maintenance (6 infusions), for a total of 16 to 18 infusions.
“In this trial, allogeneic transplantation was offered in first remission to high-risk patients who were those patients with at least one of these baseline or response-related criteria,” Dr Maury said.
Investigators defined high-risk at baseline as having a white blood cell count of 30 x 109/L or higher, CNS involvement, CD10-negative disease, or unfavorable cytogenetics.
And response-related criteria for high-risk disease included poor peripheral blast clearance after the 1-week steroid pre-phase, poor bone marrow blast clearance after the first week of chemotherapy, or no hematologic complete response after the first induction course.
Patient characteristics were well balanced between the arms, with a median age for the entire group of 40.2 years. Rituximab-treated patients had 61% CD20-positive blasts, and the no-rituximab arm had 69%.
More patients in the rituximab arm had a better ECOG performance status, although the difference was not significant. Thirteen percent were assessed as being grade 2 or higher in the rituximab arm, compared with 18% in the no-rituximab arm (P=0.06).
“The proportion of high-risk patients was comparable in both arms,” Dr Maury said, “representing around two-thirds of the study population.”
In the rituximab arm, 70% were considered high-risk, compared with 64% in the no-rituximab arm (P=0.46).
“However, despite this,” he said, “a significantly higher proportion of patients received allo transplant at first remission in the rituximab arm, 34% versus 20%. And since this was not explained by a different proportion of high-risk patients, this was probably due to differences in donor availability.”
Dr Maury noted that compliance to treatment was “quite good.”
Efficacy
The median follow-up was 30 months, and the primary endpoint was EFS.
The EFS rate for rituximab-treated patients at 2 years was 65%, compared with 52% for the non-rituximab patients (hazard ratio=0.66, P=0.038).
EFS was also significantly better with rituximab when patients were censored at allogeneic transplant, with a hazard ratio of 0.59 and a significance of 0.021.
However, there were no significant differences in early complete response rates, minimal residual disease (MRD) after induction, and MRD after consolidation.
“[O]nly 40% of patients could be centrally analyzed [for MRD],” Dr Maury explained, “which may be the reason why we could not detect any impact of rituximab on MRD.”
The cumulative incidence of relapse at 2 years was 18% in the rituximab arm and 32% in the no-rituximab arm (hazard ratio=0.52, P=0.017). And after censoring for stem cell transplant in first complete remission, the hazard ratio was 0.49 in favor of rituximab (P=0.018).
Overall survival (OS) was not significantly different between the arms. Rituximab-treated patients had an OS rate of 71%, compared with 64% in the no-rituximab arm (P=0.095).
“However, this difference became significant when censoring patients at time of allo-transplant,” Dr Maury said.
There was a 12% cumulative incidence of death in first complete remission at 2 years in each arm.
Investigators performed multivariate analysis and found that treatment with rituximab (P=0.020), age (P=0.022), white blood cell count of 30 x 109/L or higher (P=0.005), and CNS involvement all significantly impacted EFS.
When they introduced stem cell transplant in first remission as a covariable, the same factors remained significant. Allogeneic stem cell transplant in first remission did not make a significant difference on EFS (P=0.62).
Safety
One hundred twenty-four patients reported 246 severe adverse events, the most frequent of which was infection—71 in the rituximab arm and 55 in the no-rituximab arm, a difference that was not significant (P=0.16).
Severe allergic events were significantly different between the arms, with 2 severe allergic events reported in the rituximab arm and 14 in the no-rituximab arm (P=0.002). Of these 16 events, all but one were due to asparaginase.
“We believe that this may reflect the protective effect of rituximab that might inhibit B-cell protection of antibodies against asparaginase,” Dr Maury said, although the investigators did not actually measure the antibodies.
Severe lab abnormalities, neurologic and pulmonary events, coagulopathy, cardiologic and gastrointestinal events were not significantly different between the arms.
Dr Maury emphasized that the addition of rituximab to standard intensive chemotherapy is well tolerated, significantly improves EFS, and prolongs OS in patients not receiving allogeneic transplant in first remission.
While the optimal dose schedule of rituximab still remains to be determined, the GRAALL investigators believe that “the addition of rituximab should be the new standard of care for these patients,” Dr Maury declared. ![]()
FDA approves treatment for chemotherapy ODs, life-threatening toxicities
Uridine triacetate, a pyrimidine analogue, has been approved for the emergency treatment of fluorouracil or capecitabine overdoses in adults and children, and for patients who develop “certain severe or life-threatening toxicities within 4 days of receiving” these treatments, the Food and Drug Administration announced on Dec. 11.

“Today’s approval is a first-of-its-kind therapy that can potentially save lives following overdose or life-threatening toxicity from these chemotherapy agents,” Dr. Richard Pazdur, director of the office of hematology and oncology products in the FDA’s Center for Drug Evaluation and Research, said in the FDA statement. It will be marketed as Vistogard by Wellstat Therapeutics.
Uridine comes in an oral granule formulation that can be mixed into soft foods or, when necessary, administered via a nasogastric or gastrostomy tube, the prescribing information states. The indication is for use after an overdose “regardless of the presence of symptoms,” and for treating “early-onset, severe, or life-threatening toxicity affecting the cardiac or central nervous system, and/or early-onset, unusually severe adverse reactions (e.g., gastrointestinal toxicity and/or neutropenia) within 96 hours following the end of fluorouracil or capecitabine administration,” according to the prescribing information.
Uridine blocks cell damage and cell death caused by fluorouracil chemotherapy, according to the statement, which adds that it is up to the patient’s health care provider to “determine when he or she should return to the prescribed chemotherapy after treatment with Vistogard.”
Uridine was evaluated in two studies of 135 adults and children with cancer, treated with uridine for a fluorouracil or capecitabine overdose, or for early-onset, unusually severe or life-threatening toxicities within 96 hours after receiving fluorouracil (not because of an overdose). Among those treated for an overdose, 97% were alive 30 days after treatment, and among those treated for early-onset severe or life-threatening toxicity, 89% were alive 30 days after treatment. In addition, 33% of the patients resumed chemotherapy within 30 days, according to the FDA statement. Diarrhea, vomiting, and nausea were the most common adverse events associated with treatment.
Uridine was granted orphan drug, priority review, and fast track designations.
Uridine triacetate, a pyrimidine analogue, has been approved for the emergency treatment of fluorouracil or capecitabine overdoses in adults and children, and for patients who develop “certain severe or life-threatening toxicities within 4 days of receiving” these treatments, the Food and Drug Administration announced on Dec. 11.
“Today’s approval is a first-of-its-kind therapy that can potentially save lives following overdose or life-threatening toxicity from these chemotherapy agents,” Dr. Richard Pazdur, director of the office of hematology and oncology products in the FDA’s Center for Drug Evaluation and Research, said in the FDA statement. It will be marketed as Vistogard by Wellstat Therapeutics.
Uridine comes in an oral granule formulation that can be mixed into soft foods or, when necessary, administered via a nasogastric or gastrostomy tube, the prescribing information states. The indication is for use after an overdose “regardless of the presence of symptoms,” and for treating “early-onset, severe, or life-threatening toxicity affecting the cardiac or central nervous system, and/or early-onset, unusually severe adverse reactions (e.g., gastrointestinal toxicity and/or neutropenia) within 96 hours following the end of fluorouracil or capecitabine administration,” according to the prescribing information.
Uridine blocks cell damage and cell death caused by fluorouracil chemotherapy, according to the statement, which adds that it is up to the patient’s health care provider to “determine when he or she should return to the prescribed chemotherapy after treatment with Vistogard.”
Uridine was evaluated in two studies of 135 adults and children with cancer, treated with uridine for a fluorouracil or capecitabine overdose, or for early-onset, unusually severe or life-threatening toxicities within 96 hours after receiving fluorouracil (not because of an overdose). Among those treated for an overdose, 97% were alive 30 days after treatment, and among those treated for early-onset severe or life-threatening toxicity, 89% were alive 30 days after treatment. In addition, 33% of the patients resumed chemotherapy within 30 days, according to the FDA statement. Diarrhea, vomiting, and nausea were the most common adverse events associated with treatment.
Uridine was granted orphan drug, priority review, and fast track designations.
Oral contraception and medical liability
Question: Oral contraceptives are prescription drugs sold with highly specific manufacturer instructions on how and when to take them, because the sequence of pill ingestion is critical to their anovulatory efficacy.
Suppose a manufacturing mishap resulted in improper labeling and sequencing of the pills, and some women, relying on the product, became pregnant. In a lawsuit against the manufacturer, which of the following choices is best?
A. This is a case of product liability.
B. Affected plaintiffs should consider filing a class-action lawsuit.
C. Mothers can sue for wrongful pregnancy.
D. Children can sue for wrongful life.
E. All are possible legal causes of action.
Answer: E. This hypothetical is adapted from a recent report that the use of mispackaged oral contraceptives had resulted in more than 100 women becoming pregnant. The prescription drugs, available in blister packs, were erroneously sequenced such that the daily use of active or inactive drug was asynchronous with the woman’s ovulatory cycle, thus foiling the drug’s pregnancy prevention efficacy.
Typically, each packet of oral contraceptives comes with 28 days’ worth of color-coded pills, with the first 21 containing the active principle to inhibit ovulation, followed by 7 inert pills. Each monthly pack begins with the same strict pill sequence.
In 2011, the manufacturer of several brands of oral contraceptives recalled half a million such packs when it was discovered that some of them had the pill sequence reversed. Foreseeably, this debacle resulted in a number of unplanned pregnancies – and live births. Legal action soon followed.
▶ Product liability: A simple negligence lawsuit would typically cover a situation in which a wrongdoer has breached the requisite standard of care, as appears to be the case here. However, when a product such as a prescription drug leads to “harm,” an injured party, using the law of product liability, can sue the manufacturer that had placed it into the stream of commerce. This allows the plaintiff to rely on legal theories other than negligence, including breach of warranty and strict liability.
Under the latter legal theory, there is no need to prove fault or contractual breach, and the significant part of the complaint is whether the product is both defective and unreasonably dangerous. “Defective” is usually defined as product quality that is less than what a reasonable consumer expects, and “unreasonably dangerous” is a conclusion that the risks that result from its condition outweigh the product’s advantages.
Although the medication itself in this case is not defective or unreasonably dangerous, the assembly and labeling fiasco would suffice to keep the lawsuit within the product liability category. According to Section 102(2) of the Uniform Product Liability Act, product liability includes “all claims or action brought for personal injury, death, or property damage caused by the manufacture, design, formula, preparation, assembly, installation, testing, warnings, instructions, marketing, packaging, or labeling of any product.”
▶ Class action: A class action lawsuit, governed by Rule 23 of the Federal Rules of Civil Procedure, describes a legal cause of action where a representative plaintiff asserts claims on behalf of a large class of similarly injured members, who then give up their rights to pursue an individual lawsuit. It confers several advantages upon the plaintiffs, including the potential of higher damages.
However, four prerequisites must be present before a lawsuit can be certified a class action: numerosity, commonality, typicality, and adequacy.
Although there is the possibility of going forward with a class action suit, a federal judge in Georgia refused to certify class action status in the 2011 recall case. The judge stated that only 53 of the half-million recalled blister packs had the pills arranged in reverse order, and each woman’s case should be individually adjudicated given the controlling laws in her state, the need to prove use of the product, and whether she became pregnant and carried the pregnancy to term.
▶ Wrongful life: Strictly speaking, tort issues in this case can be divided into two categories: wrongful pregnancy (sometimes confusingly referred to as wrongful birth) alleged by the mother, and wrongful life by the child. Unfortunately, these claims are frequently lumped together under the rubric of wrongful life.
The women affected by this mix-up are reportedly seeking damages for lost income, medical costs, and, in some cases, the cost of raising their children, including the cost of college. However, the common law has traditionally barred a wrongful life action, although state laws have evolved over the years. So, court decisions and statutes in each state should be carefully consulted for any individual case.
The prime reason for disallowing a wrongful life action is that life, even if imperfect, is always preferable to non-life. Besides, it will be impossible to assess the quantum of damages, because this necessarily requires placing a monetary worth on human existence.
The seminal case is the 1967 New Jersey decision of Gleitman v. Cosgrove (227 A.2d 689 [N.J. 1967]), but the state’s position has since changed. In Berman v. Allan (404 A.2d 8 [N.J. 1979]), the court allowed damages for maternal emotional distress, though not for medical and other expenses of raising the child.
Overall, the law of wrongful life appears to be increasingly willing to award damages to the mother for the physical, emotional, and financial costs of pregnancy and delivery, but not the cost associated with the normal rearing of a healthy child.
The legal situation is quite different for a lawsuit filed by the child, who in essence is arguing that he/she should not have been born at all. Courts continue to refuse a claim brought by a healthy infant for wrongful life, adopting the reasoning in Berman that the infant has not suffered any damage cognizable at law by being brought into existence. Even an infant with birth disabilities will not prevail in the majority of jurisdictions, with California being a notable exception.
Dr. Tan is emeritus professor of medicine and former adjunct professor of law at the University of Hawaii, and currently directs the St. Francis International Center for Healthcare Ethics in Honolulu. This article is meant to be educational and does not constitute medical, ethical, or legal advice. Some of the articles in this series are adapted from the author’s 2006 book, “Medical Malpractice: Understanding the Law, Managing the Risk,” and his 2012 Halsbury treatise, “Medical Negligence and Professional Misconduct.” For additional information, readers may contact the author at siang@hawaii.edu.