User login
Drug can fight adenovirus in HSCT recipients
Image by Yale Rosen
NEW ORLEANS—Interim results of a phase 3 trial suggest brincidofovir can treat adenovirus (AdV) infection in recipients of allogeneic hematopoietic stem cell transplant (HSCT).
Both pediatric and adult patients experienced a decline in AdV viral load after brincidofovir treatment, but pediatric patients were more likely to respond.
Overall survival rates were better for patients who had a rapid response and were therefore better among pediatric patients than adults.
Investigators said the adverse events (AEs) in this study were consistent with the known safety profile of brincidofovir.
Michael Grimley, MD, of Cincinnati Children’s Hospital in Ohio, and his colleagues presented these results at IDWeek 2016 (abstract 2339). The research was supported by Chimerix, the company developing brincidofovir.
This trial, known as AdVise, was designed to evaluate brincidofovir for the treatment of AdV infection in pediatric and adult patients divided into 3 cohorts:
- Cohort A consists of allogeneic HSCT recipients with asymptomatic or limited AdV infection
- Cohort B consists of allogeneic HSCT recipients with disseminated AdV disease
- Cohort C consists of autologous HSCT recipients, solid organ transplant recipients, and other immunocompromised patients.
All patients were assigned to 12 weeks of oral brincidofovir, administered twice weekly. An additional 12 weeks of treatment was allowed in patients with ongoing or recurrent infection. After completing treatment, all patients were followed until week 36.
Interim analysis
The investigators examined outcomes at 24 weeks after the first brincidofovir dose (12 weeks after prescribed dosing duration) in 158 patients, including:
- Cohort A—23 adults and 43 pediatric patients
- Cohort B—35 adults and 57 pediatric patients.
The investigators noted that many of the patients did not complete the study. The team said this is a reflection of the significant mortality risk of AdV because most of these patients died before they could finish.
Sixty-five percent of adults and 33% of children in Cohort A did not complete the study. The same was true for 71% of adults and 49% of children in Cohort B.
Mortality
The study’s primary efficacy endpoint is all-cause mortality at day 60 after the first brincidofovir dose in allogeneic HSCT recipients with disseminated AdV disease (Cohort B). All-cause mortality at day 60 in this cohort was 19% in pediatric patients and 43% in adults.
In Cohorts A and B, all-cause mortality at 24 weeks was lower in children than adults.
At 24 weeks, pediatric all-cause mortality was 33% in Cohort A and 42% in Cohort B. Adult all-cause mortality was 48% in Cohort A and 71% in Cohort B.
AdV-related mortality at 24 weeks in pediatric patients was 9% in Cohort A and 14% in Cohort B. AdV-related mortality in adults was 4% in Cohort A and 46% in Cohort B.
Declines in viremia
In Cohort A, 61% of patients achieved undetectable viremia at the end of treatment—43% of adults and 70% of children.
In Cohort B, 49% of patients achieved undetectable viremia at the end of treatment—29% of adults and 63% of children.
The median time to undetectable AdV viremia was 43 days (range, 8 to non-estimable) for adults in Cohort A, 14 days (range, 5 to 23) for children in Cohort A, non-estimable (range, 29 days to non-estimable) for adults in Cohort B, and 22 days (range, 15 to 36) for children in Cohort B.
Link between response and survival
The investigators conducted post-hoc analyses to assess the correlation between rapid virologic response to brincidofovir and time to subsequent mortality.
The team compared patients who responded to treatment—defined as achieving a ≥ 2-log10 copies/mL decline, undetectable AdV viremia at week 4, or undetectable AdV viremia at week 6—with non-responders.
Fifty percent of adults and 84% of children who were still alive at week 4 had achieved a ≥ 2 log decline or undetectable AdV viremia at that time.
This type of response was associated with improved survival at week 24. In adults, the mortality rate was 46% in responders and 85% in non-responders (P=0.03). In pediatric patients, the mortality rate was 25% in responders and 71% in non-responders (P=0.01).
In patients who were alive at week 6, 42% of adults and 68% of children achieved undetectable AdV viremia by that time.
This response was associated with improved survival at week 24. In adults, the mortality rate was 30% in responders and 86% in non-responders (P=0.001). In pediatric patients, the mortality rate was 18% in responders and 54% in non-responders (P=0.01).
Safety
All adults had treatment-emergent AEs, as did all pediatric patients in Cohort B and 95% of pediatric patients in Cohort A.
The most common treatment-emergent AEs were gastrointestinal (GI) events, which occurred in 70% of adults and 81% of children in Cohort A, as well as 83% of adults and 74% of children in Cohort B.
Acute graft-versus-host disease (GVHD) was also common, occurring in 22% of adults and 37% of children in Cohort A and 43% of adults and 40% of children in Cohort B. Some patients did have acute GVHD at baseline, however—22%, 26%, 34%, and 19%, respectively.
The percentage of patients with AEs leading to treatment discontinuation was 26% for adults and 28% for children in Cohort A and 31% for adults and 14% for children in Cohort B.
Overall, 20% of pediatric patients and 29% of adults discontinued brincidofovir due to AEs. GI events were cited as the most common reason—5% and 14%, respectively.
The investigators said there were no events reported that were suggestive of drug-related nephrotoxicity or myelosuppression. ![]()
Two-drug combination targets LSCs in CML
Image by Difu Wu
Targeting a pair of transcription factors might improve the treatment of chronic myeloid leukemia (CML), according to researchers.
The team found that p53 and c-MYC have “defining roles” in the survival of leukemia stem cells (LSCs) in CML.
And by targeting these transcription factors with a pair of investigational drugs, the researchers were able to kill LSCs.
The team described this work in Nature.
“This collaborative study combined proteomics, transcriptomics, and systems biology to identify a novel, precision medicine-based approach for eradicating leukemic stem cells,” said study author Tony Whetton, PhD, of the University of Manchester in the UK.
Dr Whetton and his colleagues first discovered that p53 and c-MYC are “central hubs” in a CML network of deregulated proteins. The team also found that CML cells express increased c-MYC and decreased p53 levels.
So the researchers theorized that simultaneously activating p53 and inhibiting c-MYC could be a method for treating CML.
To that end, the team tested 2 drugs—RITA (or NSC652287), which binds p53 and blocks its degradation, and CPI-203, a BET inhibitor that hinders transcription by disrupting chromatin-dependent signal transduction.
The researchers found that CPI-203 successfully downregulated c-MYC but also reduced p53, while RITA increased p53.
Treating CML CD34+ cells with RITA or CPI-203 for 72 hours reduced cell viability and induced significant apoptosis, the team said. Combining the drugs enhanced these effects.
The researchers also found evidence to suggest that c-MYC inhibition induces differentiation of CML CD34+ cells. The team said that labelling with the cell-division tracker carboxyfluorescein succinimidyl ester (CFSE) and CD34 antibody showed that, as CML cells divided in the presence of CPI-203, there was a clear and rapid loss of CD34 expression that was not seen in the presence of RITA.
The researchers did not observe any differences in the effects of RITA and CPI-203 when they were tested in CML CD34+ cells pretreated with imatinib.
Furthermore, RITA and CPI-203, either alone or in combination, had no significant effects on normal CD34+ cells when tested at lower concentrations. However, when CPI-203 was used alone at higher concentrations (2 or 5 μ M) or with RITA at the highest concentrations tested (RITA at 25 nM, CPI-203 at 5 μ M), apoptosis did occur.
In CML cells, the researchers observed “significant apoptosis” with all concentrations of CPI-203 and RITA tested.
The team also exposed CML LSCs, defined as either CFSEmax or CD34+CD38− cells, to CPI-203 and RITA as well as a pair of tyrosine kinase inhibitors.
The CFSEmax population persisted despite 5 days of treatment with dasatinib or nilotinib, but the cells were “significantly reduced” after 5 days of treatment with CPI-203 alone and in combination with RITA.
Similarly, 72 hours of treatment with RITA with CPI-203 eliminated residual CD34+CD38− cells.
The researchers also assessed LSC engraftment after treatment with RITA and/or CPI-203, as well as dasatinib. They exposed CML CD34+ cells to the drugs for 48 hours before transplanting the cells into sublethally irradiated NSG mice.
The team said dasatinib had no significant effect on NSG-repopulating CML LSCs. However, RITA, CPI-203, and the drugs in combination reduced engraftment, as indicated by decreased CD45+, CD34+, CD33+, CD11b+, CD19+ and CD14+ cells. ![]()
Tranexamic acid safely reduces need for transfusion, study suggests

Photo by Piotr Bodzek
Results of a large study suggest that tranexamic acid can reduce the need for blood transfusion without increasing the risk of thrombotic complications or death in patients undergoing coronary artery surgery.
Patients who received tranexamic acid had a lower risk of excessive bleeding, required fewer units of blood products, and had a lower risk of emergency reoperation after surgery than patients who received placebo.
In addition, patients who received tranexamic acid had no higher risk of death or thrombotic complications than those who received placebo.
Paul S. Myles, MBBS, MD, of Alfred Hospital in Melbourne, Australia, and his colleagues conducted this study and reported the results in NEJM. The study was also presented at the ANESTHESIOLOGY® 2016 annual meeting.
The study included 4631 patients who underwent surgery and had available outcomes data, 2311 who were assigned to receive tranexamic acid and 2320 who were assigned to receive placebo.
The study’s primary outcome was a composite of death and thrombotic complications (nonfatal myocardial infarction, stroke, pulmonary embolism, renal failure, or bowel infarction) within 30 days after surgery.
There was no significant difference in the primary outcome between the 2 treatment groups. Thrombotic complications/death occurred in 16.7% of patients in the tranexamic acid group and 18.1% in the placebo group (relative risk=0.92; P=0.22).
Patients who received placebo required significantly more units of blood products than patients who received tranexamic acid—7994 and 4331 units, respectively (P<0.001).
And significantly fewer patients in the tranexamic acid group than the placebo group had major hemorrhage or cardiac tamponade leading to emergency reoperations—1.4% and 2.8%, respectively (P=0.001).
However, patients in the tranexamic group had a significantly higher incidence of seizures—0.7% and 0.1%, respectively (P=0.002).
Dr Myles said that although this study was conducted in patients undergoing coronary artery surgery, the results are relevant for patients having many other types of surgery where bleeding and the need for blood transfusion may occur. ![]()
Tobacco plants used to manufacture malaria drug

Tobacco plants can be engineered to manufacture artemisinin at therapeutic levels, according research published in Molecular Plant.
The researchers noted that the majority of people who live in malaria-endemic areas cannot afford to buy artemisinin.
The drug’s high cost is due to the extraction process and the fact that it’s difficult to grow Artemisia annua, the original source of the drug, in climates where malaria is common.
Advances in synthetic biology have made it possible to produce artemisinin in yeast, but the manufacturing process is difficult to scale up.
Earlier studies showed that artemisinin can be grown in tobacco—a plant that’s relatively easy to genetically manipulate and that grows well in areas where malaria is endemic. But yields of artemisinin from those plants were low.
Now, Shashi Kumar, PhD, of the International Centre for Genetic
Engineering and Biotechnology in New Delhi, India, and his colleagues say they have overcome this problem.
In the Molecular Plant paper, Dr Kumar and his colleagues reported using a dual-transformation approach to boost the production of artemisinin in the tobacco plants.
The team first generated plants that contained transgenic chloroplasts, and the same plants were then manipulated again to insert genes into the nuclear genome as well.
Extract from the plants was shown to stop the growth of Plasmodium falciparum in vitro. Whole cells from the plant were also fed to mice infected with Plasmodium berghei, which greatly reduced levels of the parasite in the blood.
In fact, the researchers found the whole plant material was more effective in attacking the parasite than pure artemisinin, likely because encapsulation inside the plant cells protected the compound from degradation by digestive enzymes.
The researchers acknowledged that convincing people to eat tobacco plants is likely to be a hard sell. For that reason, they are now aiming to genetically engineer lettuce plants to produce artemisinin at therapeutic levels.
They said the lettuce containing the drug could be freeze dried, ground into a powder, and put into capsules for cost-effective delivery.
“Plant and animal science are increasingly coming together,” Dr Kumar said. “In the near future, you will see more drugs produced inside plants will be commercialized to reduce the drug cost.” ![]()
Emergency Test for Absorbed Radiation
In a large-scale emergency involving radiation, health care providers need to know how much radiation a survivor has absorbed to be able to determine treatment. Devices are available that detect radiation externally, for example, on skin, but no biodosimetry tests are approved to measure radiation absorbed into the body.
To help save more people in such an emergency, the HHS is sponsoring development of 2 biodosimetry tests to determine radiation absorption. The Biomedical Advanced Research and Development Authority will provide more than $22.4 million over 2 years to DxTerity Diagnostics in Los Angeles and more than $21.3 million over 4 years to MRIGloba in Kansas City, Missouri.
Related: FDA Approves Rescue Drug for Chemotherapy Overdose
Both tests, which are being designed for use in clinical health care labs, analyze blood samples to measure how genes respond to different amounts of radiation. The tests are expected to generate results in about 8 hours and to be used up to 7 days after exposure. The manufacturers estimate a potential to process 400,000 or more tests a week.
Tips for Living With Trigeminal Neuralgia
Click here to download the PDF. 
Click here to download the PDF.
Click here to download the PDF.

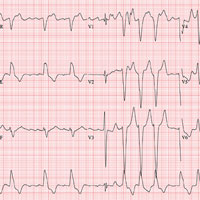
Euphoric Man, Offbeat Rhythm
ANSWER
This ECG shows atrial fibrillation with aberrancy and a rapid ventricular response, left-axis deviation, and a left bundle branch block (LBBB).
While the physical exam can identify atrial fibrillation with a rapid ventricular response, an ECG is necessary to determine left-axis deviation and LBBB.
Left-axis deviation is evidenced by an R axis of –36°.
Aberrancy is identified by a QRS duration > 120 ms with poor R wave progression in precordial leads V1 to V3 and a wide positive R wave in V5 and V6.
Of note, the 10th beat on the rhythm strip is narrow and complex and is not aberrantly conducted.

A 70-year-old man recently diagnosed with prostate cancer is undergoing preoperative assessment for prostate surgery. His cardiac history is remarkable for longstanding hypertension, which has been well-managed with diuretics and a ß-blocker. Three years ago, he developed exertional angina. He underwent stress testing, was started on isosorbide dinitrate, and has had no further episodes.
He also has chronic obstructive pulmonary disease (COPD) due to chronic smoking, and sleep apnea for which he uses a continuous positive airway pressure (CPAP) device at night.
At age 24, he had an appendectomy for a ruptured appendix. The patient’s surgical history also includes bilateral total knee replacements (seven and eight years ago) and a laparoscopic cholecystectomy (converted to an open procedure due to adhesions) three years ago.
The patient is a retired mail carrier, a widower, and one of the most active members in his retirement community. Each night, he drinks one to two glasses of Scotch, and he has smoked one pack of cigarettes every day since he was 16. He has no interest in breaking either habit.
Family history reveals a father and mother who succumbed to myocardial infarction. His older brother died of complications following surgery, and his sister died of breast cancer.
The patient’s current medication list includes hydrochlorothiazide, metoprolol, and isosorbide dinitrate. He is allergic to sulfa, with a documented anaphylactic reaction in early adulthood. During the review of systems, he mentions that his heart has been “thumping” irregularly off and on for the past couple of months, corresponding with the expiration of his metoprolol prescription. He decided to wait for his preoperative assessment to have it refilled.
Vital signs include a blood pressure of 130/84 mm Hg; pulse, 110 beats/min and irregular; and temperature, 97.8°F.
On physical exam, his weight is 234 lb and his height, 69 in. He is a pleasant, euphoric male in no distress. He wears corrective lenses and hearing aids. Pertinent physical findings include crackles in both lower lung fields that clear with coughing; an irregularly irregular heart rhythm with an occasional early systolic murmur heard at the left upper sternal border; multiple old abdominal surgical scars; and surgical scars consistent with bilateral knee replacements. He is neurologically intact.
An ECG reveals a ventricular rate of 110 beats/min; QRS duration, 144 ms; QT/QTc interval, 298/403 ms; P axis, unmeasurable; R axis, –36°; T axis, 169°. What is your interpretation?
Critical Illness Outside the ICU
This issue of the Journal of Hospital Medicine describes 2 research and quality improvement demonstration projects funded by the Gordon and Betty Moore Foundation. Early detection is central to both projects. This introductory article does not provide a global review of the now voluminous literature on rapid response teams (RRTs), sepsis detection systems, or treatment protocols. Rather, it takes a step back and reassesses just what early detection and quantification of critical illness are. It then examines the implications of early detection and its quantification.
CONCEPTUAL FRAMEWORK
We define severe illness as the presence of acute disease such that a person can no longer expect to improve without dedicated hospital treatment but which is not inevitably associated with mortality, postdischarge morbidity, or major loss of autonomy. In contrast, we define critical illness as acute disease with high a priori risk of mortality, postdischarge morbidity, and major (possibly total) loss of autonomy. We accept that the boundaries between ordinary illness, severe illness, and critical illness are blurred. The basic assumption behind all efforts at early detection is that these edges can be made sharp, and that the knowledge base required to do so can also lead to improvements in treatment protocols and patient outcomes. Further, it is assumed that at least some forms of critical illness can be prevented or mitigated by earlier detection, identification, and treatment.
Research over the last 2 decades has provided important support for this intuitive view as well as making it more nuanced. With respect to epidemiology, the big news is that sepsis is the biggest culprit, and that it accounts for a substantial proportion of all hospital deaths, including many previously considered unexpected hospital deaths due to in‐hospital deterioration.[1] With respect to treatment, a number of studies have demonstrated that crucial therapies previously considered to be intensive care unit (ICU) therapies can be initiated in the emergency department or general medicalsurgical ward.[2]
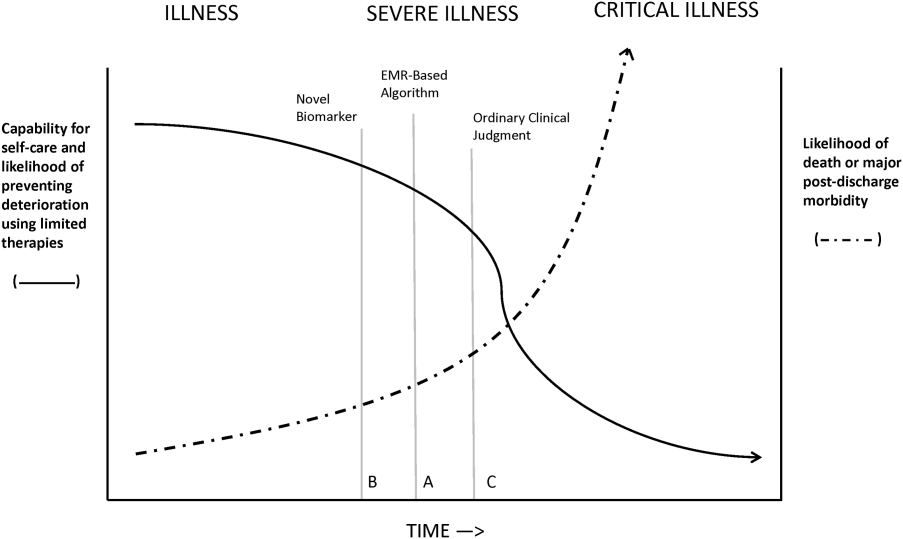
Figure 1 shows an idealized framework for illness presenting in the emergency department or general medicalsurgical wards. It illustrates the notion that a transition period exists when patients may be rescued with less intense therapy than will be required when condition progression occurs. Once a certain threshold is crossed, the risk of death or major postdischarge morbidity rises exponentially. Unaided human cognition's ability to determine where a given patient is in this continuum is dangerously variable and is highly dependent on the individuals training and experience. Consequently, as described in several of the articles in this issue as well as multiple other publications, health systems are employing comprehensive electronic medical records (EMRs) and are migrating to algorithmic approaches that combine multiple types of patient data.[3, 4] Although we are still some distance from being able to define exact boundaries between illness, severe illness, and critical illness, current EMRs permit much better definition of patient states, care processes, and short‐term outcomes.
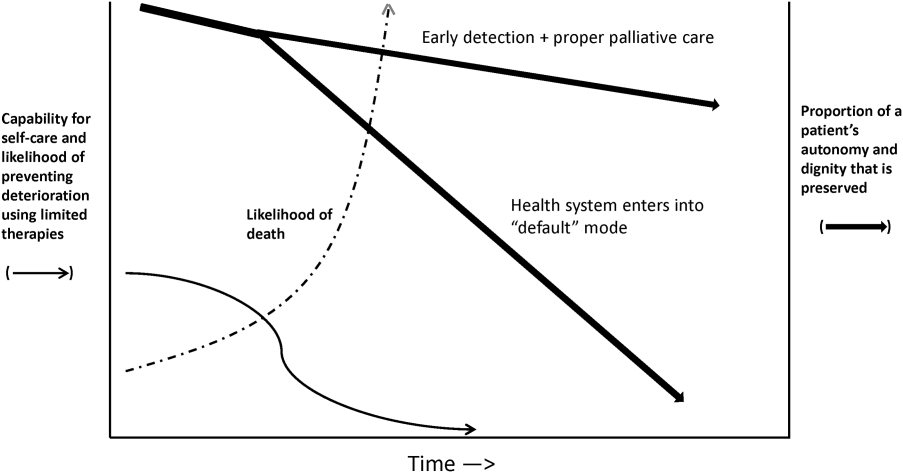
Whereas our ability to quantify many processes and short‐term outcomes is expanding rapidly, quantification of the possible benefit of early detection is complicated by the fact that, even in the best of circumstances, not all patients can be rescued. For some patients, rescue may be temporary, raising the prospect of repeated episodes of critical illness and prolonged intensive care without any hope of leaving the hospital. Figure 2 shows that, for these patients, the problem is no longer simply one of preventing death and preserving function but, rather, preserving autonomy and dignity. In this context, early detection means earlier specification of patient preferences.[5, 6]
JUST WHAT CONSTITUTES EARLY DETECTION (AND HOW DO WE QUANTIFY IT)?
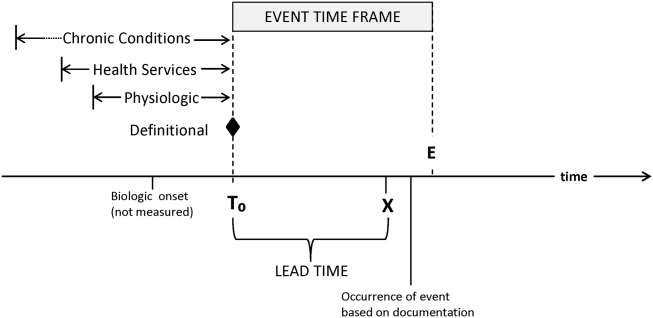
RRTs arose as the result of a number of studies showing thatin retrospectin‐hospital deteriorations should not have been unexpected. Given comprehensive inpatient EMRs, it is now possible to develop more rigorous definitions. A minimum set of parameters that one would need to specify for proper quantification of early detection is shown on Figure 3. The first is specifying a T0, that is, the moment when a prediction regarding event X (which needs to be defined) is issued. This is different from the (currently unmeasurable) biologic onset of illness as well as the first documented indication that critical illness was present. Further, it is important to be explicit about the event time frame (the time period during which a predicted event is expected to occur): we are predicting that X will occur within E hours of the T0. The time frame between the T0 and X, which we are referring to as lead time, is clinically very important, as it represents the time period during which the response arm (eg, RRT intervention) is to be instituted. Statistical approaches can be used to estimate it, but once an early detection system is in place, it can be quantified. Figure 3 is not restricted to electronic systems; all components shown can be and are used by unaided human cognition.
It is essential to specify what data are used to generate probability estimates as well as the time frames used, which we refer to as the look‐back time frames. Several types of data could be employed, with some data elements (eg, age or gender) being discrete data with a 1:1 fixed correspondence between the patient and the data. Other data have a many‐to‐1 relationship, and an exact look‐back time frame must be specified for each data type. For example, it seems reasonable to specify a short (1224 hours) look‐back period for some types of data (eg, vital signs, lactate, admission diagnosis or chief complaint), an intermediate time period (13 days) for information on the current encounter, and a longer (months to years) time period for preexisting illness or comorbidity burden.
Because many events are rare, traditional measures used to assess model performance, such as the area under the receiver operator characteristic curve (C statistic), are not as helpful.[7] Consequently, much more emphasis needs to be given to 2 key metrics: number needed to evaluate (or workup to detection ratio) and threshold‐specific sensitivity (ability of the alert to detect X at a given threshold). With these, one can answer 3 questions that will be asked by the physicians and nurses who are not likely to be researchers, and who will have little interest in the statistics: How many patients do I need to work up each day? How many patients will I need to work up for each possible outcome identified? For this amount of work, how many of the possible outcomes will we catch?
Data availability for the study of severe and critical illness continues to expand. Practically, this means that future research will require more nuanced ontologies for the classification of physiologic derangement. Current approaches to severity scoring (collapsing data into composite scores) need to be replaced by dynamic approaches that consider differential effects on organ systems as well as what can be measured. Severity scoring will also need to incorporate the rate of change of a score (or probability derived from a score) in predicting the occurrence of an event of interest as well as judging response to treatment. Thus, instead of at time of ICU admission, the patient had a severity score of 76, we may have although this patient's severity score at the time of admission was decreasing by 4 points per hour per 10 mL/kg fluid given, the probability for respiratory instability was increasing by 2.3% per hour given 3 L/min supplemental oxygen. This approach is concordant with work done in other clinical settings (eg, in addition to an absolute value of maximal negative inspiratory pressure or vital capacity, the rate of deterioration of neuromuscular weakness in Guillain‐Barr syndrome is also important in predicting respiratory failure[8]).
Electronic data also could permit better definition of patient preferences regarding escalation of care. At present, available electronic data are limited (primarily, orders such as do not resuscitate).[9] However, this EMR domain is gradually expanding.[10, 11] Entities such as the National Institutes of Health could develop sophisticated and rapid questionnaires around patient preferences that are similar to those developed for the Patient Reported Outcomes Measurement Information System.[12] Such tools could have a significant effect on our ability to quantify the benefits of early detection as it relates to a patient's preferences (including better delineation of what treatments they would and would not want).
ACTIVATING A RESPONSE ARM
Early identification, antibiotic administration, fluid resuscitation, and source control are now widely felt to constitute low‐hanging fruit for decreasing morbidity and mortality in severe sepsis. All these measures are included in quality improvement programs and sepsis bundles.[13, 14, 15] However, before early interventions can be instituted, sepsis must at least be suspected, hence the need for early detection. The situation with respect to patient deterioration (for reasons other than sepsis) in general medical surgical wards is less clear‐cut. Reasons for deterioration are much more heterogenous and, consequently, early detection is likely necessary but not sufficient for outcomes improvement.
The 2 projects described in this issue describe nonspecific (indicating elevated risk but not specifying what led to the elevation of risk) and sepsis‐specific alerting systems. In the case of the nonspecific system, detection may not lead to an immediate deployment of a response arm. Instead, a secondary evaluation process must be triggered first. Following this evaluation component, a response arm may or may not be required. In contrast, the sepsis‐specific project essentially transforms the general medicalsurgical ward into a screening system. This screening system then also triggers specific bundle components.
Neither of these systems relies on unaided human cognition. In the case of the nonspecific system, a complex equation generates a probability that is displayed in the EMR, with protocols specifying what actions are to be taken when that probability exceeds a prespecified threshold. With respect to the sepsis screening system, clinicians are supported by EMR alerts as well as protocols that increase nursing autonomy when sepsis is suspected.
The distinction between nonspecific (eg, acute respiratory failure or hemodynamic deterioration) and specific (eg, severe sepsis) alerting systems is likely to disappear as advances in the field occur. For example, incorporation of natural language processing would permit inclusion of semantic data, which could be processed so as to prebucket an alert into one that not just gave a probability, but also a likely cause for the elevated probability.
In addition, both types of systems suffer from the limitation of working off a limited database because, in general, current textbooks and training programs primary focus remains that of treatment of full‐blown clinical syndromes. For example, little is known about how one should manage patients with intermediate lactate values, despite evidence showing that a significant percentage of patients who die from sepsis will initially have such values, with 1 study showing 63% as many deaths with initial lactate of 2.5 to 4.0 mmol/L as occurred with an initial lactate of >4.0 mmol/L.[16] Lastly, as is discussed below, both systems will encounter similar problems when it comes to quantifying benefit.
QUANTIFYING BENEFIT
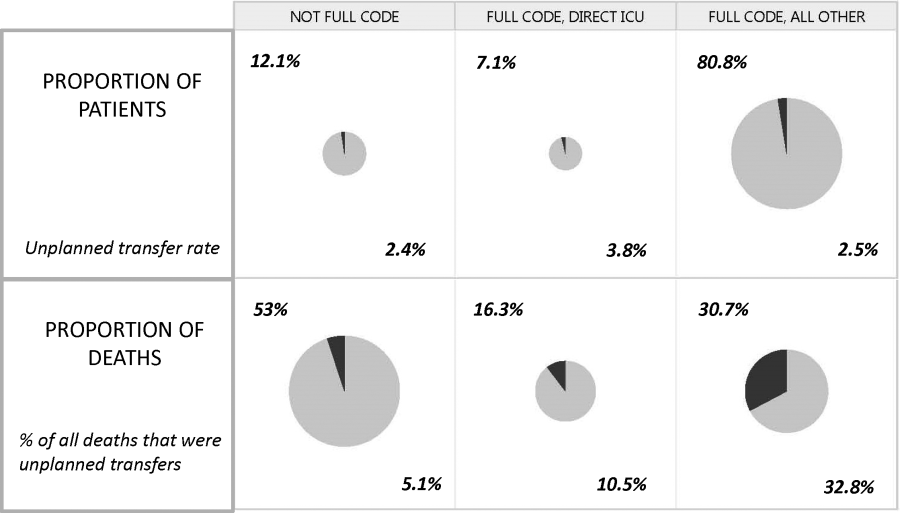
Whereas the notion of deploying RRTs has clearly been successful, success in demonstrating unequivocal benefit remains elusive.[17, 18, 19] Outcome measures vary dramatically across studies and have included the number of RRT calls, decreases in code blue events on the ward, and decreases in inpatient mortality.[20] We suspect that other reasons are behind this problem. First is the lack of adequate risk adjustment and ignoring the impact of patients near the end of life on the denominator. Figure 4 shows recent data from 21 Kaiser Permanente Northern California (KPNC) hospitals, which can now capture care directive orders electronically,[21] illustrates this problem. The majority (53%) of hospital deaths occur among a highly variable proportion (range across hospitals, 6.5%18.0%) of patients who arrive at the hospital with a restricted resuscitation preference (do not resuscitate, partial code, and comfort care only). These patients do not want to die or crash and burn but, were they to trigger an alert, they would not necessarily want to be rescued by being transferred to the ICU either; moreover, internal KPNC analyses show that large numbers of these patients have sepsis and refuse aggressive treatment. The second major confounder is that ICUs save lives. Consequently, although early detection could lead to fewer transfers to the ICU, using the end point of ICU admission is very problematic, because in many cases the goal of alerting systems should be to get patients to the ICU sooner, which would not affect the outcome of transfer to the ICU in a downward direction; in fact, such systems might increase transfer to the ICU.
The complexities summarized in Figure 4 mean that it is likely that formal quantification of benefit will require examination of multiple measures, including balancing measures as described below. It is also evident that, in this respectlack of agreement as to what constitutes a good outcomethe issues being faced here are a reflection of a broader area of disagreement within our profession and society at large that extends to medical conditions other than critical illness.
POTENTIAL HARMS OF EARLY DETECTION
Implementation of early detection and rapid response systems are not inherently free of harm. If these systems are not shown to have benefit, then the cost of operating them is moving resources away from other, possibly evidence‐based, interventions.[22] At the individual level, alerts could frighten patients and their families (for example, some people are very uncomfortable with the idea that one can predict events). Physicians and nurses who work in the hospital are already quite busy, so every time an alert is issued, it adds to the demand on their already limited time, hence, the critical importance of strategies to minimize false alarms and alert fatigue. Moreover, altering existing workflows can be disruptive and unpopular.
A potentially more quantifiable problem is the impact of early detection systems on ICU operations. For example, if an RRT decides to transfer a patient from the ward to the ICU as a preventive measure (soft landing) and this in turn ties up an ICU bed, that bed is then unavailable for a new patient in the emergency department. Similarly, early detection systems coupled with structured protocols for promoting soft landings could result in a change in ICU case mix, with greater patient flow due to increased numbers of patients with lower severity and lower ICU length of stay. These considerations suggest the need to couple early detection with other supportive data systems and workflows (eg, systems that monitor bed capacity proactively).
Lastly, if documentation protocols are not established and followed, early detection systems could expose both individual clinicians as well as healthcare institutions to medicallegal risk. This consideration could be particularly important in those instances where an alert is issued and, for whatever reasons, clinicians do not take action and do not document that decision. At present, early detection systems are relatively uncommon, but they may gradually become standard of care. This means that in‐house out of ICU deteriorations, which are generally considered to be bad luck or due to a specific error or oversight, may then be considered to be preventable. Another possible scenario that could arise is that of plaintiffs invoking enterprise liability, where a hospital's not having an early detection system becomes considered negligent.
ARTICLES IN THIS ISSUE
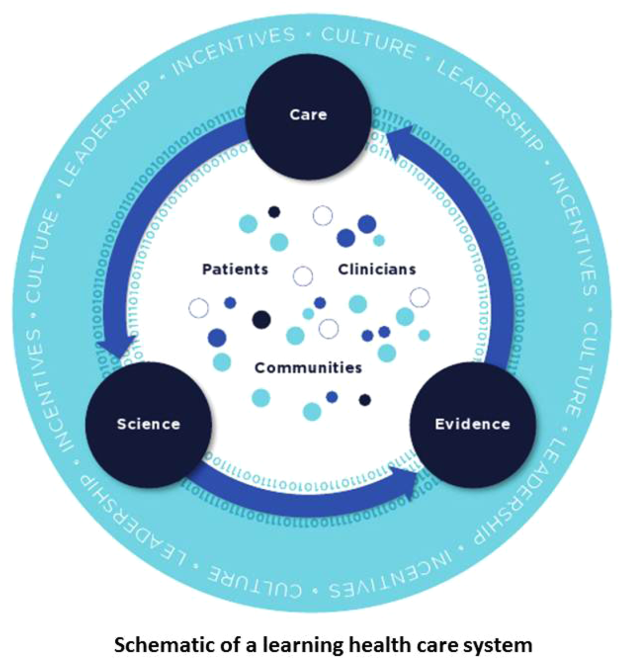
In this issue of the Journal of Hospital Medicine, we examine early detection from various perspectives but around a common theme that usually gets less attention in the academic literature: implementation. The article by Schorr et al.[23] describes a disease‐specific approach that can be instantiated using either electronic or paper tools. Escobar et al.[24] describe the quantitative as well as the electronic architecture of an early warning system (EWS) pilot at 2 hospitals that are part of an integrated healthcare delivery system. Dummett et al.[25] then show how a clinical rescue component was developed to take advantage of the EWS, whereas Granich et al.[26] describe the complementary component (integration of supportive care and ensuring that patient preferences are respected). The paper by Liu et al.[27] concludes by placing all of this work in a much broader context, that of the learning healthcare system.
FUTURE DIRECTIONS: KEY GAPS IN THE FIELD
Important gaps remain with respect to early detection and response systems. Future research will need to focus on a number of areas. First and foremost, better approaches to quantifying the costbenefit relationships of these systems are needed; somehow, we need to move beyond a purely intuitive sense that they are good things. Related to this is the need to establish metrics that would permit rigorous comparisons between different approaches; this work needs to go beyond simple comparisons of the statistical characteristics of different predictive models. Ideally, it should include comparisons of different approaches for the response arms as well. We also need to characterize clinician understanding about detection systems, what constitutes impending or incipient critical illness, and the optimum way to provide early detection. Finally, better approaches to integrating health services research with basic science work must be developed; for example, how should one test new biomarkers in settings with early detection and response systems?
The most important frontier, however, is how one can make early detection and response systems more patient centered and how one can enhance their ability to respect patient preferences. Developing systems to improve clinical management is laudable, but somehow we need to also find ways to have these systems make a better connection to what patients want most and what matters most to them, something that may need to include new ways that sometimes suspend use of these systems. At the end of the day, after early detection, patients must have a care experience that they see as an unequivocal improvement.
Acknowledgements
The authors thank our 2 foundation program officers, Dr. Marybeth Sharpe and Ms. Kate Weiland, for their administrative support and encouragement. The authors also thank Dr. Tracy Lieu, Dr. Michelle Caughey, Dr. Philip Madvig, and Ms. Barbara Crawford for their administrative assistance, Dr. Vincent Liu for comments on the manuscript, and Ms. Rachel Lesser for her help with formatting the manuscript and figures.
Disclosures
This work was supported by the Gordon and Betty Moore Foundation, The Permanente Medical Group, Inc., and Kaiser Foundation Hospitals, Inc. As part of our agreement with the Moore Foundation, we made a commitment to disseminate our findings in articles such as this one. However, the Gordon and Betty Moore Foundation and its staff played no role in how we actually structured our articles, nor did they review or preapprove any of the manuscripts submitted as part of the dissemination component. None of the authors has any conflicts of interest to declare of relevance to this work.
- , , , Inpatient care for septicemia or sepsis: a challenge for patients and hospitals. NCHS Data Brief. 2011(62):1–8.
- , , , et al. Surviving sepsis campaign: association between performance metrics and outcomes in a 7.5‐year study. Crit Care Med. 2015;43(1):3–12.
- , , , , , Early detection of impending physiologic deterioration among patients who are not in intensive care: development of predictive models using data from an automated electronic medical record. J Hosp Med. 2012;7(5):388–395.
- , , , et al. A randomized trial of real‐time automated clinical deterioration alerts sent to a rapid response team. J Hosp Med. 2014;9(7):424–429.
- , , , , , Enhanced end‐of‐life care associated with deploying a rapid response team: a pilot study. J Hosp Med. 2009;4(7):449–452.
- , , , , The medical emergency team call: a sentinel event that triggers goals of care discussion. Crit Care Med. 2014;42(2):322–327.
- , , , Why the C‐statistic is not informative to evaluate early warning scores and what metrics to use. Crit Care. 2015;19:285.
- , , , , Anticipating mechanical ventilation in Guillain‐Barre syndrome. Arch Neurol. 2001;58(6):893–898.
- , , , , , The natural history of changes in preferences for life‐sustaining treatments and implications for inpatient mortality in younger and older hospitalized adults. J Am Geriatr Soc. 2016;64(5):981–989.
- , Remote collection of questionnaires. Clin Exp Rheumatol. 2014;32(5 suppl 85):S168–S172.
- Be prepared to make your health care wishes known. Health care directives. Allina Health website. Available at: http://www.allinahealth.org/Customer-Service/Be-prepared/Be-prepared-to-make-your-health-care-wishes-known. Accessed January 1, 2015.
- Patient Reported Outcomes Measurement Information System. Dynamic tools to measure health outcomes from the patient perspective. Available at: http://www.nihpromis.org. Accessed January 15, 2015.
- , , , , , Methodology of the surviving sepsis campaign global initiative for improving care of the patient with severe sepsis. Minerva Anestesiol. 2009;75(suppl 1):23–27.
- , , The Surviving Sepsis Campaign: a history and a perspective. Surg Infect (Larchmt). 2010;11(3):275–281.
- , The Surviving Sepsis Campaign: past, present and future. Trends Mol Med. 2014;20(4):192–194.
- , , , et al. Serum lactate as a predictor of mortality in emergency department patients with infection. Ann Emerg Med. 2005;45(5):524–528.
- , , , et al. Effect of a rapid response team on hospital‐wide mortality and code rates outside the ICU in a Children's Hospital. JAMA. 2007;298(19):2267–2274.
- , , , , , Effects of a medical emergency team on reduction of incidence of and mortality from unexpected cardiac arrests in hospital: preliminary study. BMJ. 2002;324(7334):387–390.
- , Rapid response teams: qualitative analysis of their effectiveness. Am J Crit Care. 2013;22(3):198–210.
- , , , , , Hospital‐wide code rates and mortality before and after implementation of a rapid response team. JAMA. 2008;300(21):2506–2513.
- , , , , Risk‐adjusting hospital mortality using a comprehensive electronic record in an integrated healthcare delivery system. Med Care. 2013;51(5):446–453.
- , , Rapid response teams—walk, don't run. JAMA. 2006;296(13):1645–1647.
- Schorr et al. J Hosp Med. 2016;11:000–000.
- , , , et al. Piloting electronic medical record–based early detection of inpatient deterioration in community hospitals. J Hosp Med. 2016;11:000–000.
- Dummett et al. J Hosp Med. 2016;11:000–000.
- Granich et al. J Hosp Med. 2016;11:000–000.
- Liu et al. , , , , , Data that drive: closing the loop in the learning hospital system. J Hosp Med. 2016;11:000–000.
This issue of the Journal of Hospital Medicine describes 2 research and quality improvement demonstration projects funded by the Gordon and Betty Moore Foundation. Early detection is central to both projects. This introductory article does not provide a global review of the now voluminous literature on rapid response teams (RRTs), sepsis detection systems, or treatment protocols. Rather, it takes a step back and reassesses just what early detection and quantification of critical illness are. It then examines the implications of early detection and its quantification.
CONCEPTUAL FRAMEWORK
We define severe illness as the presence of acute disease such that a person can no longer expect to improve without dedicated hospital treatment but which is not inevitably associated with mortality, postdischarge morbidity, or major loss of autonomy. In contrast, we define critical illness as acute disease with high a priori risk of mortality, postdischarge morbidity, and major (possibly total) loss of autonomy. We accept that the boundaries between ordinary illness, severe illness, and critical illness are blurred. The basic assumption behind all efforts at early detection is that these edges can be made sharp, and that the knowledge base required to do so can also lead to improvements in treatment protocols and patient outcomes. Further, it is assumed that at least some forms of critical illness can be prevented or mitigated by earlier detection, identification, and treatment.
Research over the last 2 decades has provided important support for this intuitive view as well as making it more nuanced. With respect to epidemiology, the big news is that sepsis is the biggest culprit, and that it accounts for a substantial proportion of all hospital deaths, including many previously considered unexpected hospital deaths due to in‐hospital deterioration.[1] With respect to treatment, a number of studies have demonstrated that crucial therapies previously considered to be intensive care unit (ICU) therapies can be initiated in the emergency department or general medicalsurgical ward.[2]
Figure 1 shows an idealized framework for illness presenting in the emergency department or general medicalsurgical wards. It illustrates the notion that a transition period exists when patients may be rescued with less intense therapy than will be required when condition progression occurs. Once a certain threshold is crossed, the risk of death or major postdischarge morbidity rises exponentially. Unaided human cognition's ability to determine where a given patient is in this continuum is dangerously variable and is highly dependent on the individuals training and experience. Consequently, as described in several of the articles in this issue as well as multiple other publications, health systems are employing comprehensive electronic medical records (EMRs) and are migrating to algorithmic approaches that combine multiple types of patient data.[3, 4] Although we are still some distance from being able to define exact boundaries between illness, severe illness, and critical illness, current EMRs permit much better definition of patient states, care processes, and short‐term outcomes.
Whereas our ability to quantify many processes and short‐term outcomes is expanding rapidly, quantification of the possible benefit of early detection is complicated by the fact that, even in the best of circumstances, not all patients can be rescued. For some patients, rescue may be temporary, raising the prospect of repeated episodes of critical illness and prolonged intensive care without any hope of leaving the hospital. Figure 2 shows that, for these patients, the problem is no longer simply one of preventing death and preserving function but, rather, preserving autonomy and dignity. In this context, early detection means earlier specification of patient preferences.[5, 6]
JUST WHAT CONSTITUTES EARLY DETECTION (AND HOW DO WE QUANTIFY IT)?
RRTs arose as the result of a number of studies showing thatin retrospectin‐hospital deteriorations should not have been unexpected. Given comprehensive inpatient EMRs, it is now possible to develop more rigorous definitions. A minimum set of parameters that one would need to specify for proper quantification of early detection is shown on Figure 3. The first is specifying a T0, that is, the moment when a prediction regarding event X (which needs to be defined) is issued. This is different from the (currently unmeasurable) biologic onset of illness as well as the first documented indication that critical illness was present. Further, it is important to be explicit about the event time frame (the time period during which a predicted event is expected to occur): we are predicting that X will occur within E hours of the T0. The time frame between the T0 and X, which we are referring to as lead time, is clinically very important, as it represents the time period during which the response arm (eg, RRT intervention) is to be instituted. Statistical approaches can be used to estimate it, but once an early detection system is in place, it can be quantified. Figure 3 is not restricted to electronic systems; all components shown can be and are used by unaided human cognition.
It is essential to specify what data are used to generate probability estimates as well as the time frames used, which we refer to as the look‐back time frames. Several types of data could be employed, with some data elements (eg, age or gender) being discrete data with a 1:1 fixed correspondence between the patient and the data. Other data have a many‐to‐1 relationship, and an exact look‐back time frame must be specified for each data type. For example, it seems reasonable to specify a short (1224 hours) look‐back period for some types of data (eg, vital signs, lactate, admission diagnosis or chief complaint), an intermediate time period (13 days) for information on the current encounter, and a longer (months to years) time period for preexisting illness or comorbidity burden.
Because many events are rare, traditional measures used to assess model performance, such as the area under the receiver operator characteristic curve (C statistic), are not as helpful.[7] Consequently, much more emphasis needs to be given to 2 key metrics: number needed to evaluate (or workup to detection ratio) and threshold‐specific sensitivity (ability of the alert to detect X at a given threshold). With these, one can answer 3 questions that will be asked by the physicians and nurses who are not likely to be researchers, and who will have little interest in the statistics: How many patients do I need to work up each day? How many patients will I need to work up for each possible outcome identified? For this amount of work, how many of the possible outcomes will we catch?
Data availability for the study of severe and critical illness continues to expand. Practically, this means that future research will require more nuanced ontologies for the classification of physiologic derangement. Current approaches to severity scoring (collapsing data into composite scores) need to be replaced by dynamic approaches that consider differential effects on organ systems as well as what can be measured. Severity scoring will also need to incorporate the rate of change of a score (or probability derived from a score) in predicting the occurrence of an event of interest as well as judging response to treatment. Thus, instead of at time of ICU admission, the patient had a severity score of 76, we may have although this patient's severity score at the time of admission was decreasing by 4 points per hour per 10 mL/kg fluid given, the probability for respiratory instability was increasing by 2.3% per hour given 3 L/min supplemental oxygen. This approach is concordant with work done in other clinical settings (eg, in addition to an absolute value of maximal negative inspiratory pressure or vital capacity, the rate of deterioration of neuromuscular weakness in Guillain‐Barr syndrome is also important in predicting respiratory failure[8]).
Electronic data also could permit better definition of patient preferences regarding escalation of care. At present, available electronic data are limited (primarily, orders such as do not resuscitate).[9] However, this EMR domain is gradually expanding.[10, 11] Entities such as the National Institutes of Health could develop sophisticated and rapid questionnaires around patient preferences that are similar to those developed for the Patient Reported Outcomes Measurement Information System.[12] Such tools could have a significant effect on our ability to quantify the benefits of early detection as it relates to a patient's preferences (including better delineation of what treatments they would and would not want).
ACTIVATING A RESPONSE ARM
Early identification, antibiotic administration, fluid resuscitation, and source control are now widely felt to constitute low‐hanging fruit for decreasing morbidity and mortality in severe sepsis. All these measures are included in quality improvement programs and sepsis bundles.[13, 14, 15] However, before early interventions can be instituted, sepsis must at least be suspected, hence the need for early detection. The situation with respect to patient deterioration (for reasons other than sepsis) in general medical surgical wards is less clear‐cut. Reasons for deterioration are much more heterogenous and, consequently, early detection is likely necessary but not sufficient for outcomes improvement.
The 2 projects described in this issue describe nonspecific (indicating elevated risk but not specifying what led to the elevation of risk) and sepsis‐specific alerting systems. In the case of the nonspecific system, detection may not lead to an immediate deployment of a response arm. Instead, a secondary evaluation process must be triggered first. Following this evaluation component, a response arm may or may not be required. In contrast, the sepsis‐specific project essentially transforms the general medicalsurgical ward into a screening system. This screening system then also triggers specific bundle components.
Neither of these systems relies on unaided human cognition. In the case of the nonspecific system, a complex equation generates a probability that is displayed in the EMR, with protocols specifying what actions are to be taken when that probability exceeds a prespecified threshold. With respect to the sepsis screening system, clinicians are supported by EMR alerts as well as protocols that increase nursing autonomy when sepsis is suspected.
The distinction between nonspecific (eg, acute respiratory failure or hemodynamic deterioration) and specific (eg, severe sepsis) alerting systems is likely to disappear as advances in the field occur. For example, incorporation of natural language processing would permit inclusion of semantic data, which could be processed so as to prebucket an alert into one that not just gave a probability, but also a likely cause for the elevated probability.
In addition, both types of systems suffer from the limitation of working off a limited database because, in general, current textbooks and training programs primary focus remains that of treatment of full‐blown clinical syndromes. For example, little is known about how one should manage patients with intermediate lactate values, despite evidence showing that a significant percentage of patients who die from sepsis will initially have such values, with 1 study showing 63% as many deaths with initial lactate of 2.5 to 4.0 mmol/L as occurred with an initial lactate of >4.0 mmol/L.[16] Lastly, as is discussed below, both systems will encounter similar problems when it comes to quantifying benefit.
QUANTIFYING BENEFIT
Whereas the notion of deploying RRTs has clearly been successful, success in demonstrating unequivocal benefit remains elusive.[17, 18, 19] Outcome measures vary dramatically across studies and have included the number of RRT calls, decreases in code blue events on the ward, and decreases in inpatient mortality.[20] We suspect that other reasons are behind this problem. First is the lack of adequate risk adjustment and ignoring the impact of patients near the end of life on the denominator. Figure 4 shows recent data from 21 Kaiser Permanente Northern California (KPNC) hospitals, which can now capture care directive orders electronically,[21] illustrates this problem. The majority (53%) of hospital deaths occur among a highly variable proportion (range across hospitals, 6.5%18.0%) of patients who arrive at the hospital with a restricted resuscitation preference (do not resuscitate, partial code, and comfort care only). These patients do not want to die or crash and burn but, were they to trigger an alert, they would not necessarily want to be rescued by being transferred to the ICU either; moreover, internal KPNC analyses show that large numbers of these patients have sepsis and refuse aggressive treatment. The second major confounder is that ICUs save lives. Consequently, although early detection could lead to fewer transfers to the ICU, using the end point of ICU admission is very problematic, because in many cases the goal of alerting systems should be to get patients to the ICU sooner, which would not affect the outcome of transfer to the ICU in a downward direction; in fact, such systems might increase transfer to the ICU.
The complexities summarized in Figure 4 mean that it is likely that formal quantification of benefit will require examination of multiple measures, including balancing measures as described below. It is also evident that, in this respectlack of agreement as to what constitutes a good outcomethe issues being faced here are a reflection of a broader area of disagreement within our profession and society at large that extends to medical conditions other than critical illness.
POTENTIAL HARMS OF EARLY DETECTION
Implementation of early detection and rapid response systems are not inherently free of harm. If these systems are not shown to have benefit, then the cost of operating them is moving resources away from other, possibly evidence‐based, interventions.[22] At the individual level, alerts could frighten patients and their families (for example, some people are very uncomfortable with the idea that one can predict events). Physicians and nurses who work in the hospital are already quite busy, so every time an alert is issued, it adds to the demand on their already limited time, hence, the critical importance of strategies to minimize false alarms and alert fatigue. Moreover, altering existing workflows can be disruptive and unpopular.
A potentially more quantifiable problem is the impact of early detection systems on ICU operations. For example, if an RRT decides to transfer a patient from the ward to the ICU as a preventive measure (soft landing) and this in turn ties up an ICU bed, that bed is then unavailable for a new patient in the emergency department. Similarly, early detection systems coupled with structured protocols for promoting soft landings could result in a change in ICU case mix, with greater patient flow due to increased numbers of patients with lower severity and lower ICU length of stay. These considerations suggest the need to couple early detection with other supportive data systems and workflows (eg, systems that monitor bed capacity proactively).
Lastly, if documentation protocols are not established and followed, early detection systems could expose both individual clinicians as well as healthcare institutions to medicallegal risk. This consideration could be particularly important in those instances where an alert is issued and, for whatever reasons, clinicians do not take action and do not document that decision. At present, early detection systems are relatively uncommon, but they may gradually become standard of care. This means that in‐house out of ICU deteriorations, which are generally considered to be bad luck or due to a specific error or oversight, may then be considered to be preventable. Another possible scenario that could arise is that of plaintiffs invoking enterprise liability, where a hospital's not having an early detection system becomes considered negligent.
ARTICLES IN THIS ISSUE
In this issue of the Journal of Hospital Medicine, we examine early detection from various perspectives but around a common theme that usually gets less attention in the academic literature: implementation. The article by Schorr et al.[23] describes a disease‐specific approach that can be instantiated using either electronic or paper tools. Escobar et al.[24] describe the quantitative as well as the electronic architecture of an early warning system (EWS) pilot at 2 hospitals that are part of an integrated healthcare delivery system. Dummett et al.[25] then show how a clinical rescue component was developed to take advantage of the EWS, whereas Granich et al.[26] describe the complementary component (integration of supportive care and ensuring that patient preferences are respected). The paper by Liu et al.[27] concludes by placing all of this work in a much broader context, that of the learning healthcare system.
FUTURE DIRECTIONS: KEY GAPS IN THE FIELD
Important gaps remain with respect to early detection and response systems. Future research will need to focus on a number of areas. First and foremost, better approaches to quantifying the costbenefit relationships of these systems are needed; somehow, we need to move beyond a purely intuitive sense that they are good things. Related to this is the need to establish metrics that would permit rigorous comparisons between different approaches; this work needs to go beyond simple comparisons of the statistical characteristics of different predictive models. Ideally, it should include comparisons of different approaches for the response arms as well. We also need to characterize clinician understanding about detection systems, what constitutes impending or incipient critical illness, and the optimum way to provide early detection. Finally, better approaches to integrating health services research with basic science work must be developed; for example, how should one test new biomarkers in settings with early detection and response systems?
The most important frontier, however, is how one can make early detection and response systems more patient centered and how one can enhance their ability to respect patient preferences. Developing systems to improve clinical management is laudable, but somehow we need to also find ways to have these systems make a better connection to what patients want most and what matters most to them, something that may need to include new ways that sometimes suspend use of these systems. At the end of the day, after early detection, patients must have a care experience that they see as an unequivocal improvement.
Acknowledgements
The authors thank our 2 foundation program officers, Dr. Marybeth Sharpe and Ms. Kate Weiland, for their administrative support and encouragement. The authors also thank Dr. Tracy Lieu, Dr. Michelle Caughey, Dr. Philip Madvig, and Ms. Barbara Crawford for their administrative assistance, Dr. Vincent Liu for comments on the manuscript, and Ms. Rachel Lesser for her help with formatting the manuscript and figures.
Disclosures
This work was supported by the Gordon and Betty Moore Foundation, The Permanente Medical Group, Inc., and Kaiser Foundation Hospitals, Inc. As part of our agreement with the Moore Foundation, we made a commitment to disseminate our findings in articles such as this one. However, the Gordon and Betty Moore Foundation and its staff played no role in how we actually structured our articles, nor did they review or preapprove any of the manuscripts submitted as part of the dissemination component. None of the authors has any conflicts of interest to declare of relevance to this work.
- , , , Inpatient care for septicemia or sepsis: a challenge for patients and hospitals. NCHS Data Brief. 2011(62):1–8.
- , , , et al. Surviving sepsis campaign: association between performance metrics and outcomes in a 7.5‐year study. Crit Care Med. 2015;43(1):3–12.
- , , , , , Early detection of impending physiologic deterioration among patients who are not in intensive care: development of predictive models using data from an automated electronic medical record. J Hosp Med. 2012;7(5):388–395.
- , , , et al. A randomized trial of real‐time automated clinical deterioration alerts sent to a rapid response team. J Hosp Med. 2014;9(7):424–429.
- , , , , , Enhanced end‐of‐life care associated with deploying a rapid response team: a pilot study. J Hosp Med. 2009;4(7):449–452.
- , , , , The medical emergency team call: a sentinel event that triggers goals of care discussion. Crit Care Med. 2014;42(2):322–327.
- , , , Why the C‐statistic is not informative to evaluate early warning scores and what metrics to use. Crit Care. 2015;19:285.
- , , , , Anticipating mechanical ventilation in Guillain‐Barre syndrome. Arch Neurol. 2001;58(6):893–898.
- , , , , , The natural history of changes in preferences for life‐sustaining treatments and implications for inpatient mortality in younger and older hospitalized adults. J Am Geriatr Soc. 2016;64(5):981–989.
- , Remote collection of questionnaires. Clin Exp Rheumatol. 2014;32(5 suppl 85):S168–S172.
- Be prepared to make your health care wishes known. Health care directives. Allina Health website. Available at: http://www.allinahealth.org/Customer-Service/Be-prepared/Be-prepared-to-make-your-health-care-wishes-known. Accessed January 1, 2015.
- Patient Reported Outcomes Measurement Information System. Dynamic tools to measure health outcomes from the patient perspective. Available at: http://www.nihpromis.org. Accessed January 15, 2015.
- , , , , , Methodology of the surviving sepsis campaign global initiative for improving care of the patient with severe sepsis. Minerva Anestesiol. 2009;75(suppl 1):23–27.
- , , The Surviving Sepsis Campaign: a history and a perspective. Surg Infect (Larchmt). 2010;11(3):275–281.
- , The Surviving Sepsis Campaign: past, present and future. Trends Mol Med. 2014;20(4):192–194.
- , , , et al. Serum lactate as a predictor of mortality in emergency department patients with infection. Ann Emerg Med. 2005;45(5):524–528.
- , , , et al. Effect of a rapid response team on hospital‐wide mortality and code rates outside the ICU in a Children's Hospital. JAMA. 2007;298(19):2267–2274.
- , , , , , Effects of a medical emergency team on reduction of incidence of and mortality from unexpected cardiac arrests in hospital: preliminary study. BMJ. 2002;324(7334):387–390.
- , Rapid response teams: qualitative analysis of their effectiveness. Am J Crit Care. 2013;22(3):198–210.
- , , , , , Hospital‐wide code rates and mortality before and after implementation of a rapid response team. JAMA. 2008;300(21):2506–2513.
- , , , , Risk‐adjusting hospital mortality using a comprehensive electronic record in an integrated healthcare delivery system. Med Care. 2013;51(5):446–453.
- , , Rapid response teams—walk, don't run. JAMA. 2006;296(13):1645–1647.
- Schorr et al. J Hosp Med. 2016;11:000–000.
- , , , et al. Piloting electronic medical record–based early detection of inpatient deterioration in community hospitals. J Hosp Med. 2016;11:000–000.
- Dummett et al. J Hosp Med. 2016;11:000–000.
- Granich et al. J Hosp Med. 2016;11:000–000.
- Liu et al. , , , , , Data that drive: closing the loop in the learning hospital system. J Hosp Med. 2016;11:000–000.

Incorporating an EWS Into Practice
Patients who deteriorate outside highly monitored settings and who require unplanned transfer to the intensive care unit (ICU) are known to have high mortality and morbidity.[1, 2, 3, 4, 5] The notion that early detection of a deteriorating patient improves outcomes has intuitive appeal and is discussed in a large number of publications.[6, 7, 8, 9, 10] However, much less information is available on what should be done after early detection is made.[11] Existing literature on early warning systems (EWSs) does not provide enough detail to serve as a map for implementation. This lack of transparency is complicated by the fact that, although the comprehensive inpatient electronic medical record (EMR) now constitutes the central locus for clinical practice, much of the existing literature comes from research institutions that may employ home‐grown EMRs, not community hospitals that employ commercially available systems.
In this issue of the Journal of Hospital Medicine, we describe our efforts to bridge that gap by implementing an EWS in a pair of community hospitals. The EWS's development and its basic statistical and electronic infrastructure are described in the articles by Escobar and Dellinger and Escobar et al.[2, 12, 13] In this report, we focus on how we addressed clinicians' primary concern: What do we do when we get an alert? Because it is described in detail by Granich et al.[14] elsewhere in this issue of the Journal of Hospital Medicine, a critical component of our implementation process (ensuring that patient preferences with respect to supportive care are honored) is not discussed.
Our article is divided into the following sections: rationale, preimplementation preparatory work, workflow development, response protocols, challenges and key learnings, and concluding reflections.
RATIONALE
Much of the previous work on the implementation of alarm systems has focused on the statistics behind detection or on the quantification of processes (eg, how many rapid response calls were triggered) or on outcomes such as mortality. The conceptual underpinnings and practical steps necessary for successful integration of an alarm system into the clinicians' workflow have not been articulated. Our theoretical framework was based on (1) improving situational awareness[15] (knowing what is going on around you and what is likely to happen next) and (2) mitigating cognitive errors.
An EWS enhances situational awareness most directly by earlier identification of a problem with a particular patient. As is detailed by Escobar et al.[16] in this issue of the Journal of Hospital Medicine, our EWS extracts EMR data every 6 hours, performs multiple calculations, and then displays 3 scores in real time in the inpatient dashboard (known as the Patient Lists activity in the Epic EMR). The first of these scores is the Laboratory‐Based Acute Physiologic Score, version 2 (LAPS2), an objective severity score whose retrospective version is already in use in Kaiser Permanente Northern California (KPNC) for internal benchmarking.[13] This score captures a patient's overall degree of physiologic instability within the preceding 72 hours. The second is the Comorbidity Point Score, version 2 (COPS2), a longitudinal comorbidity score based on the patient's diagnoses over the preceding 12 months.[13] This score captures a patient's overall comorbidity burden. Thus, it is possible for a patient to be very ill (high COPS2) while also being stable (low LAPS2) or vice versa. Both of these scores have other uses, including prediction of rehospitalization risk in real time,[17] which is also being piloted at KPNC. Finally, the Advanced Alert Monitoring (AAM) score, which integrates the LAPS2 and COPS2 with other variables, provides a 12‐hour deterioration risk, with a threshold value of 8% triggering response protocols. At or above this threshold, which was agreed to prior to implementation, the system achieves 25% sensitivity, 98% specificity, with a number needed to evaluate of 10 to 12, a level of workload that was felt to be acceptable by clinicians. Actions triggered by the EWS may be quite different from those one would take when being notified of a code blue, which is called at the time an event occurs. The EWS focuses attention on patients who might be missed because they do not yet appear critically ill. It also provides a shared, quantifiable measure of a patient's risk that can trigger a standardized plan of action to follow in evaluating and treating a patient.[15]
In addition to enhancing situational awareness, we intended the alarms to produce cognitive change in practitioners. Our goal was to replace medical intuition with analytic, evidence‐based judgment of future illness. We proceeded with the understanding that replacing quick intuition with slower analytic response is an essential skill in developing sound clinical reasoning.[18, 19, 20] The alert encourages physicians to reassess high‐risk patients facilitating a cognitive shift from automatic, error‐prone processing to slower, deliberate processing. Given the busy pace of ward work, slowing down permits clinicians to reassess previously overlooked details. Related to this process of inducing cognitive change is a secondary effect: we uncovered and discussed physician biases. Physicians are subject to potential biases that allow patients to deteriorate.[18, 19, 20] Therefore, we addressed bias through education. By reviewing particular cases of unanticipated deterioration at each hospital facility, we provided evidence for the problem of in‐hospital deterioration. This framed the new tool as an opportunity for improving treatment and encouraged physicians to act on the alert using a structured process.
INTERVENTIONS
Preimplementation Preparatory Work
Initial KPNC data provided strong support for the generally accepted notion that unplanned transfer patients have poor outcomes.[2, 4, 5] However, published reports failed to provide the granular detail clinicians need to implement a response arm at the unit and patient level. In preparation for going live, we conducted a retrospective chart review. This included data from patients hospitalized from January 1, 2011 through December 31, 2012 (additional detail is provided in the Supporting Information, Appendix, in the online version of this article). The key findings from our internal review of subjective documentation preceding deterioration are similar to those described in the literature and summarized in Figure 1, which displays the 5 most common clinical presentations associated with unplanned transfers.
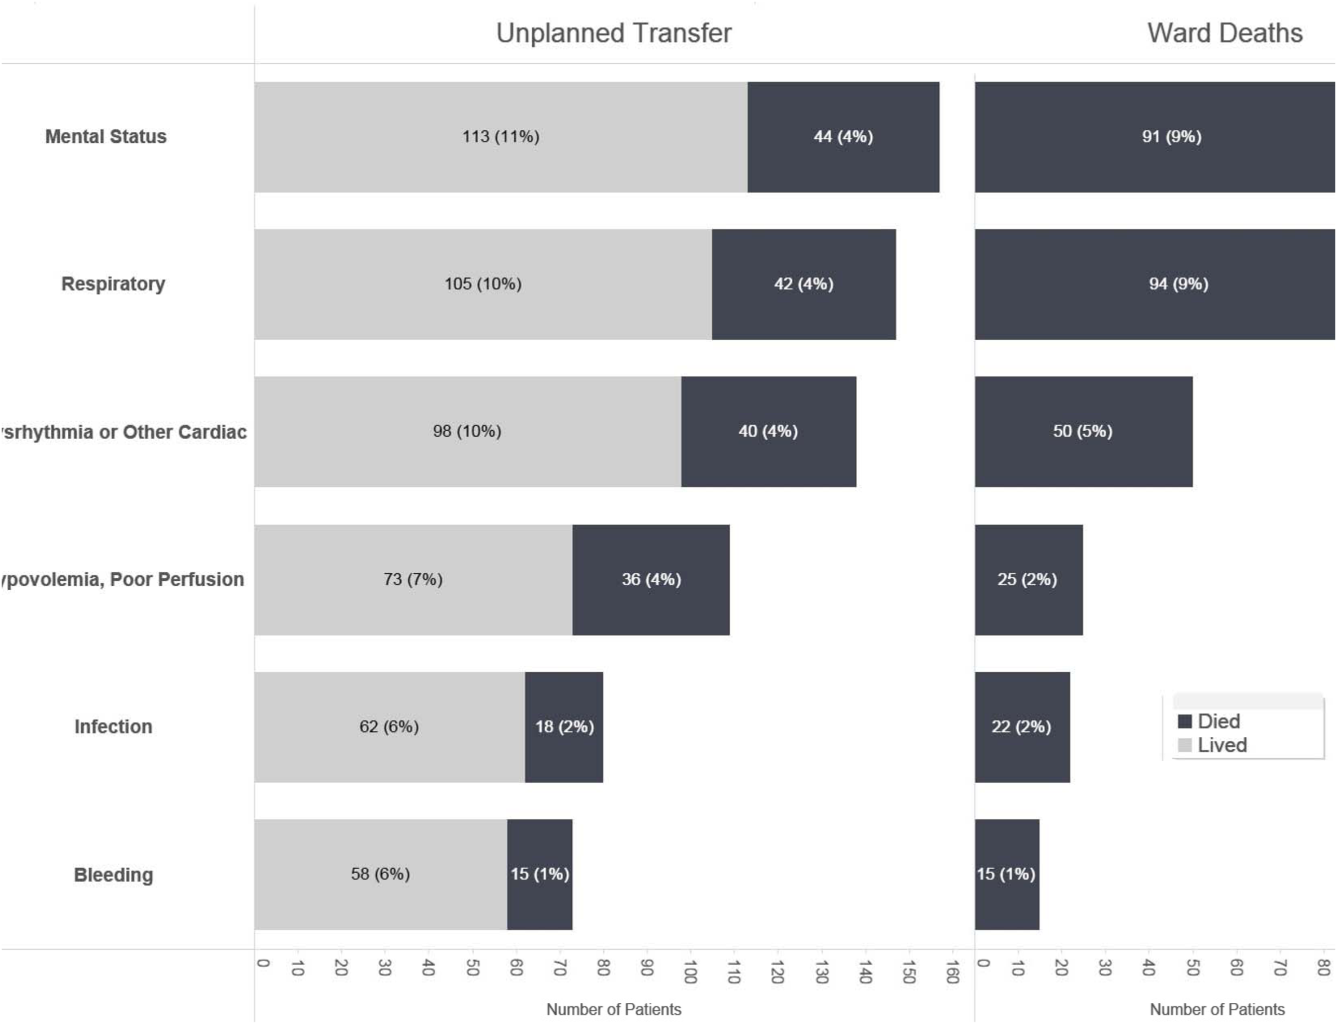
The chart review served several major roles. First, it facilitated cognitive change by eliminating the notion that it can't happen here. Second, it provided considerable guidance on key clinical components that had to be incorporated into the workflow. Third, it engaged the rapid response team (RRT) in reviewing our work retrospectively to identify future opportunities. Finally, the review provided considerable guidance with respect to structuring documentation requirements.
As a result of the above efforts, other processes detailed below, and knowledge described in several of the companion articles in this issue of the Journal of Hospital Medicine, 3 critical elements, which had been explicitly required by our leadership, were in place prior to the go‐live date: a general consensus among hospitalists and nurses that this would be worth testing, a basic clinical response workflow, and an automated checklist for documentation. We refined these in a 2‐week shadowing phase preceding the start date. In this phase, the alerts were not displayed in the EMR. Instead, programmers working on the project notified selected physician leaders by phone. This permitted them to understand exactly what sort of patients were reaching the physiologic threshold so that they could better prepare both RRT registered nurses (RNs) and hospitalists for the go‐live date. This also provided an opportunity to begin refining the documentation process using actual patients.
The original name for our project was Early Detection of Impending Physiologic Deterioration. However, during the preparatory phase, consultation with our public relations staff led to a concern that the name could be frightening to some patients. This highlights the need to consider patient perceptions and how words used in 1 way by physicians can have different connotations to nonclinicians. Consequently, the system was renamed, and it is now referred to as Advance Alert Monitoring (AAM).
Workflow Development
We carefully examined the space where electronic data, graphical user interfaces, and clinical practice blend, a nexus now commonly referred to as workflow or user experience.[21] To promote situational awareness and effect cognitive change, we utilized the Institute for Health Care Improvement's Plan‐Do‐Study‐Act model.[22, 23] We then facilitated the iterative development of a clinician‐endorsed workflow.[22, 23, 24, 25] By adjusting the workflow based on ongoing experience and giving clinicians multiple opportunities to revise (a process that continues to date), we ensured clinicians would approach and endorse the alarm system as a useful tool for decision support.
Table 1 summarizes the work groups assembled for our implementation, and Table 2 provides a system‐oriented checklist indicating key components that need to be in place prior to having an early warning system go live in a hospital. Figure 2 summarizes the alert response protocols we developed through an iterative process at the 2 pilot sites. The care path shown in Figure 2 is the result of considerable revision, mostly due to actual experience acquired following the go live date. The diagram also includes a component that is still work in progress. This is how an emergency department probability estimate (triage support) will be integrated into both the ward as well as the ICU workflows. Although this is beyond the scope of this article, other hospitals may be experimenting with triage support (eg, for sepsis patients), so it is important to consider how one would incorporate such support into workflows.
| Workgroup | Goals |
|---|---|
| |
| Clinical checklist | Perform structured chart review of selected unplanned transfer patients and near misses |
| Develop a checklist for mitigation strategies given an alert | |
| Develop documentation standards given an alert | |
| Develop escalation protocol given an alert | |
| Workload and threshold | Determine threshold for sensitivity of alerts and resulting impact on clinician workload |
| Patient preferences | Prepare background information to be presented to providers regarding end‐of‐life care and POLST orders |
| Coordinate with clinical checklist workgroup to generate documentation templates that provide guidance for appropriate management of patients regarding preferences on escalation of care and end‐of‐life care | |
| Electronic medical record coordination | Review proposed electronic medical record changes |
| Make recommendation for further changes as needed | |
| Develop plan for rollout of new and/or revised electronic record tools | |
| Designate contact list for questions/emssues that may arise regarding electronic record changes during the pilot | |
| Determine alert display choices and mode of alert notification | |
| Nursing committee | Review staffing needs in anticipation of alert |
| Coordinate with workload and threshold group | |
| Develop training calendar to ensure skills necessary for successful implementation of alerts | |
| Make recommendations for potential modification of rapid response team's role in development of a clinical checklist for nurses responding to an alert | |
| Design educational materials for clinicians | |
| Local communication strategy | Develop internal communication plan (for clinical staff not directly involved with pilot) |
| Develop external communication plan (for nonclinicians who may hear about the project) | |
| Level | Tasks |
|---|---|
| Administration | Obtain executive committee approval |
| Establish communication protocols with quality assurance and quality improvement committees | |
| Review protocols with medicallegal department | |
| Communication | Write media material for patients and families |
| Develop and disseminate scripts for front‐line staff | |
| Develop communication and meet with all relevant front‐line staff on merits of project | |
| Educate all staff on workflow changes and impacts | |
| Clinical preparation | Conduct internal review of unplanned transfers and present results to all clinicians |
| Determine service level agreements, ownership of at‐risk patients, who will access alerts | |
| Conduct staff meetings to educate staff | |
| Perform debriefs on relevant cases | |
| Determine desired outcomes, process measures, balancing measures | |
| Determine acceptable clinician burden (alerts/day) | |
| Technology | Establish documentation templates |
| Ensure access to new data fields (electronic medical record security process must be followed for access rights) | |
| Workflows | Workflows (clinical response, patient preferences, supportive care, communication, documentation) must be in place prior to actual go live |
| Shadowing | Testing period (alerts communicated to selected clinicians prior to going live) should occur |
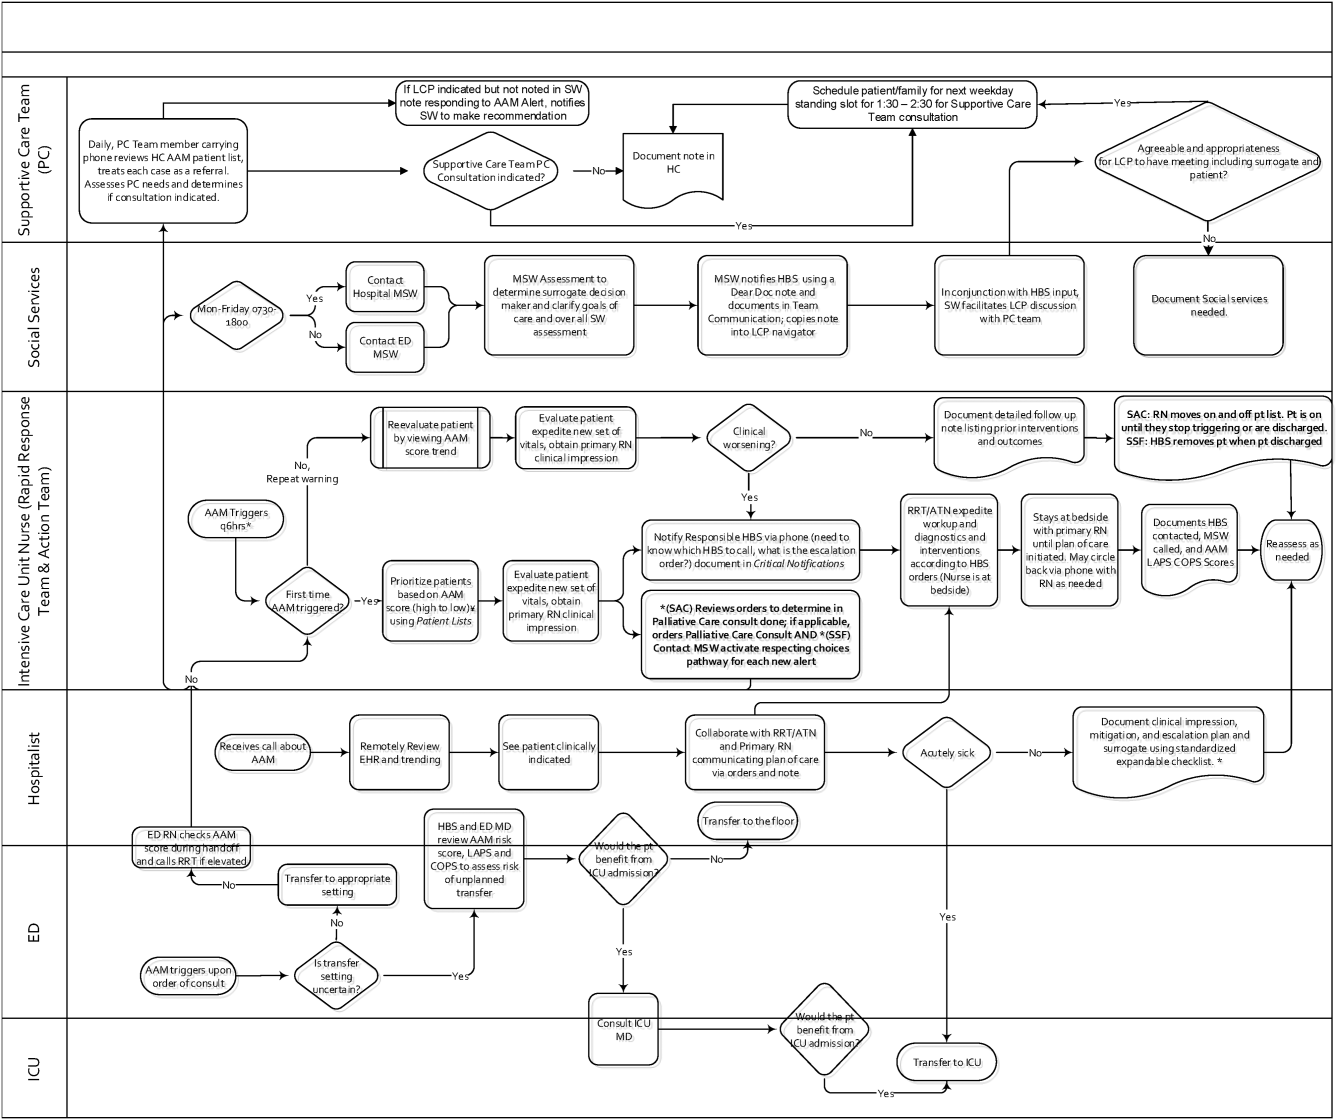
RESPONSE PROTOCOLS
At South San Francisco, the RRT consists of an ICU nurse, a respiratory care therapist, and a designated hospitalist; at Sacramento, the team is also augmented by an additional nurse (the house supervisor). In addition to responding to the AAM alerts, RRT nurses respond to other emergency calls such as code blues, stroke alerts, and patient or patient‐familyinitiated rapid response calls. They also expedite time sensitive workups and treatments. They check up on recent transfers from the ICU to ensure continued improvement justifying staying on the ward. Serving as peer educators, they assist with processes such as chest tube or central line insertions, troubleshoot high‐risk medication administration, and ensure that treatment bundles (eg, for sepsis) occur expeditiously.
The RRT reviews EWS scores every 6 hours. The AAM score is seen as soon as providers open the chart, which helps triage patients for evaluation. Because patients can still be at risk even without an elevated AAM score, all normal escalation pathways remain in place. Once an alert is noted in the inpatient dashboard, the RRT nurse obtains a fresh set of vital signs, assesses the patient's clinical status, and informs the physician, social worker, and primary nurse (Figure 2). Team members work with the bedside nurse, providing support with assessment, interventions, plans, and follow‐up. Once advised of the alert, the hospitalist performs a second chart review and evaluates the patient at the bedside to identify factors that could underlie potential deterioration. After this evaluation, the hospitalist documents concerns, orders appropriate interventions (which can include escalation), and determines appropriate follow‐up. We made sure the team knew that respiratory distress, arrhythmias, mental status changes, or worsening infection were responsible for over 80% of in‐hospital deterioration cases. We also involved palliative care earlier in patient care, streamlining the process so the RRT makes just 1 phone call to the social worker, who contacts the palliative care physician and nurse to ensure patients have a designated surrogate in the event of further deterioration.
Our initial documentation template consisted of a comprehensive organ system‐based physician checklist. However, although this was of use to covering physicians unfamiliar with a given patient, it was redundant and annoying to attending providers already familiar with the patient. After more than 30 iterations, we settled on a succinct note that only documented the clinicians' clinical judgment as to what constituted the major risk for deterioration and what the mitigation strategies would be. Both of these judgments are in a checklist format (see Supporting Information, Appendix, in the online version of this article for the components of the physician and nurse notes).
Prior to the implementation of the system, RRT nurses performed proactive rounding by manually checking patient labs and vital signs, an inefficient process due to the poor sensitivity and specificity of individual values. Following implementation of the system, RRT RNs and clinicians switched to sorting patients by the 3 scores (COPS2, LAPS2, AAM). For example, patients may be stable at admission (as evidenced by their AAM score) but be at high risk due to their comorbidities. One approach that has been employed is to proactively check such patients to ensure they have a care directive in place, as is described in the article by Granich et al.[14] The Supportive Care Team (detailed in Granich et al.) assesses needs for palliative care and provides in‐hospital consultation as needed. Social services staff perform chart reviews to ensure a patient surrogate has been defined and also works with patients and their families to clarify goals of care.
CHALLENGES AND KEY LEARNINGS
One challenge that arose was reconciling the periodic nature of the alert (every 6 hours) with physicians' availability, which varied due to different rounding workflows at the 2 sites. Consequently, the alert cycle was changed; at the first site, the cycle was set to 1000‐1600‐2200‐0400, whereas the second site chose 0800‐1400‐2000‐0200.
One essential but problematic component of the clinical response is the issue of documentation. Inadequate documentation could lead to adverse outcomes, clinician malpractice exposure, and placing the entire hospital at risk for enterprise liability when clinical responses are not documented. This issue is complicated by the fact that overzealous efforts could lead to less or no documentation by making it too onerous for busy clinicians. We found that the ease with which data can populate progress notes in the EMR can lead to note bloat. Clearly, no documentation is not enough, and a complete history and physical is too much. Paradoxically, 1 of the issues underlying our problems with documentation was the proactive nature of the alerts themselves; because they are based on an outcome prediction in the next 12 hours, documenting the response to them may lack (perceived) urgency.
Shortly after the system went live, a patient who had been recently transferred out to the ward from the ICU triggered an alert. As a response was mounted, the team realized that existing ward protocols did not specify which physician service (intensivist or hospitalist) was responsible for patients who were transitioning from 1 unit to another. We also had to perform multiple revisions of the protocols specifying how alerts were handled when they occurred at times of change of shift. Eventually, we settled on having the combination of a hospitalist and an RRT nurse as the cornerstone of the response, with the hospitalist service as the primary owner of the entire process, but this arrangement might need to be varied in different settings. As a result of the experience with the pilot, the business case for deployment in the remaining 19 hospitals includes a formal budget request so that all have properly staffed RRTs, although the issue of primary ownership of the alert process for different patient types (eg, surgical patients) will be decided on a hospital‐by‐hospital basis. These experiences raise the intriguing possibility that implementation of alert systems can lead to the identification of systemic gaps in existing protocols. These gaps can include specific components of the hospital service agreements between multiple departments (emergency, hospital medicine, ICU, palliative care, surgery) as well as problems with existing workflows.
In addition to ongoing tweaking of care protocols, 3 issues remain unresolved. First is the issue of documentation. The current documentation notes are not completely satisfactory, and we are working with the KPNC EMR administrators to refine the tool. Desirable refinements include (1) having the system scores populate in more accessible sectors of the EMR where their retrieval will facilitate increased automation of the note writing process, (2) changing the note type to a note that will facilitate process audits, and (3) linking the note to other EMR tools so that the response arm can be tracked more formally. The second issue is the need to develop strategies to address staff turnover; for example, newer staff may not have received the same degree of exposure to the system as those who were there when it was started. Finally, due to limited resources, we have done very limited work on more mechanistic analyses of the clinical response itself. For example, it would be desirable to perform a formal quantitative, risk‐adjusted process‐outcome analysis of why some patients' outcomes are better than others following an alert.
Finally, it is also the case that we have had some unexpected occurrences that hint at new uses and benefits of alert systems. One of these is the phenomenon of chasing the alert. Some clinicians, on their own, have taken a more proactive stance in the care of patients in whom the AAM score is rising or near the alert threshold. This has 2 potential consequences. Some patients are stabilized and thus do not reach threshold instability levels. In other cases, patients reach threshold but the response team is informed that things are already under control. A second unexpected result is increased requests for COPS2 scores by clinicians who have heard about the system, particularly surgeons who would like to use the comorbidity scores as a screening tool in the outpatient setting. Because KPNC is an integrated system, it is not likely that such alternatives will be implemented immediately without considerable analysis, but it is clear that the system's deployment has captured the clinicians' imagination.
CONCLUSIONS AND FUTURE DIRECTIONS
Our preparatory efforts have been successful. We have found that embedding an EWS in a commercially available EMR is acceptable to hospital physicians and nurses. We have developed a coordinated workflow for mitigation and escalation that is tightly linked to the availability of probabilistic alerts in real time. Although resource limitations have precluded us from conducting formal clinician surveys, the EWS has been discussed at multiple hospital‐wide as well as department‐specific meetings. Although there have been requests for clarification, refinements, and modifications in workflows, no one has suggested that the system be discontinued. Further, many of the other KPNC hospitals have requested that the EWS be deployed at their site. We have examined KPNC databases that track patient complaints and have not found any complaints that could be linked to the EWS. Most importantly, the existence of the workflows we have developed has played a major role in KPNC's decision to deploy the system in its remaining hospitals.
Although alert fatigue is the number 1 reason that clinicians do not utilize embedded clinical decision support,[26] simply calibrating statistical models is insufficient. Careful consideration of clinicians' needs and responsibilities, particularly around ownership of patients and documentation, is essential. Such consideration needs to include planning time and socializing the system (providing multiple venues for clinicians to learn about the system as well as participate in the process for using it).
We anticipate that, as the system leaves the pilot stage and becomes a routine component of hospital care, additional enhancements (eg, sending notifications to smart phones, providing an alert response tracking system) will be added. Our organization is also implementing real‐time concurrent review of inpatient EMRs (eg, for proactive detection of an expanded range of potential process failures), and work is underway on how to link the workflows we describe here with this effort. As has been the case with other systems,[27] it is likely that we will eventually move to continuous scanning of patient data rather than only every 6 hours. Given that the basic workflow is quite robust and amenable to local modifications, we are confident that our clinicians and hospitals will adapt to future system enhancements.
Lastly, we intend to conduct additional research on the clinical response itself. In particular, we consider it extremely important to conduct formal quantitative analyses on why some patients' outcomes are better than others following an alert. A key component of this effort will be to develop tools that can permit an automatedor nearly automatedassessment of the clinical response. For example, we are considering automated approaches that would scan the EMR for the presence of specific orders, notes, vital signs patterns, and laboratory tests following an alert. Whereas it may not be possible to dispense with manual chart review, even partial automation of a feedback process could lead to significant enhancement of our quality improvement efforts.
Acknowledgements
The authors thank Dr. Michelle Caughey, Dr. Philip Madvig, Dr. Brian Hoberman, Dr. Patricia Conolly, and Ms. Barbara Crawford for their administrative support; Dr. Tracy Lieu for reviewing the manuscript; and Ms. Rachel Lesser for formatting the manuscript. The authors also thank Drs. Jason Anderson, John Fitzgibbon, Elena M. Nishimura, and Najm Haq for their support of the project. We are particularly grateful to our nurses, Theresa A. Villorente, Zoe Sutton, Doanh Ly, Catherine Burger, and Hillary R. Mitchell, for their critical assistance. Last but not least, we also thank all the hospitalists and nurses at the Kaiser Permanente Sacramento and South San Francisco hospitals.
Disclosures: This work was supported by a grant from the Gordon and Betty Moore Foundation (Early Detection, Prevention, and Mitigation of Impending Physiologic Deterioration in Hospitalized Patients Outside Intensive Care: Phase 3, pilot), The Permanente Medical Group, Inc., and Kaiser Foundation Hospitals, Inc. Dr. Liu was supported by the National Institute for General Medical Sciences award K23GM112018. As part of our agreement with the Moore Foundation, we made a commitment to disseminate our findings in articles such as this one. However, the Gordon and Betty Moore Foundation played no role in how we actually structured our articles, nor did they review or preapprove any of the manuscripts submitted as part of the dissemination component; the same was the case with the other sponsors. None of the authors has any conflicts of interest to declare of relevance to this work
- , , , , . Location of patients before transfer to a tertiary care intensive care unit: impact on outcome. J Crit Care. 2009;24(1):108–113.
- , , , , , . Intra‐hospital transfers to a higher level of care: contribution to total hospital and intensive care unit (ICU) mortality and length of stay (LOS). J Hosp Med. 2011;6(2):74–80.
- , , , . Unplanned transfers to a medical intensive care unit: causes and relationship to preventable errors in care. J Hosp Med. 2011;6(2):68–72.
- , , , . Adverse outcomes associated with delayed intensive care unit transfers in an integrated healthcare system. J Hosp Med. 2012;7(3):224–230.
- , , , , , . Risk factors for unplanned transfer to intensive care within 24 hours of admission from the emergency department in an integrated healthcare system. J Hosp Med. 2013;8(1):13–19.
- , , , , , . Reducing hospital standardized mortality rate with early interventions. J Trauma Nursing. 2006;13(4):178–182.
- , , , , , . Centile‐based early warning scores derived from statistical distributions of vital signs. Resuscitation. 2011;82(8):1013–1018.
- , , , et al. Randomized trial of automated, electronic monitoring to facilitate early detection of sepsis in the intensive care unit. Crit Care Med. 2012;40(7):2096–2101.
- , , , et al. Early recognition of acutely deteriorating patients in non‐intensive care units: assessment of an innovative monitoring technology. J Hosp Med. 2012;7(8):628–633.
- , , , et al. A randomized trial of real‐time automated clinical deterioration alerts sent to a rapid response team. J Hosp Med. 2014;9(7):424–429.
- , , , et al. Improving situation awareness to reduce unrecognized clinical deterioration and serious safety events. Pediatrics. 2013;131(1):e298–e308.
- , , , , , . Early detection of impending physiologic deterioration among patients who are not in intensive care: development of predictive models using data from an automated electronic medical record. J Hosp Med. 2012;7(5):388–395.
- , , , , . Risk‐adjusting hospital mortality using a comprehensive electronic record in an integrated healthcare delivery system. Med Care. 2013;51(5):446–453.
- , , . et al. Early detection of critical illness outside the intensive care unit: clarifying treatment plans and honoring goals of care using a supportive care team. J Hosp Med. 2016;11:000–000.
- , . A qualitative study examining the influences on situation awareness and the identification, mitigation and escalation of recognised patient risk. BMJ Qual Saf. 2014;23(2):153–161.
- , , , et al. Piloting electronic medical record‐based early detection of inpatient deterioration in community hospitals. J Hosp Med. 2016;11:000–000.
- , , , , , . Nonelective rehospitalizations and postdischarge mortality: predictive models suitable for use in real time. Med Care. 2015;53(11):916–923.
- . The importance of cognitive errors in diagnosis and strategies to minimize them. Acad Med. 2003;78(8):775–780.
- , , . Cognitive debiasing 1: origins of bias and theory of debiasing. BMJ Qual Saf. 2013;22(suppl 2):ii58–ii64.
- , , . Cognitive debiasing 2: impediments to and strategies for change. BMJ Qual Saf. 2013;22(suppl 2):ii65–ii72.
- , , . Use of health information technology to reduce diagnostic errors. BMJ Qual Saf. 2013;22(suppl 2):ii40–ii51.
- , , , , , . The Improvement Guide: A Practical Approach to Enhancing Organizational Performance. 2nd ed. San Francisco, CA: Jossey‐Bass; 2009.
- , , , , . Understanding the components of quality improvement collaboratives: a systematic literature review. Milbank Q. 2013;91(2):354–394.
- , , . Reducing diagnostic errors in medicine: what's the goal? Acad Med. 2002;77(10):981–992.
- , , , . Huddling for high reliability and situation awareness. BMJ Qual Saf. 2013;22(11):899–906.
- Top 10 patient safety concerns for healthcare organizations. ECRI Institute website. Available at: https://www.ecri.org/Pages/Top‐10‐Patient‐Safety‐Concerns.aspx. Accessed February 18, 2016.
- , , , et al. Automated detection of physiologic deterioration in hospitalized patients. J Am Med Inform Assoc. 2015;22(2):350–360.
Patients who deteriorate outside highly monitored settings and who require unplanned transfer to the intensive care unit (ICU) are known to have high mortality and morbidity.[1, 2, 3, 4, 5] The notion that early detection of a deteriorating patient improves outcomes has intuitive appeal and is discussed in a large number of publications.[6, 7, 8, 9, 10] However, much less information is available on what should be done after early detection is made.[11] Existing literature on early warning systems (EWSs) does not provide enough detail to serve as a map for implementation. This lack of transparency is complicated by the fact that, although the comprehensive inpatient electronic medical record (EMR) now constitutes the central locus for clinical practice, much of the existing literature comes from research institutions that may employ home‐grown EMRs, not community hospitals that employ commercially available systems.
In this issue of the Journal of Hospital Medicine, we describe our efforts to bridge that gap by implementing an EWS in a pair of community hospitals. The EWS's development and its basic statistical and electronic infrastructure are described in the articles by Escobar and Dellinger and Escobar et al.[2, 12, 13] In this report, we focus on how we addressed clinicians' primary concern: What do we do when we get an alert? Because it is described in detail by Granich et al.[14] elsewhere in this issue of the Journal of Hospital Medicine, a critical component of our implementation process (ensuring that patient preferences with respect to supportive care are honored) is not discussed.
Our article is divided into the following sections: rationale, preimplementation preparatory work, workflow development, response protocols, challenges and key learnings, and concluding reflections.
RATIONALE
Much of the previous work on the implementation of alarm systems has focused on the statistics behind detection or on the quantification of processes (eg, how many rapid response calls were triggered) or on outcomes such as mortality. The conceptual underpinnings and practical steps necessary for successful integration of an alarm system into the clinicians' workflow have not been articulated. Our theoretical framework was based on (1) improving situational awareness[15] (knowing what is going on around you and what is likely to happen next) and (2) mitigating cognitive errors.
An EWS enhances situational awareness most directly by earlier identification of a problem with a particular patient. As is detailed by Escobar et al.[16] in this issue of the Journal of Hospital Medicine, our EWS extracts EMR data every 6 hours, performs multiple calculations, and then displays 3 scores in real time in the inpatient dashboard (known as the Patient Lists activity in the Epic EMR). The first of these scores is the Laboratory‐Based Acute Physiologic Score, version 2 (LAPS2), an objective severity score whose retrospective version is already in use in Kaiser Permanente Northern California (KPNC) for internal benchmarking.[13] This score captures a patient's overall degree of physiologic instability within the preceding 72 hours. The second is the Comorbidity Point Score, version 2 (COPS2), a longitudinal comorbidity score based on the patient's diagnoses over the preceding 12 months.[13] This score captures a patient's overall comorbidity burden. Thus, it is possible for a patient to be very ill (high COPS2) while also being stable (low LAPS2) or vice versa. Both of these scores have other uses, including prediction of rehospitalization risk in real time,[17] which is also being piloted at KPNC. Finally, the Advanced Alert Monitoring (AAM) score, which integrates the LAPS2 and COPS2 with other variables, provides a 12‐hour deterioration risk, with a threshold value of 8% triggering response protocols. At or above this threshold, which was agreed to prior to implementation, the system achieves 25% sensitivity, 98% specificity, with a number needed to evaluate of 10 to 12, a level of workload that was felt to be acceptable by clinicians. Actions triggered by the EWS may be quite different from those one would take when being notified of a code blue, which is called at the time an event occurs. The EWS focuses attention on patients who might be missed because they do not yet appear critically ill. It also provides a shared, quantifiable measure of a patient's risk that can trigger a standardized plan of action to follow in evaluating and treating a patient.[15]
In addition to enhancing situational awareness, we intended the alarms to produce cognitive change in practitioners. Our goal was to replace medical intuition with analytic, evidence‐based judgment of future illness. We proceeded with the understanding that replacing quick intuition with slower analytic response is an essential skill in developing sound clinical reasoning.[18, 19, 20] The alert encourages physicians to reassess high‐risk patients facilitating a cognitive shift from automatic, error‐prone processing to slower, deliberate processing. Given the busy pace of ward work, slowing down permits clinicians to reassess previously overlooked details. Related to this process of inducing cognitive change is a secondary effect: we uncovered and discussed physician biases. Physicians are subject to potential biases that allow patients to deteriorate.[18, 19, 20] Therefore, we addressed bias through education. By reviewing particular cases of unanticipated deterioration at each hospital facility, we provided evidence for the problem of in‐hospital deterioration. This framed the new tool as an opportunity for improving treatment and encouraged physicians to act on the alert using a structured process.
INTERVENTIONS
Preimplementation Preparatory Work
Initial KPNC data provided strong support for the generally accepted notion that unplanned transfer patients have poor outcomes.[2, 4, 5] However, published reports failed to provide the granular detail clinicians need to implement a response arm at the unit and patient level. In preparation for going live, we conducted a retrospective chart review. This included data from patients hospitalized from January 1, 2011 through December 31, 2012 (additional detail is provided in the Supporting Information, Appendix, in the online version of this article). The key findings from our internal review of subjective documentation preceding deterioration are similar to those described in the literature and summarized in Figure 1, which displays the 5 most common clinical presentations associated with unplanned transfers.
The chart review served several major roles. First, it facilitated cognitive change by eliminating the notion that it can't happen here. Second, it provided considerable guidance on key clinical components that had to be incorporated into the workflow. Third, it engaged the rapid response team (RRT) in reviewing our work retrospectively to identify future opportunities. Finally, the review provided considerable guidance with respect to structuring documentation requirements.
As a result of the above efforts, other processes detailed below, and knowledge described in several of the companion articles in this issue of the Journal of Hospital Medicine, 3 critical elements, which had been explicitly required by our leadership, were in place prior to the go‐live date: a general consensus among hospitalists and nurses that this would be worth testing, a basic clinical response workflow, and an automated checklist for documentation. We refined these in a 2‐week shadowing phase preceding the start date. In this phase, the alerts were not displayed in the EMR. Instead, programmers working on the project notified selected physician leaders by phone. This permitted them to understand exactly what sort of patients were reaching the physiologic threshold so that they could better prepare both RRT registered nurses (RNs) and hospitalists for the go‐live date. This also provided an opportunity to begin refining the documentation process using actual patients.
The original name for our project was Early Detection of Impending Physiologic Deterioration. However, during the preparatory phase, consultation with our public relations staff led to a concern that the name could be frightening to some patients. This highlights the need to consider patient perceptions and how words used in 1 way by physicians can have different connotations to nonclinicians. Consequently, the system was renamed, and it is now referred to as Advance Alert Monitoring (AAM).
Workflow Development
We carefully examined the space where electronic data, graphical user interfaces, and clinical practice blend, a nexus now commonly referred to as workflow or user experience.[21] To promote situational awareness and effect cognitive change, we utilized the Institute for Health Care Improvement's Plan‐Do‐Study‐Act model.[22, 23] We then facilitated the iterative development of a clinician‐endorsed workflow.[22, 23, 24, 25] By adjusting the workflow based on ongoing experience and giving clinicians multiple opportunities to revise (a process that continues to date), we ensured clinicians would approach and endorse the alarm system as a useful tool for decision support.
Table 1 summarizes the work groups assembled for our implementation, and Table 2 provides a system‐oriented checklist indicating key components that need to be in place prior to having an early warning system go live in a hospital. Figure 2 summarizes the alert response protocols we developed through an iterative process at the 2 pilot sites. The care path shown in Figure 2 is the result of considerable revision, mostly due to actual experience acquired following the go live date. The diagram also includes a component that is still work in progress. This is how an emergency department probability estimate (triage support) will be integrated into both the ward as well as the ICU workflows. Although this is beyond the scope of this article, other hospitals may be experimenting with triage support (eg, for sepsis patients), so it is important to consider how one would incorporate such support into workflows.
| Workgroup | Goals |
|---|---|
| |
| Clinical checklist | Perform structured chart review of selected unplanned transfer patients and near misses |
| Develop a checklist for mitigation strategies given an alert | |
| Develop documentation standards given an alert | |
| Develop escalation protocol given an alert | |
| Workload and threshold | Determine threshold for sensitivity of alerts and resulting impact on clinician workload |
| Patient preferences | Prepare background information to be presented to providers regarding end‐of‐life care and POLST orders |
| Coordinate with clinical checklist workgroup to generate documentation templates that provide guidance for appropriate management of patients regarding preferences on escalation of care and end‐of‐life care | |
| Electronic medical record coordination | Review proposed electronic medical record changes |
| Make recommendation for further changes as needed | |
| Develop plan for rollout of new and/or revised electronic record tools | |
| Designate contact list for questions/emssues that may arise regarding electronic record changes during the pilot | |
| Determine alert display choices and mode of alert notification | |
| Nursing committee | Review staffing needs in anticipation of alert |
| Coordinate with workload and threshold group | |
| Develop training calendar to ensure skills necessary for successful implementation of alerts | |
| Make recommendations for potential modification of rapid response team's role in development of a clinical checklist for nurses responding to an alert | |
| Design educational materials for clinicians | |
| Local communication strategy | Develop internal communication plan (for clinical staff not directly involved with pilot) |
| Develop external communication plan (for nonclinicians who may hear about the project) | |
| Level | Tasks |
|---|---|
| Administration | Obtain executive committee approval |
| Establish communication protocols with quality assurance and quality improvement committees | |
| Review protocols with medicallegal department | |
| Communication | Write media material for patients and families |
| Develop and disseminate scripts for front‐line staff | |
| Develop communication and meet with all relevant front‐line staff on merits of project | |
| Educate all staff on workflow changes and impacts | |
| Clinical preparation | Conduct internal review of unplanned transfers and present results to all clinicians |
| Determine service level agreements, ownership of at‐risk patients, who will access alerts | |
| Conduct staff meetings to educate staff | |
| Perform debriefs on relevant cases | |
| Determine desired outcomes, process measures, balancing measures | |
| Determine acceptable clinician burden (alerts/day) | |
| Technology | Establish documentation templates |
| Ensure access to new data fields (electronic medical record security process must be followed for access rights) | |
| Workflows | Workflows (clinical response, patient preferences, supportive care, communication, documentation) must be in place prior to actual go live |
| Shadowing | Testing period (alerts communicated to selected clinicians prior to going live) should occur |
RESPONSE PROTOCOLS
At South San Francisco, the RRT consists of an ICU nurse, a respiratory care therapist, and a designated hospitalist; at Sacramento, the team is also augmented by an additional nurse (the house supervisor). In addition to responding to the AAM alerts, RRT nurses respond to other emergency calls such as code blues, stroke alerts, and patient or patient‐familyinitiated rapid response calls. They also expedite time sensitive workups and treatments. They check up on recent transfers from the ICU to ensure continued improvement justifying staying on the ward. Serving as peer educators, they assist with processes such as chest tube or central line insertions, troubleshoot high‐risk medication administration, and ensure that treatment bundles (eg, for sepsis) occur expeditiously.
The RRT reviews EWS scores every 6 hours. The AAM score is seen as soon as providers open the chart, which helps triage patients for evaluation. Because patients can still be at risk even without an elevated AAM score, all normal escalation pathways remain in place. Once an alert is noted in the inpatient dashboard, the RRT nurse obtains a fresh set of vital signs, assesses the patient's clinical status, and informs the physician, social worker, and primary nurse (Figure 2). Team members work with the bedside nurse, providing support with assessment, interventions, plans, and follow‐up. Once advised of the alert, the hospitalist performs a second chart review and evaluates the patient at the bedside to identify factors that could underlie potential deterioration. After this evaluation, the hospitalist documents concerns, orders appropriate interventions (which can include escalation), and determines appropriate follow‐up. We made sure the team knew that respiratory distress, arrhythmias, mental status changes, or worsening infection were responsible for over 80% of in‐hospital deterioration cases. We also involved palliative care earlier in patient care, streamlining the process so the RRT makes just 1 phone call to the social worker, who contacts the palliative care physician and nurse to ensure patients have a designated surrogate in the event of further deterioration.
Our initial documentation template consisted of a comprehensive organ system‐based physician checklist. However, although this was of use to covering physicians unfamiliar with a given patient, it was redundant and annoying to attending providers already familiar with the patient. After more than 30 iterations, we settled on a succinct note that only documented the clinicians' clinical judgment as to what constituted the major risk for deterioration and what the mitigation strategies would be. Both of these judgments are in a checklist format (see Supporting Information, Appendix, in the online version of this article for the components of the physician and nurse notes).
Prior to the implementation of the system, RRT nurses performed proactive rounding by manually checking patient labs and vital signs, an inefficient process due to the poor sensitivity and specificity of individual values. Following implementation of the system, RRT RNs and clinicians switched to sorting patients by the 3 scores (COPS2, LAPS2, AAM). For example, patients may be stable at admission (as evidenced by their AAM score) but be at high risk due to their comorbidities. One approach that has been employed is to proactively check such patients to ensure they have a care directive in place, as is described in the article by Granich et al.[14] The Supportive Care Team (detailed in Granich et al.) assesses needs for palliative care and provides in‐hospital consultation as needed. Social services staff perform chart reviews to ensure a patient surrogate has been defined and also works with patients and their families to clarify goals of care.
CHALLENGES AND KEY LEARNINGS
One challenge that arose was reconciling the periodic nature of the alert (every 6 hours) with physicians' availability, which varied due to different rounding workflows at the 2 sites. Consequently, the alert cycle was changed; at the first site, the cycle was set to 1000‐1600‐2200‐0400, whereas the second site chose 0800‐1400‐2000‐0200.
One essential but problematic component of the clinical response is the issue of documentation. Inadequate documentation could lead to adverse outcomes, clinician malpractice exposure, and placing the entire hospital at risk for enterprise liability when clinical responses are not documented. This issue is complicated by the fact that overzealous efforts could lead to less or no documentation by making it too onerous for busy clinicians. We found that the ease with which data can populate progress notes in the EMR can lead to note bloat. Clearly, no documentation is not enough, and a complete history and physical is too much. Paradoxically, 1 of the issues underlying our problems with documentation was the proactive nature of the alerts themselves; because they are based on an outcome prediction in the next 12 hours, documenting the response to them may lack (perceived) urgency.
Shortly after the system went live, a patient who had been recently transferred out to the ward from the ICU triggered an alert. As a response was mounted, the team realized that existing ward protocols did not specify which physician service (intensivist or hospitalist) was responsible for patients who were transitioning from 1 unit to another. We also had to perform multiple revisions of the protocols specifying how alerts were handled when they occurred at times of change of shift. Eventually, we settled on having the combination of a hospitalist and an RRT nurse as the cornerstone of the response, with the hospitalist service as the primary owner of the entire process, but this arrangement might need to be varied in different settings. As a result of the experience with the pilot, the business case for deployment in the remaining 19 hospitals includes a formal budget request so that all have properly staffed RRTs, although the issue of primary ownership of the alert process for different patient types (eg, surgical patients) will be decided on a hospital‐by‐hospital basis. These experiences raise the intriguing possibility that implementation of alert systems can lead to the identification of systemic gaps in existing protocols. These gaps can include specific components of the hospital service agreements between multiple departments (emergency, hospital medicine, ICU, palliative care, surgery) as well as problems with existing workflows.
In addition to ongoing tweaking of care protocols, 3 issues remain unresolved. First is the issue of documentation. The current documentation notes are not completely satisfactory, and we are working with the KPNC EMR administrators to refine the tool. Desirable refinements include (1) having the system scores populate in more accessible sectors of the EMR where their retrieval will facilitate increased automation of the note writing process, (2) changing the note type to a note that will facilitate process audits, and (3) linking the note to other EMR tools so that the response arm can be tracked more formally. The second issue is the need to develop strategies to address staff turnover; for example, newer staff may not have received the same degree of exposure to the system as those who were there when it was started. Finally, due to limited resources, we have done very limited work on more mechanistic analyses of the clinical response itself. For example, it would be desirable to perform a formal quantitative, risk‐adjusted process‐outcome analysis of why some patients' outcomes are better than others following an alert.
Finally, it is also the case that we have had some unexpected occurrences that hint at new uses and benefits of alert systems. One of these is the phenomenon of chasing the alert. Some clinicians, on their own, have taken a more proactive stance in the care of patients in whom the AAM score is rising or near the alert threshold. This has 2 potential consequences. Some patients are stabilized and thus do not reach threshold instability levels. In other cases, patients reach threshold but the response team is informed that things are already under control. A second unexpected result is increased requests for COPS2 scores by clinicians who have heard about the system, particularly surgeons who would like to use the comorbidity scores as a screening tool in the outpatient setting. Because KPNC is an integrated system, it is not likely that such alternatives will be implemented immediately without considerable analysis, but it is clear that the system's deployment has captured the clinicians' imagination.
CONCLUSIONS AND FUTURE DIRECTIONS
Our preparatory efforts have been successful. We have found that embedding an EWS in a commercially available EMR is acceptable to hospital physicians and nurses. We have developed a coordinated workflow for mitigation and escalation that is tightly linked to the availability of probabilistic alerts in real time. Although resource limitations have precluded us from conducting formal clinician surveys, the EWS has been discussed at multiple hospital‐wide as well as department‐specific meetings. Although there have been requests for clarification, refinements, and modifications in workflows, no one has suggested that the system be discontinued. Further, many of the other KPNC hospitals have requested that the EWS be deployed at their site. We have examined KPNC databases that track patient complaints and have not found any complaints that could be linked to the EWS. Most importantly, the existence of the workflows we have developed has played a major role in KPNC's decision to deploy the system in its remaining hospitals.
Although alert fatigue is the number 1 reason that clinicians do not utilize embedded clinical decision support,[26] simply calibrating statistical models is insufficient. Careful consideration of clinicians' needs and responsibilities, particularly around ownership of patients and documentation, is essential. Such consideration needs to include planning time and socializing the system (providing multiple venues for clinicians to learn about the system as well as participate in the process for using it).
We anticipate that, as the system leaves the pilot stage and becomes a routine component of hospital care, additional enhancements (eg, sending notifications to smart phones, providing an alert response tracking system) will be added. Our organization is also implementing real‐time concurrent review of inpatient EMRs (eg, for proactive detection of an expanded range of potential process failures), and work is underway on how to link the workflows we describe here with this effort. As has been the case with other systems,[27] it is likely that we will eventually move to continuous scanning of patient data rather than only every 6 hours. Given that the basic workflow is quite robust and amenable to local modifications, we are confident that our clinicians and hospitals will adapt to future system enhancements.
Lastly, we intend to conduct additional research on the clinical response itself. In particular, we consider it extremely important to conduct formal quantitative analyses on why some patients' outcomes are better than others following an alert. A key component of this effort will be to develop tools that can permit an automatedor nearly automatedassessment of the clinical response. For example, we are considering automated approaches that would scan the EMR for the presence of specific orders, notes, vital signs patterns, and laboratory tests following an alert. Whereas it may not be possible to dispense with manual chart review, even partial automation of a feedback process could lead to significant enhancement of our quality improvement efforts.
Acknowledgements
The authors thank Dr. Michelle Caughey, Dr. Philip Madvig, Dr. Brian Hoberman, Dr. Patricia Conolly, and Ms. Barbara Crawford for their administrative support; Dr. Tracy Lieu for reviewing the manuscript; and Ms. Rachel Lesser for formatting the manuscript. The authors also thank Drs. Jason Anderson, John Fitzgibbon, Elena M. Nishimura, and Najm Haq for their support of the project. We are particularly grateful to our nurses, Theresa A. Villorente, Zoe Sutton, Doanh Ly, Catherine Burger, and Hillary R. Mitchell, for their critical assistance. Last but not least, we also thank all the hospitalists and nurses at the Kaiser Permanente Sacramento and South San Francisco hospitals.
Disclosures: This work was supported by a grant from the Gordon and Betty Moore Foundation (Early Detection, Prevention, and Mitigation of Impending Physiologic Deterioration in Hospitalized Patients Outside Intensive Care: Phase 3, pilot), The Permanente Medical Group, Inc., and Kaiser Foundation Hospitals, Inc. Dr. Liu was supported by the National Institute for General Medical Sciences award K23GM112018. As part of our agreement with the Moore Foundation, we made a commitment to disseminate our findings in articles such as this one. However, the Gordon and Betty Moore Foundation played no role in how we actually structured our articles, nor did they review or preapprove any of the manuscripts submitted as part of the dissemination component; the same was the case with the other sponsors. None of the authors has any conflicts of interest to declare of relevance to this work
- , , , , . Location of patients before transfer to a tertiary care intensive care unit: impact on outcome. J Crit Care. 2009;24(1):108–113.
- , , , , , . Intra‐hospital transfers to a higher level of care: contribution to total hospital and intensive care unit (ICU) mortality and length of stay (LOS). J Hosp Med. 2011;6(2):74–80.
- , , , . Unplanned transfers to a medical intensive care unit: causes and relationship to preventable errors in care. J Hosp Med. 2011;6(2):68–72.
- , , , . Adverse outcomes associated with delayed intensive care unit transfers in an integrated healthcare system. J Hosp Med. 2012;7(3):224–230.
- , , , , , . Risk factors for unplanned transfer to intensive care within 24 hours of admission from the emergency department in an integrated healthcare system. J Hosp Med. 2013;8(1):13–19.
- , , , , , . Reducing hospital standardized mortality rate with early interventions. J Trauma Nursing. 2006;13(4):178–182.
- , , , , , . Centile‐based early warning scores derived from statistical distributions of vital signs. Resuscitation. 2011;82(8):1013–1018.
- , , , et al. Randomized trial of automated, electronic monitoring to facilitate early detection of sepsis in the intensive care unit. Crit Care Med. 2012;40(7):2096–2101.
- , , , et al. Early recognition of acutely deteriorating patients in non‐intensive care units: assessment of an innovative monitoring technology. J Hosp Med. 2012;7(8):628–633.
- , , , et al. A randomized trial of real‐time automated clinical deterioration alerts sent to a rapid response team. J Hosp Med. 2014;9(7):424–429.
- , , , et al. Improving situation awareness to reduce unrecognized clinical deterioration and serious safety events. Pediatrics. 2013;131(1):e298–e308.
- , , , , , . Early detection of impending physiologic deterioration among patients who are not in intensive care: development of predictive models using data from an automated electronic medical record. J Hosp Med. 2012;7(5):388–395.
- , , , , . Risk‐adjusting hospital mortality using a comprehensive electronic record in an integrated healthcare delivery system. Med Care. 2013;51(5):446–453.
- , , . et al. Early detection of critical illness outside the intensive care unit: clarifying treatment plans and honoring goals of care using a supportive care team. J Hosp Med. 2016;11:000–000.
- , . A qualitative study examining the influences on situation awareness and the identification, mitigation and escalation of recognised patient risk. BMJ Qual Saf. 2014;23(2):153–161.
- , , , et al. Piloting electronic medical record‐based early detection of inpatient deterioration in community hospitals. J Hosp Med. 2016;11:000–000.
- , , , , , . Nonelective rehospitalizations and postdischarge mortality: predictive models suitable for use in real time. Med Care. 2015;53(11):916–923.
- . The importance of cognitive errors in diagnosis and strategies to minimize them. Acad Med. 2003;78(8):775–780.
- , , . Cognitive debiasing 1: origins of bias and theory of debiasing. BMJ Qual Saf. 2013;22(suppl 2):ii58–ii64.
- , , . Cognitive debiasing 2: impediments to and strategies for change. BMJ Qual Saf. 2013;22(suppl 2):ii65–ii72.
- , , . Use of health information technology to reduce diagnostic errors. BMJ Qual Saf. 2013;22(suppl 2):ii40–ii51.
- , , , , , . The Improvement Guide: A Practical Approach to Enhancing Organizational Performance. 2nd ed. San Francisco, CA: Jossey‐Bass; 2009.
- , , , , . Understanding the components of quality improvement collaboratives: a systematic literature review. Milbank Q. 2013;91(2):354–394.
- , , . Reducing diagnostic errors in medicine: what's the goal? Acad Med. 2002;77(10):981–992.
- , , , . Huddling for high reliability and situation awareness. BMJ Qual Saf. 2013;22(11):899–906.
- Top 10 patient safety concerns for healthcare organizations. ECRI Institute website. Available at: https://www.ecri.org/Pages/Top‐10‐Patient‐Safety‐Concerns.aspx. Accessed February 18, 2016.
- , , , et al. Automated detection of physiologic deterioration in hospitalized patients. J Am Med Inform Assoc. 2015;22(2):350–360.

The Learning Hospital System
In the landmark Best Care at Lower Cost report, the Institute of Medicine presents a compelling vision of a US healthcare system where science, information technology, incentives, and care culture are brought together seamlessly to produce high‐quality healthcare.[1] At the center of this transformation is the learning healthcare system, a system characterized by its ability to leverage data arising from care provision to drive rapid improvements in care delivery.[2] When steeped within the right organizational milieu, these data help to close the virtuous cycle of continuous learning moving from science to evidence to care and back to new science. The anticipated end result is a healthcare system that can provide Americans with superior care at lower cost.
Hospital‐based practitioners will recognize the inpatient setting as an ideal demonstration opportunity for continuous learning. Hospital care is costly, accounting for more than 30% of all US healthcare costs[3]; intensive care alone accounts for a notable proportion of the US gross domestic product.[4] Inpatient care is associated with significant mortality and morbidity, and its use is often greatly increased in patients' last days.[5, 6] Fortunately, the inpatient setting also offers an ideal opportunity to leverage high‐quality data to help inform and improve care. The digitization of medicine means that far more data are now available through electronic health records, medical devices, and tests.[7] This is particularly true for inpatients, for whom a large volume of data are produced even over relatively short hospital stays.
Whereas the challenge to improve hospital care is daunting, there is an incredible opportunity to advance the quality of inpatient care through realizing the vision of the learning hospital system. In the sections that follow, we use an object lessonsepsis care within hospitals of the Kaiser Permanente Northern California (KPNC) integrated healthcare delivery systemto evaluate the challenges and insights gleaned from working toward building a learning hospital system. Then, we describe further steps that could enhance the use of inpatient data to drive improved care.
THE FRAMEWORK OF A LEARNING HEALTHCARE SYSTEM
Best Care at Lower Cost notes a fundamental paradox in US healthcare: although we have witnessed a dramatic expansion in biomedical knowledge, innovative therapies and surgical procedures, and clinical treatments to extend survival, US healthcare persistently falls short on the basic dimensions of quality, outcomes, cost, and equity.[1] The proposed path forward lies in building the learning healthcare system, a system characterized by continuous knowledge development, improvement, and application. Figure 1 shows the critical nodes in the framework for continuous learning, which include: (1) the development of new scientific knowledge (science), (2) the translation of science into clinical evidence of efficacy (evidence), and (3) the application of efficacious interventions through effective care delivery (care). In healthcare today, transitions between these nodes are rife with missed or wasted opportunities like delays in applying high‐quality evidence or poorly managed insights arising from scientific discovery. If such opportunities could be recovered, however, the quality of healthcare could be improved dramatically.[8]

The pursuit of continuous learning is aided by rapid changes in the quality and quantity of biomedical data available over the past decade, especially through the use of electronic health records, novel biomolecular tools, and digital sensors.[2, 7, 9] The Internet has ushered in a new era of data connectivity, for example, allowing for highly engaged communication between patients and providers as well as collaboration between professional or citizen scientists on data of unprecedented scale.[10] New methodologic approaches, including data mining and machine learning, increasingly leverage commodity hardware to conduct previously computationally intractable analyses.[9] Moreover, the development of domain ontologies fosters the discovery of meaningful insights from data of heterogeneous types.[11]
Ultimately, however, improvements in data alone are inadequate to achieve continuous learning. As shown in Figure 1, whereas data form the channels that allow for transitions from science to evidence to care, novel insights need to be steeped within the right culture, motivated by the right incentives, and supported by the right leaders.[1, 12] Within the sustainable learning healthcare system, knowledge generation feeds practice change with the support and guidance of system leadership; improved practice, in turn, generates new knowledge and completes the virtuous cycle of learning.
THE PROMISE OF CONTINUOUS LEARNING IN HOSPITAL SETTINGS
The hospital is an ideal setting in which to foster continuous learning because advances in inpatient care have the potential to substantially improve healthcare quality and value.[8] Americans were hospitalized roughly 37 million times in 2012; in total, these episodes cost $378 billion.[3] Over 700,000 patients die in US hospitals annually, with reports showing that many patients utilize greatly increased inpatient and critical care services near the end of their lives in a manner that appears misaligned with their preferences.[11, 13] Hospital care is also highly variable in quality and cost; this heterogeneity is not closely associated with improved outcomes.[14, 15] Preventable harm and medical injury occur commonly in hospitals and are now recognized to be a leading cause of inpatient death.[16] Finally, emerging research illuminates the substantial toll that acute care has on patients and families resulting in new comorbidity, functional or neuropsychiatric impairment, rehospitalization, and financial burden that persist long after patients are discharged.[17]
Fortunately, inpatient care also exhibits several qualities that improve the likelihood that continuous learning can be achieved. Although it is clear that hospitalizations occur within the arc of a patient's larger health trajectory, these distinct episodes offer the potential to observe patient trajectories and treatments evolving within relatively compressed time intervals; over that same interval, a large volume of data are produced. Stored within comprehensive electronic health records, these granular data now allow inpatient episodes to be digitally recapitulated with high fidelity, bolstering their use in driving care improvements.[18]
AN OBJECT LESSON IN THE LEARNING FRAMEWORK: SEPSIS CARE
Translating Science to Evidence in Sepsis
Although sepsis has attracted great attention in modern hospital care, sepsis was described long ago by Hippocrates to describe the process by which wounds fester.[19] Recast after the confirmation of germ theory, sepsis came to be known primarily as the blood poisoning resulting from pathogenic organisms.[20] However, with the advent of antibiotics, numerous scientific studies now recognize that sepsis actually results from the dysregulated host immune response to systemic infection, which can also cause organ dysfunction.[21] Based on this knowledge, landmark translational and clinical studies in the 2000s provided strong evidence that early identification of sepsis patients and aggressive infection control and resuscitation were associated with improved mortality (Figure 2, step 1).[22]
Translating Evidence to Care in Sepsis at KPNC
In 2007, the leadership of KPNC initiated a regional effort to improve the quality of care and reduce the variability in performance at its medical centers (Table 1).[23] Reviewing data from nearly 1000 inpatientsthe last 50 consecutive hospital deaths from each of 19 medical centersa mortality diagnostic based on Institute for Healthcare Improvement recommendations[24] revealed that sepsis had a major impact on hospital outcomes. For example, even though sepsis patients were still relatively under‐recognized at the time, accounting for fewer than 3% of hospitalizations, they contributed to one‐quarter of hospital deaths. In light of these compelling data, senior regional leadership identified reducing sepsis mortality as a key performance improvement goal (Figure 2, step 2).
| Time Period | Event Summary |
|---|---|
| |
| 2007 | Variability in hospital standardized mortality ratio observed, indicating an opportunity to drive improved outcomes. |
| Initiation of staggered implementation of unified electronic medical record across all KP sites (starting in 2006 and ending in 2009). | |
| Spring 2008 | Mortality diagnostic chart review completed identifying sepsis and infection‐related causes as key factors in hospital outcomes. |
| May 2008 | Regional Mortality Summit held with a focus on patient safety and mortality reduction efforts through performance improvement. Executive regional and local leadership alignment to focus on sepsis performance improvement. |
| Summer 2008 | Sepsis Steering Committee evaluates best available evidence, develops treatment algorithms, and plans for medical center pilots. |
| Fall 2008 | Pilot intervention deployed at 2 medical centers. |
| November 2008 | First Regional Sepsis Summit: development of sepsis performance improvement playbook, training materials, implementation plans, and measurement strategy. |
| November 2008 | All medical centers begin to form multidisciplinary sepsis teams and performance improvement committees, obtain equipment and supplies including assembly of a sepsis cart. Multidisciplinary teams included ED physician champion, ED nurse champion, improvement advisor, hospitalists, intensivists, quality improvement personnel, nurse educators, and even resident physicians. |
| January 2009 | Performance data collection begins on EGDT processes and outcomes. Initiation of 2 key elements to enhance screening for and detection of sepsis: (1) concomitant ordering of serum lactic acid along with blood cultures, and (2) definition of lactate >2.0 as a critical lab value. |
| Use of manual chart review for case finding and central database entry because of ongoing implementation of electronic medical record and limited sepsis‐specific data infrastructure. | |
| March 2009 | Regional train the trainer sessions occur and local educational spread efforts begin including: collaborative calls, in‐person training events, and medical center site visits. |
| August 2009 | Grant funding from the Gordon and Betty Moore Foundation begins with a planned 2‐year duration providing funding for improvement advisors with performance improvement expertise and data infrastructure development. |
| November 2009 | Second Regional Sepsis Summit. Identification of intermediate lactate sepsis patients having significant mortality. |
| January 2010 | Initiate measurement of performance for intermediate lactate sepsis patients with a focus on lactate clearance as an outcome measure of interest. |
| 2010 | Development of an intranet Web‐based data abstraction tool to identify cases and auto‐populate specific fields for review. Facilities were responsible for review of cases at the local level to foster rapid feedback cycles for local performance improvement. Standardized data query tools were deployed to foster local medical center engagement and system‐level evaluation. |
| Accompanying development of a sepsis performance improvement scorecard allowing for comparison of longitudinal performance metrics across all facilities. Scorecard elements included: proportion of lactates drawn following ED blood culture, EGDT‐specific bundle elements (ie, number of EGDT cases, antibiotics within 1 hour, first central venous pressure within 2 hours of EGDT start, target mean arterial pressure achievement), repeat lactate elements, balancing measures for central line placement (ie, pneumothorax, central line infection), and overall sepsis statistics. | |
| April 2011 | Third Regional Sepsis Summit. Refinement of EGDT bundle and further development of intermediate lactate bundle approach, including piloting specific treatment bundles targeting this population. Collaborative performance improvement environment in which successful strategies at 1 site were rapidly disseminated to other sites including the Sepsis Alert and the Sepsis Clock. |
| May 2012 | Research analysis of fluid volume and lactate clearance in intermediate lactate sepsis population begins. |
| February 2013 | Fourth Regional Sepsis Summit. Regional spread of intermediate lactate bundle including the use of fluids, antibiotics, and repeat lactate measurements. |
| May 2013 | Research analysis of the contribution of sepsis to hospital deaths (within KP and in national sample) as well as post‐sepsis resource utilization and mortality |
| March 2014 | Publication of ProCESS randomized clinical trial, requiring systemic reevaluation of EGDT‐based sepsis strategy. Subsequent publications of ARISE and ProMISe trials confirming findings from ProCESS. Updated approach under consideration and informally disseminated to practitioners. |
| October 2014 | Updated sepsis treatment guidelines and data capture strategy fully implemented moving away from a catheter‐based strategy for all EGDT‐eligible patients. |
| October 2015 | Sixth Regional Sepsis Summit held to adjust sepsis treatment and data measurement strategy to align more closely with CMS SEP‐1 guidelines. |
Based on the principles of performance improvement methodology, clinical and operational leaders established an environment with aligned culture, incentives, and leadership around sepsis care. The effort was launched in late 2008 at a Sepsis Summit, bringing together a multidisciplinary group of stakeholders (eg, hospitalist, emergency department, and intensive care chiefs of staff and nursing managers; medical center and nursing executive and operational leadership) and providing sepsis care pathways based on the best available evidence.[23] Regional investments in the digital infrastructure to support implementation resulted in the provision of granular data within monthly sepsis scorecards quantifying each medical center's performance and trends for a diverse set of sepsis bundle metrics.
The resulting changes in sepsis care were substantial. For example, improved early recognition of infected patients meeting the criteria for sepsis resulted in large changes in the standardized diagnostic criteria used to label patients (Figure 3A). Implementing screening strategies using serum lactate testing for any patient receiving blood cultures resulted in a roughly 10‐fold increase in the use of lactate testing in the emergency department (Figure 3B). Earlier recognition of sepsis also increased the number of patients receiving early antibiotics and receiving central venous catheters for quantitative resuscitation.[23]
CLOSING THE LOOP TOWARD CONTINUOUS LEARNING IN SEPSIS
Leveraging timely and actionable data steeped within an aligned organizational milieu resulted in large‐scale changes across a heterogeneous set of hospitals. However, to realize the true vision of a learning hospital system, a looming question remained: Could the data generated as the byproduct of routine care now be used to complete the virtuous cycle and drive new scientific discovery (Figure 2, step 3)?
Confirming Concordance in the Impact of Sepsis Nationally
The heightened identification of sepsis patients through program implementation revealed that the impact of sepsis on hospital mortality was greater than originally estimated; based on improved patient identification, sepsis now accounted for upward of 1 in 2 hospital deaths.[25] This sobering statistic confirmed that the investments in standardizing best sepsis care following the mortality diagnostic were critical. However, were similar estimates of sepsis‐attributable mortality consistent outside of the KPNC system? To study this, we examined US hospitalizations occurring across >1000 hospitals and involving >6 million hospital stays to estimate corresponding prevalence.[25] In this national sample, sepsis contributed to as many as half of hospital deaths in the United States in 2010, lending strong support to ongoing international and state‐based efforts to improve sepsis care. These studies also paved the way to use these data drawn from our large sepsis population to inform updated international consensus definitions for sepsis and septic shock.[26, 27, 28]
Identifying New Avenues for Reducing the Toll of Sepsis
A major concern of sepsis program leaders was the prior findings that sepsis hospitalizations among Medicare beneficiaries were associated with substantial new cognitive and functional disability.[29] This lingering toll of sepsis had been termed a hidden public health disaster.[30] To further understand the posthospital impact of sepsis and to begin investigating new avenues to reduce this impact, a cohort of patients was followed for 1 year following sepsis hospitalization.[31] Over that period, nearly half of sepsis survivors were rehospitalized. When compared with their presepsis levels of healthcare utilization, middle‐aged and elderly sepsis patients experienced a 3‐fold increase in their days using facility‐based care. Subsequent studies in other populations outside of KPNC have confirmed these concerning findings, resulting in new efforts to address postsepsis survivorship care.[32, 33]
Phenotyping New Targets for Standardized Sepsis Care
At its outset, the sepsis improvement program applied the best available evidence to treat patients with the most severe forms of sepsisseptic shock. However, once the initial implementation phase had succeeded, clinicians and operational leaders quickly realized from the emerging data that there was a far larger group of sepsis patients for whom treatment guidelines were poorly defined.[25, 34, 35] These were severe sepsis patients with so‐called intermediate lactate values between 2 mmol/L and 4 mmol/L; they comprised a substantial proportion of all sepsis patients dying in the hospital. Using data generated from the routine care of sepsis patients treated across 21 hospitals, the sepsis leadership group was able to rapidly assemble a cohort of intermediate lactate sepsis patients up to 20‐ to 100‐fold larger than that reported in prior studies and evaluate their outcomes.[34, 35]
The data used to evaluate these intermediate lactate sepsis patients now spurred a new implementation program in 2013 for a group of patients in whom there was essentially no existing evidence to guide care. Rapidly implemented within a mature sepsis performance improvement program, evaluations at the 6‐month and 1‐year intervals demonstrated significant decreases in mortality.[36] Importantly, to allay the justified concerns of clinicians, these evaluations also clearly showed no evidence of harm from more aggressive fluid resuscitation (eg, increased transfer to intensive care, increased rates of mechanical ventilation). Again, driven by clinician input, subgroup analyses further revealed that the implementation program was only associated with reduced mortality in patients who could be at risk for iatrogenic fluid overload (ie, those with a history of congestive heart failure or chronic kidney disease).[36] Spurred by these provocative findings, operational and clinical leaders are currently considering how to guide future care in these patients, especially with the emerging use of noninvasive methods to quantify patients' fluid responsiveness.
PRINCIPLES FOR LEVERAGING DATA IN THE LEARNING HOSPITAL SYSTEM
The object lesson of using data to drive improved sepsis care and further new scientific discovery offers some important insights for continuous learning.
Building a Digital Infrastructure for Utilizing Granular Hospital Data
As described above, current transitions between the nodes of the learning framework are rife with missed opportunities. Perhaps one of the most glaring is the inability to use highly granular data already collected within the electronic health record (eg, trajectories and trends across vital signs or laboratory results, large‐scale medication administration records to evaluate multidrug interactions). An essential starting point for continuous learning is investing in the digital infrastructure to improve the use of data beyond traditional claims (administrative dataadmission source codes, disposition codes, diagnoses, and procedures). As shown in Table 2, the first key step is incorporating laboratory data into the quality assessment/emmprovement process. In addition, using these data to automate severity of illness and risk adjustment metrics fosters use of similar comparison cohorts across time or disease types.[18, 37, 38, 39, 40]
| Data Type | Contents | Degree of Difficulty in Accessing | Degree of Difficulty in Analyzing |
|---|---|---|---|
| Administrative | Traditional claims data, diagnostic or procedural codes | Low | Low to moderate |
| Standard cohort profiling | Limited instances of vitals signs, laboratory, diagnostic testing, or treatment data | Low to moderate | Low to moderate |
| Metrics reporting for care improvement | Standard cohort identification, aggregated achievement of treatment targets, scorecard dissemination | Moderate | Moderate |
| Advanced cohort profiling | Time series of physiologic data, inpatient triage and treatment data within short temporal intervals | Moderate to high | High |
| Research‐grade discovery | Data with breadth (representative sample size) and depth (highly granular physiologic and treatment data) | High | Very high |
| Patient‐reported outcomes | Quality of life, functional and cognitive disability | Very high | High |
Employing Novel Methods to Address the Limitations of Using Real‐World Data
The rapid digitization of medicine through the use of electronic medical records offers tremendous opportunities to facilitate continuous learning. However, these opportunities are accompanied by important limitations.[41] Data collected as a byproduct of real‐world care can be vulnerable to many forms of bias and confounding, potentially clouding the validity and robustness of corresponding analytic results. Fortunately, advanced methods including causal inference are now used routinely to address some limitations.[42] In the context of a learning healthcare system, other opportunities for improved study design including cluster randomized trials or stepped wedge implementation can also be employed to preserve the statistical rigor of subsequent analyses.[43] Finally, emerging methods employing randomization through the electronic medical record alongside adaptive trial design offer great potential to increase the efficiency of continuous learning.[44]
Evaluating the Hospital as a Single System
Advances in contemporary hospital care require seamless transitions of patient care, screening strategies, and therapeutic approaches across multiple hospital domains and with diverse providers; these interventions also need to happen rapidly. Many traditional approaches to inpatient care have taken a bottom‐up approach (eg, studying a specific disease within a specific hospital ward like the intensive care unit) that have proven useful but may limit generalizability when applied to a real‐world hospital operating with Pareto optimality (ie, the trade‐off scenario where new resource allocation to 1 area also requires resource withdrawal from another area). In certain cases, an empiric approach, without initial preference for any specific ward or disease, can aid decision making by hospital operational and clinical leaders by providing a global picture of impact and value.
Focusing on Early Detection in Hospital Settings as Secondary Prevention
Once patients have been admitted to the hospital, a race against the clock begins. Each additional hour of hospitalization increases the risks of iatrogenic injury or medical harm manifested by immobility, disorientation and delirium, nosocomial infections, or medication errors, among others. In this context, detection systems that use granular hospital data to focus on the earliest detection of risk can aid critical approaches to secondary prevention (Although the hospitalization for sepsis cannot be avoided, careful attention to mobility can limit the risk of developing delirium. In turn, preventing delirium can limit the risk of new functional disability).
Contextualizing Hospital Care Within a Longitudinal Trajectory
Although we described the benefit of hospital episodes having well‐demarcated beginning and ending points, it remains essential to recognize that the harms associated with hospitalization extend well beyond discharge. In this context, hospitalizations can serve as waypoints in patients' health trajectories as well as an opportunity to achieve patient‐centered care including discussing and aligning goals of care with actual care provision. Furthermore, although we have seen steady declines in hospital mortality over time, it is highly likely that we will reach a nadir in mortality where additional metrics of hospital outcomes will need to include postdischarge events like readmission, long‐term mortality, quality of life, and the prevention of disability or decline.
CONCLUSION
Hospitalizations in the United States are costly and associated with high mortality and morbidity; the toll of hospitalization also extends well beyond hospital discharge. The promise of the learning hospital system has marked improvements in the quality of hospital care, especially where healthcare systems can steep critical investments in data and digital infrastructure within the right culture, incentives, and leadership. Where continuous learning is achieved, data generated during routine care offer the potential to yield new scientific discovery and drive further improvements in hospital care.
Disclosures
As part of our agreement with the Gordon and Betty Moore Foundation, we made a commitment to disseminate our findings in articles such as this one. However, the Foundation and its staff played no role in how we actually structured our articles, nor did they review or preapprove any of the manuscripts submitted as part of the dissemination component. None of the authors has any conflicts of interest to declare of relevance to this work, which was funded by a combination of funding from the Gordon and Betty Moore Foundation, The Permanente Medical Group, Inc., and Kaiser Foundation Hospitals, Inc. VXL was supported by NIH K23GM112018.
- Institute of Medicine. Best Care at Lower Cost: The Path to Continuously Learning Health Care in America. Washington, DC: The National Academies Press; 2012.
- , , , et al. Toward a science of learning systems: a research agenda for the high‐functioning Learning Health System. J Am Med Inform Assoc. 2015;22(1):43–50.
- National Center for Health Statistics. Health, United States, 2014: With Special Feature on Adults Aged 55–64. Hyattsville, MD; 2015.
- , . Critical care medicine in the United States 2000‐2005: an analysis of bed numbers, occupancy rates, payer mix, and costs. Crit Care Med. 2010;38(1):65–71.
- , , , . Trends and variation in end‐of‐life care for medicare beneficiaries with severe chronic illness. A report of the Dartmouth Atlas Project. Lebanon, NH: The Dartmouth Institute for Health Policy and Clinical Practice; 2011.
- , , , et al. Change in end‐of‐life care for Medicare beneficiaries: site of death, place of care, and health care transitions in 2000, 2005, and 2009. JAMA. 2013;309(5):470–477.
- , , . Finding the missing link for big biomedical data. JAMA. 2014;311(24):2479–2480.
- . Code red and blue—safely limiting health care's GDP footprint. N Engl J Med. 2013;368(1):1–3.
- , . The inevitable application of big data to health care. JAMA. 2013;309(13):1351–1352.
- , . What is citizen science?—a scientometric meta‐analysis. PLoS One. 2016;11(1):e0147152.
- , , . Biomedical ontologies: a functional perspective. Brief Bioinform. 2008;9(1):75–90.
- . Rapid learning: a breakthrough agenda. Health Aff (Millwood). 2014;33(7):1155–1162.
- , , , et al. Are regional variations in end‐of‐life care intensity explained by patient preferences?: a study of the US Medicare population. Med Care. 2007;45(5):386–393.
- , . Extreme markup: the fifty US hospitals with the highest charge‐to‐cost ratios. Health Aff (Millwood). 2015;34(6):922–928.
- , , , . The price ain't right? Hospital prices and health spending on the privately insured. Health Care Pricing Project website. Available at: http://www.healthcarepricingproject.org/sites/default/files/pricing_variation_manuscript_0.pdf. Accessed February 15, 2016
- . A new, evidence‐based estimate of patient harms associated with hospital care. J Patient Saf. 2013;9(3):122–128.
- , , . Hospitalization‐associated disability: “she was probably able to ambulate, but I'm not sure”. JAMA. 2011;306(16):1782–1793.
- , , , , . Risk‐adjusting hospital mortality using a comprehensive electronic record in an integrated health care delivery system. Med Care. 2013;51(5):446–453.
- . New definitions for sepsis and septic shock: continuing evolution but with much still to be done. JAMA. 2016;315(8):757–759.
- , . Severe sepsis and septic shock. N Engl J Med. 2013;369(21):2063.
- , , . Sepsis‐induced immunosuppression: from cellular dysfunctions to immunotherapy. Nat Rev Immunol. 2013;13(12):862–874.
- , , , et al. Early goal‐directed therapy in the treatment of severe sepsis and septic shock. N Engl J Med. 2001;345(19):1368–1377.
- , , , et al. Kaiser Permanente's performance improvement system, part 3: multisite improvements in care for patients with sepsis. Jt Comm J Qual Patient Saf. 2011;37(11):483–493.
- , , , , . Understanding the components of quality improvement collaboratives: a systematic literature review. Milbank Q. 2013;91(2):354–394.
- , , , et al. Hospital deaths in patients with sepsis from 2 independent cohorts. JAMA. 2014;312(1):90–92.
- , , , et al. Assessment of clinical criteria for sepsis: for the Third International Consensus Definitions for Sepsis and Septic Shock (Sepsis‐3). JAMA. 2016;315(8):762–774.
- , , , et al. Developing a new definition and assessing new clinical criteria for septic shock: for the Third International Consensus Definitions for Sepsis and Septic Shock (Sepsis‐3). JAMA. 2016;315(8):775–787.
- , , , et al. The Third International Consensus Definitions for Sepsis and Septic Shock (Sepsis‐3). JAMA. 2016;315(8):801–810.
- , , , . Long‐term cognitive impairment and functional disability among survivors of severe sepsis. JAMA. 2010;304(16):1787–1794.
- . The lingering consequences of sepsis: a hidden public health disaster? JAMA. 2010;304(16):1833–1834.
- , , , , , . Hospital readmission and healthcare utilization following sepsis in community settings. J Hosp Med. 2014;9(8):502–507.
- , , , , . Increased 1‐year healthcare use in survivors of severe sepsis. Am J Respir Crit Care Med. 2014;190(1):62–69.
- , , , et al. Post‐acute care use and hospital readmission after sepsis. Ann Am Thorac Soc. 2015;12(6):904–913.
- , , , , . Fluid volume, lactate values, and mortality in sepsis patients with intermediate lactate values. Ann Am Thorac Soc. 2013;10(5):466–473.
- , , . Prognosis of emergency department patients with suspected infection and intermediate lactate levels: a systematic review. J Crit Care. 2014;29(3):334–339.
- , , , et al. Multicenter implementation of a treatment bundle for sepsis patients with intermediate lactate values. Am J Respir Crit Care Med. 2016;193(11):1264–1270.
- , , , et al. Risk adjusting community‐acquired pneumonia hospital outcomes using automated databases. Am J Manag Care. 2008;14(3):158–166.
- , , , , , . Intra‐hospital transfers to a higher level of care: contribution to total hospital and intensive care unit (ICU) mortality and length of stay (LOS). J Hosp Med. 2011;6(2):74–80.
- , , , , , . Early detection of impending physiologic deterioration among patients who are not in intensive care: development of predictive models using data from an automated electronic medical record. J Hosp Med. 2012;7(5):388–395.
- , , , , . An electronic Simplified Acute Physiology Score‐based risk adjustment score for critical illness in an integrated healthcare system. Crit Care Med. 2013;41(1):41–48.
- . Learning from big health care data. N Engl J Med. 2014;370(23):2161–2163.
- , . Getting the methods right—the foundation of patient‐centered outcomes research. N Engl J Med. 2012;367(9):787–790.
- , , , , . The stepped wedge cluster randomised trial: rationale, design, analysis, and reporting. BMJ. 2015;350:h391.
- . Fusing randomized trials with big data: the key to self‐learning health care systems? JAMA. 2015;314(8):767–768.
In the landmark Best Care at Lower Cost report, the Institute of Medicine presents a compelling vision of a US healthcare system where science, information technology, incentives, and care culture are brought together seamlessly to produce high‐quality healthcare.[1] At the center of this transformation is the learning healthcare system, a system characterized by its ability to leverage data arising from care provision to drive rapid improvements in care delivery.[2] When steeped within the right organizational milieu, these data help to close the virtuous cycle of continuous learning moving from science to evidence to care and back to new science. The anticipated end result is a healthcare system that can provide Americans with superior care at lower cost.
Hospital‐based practitioners will recognize the inpatient setting as an ideal demonstration opportunity for continuous learning. Hospital care is costly, accounting for more than 30% of all US healthcare costs[3]; intensive care alone accounts for a notable proportion of the US gross domestic product.[4] Inpatient care is associated with significant mortality and morbidity, and its use is often greatly increased in patients' last days.[5, 6] Fortunately, the inpatient setting also offers an ideal opportunity to leverage high‐quality data to help inform and improve care. The digitization of medicine means that far more data are now available through electronic health records, medical devices, and tests.[7] This is particularly true for inpatients, for whom a large volume of data are produced even over relatively short hospital stays.
Whereas the challenge to improve hospital care is daunting, there is an incredible opportunity to advance the quality of inpatient care through realizing the vision of the learning hospital system. In the sections that follow, we use an object lessonsepsis care within hospitals of the Kaiser Permanente Northern California (KPNC) integrated healthcare delivery systemto evaluate the challenges and insights gleaned from working toward building a learning hospital system. Then, we describe further steps that could enhance the use of inpatient data to drive improved care.
THE FRAMEWORK OF A LEARNING HEALTHCARE SYSTEM
Best Care at Lower Cost notes a fundamental paradox in US healthcare: although we have witnessed a dramatic expansion in biomedical knowledge, innovative therapies and surgical procedures, and clinical treatments to extend survival, US healthcare persistently falls short on the basic dimensions of quality, outcomes, cost, and equity.[1] The proposed path forward lies in building the learning healthcare system, a system characterized by continuous knowledge development, improvement, and application. Figure 1 shows the critical nodes in the framework for continuous learning, which include: (1) the development of new scientific knowledge (science), (2) the translation of science into clinical evidence of efficacy (evidence), and (3) the application of efficacious interventions through effective care delivery (care). In healthcare today, transitions between these nodes are rife with missed or wasted opportunities like delays in applying high‐quality evidence or poorly managed insights arising from scientific discovery. If such opportunities could be recovered, however, the quality of healthcare could be improved dramatically.[8]
The pursuit of continuous learning is aided by rapid changes in the quality and quantity of biomedical data available over the past decade, especially through the use of electronic health records, novel biomolecular tools, and digital sensors.[2, 7, 9] The Internet has ushered in a new era of data connectivity, for example, allowing for highly engaged communication between patients and providers as well as collaboration between professional or citizen scientists on data of unprecedented scale.[10] New methodologic approaches, including data mining and machine learning, increasingly leverage commodity hardware to conduct previously computationally intractable analyses.[9] Moreover, the development of domain ontologies fosters the discovery of meaningful insights from data of heterogeneous types.[11]
Ultimately, however, improvements in data alone are inadequate to achieve continuous learning. As shown in Figure 1, whereas data form the channels that allow for transitions from science to evidence to care, novel insights need to be steeped within the right culture, motivated by the right incentives, and supported by the right leaders.[1, 12] Within the sustainable learning healthcare system, knowledge generation feeds practice change with the support and guidance of system leadership; improved practice, in turn, generates new knowledge and completes the virtuous cycle of learning.
THE PROMISE OF CONTINUOUS LEARNING IN HOSPITAL SETTINGS
The hospital is an ideal setting in which to foster continuous learning because advances in inpatient care have the potential to substantially improve healthcare quality and value.[8] Americans were hospitalized roughly 37 million times in 2012; in total, these episodes cost $378 billion.[3] Over 700,000 patients die in US hospitals annually, with reports showing that many patients utilize greatly increased inpatient and critical care services near the end of their lives in a manner that appears misaligned with their preferences.[11, 13] Hospital care is also highly variable in quality and cost; this heterogeneity is not closely associated with improved outcomes.[14, 15] Preventable harm and medical injury occur commonly in hospitals and are now recognized to be a leading cause of inpatient death.[16] Finally, emerging research illuminates the substantial toll that acute care has on patients and families resulting in new comorbidity, functional or neuropsychiatric impairment, rehospitalization, and financial burden that persist long after patients are discharged.[17]
Fortunately, inpatient care also exhibits several qualities that improve the likelihood that continuous learning can be achieved. Although it is clear that hospitalizations occur within the arc of a patient's larger health trajectory, these distinct episodes offer the potential to observe patient trajectories and treatments evolving within relatively compressed time intervals; over that same interval, a large volume of data are produced. Stored within comprehensive electronic health records, these granular data now allow inpatient episodes to be digitally recapitulated with high fidelity, bolstering their use in driving care improvements.[18]
AN OBJECT LESSON IN THE LEARNING FRAMEWORK: SEPSIS CARE
Translating Science to Evidence in Sepsis
Although sepsis has attracted great attention in modern hospital care, sepsis was described long ago by Hippocrates to describe the process by which wounds fester.[19] Recast after the confirmation of germ theory, sepsis came to be known primarily as the blood poisoning resulting from pathogenic organisms.[20] However, with the advent of antibiotics, numerous scientific studies now recognize that sepsis actually results from the dysregulated host immune response to systemic infection, which can also cause organ dysfunction.[21] Based on this knowledge, landmark translational and clinical studies in the 2000s provided strong evidence that early identification of sepsis patients and aggressive infection control and resuscitation were associated with improved mortality (Figure 2, step 1).[22]
Translating Evidence to Care in Sepsis at KPNC
In 2007, the leadership of KPNC initiated a regional effort to improve the quality of care and reduce the variability in performance at its medical centers (Table 1).[23] Reviewing data from nearly 1000 inpatientsthe last 50 consecutive hospital deaths from each of 19 medical centersa mortality diagnostic based on Institute for Healthcare Improvement recommendations[24] revealed that sepsis had a major impact on hospital outcomes. For example, even though sepsis patients were still relatively under‐recognized at the time, accounting for fewer than 3% of hospitalizations, they contributed to one‐quarter of hospital deaths. In light of these compelling data, senior regional leadership identified reducing sepsis mortality as a key performance improvement goal (Figure 2, step 2).
| Time Period | Event Summary |
|---|---|
| |
| 2007 | Variability in hospital standardized mortality ratio observed, indicating an opportunity to drive improved outcomes. |
| Initiation of staggered implementation of unified electronic medical record across all KP sites (starting in 2006 and ending in 2009). | |
| Spring 2008 | Mortality diagnostic chart review completed identifying sepsis and infection‐related causes as key factors in hospital outcomes. |
| May 2008 | Regional Mortality Summit held with a focus on patient safety and mortality reduction efforts through performance improvement. Executive regional and local leadership alignment to focus on sepsis performance improvement. |
| Summer 2008 | Sepsis Steering Committee evaluates best available evidence, develops treatment algorithms, and plans for medical center pilots. |
| Fall 2008 | Pilot intervention deployed at 2 medical centers. |
| November 2008 | First Regional Sepsis Summit: development of sepsis performance improvement playbook, training materials, implementation plans, and measurement strategy. |
| November 2008 | All medical centers begin to form multidisciplinary sepsis teams and performance improvement committees, obtain equipment and supplies including assembly of a sepsis cart. Multidisciplinary teams included ED physician champion, ED nurse champion, improvement advisor, hospitalists, intensivists, quality improvement personnel, nurse educators, and even resident physicians. |
| January 2009 | Performance data collection begins on EGDT processes and outcomes. Initiation of 2 key elements to enhance screening for and detection of sepsis: (1) concomitant ordering of serum lactic acid along with blood cultures, and (2) definition of lactate >2.0 as a critical lab value. |
| Use of manual chart review for case finding and central database entry because of ongoing implementation of electronic medical record and limited sepsis‐specific data infrastructure. | |
| March 2009 | Regional train the trainer sessions occur and local educational spread efforts begin including: collaborative calls, in‐person training events, and medical center site visits. |
| August 2009 | Grant funding from the Gordon and Betty Moore Foundation begins with a planned 2‐year duration providing funding for improvement advisors with performance improvement expertise and data infrastructure development. |
| November 2009 | Second Regional Sepsis Summit. Identification of intermediate lactate sepsis patients having significant mortality. |
| January 2010 | Initiate measurement of performance for intermediate lactate sepsis patients with a focus on lactate clearance as an outcome measure of interest. |
| 2010 | Development of an intranet Web‐based data abstraction tool to identify cases and auto‐populate specific fields for review. Facilities were responsible for review of cases at the local level to foster rapid feedback cycles for local performance improvement. Standardized data query tools were deployed to foster local medical center engagement and system‐level evaluation. |
| Accompanying development of a sepsis performance improvement scorecard allowing for comparison of longitudinal performance metrics across all facilities. Scorecard elements included: proportion of lactates drawn following ED blood culture, EGDT‐specific bundle elements (ie, number of EGDT cases, antibiotics within 1 hour, first central venous pressure within 2 hours of EGDT start, target mean arterial pressure achievement), repeat lactate elements, balancing measures for central line placement (ie, pneumothorax, central line infection), and overall sepsis statistics. | |
| April 2011 | Third Regional Sepsis Summit. Refinement of EGDT bundle and further development of intermediate lactate bundle approach, including piloting specific treatment bundles targeting this population. Collaborative performance improvement environment in which successful strategies at 1 site were rapidly disseminated to other sites including the Sepsis Alert and the Sepsis Clock. |
| May 2012 | Research analysis of fluid volume and lactate clearance in intermediate lactate sepsis population begins. |
| February 2013 | Fourth Regional Sepsis Summit. Regional spread of intermediate lactate bundle including the use of fluids, antibiotics, and repeat lactate measurements. |
| May 2013 | Research analysis of the contribution of sepsis to hospital deaths (within KP and in national sample) as well as post‐sepsis resource utilization and mortality |
| March 2014 | Publication of ProCESS randomized clinical trial, requiring systemic reevaluation of EGDT‐based sepsis strategy. Subsequent publications of ARISE and ProMISe trials confirming findings from ProCESS. Updated approach under consideration and informally disseminated to practitioners. |
| October 2014 | Updated sepsis treatment guidelines and data capture strategy fully implemented moving away from a catheter‐based strategy for all EGDT‐eligible patients. |
| October 2015 | Sixth Regional Sepsis Summit held to adjust sepsis treatment and data measurement strategy to align more closely with CMS SEP‐1 guidelines. |
Based on the principles of performance improvement methodology, clinical and operational leaders established an environment with aligned culture, incentives, and leadership around sepsis care. The effort was launched in late 2008 at a Sepsis Summit, bringing together a multidisciplinary group of stakeholders (eg, hospitalist, emergency department, and intensive care chiefs of staff and nursing managers; medical center and nursing executive and operational leadership) and providing sepsis care pathways based on the best available evidence.[23] Regional investments in the digital infrastructure to support implementation resulted in the provision of granular data within monthly sepsis scorecards quantifying each medical center's performance and trends for a diverse set of sepsis bundle metrics.
The resulting changes in sepsis care were substantial. For example, improved early recognition of infected patients meeting the criteria for sepsis resulted in large changes in the standardized diagnostic criteria used to label patients (Figure 3A). Implementing screening strategies using serum lactate testing for any patient receiving blood cultures resulted in a roughly 10‐fold increase in the use of lactate testing in the emergency department (Figure 3B). Earlier recognition of sepsis also increased the number of patients receiving early antibiotics and receiving central venous catheters for quantitative resuscitation.[23]
CLOSING THE LOOP TOWARD CONTINUOUS LEARNING IN SEPSIS
Leveraging timely and actionable data steeped within an aligned organizational milieu resulted in large‐scale changes across a heterogeneous set of hospitals. However, to realize the true vision of a learning hospital system, a looming question remained: Could the data generated as the byproduct of routine care now be used to complete the virtuous cycle and drive new scientific discovery (Figure 2, step 3)?
Confirming Concordance in the Impact of Sepsis Nationally
The heightened identification of sepsis patients through program implementation revealed that the impact of sepsis on hospital mortality was greater than originally estimated; based on improved patient identification, sepsis now accounted for upward of 1 in 2 hospital deaths.[25] This sobering statistic confirmed that the investments in standardizing best sepsis care following the mortality diagnostic were critical. However, were similar estimates of sepsis‐attributable mortality consistent outside of the KPNC system? To study this, we examined US hospitalizations occurring across >1000 hospitals and involving >6 million hospital stays to estimate corresponding prevalence.[25] In this national sample, sepsis contributed to as many as half of hospital deaths in the United States in 2010, lending strong support to ongoing international and state‐based efforts to improve sepsis care. These studies also paved the way to use these data drawn from our large sepsis population to inform updated international consensus definitions for sepsis and septic shock.[26, 27, 28]
Identifying New Avenues for Reducing the Toll of Sepsis
A major concern of sepsis program leaders was the prior findings that sepsis hospitalizations among Medicare beneficiaries were associated with substantial new cognitive and functional disability.[29] This lingering toll of sepsis had been termed a hidden public health disaster.[30] To further understand the posthospital impact of sepsis and to begin investigating new avenues to reduce this impact, a cohort of patients was followed for 1 year following sepsis hospitalization.[31] Over that period, nearly half of sepsis survivors were rehospitalized. When compared with their presepsis levels of healthcare utilization, middle‐aged and elderly sepsis patients experienced a 3‐fold increase in their days using facility‐based care. Subsequent studies in other populations outside of KPNC have confirmed these concerning findings, resulting in new efforts to address postsepsis survivorship care.[32, 33]
Phenotyping New Targets for Standardized Sepsis Care
At its outset, the sepsis improvement program applied the best available evidence to treat patients with the most severe forms of sepsisseptic shock. However, once the initial implementation phase had succeeded, clinicians and operational leaders quickly realized from the emerging data that there was a far larger group of sepsis patients for whom treatment guidelines were poorly defined.[25, 34, 35] These were severe sepsis patients with so‐called intermediate lactate values between 2 mmol/L and 4 mmol/L; they comprised a substantial proportion of all sepsis patients dying in the hospital. Using data generated from the routine care of sepsis patients treated across 21 hospitals, the sepsis leadership group was able to rapidly assemble a cohort of intermediate lactate sepsis patients up to 20‐ to 100‐fold larger than that reported in prior studies and evaluate their outcomes.[34, 35]
The data used to evaluate these intermediate lactate sepsis patients now spurred a new implementation program in 2013 for a group of patients in whom there was essentially no existing evidence to guide care. Rapidly implemented within a mature sepsis performance improvement program, evaluations at the 6‐month and 1‐year intervals demonstrated significant decreases in mortality.[36] Importantly, to allay the justified concerns of clinicians, these evaluations also clearly showed no evidence of harm from more aggressive fluid resuscitation (eg, increased transfer to intensive care, increased rates of mechanical ventilation). Again, driven by clinician input, subgroup analyses further revealed that the implementation program was only associated with reduced mortality in patients who could be at risk for iatrogenic fluid overload (ie, those with a history of congestive heart failure or chronic kidney disease).[36] Spurred by these provocative findings, operational and clinical leaders are currently considering how to guide future care in these patients, especially with the emerging use of noninvasive methods to quantify patients' fluid responsiveness.
PRINCIPLES FOR LEVERAGING DATA IN THE LEARNING HOSPITAL SYSTEM
The object lesson of using data to drive improved sepsis care and further new scientific discovery offers some important insights for continuous learning.
Building a Digital Infrastructure for Utilizing Granular Hospital Data
As described above, current transitions between the nodes of the learning framework are rife with missed opportunities. Perhaps one of the most glaring is the inability to use highly granular data already collected within the electronic health record (eg, trajectories and trends across vital signs or laboratory results, large‐scale medication administration records to evaluate multidrug interactions). An essential starting point for continuous learning is investing in the digital infrastructure to improve the use of data beyond traditional claims (administrative dataadmission source codes, disposition codes, diagnoses, and procedures). As shown in Table 2, the first key step is incorporating laboratory data into the quality assessment/emmprovement process. In addition, using these data to automate severity of illness and risk adjustment metrics fosters use of similar comparison cohorts across time or disease types.[18, 37, 38, 39, 40]
| Data Type | Contents | Degree of Difficulty in Accessing | Degree of Difficulty in Analyzing |
|---|---|---|---|
| Administrative | Traditional claims data, diagnostic or procedural codes | Low | Low to moderate |
| Standard cohort profiling | Limited instances of vitals signs, laboratory, diagnostic testing, or treatment data | Low to moderate | Low to moderate |
| Metrics reporting for care improvement | Standard cohort identification, aggregated achievement of treatment targets, scorecard dissemination | Moderate | Moderate |
| Advanced cohort profiling | Time series of physiologic data, inpatient triage and treatment data within short temporal intervals | Moderate to high | High |
| Research‐grade discovery | Data with breadth (representative sample size) and depth (highly granular physiologic and treatment data) | High | Very high |
| Patient‐reported outcomes | Quality of life, functional and cognitive disability | Very high | High |
Employing Novel Methods to Address the Limitations of Using Real‐World Data
The rapid digitization of medicine through the use of electronic medical records offers tremendous opportunities to facilitate continuous learning. However, these opportunities are accompanied by important limitations.[41] Data collected as a byproduct of real‐world care can be vulnerable to many forms of bias and confounding, potentially clouding the validity and robustness of corresponding analytic results. Fortunately, advanced methods including causal inference are now used routinely to address some limitations.[42] In the context of a learning healthcare system, other opportunities for improved study design including cluster randomized trials or stepped wedge implementation can also be employed to preserve the statistical rigor of subsequent analyses.[43] Finally, emerging methods employing randomization through the electronic medical record alongside adaptive trial design offer great potential to increase the efficiency of continuous learning.[44]
Evaluating the Hospital as a Single System
Advances in contemporary hospital care require seamless transitions of patient care, screening strategies, and therapeutic approaches across multiple hospital domains and with diverse providers; these interventions also need to happen rapidly. Many traditional approaches to inpatient care have taken a bottom‐up approach (eg, studying a specific disease within a specific hospital ward like the intensive care unit) that have proven useful but may limit generalizability when applied to a real‐world hospital operating with Pareto optimality (ie, the trade‐off scenario where new resource allocation to 1 area also requires resource withdrawal from another area). In certain cases, an empiric approach, without initial preference for any specific ward or disease, can aid decision making by hospital operational and clinical leaders by providing a global picture of impact and value.
Focusing on Early Detection in Hospital Settings as Secondary Prevention
Once patients have been admitted to the hospital, a race against the clock begins. Each additional hour of hospitalization increases the risks of iatrogenic injury or medical harm manifested by immobility, disorientation and delirium, nosocomial infections, or medication errors, among others. In this context, detection systems that use granular hospital data to focus on the earliest detection of risk can aid critical approaches to secondary prevention (Although the hospitalization for sepsis cannot be avoided, careful attention to mobility can limit the risk of developing delirium. In turn, preventing delirium can limit the risk of new functional disability).
Contextualizing Hospital Care Within a Longitudinal Trajectory
Although we described the benefit of hospital episodes having well‐demarcated beginning and ending points, it remains essential to recognize that the harms associated with hospitalization extend well beyond discharge. In this context, hospitalizations can serve as waypoints in patients' health trajectories as well as an opportunity to achieve patient‐centered care including discussing and aligning goals of care with actual care provision. Furthermore, although we have seen steady declines in hospital mortality over time, it is highly likely that we will reach a nadir in mortality where additional metrics of hospital outcomes will need to include postdischarge events like readmission, long‐term mortality, quality of life, and the prevention of disability or decline.
CONCLUSION
Hospitalizations in the United States are costly and associated with high mortality and morbidity; the toll of hospitalization also extends well beyond hospital discharge. The promise of the learning hospital system has marked improvements in the quality of hospital care, especially where healthcare systems can steep critical investments in data and digital infrastructure within the right culture, incentives, and leadership. Where continuous learning is achieved, data generated during routine care offer the potential to yield new scientific discovery and drive further improvements in hospital care.
Disclosures
As part of our agreement with the Gordon and Betty Moore Foundation, we made a commitment to disseminate our findings in articles such as this one. However, the Foundation and its staff played no role in how we actually structured our articles, nor did they review or preapprove any of the manuscripts submitted as part of the dissemination component. None of the authors has any conflicts of interest to declare of relevance to this work, which was funded by a combination of funding from the Gordon and Betty Moore Foundation, The Permanente Medical Group, Inc., and Kaiser Foundation Hospitals, Inc. VXL was supported by NIH K23GM112018.
- Institute of Medicine. Best Care at Lower Cost: The Path to Continuously Learning Health Care in America. Washington, DC: The National Academies Press; 2012.
- , , , et al. Toward a science of learning systems: a research agenda for the high‐functioning Learning Health System. J Am Med Inform Assoc. 2015;22(1):43–50.
- National Center for Health Statistics. Health, United States, 2014: With Special Feature on Adults Aged 55–64. Hyattsville, MD; 2015.
- , . Critical care medicine in the United States 2000‐2005: an analysis of bed numbers, occupancy rates, payer mix, and costs. Crit Care Med. 2010;38(1):65–71.
- , , , . Trends and variation in end‐of‐life care for medicare beneficiaries with severe chronic illness. A report of the Dartmouth Atlas Project. Lebanon, NH: The Dartmouth Institute for Health Policy and Clinical Practice; 2011.
- , , , et al. Change in end‐of‐life care for Medicare beneficiaries: site of death, place of care, and health care transitions in 2000, 2005, and 2009. JAMA. 2013;309(5):470–477.
- , , . Finding the missing link for big biomedical data. JAMA. 2014;311(24):2479–2480.
- . Code red and blue—safely limiting health care's GDP footprint. N Engl J Med. 2013;368(1):1–3.
- , . The inevitable application of big data to health care. JAMA. 2013;309(13):1351–1352.
- , . What is citizen science?—a scientometric meta‐analysis. PLoS One. 2016;11(1):e0147152.
- , , . Biomedical ontologies: a functional perspective. Brief Bioinform. 2008;9(1):75–90.
- . Rapid learning: a breakthrough agenda. Health Aff (Millwood). 2014;33(7):1155–1162.
- , , , et al. Are regional variations in end‐of‐life care intensity explained by patient preferences?: a study of the US Medicare population. Med Care. 2007;45(5):386–393.
- , . Extreme markup: the fifty US hospitals with the highest charge‐to‐cost ratios. Health Aff (Millwood). 2015;34(6):922–928.
- , , , . The price ain't right? Hospital prices and health spending on the privately insured. Health Care Pricing Project website. Available at: http://www.healthcarepricingproject.org/sites/default/files/pricing_variation_manuscript_0.pdf. Accessed February 15, 2016
- . A new, evidence‐based estimate of patient harms associated with hospital care. J Patient Saf. 2013;9(3):122–128.
- , , . Hospitalization‐associated disability: “she was probably able to ambulate, but I'm not sure”. JAMA. 2011;306(16):1782–1793.
- , , , , . Risk‐adjusting hospital mortality using a comprehensive electronic record in an integrated health care delivery system. Med Care. 2013;51(5):446–453.
- . New definitions for sepsis and septic shock: continuing evolution but with much still to be done. JAMA. 2016;315(8):757–759.
- , . Severe sepsis and septic shock. N Engl J Med. 2013;369(21):2063.
- , , . Sepsis‐induced immunosuppression: from cellular dysfunctions to immunotherapy. Nat Rev Immunol. 2013;13(12):862–874.
- , , , et al. Early goal‐directed therapy in the treatment of severe sepsis and septic shock. N Engl J Med. 2001;345(19):1368–1377.
- , , , et al. Kaiser Permanente's performance improvement system, part 3: multisite improvements in care for patients with sepsis. Jt Comm J Qual Patient Saf. 2011;37(11):483–493.
- , , , , . Understanding the components of quality improvement collaboratives: a systematic literature review. Milbank Q. 2013;91(2):354–394.
- , , , et al. Hospital deaths in patients with sepsis from 2 independent cohorts. JAMA. 2014;312(1):90–92.
- , , , et al. Assessment of clinical criteria for sepsis: for the Third International Consensus Definitions for Sepsis and Septic Shock (Sepsis‐3). JAMA. 2016;315(8):762–774.
- , , , et al. Developing a new definition and assessing new clinical criteria for septic shock: for the Third International Consensus Definitions for Sepsis and Septic Shock (Sepsis‐3). JAMA. 2016;315(8):775–787.
- , , , et al. The Third International Consensus Definitions for Sepsis and Septic Shock (Sepsis‐3). JAMA. 2016;315(8):801–810.
- , , , . Long‐term cognitive impairment and functional disability among survivors of severe sepsis. JAMA. 2010;304(16):1787–1794.
- . The lingering consequences of sepsis: a hidden public health disaster? JAMA. 2010;304(16):1833–1834.
- , , , , , . Hospital readmission and healthcare utilization following sepsis in community settings. J Hosp Med. 2014;9(8):502–507.
- , , , , . Increased 1‐year healthcare use in survivors of severe sepsis. Am J Respir Crit Care Med. 2014;190(1):62–69.
- , , , et al. Post‐acute care use and hospital readmission after sepsis. Ann Am Thorac Soc. 2015;12(6):904–913.
- , , , , . Fluid volume, lactate values, and mortality in sepsis patients with intermediate lactate values. Ann Am Thorac Soc. 2013;10(5):466–473.
- , , . Prognosis of emergency department patients with suspected infection and intermediate lactate levels: a systematic review. J Crit Care. 2014;29(3):334–339.
- , , , et al. Multicenter implementation of a treatment bundle for sepsis patients with intermediate lactate values. Am J Respir Crit Care Med. 2016;193(11):1264–1270.
- , , , et al. Risk adjusting community‐acquired pneumonia hospital outcomes using automated databases. Am J Manag Care. 2008;14(3):158–166.
- , , , , , . Intra‐hospital transfers to a higher level of care: contribution to total hospital and intensive care unit (ICU) mortality and length of stay (LOS). J Hosp Med. 2011;6(2):74–80.
- , , , , , . Early detection of impending physiologic deterioration among patients who are not in intensive care: development of predictive models using data from an automated electronic medical record. J Hosp Med. 2012;7(5):388–395.
- , , , , . An electronic Simplified Acute Physiology Score‐based risk adjustment score for critical illness in an integrated healthcare system. Crit Care Med. 2013;41(1):41–48.
- . Learning from big health care data. N Engl J Med. 2014;370(23):2161–2163.
- , . Getting the methods right—the foundation of patient‐centered outcomes research. N Engl J Med. 2012;367(9):787–790.
- , , , , . The stepped wedge cluster randomised trial: rationale, design, analysis, and reporting. BMJ. 2015;350:h391.
- . Fusing randomized trials with big data: the key to self‐learning health care systems? JAMA. 2015;314(8):767–768.