User login
Treatment of inflammatory bowel disease
The inflammatory bowel disease (IBD) session covered optimal ways to initiate treatment for ulcerative colitis and Crohn’s disease, when and how to discontinue some of those treatments, and the use of biosimilars as substitutes for biologic therapies. Finally, suggestions were provided regarding the often-challenging identification of irritable bowel complaints in patients with IBD.

Uma Mahadevan, MD, opened by reviewing important patient factors to consider, such as disease type and severity, comorbidities, and previous therapies, before the initiation of anti-inflammatory, immunomodulatory, and/or biologic therapies in patients with IBD. She underlined the importance of risk stratification in selecting optimal therapies as well as the role of steroid-sparing agents, and she discussed the preferability of a “treat to target” strategy that emphasizes clinical, laboratory, and endoscopic response. Finally, Dr. Mahadevan, of the University of California, San Francisco, provided an overview of the role of tofacitinib (Xeljanz), which was recently approved for the treatment of moderate to severe ulcerative colitis.
Millie D. Long, MD, MPH, discussed the clinical challenges associated with stopping biologic and/or immunomodulator therapy in selected patients with IBD. Long-term use of immunomodulators and biologics can be associated with increased risk of malignancy. Dr. Long, of the University of North Carolina, Chapel Hill, reviewed data suggesting that approximately 50% of patients will relapse within 2 years of withdrawing from either class of agents. For patients on dual therapy, similar rates are seen on withdrawal of biologics alone, although most patients can be brought back under control with drug reinitiation. In general, withdrawal is predicted to be most effective in patients who have had a durable response for at least 6-12 months with clinical, laboratory, and endoscopic evidence of remission.
Around the world, use of biosimilar anti–tumor necrosis factor agents is growing. Peter Lakatos, MD, PhD, AGAF, director of IBD Centre at McGill University, Montreal, reviewed the current literature, which demonstrates very similar clinical performance between the first generation of biosimilars and more traditional agents from this class. Food and Drug Administration approval in the United States has been slower than elsewhere. However, it is expected that multiple agents already used or under development outside this country will be available in the United States in the next several years. Biosimilars have already captured 50% of the European market and, because of cost considerations, their use is mandatory in some non-U.S. settings.
In some patients, differentiating an IBD flare from superimposed irritable bowel syndrome symptoms can be difficult. Charles Bernstein, MD, of the University of Manitoba (Canada), emphasized the importance of exploring perceived stress in the life of patients with IBD. Stress can be the dominant factor driving clinical complaints in the absence of identifiable increases in inflammatory activity, he explained.
Dr. Weinberg is chairman of the department of medicine, Fox Chase Cancer Center, Philadelphia. This is a summary provided by the moderator of one of the spring postgraduate course sessions held at DDW 2018.
The inflammatory bowel disease (IBD) session covered optimal ways to initiate treatment for ulcerative colitis and Crohn’s disease, when and how to discontinue some of those treatments, and the use of biosimilars as substitutes for biologic therapies. Finally, suggestions were provided regarding the often-challenging identification of irritable bowel complaints in patients with IBD.
Uma Mahadevan, MD, opened by reviewing important patient factors to consider, such as disease type and severity, comorbidities, and previous therapies, before the initiation of anti-inflammatory, immunomodulatory, and/or biologic therapies in patients with IBD. She underlined the importance of risk stratification in selecting optimal therapies as well as the role of steroid-sparing agents, and she discussed the preferability of a “treat to target” strategy that emphasizes clinical, laboratory, and endoscopic response. Finally, Dr. Mahadevan, of the University of California, San Francisco, provided an overview of the role of tofacitinib (Xeljanz), which was recently approved for the treatment of moderate to severe ulcerative colitis.
Millie D. Long, MD, MPH, discussed the clinical challenges associated with stopping biologic and/or immunomodulator therapy in selected patients with IBD. Long-term use of immunomodulators and biologics can be associated with increased risk of malignancy. Dr. Long, of the University of North Carolina, Chapel Hill, reviewed data suggesting that approximately 50% of patients will relapse within 2 years of withdrawing from either class of agents. For patients on dual therapy, similar rates are seen on withdrawal of biologics alone, although most patients can be brought back under control with drug reinitiation. In general, withdrawal is predicted to be most effective in patients who have had a durable response for at least 6-12 months with clinical, laboratory, and endoscopic evidence of remission.
Around the world, use of biosimilar anti–tumor necrosis factor agents is growing. Peter Lakatos, MD, PhD, AGAF, director of IBD Centre at McGill University, Montreal, reviewed the current literature, which demonstrates very similar clinical performance between the first generation of biosimilars and more traditional agents from this class. Food and Drug Administration approval in the United States has been slower than elsewhere. However, it is expected that multiple agents already used or under development outside this country will be available in the United States in the next several years. Biosimilars have already captured 50% of the European market and, because of cost considerations, their use is mandatory in some non-U.S. settings.
In some patients, differentiating an IBD flare from superimposed irritable bowel syndrome symptoms can be difficult. Charles Bernstein, MD, of the University of Manitoba (Canada), emphasized the importance of exploring perceived stress in the life of patients with IBD. Stress can be the dominant factor driving clinical complaints in the absence of identifiable increases in inflammatory activity, he explained.
Dr. Weinberg is chairman of the department of medicine, Fox Chase Cancer Center, Philadelphia. This is a summary provided by the moderator of one of the spring postgraduate course sessions held at DDW 2018.
The inflammatory bowel disease (IBD) session covered optimal ways to initiate treatment for ulcerative colitis and Crohn’s disease, when and how to discontinue some of those treatments, and the use of biosimilars as substitutes for biologic therapies. Finally, suggestions were provided regarding the often-challenging identification of irritable bowel complaints in patients with IBD.
Uma Mahadevan, MD, opened by reviewing important patient factors to consider, such as disease type and severity, comorbidities, and previous therapies, before the initiation of anti-inflammatory, immunomodulatory, and/or biologic therapies in patients with IBD. She underlined the importance of risk stratification in selecting optimal therapies as well as the role of steroid-sparing agents, and she discussed the preferability of a “treat to target” strategy that emphasizes clinical, laboratory, and endoscopic response. Finally, Dr. Mahadevan, of the University of California, San Francisco, provided an overview of the role of tofacitinib (Xeljanz), which was recently approved for the treatment of moderate to severe ulcerative colitis.
Millie D. Long, MD, MPH, discussed the clinical challenges associated with stopping biologic and/or immunomodulator therapy in selected patients with IBD. Long-term use of immunomodulators and biologics can be associated with increased risk of malignancy. Dr. Long, of the University of North Carolina, Chapel Hill, reviewed data suggesting that approximately 50% of patients will relapse within 2 years of withdrawing from either class of agents. For patients on dual therapy, similar rates are seen on withdrawal of biologics alone, although most patients can be brought back under control with drug reinitiation. In general, withdrawal is predicted to be most effective in patients who have had a durable response for at least 6-12 months with clinical, laboratory, and endoscopic evidence of remission.
Around the world, use of biosimilar anti–tumor necrosis factor agents is growing. Peter Lakatos, MD, PhD, AGAF, director of IBD Centre at McGill University, Montreal, reviewed the current literature, which demonstrates very similar clinical performance between the first generation of biosimilars and more traditional agents from this class. Food and Drug Administration approval in the United States has been slower than elsewhere. However, it is expected that multiple agents already used or under development outside this country will be available in the United States in the next several years. Biosimilars have already captured 50% of the European market and, because of cost considerations, their use is mandatory in some non-U.S. settings.
In some patients, differentiating an IBD flare from superimposed irritable bowel syndrome symptoms can be difficult. Charles Bernstein, MD, of the University of Manitoba (Canada), emphasized the importance of exploring perceived stress in the life of patients with IBD. Stress can be the dominant factor driving clinical complaints in the absence of identifiable increases in inflammatory activity, he explained.
Dr. Weinberg is chairman of the department of medicine, Fox Chase Cancer Center, Philadelphia. This is a summary provided by the moderator of one of the spring postgraduate course sessions held at DDW 2018.
Eosinophilic esophagitis: Faces and facets of a new disease
A dramatic rise in the recognition of eosinophilic esophagitis (EoE) has followed the case series by Stephen Attwood, MD, and Alex Straumann, MD, which first characterized the disease 25 years ago. While still a young disease, EoE has evolved from esoterica to a leading cause of dysphagia and food impaction worldwide (Gastroenterology. 2018 Jan;154[2]:319-32.). The typical face of EoE is a 30- to 40-year-old white man, but EoE afflicts both men and women of all ages and ethnic groups.

Guidelines prior to 2017 excluded proton pump inhibitor–responsive esophageal eosinophilia (PPIREE) from a formal diagnosis of EoE. The last decade, however, has witnessed the rise of fall of PPIREE, which was first reported in 2006 in a case series of three pediatric patients with presentations consistent with EoE, but symptom and histologic resolution after treatment with omeprazole. At the time, these cases were viewed as rare curiosities. Subsequent to a prospective series by Javier Molina-Infante, MD, in 2011, however, multiple studies have demonstrated that 30%-50% of patients suspected of having EoE respond to proton pump inhibitor (PPI). Clearly, PPIREE is not rare. Clinical and translational studies have investigated the phenomenon of PPIREE, noting that EoE and PPIREE share demographic, symptom, endoscopic, and pathologic features as well as biomarker expression and gene profiles that are distinct from gastroesophageal reflux disease (GERD). Furthermore, studies have identified intriguing, acid-independent properties of PPIs that inhibit allergic inflammation in cultured EoE cell lines. Together, these clinical and translational studies led to a 2016 European task force recommendation to remove the PPI trial from the diagnostic criteria for EoE (Gut 2016 Mar;65[3]:524-31). At Digestive Disease Week 2017®, an international consortium sponsored by the International Gastrointestinal Eosinophil Researchers (TIGERS) convened in Chicago to review this controversy. The consensus from this meeting was in line with the European position statement. For patients with a clinical presentation suggestive of EoE and esophageal eosinophilia, clinicians should carefully consider non-EoE causes of esophageal eosinophilia but would not be required to use PPIs to establish a diagnosis of EoE.
Assessment of disease activity in EoE has largely focused on counting eosinophils on esophageal biopsies, but the mucosa may be the tip of the EoE iceberg. There is increasing evidence that the inflammation and remodeling aspects of EoE extend beneath the mucosa. If you “dig a little deeper” and sample the subepithelial space, a different face of EoE emerges, with eosinophilic inflammation and fibrosis in EoE that are distinct from GERD. This subepithelial remodeling forms the basis for the strictures and narrow caliber esophagus that are major complications of EoE.
Treatment of EoE involves a multifaceted approach that includes medications, dietary therapy, and esophageal dilation. No drugs have yet been approved by the Food and Drug Administration for EoE. Off-label use of topical corticosteroids are a mainstay of therapy, with 10 double-blind, placebo-controlled randomized trials demonstrating efficacy for both histology and symptoms. Novel therapeutic approaches to EoE are targeting allergic cytokine mediators including interleukin-4, 5, and 13 with promising results. The role of biologic therapies in the management of EoE is yet undefined but the increasing recognition of steroid-refractory patients as well as potential effects on esophageal remodeling are unmet needs. Diet therapy continues to be an important, first-line option for motivated patients and clinicians, with removal of the six most common food allergens associated with a 70% histologic response in both pediatric and adult studies. Less-restrictive diets have been devised to reduce the need for repeated endoscopies. At the same time, several office-based tests of disease activity are undergoing validation, including the esophageal string test, Cytosponge, mucosal impedance, transnasal endoscopy, and confocal microscopy capsule. These technologies will lead to fewer endoscopies and may shift EoE management to the primary care or allergist’s office.
Finally, it is important to acknowledge that EoE is not a “GI disease,” but one that is best managed by a multifaceted approach that integrates allergists, immunologists, pathologists, radiologists, dietitians, patient advocacy, and epidemiologists who are confronting this new disease. The Consortium of Eosinophilic Gastrointestinal Disease Researchers, funded by the National Institutes of Health and the Rare Diseases Clinical Research Network, is an example of a multidisciplinary collaboration that addresses fundamental questions regarding the natural history and optimal management of EoE.
Dr. Hirano is a professor of medicine, division of gastroenterology, Northwestern University, Chicago. He has received grant support from the NIH Consortium of Eosinophilic Gastrointestinal Disease Researchers (CEGIR, U54 AI117804). CEGIR is also supported by patient advocacy groups including the American Partnership for Eosinophilic Disorders, the CURED Foundation, and the Eosinophilic Family Coalition. Dr. Hirano has received consulting fees and research funding from Celgene, Regeneron, and Shire among others. Dr. Hirano made his comments during the AGA Institute Presidential Plenary at the Annual Digestive Disease Week.
A dramatic rise in the recognition of eosinophilic esophagitis (EoE) has followed the case series by Stephen Attwood, MD, and Alex Straumann, MD, which first characterized the disease 25 years ago. While still a young disease, EoE has evolved from esoterica to a leading cause of dysphagia and food impaction worldwide (Gastroenterology. 2018 Jan;154[2]:319-32.). The typical face of EoE is a 30- to 40-year-old white man, but EoE afflicts both men and women of all ages and ethnic groups.
Guidelines prior to 2017 excluded proton pump inhibitor–responsive esophageal eosinophilia (PPIREE) from a formal diagnosis of EoE. The last decade, however, has witnessed the rise of fall of PPIREE, which was first reported in 2006 in a case series of three pediatric patients with presentations consistent with EoE, but symptom and histologic resolution after treatment with omeprazole. At the time, these cases were viewed as rare curiosities. Subsequent to a prospective series by Javier Molina-Infante, MD, in 2011, however, multiple studies have demonstrated that 30%-50% of patients suspected of having EoE respond to proton pump inhibitor (PPI). Clearly, PPIREE is not rare. Clinical and translational studies have investigated the phenomenon of PPIREE, noting that EoE and PPIREE share demographic, symptom, endoscopic, and pathologic features as well as biomarker expression and gene profiles that are distinct from gastroesophageal reflux disease (GERD). Furthermore, studies have identified intriguing, acid-independent properties of PPIs that inhibit allergic inflammation in cultured EoE cell lines. Together, these clinical and translational studies led to a 2016 European task force recommendation to remove the PPI trial from the diagnostic criteria for EoE (Gut 2016 Mar;65[3]:524-31). At Digestive Disease Week 2017®, an international consortium sponsored by the International Gastrointestinal Eosinophil Researchers (TIGERS) convened in Chicago to review this controversy. The consensus from this meeting was in line with the European position statement. For patients with a clinical presentation suggestive of EoE and esophageal eosinophilia, clinicians should carefully consider non-EoE causes of esophageal eosinophilia but would not be required to use PPIs to establish a diagnosis of EoE.
Assessment of disease activity in EoE has largely focused on counting eosinophils on esophageal biopsies, but the mucosa may be the tip of the EoE iceberg. There is increasing evidence that the inflammation and remodeling aspects of EoE extend beneath the mucosa. If you “dig a little deeper” and sample the subepithelial space, a different face of EoE emerges, with eosinophilic inflammation and fibrosis in EoE that are distinct from GERD. This subepithelial remodeling forms the basis for the strictures and narrow caliber esophagus that are major complications of EoE.
Treatment of EoE involves a multifaceted approach that includes medications, dietary therapy, and esophageal dilation. No drugs have yet been approved by the Food and Drug Administration for EoE. Off-label use of topical corticosteroids are a mainstay of therapy, with 10 double-blind, placebo-controlled randomized trials demonstrating efficacy for both histology and symptoms. Novel therapeutic approaches to EoE are targeting allergic cytokine mediators including interleukin-4, 5, and 13 with promising results. The role of biologic therapies in the management of EoE is yet undefined but the increasing recognition of steroid-refractory patients as well as potential effects on esophageal remodeling are unmet needs. Diet therapy continues to be an important, first-line option for motivated patients and clinicians, with removal of the six most common food allergens associated with a 70% histologic response in both pediatric and adult studies. Less-restrictive diets have been devised to reduce the need for repeated endoscopies. At the same time, several office-based tests of disease activity are undergoing validation, including the esophageal string test, Cytosponge, mucosal impedance, transnasal endoscopy, and confocal microscopy capsule. These technologies will lead to fewer endoscopies and may shift EoE management to the primary care or allergist’s office.
Finally, it is important to acknowledge that EoE is not a “GI disease,” but one that is best managed by a multifaceted approach that integrates allergists, immunologists, pathologists, radiologists, dietitians, patient advocacy, and epidemiologists who are confronting this new disease. The Consortium of Eosinophilic Gastrointestinal Disease Researchers, funded by the National Institutes of Health and the Rare Diseases Clinical Research Network, is an example of a multidisciplinary collaboration that addresses fundamental questions regarding the natural history and optimal management of EoE.
Dr. Hirano is a professor of medicine, division of gastroenterology, Northwestern University, Chicago. He has received grant support from the NIH Consortium of Eosinophilic Gastrointestinal Disease Researchers (CEGIR, U54 AI117804). CEGIR is also supported by patient advocacy groups including the American Partnership for Eosinophilic Disorders, the CURED Foundation, and the Eosinophilic Family Coalition. Dr. Hirano has received consulting fees and research funding from Celgene, Regeneron, and Shire among others. Dr. Hirano made his comments during the AGA Institute Presidential Plenary at the Annual Digestive Disease Week.
A dramatic rise in the recognition of eosinophilic esophagitis (EoE) has followed the case series by Stephen Attwood, MD, and Alex Straumann, MD, which first characterized the disease 25 years ago. While still a young disease, EoE has evolved from esoterica to a leading cause of dysphagia and food impaction worldwide (Gastroenterology. 2018 Jan;154[2]:319-32.). The typical face of EoE is a 30- to 40-year-old white man, but EoE afflicts both men and women of all ages and ethnic groups.
Guidelines prior to 2017 excluded proton pump inhibitor–responsive esophageal eosinophilia (PPIREE) from a formal diagnosis of EoE. The last decade, however, has witnessed the rise of fall of PPIREE, which was first reported in 2006 in a case series of three pediatric patients with presentations consistent with EoE, but symptom and histologic resolution after treatment with omeprazole. At the time, these cases were viewed as rare curiosities. Subsequent to a prospective series by Javier Molina-Infante, MD, in 2011, however, multiple studies have demonstrated that 30%-50% of patients suspected of having EoE respond to proton pump inhibitor (PPI). Clearly, PPIREE is not rare. Clinical and translational studies have investigated the phenomenon of PPIREE, noting that EoE and PPIREE share demographic, symptom, endoscopic, and pathologic features as well as biomarker expression and gene profiles that are distinct from gastroesophageal reflux disease (GERD). Furthermore, studies have identified intriguing, acid-independent properties of PPIs that inhibit allergic inflammation in cultured EoE cell lines. Together, these clinical and translational studies led to a 2016 European task force recommendation to remove the PPI trial from the diagnostic criteria for EoE (Gut 2016 Mar;65[3]:524-31). At Digestive Disease Week 2017®, an international consortium sponsored by the International Gastrointestinal Eosinophil Researchers (TIGERS) convened in Chicago to review this controversy. The consensus from this meeting was in line with the European position statement. For patients with a clinical presentation suggestive of EoE and esophageal eosinophilia, clinicians should carefully consider non-EoE causes of esophageal eosinophilia but would not be required to use PPIs to establish a diagnosis of EoE.
Assessment of disease activity in EoE has largely focused on counting eosinophils on esophageal biopsies, but the mucosa may be the tip of the EoE iceberg. There is increasing evidence that the inflammation and remodeling aspects of EoE extend beneath the mucosa. If you “dig a little deeper” and sample the subepithelial space, a different face of EoE emerges, with eosinophilic inflammation and fibrosis in EoE that are distinct from GERD. This subepithelial remodeling forms the basis for the strictures and narrow caliber esophagus that are major complications of EoE.
Treatment of EoE involves a multifaceted approach that includes medications, dietary therapy, and esophageal dilation. No drugs have yet been approved by the Food and Drug Administration for EoE. Off-label use of topical corticosteroids are a mainstay of therapy, with 10 double-blind, placebo-controlled randomized trials demonstrating efficacy for both histology and symptoms. Novel therapeutic approaches to EoE are targeting allergic cytokine mediators including interleukin-4, 5, and 13 with promising results. The role of biologic therapies in the management of EoE is yet undefined but the increasing recognition of steroid-refractory patients as well as potential effects on esophageal remodeling are unmet needs. Diet therapy continues to be an important, first-line option for motivated patients and clinicians, with removal of the six most common food allergens associated with a 70% histologic response in both pediatric and adult studies. Less-restrictive diets have been devised to reduce the need for repeated endoscopies. At the same time, several office-based tests of disease activity are undergoing validation, including the esophageal string test, Cytosponge, mucosal impedance, transnasal endoscopy, and confocal microscopy capsule. These technologies will lead to fewer endoscopies and may shift EoE management to the primary care or allergist’s office.
Finally, it is important to acknowledge that EoE is not a “GI disease,” but one that is best managed by a multifaceted approach that integrates allergists, immunologists, pathologists, radiologists, dietitians, patient advocacy, and epidemiologists who are confronting this new disease. The Consortium of Eosinophilic Gastrointestinal Disease Researchers, funded by the National Institutes of Health and the Rare Diseases Clinical Research Network, is an example of a multidisciplinary collaboration that addresses fundamental questions regarding the natural history and optimal management of EoE.
Dr. Hirano is a professor of medicine, division of gastroenterology, Northwestern University, Chicago. He has received grant support from the NIH Consortium of Eosinophilic Gastrointestinal Disease Researchers (CEGIR, U54 AI117804). CEGIR is also supported by patient advocacy groups including the American Partnership for Eosinophilic Disorders, the CURED Foundation, and the Eosinophilic Family Coalition. Dr. Hirano has received consulting fees and research funding from Celgene, Regeneron, and Shire among others. Dr. Hirano made his comments during the AGA Institute Presidential Plenary at the Annual Digestive Disease Week.

Patient-reported outcomes in esophageal diseases
In my introductory comments to the practice management section last year, I wrote about cultivating competencies for value-based care. One of the key competencies was patient centeredness. Patient-reported outcomes (PROs) and patient experience measures specifically were highlighted as examples of meaningful tools for achieving patient centeredness. Starting with this month’s contribution by Drs Reed and Dellon on PROs in esophageal disease, we begin a series of articles focused on this important construct. We will follow this article with reports focused on PRO for patients with irritable bowel syndrome, inflammatory bowel disease, and chronic liver disease. These reports will not only review the importance of PROs, but also highlight the most practical approaches to measuring disease-specific PROs in clinical practice all with the goal of improving the care of our patients.
Ziad Gellad, MD, MPH, AGAF, Special Section Editor
Patients seek medical care for symptoms affecting their quality of life,1 and this is particularly true of digestive diseases, in which many common conditions are symptom predominant. However, clinician and patient perception of symptoms often conflict,2 and formalized measurement tools may have a role for optimizing symptom assessment. Patient-reported outcomes (PROs) directly capture patients’ health status from their own perspectives and can bridge the divide between patient and provider interpretation. The US Food and Drug Administration (FDA) defines PROs as “any report of the status of a patient’s health condition that comes directly from the patient without interpretation of the patient’s response by a clinician or anyone else.”3
For the clinical assessment of esophageal diseases, existing physiologic and structural testing modalities cannot ascertain patient disease perception or measure the impact of symptoms on health care–associated quality of life. In contrast, by capturing patient-centric data, PROs can provide insight into the psychosocial aspects of patient disease perceptions; capture health-related quality of life (HRQL); improve provider understanding; highlight discordance between physiologic, symptom, and HRQL measures; and formalize follow-up evaluation of treatment response.1,4 Following up symptoms such as dysphagia or heartburn over time in a structured way allows clinically obtained data to be used in pragmatic or comparative effectiveness studies. PROs are now an integral part of the FDA’s drug approval process.
In this article, we review the available PROs capturing esophageal symptoms with a focus on dysphagia and heartburn measures that were developed with rigorous methodology; it is beyond the scope of this article to perform a thorough review of all upper gastrointestinal (GI) PROs or quality-of-life PROs. We then discuss how esophageal PROs may be incorporated into clinical practice now, as well as opportunities for PRO use in the future.
Esophageal symptom-specific patient-reported outcomes
The literature pertinent to upper GI and esophageal-specific PROs is heterogeneous, and the development of PROs has been variable in rigor. Two recent systematic reviews identified PROs pertinent to dysphagia and heartburn (Table 1) and both emphasized rigorous measures developed in accordance with FDA guidance.3
Patel et al5 identified 34 dysphagia-specific PRO measures, of which 10 were rigorously developed (Table 1). These measures encompassed multiple conditions including esophageal cancer (Functional Assessment of Cancer Therapy Esophageal Cancer Subscale, European Organization for Research and Treatment of Cancer Quality-of-Life with esophageal Cancer 25 items, European Organization for Research and Treatment of Cancer Quality-of-Life with esophageal cancer 18 items, upper aerodigestive neoplasm-attributable oropharyngeal dysphagia [M.D. Anderson dysphagia inventory], mechanical and neuromyogenic oropharyngeal dysphagia [swallow quality-of-life questionnaire], Sydney Swallow Questionnaire, [swallowing quality of care], achalasia [Measure of Achalasia Disease Severity], eosinophilic esophagitis [Dysphagia Symptom Questionnaire], and general dysphagia symptoms and gastroesophageal reflux [Patient-Reported Outcomes Measurement Information System Gastrointestinal Symptom Scales (PROMIS-GI)]. PROMIS-GI, produced as part of the National Institutes of Health PROMIS program, includes rigorous measures for general dysphagia symptoms and gastroesophageal reflux in addition to lower gastrointestinal symptom measures.
The systematic review by Vakil et al6 found 15 PRO measures for gastroesophageal reflux disease (GERD) symptoms that underwent psychometric evaluation (Table 1). Of these, 5 measures were devised according to the developmental steps stipulated by the US FDA and the European Medicines Agency, and each measure has been used as an end point for a clinical trial. The 5 measures include the GERD Symptom Assessment Scale, the Nocturnal Gastro-oesophageal Reflux Disease Symptom Severity and Impact Questionnaire, the Reflux Questionnaire, the Reflux Disease Questionnaire, and the Proton Pump Inhibitor Acid Suppression Symptom Test (Table 1). Additional PROs capturing esophageal symptoms include the eosinophilic esophagitis symptom activity index, Eckardt score (used for achalasia), Mayo dysphagia questionnaire, and GERD-Q (Table 1).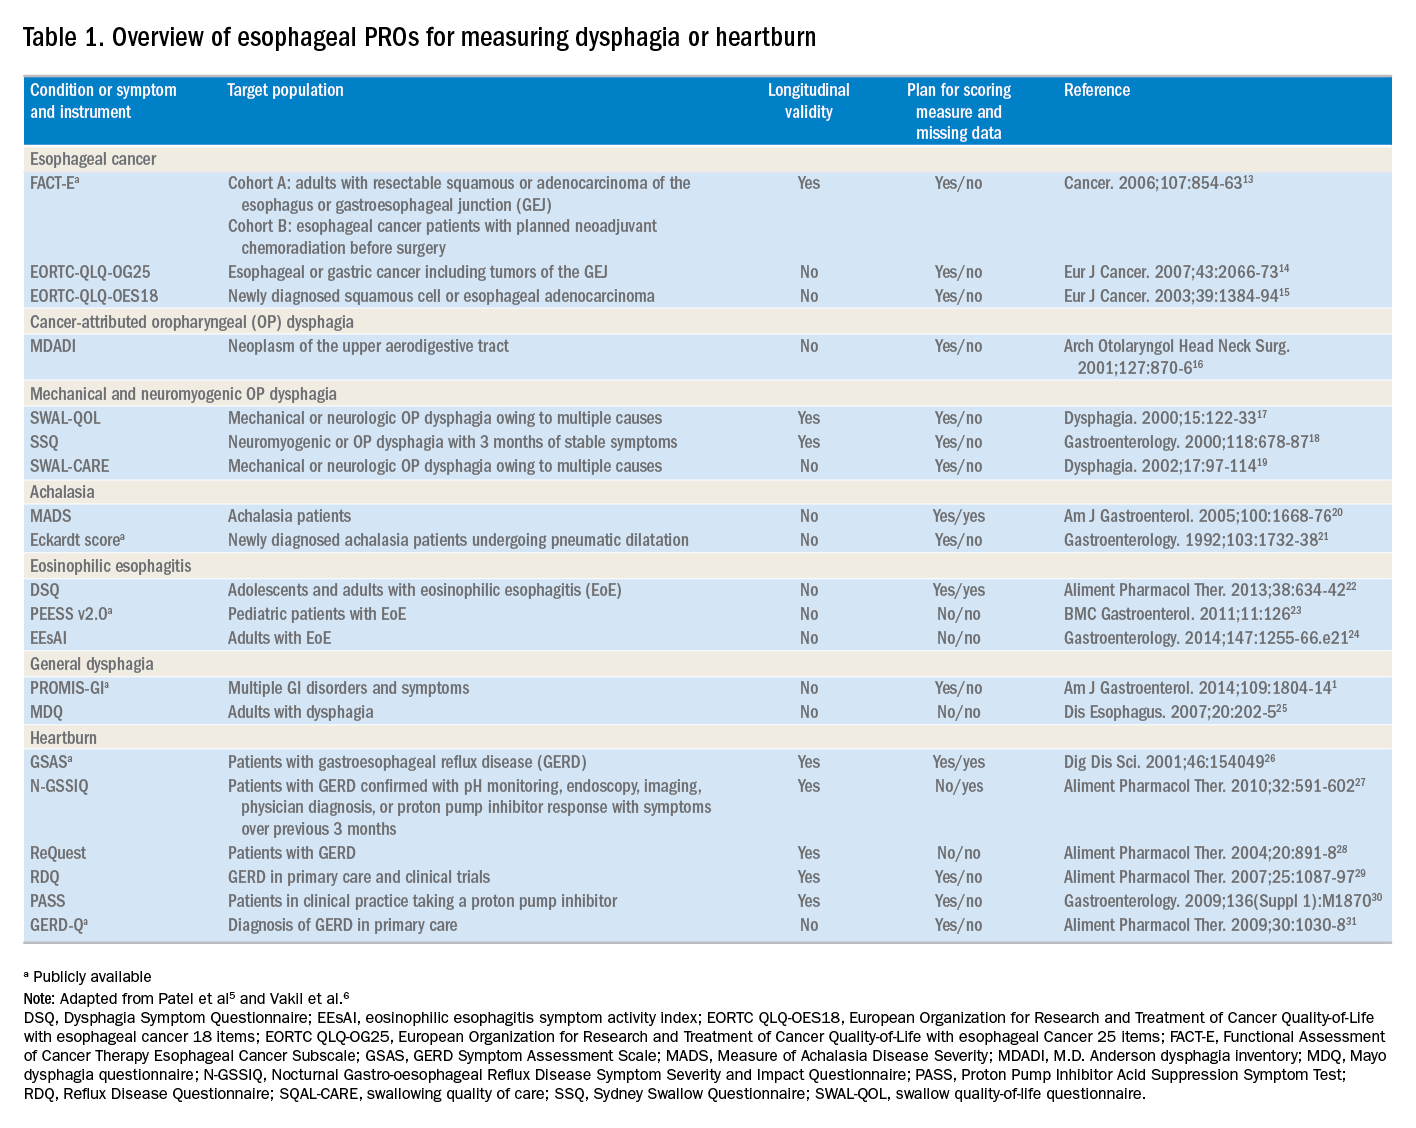
Utilization of esophageal patient-reported outcomes in practice
Before incorporating a PRO into clinical practice, providers must appreciate the construct(s), intent, developmental measurement properties, validation strategies, and responsiveness characteristics associated with the measure.4 PROs can be symptom- and/or condition-specific. For example, this could include dysphagia associated with achalasia or eosinophilic esophagitis, postoperative dysphagia from spine surgery, or general dysphagia symptoms regardless of the etiology (Table 1). Intent refers to the context in which a PRO should be used and generally is stratified into 3 areas: population surveillance, individual patient-clinician interactions, and research studies.4 A thorough analysis of PRO developmental properties exceeds the scope of this article. However, several key considerations are worth discussing. Each measure should clearly delineate the construct, or outcome, in addition to the population used to create the measure (eg, patients with achalasia). PROs should be assessed for reliability, construct validity, and content validity. Reliability pertains to the degree in which scores are free from measurement error, the extent to which items (ie, questions) correlate, and test–retest reliability. Construct validity includes dimensionality (evidence of whether a single or multiple subscales exist in the measure), responsiveness to change (longitudinal validity), and convergent validity (correlation with additional construct-specific measures). Central to the PRO development process is the involvement of patients and content experts (content validity). PRO measures should be readily interpretable, and the handling of missing items should be stipulated. The burden, or time required for administering and scoring the instrument, and the reading level of the PRO need to be considered.8 In short, a PRO should measure something important to patients, in a way that patients can understand, and in a way that accurately reflects the underlying symptom and disease.
Although PROs traditionally represent a method for gathering data for research, they also should be viewed as a means of improving clinical care. The monitoring of change in a particular construct represents a common application of PROs in clinical practice. This helps quantify the efficacy of an intervention and can provide insight into the comparative effectiveness of alternative therapies. For example, in a patient with an esophageal stricture, a dysphagia-specific measure could be used at baseline before an endoscopy and dilation, in follow-up evaluation after dilation, and then as a monitoring tool to determine when repeat dilation may be needed. Similarly, the Eckardt score has been used commonly to monitor response to achalasia treatments. Clinicians also may use PROs in real time to optimize patient management. The data gathered from PROs may help triage patients into treatment pathways, trigger follow-up appointments, supply patient education prompts, and produce patient and provider alerts.8 For providers engaging in clinical research, PROs administered at the point of patient intake, whether electronically through a patient portal or in the clinic, provide a means of gathering baseline data.9 A key question, however, is whether it is practical to use a PRO routinely in the clinic, esophageal function laboratory, or endoscopy suite.
These practical issues include cultivating a conducive environment for PRO utilization, considering the burden of the measure on the patient, and utilization of the results in an expedient manner.9 To promote seamless use of a PRO in clinical work-flows, a multimodal means of collecting PRO data should be arranged. Electronic PROs available through a patient portal, designed with a user-friendly and intuitive interface, facilitate patient completion of PROs at their convenience, and ideally before a clinical or procedure visit. For patients without access to the internet, tablets and/or computer terminals within the office are convenient options. Nurses or clinic staff also could help patients complete a PRO during check-in for clinic, esophageal testing, or endoscopy. The burden a PRO imposes on patients also limits the utility of a measure. For instance, PROs with a small number of questions are more likely to be completed, while scales consisting of 30 of more items are infrequently finished. Clinicians also should consider how they plan to use the results of a PRO before implementing one; if the data will not be used, then the effort to implement and collect it will be wasted. Moreover, patients will anticipate that the time required to complete a PRO will translate to an impact on their management plan and will more readily complete additional PROs if previous measures expediently affected their care.9
Barriers to patient-reported outcome implementation and future directions
Given the potential benefits to PRO use, why are they not implemented routinely? In practice, there are multiple barriers that thwart the adoption of PROs into both health care systems and individual practices. The integration of PROs into large health care systems languishes partly because of technological and operational barriers.9 For instance, the manual distribution, collection, and transcription of handwritten information requires substantial investitures of time, which is magnified by the number of patients whose care is provided within a large health system. One approach to the technological barrier includes the creation of an electronic platform integrating with patient portals. Such a platform would obviate the need to manually collect and transcribe documents, and could import data directly into provider documentation and flowsheets. However, the programming time and costs are substantial upfront, and without clear data that this could lead to improved outcomes or decreased costs downstream there may be reluctance to devote resources to this. In clinical practice, the already significant demands on providers’ time mitigates enthusiasm to add additional tasks. Providers also could face annual licensing agreements, fees on a per-study basis, or royalties associated with particular PROs, and at the individual practice level, there may not be appropriate expertise to select and implement routine PRO monitoring. To address this, efforts are being made to simplify the process of incorporating PROs. For example, given the relatively large number of heterogeneous PROs, the PROMIS project1 endeavors to clarify which PROs constitute the best measure for each construct and condition.9 The PROMIS measures also are provided publicly and are available without license or fee.
Areas particularly well situated for growth in the use of PRO measures include comparative effectiveness studies and pragmatic clinical trials. PRO-derived data may promote a shift from explanatory randomized controlled trials to pragmatic randomized controlled trials because these data emphasize patient-centered care and are more broadly generalizable to clinical settings. Furthermore, the derivation of data directly from the health care delivery system through PROs, such as two-way text messages, increases the relevance and cost effectiveness of clinical trials. Given the current medical climate, pressures continue to mount to identify cost-efficient and efficacious medical therapies.10 In this capacity, PROs facilitate the understanding of changes in HRQL domains subject to treatment choices. PROs further consider the comparative symptom burden and side effects associated with competing treatment strategies.11 Finally, PROs also have enabled the procurement of data from patient-powered research networks. Although this concept has not yet been applied to esophageal diseases, one example of this in the GI field is the Crohn’s and Colitis Foundation of America Partners project, which has built an internet cohort consisting of approximately 14,200 inflammatory bowel disease patients who are monitored with a series of PROs.12 An endeavor such as this should be a model for esophageal conditions in the future.
Conclusions
PROs, as a structured means of directly assessing symptoms, help facilitate a provider’s understanding from a patient’s perspectives. Multiple PROs have been developed to characterize constructs pertinent to esophageal diseases and symptoms. These vary in methodologic rigor, but multiple well-constructed PROs exist for symptom domains such as dysphagia and heartburn, and can be used to monitor symptoms over time and assess treatment efficacy. Implementation of esophageal PROs, both in large health systems and in routine clinical practice, is not yet standard and faces a number of barriers. However, the potential benefits are substantial and include increased patient-centeredness, more accurate and timely disease monitoring, and applicability to comparative effectiveness studies, pragmatic clinical trials, and patient-powered research networks.
References
1. Spiegel B., Hays R., Bolus R., et al. Development of the NIH Patient-Reported Outcomes Measurement Information System (PROMIS) gastrointestinal symptom scales. Am J Gastroenterol. 2014;109:1804-14.
2. Chassany O., Shaheen N.J., Karlsson M., et al. Systematic review: symptom assessment using patient-reported outcomes in gastroesophageal reflux disease and dyspepsia. Scand J Gastroenterol. 2012;47:1412-21.
3. U.S. Department of Health and Human Services FDA Center for Drug Evaluation and Research, U.S. Department of Health and Human Services FDA Center for Biologics Evaluation and Research, U.S. Department of Health and Human Services FDA Center for Devices and Radiological Health. Guidance for industry: patient-reported outcome measures: use in medical product development to support labeling claims: draft guidance. Health Qual Life Outcomes. 2006;4:79. Available from:http://www.ncbi.nlm.nih.gov/pubmed/17034633%0Ahttp://www.pubmedcentral.nih.gov/articlerender.fcgi?artid=PMC1629006
Accessed May 23, 2017
4. Lipscomb J. Cancer outcomes research and the arenas of application. J Natl Cancer Inst Monogr. 2004;2004:1-7.
5. Patel D.A., Sharda R., Hovis K.L., et al. Patient-reported outcome measures in dysphagia: a systematic review of instrument development and validation. Dis Esophagus. 2017;30:1-23.
6. Vakil N.B., Halling K., Becher A., et al. Systematic review of patient-reported outcome instruments for gastroesophageal reflux disease symptoms. Eur J Gastroenterol Hepatol. 2013;25:2-14.
7. Bedell A., Taft T.H., Keefer L. Development of the Northwestern Esophageal Quality of Life Scale: a hybrid measure for use across esophageal conditions. Am J Gastroenterol. 2016;111:493-9.
8. Farnik M., Pierzchala W. Instrument development and evaluation for patient-related outcomes assessments. Patient Relat Outcome Meas. 2012;3:1-7.
9. Wagle N.W.. Implementing patient-reported outcome measures (PROMs). N Engl J Med Catal. 2016; :1-2. Available from:
http://catalyst.nejm.org/implementing-proms-patient-reported-outcome-measures/. Accessed July 14, 2017
10. Richesson R.L., Hammond W.E., Nahm M., et al. Electronic health records based phenotyping in next-generation clinical trials: a perspective from the NIH Health Care Systems Collaboratory. J Am Med Informatics Assoc. 2013;20: e226-e231.
11. Coon C.D., McLeod L.D. Patient-reported outcomes: current perspectives and future directions. Clin Ther. 2013;35:399-401.
12. Chung A.E., Sandler R.S., Long M.D., et al. Harnessing person-generated health data to accelerate patient-centered outcomes research: The Crohn’s and Colitis Foundation of America PCORnet Patient Powered Research Network (CCFA Partners)
J Am Med Informatics Assoc. 2016;23:485-90.
13. Darling G., Eton D.T., Sulman J., et al. Validation of the functional assessment of cancer therapy esophageal cancer subscale. Cancer. 2006;107:854-63.
14. Lagergren P., Fayers P., Conroy T., et al. Clinical and psychometric validation of a questionnaire module, the EORTC QLQ-OG25, to assess health-related quality of life in patients with cancer of the oesophagus, the oesophago-gastric junction and the stomach. Eur J Cancer. 2007;43:2066-73.
15. Blazeby J.M., Conroy T., Hammerlid E., et al. Clinical and psychometric validation of an EORTC questionnaire module, the EORTC QLQ-OES18, to assess quality of life in patients with oesophageal cancer. Eur J Cancer. 2003;39:1384-94.
16. Chen A.Y., Frankowski R., Bishop-Leone J., et al. The development and validation of a dysphagia-specific quality-of-life questionnaire for patients with head and neck cancer: the M. D. Anderson dysphagia inventory. Arch Otolaryngol Head Neck Surg. 2001;127:870-6.
17. McHorney C.A., Bricker D.E., Robbins J., et al. The SWAL-QOL outcomes tool for oropharyngeal dysphagia in adults: II. item reduction and preliminary scaling. Dysphagia. 2000;15:122-33.
18. Wallace K.L., Middleton S., Cook I.J. Development and validation of a self-report symptom inventory to assess the severity of oral-pharyngeal dysphagia. Gastroenterology. 2000;118:678-87.
19. McHorney C.A., Robbins J.A., Lomax K., et al. The SWAL-QOL and SWAL-CARE outcomes tool for oropharyngeal dysphagia in adults: III. Documentation of reliability and validity. Dysphagia. 2002;17:97-114.
20. Urbach D.R., Tomlinson G.A., Harnish J.L., et al. A measure of disease-specific health-related quality of life for achalasia. Am J Gastroenterol. 2005;100:1668-76.
21. Eckardt V., Aignherr C., Bernhard G. Predictors of outcome in patients with achalasia treated by pneumatic dilation. Gastroenterology. 1992;103:1732-8.
22. Dellon E.S., Irani A.M., Hill M.R., et al. Development and field testing of a novel patient-reported outcome measure of dysphagia in patients with eosinophilic esophagitis. Aliment Pharmacol Ther. 2013;38:634-42.
23. Franciosi J.P., Hommel K., DeBrosse C.W., et al. Development of a validated patient-reported symptom metric for pediatric eosinophilic esophagitis: qualitative methods. BMC Gastroenterol. 2011;11:126.
24. Schoepfer A.M., Straumann A., Panczak R., et al. Development and validation of a symptom-based activity index for adults with eosinophilic esophagitis. Gastroenterology. 2014;147:1-24.
25. Grudell A.B., Alexander J.A., Enders F.B., et al. Validation of the Mayo Dysphagia Questionnaire. Dis Esophagus. 2007;20:202-5.
26. Rothman M., Farup C., Steward W., et al. Symptoms associated with gastroesophageal reflux disease: Development of a questionnaire for use in clinical trials. Dig Dis Sci. 2001;46:1540-9.
27. Spiegel B.M., Roberts L., Mody R., et al. The development and validation of a nocturnal gastro-oesophageal reflux disease symptom severity and impact questionnaire for adults. Aliment Pharmacol Ther. 2010;32:591-602.
28. Bardhan K.D., Stanghellini V., Armstrong D., et al. International validation of ReQuest in patients with endoscopy-negative gastro-oesophageal reflux disease. Aliment Pharmacol Ther. 2004;20:891-8.
29. Van Zanten S.V., Armstrong D., Barkun A., et al. Symptom overlap in patients with upper gastrointestinal complaints in the Canadian confirmatory acid suppression test (CAST) study: Further psychometric validation of the reflux disease questionnaire. Aliment Pharmacol Ther. 2007;25:1087-97.
30. Armstrong D., Moayyedi P., Hunt R., et al. M1870 resolution of persistent GERD symptoms after a change in therapy: EncomPASS - a cluster-randomized study in primary care. Gastroenterology. 2009;136(Suppl 1):A-435.
31. Jones R., Junghard O., Dent J., et al. Developement of the GerdQ, a tool for the diagnosis and management of gastro-oesophageal reflux disease in primary care. Aliment Pharmacol Ther. 2009;30:1030-8.
Dr. Reed is a senior fellow and Dr. Dillon is an associate professor of medicine and epidemiology, Center for Esophageal Diseases and Swallowing, division of gastroenterology and hepatology, University of North Carolina School of Medicine, Chapel Hill. Dr. Dellon has received research funding from Adare, Allakos, GSK, Meritage, Miraca, Nutricia, Celgene/Receptos, Regeneron, and Shire; he has been a consultant for Adare, Alivio, Allakos, AstraZeneca, Banner, Calypso, Enumeral, EsoCap, Celgene/Receptos, GSK, Regeneron, Robarts, and Shire; and has received an educational grant from Banner and Holoclara.
In my introductory comments to the practice management section last year, I wrote about cultivating competencies for value-based care. One of the key competencies was patient centeredness. Patient-reported outcomes (PROs) and patient experience measures specifically were highlighted as examples of meaningful tools for achieving patient centeredness. Starting with this month’s contribution by Drs Reed and Dellon on PROs in esophageal disease, we begin a series of articles focused on this important construct. We will follow this article with reports focused on PRO for patients with irritable bowel syndrome, inflammatory bowel disease, and chronic liver disease. These reports will not only review the importance of PROs, but also highlight the most practical approaches to measuring disease-specific PROs in clinical practice all with the goal of improving the care of our patients.
Ziad Gellad, MD, MPH, AGAF, Special Section Editor
Patients seek medical care for symptoms affecting their quality of life,1 and this is particularly true of digestive diseases, in which many common conditions are symptom predominant. However, clinician and patient perception of symptoms often conflict,2 and formalized measurement tools may have a role for optimizing symptom assessment. Patient-reported outcomes (PROs) directly capture patients’ health status from their own perspectives and can bridge the divide between patient and provider interpretation. The US Food and Drug Administration (FDA) defines PROs as “any report of the status of a patient’s health condition that comes directly from the patient without interpretation of the patient’s response by a clinician or anyone else.”3
For the clinical assessment of esophageal diseases, existing physiologic and structural testing modalities cannot ascertain patient disease perception or measure the impact of symptoms on health care–associated quality of life. In contrast, by capturing patient-centric data, PROs can provide insight into the psychosocial aspects of patient disease perceptions; capture health-related quality of life (HRQL); improve provider understanding; highlight discordance between physiologic, symptom, and HRQL measures; and formalize follow-up evaluation of treatment response.1,4 Following up symptoms such as dysphagia or heartburn over time in a structured way allows clinically obtained data to be used in pragmatic or comparative effectiveness studies. PROs are now an integral part of the FDA’s drug approval process.
In this article, we review the available PROs capturing esophageal symptoms with a focus on dysphagia and heartburn measures that were developed with rigorous methodology; it is beyond the scope of this article to perform a thorough review of all upper gastrointestinal (GI) PROs or quality-of-life PROs. We then discuss how esophageal PROs may be incorporated into clinical practice now, as well as opportunities for PRO use in the future.
Esophageal symptom-specific patient-reported outcomes
The literature pertinent to upper GI and esophageal-specific PROs is heterogeneous, and the development of PROs has been variable in rigor. Two recent systematic reviews identified PROs pertinent to dysphagia and heartburn (Table 1) and both emphasized rigorous measures developed in accordance with FDA guidance.3
Patel et al5 identified 34 dysphagia-specific PRO measures, of which 10 were rigorously developed (Table 1). These measures encompassed multiple conditions including esophageal cancer (Functional Assessment of Cancer Therapy Esophageal Cancer Subscale, European Organization for Research and Treatment of Cancer Quality-of-Life with esophageal Cancer 25 items, European Organization for Research and Treatment of Cancer Quality-of-Life with esophageal cancer 18 items, upper aerodigestive neoplasm-attributable oropharyngeal dysphagia [M.D. Anderson dysphagia inventory], mechanical and neuromyogenic oropharyngeal dysphagia [swallow quality-of-life questionnaire], Sydney Swallow Questionnaire, [swallowing quality of care], achalasia [Measure of Achalasia Disease Severity], eosinophilic esophagitis [Dysphagia Symptom Questionnaire], and general dysphagia symptoms and gastroesophageal reflux [Patient-Reported Outcomes Measurement Information System Gastrointestinal Symptom Scales (PROMIS-GI)]. PROMIS-GI, produced as part of the National Institutes of Health PROMIS program, includes rigorous measures for general dysphagia symptoms and gastroesophageal reflux in addition to lower gastrointestinal symptom measures.
The systematic review by Vakil et al6 found 15 PRO measures for gastroesophageal reflux disease (GERD) symptoms that underwent psychometric evaluation (Table 1). Of these, 5 measures were devised according to the developmental steps stipulated by the US FDA and the European Medicines Agency, and each measure has been used as an end point for a clinical trial. The 5 measures include the GERD Symptom Assessment Scale, the Nocturnal Gastro-oesophageal Reflux Disease Symptom Severity and Impact Questionnaire, the Reflux Questionnaire, the Reflux Disease Questionnaire, and the Proton Pump Inhibitor Acid Suppression Symptom Test (Table 1). Additional PROs capturing esophageal symptoms include the eosinophilic esophagitis symptom activity index, Eckardt score (used for achalasia), Mayo dysphagia questionnaire, and GERD-Q (Table 1).
Utilization of esophageal patient-reported outcomes in practice
Before incorporating a PRO into clinical practice, providers must appreciate the construct(s), intent, developmental measurement properties, validation strategies, and responsiveness characteristics associated with the measure.4 PROs can be symptom- and/or condition-specific. For example, this could include dysphagia associated with achalasia or eosinophilic esophagitis, postoperative dysphagia from spine surgery, or general dysphagia symptoms regardless of the etiology (Table 1). Intent refers to the context in which a PRO should be used and generally is stratified into 3 areas: population surveillance, individual patient-clinician interactions, and research studies.4 A thorough analysis of PRO developmental properties exceeds the scope of this article. However, several key considerations are worth discussing. Each measure should clearly delineate the construct, or outcome, in addition to the population used to create the measure (eg, patients with achalasia). PROs should be assessed for reliability, construct validity, and content validity. Reliability pertains to the degree in which scores are free from measurement error, the extent to which items (ie, questions) correlate, and test–retest reliability. Construct validity includes dimensionality (evidence of whether a single or multiple subscales exist in the measure), responsiveness to change (longitudinal validity), and convergent validity (correlation with additional construct-specific measures). Central to the PRO development process is the involvement of patients and content experts (content validity). PRO measures should be readily interpretable, and the handling of missing items should be stipulated. The burden, or time required for administering and scoring the instrument, and the reading level of the PRO need to be considered.8 In short, a PRO should measure something important to patients, in a way that patients can understand, and in a way that accurately reflects the underlying symptom and disease.
Although PROs traditionally represent a method for gathering data for research, they also should be viewed as a means of improving clinical care. The monitoring of change in a particular construct represents a common application of PROs in clinical practice. This helps quantify the efficacy of an intervention and can provide insight into the comparative effectiveness of alternative therapies. For example, in a patient with an esophageal stricture, a dysphagia-specific measure could be used at baseline before an endoscopy and dilation, in follow-up evaluation after dilation, and then as a monitoring tool to determine when repeat dilation may be needed. Similarly, the Eckardt score has been used commonly to monitor response to achalasia treatments. Clinicians also may use PROs in real time to optimize patient management. The data gathered from PROs may help triage patients into treatment pathways, trigger follow-up appointments, supply patient education prompts, and produce patient and provider alerts.8 For providers engaging in clinical research, PROs administered at the point of patient intake, whether electronically through a patient portal or in the clinic, provide a means of gathering baseline data.9 A key question, however, is whether it is practical to use a PRO routinely in the clinic, esophageal function laboratory, or endoscopy suite.
These practical issues include cultivating a conducive environment for PRO utilization, considering the burden of the measure on the patient, and utilization of the results in an expedient manner.9 To promote seamless use of a PRO in clinical work-flows, a multimodal means of collecting PRO data should be arranged. Electronic PROs available through a patient portal, designed with a user-friendly and intuitive interface, facilitate patient completion of PROs at their convenience, and ideally before a clinical or procedure visit. For patients without access to the internet, tablets and/or computer terminals within the office are convenient options. Nurses or clinic staff also could help patients complete a PRO during check-in for clinic, esophageal testing, or endoscopy. The burden a PRO imposes on patients also limits the utility of a measure. For instance, PROs with a small number of questions are more likely to be completed, while scales consisting of 30 of more items are infrequently finished. Clinicians also should consider how they plan to use the results of a PRO before implementing one; if the data will not be used, then the effort to implement and collect it will be wasted. Moreover, patients will anticipate that the time required to complete a PRO will translate to an impact on their management plan and will more readily complete additional PROs if previous measures expediently affected their care.9
Barriers to patient-reported outcome implementation and future directions
Given the potential benefits to PRO use, why are they not implemented routinely? In practice, there are multiple barriers that thwart the adoption of PROs into both health care systems and individual practices. The integration of PROs into large health care systems languishes partly because of technological and operational barriers.9 For instance, the manual distribution, collection, and transcription of handwritten information requires substantial investitures of time, which is magnified by the number of patients whose care is provided within a large health system. One approach to the technological barrier includes the creation of an electronic platform integrating with patient portals. Such a platform would obviate the need to manually collect and transcribe documents, and could import data directly into provider documentation and flowsheets. However, the programming time and costs are substantial upfront, and without clear data that this could lead to improved outcomes or decreased costs downstream there may be reluctance to devote resources to this. In clinical practice, the already significant demands on providers’ time mitigates enthusiasm to add additional tasks. Providers also could face annual licensing agreements, fees on a per-study basis, or royalties associated with particular PROs, and at the individual practice level, there may not be appropriate expertise to select and implement routine PRO monitoring. To address this, efforts are being made to simplify the process of incorporating PROs. For example, given the relatively large number of heterogeneous PROs, the PROMIS project1 endeavors to clarify which PROs constitute the best measure for each construct and condition.9 The PROMIS measures also are provided publicly and are available without license or fee.
Areas particularly well situated for growth in the use of PRO measures include comparative effectiveness studies and pragmatic clinical trials. PRO-derived data may promote a shift from explanatory randomized controlled trials to pragmatic randomized controlled trials because these data emphasize patient-centered care and are more broadly generalizable to clinical settings. Furthermore, the derivation of data directly from the health care delivery system through PROs, such as two-way text messages, increases the relevance and cost effectiveness of clinical trials. Given the current medical climate, pressures continue to mount to identify cost-efficient and efficacious medical therapies.10 In this capacity, PROs facilitate the understanding of changes in HRQL domains subject to treatment choices. PROs further consider the comparative symptom burden and side effects associated with competing treatment strategies.11 Finally, PROs also have enabled the procurement of data from patient-powered research networks. Although this concept has not yet been applied to esophageal diseases, one example of this in the GI field is the Crohn’s and Colitis Foundation of America Partners project, which has built an internet cohort consisting of approximately 14,200 inflammatory bowel disease patients who are monitored with a series of PROs.12 An endeavor such as this should be a model for esophageal conditions in the future.
Conclusions
PROs, as a structured means of directly assessing symptoms, help facilitate a provider’s understanding from a patient’s perspectives. Multiple PROs have been developed to characterize constructs pertinent to esophageal diseases and symptoms. These vary in methodologic rigor, but multiple well-constructed PROs exist for symptom domains such as dysphagia and heartburn, and can be used to monitor symptoms over time and assess treatment efficacy. Implementation of esophageal PROs, both in large health systems and in routine clinical practice, is not yet standard and faces a number of barriers. However, the potential benefits are substantial and include increased patient-centeredness, more accurate and timely disease monitoring, and applicability to comparative effectiveness studies, pragmatic clinical trials, and patient-powered research networks.
References
1. Spiegel B., Hays R., Bolus R., et al. Development of the NIH Patient-Reported Outcomes Measurement Information System (PROMIS) gastrointestinal symptom scales. Am J Gastroenterol. 2014;109:1804-14.
2. Chassany O., Shaheen N.J., Karlsson M., et al. Systematic review: symptom assessment using patient-reported outcomes in gastroesophageal reflux disease and dyspepsia. Scand J Gastroenterol. 2012;47:1412-21.
3. U.S. Department of Health and Human Services FDA Center for Drug Evaluation and Research, U.S. Department of Health and Human Services FDA Center for Biologics Evaluation and Research, U.S. Department of Health and Human Services FDA Center for Devices and Radiological Health. Guidance for industry: patient-reported outcome measures: use in medical product development to support labeling claims: draft guidance. Health Qual Life Outcomes. 2006;4:79. Available from:http://www.ncbi.nlm.nih.gov/pubmed/17034633%0Ahttp://www.pubmedcentral.nih.gov/articlerender.fcgi?artid=PMC1629006
Accessed May 23, 2017
4. Lipscomb J. Cancer outcomes research and the arenas of application. J Natl Cancer Inst Monogr. 2004;2004:1-7.
5. Patel D.A., Sharda R., Hovis K.L., et al. Patient-reported outcome measures in dysphagia: a systematic review of instrument development and validation. Dis Esophagus. 2017;30:1-23.
6. Vakil N.B., Halling K., Becher A., et al. Systematic review of patient-reported outcome instruments for gastroesophageal reflux disease symptoms. Eur J Gastroenterol Hepatol. 2013;25:2-14.
7. Bedell A., Taft T.H., Keefer L. Development of the Northwestern Esophageal Quality of Life Scale: a hybrid measure for use across esophageal conditions. Am J Gastroenterol. 2016;111:493-9.
8. Farnik M., Pierzchala W. Instrument development and evaluation for patient-related outcomes assessments. Patient Relat Outcome Meas. 2012;3:1-7.
9. Wagle N.W.. Implementing patient-reported outcome measures (PROMs). N Engl J Med Catal. 2016; :1-2. Available from:
http://catalyst.nejm.org/implementing-proms-patient-reported-outcome-measures/. Accessed July 14, 2017
10. Richesson R.L., Hammond W.E., Nahm M., et al. Electronic health records based phenotyping in next-generation clinical trials: a perspective from the NIH Health Care Systems Collaboratory. J Am Med Informatics Assoc. 2013;20: e226-e231.
11. Coon C.D., McLeod L.D. Patient-reported outcomes: current perspectives and future directions. Clin Ther. 2013;35:399-401.
12. Chung A.E., Sandler R.S., Long M.D., et al. Harnessing person-generated health data to accelerate patient-centered outcomes research: The Crohn’s and Colitis Foundation of America PCORnet Patient Powered Research Network (CCFA Partners)
J Am Med Informatics Assoc. 2016;23:485-90.
13. Darling G., Eton D.T., Sulman J., et al. Validation of the functional assessment of cancer therapy esophageal cancer subscale. Cancer. 2006;107:854-63.
14. Lagergren P., Fayers P., Conroy T., et al. Clinical and psychometric validation of a questionnaire module, the EORTC QLQ-OG25, to assess health-related quality of life in patients with cancer of the oesophagus, the oesophago-gastric junction and the stomach. Eur J Cancer. 2007;43:2066-73.
15. Blazeby J.M., Conroy T., Hammerlid E., et al. Clinical and psychometric validation of an EORTC questionnaire module, the EORTC QLQ-OES18, to assess quality of life in patients with oesophageal cancer. Eur J Cancer. 2003;39:1384-94.
16. Chen A.Y., Frankowski R., Bishop-Leone J., et al. The development and validation of a dysphagia-specific quality-of-life questionnaire for patients with head and neck cancer: the M. D. Anderson dysphagia inventory. Arch Otolaryngol Head Neck Surg. 2001;127:870-6.
17. McHorney C.A., Bricker D.E., Robbins J., et al. The SWAL-QOL outcomes tool for oropharyngeal dysphagia in adults: II. item reduction and preliminary scaling. Dysphagia. 2000;15:122-33.
18. Wallace K.L., Middleton S., Cook I.J. Development and validation of a self-report symptom inventory to assess the severity of oral-pharyngeal dysphagia. Gastroenterology. 2000;118:678-87.
19. McHorney C.A., Robbins J.A., Lomax K., et al. The SWAL-QOL and SWAL-CARE outcomes tool for oropharyngeal dysphagia in adults: III. Documentation of reliability and validity. Dysphagia. 2002;17:97-114.
20. Urbach D.R., Tomlinson G.A., Harnish J.L., et al. A measure of disease-specific health-related quality of life for achalasia. Am J Gastroenterol. 2005;100:1668-76.
21. Eckardt V., Aignherr C., Bernhard G. Predictors of outcome in patients with achalasia treated by pneumatic dilation. Gastroenterology. 1992;103:1732-8.
22. Dellon E.S., Irani A.M., Hill M.R., et al. Development and field testing of a novel patient-reported outcome measure of dysphagia in patients with eosinophilic esophagitis. Aliment Pharmacol Ther. 2013;38:634-42.
23. Franciosi J.P., Hommel K., DeBrosse C.W., et al. Development of a validated patient-reported symptom metric for pediatric eosinophilic esophagitis: qualitative methods. BMC Gastroenterol. 2011;11:126.
24. Schoepfer A.M., Straumann A., Panczak R., et al. Development and validation of a symptom-based activity index for adults with eosinophilic esophagitis. Gastroenterology. 2014;147:1-24.
25. Grudell A.B., Alexander J.A., Enders F.B., et al. Validation of the Mayo Dysphagia Questionnaire. Dis Esophagus. 2007;20:202-5.
26. Rothman M., Farup C., Steward W., et al. Symptoms associated with gastroesophageal reflux disease: Development of a questionnaire for use in clinical trials. Dig Dis Sci. 2001;46:1540-9.
27. Spiegel B.M., Roberts L., Mody R., et al. The development and validation of a nocturnal gastro-oesophageal reflux disease symptom severity and impact questionnaire for adults. Aliment Pharmacol Ther. 2010;32:591-602.
28. Bardhan K.D., Stanghellini V., Armstrong D., et al. International validation of ReQuest in patients with endoscopy-negative gastro-oesophageal reflux disease. Aliment Pharmacol Ther. 2004;20:891-8.
29. Van Zanten S.V., Armstrong D., Barkun A., et al. Symptom overlap in patients with upper gastrointestinal complaints in the Canadian confirmatory acid suppression test (CAST) study: Further psychometric validation of the reflux disease questionnaire. Aliment Pharmacol Ther. 2007;25:1087-97.
30. Armstrong D., Moayyedi P., Hunt R., et al. M1870 resolution of persistent GERD symptoms after a change in therapy: EncomPASS - a cluster-randomized study in primary care. Gastroenterology. 2009;136(Suppl 1):A-435.
31. Jones R., Junghard O., Dent J., et al. Developement of the GerdQ, a tool for the diagnosis and management of gastro-oesophageal reflux disease in primary care. Aliment Pharmacol Ther. 2009;30:1030-8.
Dr. Reed is a senior fellow and Dr. Dillon is an associate professor of medicine and epidemiology, Center for Esophageal Diseases and Swallowing, division of gastroenterology and hepatology, University of North Carolina School of Medicine, Chapel Hill. Dr. Dellon has received research funding from Adare, Allakos, GSK, Meritage, Miraca, Nutricia, Celgene/Receptos, Regeneron, and Shire; he has been a consultant for Adare, Alivio, Allakos, AstraZeneca, Banner, Calypso, Enumeral, EsoCap, Celgene/Receptos, GSK, Regeneron, Robarts, and Shire; and has received an educational grant from Banner and Holoclara.
In my introductory comments to the practice management section last year, I wrote about cultivating competencies for value-based care. One of the key competencies was patient centeredness. Patient-reported outcomes (PROs) and patient experience measures specifically were highlighted as examples of meaningful tools for achieving patient centeredness. Starting with this month’s contribution by Drs Reed and Dellon on PROs in esophageal disease, we begin a series of articles focused on this important construct. We will follow this article with reports focused on PRO for patients with irritable bowel syndrome, inflammatory bowel disease, and chronic liver disease. These reports will not only review the importance of PROs, but also highlight the most practical approaches to measuring disease-specific PROs in clinical practice all with the goal of improving the care of our patients.
Ziad Gellad, MD, MPH, AGAF, Special Section Editor
Patients seek medical care for symptoms affecting their quality of life,1 and this is particularly true of digestive diseases, in which many common conditions are symptom predominant. However, clinician and patient perception of symptoms often conflict,2 and formalized measurement tools may have a role for optimizing symptom assessment. Patient-reported outcomes (PROs) directly capture patients’ health status from their own perspectives and can bridge the divide between patient and provider interpretation. The US Food and Drug Administration (FDA) defines PROs as “any report of the status of a patient’s health condition that comes directly from the patient without interpretation of the patient’s response by a clinician or anyone else.”3
For the clinical assessment of esophageal diseases, existing physiologic and structural testing modalities cannot ascertain patient disease perception or measure the impact of symptoms on health care–associated quality of life. In contrast, by capturing patient-centric data, PROs can provide insight into the psychosocial aspects of patient disease perceptions; capture health-related quality of life (HRQL); improve provider understanding; highlight discordance between physiologic, symptom, and HRQL measures; and formalize follow-up evaluation of treatment response.1,4 Following up symptoms such as dysphagia or heartburn over time in a structured way allows clinically obtained data to be used in pragmatic or comparative effectiveness studies. PROs are now an integral part of the FDA’s drug approval process.
In this article, we review the available PROs capturing esophageal symptoms with a focus on dysphagia and heartburn measures that were developed with rigorous methodology; it is beyond the scope of this article to perform a thorough review of all upper gastrointestinal (GI) PROs or quality-of-life PROs. We then discuss how esophageal PROs may be incorporated into clinical practice now, as well as opportunities for PRO use in the future.
Esophageal symptom-specific patient-reported outcomes
The literature pertinent to upper GI and esophageal-specific PROs is heterogeneous, and the development of PROs has been variable in rigor. Two recent systematic reviews identified PROs pertinent to dysphagia and heartburn (Table 1) and both emphasized rigorous measures developed in accordance with FDA guidance.3
Patel et al5 identified 34 dysphagia-specific PRO measures, of which 10 were rigorously developed (Table 1). These measures encompassed multiple conditions including esophageal cancer (Functional Assessment of Cancer Therapy Esophageal Cancer Subscale, European Organization for Research and Treatment of Cancer Quality-of-Life with esophageal Cancer 25 items, European Organization for Research and Treatment of Cancer Quality-of-Life with esophageal cancer 18 items, upper aerodigestive neoplasm-attributable oropharyngeal dysphagia [M.D. Anderson dysphagia inventory], mechanical and neuromyogenic oropharyngeal dysphagia [swallow quality-of-life questionnaire], Sydney Swallow Questionnaire, [swallowing quality of care], achalasia [Measure of Achalasia Disease Severity], eosinophilic esophagitis [Dysphagia Symptom Questionnaire], and general dysphagia symptoms and gastroesophageal reflux [Patient-Reported Outcomes Measurement Information System Gastrointestinal Symptom Scales (PROMIS-GI)]. PROMIS-GI, produced as part of the National Institutes of Health PROMIS program, includes rigorous measures for general dysphagia symptoms and gastroesophageal reflux in addition to lower gastrointestinal symptom measures.
The systematic review by Vakil et al6 found 15 PRO measures for gastroesophageal reflux disease (GERD) symptoms that underwent psychometric evaluation (Table 1). Of these, 5 measures were devised according to the developmental steps stipulated by the US FDA and the European Medicines Agency, and each measure has been used as an end point for a clinical trial. The 5 measures include the GERD Symptom Assessment Scale, the Nocturnal Gastro-oesophageal Reflux Disease Symptom Severity and Impact Questionnaire, the Reflux Questionnaire, the Reflux Disease Questionnaire, and the Proton Pump Inhibitor Acid Suppression Symptom Test (Table 1). Additional PROs capturing esophageal symptoms include the eosinophilic esophagitis symptom activity index, Eckardt score (used for achalasia), Mayo dysphagia questionnaire, and GERD-Q (Table 1).
Utilization of esophageal patient-reported outcomes in practice
Before incorporating a PRO into clinical practice, providers must appreciate the construct(s), intent, developmental measurement properties, validation strategies, and responsiveness characteristics associated with the measure.4 PROs can be symptom- and/or condition-specific. For example, this could include dysphagia associated with achalasia or eosinophilic esophagitis, postoperative dysphagia from spine surgery, or general dysphagia symptoms regardless of the etiology (Table 1). Intent refers to the context in which a PRO should be used and generally is stratified into 3 areas: population surveillance, individual patient-clinician interactions, and research studies.4 A thorough analysis of PRO developmental properties exceeds the scope of this article. However, several key considerations are worth discussing. Each measure should clearly delineate the construct, or outcome, in addition to the population used to create the measure (eg, patients with achalasia). PROs should be assessed for reliability, construct validity, and content validity. Reliability pertains to the degree in which scores are free from measurement error, the extent to which items (ie, questions) correlate, and test–retest reliability. Construct validity includes dimensionality (evidence of whether a single or multiple subscales exist in the measure), responsiveness to change (longitudinal validity), and convergent validity (correlation with additional construct-specific measures). Central to the PRO development process is the involvement of patients and content experts (content validity). PRO measures should be readily interpretable, and the handling of missing items should be stipulated. The burden, or time required for administering and scoring the instrument, and the reading level of the PRO need to be considered.8 In short, a PRO should measure something important to patients, in a way that patients can understand, and in a way that accurately reflects the underlying symptom and disease.
Although PROs traditionally represent a method for gathering data for research, they also should be viewed as a means of improving clinical care. The monitoring of change in a particular construct represents a common application of PROs in clinical practice. This helps quantify the efficacy of an intervention and can provide insight into the comparative effectiveness of alternative therapies. For example, in a patient with an esophageal stricture, a dysphagia-specific measure could be used at baseline before an endoscopy and dilation, in follow-up evaluation after dilation, and then as a monitoring tool to determine when repeat dilation may be needed. Similarly, the Eckardt score has been used commonly to monitor response to achalasia treatments. Clinicians also may use PROs in real time to optimize patient management. The data gathered from PROs may help triage patients into treatment pathways, trigger follow-up appointments, supply patient education prompts, and produce patient and provider alerts.8 For providers engaging in clinical research, PROs administered at the point of patient intake, whether electronically through a patient portal or in the clinic, provide a means of gathering baseline data.9 A key question, however, is whether it is practical to use a PRO routinely in the clinic, esophageal function laboratory, or endoscopy suite.
These practical issues include cultivating a conducive environment for PRO utilization, considering the burden of the measure on the patient, and utilization of the results in an expedient manner.9 To promote seamless use of a PRO in clinical work-flows, a multimodal means of collecting PRO data should be arranged. Electronic PROs available through a patient portal, designed with a user-friendly and intuitive interface, facilitate patient completion of PROs at their convenience, and ideally before a clinical or procedure visit. For patients without access to the internet, tablets and/or computer terminals within the office are convenient options. Nurses or clinic staff also could help patients complete a PRO during check-in for clinic, esophageal testing, or endoscopy. The burden a PRO imposes on patients also limits the utility of a measure. For instance, PROs with a small number of questions are more likely to be completed, while scales consisting of 30 of more items are infrequently finished. Clinicians also should consider how they plan to use the results of a PRO before implementing one; if the data will not be used, then the effort to implement and collect it will be wasted. Moreover, patients will anticipate that the time required to complete a PRO will translate to an impact on their management plan and will more readily complete additional PROs if previous measures expediently affected their care.9
Barriers to patient-reported outcome implementation and future directions
Given the potential benefits to PRO use, why are they not implemented routinely? In practice, there are multiple barriers that thwart the adoption of PROs into both health care systems and individual practices. The integration of PROs into large health care systems languishes partly because of technological and operational barriers.9 For instance, the manual distribution, collection, and transcription of handwritten information requires substantial investitures of time, which is magnified by the number of patients whose care is provided within a large health system. One approach to the technological barrier includes the creation of an electronic platform integrating with patient portals. Such a platform would obviate the need to manually collect and transcribe documents, and could import data directly into provider documentation and flowsheets. However, the programming time and costs are substantial upfront, and without clear data that this could lead to improved outcomes or decreased costs downstream there may be reluctance to devote resources to this. In clinical practice, the already significant demands on providers’ time mitigates enthusiasm to add additional tasks. Providers also could face annual licensing agreements, fees on a per-study basis, or royalties associated with particular PROs, and at the individual practice level, there may not be appropriate expertise to select and implement routine PRO monitoring. To address this, efforts are being made to simplify the process of incorporating PROs. For example, given the relatively large number of heterogeneous PROs, the PROMIS project1 endeavors to clarify which PROs constitute the best measure for each construct and condition.9 The PROMIS measures also are provided publicly and are available without license or fee.
Areas particularly well situated for growth in the use of PRO measures include comparative effectiveness studies and pragmatic clinical trials. PRO-derived data may promote a shift from explanatory randomized controlled trials to pragmatic randomized controlled trials because these data emphasize patient-centered care and are more broadly generalizable to clinical settings. Furthermore, the derivation of data directly from the health care delivery system through PROs, such as two-way text messages, increases the relevance and cost effectiveness of clinical trials. Given the current medical climate, pressures continue to mount to identify cost-efficient and efficacious medical therapies.10 In this capacity, PROs facilitate the understanding of changes in HRQL domains subject to treatment choices. PROs further consider the comparative symptom burden and side effects associated with competing treatment strategies.11 Finally, PROs also have enabled the procurement of data from patient-powered research networks. Although this concept has not yet been applied to esophageal diseases, one example of this in the GI field is the Crohn’s and Colitis Foundation of America Partners project, which has built an internet cohort consisting of approximately 14,200 inflammatory bowel disease patients who are monitored with a series of PROs.12 An endeavor such as this should be a model for esophageal conditions in the future.
Conclusions
PROs, as a structured means of directly assessing symptoms, help facilitate a provider’s understanding from a patient’s perspectives. Multiple PROs have been developed to characterize constructs pertinent to esophageal diseases and symptoms. These vary in methodologic rigor, but multiple well-constructed PROs exist for symptom domains such as dysphagia and heartburn, and can be used to monitor symptoms over time and assess treatment efficacy. Implementation of esophageal PROs, both in large health systems and in routine clinical practice, is not yet standard and faces a number of barriers. However, the potential benefits are substantial and include increased patient-centeredness, more accurate and timely disease monitoring, and applicability to comparative effectiveness studies, pragmatic clinical trials, and patient-powered research networks.
References
1. Spiegel B., Hays R., Bolus R., et al. Development of the NIH Patient-Reported Outcomes Measurement Information System (PROMIS) gastrointestinal symptom scales. Am J Gastroenterol. 2014;109:1804-14.
2. Chassany O., Shaheen N.J., Karlsson M., et al. Systematic review: symptom assessment using patient-reported outcomes in gastroesophageal reflux disease and dyspepsia. Scand J Gastroenterol. 2012;47:1412-21.
3. U.S. Department of Health and Human Services FDA Center for Drug Evaluation and Research, U.S. Department of Health and Human Services FDA Center for Biologics Evaluation and Research, U.S. Department of Health and Human Services FDA Center for Devices and Radiological Health. Guidance for industry: patient-reported outcome measures: use in medical product development to support labeling claims: draft guidance. Health Qual Life Outcomes. 2006;4:79. Available from:http://www.ncbi.nlm.nih.gov/pubmed/17034633%0Ahttp://www.pubmedcentral.nih.gov/articlerender.fcgi?artid=PMC1629006
Accessed May 23, 2017
4. Lipscomb J. Cancer outcomes research and the arenas of application. J Natl Cancer Inst Monogr. 2004;2004:1-7.
5. Patel D.A., Sharda R., Hovis K.L., et al. Patient-reported outcome measures in dysphagia: a systematic review of instrument development and validation. Dis Esophagus. 2017;30:1-23.
6. Vakil N.B., Halling K., Becher A., et al. Systematic review of patient-reported outcome instruments for gastroesophageal reflux disease symptoms. Eur J Gastroenterol Hepatol. 2013;25:2-14.
7. Bedell A., Taft T.H., Keefer L. Development of the Northwestern Esophageal Quality of Life Scale: a hybrid measure for use across esophageal conditions. Am J Gastroenterol. 2016;111:493-9.
8. Farnik M., Pierzchala W. Instrument development and evaluation for patient-related outcomes assessments. Patient Relat Outcome Meas. 2012;3:1-7.
9. Wagle N.W.. Implementing patient-reported outcome measures (PROMs). N Engl J Med Catal. 2016; :1-2. Available from:
http://catalyst.nejm.org/implementing-proms-patient-reported-outcome-measures/. Accessed July 14, 2017
10. Richesson R.L., Hammond W.E., Nahm M., et al. Electronic health records based phenotyping in next-generation clinical trials: a perspective from the NIH Health Care Systems Collaboratory. J Am Med Informatics Assoc. 2013;20: e226-e231.
11. Coon C.D., McLeod L.D. Patient-reported outcomes: current perspectives and future directions. Clin Ther. 2013;35:399-401.
12. Chung A.E., Sandler R.S., Long M.D., et al. Harnessing person-generated health data to accelerate patient-centered outcomes research: The Crohn’s and Colitis Foundation of America PCORnet Patient Powered Research Network (CCFA Partners)
J Am Med Informatics Assoc. 2016;23:485-90.
13. Darling G., Eton D.T., Sulman J., et al. Validation of the functional assessment of cancer therapy esophageal cancer subscale. Cancer. 2006;107:854-63.
14. Lagergren P., Fayers P., Conroy T., et al. Clinical and psychometric validation of a questionnaire module, the EORTC QLQ-OG25, to assess health-related quality of life in patients with cancer of the oesophagus, the oesophago-gastric junction and the stomach. Eur J Cancer. 2007;43:2066-73.
15. Blazeby J.M., Conroy T., Hammerlid E., et al. Clinical and psychometric validation of an EORTC questionnaire module, the EORTC QLQ-OES18, to assess quality of life in patients with oesophageal cancer. Eur J Cancer. 2003;39:1384-94.
16. Chen A.Y., Frankowski R., Bishop-Leone J., et al. The development and validation of a dysphagia-specific quality-of-life questionnaire for patients with head and neck cancer: the M. D. Anderson dysphagia inventory. Arch Otolaryngol Head Neck Surg. 2001;127:870-6.
17. McHorney C.A., Bricker D.E., Robbins J., et al. The SWAL-QOL outcomes tool for oropharyngeal dysphagia in adults: II. item reduction and preliminary scaling. Dysphagia. 2000;15:122-33.
18. Wallace K.L., Middleton S., Cook I.J. Development and validation of a self-report symptom inventory to assess the severity of oral-pharyngeal dysphagia. Gastroenterology. 2000;118:678-87.
19. McHorney C.A., Robbins J.A., Lomax K., et al. The SWAL-QOL and SWAL-CARE outcomes tool for oropharyngeal dysphagia in adults: III. Documentation of reliability and validity. Dysphagia. 2002;17:97-114.
20. Urbach D.R., Tomlinson G.A., Harnish J.L., et al. A measure of disease-specific health-related quality of life for achalasia. Am J Gastroenterol. 2005;100:1668-76.
21. Eckardt V., Aignherr C., Bernhard G. Predictors of outcome in patients with achalasia treated by pneumatic dilation. Gastroenterology. 1992;103:1732-8.
22. Dellon E.S., Irani A.M., Hill M.R., et al. Development and field testing of a novel patient-reported outcome measure of dysphagia in patients with eosinophilic esophagitis. Aliment Pharmacol Ther. 2013;38:634-42.
23. Franciosi J.P., Hommel K., DeBrosse C.W., et al. Development of a validated patient-reported symptom metric for pediatric eosinophilic esophagitis: qualitative methods. BMC Gastroenterol. 2011;11:126.
24. Schoepfer A.M., Straumann A., Panczak R., et al. Development and validation of a symptom-based activity index for adults with eosinophilic esophagitis. Gastroenterology. 2014;147:1-24.
25. Grudell A.B., Alexander J.A., Enders F.B., et al. Validation of the Mayo Dysphagia Questionnaire. Dis Esophagus. 2007;20:202-5.
26. Rothman M., Farup C., Steward W., et al. Symptoms associated with gastroesophageal reflux disease: Development of a questionnaire for use in clinical trials. Dig Dis Sci. 2001;46:1540-9.
27. Spiegel B.M., Roberts L., Mody R., et al. The development and validation of a nocturnal gastro-oesophageal reflux disease symptom severity and impact questionnaire for adults. Aliment Pharmacol Ther. 2010;32:591-602.
28. Bardhan K.D., Stanghellini V., Armstrong D., et al. International validation of ReQuest in patients with endoscopy-negative gastro-oesophageal reflux disease. Aliment Pharmacol Ther. 2004;20:891-8.
29. Van Zanten S.V., Armstrong D., Barkun A., et al. Symptom overlap in patients with upper gastrointestinal complaints in the Canadian confirmatory acid suppression test (CAST) study: Further psychometric validation of the reflux disease questionnaire. Aliment Pharmacol Ther. 2007;25:1087-97.
30. Armstrong D., Moayyedi P., Hunt R., et al. M1870 resolution of persistent GERD symptoms after a change in therapy: EncomPASS - a cluster-randomized study in primary care. Gastroenterology. 2009;136(Suppl 1):A-435.
31. Jones R., Junghard O., Dent J., et al. Developement of the GerdQ, a tool for the diagnosis and management of gastro-oesophageal reflux disease in primary care. Aliment Pharmacol Ther. 2009;30:1030-8.
Dr. Reed is a senior fellow and Dr. Dillon is an associate professor of medicine and epidemiology, Center for Esophageal Diseases and Swallowing, division of gastroenterology and hepatology, University of North Carolina School of Medicine, Chapel Hill. Dr. Dellon has received research funding from Adare, Allakos, GSK, Meritage, Miraca, Nutricia, Celgene/Receptos, Regeneron, and Shire; he has been a consultant for Adare, Alivio, Allakos, AstraZeneca, Banner, Calypso, Enumeral, EsoCap, Celgene/Receptos, GSK, Regeneron, Robarts, and Shire; and has received an educational grant from Banner and Holoclara.
Delayed diagnosis of breast cancer: $15M award
Delayed diagnosis of breast cancer: $15M award
A woman in her mid-50s had been seen by a breast surgeon for 16 years for regular mammograms and sonograms. In May 2009, the breast surgeon misinterpreted a mammogram as negative, as did a radiologist who re-read the mammogram weeks later. In December 2010, the patient returned to the breast surgeon with nipple discharge. No further testing was conducted. In October 2011, the patient was found to have Stage IIIA breast cancer involving 4 lymph nodes. She underwent left radical mastectomy, chemotherapy, radiation therapy, and breast reconstruction. At time of trial, the cancer had invaded her vertebrae, was Stage IV, and most likely incurable.
PATIENT'S CLAIM: Although the surgeon admittedly did not possess the qualifications required under the Mammography Quality Standards Act, he interpreted about 5,000 mammograms per year in his office. In this case, he failed to detect a small breast tumor in May 2009. He also failed to perform testing when the patient reported nipple discharge. A more timely diagnosis of breast cancer at Stage I would have provided a 90% chance of long-term survival.
DEFENDANTS' DEFENSE: The defense held the radiologist fully liable because the surgeon was not a qualified interpreter of mammography, therefore relying on the radiologist’s interpretation. The radiologist was legally responsible for the missed diagnosis.
VERDICT: A $15M New York verdict was reached, finding the breast surgeon 75% at fault and the radiologist 25%. The radiologist settled before the trial (the jury was not informed of this). The breast surgeon was responsible for $11.25M. The defense indicated intent to appeal.
Alleged failure to evacuate uterus after cesarean delivery
A 37-year-old woman underwent cesarean delivery (CD) performed by 2 ObGyns. After delivery, she began to hemorrhage and the uterus became atonic. Hysterectomy was performed but the bleeding did not stop. The ObGyns called in 3 other ObGyns. During exploratory laparotomy, the bleeding was halted.
PATIENT'S CLAIM: She and her husband had hoped to have more children but the hysterectomy precluded that. She sued all 5 ObGyns, alleging that the delivering ObGyns failed to properly perform the CD and that each physician failed to properly perform the laparotomy, causing a large scar. The claim was discontinued against the 3 surgical ObGyns; trial addressed the 2 delivering ObGyns.
The patient’s expert ObGyn remarked that the hemorrhage was caused by a small placental remnant that remained in the uterus as a result of inadequate evacuation following delivery. The presence of the remnant was indicated by the uterine atony and should have prompted immediate investigation. The physicians’ notes did not document exploration of the uterus prior to closure.
PHYSICIAN'S DEFENSE: The defense’s expert contended that atony would not be a result of a small remnant of placenta. The patient’s uterus was properly evacuated, the hemorrhage was an unforeseeable complication, and the ObGyns properly addressed the hemorrhage.
VERDICT: A New York defense verdict was returned.
Alleged bowel injury during hysterectomy
Two days after a woman underwent a hysterectomy performed by her ObGyn, she went to the emergency department with increasing pain. Her ObGyn admitted her to the hospital. A general surgeon performed an exploratory laparotomy the next day that revealed an abscess; a 1-cm perforation of the patient’s bowel was surgically repaired. The patient had a difficult recovery. She developed pneumonia and respiratory failure. She underwent multiple repair surgeries for recurrent abscesses and fistulas because the wound was slow to heal.
PATIENT'S CLAIM: The ObGyn’s surgical technique was negligent. He injured the bowel when inserting a trocar and did not identify the injury in a timely manner. The expert witness commented that such an injury can sometimes be a surgical complication, but not in this case: the ObGyn rushed the procedure because he had another patient waiting for CD at another hospital.
PHYSICIAN'S DEFENSE: The ObGyn denied negligence and contended that the trocar used in surgery was too blunt to have caused a perforation. It would have been obvious to the ObGyn during surgery if a perforation had occurred. The perforation developed days after surgery within an abscess.
VERDICT: A Mississippi defense verdict was returned.
These cases were selected by the editors of OBG Management from Medical Malpractice Verdicts, Settlements & Experts, with permission of the editor, Lewis Laska (www.verdictslaska.com). The information available to the editors about the cases presented here is sometimes incomplete. Moreover, the cases may or may not have merit. Nevertheless, these cases represent the types of clinical situations that typically result in litigation and are meant to illustrate nationwide variation in jury verdicts and awards.
Share your thoughts! Send your Letter to the Editor to rbarbieri@mdedge.com. Please include your name and the city and state in which you practice.
Delayed diagnosis of breast cancer: $15M award
A woman in her mid-50s had been seen by a breast surgeon for 16 years for regular mammograms and sonograms. In May 2009, the breast surgeon misinterpreted a mammogram as negative, as did a radiologist who re-read the mammogram weeks later. In December 2010, the patient returned to the breast surgeon with nipple discharge. No further testing was conducted. In October 2011, the patient was found to have Stage IIIA breast cancer involving 4 lymph nodes. She underwent left radical mastectomy, chemotherapy, radiation therapy, and breast reconstruction. At time of trial, the cancer had invaded her vertebrae, was Stage IV, and most likely incurable.
PATIENT'S CLAIM: Although the surgeon admittedly did not possess the qualifications required under the Mammography Quality Standards Act, he interpreted about 5,000 mammograms per year in his office. In this case, he failed to detect a small breast tumor in May 2009. He also failed to perform testing when the patient reported nipple discharge. A more timely diagnosis of breast cancer at Stage I would have provided a 90% chance of long-term survival.
DEFENDANTS' DEFENSE: The defense held the radiologist fully liable because the surgeon was not a qualified interpreter of mammography, therefore relying on the radiologist’s interpretation. The radiologist was legally responsible for the missed diagnosis.
VERDICT: A $15M New York verdict was reached, finding the breast surgeon 75% at fault and the radiologist 25%. The radiologist settled before the trial (the jury was not informed of this). The breast surgeon was responsible for $11.25M. The defense indicated intent to appeal.
Alleged failure to evacuate uterus after cesarean delivery
A 37-year-old woman underwent cesarean delivery (CD) performed by 2 ObGyns. After delivery, she began to hemorrhage and the uterus became atonic. Hysterectomy was performed but the bleeding did not stop. The ObGyns called in 3 other ObGyns. During exploratory laparotomy, the bleeding was halted.
PATIENT'S CLAIM: She and her husband had hoped to have more children but the hysterectomy precluded that. She sued all 5 ObGyns, alleging that the delivering ObGyns failed to properly perform the CD and that each physician failed to properly perform the laparotomy, causing a large scar. The claim was discontinued against the 3 surgical ObGyns; trial addressed the 2 delivering ObGyns.
The patient’s expert ObGyn remarked that the hemorrhage was caused by a small placental remnant that remained in the uterus as a result of inadequate evacuation following delivery. The presence of the remnant was indicated by the uterine atony and should have prompted immediate investigation. The physicians’ notes did not document exploration of the uterus prior to closure.
PHYSICIAN'S DEFENSE: The defense’s expert contended that atony would not be a result of a small remnant of placenta. The patient’s uterus was properly evacuated, the hemorrhage was an unforeseeable complication, and the ObGyns properly addressed the hemorrhage.
VERDICT: A New York defense verdict was returned.
Alleged bowel injury during hysterectomy
Two days after a woman underwent a hysterectomy performed by her ObGyn, she went to the emergency department with increasing pain. Her ObGyn admitted her to the hospital. A general surgeon performed an exploratory laparotomy the next day that revealed an abscess; a 1-cm perforation of the patient’s bowel was surgically repaired. The patient had a difficult recovery. She developed pneumonia and respiratory failure. She underwent multiple repair surgeries for recurrent abscesses and fistulas because the wound was slow to heal.
PATIENT'S CLAIM: The ObGyn’s surgical technique was negligent. He injured the bowel when inserting a trocar and did not identify the injury in a timely manner. The expert witness commented that such an injury can sometimes be a surgical complication, but not in this case: the ObGyn rushed the procedure because he had another patient waiting for CD at another hospital.
PHYSICIAN'S DEFENSE: The ObGyn denied negligence and contended that the trocar used in surgery was too blunt to have caused a perforation. It would have been obvious to the ObGyn during surgery if a perforation had occurred. The perforation developed days after surgery within an abscess.
VERDICT: A Mississippi defense verdict was returned.
These cases were selected by the editors of OBG Management from Medical Malpractice Verdicts, Settlements & Experts, with permission of the editor, Lewis Laska (www.verdictslaska.com). The information available to the editors about the cases presented here is sometimes incomplete. Moreover, the cases may or may not have merit. Nevertheless, these cases represent the types of clinical situations that typically result in litigation and are meant to illustrate nationwide variation in jury verdicts and awards.
Share your thoughts! Send your Letter to the Editor to rbarbieri@mdedge.com. Please include your name and the city and state in which you practice.
Delayed diagnosis of breast cancer: $15M award
A woman in her mid-50s had been seen by a breast surgeon for 16 years for regular mammograms and sonograms. In May 2009, the breast surgeon misinterpreted a mammogram as negative, as did a radiologist who re-read the mammogram weeks later. In December 2010, the patient returned to the breast surgeon with nipple discharge. No further testing was conducted. In October 2011, the patient was found to have Stage IIIA breast cancer involving 4 lymph nodes. She underwent left radical mastectomy, chemotherapy, radiation therapy, and breast reconstruction. At time of trial, the cancer had invaded her vertebrae, was Stage IV, and most likely incurable.
PATIENT'S CLAIM: Although the surgeon admittedly did not possess the qualifications required under the Mammography Quality Standards Act, he interpreted about 5,000 mammograms per year in his office. In this case, he failed to detect a small breast tumor in May 2009. He also failed to perform testing when the patient reported nipple discharge. A more timely diagnosis of breast cancer at Stage I would have provided a 90% chance of long-term survival.
DEFENDANTS' DEFENSE: The defense held the radiologist fully liable because the surgeon was not a qualified interpreter of mammography, therefore relying on the radiologist’s interpretation. The radiologist was legally responsible for the missed diagnosis.
VERDICT: A $15M New York verdict was reached, finding the breast surgeon 75% at fault and the radiologist 25%. The radiologist settled before the trial (the jury was not informed of this). The breast surgeon was responsible for $11.25M. The defense indicated intent to appeal.
Alleged failure to evacuate uterus after cesarean delivery
A 37-year-old woman underwent cesarean delivery (CD) performed by 2 ObGyns. After delivery, she began to hemorrhage and the uterus became atonic. Hysterectomy was performed but the bleeding did not stop. The ObGyns called in 3 other ObGyns. During exploratory laparotomy, the bleeding was halted.
PATIENT'S CLAIM: She and her husband had hoped to have more children but the hysterectomy precluded that. She sued all 5 ObGyns, alleging that the delivering ObGyns failed to properly perform the CD and that each physician failed to properly perform the laparotomy, causing a large scar. The claim was discontinued against the 3 surgical ObGyns; trial addressed the 2 delivering ObGyns.
The patient’s expert ObGyn remarked that the hemorrhage was caused by a small placental remnant that remained in the uterus as a result of inadequate evacuation following delivery. The presence of the remnant was indicated by the uterine atony and should have prompted immediate investigation. The physicians’ notes did not document exploration of the uterus prior to closure.
PHYSICIAN'S DEFENSE: The defense’s expert contended that atony would not be a result of a small remnant of placenta. The patient’s uterus was properly evacuated, the hemorrhage was an unforeseeable complication, and the ObGyns properly addressed the hemorrhage.
VERDICT: A New York defense verdict was returned.
Alleged bowel injury during hysterectomy
Two days after a woman underwent a hysterectomy performed by her ObGyn, she went to the emergency department with increasing pain. Her ObGyn admitted her to the hospital. A general surgeon performed an exploratory laparotomy the next day that revealed an abscess; a 1-cm perforation of the patient’s bowel was surgically repaired. The patient had a difficult recovery. She developed pneumonia and respiratory failure. She underwent multiple repair surgeries for recurrent abscesses and fistulas because the wound was slow to heal.
PATIENT'S CLAIM: The ObGyn’s surgical technique was negligent. He injured the bowel when inserting a trocar and did not identify the injury in a timely manner. The expert witness commented that such an injury can sometimes be a surgical complication, but not in this case: the ObGyn rushed the procedure because he had another patient waiting for CD at another hospital.
PHYSICIAN'S DEFENSE: The ObGyn denied negligence and contended that the trocar used in surgery was too blunt to have caused a perforation. It would have been obvious to the ObGyn during surgery if a perforation had occurred. The perforation developed days after surgery within an abscess.
VERDICT: A Mississippi defense verdict was returned.
These cases were selected by the editors of OBG Management from Medical Malpractice Verdicts, Settlements & Experts, with permission of the editor, Lewis Laska (www.verdictslaska.com). The information available to the editors about the cases presented here is sometimes incomplete. Moreover, the cases may or may not have merit. Nevertheless, these cases represent the types of clinical situations that typically result in litigation and are meant to illustrate nationwide variation in jury verdicts and awards.
Share your thoughts! Send your Letter to the Editor to rbarbieri@mdedge.com. Please include your name and the city and state in which you practice.
When is the right time to stop treatment?
Martha Boxer (not her real name) had mentally prepared herself that this could happen, but the news still hit hard. Her doctors on the leukemia service broke the facts as gently as we could: The chemotherapy she had been suffering through for the last 2 weeks hadn’t worked. The results of her latest bone marrow biopsy showed it remained packed with cancer cells.

As Martha absorbed the news quietly, her son, sitting next to her bedside with his hand on hers, spoke first. “What now?”
I looked at my attending and nodded, as we were fully ready to answer this question. From the outset, we knew that Martha’s leukemia carried a genetic mutation that unfortunately put her in a high-risk category. The chances of her cancer responding to the first round of chemotherapy were low. When this happens, what we typically do next is reinduction, we explained. It’s a different combination of chemotherapy drugs, with a somewhat different side effect profile. But it would give her the best chance of response, we believed. We could start the new chemotherapy as early as today, we said.
Martha took this in. “Okay,” she said pensively. “I’ve been thinking. And I think maybe … I won’t do chemotherapy anymore.”
Her words caught me off guard because, frankly, they seemed premature. Her leukemia had not budged with the first round of treatment. But we still had an option B, and then an option C. It was usually at a later, more dire stage – when multiple lines of treatment had not worked, and instead had only caused harm – or, when the decision was forced by the medical system’s admission that we had nothing left to offer – that I’d heard patients express similar preferences. It was then that I’d seen patients and their loved ones flip a mental switch and choose to focus the time they had left on what really mattered to them.
It didn’t feel like we were at that point.
And so, as we debriefed outside her room, my first instinct was to convince her otherwise.
However, Martha had other priorities, as I would come to learn. Above all else, she hated the hospital. She hated feeling trapped in a strange room that wasn’t hers; she hated how the chemotherapy stole her energy and made her feel too weak to even shower. She wanted to be in her own home. She wanted to eat her own food, sleep in her own bed, and be surrounded by what she recognized.

But, she also wanted to live. Two paths lay ahead of her. It was a trade-off of more suffering with a small chance at remission, versus accepting no chance of cure but feeling well for as long as she could. She soon clarified that she wasn’t definitely against chemotherapy. She couldn’t decide. She needed more information from us to make this decision, the hardest of her life.
Over the next few days, I watched as our attending physician expertly provided just that. There were actually three options, she laid out. There was aggressive chemotherapy, entailing at least 3 more weeks in the hospital and coming with significant risk of infection, nausea, vomiting, and fatigue. The chances of inducing a remission were about one in three to one in two, and that remission would likely last between several months and 2 years before the leukemia would relapse. The second option was a chemotherapy pill she could take at home, an option with fewer side effects but no longer aimed at cure. The third option was home hospice support, focused on symptoms, without any anticancer medication.
I noticed a few things during those conversations. I noticed how my attending took a navigator role, not pushing Martha in one direction or another, but rather imparting all the relevant information to empower Martha to decide for herself. I noticed how she provided realistic estimates, not hedging away from numbers, but giving the honest, nitty-gritty facts, as best as she could predict. I noticed how she took the time and never rushed, even in spite of external pressures to discharge the patient from the hospital.
There was no right or wrong answer. I no longer felt that we had something in our grasp – a clear-cut, best decision – to persuade Martha toward. Is one in three good odds, or bad odds? Is 2 years a long period of time, or a short one? Of course, there is no actual answer to these questions; the answer is as elusive and personal as if we had asked Martha: What do you think?
What I learned from Martha is that, with a devastating diagnosis, there isn’t a right time to make this decision. There isn’t one defining moment where we flip a switch and change course. It isn’t only when we run out of treatment options that the choice to forgo it makes sense. That option is on a flexible line, different for every person and priority. As my attending later said, with Martha’s diagnosis and her values, it wouldn’t have been unreasonable to decide against chemotherapy from the start.
The language we use can sometimes mask that reality. As doctors, we may casually slip in words like “need” and “have to” in response to patients’ questions about what to do next. “You need more chemotherapy,” we might say. “We’d have to treat it.” We have “treatment,” after all, and so we go down the line of offering what’s next in the medical algorithm. That word, too, can be deceivingly tempting, enticing down a road that makes it seem like the obvious answer – or the only one. If the choices are treatment versus not, who wouldn’t want the treatment? But the details are where things get murky. What does that treatment involve? What are the chances it will work, and for how long?
Surreptitiously missing from this language is the fact that there’s a choice. There’s always a choice, and it’s on the table at any point. You can start chemotherapy without committing to stick it out until the end. You can go home, if that is what’s important to you. The best treatment option is the one the patient wants.
After 4 days, Martha decided to go home with palliative chemotherapy and a bridge to hospice. Each member of our team hugged her goodbye and wished her luck. She was nervous. But she packed her hospital room, and she left.
I recently pulled up her medical chart, bracing myself for bad news. But the interesting thing about hospice is that even though the focus is no longer on prolonging life, people sometimes live longer.
She felt well, the most recent palliative note said. She was spending her time writing, getting her finances in order, and finishing a legacy project for her grandchildren.
For Martha, it seemed to be the right choice.
Dr. Yurkiewicz is a fellow in hematology and oncology at Stanford (Calif.) University. Follow her on Twitter @ilanayurkiewicz.
Martha Boxer (not her real name) had mentally prepared herself that this could happen, but the news still hit hard. Her doctors on the leukemia service broke the facts as gently as we could: The chemotherapy she had been suffering through for the last 2 weeks hadn’t worked. The results of her latest bone marrow biopsy showed it remained packed with cancer cells.
As Martha absorbed the news quietly, her son, sitting next to her bedside with his hand on hers, spoke first. “What now?”
I looked at my attending and nodded, as we were fully ready to answer this question. From the outset, we knew that Martha’s leukemia carried a genetic mutation that unfortunately put her in a high-risk category. The chances of her cancer responding to the first round of chemotherapy were low. When this happens, what we typically do next is reinduction, we explained. It’s a different combination of chemotherapy drugs, with a somewhat different side effect profile. But it would give her the best chance of response, we believed. We could start the new chemotherapy as early as today, we said.
Martha took this in. “Okay,” she said pensively. “I’ve been thinking. And I think maybe … I won’t do chemotherapy anymore.”
Her words caught me off guard because, frankly, they seemed premature. Her leukemia had not budged with the first round of treatment. But we still had an option B, and then an option C. It was usually at a later, more dire stage – when multiple lines of treatment had not worked, and instead had only caused harm – or, when the decision was forced by the medical system’s admission that we had nothing left to offer – that I’d heard patients express similar preferences. It was then that I’d seen patients and their loved ones flip a mental switch and choose to focus the time they had left on what really mattered to them.
It didn’t feel like we were at that point.
And so, as we debriefed outside her room, my first instinct was to convince her otherwise.
However, Martha had other priorities, as I would come to learn. Above all else, she hated the hospital. She hated feeling trapped in a strange room that wasn’t hers; she hated how the chemotherapy stole her energy and made her feel too weak to even shower. She wanted to be in her own home. She wanted to eat her own food, sleep in her own bed, and be surrounded by what she recognized.
But, she also wanted to live. Two paths lay ahead of her. It was a trade-off of more suffering with a small chance at remission, versus accepting no chance of cure but feeling well for as long as she could. She soon clarified that she wasn’t definitely against chemotherapy. She couldn’t decide. She needed more information from us to make this decision, the hardest of her life.
Over the next few days, I watched as our attending physician expertly provided just that. There were actually three options, she laid out. There was aggressive chemotherapy, entailing at least 3 more weeks in the hospital and coming with significant risk of infection, nausea, vomiting, and fatigue. The chances of inducing a remission were about one in three to one in two, and that remission would likely last between several months and 2 years before the leukemia would relapse. The second option was a chemotherapy pill she could take at home, an option with fewer side effects but no longer aimed at cure. The third option was home hospice support, focused on symptoms, without any anticancer medication.
I noticed a few things during those conversations. I noticed how my attending took a navigator role, not pushing Martha in one direction or another, but rather imparting all the relevant information to empower Martha to decide for herself. I noticed how she provided realistic estimates, not hedging away from numbers, but giving the honest, nitty-gritty facts, as best as she could predict. I noticed how she took the time and never rushed, even in spite of external pressures to discharge the patient from the hospital.
There was no right or wrong answer. I no longer felt that we had something in our grasp – a clear-cut, best decision – to persuade Martha toward. Is one in three good odds, or bad odds? Is 2 years a long period of time, or a short one? Of course, there is no actual answer to these questions; the answer is as elusive and personal as if we had asked Martha: What do you think?
What I learned from Martha is that, with a devastating diagnosis, there isn’t a right time to make this decision. There isn’t one defining moment where we flip a switch and change course. It isn’t only when we run out of treatment options that the choice to forgo it makes sense. That option is on a flexible line, different for every person and priority. As my attending later said, with Martha’s diagnosis and her values, it wouldn’t have been unreasonable to decide against chemotherapy from the start.
The language we use can sometimes mask that reality. As doctors, we may casually slip in words like “need” and “have to” in response to patients’ questions about what to do next. “You need more chemotherapy,” we might say. “We’d have to treat it.” We have “treatment,” after all, and so we go down the line of offering what’s next in the medical algorithm. That word, too, can be deceivingly tempting, enticing down a road that makes it seem like the obvious answer – or the only one. If the choices are treatment versus not, who wouldn’t want the treatment? But the details are where things get murky. What does that treatment involve? What are the chances it will work, and for how long?
Surreptitiously missing from this language is the fact that there’s a choice. There’s always a choice, and it’s on the table at any point. You can start chemotherapy without committing to stick it out until the end. You can go home, if that is what’s important to you. The best treatment option is the one the patient wants.
After 4 days, Martha decided to go home with palliative chemotherapy and a bridge to hospice. Each member of our team hugged her goodbye and wished her luck. She was nervous. But she packed her hospital room, and she left.
I recently pulled up her medical chart, bracing myself for bad news. But the interesting thing about hospice is that even though the focus is no longer on prolonging life, people sometimes live longer.
She felt well, the most recent palliative note said. She was spending her time writing, getting her finances in order, and finishing a legacy project for her grandchildren.
For Martha, it seemed to be the right choice.
Dr. Yurkiewicz is a fellow in hematology and oncology at Stanford (Calif.) University. Follow her on Twitter @ilanayurkiewicz.
Martha Boxer (not her real name) had mentally prepared herself that this could happen, but the news still hit hard. Her doctors on the leukemia service broke the facts as gently as we could: The chemotherapy she had been suffering through for the last 2 weeks hadn’t worked. The results of her latest bone marrow biopsy showed it remained packed with cancer cells.
As Martha absorbed the news quietly, her son, sitting next to her bedside with his hand on hers, spoke first. “What now?”
I looked at my attending and nodded, as we were fully ready to answer this question. From the outset, we knew that Martha’s leukemia carried a genetic mutation that unfortunately put her in a high-risk category. The chances of her cancer responding to the first round of chemotherapy were low. When this happens, what we typically do next is reinduction, we explained. It’s a different combination of chemotherapy drugs, with a somewhat different side effect profile. But it would give her the best chance of response, we believed. We could start the new chemotherapy as early as today, we said.
Martha took this in. “Okay,” she said pensively. “I’ve been thinking. And I think maybe … I won’t do chemotherapy anymore.”
Her words caught me off guard because, frankly, they seemed premature. Her leukemia had not budged with the first round of treatment. But we still had an option B, and then an option C. It was usually at a later, more dire stage – when multiple lines of treatment had not worked, and instead had only caused harm – or, when the decision was forced by the medical system’s admission that we had nothing left to offer – that I’d heard patients express similar preferences. It was then that I’d seen patients and their loved ones flip a mental switch and choose to focus the time they had left on what really mattered to them.
It didn’t feel like we were at that point.
And so, as we debriefed outside her room, my first instinct was to convince her otherwise.
However, Martha had other priorities, as I would come to learn. Above all else, she hated the hospital. She hated feeling trapped in a strange room that wasn’t hers; she hated how the chemotherapy stole her energy and made her feel too weak to even shower. She wanted to be in her own home. She wanted to eat her own food, sleep in her own bed, and be surrounded by what she recognized.
But, she also wanted to live. Two paths lay ahead of her. It was a trade-off of more suffering with a small chance at remission, versus accepting no chance of cure but feeling well for as long as she could. She soon clarified that she wasn’t definitely against chemotherapy. She couldn’t decide. She needed more information from us to make this decision, the hardest of her life.
Over the next few days, I watched as our attending physician expertly provided just that. There were actually three options, she laid out. There was aggressive chemotherapy, entailing at least 3 more weeks in the hospital and coming with significant risk of infection, nausea, vomiting, and fatigue. The chances of inducing a remission were about one in three to one in two, and that remission would likely last between several months and 2 years before the leukemia would relapse. The second option was a chemotherapy pill she could take at home, an option with fewer side effects but no longer aimed at cure. The third option was home hospice support, focused on symptoms, without any anticancer medication.
I noticed a few things during those conversations. I noticed how my attending took a navigator role, not pushing Martha in one direction or another, but rather imparting all the relevant information to empower Martha to decide for herself. I noticed how she provided realistic estimates, not hedging away from numbers, but giving the honest, nitty-gritty facts, as best as she could predict. I noticed how she took the time and never rushed, even in spite of external pressures to discharge the patient from the hospital.
There was no right or wrong answer. I no longer felt that we had something in our grasp – a clear-cut, best decision – to persuade Martha toward. Is one in three good odds, or bad odds? Is 2 years a long period of time, or a short one? Of course, there is no actual answer to these questions; the answer is as elusive and personal as if we had asked Martha: What do you think?
What I learned from Martha is that, with a devastating diagnosis, there isn’t a right time to make this decision. There isn’t one defining moment where we flip a switch and change course. It isn’t only when we run out of treatment options that the choice to forgo it makes sense. That option is on a flexible line, different for every person and priority. As my attending later said, with Martha’s diagnosis and her values, it wouldn’t have been unreasonable to decide against chemotherapy from the start.
The language we use can sometimes mask that reality. As doctors, we may casually slip in words like “need” and “have to” in response to patients’ questions about what to do next. “You need more chemotherapy,” we might say. “We’d have to treat it.” We have “treatment,” after all, and so we go down the line of offering what’s next in the medical algorithm. That word, too, can be deceivingly tempting, enticing down a road that makes it seem like the obvious answer – or the only one. If the choices are treatment versus not, who wouldn’t want the treatment? But the details are where things get murky. What does that treatment involve? What are the chances it will work, and for how long?
Surreptitiously missing from this language is the fact that there’s a choice. There’s always a choice, and it’s on the table at any point. You can start chemotherapy without committing to stick it out until the end. You can go home, if that is what’s important to you. The best treatment option is the one the patient wants.
After 4 days, Martha decided to go home with palliative chemotherapy and a bridge to hospice. Each member of our team hugged her goodbye and wished her luck. She was nervous. But she packed her hospital room, and she left.
I recently pulled up her medical chart, bracing myself for bad news. But the interesting thing about hospice is that even though the focus is no longer on prolonging life, people sometimes live longer.
She felt well, the most recent palliative note said. She was spending her time writing, getting her finances in order, and finishing a legacy project for her grandchildren.
For Martha, it seemed to be the right choice.
Dr. Yurkiewicz is a fellow in hematology and oncology at Stanford (Calif.) University. Follow her on Twitter @ilanayurkiewicz.

Abstracts Presented at the 2018 AVAHO Annual Meeting (Digital Edition)



Rivaroxaban has ‘favorable’ benefit-risk profile

Both low-dose and full-dose rivaroxaban had superior benefit-risk profiles for extended venous thromboembolism (VTE) treatment when compared to aspirin, according to investigators.
The team found the combined outcome of recurrent VTE and major bleeding was less likely to occur in patients treated with rivaroxaban at 20 mg or 10 mg than in patients treated with aspirin.
Paolo Prandoni, MD, of the University of Padua in Italy, and his colleagues reported these results in Thrombosis Research.
The investigators analyzed data from the EINSTEIN-CHOICE trial, a double-blind, randomized study of 3,365 patients age 18 or older with deep vein thrombosis (DVT) or pulmonary embolism (PE) who had previously received anticoagulant treatment for 6 to 12 months.
Patients were given once-daily rivaroxaban at a low dose (10 mg), once-daily rivaroxaban at the full dose (20 mg), or once-daily aspirin at a dose of 100 mg.
The incidence of the combined outcome of recurrent VTE and major bleeding was 2.8% lower in the 20 mg rivaroxaban arm and 3.4% lower in the 10 mg rivaroxaban arm than in the aspirin arm.
The cumulative incidence of recurrent VTE was 1.9% in the 20 mg rivaroxaban arm, 1.6% in the 10 mg rivaroxaban arm, and 5.0% in the aspirin arm.
The cumulative incidence of major bleeding was 0.7%, 0.4%, and 0.5%, respectively.
Benefit-risk profile
Benefit and risk were calculated using “excess numbers of events,” or the difference in cumulative incidences in a hypothetical population of 10,000 VTE patients treated for 1 year.
Excess numbers of events were defined as the number of patients in this hypothetical population who would experience a particular event when treated with rivaroxaban (at either dose), minus that in the same population treated with aspirin.
In patients treated with 20 mg of rivaroxaban instead of aspirin, there would be 123 fewer episodes of PE (95% confidence interval [CI], 21-226) and 198 fewer episodes of DVT (95% CI, 62-333).
In patients given 10 mg of rivaroxaban instead of aspirin, there would be 121 fewer episodes of PE (95% CI, 4-238) and 217 fewer episodes of DVT (95% CI, 92-342).
Net clinical benefit was defined as the composite of symptomatic recurrent VTE and major bleeding events. It occurred in 23 patients in the 20 mg rivaroxaban arm, 17 patients in the 10 mg rivaroxaban arm, and 53 patients in the aspirin arm.
For 10,000 patients treated for 1 year with rivaroxaban instead of aspirin, there would be 284 fewer net clinical benefit outcomes for the 20 mg dose (95% CI, 106-462) and 339 fewer (95% CI, 165-512) for the 10 mg dose.
This means that one additional symptomatic recurrent VTE or major bleed would be avoided for every 36 patients treated with rivaroxaban at 20 mg or every 30 patients treated with rivaroxaban at 10 mg.
The investigators therefore concluded that rivaroxaban “provides a clinically important benefit in terms of reduction in recurrent VTE” and has a favorable benefit-risk profile relative to aspirin.
In fact, the team said there is “no longer a place” for extended VTE treatment with aspirin.
Bayer AG funded this study. Dr. Prandoni reported financial relationships with Bayer, Sanofi, Daiichi Sankyo, and Pfizer.
Both low-dose and full-dose rivaroxaban had superior benefit-risk profiles for extended venous thromboembolism (VTE) treatment when compared to aspirin, according to investigators.
The team found the combined outcome of recurrent VTE and major bleeding was less likely to occur in patients treated with rivaroxaban at 20 mg or 10 mg than in patients treated with aspirin.
Paolo Prandoni, MD, of the University of Padua in Italy, and his colleagues reported these results in Thrombosis Research.
The investigators analyzed data from the EINSTEIN-CHOICE trial, a double-blind, randomized study of 3,365 patients age 18 or older with deep vein thrombosis (DVT) or pulmonary embolism (PE) who had previously received anticoagulant treatment for 6 to 12 months.
Patients were given once-daily rivaroxaban at a low dose (10 mg), once-daily rivaroxaban at the full dose (20 mg), or once-daily aspirin at a dose of 100 mg.
The incidence of the combined outcome of recurrent VTE and major bleeding was 2.8% lower in the 20 mg rivaroxaban arm and 3.4% lower in the 10 mg rivaroxaban arm than in the aspirin arm.
The cumulative incidence of recurrent VTE was 1.9% in the 20 mg rivaroxaban arm, 1.6% in the 10 mg rivaroxaban arm, and 5.0% in the aspirin arm.
The cumulative incidence of major bleeding was 0.7%, 0.4%, and 0.5%, respectively.
Benefit-risk profile
Benefit and risk were calculated using “excess numbers of events,” or the difference in cumulative incidences in a hypothetical population of 10,000 VTE patients treated for 1 year.
Excess numbers of events were defined as the number of patients in this hypothetical population who would experience a particular event when treated with rivaroxaban (at either dose), minus that in the same population treated with aspirin.
In patients treated with 20 mg of rivaroxaban instead of aspirin, there would be 123 fewer episodes of PE (95% confidence interval [CI], 21-226) and 198 fewer episodes of DVT (95% CI, 62-333).
In patients given 10 mg of rivaroxaban instead of aspirin, there would be 121 fewer episodes of PE (95% CI, 4-238) and 217 fewer episodes of DVT (95% CI, 92-342).
Net clinical benefit was defined as the composite of symptomatic recurrent VTE and major bleeding events. It occurred in 23 patients in the 20 mg rivaroxaban arm, 17 patients in the 10 mg rivaroxaban arm, and 53 patients in the aspirin arm.
For 10,000 patients treated for 1 year with rivaroxaban instead of aspirin, there would be 284 fewer net clinical benefit outcomes for the 20 mg dose (95% CI, 106-462) and 339 fewer (95% CI, 165-512) for the 10 mg dose.
This means that one additional symptomatic recurrent VTE or major bleed would be avoided for every 36 patients treated with rivaroxaban at 20 mg or every 30 patients treated with rivaroxaban at 10 mg.
The investigators therefore concluded that rivaroxaban “provides a clinically important benefit in terms of reduction in recurrent VTE” and has a favorable benefit-risk profile relative to aspirin.
In fact, the team said there is “no longer a place” for extended VTE treatment with aspirin.
Bayer AG funded this study. Dr. Prandoni reported financial relationships with Bayer, Sanofi, Daiichi Sankyo, and Pfizer.
Both low-dose and full-dose rivaroxaban had superior benefit-risk profiles for extended venous thromboembolism (VTE) treatment when compared to aspirin, according to investigators.
The team found the combined outcome of recurrent VTE and major bleeding was less likely to occur in patients treated with rivaroxaban at 20 mg or 10 mg than in patients treated with aspirin.
Paolo Prandoni, MD, of the University of Padua in Italy, and his colleagues reported these results in Thrombosis Research.
The investigators analyzed data from the EINSTEIN-CHOICE trial, a double-blind, randomized study of 3,365 patients age 18 or older with deep vein thrombosis (DVT) or pulmonary embolism (PE) who had previously received anticoagulant treatment for 6 to 12 months.
Patients were given once-daily rivaroxaban at a low dose (10 mg), once-daily rivaroxaban at the full dose (20 mg), or once-daily aspirin at a dose of 100 mg.
The incidence of the combined outcome of recurrent VTE and major bleeding was 2.8% lower in the 20 mg rivaroxaban arm and 3.4% lower in the 10 mg rivaroxaban arm than in the aspirin arm.
The cumulative incidence of recurrent VTE was 1.9% in the 20 mg rivaroxaban arm, 1.6% in the 10 mg rivaroxaban arm, and 5.0% in the aspirin arm.
The cumulative incidence of major bleeding was 0.7%, 0.4%, and 0.5%, respectively.
Benefit-risk profile
Benefit and risk were calculated using “excess numbers of events,” or the difference in cumulative incidences in a hypothetical population of 10,000 VTE patients treated for 1 year.
Excess numbers of events were defined as the number of patients in this hypothetical population who would experience a particular event when treated with rivaroxaban (at either dose), minus that in the same population treated with aspirin.
In patients treated with 20 mg of rivaroxaban instead of aspirin, there would be 123 fewer episodes of PE (95% confidence interval [CI], 21-226) and 198 fewer episodes of DVT (95% CI, 62-333).
In patients given 10 mg of rivaroxaban instead of aspirin, there would be 121 fewer episodes of PE (95% CI, 4-238) and 217 fewer episodes of DVT (95% CI, 92-342).
Net clinical benefit was defined as the composite of symptomatic recurrent VTE and major bleeding events. It occurred in 23 patients in the 20 mg rivaroxaban arm, 17 patients in the 10 mg rivaroxaban arm, and 53 patients in the aspirin arm.
For 10,000 patients treated for 1 year with rivaroxaban instead of aspirin, there would be 284 fewer net clinical benefit outcomes for the 20 mg dose (95% CI, 106-462) and 339 fewer (95% CI, 165-512) for the 10 mg dose.
This means that one additional symptomatic recurrent VTE or major bleed would be avoided for every 36 patients treated with rivaroxaban at 20 mg or every 30 patients treated with rivaroxaban at 10 mg.
The investigators therefore concluded that rivaroxaban “provides a clinically important benefit in terms of reduction in recurrent VTE” and has a favorable benefit-risk profile relative to aspirin.
In fact, the team said there is “no longer a place” for extended VTE treatment with aspirin.
Bayer AG funded this study. Dr. Prandoni reported financial relationships with Bayer, Sanofi, Daiichi Sankyo, and Pfizer.

HPV: Changing the Statistics
In the world of research, an “n of 1” is considered an insufficient sample size to make an inference about a population. While distinguishing significance in research is vital in the scientific world, this statistical view often feels invalid when the “n of 1” is you or someone you know. And when the statistic is a diagnosis of cancer, that “1” feels even more noteworthy.
We know that cancer is a devastating disease that results in an increasing number of diagnoses each day. Case in point, the American Cancer Society estimates that more than 4,700 new cancers will be diagnosed each day in 2018.1 Most of us know that breast, colon, lung, and prostate cancer are the main contributors to those staggering numbers. But did you know that the incidence of oropharyngeal cancers (OPCs) is increasing? I didn’t.
It is estimated that 51,540 new cancer cases in 2018 will be of the oral cavity and pharynx and will cause approximately 10,000 deaths in the United States (US).1 Included in this estimate is the increasing incidence of human papillomavirus–associated oropharyngeal cancers (HPV-OPCs). The “n of 1” that started this discussion? That was a colleague of mine, who received just such a diagnosis. And the causative factor was surprising to me.
Now, please don’t misunderstand me—I know that HPV, a group of more than 150 related viruses, is the most common sexually transmitted infection (STI) in the US.2 I also know that HPV is implicated in genital warts and in cervical and anal cancers. The virus, which is transmitted through intimate skin-to-skin contact, is acquired by many during their adolescent and young adult years.2 Currently, 84 million Americans have HPV, and 14 million new cases are diagnosed each year.3
The most serious of those health problems, HPV-related cancers (which include cervical, vulvovaginal, anal, and oropharyngeal), are on the rise in the US.4 The prevalence of HPV in oropharyngeal tumors increased from 16.3% during the 1980s to 72.7% during the 2000s.5 Moreover, HPV has been implicated in 12% to 63% of all oropharyngeal cancers.6 Fifteen years ago, researchers concluded that HPV type 16 was the cause of 90% of cases of HPV-positive squamous cell carcinomas of the head and neck.7,8 At any given time, 7% of the population between ages 14 and 69 are infected by the virus within the oral mucosa.9
For my colleague—and many of us—the ship of prevention has sailed. But what disconcerts me most about this rise in HPV-related cancers is that, as of 2006, we have a vaccine that protects against infection with the two most prevalent cancer-causing HPV types. And yet, our vaccination rates continue to fall short of the Office of Disease Prevention and Health Promotion’s goal of having 80% of females ages 13 to 15 fully vaccinated against HPV.10
Continue to: Research has shown that parents of young adolescents...
Research has shown that parents of young adolescents are often upset by the recommendation that their children receive the HPV vaccine.11 Common beliefs are that the vaccine will give adolescents permission to become sexually active—or, conversely, that the adolescent isn’t sexually active, so the vaccine isn’t necessary. The reality of the situation: Adolescents don’t consider oral sex as having sexual relations, and oral sex is often the first sexual encounter for young people. Adolescents also regard oral sex as less risky than vaginal sex.12 So, many have unknowingly put themselves at risk while thinking they are actually being “safe.”
There are ways to reduce cancer risk, but few interventions are more effective than HPV vaccination.13 Given the incidence of HPV-OPC, it’s time to debunk the misbeliefs about sexual activity and move on to a concerted effort to promote HPV vaccination. Recent advertising about the HPV vaccine has emphasized the consequence of cancer in its messages. I applaud this new direction—it could be key to reversing the persistently low rate of HPV vaccination and changing that “n of 1” to zero. Share your trials and triumphs in promoting HPV vaccination with me at NPeditor@mdedge.com.
1. Siegel RL, Miller KD, Jemal A. Cancer statistics, 2018. CA Cancer J Clin. 2018;68(1):7-30.
2. CDC. Human papillomavirus (HPV). www.cdc.gov/hpv/parents/whatishpv.html. Accessed August 8, 2018.
3. Patel EU, Grabowski MK, Eisenberg AL, et al. Increases in human papillomavirus vaccination among adolescent and young adult males in the United States, 2011-2016. J Infect Dis. 2018;218(1):109-113.
4. Dilley S, Scarinci I, Kimberlin D, Straughn JM. Preventing human papillomavirus-related cancers: we are all in this together. Am J Obstet Gynecol. 2017;216(6):576.e1-576.e5.
5. Chaturvedi AK, Engels EA, Pfeiffer RM, et al. Human papillomavirus and rising oropharyngeal cancer incidence in the United States. J Clin Oncol. 2011; 29(32):4294-4301.
6. Chandrani P, Kulkarni V, Iyer P, et al. NGS-based approach to determine the presence of HPV and their sites of integration in human cancer genome. Br J Cancer. 2015;112 (12):1958-1965.
7. Herrero R, Castellsague X, Pawlita M, et al; IARC Multicenter Oral Cancer Study Group. Human papillomavirus and oral cancer: the International Agency for Research on Cancer multicenter study. J Natl Cancer Inst. 2003;95(23):1772-1783.
8. Gillison ML, Koch WM, Capone RB, et al. Evidence for a causal association between human papillomavirus and a subset of head and neck cancers. J Natl Cancer Inst. 2000;92(9):709-720.
9. Golusin´ski W, Leemans CR, Dietz D, eds. HPV Infection in Head and Neck Cancer. Cham, Switzerland: Springer International Publishing; 2017.
10. Office of Disease Prevention and Health Promotion. Increase the vaccination coverage level of 3 doses of human papillomavirus (HPV) vaccine for females by age 13 to 15 years. www.healthypeople.gov/node/4657/data_details. Accessed August 8, 2018.
11. National Cancer Institute; National Institutes of Health. President’s cancer panel annual report 2012–2013. Accelerating HPV vaccine uptake: urgency for action to prevent cancer. https://deainfo.nci.nih.gov/advisory/pcp/annualReports/HPV/index.htm. Accessed August 8, 2018.
12. Halpern-Felsher BL, Cornell JL, Kropp RY, Tschann JM. Oral versus vaginal sex among adolescents: perceptions, attitudes, and behavior. Pediatrics. 2005;115(4):845-851.
13. National Foundation for Infectious Diseases. Call to action: HPV vaccination as a public health priority. www.nfid.org/publications/cta/hpv-call-to-action.pdf. Accessed August 8, 2018.

In the world of research, an “n of 1” is considered an insufficient sample size to make an inference about a population. While distinguishing significance in research is vital in the scientific world, this statistical view often feels invalid when the “n of 1” is you or someone you know. And when the statistic is a diagnosis of cancer, that “1” feels even more noteworthy.
We know that cancer is a devastating disease that results in an increasing number of diagnoses each day. Case in point, the American Cancer Society estimates that more than 4,700 new cancers will be diagnosed each day in 2018.1 Most of us know that breast, colon, lung, and prostate cancer are the main contributors to those staggering numbers. But did you know that the incidence of oropharyngeal cancers (OPCs) is increasing? I didn’t.
It is estimated that 51,540 new cancer cases in 2018 will be of the oral cavity and pharynx and will cause approximately 10,000 deaths in the United States (US).1 Included in this estimate is the increasing incidence of human papillomavirus–associated oropharyngeal cancers (HPV-OPCs). The “n of 1” that started this discussion? That was a colleague of mine, who received just such a diagnosis. And the causative factor was surprising to me.
Now, please don’t misunderstand me—I know that HPV, a group of more than 150 related viruses, is the most common sexually transmitted infection (STI) in the US.2 I also know that HPV is implicated in genital warts and in cervical and anal cancers. The virus, which is transmitted through intimate skin-to-skin contact, is acquired by many during their adolescent and young adult years.2 Currently, 84 million Americans have HPV, and 14 million new cases are diagnosed each year.3
The most serious of those health problems, HPV-related cancers (which include cervical, vulvovaginal, anal, and oropharyngeal), are on the rise in the US.4 The prevalence of HPV in oropharyngeal tumors increased from 16.3% during the 1980s to 72.7% during the 2000s.5 Moreover, HPV has been implicated in 12% to 63% of all oropharyngeal cancers.6 Fifteen years ago, researchers concluded that HPV type 16 was the cause of 90% of cases of HPV-positive squamous cell carcinomas of the head and neck.7,8 At any given time, 7% of the population between ages 14 and 69 are infected by the virus within the oral mucosa.9
For my colleague—and many of us—the ship of prevention has sailed. But what disconcerts me most about this rise in HPV-related cancers is that, as of 2006, we have a vaccine that protects against infection with the two most prevalent cancer-causing HPV types. And yet, our vaccination rates continue to fall short of the Office of Disease Prevention and Health Promotion’s goal of having 80% of females ages 13 to 15 fully vaccinated against HPV.10
Continue to: Research has shown that parents of young adolescents...
Research has shown that parents of young adolescents are often upset by the recommendation that their children receive the HPV vaccine.11 Common beliefs are that the vaccine will give adolescents permission to become sexually active—or, conversely, that the adolescent isn’t sexually active, so the vaccine isn’t necessary. The reality of the situation: Adolescents don’t consider oral sex as having sexual relations, and oral sex is often the first sexual encounter for young people. Adolescents also regard oral sex as less risky than vaginal sex.12 So, many have unknowingly put themselves at risk while thinking they are actually being “safe.”
There are ways to reduce cancer risk, but few interventions are more effective than HPV vaccination.13 Given the incidence of HPV-OPC, it’s time to debunk the misbeliefs about sexual activity and move on to a concerted effort to promote HPV vaccination. Recent advertising about the HPV vaccine has emphasized the consequence of cancer in its messages. I applaud this new direction—it could be key to reversing the persistently low rate of HPV vaccination and changing that “n of 1” to zero. Share your trials and triumphs in promoting HPV vaccination with me at NPeditor@mdedge.com.
In the world of research, an “n of 1” is considered an insufficient sample size to make an inference about a population. While distinguishing significance in research is vital in the scientific world, this statistical view often feels invalid when the “n of 1” is you or someone you know. And when the statistic is a diagnosis of cancer, that “1” feels even more noteworthy.
We know that cancer is a devastating disease that results in an increasing number of diagnoses each day. Case in point, the American Cancer Society estimates that more than 4,700 new cancers will be diagnosed each day in 2018.1 Most of us know that breast, colon, lung, and prostate cancer are the main contributors to those staggering numbers. But did you know that the incidence of oropharyngeal cancers (OPCs) is increasing? I didn’t.
It is estimated that 51,540 new cancer cases in 2018 will be of the oral cavity and pharynx and will cause approximately 10,000 deaths in the United States (US).1 Included in this estimate is the increasing incidence of human papillomavirus–associated oropharyngeal cancers (HPV-OPCs). The “n of 1” that started this discussion? That was a colleague of mine, who received just such a diagnosis. And the causative factor was surprising to me.
Now, please don’t misunderstand me—I know that HPV, a group of more than 150 related viruses, is the most common sexually transmitted infection (STI) in the US.2 I also know that HPV is implicated in genital warts and in cervical and anal cancers. The virus, which is transmitted through intimate skin-to-skin contact, is acquired by many during their adolescent and young adult years.2 Currently, 84 million Americans have HPV, and 14 million new cases are diagnosed each year.3
The most serious of those health problems, HPV-related cancers (which include cervical, vulvovaginal, anal, and oropharyngeal), are on the rise in the US.4 The prevalence of HPV in oropharyngeal tumors increased from 16.3% during the 1980s to 72.7% during the 2000s.5 Moreover, HPV has been implicated in 12% to 63% of all oropharyngeal cancers.6 Fifteen years ago, researchers concluded that HPV type 16 was the cause of 90% of cases of HPV-positive squamous cell carcinomas of the head and neck.7,8 At any given time, 7% of the population between ages 14 and 69 are infected by the virus within the oral mucosa.9
For my colleague—and many of us—the ship of prevention has sailed. But what disconcerts me most about this rise in HPV-related cancers is that, as of 2006, we have a vaccine that protects against infection with the two most prevalent cancer-causing HPV types. And yet, our vaccination rates continue to fall short of the Office of Disease Prevention and Health Promotion’s goal of having 80% of females ages 13 to 15 fully vaccinated against HPV.10
Continue to: Research has shown that parents of young adolescents...
Research has shown that parents of young adolescents are often upset by the recommendation that their children receive the HPV vaccine.11 Common beliefs are that the vaccine will give adolescents permission to become sexually active—or, conversely, that the adolescent isn’t sexually active, so the vaccine isn’t necessary. The reality of the situation: Adolescents don’t consider oral sex as having sexual relations, and oral sex is often the first sexual encounter for young people. Adolescents also regard oral sex as less risky than vaginal sex.12 So, many have unknowingly put themselves at risk while thinking they are actually being “safe.”
There are ways to reduce cancer risk, but few interventions are more effective than HPV vaccination.13 Given the incidence of HPV-OPC, it’s time to debunk the misbeliefs about sexual activity and move on to a concerted effort to promote HPV vaccination. Recent advertising about the HPV vaccine has emphasized the consequence of cancer in its messages. I applaud this new direction—it could be key to reversing the persistently low rate of HPV vaccination and changing that “n of 1” to zero. Share your trials and triumphs in promoting HPV vaccination with me at NPeditor@mdedge.com.
1. Siegel RL, Miller KD, Jemal A. Cancer statistics, 2018. CA Cancer J Clin. 2018;68(1):7-30.
2. CDC. Human papillomavirus (HPV). www.cdc.gov/hpv/parents/whatishpv.html. Accessed August 8, 2018.
3. Patel EU, Grabowski MK, Eisenberg AL, et al. Increases in human papillomavirus vaccination among adolescent and young adult males in the United States, 2011-2016. J Infect Dis. 2018;218(1):109-113.
4. Dilley S, Scarinci I, Kimberlin D, Straughn JM. Preventing human papillomavirus-related cancers: we are all in this together. Am J Obstet Gynecol. 2017;216(6):576.e1-576.e5.
5. Chaturvedi AK, Engels EA, Pfeiffer RM, et al. Human papillomavirus and rising oropharyngeal cancer incidence in the United States. J Clin Oncol. 2011; 29(32):4294-4301.
6. Chandrani P, Kulkarni V, Iyer P, et al. NGS-based approach to determine the presence of HPV and their sites of integration in human cancer genome. Br J Cancer. 2015;112 (12):1958-1965.
7. Herrero R, Castellsague X, Pawlita M, et al; IARC Multicenter Oral Cancer Study Group. Human papillomavirus and oral cancer: the International Agency for Research on Cancer multicenter study. J Natl Cancer Inst. 2003;95(23):1772-1783.
8. Gillison ML, Koch WM, Capone RB, et al. Evidence for a causal association between human papillomavirus and a subset of head and neck cancers. J Natl Cancer Inst. 2000;92(9):709-720.
9. Golusin´ski W, Leemans CR, Dietz D, eds. HPV Infection in Head and Neck Cancer. Cham, Switzerland: Springer International Publishing; 2017.
10. Office of Disease Prevention and Health Promotion. Increase the vaccination coverage level of 3 doses of human papillomavirus (HPV) vaccine for females by age 13 to 15 years. www.healthypeople.gov/node/4657/data_details. Accessed August 8, 2018.
11. National Cancer Institute; National Institutes of Health. President’s cancer panel annual report 2012–2013. Accelerating HPV vaccine uptake: urgency for action to prevent cancer. https://deainfo.nci.nih.gov/advisory/pcp/annualReports/HPV/index.htm. Accessed August 8, 2018.
12. Halpern-Felsher BL, Cornell JL, Kropp RY, Tschann JM. Oral versus vaginal sex among adolescents: perceptions, attitudes, and behavior. Pediatrics. 2005;115(4):845-851.
13. National Foundation for Infectious Diseases. Call to action: HPV vaccination as a public health priority. www.nfid.org/publications/cta/hpv-call-to-action.pdf. Accessed August 8, 2018.
1. Siegel RL, Miller KD, Jemal A. Cancer statistics, 2018. CA Cancer J Clin. 2018;68(1):7-30.
2. CDC. Human papillomavirus (HPV). www.cdc.gov/hpv/parents/whatishpv.html. Accessed August 8, 2018.
3. Patel EU, Grabowski MK, Eisenberg AL, et al. Increases in human papillomavirus vaccination among adolescent and young adult males in the United States, 2011-2016. J Infect Dis. 2018;218(1):109-113.
4. Dilley S, Scarinci I, Kimberlin D, Straughn JM. Preventing human papillomavirus-related cancers: we are all in this together. Am J Obstet Gynecol. 2017;216(6):576.e1-576.e5.
5. Chaturvedi AK, Engels EA, Pfeiffer RM, et al. Human papillomavirus and rising oropharyngeal cancer incidence in the United States. J Clin Oncol. 2011; 29(32):4294-4301.
6. Chandrani P, Kulkarni V, Iyer P, et al. NGS-based approach to determine the presence of HPV and their sites of integration in human cancer genome. Br J Cancer. 2015;112 (12):1958-1965.
7. Herrero R, Castellsague X, Pawlita M, et al; IARC Multicenter Oral Cancer Study Group. Human papillomavirus and oral cancer: the International Agency for Research on Cancer multicenter study. J Natl Cancer Inst. 2003;95(23):1772-1783.
8. Gillison ML, Koch WM, Capone RB, et al. Evidence for a causal association between human papillomavirus and a subset of head and neck cancers. J Natl Cancer Inst. 2000;92(9):709-720.
9. Golusin´ski W, Leemans CR, Dietz D, eds. HPV Infection in Head and Neck Cancer. Cham, Switzerland: Springer International Publishing; 2017.
10. Office of Disease Prevention and Health Promotion. Increase the vaccination coverage level of 3 doses of human papillomavirus (HPV) vaccine for females by age 13 to 15 years. www.healthypeople.gov/node/4657/data_details. Accessed August 8, 2018.
11. National Cancer Institute; National Institutes of Health. President’s cancer panel annual report 2012–2013. Accelerating HPV vaccine uptake: urgency for action to prevent cancer. https://deainfo.nci.nih.gov/advisory/pcp/annualReports/HPV/index.htm. Accessed August 8, 2018.
12. Halpern-Felsher BL, Cornell JL, Kropp RY, Tschann JM. Oral versus vaginal sex among adolescents: perceptions, attitudes, and behavior. Pediatrics. 2005;115(4):845-851.
13. National Foundation for Infectious Diseases. Call to action: HPV vaccination as a public health priority. www.nfid.org/publications/cta/hpv-call-to-action.pdf. Accessed August 8, 2018.
Novel molecular assay: Promising results in bone and soft tissue tumor evaluation
, according to researchers.
The technique of anchored multiplex polymerase chain reaction (AMP)–based targeted next-generation sequencing (NGS) had a failure rate of 14% but, nonetheless, worked favorably when compared with conventional techniques, which were associated with several false positives in this study, the researchers reported in the Journal of Molecular Diagnostics.
Two new fusion partners for the USP6 gene were found using AMP-based targeted NGS in this study, which thus contributed to the “further unraveling of the molecular landscape” for these tumors, added corresponding author Judith V.M.G. Bovée, MD, PhD, of the department of pathology at Leiden (the Netherlands) University Medical Center and her colleagues.
While the genetics of bone and soft tissue tumors have diagnostic value in clinical practice, standard fluorescence in situ hybridization (FISH) and reverse transcriptase PCR are associated with several drawbacks, such as a high false negative rate in the case of FISH, Dr. Bovée and her coauthors wrote.
Accordingly, the researchers evaluated the applicability of a targeted sequencing assay (Archer FusionPlex Sarcoma kit, which was developed by ArcherDX) aimed at 26 genes relevant to bone and soft tissue tumor diagnostics.
Besides allowing for assessment of multiple target genes in a single assay, this technique circumvents the need to know both fusion partners for translocation detection, which opens up the possibility of identifying novel or rare fusion partners, investigators noted.
AMP-based targeted NGS was used to evaluate 81 bone and soft tissue tumor samples, and of those, 48 cases showed a fusion. For the remaining 33 cases in which no fusion was detected, 22 were considered truly negative because samples met all criteria for good quality, while the remaining 11 (14%) were considered not reliable because of insufficient quality, investigators reported.
The samples were also evaluated through use of FISH, reverse transcriptase PCR, or both in 58 cases and use of immunohistochemistry in 16 cases; for the remaining seven cases, no assay or immunohistochemistry could be applied because of a lack of availability, according to investigators.
Among the 48 entities that were fusion-positive according to AMP-based targeted NGS, 29 were validated using standard molecular assays, and of those, 25 had concordant results. Further analysis of the four discordant cases with a third independent technique confirmed the AMP-based targeted NGS findings, according to the published report.
Among the 22 fusion-negative high-quality samples, 19 were validated using FISH, and one case was found to be discordant; however, despite use of a third independent technique, this discrepancy could not be resolved, investigators said.
The AMP-based targeted NGS technique identified COL1A1 and SEC31A as novel fusion partners for USP6 in two cases of nodular fasciitis. Those fusion partners had been previously described in aneurysmal bone cysts, according to investigators.
Despite the promising results for the novel assay, conventional methods were sufficient in this study to confirm translocations in straightforward cases and ordinary rearrangements, according to the investigators.
“Both reverse transcription PCR and FISH are not only quick and easy to conduct but are also of low cost and high analytical validity and accuracy, which make them attractive methods,” they wrote.
The work by Dr. Bovée and her colleagues was supported by Leiden University Medical Center. The department of pathology and the department of cell and chemical biology at the medical center receive royalty payments from Kreatech/Leica, which provided a COL1A1/PDGFB fusion probe used in the research.
SOURCE: Lam SW et al. J Mol Diagn. 2018 Aug 20;20(5):653-63.
, according to researchers.
The technique of anchored multiplex polymerase chain reaction (AMP)–based targeted next-generation sequencing (NGS) had a failure rate of 14% but, nonetheless, worked favorably when compared with conventional techniques, which were associated with several false positives in this study, the researchers reported in the Journal of Molecular Diagnostics.
Two new fusion partners for the USP6 gene were found using AMP-based targeted NGS in this study, which thus contributed to the “further unraveling of the molecular landscape” for these tumors, added corresponding author Judith V.M.G. Bovée, MD, PhD, of the department of pathology at Leiden (the Netherlands) University Medical Center and her colleagues.
While the genetics of bone and soft tissue tumors have diagnostic value in clinical practice, standard fluorescence in situ hybridization (FISH) and reverse transcriptase PCR are associated with several drawbacks, such as a high false negative rate in the case of FISH, Dr. Bovée and her coauthors wrote.
Accordingly, the researchers evaluated the applicability of a targeted sequencing assay (Archer FusionPlex Sarcoma kit, which was developed by ArcherDX) aimed at 26 genes relevant to bone and soft tissue tumor diagnostics.
Besides allowing for assessment of multiple target genes in a single assay, this technique circumvents the need to know both fusion partners for translocation detection, which opens up the possibility of identifying novel or rare fusion partners, investigators noted.
AMP-based targeted NGS was used to evaluate 81 bone and soft tissue tumor samples, and of those, 48 cases showed a fusion. For the remaining 33 cases in which no fusion was detected, 22 were considered truly negative because samples met all criteria for good quality, while the remaining 11 (14%) were considered not reliable because of insufficient quality, investigators reported.
The samples were also evaluated through use of FISH, reverse transcriptase PCR, or both in 58 cases and use of immunohistochemistry in 16 cases; for the remaining seven cases, no assay or immunohistochemistry could be applied because of a lack of availability, according to investigators.
Among the 48 entities that were fusion-positive according to AMP-based targeted NGS, 29 were validated using standard molecular assays, and of those, 25 had concordant results. Further analysis of the four discordant cases with a third independent technique confirmed the AMP-based targeted NGS findings, according to the published report.
Among the 22 fusion-negative high-quality samples, 19 were validated using FISH, and one case was found to be discordant; however, despite use of a third independent technique, this discrepancy could not be resolved, investigators said.
The AMP-based targeted NGS technique identified COL1A1 and SEC31A as novel fusion partners for USP6 in two cases of nodular fasciitis. Those fusion partners had been previously described in aneurysmal bone cysts, according to investigators.
Despite the promising results for the novel assay, conventional methods were sufficient in this study to confirm translocations in straightforward cases and ordinary rearrangements, according to the investigators.
“Both reverse transcription PCR and FISH are not only quick and easy to conduct but are also of low cost and high analytical validity and accuracy, which make them attractive methods,” they wrote.
The work by Dr. Bovée and her colleagues was supported by Leiden University Medical Center. The department of pathology and the department of cell and chemical biology at the medical center receive royalty payments from Kreatech/Leica, which provided a COL1A1/PDGFB fusion probe used in the research.
SOURCE: Lam SW et al. J Mol Diagn. 2018 Aug 20;20(5):653-63.
, according to researchers.
The technique of anchored multiplex polymerase chain reaction (AMP)–based targeted next-generation sequencing (NGS) had a failure rate of 14% but, nonetheless, worked favorably when compared with conventional techniques, which were associated with several false positives in this study, the researchers reported in the Journal of Molecular Diagnostics.
Two new fusion partners for the USP6 gene were found using AMP-based targeted NGS in this study, which thus contributed to the “further unraveling of the molecular landscape” for these tumors, added corresponding author Judith V.M.G. Bovée, MD, PhD, of the department of pathology at Leiden (the Netherlands) University Medical Center and her colleagues.
While the genetics of bone and soft tissue tumors have diagnostic value in clinical practice, standard fluorescence in situ hybridization (FISH) and reverse transcriptase PCR are associated with several drawbacks, such as a high false negative rate in the case of FISH, Dr. Bovée and her coauthors wrote.
Accordingly, the researchers evaluated the applicability of a targeted sequencing assay (Archer FusionPlex Sarcoma kit, which was developed by ArcherDX) aimed at 26 genes relevant to bone and soft tissue tumor diagnostics.
Besides allowing for assessment of multiple target genes in a single assay, this technique circumvents the need to know both fusion partners for translocation detection, which opens up the possibility of identifying novel or rare fusion partners, investigators noted.
AMP-based targeted NGS was used to evaluate 81 bone and soft tissue tumor samples, and of those, 48 cases showed a fusion. For the remaining 33 cases in which no fusion was detected, 22 were considered truly negative because samples met all criteria for good quality, while the remaining 11 (14%) were considered not reliable because of insufficient quality, investigators reported.
The samples were also evaluated through use of FISH, reverse transcriptase PCR, or both in 58 cases and use of immunohistochemistry in 16 cases; for the remaining seven cases, no assay or immunohistochemistry could be applied because of a lack of availability, according to investigators.
Among the 48 entities that were fusion-positive according to AMP-based targeted NGS, 29 were validated using standard molecular assays, and of those, 25 had concordant results. Further analysis of the four discordant cases with a third independent technique confirmed the AMP-based targeted NGS findings, according to the published report.
Among the 22 fusion-negative high-quality samples, 19 were validated using FISH, and one case was found to be discordant; however, despite use of a third independent technique, this discrepancy could not be resolved, investigators said.
The AMP-based targeted NGS technique identified COL1A1 and SEC31A as novel fusion partners for USP6 in two cases of nodular fasciitis. Those fusion partners had been previously described in aneurysmal bone cysts, according to investigators.
Despite the promising results for the novel assay, conventional methods were sufficient in this study to confirm translocations in straightforward cases and ordinary rearrangements, according to the investigators.
“Both reverse transcription PCR and FISH are not only quick and easy to conduct but are also of low cost and high analytical validity and accuracy, which make them attractive methods,” they wrote.
The work by Dr. Bovée and her colleagues was supported by Leiden University Medical Center. The department of pathology and the department of cell and chemical biology at the medical center receive royalty payments from Kreatech/Leica, which provided a COL1A1/PDGFB fusion probe used in the research.
SOURCE: Lam SW et al. J Mol Diagn. 2018 Aug 20;20(5):653-63.
FROM THE JOURNAL OF MOLECULAR DIAGNOSTICS
Key clinical point: Anchored multiplex PCR (AMP)-based targeted next-generation sequencing (NGS) may be superior to conventional molecular assays in the evaluation of bone and soft tissue tumor samples.
Major finding: Standard techniques yielded 4 false negatives out of 29 samples that were fusion-positive by AMP-based targeted NGS.
Study details: Analysis of 81 bone and soft tissue tumor samples evaluated by AMP-based targeted NGS and conventional techniques.
Disclosures: The research was supported by Leiden (the Netherlands) University Medical Center, which receives royalty payments from Kreatech/Leica.
Source: Lam SW et al. J Mol Diagn. 2018 Aug 20;20(5):653-63.
SEAL: Selinexor extends PFS in advanced dedifferentiated liposarcoma
The investigational drug selinexor appears to be improving progression-free survival in patients with advanced dedifferentiated liposarcoma, based on phase 2 results from the randomized, placebo-controlled SEAL study.
But the statistical significance of the improvements varied depending on whether progression-free survival (PFS) was assessed by the World Health Organization criteria, which looks at two-dimensional measurements of these irregular three-dimensional objects, or RECIST v1.1 criteria, which only looks at a unidimensional measure, reported Mrinal M. Gounder, MD, of Memorial Sloan Kettering Cancer Center, New York, at the annual meeting of the American Society of Clinical Oncology. When tumor response was based on WHO criteria, there was no difference in median PFS for the 24 patients on active therapy (1.4 months) and the 27 patients on placebo (1.8 months). By RECIST v1.1 criteria, however, median PFS was 5.6 months with selinexor.
Dedifferentiated liposarcoma is incurable, and palliative therapies are associated with an overall survival of 11-20 months in these patients. Selinexor is an oral selective inhibitor of exportin-1 which exports proteins from the nucleus into the cytoplasm. The drug appears to prevent p53 from leaving the nucleus, thereby protecting it from overexpressed MDM2, which is a negative regulator of p53, but the drug might have other potential mechanisms of action.
The double-blind study included 56 evaluable patients who had progressive dedifferentiated liposarcoma and had received at least one prior systemic therapy. Patients’ median age was 61 years and they had received a median of two prior therapies. Patients were randomized to get either 60 mg of selinexor (26 patients) or placebo (30 patients) twice weekly until their disease progressed or they were no longer able to tolerate therapy. Patients whose disease progressed on placebo (24 patients) were allowed to cross over to open-label selinexor therapy.
Treatments were unblinded for 51 of the patients, 24 on selinexor and 27 on placebo. Disease progression as confirmed by Independent Central Radiological Review using WHO criteria was the main reason for ending blinded treatment.
Grade 1/2 adverse events for selinexor versus placebo, respectively, were nausea (85% vs. 31%), anorexia (62% vs. 14%), and fatigue (58% vs. 45%). The comparable rates of grade 3/4 adverse events were hyponatremia (15% vs. 0%), anemia (15% vs. 7%), and thrombocytopenia (12% vs. 0%). Selinexor dose was reduced because of adverse events in 12 patients.
In a discussion of the study’s implications, Mark Andrew Dickson, MD, also of Memorial Sloan Kettering Cancer Center, called the adverse events profile “mostly manageable but predictable grade 1/2 adverse events ... and median progression-free survival of 5 and a half months is quite encouraging.
“Changing response assessment method midtrial in a study with progression-free survival as the primary endpoint is obviously problematic, but it also highlights how difficult it is to measure three-dimensional tumors like complex retroperitoneal liposarcomas, which move and change and grow and shrink over time,” he said. “And I would conclude that RECIST is probably the worst method of tumor assessment for sarcoma, except for all the other methods of tumor assessment.”
To illustrate the difficulty of measuring tumor response, Dr. Dickson presented examples of different tumor shapes and scenarios where one method would indicate tumor progression and the other would indicate stable disease.
“There can be differences between the two methods in how progression responds and is determined. And you can do this experiment with a number of different shapes and find scenarios where one method would call it progression at a different time than the other. So this is really critically important when we look at the results of the clinical trial, because it was designed to look at WHO PFS. And you can see that, based on that, there was no significant difference between the selinexor and placebo arm,” he said.
Additionally, he reviewed cases from the study where “either way you measure this, you can see that [the] tumor is getting smaller over time,” as well as cases where the tumor grew in patients on placebo first, but decreased in size after switching to the active therapy.
“The improvement in progression-free survival is promising and ... selinexor probably does have activity in dediff lipo compared to historical data,” said Dr. Dickson, adding that he looks forward to selinexor progressing to a randomized, phase 3 trial and “seeing those data perhaps next year.”
Dr. Gounder disclosed financial relationships with multiple drug companies including Karyopharm Therapeutics, the maker of selinexor. Dr. Dickson disclosed a consult or adviser role with Celgene and research funding from Eli Lilly.
SOURCE: Gounder M et al. ASCO 2018, Abstract 11512.
The investigational drug selinexor appears to be improving progression-free survival in patients with advanced dedifferentiated liposarcoma, based on phase 2 results from the randomized, placebo-controlled SEAL study.
But the statistical significance of the improvements varied depending on whether progression-free survival (PFS) was assessed by the World Health Organization criteria, which looks at two-dimensional measurements of these irregular three-dimensional objects, or RECIST v1.1 criteria, which only looks at a unidimensional measure, reported Mrinal M. Gounder, MD, of Memorial Sloan Kettering Cancer Center, New York, at the annual meeting of the American Society of Clinical Oncology. When tumor response was based on WHO criteria, there was no difference in median PFS for the 24 patients on active therapy (1.4 months) and the 27 patients on placebo (1.8 months). By RECIST v1.1 criteria, however, median PFS was 5.6 months with selinexor.
Dedifferentiated liposarcoma is incurable, and palliative therapies are associated with an overall survival of 11-20 months in these patients. Selinexor is an oral selective inhibitor of exportin-1 which exports proteins from the nucleus into the cytoplasm. The drug appears to prevent p53 from leaving the nucleus, thereby protecting it from overexpressed MDM2, which is a negative regulator of p53, but the drug might have other potential mechanisms of action.
The double-blind study included 56 evaluable patients who had progressive dedifferentiated liposarcoma and had received at least one prior systemic therapy. Patients’ median age was 61 years and they had received a median of two prior therapies. Patients were randomized to get either 60 mg of selinexor (26 patients) or placebo (30 patients) twice weekly until their disease progressed or they were no longer able to tolerate therapy. Patients whose disease progressed on placebo (24 patients) were allowed to cross over to open-label selinexor therapy.
Treatments were unblinded for 51 of the patients, 24 on selinexor and 27 on placebo. Disease progression as confirmed by Independent Central Radiological Review using WHO criteria was the main reason for ending blinded treatment.
Grade 1/2 adverse events for selinexor versus placebo, respectively, were nausea (85% vs. 31%), anorexia (62% vs. 14%), and fatigue (58% vs. 45%). The comparable rates of grade 3/4 adverse events were hyponatremia (15% vs. 0%), anemia (15% vs. 7%), and thrombocytopenia (12% vs. 0%). Selinexor dose was reduced because of adverse events in 12 patients.
In a discussion of the study’s implications, Mark Andrew Dickson, MD, also of Memorial Sloan Kettering Cancer Center, called the adverse events profile “mostly manageable but predictable grade 1/2 adverse events ... and median progression-free survival of 5 and a half months is quite encouraging.
“Changing response assessment method midtrial in a study with progression-free survival as the primary endpoint is obviously problematic, but it also highlights how difficult it is to measure three-dimensional tumors like complex retroperitoneal liposarcomas, which move and change and grow and shrink over time,” he said. “And I would conclude that RECIST is probably the worst method of tumor assessment for sarcoma, except for all the other methods of tumor assessment.”
To illustrate the difficulty of measuring tumor response, Dr. Dickson presented examples of different tumor shapes and scenarios where one method would indicate tumor progression and the other would indicate stable disease.
“There can be differences between the two methods in how progression responds and is determined. And you can do this experiment with a number of different shapes and find scenarios where one method would call it progression at a different time than the other. So this is really critically important when we look at the results of the clinical trial, because it was designed to look at WHO PFS. And you can see that, based on that, there was no significant difference between the selinexor and placebo arm,” he said.
Additionally, he reviewed cases from the study where “either way you measure this, you can see that [the] tumor is getting smaller over time,” as well as cases where the tumor grew in patients on placebo first, but decreased in size after switching to the active therapy.
“The improvement in progression-free survival is promising and ... selinexor probably does have activity in dediff lipo compared to historical data,” said Dr. Dickson, adding that he looks forward to selinexor progressing to a randomized, phase 3 trial and “seeing those data perhaps next year.”
Dr. Gounder disclosed financial relationships with multiple drug companies including Karyopharm Therapeutics, the maker of selinexor. Dr. Dickson disclosed a consult or adviser role with Celgene and research funding from Eli Lilly.
SOURCE: Gounder M et al. ASCO 2018, Abstract 11512.
The investigational drug selinexor appears to be improving progression-free survival in patients with advanced dedifferentiated liposarcoma, based on phase 2 results from the randomized, placebo-controlled SEAL study.
But the statistical significance of the improvements varied depending on whether progression-free survival (PFS) was assessed by the World Health Organization criteria, which looks at two-dimensional measurements of these irregular three-dimensional objects, or RECIST v1.1 criteria, which only looks at a unidimensional measure, reported Mrinal M. Gounder, MD, of Memorial Sloan Kettering Cancer Center, New York, at the annual meeting of the American Society of Clinical Oncology. When tumor response was based on WHO criteria, there was no difference in median PFS for the 24 patients on active therapy (1.4 months) and the 27 patients on placebo (1.8 months). By RECIST v1.1 criteria, however, median PFS was 5.6 months with selinexor.
Dedifferentiated liposarcoma is incurable, and palliative therapies are associated with an overall survival of 11-20 months in these patients. Selinexor is an oral selective inhibitor of exportin-1 which exports proteins from the nucleus into the cytoplasm. The drug appears to prevent p53 from leaving the nucleus, thereby protecting it from overexpressed MDM2, which is a negative regulator of p53, but the drug might have other potential mechanisms of action.
The double-blind study included 56 evaluable patients who had progressive dedifferentiated liposarcoma and had received at least one prior systemic therapy. Patients’ median age was 61 years and they had received a median of two prior therapies. Patients were randomized to get either 60 mg of selinexor (26 patients) or placebo (30 patients) twice weekly until their disease progressed or they were no longer able to tolerate therapy. Patients whose disease progressed on placebo (24 patients) were allowed to cross over to open-label selinexor therapy.
Treatments were unblinded for 51 of the patients, 24 on selinexor and 27 on placebo. Disease progression as confirmed by Independent Central Radiological Review using WHO criteria was the main reason for ending blinded treatment.
Grade 1/2 adverse events for selinexor versus placebo, respectively, were nausea (85% vs. 31%), anorexia (62% vs. 14%), and fatigue (58% vs. 45%). The comparable rates of grade 3/4 adverse events were hyponatremia (15% vs. 0%), anemia (15% vs. 7%), and thrombocytopenia (12% vs. 0%). Selinexor dose was reduced because of adverse events in 12 patients.
In a discussion of the study’s implications, Mark Andrew Dickson, MD, also of Memorial Sloan Kettering Cancer Center, called the adverse events profile “mostly manageable but predictable grade 1/2 adverse events ... and median progression-free survival of 5 and a half months is quite encouraging.
“Changing response assessment method midtrial in a study with progression-free survival as the primary endpoint is obviously problematic, but it also highlights how difficult it is to measure three-dimensional tumors like complex retroperitoneal liposarcomas, which move and change and grow and shrink over time,” he said. “And I would conclude that RECIST is probably the worst method of tumor assessment for sarcoma, except for all the other methods of tumor assessment.”
To illustrate the difficulty of measuring tumor response, Dr. Dickson presented examples of different tumor shapes and scenarios where one method would indicate tumor progression and the other would indicate stable disease.
“There can be differences between the two methods in how progression responds and is determined. And you can do this experiment with a number of different shapes and find scenarios where one method would call it progression at a different time than the other. So this is really critically important when we look at the results of the clinical trial, because it was designed to look at WHO PFS. And you can see that, based on that, there was no significant difference between the selinexor and placebo arm,” he said.
Additionally, he reviewed cases from the study where “either way you measure this, you can see that [the] tumor is getting smaller over time,” as well as cases where the tumor grew in patients on placebo first, but decreased in size after switching to the active therapy.
“The improvement in progression-free survival is promising and ... selinexor probably does have activity in dediff lipo compared to historical data,” said Dr. Dickson, adding that he looks forward to selinexor progressing to a randomized, phase 3 trial and “seeing those data perhaps next year.”
Dr. Gounder disclosed financial relationships with multiple drug companies including Karyopharm Therapeutics, the maker of selinexor. Dr. Dickson disclosed a consult or adviser role with Celgene and research funding from Eli Lilly.
SOURCE: Gounder M et al. ASCO 2018, Abstract 11512.
FROM ASCO 2018
Key clinical point: The investigational drug selinexor appears to be improving progression-free survival (PFS) in patients with advanced dedifferentiated liposarcoma.
Major finding: When tumor response was based on World Health Organization criteria, there was no difference in median PFS for the 24 patients on active therapy (1.4 months) and the 27 patients on placebo (1.8 months). By RECIST v1.1 criteria, however, median PFS was 5.6 months with selinexor.
Study details: Phase 2 results from 56 patients with dedifferentiated liposarcoma in the randomized, placebo-controlled SEAL study.
Disclosures: Dr. Gounder reported financial relationships with multiple drug companies including Karyopharm Therapeutics, the maker of selinexor. Dr. Dickson reported a consultant or adviser role with Celgene and research funding from Eli Lilly.
Source: Gounder M et al. ASCO 2018, Abstract 11512.