User login
Applying Robust Process Improvement Techniques to the Voluntary Inpatient Psychiatry Admission Process
From the Wake Forest School of Medicine (Ms. Newman), and Wake Forest Baptist Health, Department of Psychiatry and Behavioral Medicine (Dr. Kramer), Winston-Salem, NC.
Abstract
- Background: Adults voluntarily admitted to inpatient behavioral health units can ask to sign a Request to Discharge (RTD) form if they would like to be discharged before the treatment team agrees that discharge is appropriate. This gives the team 72 hours to determine whether the patient is safe to discharge or to involuntarily commit the patient to the unit. At 1 medical center, patients who were offered voluntary admission often lacked complete understanding of the “72-hour rule” and the early discharge procedure.
- Methods: Robust Process Improvement® techniques were implemented to improve the admission process. Flow charts, standardized scripts, and pocket cards were distributed to relevant staff. The Request for Voluntary Admission form was revised to emphasize the “72-hour rule” and the process for requesting a RTD form.
- Results: The unit’s average overall Press Ganey score improved from 77.1 to 81.6 (P = 0.003), while the average discharge score improved from 83.0 to 87.5 (P = 0.023) following implementation of the new process.
- Conclusion: Incorporating strategies such as an opportunity to “teach back” important information about the voluntary admission process (ie, what the 72-hour rule is, what the request to discharge form is, and the possibility of involuntary commitment) allows clinicians to assess capacity while simultaneously giving patients realistic expectations of the admission. These changes can lead to improvement in patient satisfaction.
Keywords: behavioral health; communication; patient satisfaction.
Communication is paramount within medical teams to improve outcomes and strengthen rapport with patients, particularly with psychiatric patients in acute crisis. Studies
While some forms of communication are required to protect the safety of patients and others around them, other forms are required to build strong relationships with patients. However, these 2 goals do not have to be mutually exclusive in the psychiatric hospital environment. Hospitals aim to improve patient satisfaction while simultaneously providing effective communication about treatment. Studies have indicated that communication during graduate medical training may decline due to “emotional and physical brutality” associated with residency training programs.4 To ameliorate this and emphasize communication education, accredited psychiatry residency programs require residents to use structured communication tools to achieve a level 2 in the Accreditation Council for Graduate Medical Education milestone project for the category of patient safety and health care team.5 These standardized processes allow all patients to receive the same important information related to their care while minimizing human error. Such communication skills aim to improve health care outcomes and satisfaction for patients while also training better physicians.
For legal and ethical reasons, the adult inpatient behavioral health units at major hospitals are highly regulated. In most states, a patient who is admitted to an adult inpatient behavioral health unit on a voluntary basis can ask to sign a request to discharge (RTD) form if he or she would like to be discharged from the hospital before the treatment team sees fit.6 In most jurisdictions, this action gives the treatment team 72 hours to determine whether the patient is safe to discharge. Within that time frame, the physician must either discharge the patient, or, if it is not safe to do so, involuntarily commit him or her to the unit. In most jurisdictions, this process is commonly referred to as the “72-hour rule.”
In North Carolina, state legislation Chapter 122C, Article 5, Part 2(b) specifies: “In 24-hour facilities the application shall acknowledge that the applicant may be held by the facility for a period of 72 hours after any written request for release that the applicant may make, and shall acknowledge that the 24-hour facility may have the legal right to petition for involuntary commitment of the applicant during that period. At the time of application, the facility shall tell the applicant about procedures for discharge.”7 This requirement can be somewhat confusing for both medical team members and patients alike.
As formerly practiced on the behavioral health unit described in this report, patients offered voluntary admission status to the inpatient behavioral unit often lacked complete understanding of the 72-hour rule and the process for requesting early discharge from the facility. We hypothesized that this led to the observed patient frustration and hostility, lack of trust in the treatment team, poor attendance and participation in group therapy activities, medication refusal, and overall decreased patient satisfaction. To address this issue, this pilot project was conducted to improve the voluntary admission process on the adult inpatient unit of a major academic medical center in North Carolina.
In April 2008, The Joint Commission’s Center for Transforming Healthcare embarked on an enterprise-wide initiative called Robust Process Improvement (RPI). RPI was developed as a blended approach in applying Six Sigma, Lean, and Change Management techniques to improve medical processes and procedures. RPI techniques were applied in this study to better define the problems related to inpatient behavioral health unit admission and discharge by collecting data, obtaining staff involvement, creating a solution, and monitoring for lasting benefit.
Methods
This quality improvement project took place at an 885-bed tertiary care academic medical center with Level 1 Trauma Center designation. Institutional Review Board approval was not required because this was performed as a quality improvement project rather than an experimental clinical trial and was not designed to create new generalizable knowledge.
The techniques used to improve outcomes on the inpatient behavioral health unit included Active Listening, Elevator Speech, Statistics, Cause and Effect Diagrams, development of a Communication Plan, Brainstorming, and Standard Work. Through interviews with physician assistants, nurses, and resident physicians conducted over a 1-month period, it became clear that there was confusion among patients surrounding the voluntary admission process, the process for requesting discharge, and the possibility of a voluntary admission being converted to an involuntary one. Active listening was used to better understand the opportunities for improvement from multiple perspectives through varying stages of the admission—from the consent process in the emergency department, admission to the unit, throughout the hospital stay, to the time of discharge. The following elevator speech was used to highlight the areas of confusion and the importance of implementing change with the team involved in implementing the new admission procedures:
Our project is about improving patient understanding of the voluntary admission process to the Adult Psychiatry Unit and the 72-hour rule. This is important because the present process leads to patient misunderstanding, discontent on the unit, resistance to provided therapies, and low Press Ganey satisfaction scores. Success will look like reduced patient confusion about the 72-hour rule, increased group participation, decreased patient-staff conflict, and improved Press Ganey scores. What we are asking from you is to use a standardized, scripted informed consent process, flow chart, and pocket card during the voluntary admission process.
Additionally, brainstorming sessions were conducted with physician assistants, nurses, and residents to discuss options to improve the process and elicit a list of barriers.
Data Gathering
Several metrics were tracked to further understand the issue. Overall Press Ganey scores, in addition to admission and discharge subsection scores, were tracked for the 8 months prior to implementing the quality improvement procedures (March 2017-October 2017). Additionally, the treatment team members answered survey questions related to perceived patient understanding at the beginning of training sessions in the 5-week period immediately prior to implementing the quality improvement procedures. This survey was administered using a 6-point Likert scale, ranging from 1 (never) to 6 (frequently), and included the following questions:
- How often do you have to explain: (a) Request for Voluntary Admission form, (b) 72-Hour Rule, (c) Request to Discharge form?
- How often is there confusion about the 72-hour rule and RTD form once admitted to the adult inpatient psychiatric unit?
- How often do you need to re-explain the 72-hour rule and RTD form once admitted to the adult inpatient psychiatric unit?
In-depth interviews were conducted with 4 resident physicians, 4 physician assistants, and 3 nurses to identify specific shortcomings of the admission procedure. A key finding from these interviews was that some patients tended not to understand that the treatment team had 72 hours to respond to the RTD application. Instead, several patients had indicated that they thought that they could immediately discharge themselves since they were on the unit “voluntarily” or that they could categorically discharge themselves after 72 hours of being admitted. This feedback was crucial in determining the next steps that could be taken to minimize confusion.
Process Changes
In preparation for this quality improvement project, the language and layout of the Request for Voluntary Admission form was revised and approved internally by the hospital’s Forms Committee to emphasize the 72-hour rule and the process for completing a RTD form. Additionally, these interviews indicated that it was difficult to track patients who were admitted voluntarily versus involuntarily. To rectify this problem, a field was added to the electronic medical record system to include current psychiatric admission status, allowing the selection to be either “Voluntary” or “Involuntary.” This new field in the electronic medical record system gives nurses the ability to easily update legal status daily as appropriate, which minimizes the risk of information not being effectively communicated at shift changes, while also allowing various members of the treatment team to be updated on the admission status of each patient.
After reviewing data and obtaining staff involvement related to the problem, a new psychiatric admission and consent process was created. The new consent and admission process was characterized by a standardized procedure and scripted language to present to candidates for voluntary admission. The standardized procedure begins with the admitting staff member reading scripted consent language from a pocket card that includes 3 key points describing the voluntary admission procedure (see script in Figure 1). The first key point is to describe the 72-hour rule. Next, the staff member describes the purpose of the RTD form and shows an example to the patient. Finally, the staff member responsible for consenting describes the possibility of the patient being required to remain on the unit involuntarily in the event that he or she wants to leave before the treatment team sees fit and is deemed to be a danger to himself or herself or others.
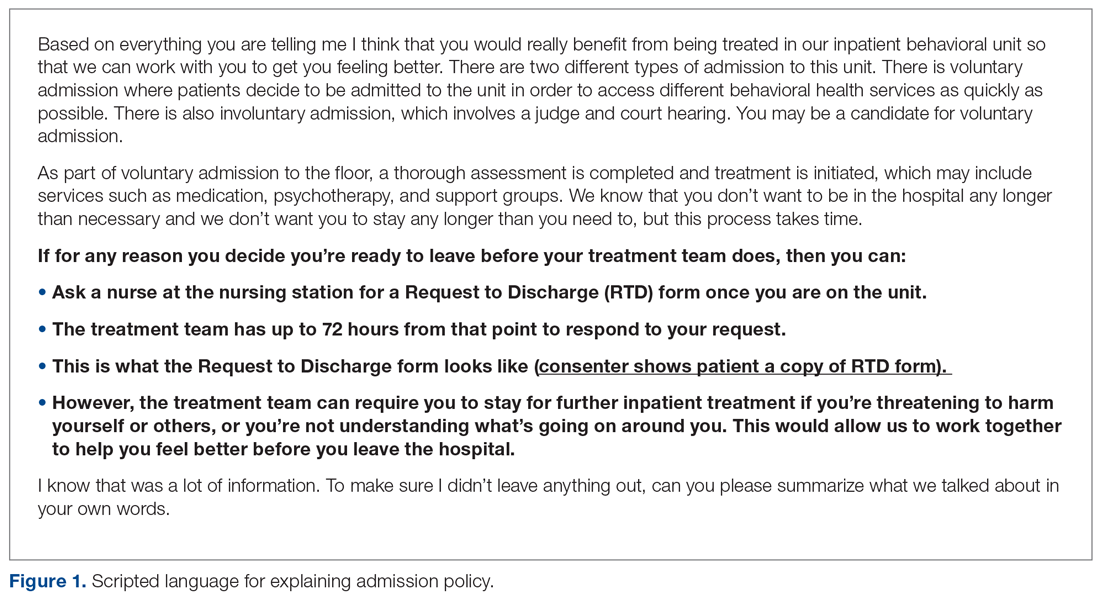
On the reverse side of the pocket card, an example of the RTD form is available to show to the patient. The subsequent teach-back procedure is summarized using the flow chart in Figure 2, and this was made available to staff who participate in the admission and discharge processes. After reading the consent script, the consenting staff member must ask the patient to recall the 3 key points. For each key point that the patient cannot recall, the relevant section of the scripted language is re-read to the patient, who is asked to explain it again. If the patient recalls the 3 key points, then he or she is deemed to have cognitive capacity and thus can become a candidate for voluntary admission.
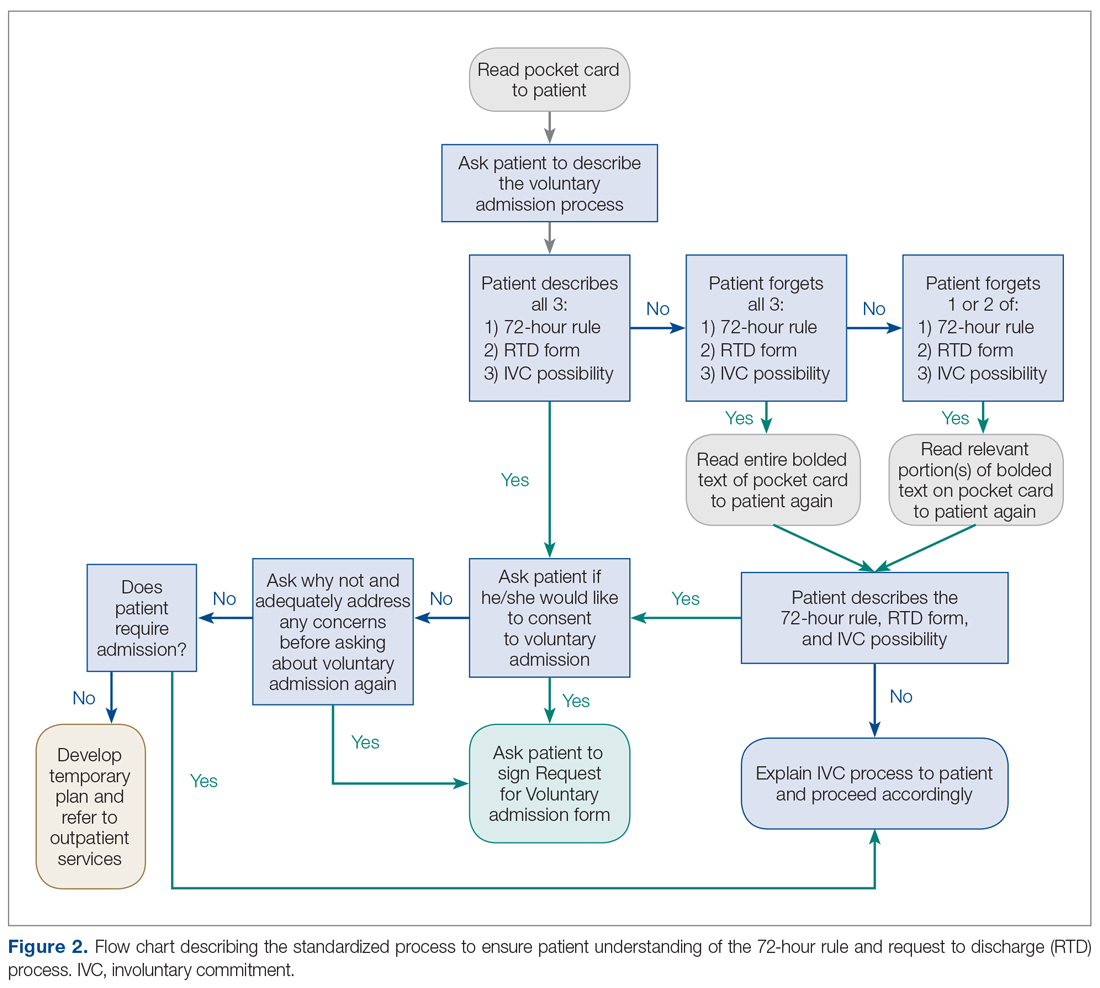
Flow charts, scripts, and pocket cards were created and distributed to relevant physicians, physician assistants, and nurses who participate in the admission or discharge process. Additional copies of pocket cards were made available within the department. In October 2017, an attending psychiatrist and medical student trained psychiatry physician assistants, nurses, and resident physicians who participated in the admission process in the ED or patient care on the unit on how to use the new materials. The new process was first implemented on November 1, 2017.
Measurements
Press Ganey scores were compared for 8 months before and 8 months after implementing the new process to monitor changes from the patients’ perspective. Additionally, the treatment team members answered survey questions related to perceived patient understanding at the beginning of training sessions in mid-September through mid-October and again 5 weeks after the new process was implemented.
Results
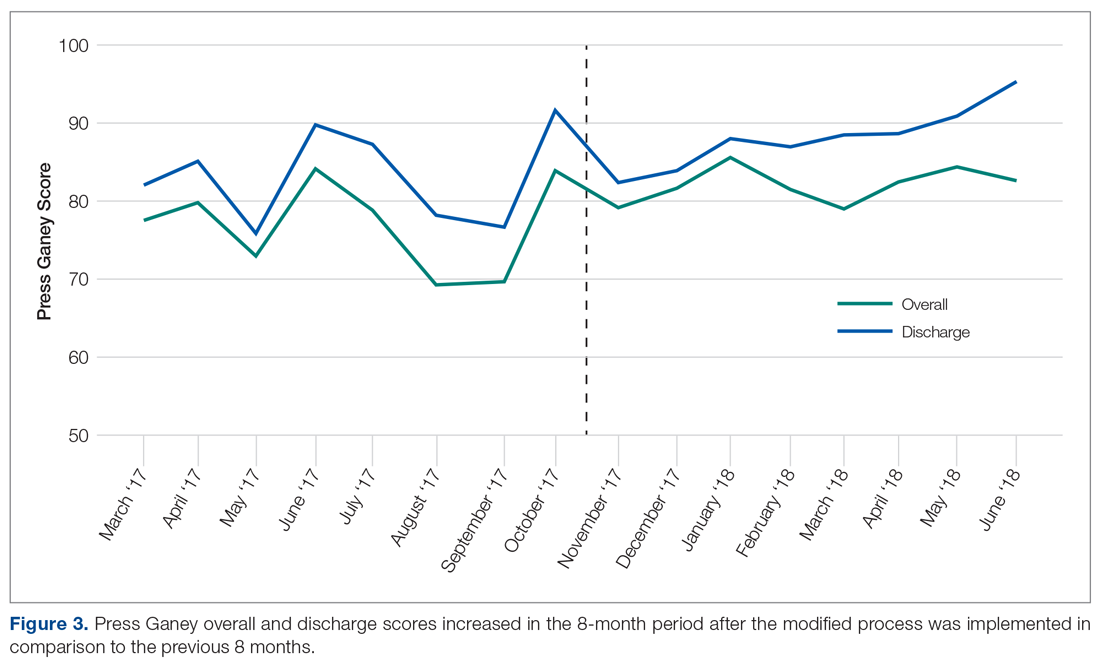
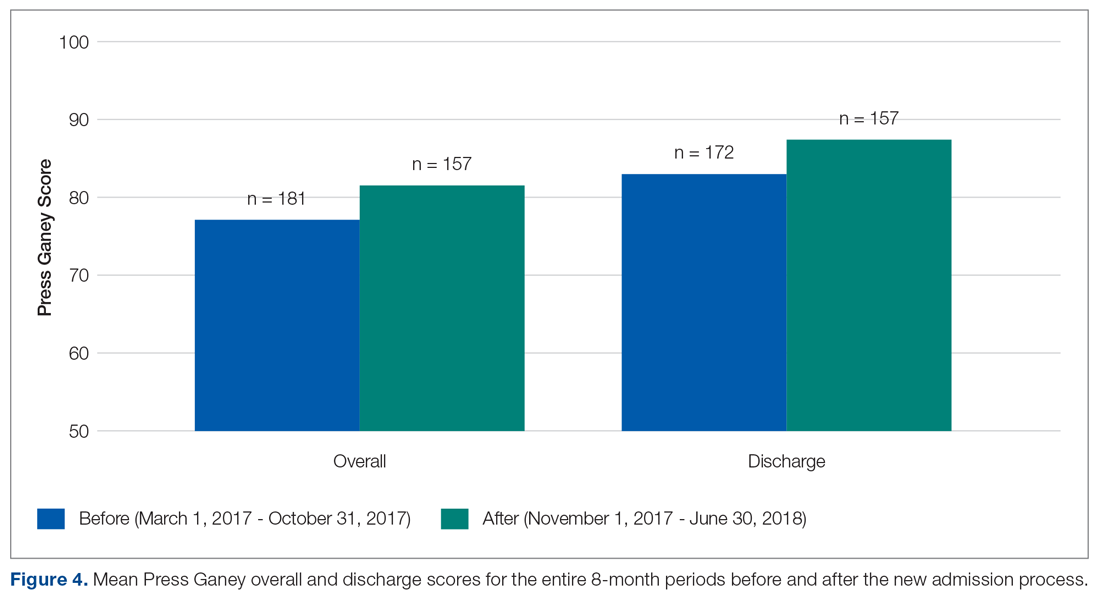
The behavioral health unit’s Press Ganey (overall and discharge) scores increased during the 8-month period following implementation of the quality improvement project (Figure 3). There was a notable upward trend of overall and discharge Press Ganey scores on a month-by-month basis from November through April. In total, 181 Press Ganey score reports were available for the 6-month period prior to the new process versus 157 score reports after (Figure 4). The average overall Press Ganey score for respondents improved from 77.1 to 81.6 (P = 0.003), while the average discharge score improved from 83.0 to 87.5 (P = 0.023).
In recent months, the behavioral health discharge satisfaction score has become one of the highest performing aspects of the department according to Press Ganey reports. From April through June 2018, the department has performed in the 98th percentile or higher in “information about patient’s rights” during admission and “discharge instructions if help is needed.”
The survey related to perceived patient satisfaction and confusion also indicated significant improvement. Survey respondents indicated that there was less confusion about the 72-hour rule and RTD form after the quality improvement procedure was implemented (P = 0.039) and that fewer attempts to re-explain these concepts were required as well (P = 0.035).
Discussion
The Press Ganey scores for this unit indicated an improvement in patient satisfaction, in particular with the discharge process. While the overall Press Ganey scores on the inpatient behavioral health unit showed a significant improvement, it remained stagnant, around 80, during the 8-month period after implementing the new standardized admission process. However, the discharge score consistently improved over the same 8 months, from 82 to 95 in the most recent month. Also, the overall and discharge scores indicated a brief spike/improvement in October, immediately preceding the implementation of the new scripted language. Given the timeline, this spike is likely related to the ongoing meetings, trainings, and awareness of the upcoming process improvement.
With hospital and health system reimbursements becoming increasingly tied with patient outcomes, quality improvement efforts to improve patient care and satisfaction are of the utmost importance. In order to develop the rapport with patients needed for a high level of cooperation and excellent outcomes on an inpatient psychiatric unit, it is essential that all patients receive specific information about what the admission entails and what the options are for being discharged from the unit. Since a voluntary admission can be converted to an involuntary admission if a patient is deemed a threat to himself or herself or others despite already signing a RTD form, it is essential that this is not only discussed prior to admission, but that these details are explicitly checked for understanding. This allows the treatment team to assess for capacity and the patient to demonstrate informed consent. Differing expectations or understanding in what the voluntary admission or discharge process entails can lead to patient frustration and hostility, lack of trust in the treatment team, poor attendance and participation in group therapy activities, and medication refusal. Altogether, this can lead to longer inpatient stays, increased costs, decreased outcomes, and decreased patient satisfaction.
These initiatives were relatively easy to implement and are backed by evidence that they ultimately increased patient satisfaction. These findings could be extended to other institutions to improve the voluntary admission process and, ultimately, the patient experience. Additionally, the methods could be applied to other patient care processes within psychiatric facilities, and to improve other aspects of the patient care experience that have room for improvement, as illustrated by the department’s Press Ganey subsection scores, or areas that the treatment team would like to focus on.
Limitations
There are several limitations in the design and evaluation of this project. The assessment of patient understanding, especially in psychiatric patients, is very difficult to quantify. The principal measure of assessing patient understanding was limited to health care professional survey results. This may have led to a slight social desirability bias. An objective assessment of understanding directly from the patients was not readily attainable in our study, but future studies could look at this metric in addition to health care professional survey results.
Additionally, the overall Press Ganey scores may be influenced by factors beyond the admission process and the applied improvement procedures. It is difficult to discern whether there were any other factors that also contributed to the overall increase. However, the discharge score was a more direct measure specifically related to the modified procedures, and the temporal association of the intervention with the increased scores suggests that the intervention was responsible.
Conclusion
Standardization of the consent process ensures that all patients receive the necessary information every time in busy clinical settings. Incorporating an opportunity to “teach back” specific important information about the voluntary admission process, specifically what the 72-hour rule is, what the RTD form is, and the possibility of involuntary commitment, allows clinicians to assess capacity, while simultaneously allowing patients to have realistic expectations of the admission. Concise, standardized answers regarding these points minimizes variation in information being dispersed and decreases the possibility of omitting important information. At a major academic medical center, easy-to-implement quality improvement techniques significantly decreased patient confusion surrounding the 72-hour rule and the RTD form, along with the frequency in which these policies needed to be re-explained on the adult inpatient psychiatric unit. These changes ultimately led to improvement in patient satisfaction, as indicated by significant improvement in both overall and discharge patient satisfaction scores.
Corresponding author: Jennifer F. Newman, 475 Vine St., Winston-Salem, NC, 27101; jnewman9@u.rochester.edu.
Financial disclosures: None.
1. Redfern E, Brown R, Vincent C. Improving communication in the emergency department. Emerg Med J. 2009;26:658-661.
2. Payne CE, Stein JM, Leong T, Dressler DD. Avoiding handover fumbles: a controlled trial of a structured handover tool versus traditional handover methods. BMJ Qual Saf. 2012;21:925-932.
3. Weller J, Boyd M, Cumin D. Teams, tribes and patient safety: overcoming barriers to effective teamwork in healthcare. Postgrad Med J. 2014;90:149-154.
4. DiMatteo MR. The role of the physician in the emerging health care environment. Western J Med. 1998;168:328.
5. The Psychiatry Milestone Project. J Grad Med Educ. 2014;6(1 Suppl 1):284-304.
6. Garakani A, Shalenberg E, Burstin SC, et al. Voluntary psychiatric hospitalization and patient-driven requests for discharge: a statutory review and analysis of implications for the capacity to consent to voluntary hospitalization. Harv Rev Psychiatry. 2014;22:241-249.
7. Procedure for Admission and Discharge of Clients Act, 211 § 122C-211(2014).
From the Wake Forest School of Medicine (Ms. Newman), and Wake Forest Baptist Health, Department of Psychiatry and Behavioral Medicine (Dr. Kramer), Winston-Salem, NC.
Abstract
- Background: Adults voluntarily admitted to inpatient behavioral health units can ask to sign a Request to Discharge (RTD) form if they would like to be discharged before the treatment team agrees that discharge is appropriate. This gives the team 72 hours to determine whether the patient is safe to discharge or to involuntarily commit the patient to the unit. At 1 medical center, patients who were offered voluntary admission often lacked complete understanding of the “72-hour rule” and the early discharge procedure.
- Methods: Robust Process Improvement® techniques were implemented to improve the admission process. Flow charts, standardized scripts, and pocket cards were distributed to relevant staff. The Request for Voluntary Admission form was revised to emphasize the “72-hour rule” and the process for requesting a RTD form.
- Results: The unit’s average overall Press Ganey score improved from 77.1 to 81.6 (P = 0.003), while the average discharge score improved from 83.0 to 87.5 (P = 0.023) following implementation of the new process.
- Conclusion: Incorporating strategies such as an opportunity to “teach back” important information about the voluntary admission process (ie, what the 72-hour rule is, what the request to discharge form is, and the possibility of involuntary commitment) allows clinicians to assess capacity while simultaneously giving patients realistic expectations of the admission. These changes can lead to improvement in patient satisfaction.
Keywords: behavioral health; communication; patient satisfaction.
Communication is paramount within medical teams to improve outcomes and strengthen rapport with patients, particularly with psychiatric patients in acute crisis. Studies
While some forms of communication are required to protect the safety of patients and others around them, other forms are required to build strong relationships with patients. However, these 2 goals do not have to be mutually exclusive in the psychiatric hospital environment. Hospitals aim to improve patient satisfaction while simultaneously providing effective communication about treatment. Studies have indicated that communication during graduate medical training may decline due to “emotional and physical brutality” associated with residency training programs.4 To ameliorate this and emphasize communication education, accredited psychiatry residency programs require residents to use structured communication tools to achieve a level 2 in the Accreditation Council for Graduate Medical Education milestone project for the category of patient safety and health care team.5 These standardized processes allow all patients to receive the same important information related to their care while minimizing human error. Such communication skills aim to improve health care outcomes and satisfaction for patients while also training better physicians.
For legal and ethical reasons, the adult inpatient behavioral health units at major hospitals are highly regulated. In most states, a patient who is admitted to an adult inpatient behavioral health unit on a voluntary basis can ask to sign a request to discharge (RTD) form if he or she would like to be discharged from the hospital before the treatment team sees fit.6 In most jurisdictions, this action gives the treatment team 72 hours to determine whether the patient is safe to discharge. Within that time frame, the physician must either discharge the patient, or, if it is not safe to do so, involuntarily commit him or her to the unit. In most jurisdictions, this process is commonly referred to as the “72-hour rule.”
In North Carolina, state legislation Chapter 122C, Article 5, Part 2(b) specifies: “In 24-hour facilities the application shall acknowledge that the applicant may be held by the facility for a period of 72 hours after any written request for release that the applicant may make, and shall acknowledge that the 24-hour facility may have the legal right to petition for involuntary commitment of the applicant during that period. At the time of application, the facility shall tell the applicant about procedures for discharge.”7 This requirement can be somewhat confusing for both medical team members and patients alike.
As formerly practiced on the behavioral health unit described in this report, patients offered voluntary admission status to the inpatient behavioral unit often lacked complete understanding of the 72-hour rule and the process for requesting early discharge from the facility. We hypothesized that this led to the observed patient frustration and hostility, lack of trust in the treatment team, poor attendance and participation in group therapy activities, medication refusal, and overall decreased patient satisfaction. To address this issue, this pilot project was conducted to improve the voluntary admission process on the adult inpatient unit of a major academic medical center in North Carolina.
In April 2008, The Joint Commission’s Center for Transforming Healthcare embarked on an enterprise-wide initiative called Robust Process Improvement (RPI). RPI was developed as a blended approach in applying Six Sigma, Lean, and Change Management techniques to improve medical processes and procedures. RPI techniques were applied in this study to better define the problems related to inpatient behavioral health unit admission and discharge by collecting data, obtaining staff involvement, creating a solution, and monitoring for lasting benefit.
Methods
This quality improvement project took place at an 885-bed tertiary care academic medical center with Level 1 Trauma Center designation. Institutional Review Board approval was not required because this was performed as a quality improvement project rather than an experimental clinical trial and was not designed to create new generalizable knowledge.
The techniques used to improve outcomes on the inpatient behavioral health unit included Active Listening, Elevator Speech, Statistics, Cause and Effect Diagrams, development of a Communication Plan, Brainstorming, and Standard Work. Through interviews with physician assistants, nurses, and resident physicians conducted over a 1-month period, it became clear that there was confusion among patients surrounding the voluntary admission process, the process for requesting discharge, and the possibility of a voluntary admission being converted to an involuntary one. Active listening was used to better understand the opportunities for improvement from multiple perspectives through varying stages of the admission—from the consent process in the emergency department, admission to the unit, throughout the hospital stay, to the time of discharge. The following elevator speech was used to highlight the areas of confusion and the importance of implementing change with the team involved in implementing the new admission procedures:
Our project is about improving patient understanding of the voluntary admission process to the Adult Psychiatry Unit and the 72-hour rule. This is important because the present process leads to patient misunderstanding, discontent on the unit, resistance to provided therapies, and low Press Ganey satisfaction scores. Success will look like reduced patient confusion about the 72-hour rule, increased group participation, decreased patient-staff conflict, and improved Press Ganey scores. What we are asking from you is to use a standardized, scripted informed consent process, flow chart, and pocket card during the voluntary admission process.
Additionally, brainstorming sessions were conducted with physician assistants, nurses, and residents to discuss options to improve the process and elicit a list of barriers.
Data Gathering
Several metrics were tracked to further understand the issue. Overall Press Ganey scores, in addition to admission and discharge subsection scores, were tracked for the 8 months prior to implementing the quality improvement procedures (March 2017-October 2017). Additionally, the treatment team members answered survey questions related to perceived patient understanding at the beginning of training sessions in the 5-week period immediately prior to implementing the quality improvement procedures. This survey was administered using a 6-point Likert scale, ranging from 1 (never) to 6 (frequently), and included the following questions:
- How often do you have to explain: (a) Request for Voluntary Admission form, (b) 72-Hour Rule, (c) Request to Discharge form?
- How often is there confusion about the 72-hour rule and RTD form once admitted to the adult inpatient psychiatric unit?
- How often do you need to re-explain the 72-hour rule and RTD form once admitted to the adult inpatient psychiatric unit?
In-depth interviews were conducted with 4 resident physicians, 4 physician assistants, and 3 nurses to identify specific shortcomings of the admission procedure. A key finding from these interviews was that some patients tended not to understand that the treatment team had 72 hours to respond to the RTD application. Instead, several patients had indicated that they thought that they could immediately discharge themselves since they were on the unit “voluntarily” or that they could categorically discharge themselves after 72 hours of being admitted. This feedback was crucial in determining the next steps that could be taken to minimize confusion.
Process Changes
In preparation for this quality improvement project, the language and layout of the Request for Voluntary Admission form was revised and approved internally by the hospital’s Forms Committee to emphasize the 72-hour rule and the process for completing a RTD form. Additionally, these interviews indicated that it was difficult to track patients who were admitted voluntarily versus involuntarily. To rectify this problem, a field was added to the electronic medical record system to include current psychiatric admission status, allowing the selection to be either “Voluntary” or “Involuntary.” This new field in the electronic medical record system gives nurses the ability to easily update legal status daily as appropriate, which minimizes the risk of information not being effectively communicated at shift changes, while also allowing various members of the treatment team to be updated on the admission status of each patient.
After reviewing data and obtaining staff involvement related to the problem, a new psychiatric admission and consent process was created. The new consent and admission process was characterized by a standardized procedure and scripted language to present to candidates for voluntary admission. The standardized procedure begins with the admitting staff member reading scripted consent language from a pocket card that includes 3 key points describing the voluntary admission procedure (see script in Figure 1). The first key point is to describe the 72-hour rule. Next, the staff member describes the purpose of the RTD form and shows an example to the patient. Finally, the staff member responsible for consenting describes the possibility of the patient being required to remain on the unit involuntarily in the event that he or she wants to leave before the treatment team sees fit and is deemed to be a danger to himself or herself or others.
On the reverse side of the pocket card, an example of the RTD form is available to show to the patient. The subsequent teach-back procedure is summarized using the flow chart in Figure 2, and this was made available to staff who participate in the admission and discharge processes. After reading the consent script, the consenting staff member must ask the patient to recall the 3 key points. For each key point that the patient cannot recall, the relevant section of the scripted language is re-read to the patient, who is asked to explain it again. If the patient recalls the 3 key points, then he or she is deemed to have cognitive capacity and thus can become a candidate for voluntary admission.
Flow charts, scripts, and pocket cards were created and distributed to relevant physicians, physician assistants, and nurses who participate in the admission or discharge process. Additional copies of pocket cards were made available within the department. In October 2017, an attending psychiatrist and medical student trained psychiatry physician assistants, nurses, and resident physicians who participated in the admission process in the ED or patient care on the unit on how to use the new materials. The new process was first implemented on November 1, 2017.
Measurements
Press Ganey scores were compared for 8 months before and 8 months after implementing the new process to monitor changes from the patients’ perspective. Additionally, the treatment team members answered survey questions related to perceived patient understanding at the beginning of training sessions in mid-September through mid-October and again 5 weeks after the new process was implemented.
Results
The behavioral health unit’s Press Ganey (overall and discharge) scores increased during the 8-month period following implementation of the quality improvement project (Figure 3). There was a notable upward trend of overall and discharge Press Ganey scores on a month-by-month basis from November through April. In total, 181 Press Ganey score reports were available for the 6-month period prior to the new process versus 157 score reports after (Figure 4). The average overall Press Ganey score for respondents improved from 77.1 to 81.6 (P = 0.003), while the average discharge score improved from 83.0 to 87.5 (P = 0.023).
In recent months, the behavioral health discharge satisfaction score has become one of the highest performing aspects of the department according to Press Ganey reports. From April through June 2018, the department has performed in the 98th percentile or higher in “information about patient’s rights” during admission and “discharge instructions if help is needed.”
The survey related to perceived patient satisfaction and confusion also indicated significant improvement. Survey respondents indicated that there was less confusion about the 72-hour rule and RTD form after the quality improvement procedure was implemented (P = 0.039) and that fewer attempts to re-explain these concepts were required as well (P = 0.035).
Discussion
The Press Ganey scores for this unit indicated an improvement in patient satisfaction, in particular with the discharge process. While the overall Press Ganey scores on the inpatient behavioral health unit showed a significant improvement, it remained stagnant, around 80, during the 8-month period after implementing the new standardized admission process. However, the discharge score consistently improved over the same 8 months, from 82 to 95 in the most recent month. Also, the overall and discharge scores indicated a brief spike/improvement in October, immediately preceding the implementation of the new scripted language. Given the timeline, this spike is likely related to the ongoing meetings, trainings, and awareness of the upcoming process improvement.
With hospital and health system reimbursements becoming increasingly tied with patient outcomes, quality improvement efforts to improve patient care and satisfaction are of the utmost importance. In order to develop the rapport with patients needed for a high level of cooperation and excellent outcomes on an inpatient psychiatric unit, it is essential that all patients receive specific information about what the admission entails and what the options are for being discharged from the unit. Since a voluntary admission can be converted to an involuntary admission if a patient is deemed a threat to himself or herself or others despite already signing a RTD form, it is essential that this is not only discussed prior to admission, but that these details are explicitly checked for understanding. This allows the treatment team to assess for capacity and the patient to demonstrate informed consent. Differing expectations or understanding in what the voluntary admission or discharge process entails can lead to patient frustration and hostility, lack of trust in the treatment team, poor attendance and participation in group therapy activities, and medication refusal. Altogether, this can lead to longer inpatient stays, increased costs, decreased outcomes, and decreased patient satisfaction.
These initiatives were relatively easy to implement and are backed by evidence that they ultimately increased patient satisfaction. These findings could be extended to other institutions to improve the voluntary admission process and, ultimately, the patient experience. Additionally, the methods could be applied to other patient care processes within psychiatric facilities, and to improve other aspects of the patient care experience that have room for improvement, as illustrated by the department’s Press Ganey subsection scores, or areas that the treatment team would like to focus on.
Limitations
There are several limitations in the design and evaluation of this project. The assessment of patient understanding, especially in psychiatric patients, is very difficult to quantify. The principal measure of assessing patient understanding was limited to health care professional survey results. This may have led to a slight social desirability bias. An objective assessment of understanding directly from the patients was not readily attainable in our study, but future studies could look at this metric in addition to health care professional survey results.
Additionally, the overall Press Ganey scores may be influenced by factors beyond the admission process and the applied improvement procedures. It is difficult to discern whether there were any other factors that also contributed to the overall increase. However, the discharge score was a more direct measure specifically related to the modified procedures, and the temporal association of the intervention with the increased scores suggests that the intervention was responsible.
Conclusion
Standardization of the consent process ensures that all patients receive the necessary information every time in busy clinical settings. Incorporating an opportunity to “teach back” specific important information about the voluntary admission process, specifically what the 72-hour rule is, what the RTD form is, and the possibility of involuntary commitment, allows clinicians to assess capacity, while simultaneously allowing patients to have realistic expectations of the admission. Concise, standardized answers regarding these points minimizes variation in information being dispersed and decreases the possibility of omitting important information. At a major academic medical center, easy-to-implement quality improvement techniques significantly decreased patient confusion surrounding the 72-hour rule and the RTD form, along with the frequency in which these policies needed to be re-explained on the adult inpatient psychiatric unit. These changes ultimately led to improvement in patient satisfaction, as indicated by significant improvement in both overall and discharge patient satisfaction scores.
Corresponding author: Jennifer F. Newman, 475 Vine St., Winston-Salem, NC, 27101; jnewman9@u.rochester.edu.
Financial disclosures: None.
From the Wake Forest School of Medicine (Ms. Newman), and Wake Forest Baptist Health, Department of Psychiatry and Behavioral Medicine (Dr. Kramer), Winston-Salem, NC.
Abstract
- Background: Adults voluntarily admitted to inpatient behavioral health units can ask to sign a Request to Discharge (RTD) form if they would like to be discharged before the treatment team agrees that discharge is appropriate. This gives the team 72 hours to determine whether the patient is safe to discharge or to involuntarily commit the patient to the unit. At 1 medical center, patients who were offered voluntary admission often lacked complete understanding of the “72-hour rule” and the early discharge procedure.
- Methods: Robust Process Improvement® techniques were implemented to improve the admission process. Flow charts, standardized scripts, and pocket cards were distributed to relevant staff. The Request for Voluntary Admission form was revised to emphasize the “72-hour rule” and the process for requesting a RTD form.
- Results: The unit’s average overall Press Ganey score improved from 77.1 to 81.6 (P = 0.003), while the average discharge score improved from 83.0 to 87.5 (P = 0.023) following implementation of the new process.
- Conclusion: Incorporating strategies such as an opportunity to “teach back” important information about the voluntary admission process (ie, what the 72-hour rule is, what the request to discharge form is, and the possibility of involuntary commitment) allows clinicians to assess capacity while simultaneously giving patients realistic expectations of the admission. These changes can lead to improvement in patient satisfaction.
Keywords: behavioral health; communication; patient satisfaction.
Communication is paramount within medical teams to improve outcomes and strengthen rapport with patients, particularly with psychiatric patients in acute crisis. Studies
While some forms of communication are required to protect the safety of patients and others around them, other forms are required to build strong relationships with patients. However, these 2 goals do not have to be mutually exclusive in the psychiatric hospital environment. Hospitals aim to improve patient satisfaction while simultaneously providing effective communication about treatment. Studies have indicated that communication during graduate medical training may decline due to “emotional and physical brutality” associated with residency training programs.4 To ameliorate this and emphasize communication education, accredited psychiatry residency programs require residents to use structured communication tools to achieve a level 2 in the Accreditation Council for Graduate Medical Education milestone project for the category of patient safety and health care team.5 These standardized processes allow all patients to receive the same important information related to their care while minimizing human error. Such communication skills aim to improve health care outcomes and satisfaction for patients while also training better physicians.
For legal and ethical reasons, the adult inpatient behavioral health units at major hospitals are highly regulated. In most states, a patient who is admitted to an adult inpatient behavioral health unit on a voluntary basis can ask to sign a request to discharge (RTD) form if he or she would like to be discharged from the hospital before the treatment team sees fit.6 In most jurisdictions, this action gives the treatment team 72 hours to determine whether the patient is safe to discharge. Within that time frame, the physician must either discharge the patient, or, if it is not safe to do so, involuntarily commit him or her to the unit. In most jurisdictions, this process is commonly referred to as the “72-hour rule.”
In North Carolina, state legislation Chapter 122C, Article 5, Part 2(b) specifies: “In 24-hour facilities the application shall acknowledge that the applicant may be held by the facility for a period of 72 hours after any written request for release that the applicant may make, and shall acknowledge that the 24-hour facility may have the legal right to petition for involuntary commitment of the applicant during that period. At the time of application, the facility shall tell the applicant about procedures for discharge.”7 This requirement can be somewhat confusing for both medical team members and patients alike.
As formerly practiced on the behavioral health unit described in this report, patients offered voluntary admission status to the inpatient behavioral unit often lacked complete understanding of the 72-hour rule and the process for requesting early discharge from the facility. We hypothesized that this led to the observed patient frustration and hostility, lack of trust in the treatment team, poor attendance and participation in group therapy activities, medication refusal, and overall decreased patient satisfaction. To address this issue, this pilot project was conducted to improve the voluntary admission process on the adult inpatient unit of a major academic medical center in North Carolina.
In April 2008, The Joint Commission’s Center for Transforming Healthcare embarked on an enterprise-wide initiative called Robust Process Improvement (RPI). RPI was developed as a blended approach in applying Six Sigma, Lean, and Change Management techniques to improve medical processes and procedures. RPI techniques were applied in this study to better define the problems related to inpatient behavioral health unit admission and discharge by collecting data, obtaining staff involvement, creating a solution, and monitoring for lasting benefit.
Methods
This quality improvement project took place at an 885-bed tertiary care academic medical center with Level 1 Trauma Center designation. Institutional Review Board approval was not required because this was performed as a quality improvement project rather than an experimental clinical trial and was not designed to create new generalizable knowledge.
The techniques used to improve outcomes on the inpatient behavioral health unit included Active Listening, Elevator Speech, Statistics, Cause and Effect Diagrams, development of a Communication Plan, Brainstorming, and Standard Work. Through interviews with physician assistants, nurses, and resident physicians conducted over a 1-month period, it became clear that there was confusion among patients surrounding the voluntary admission process, the process for requesting discharge, and the possibility of a voluntary admission being converted to an involuntary one. Active listening was used to better understand the opportunities for improvement from multiple perspectives through varying stages of the admission—from the consent process in the emergency department, admission to the unit, throughout the hospital stay, to the time of discharge. The following elevator speech was used to highlight the areas of confusion and the importance of implementing change with the team involved in implementing the new admission procedures:
Our project is about improving patient understanding of the voluntary admission process to the Adult Psychiatry Unit and the 72-hour rule. This is important because the present process leads to patient misunderstanding, discontent on the unit, resistance to provided therapies, and low Press Ganey satisfaction scores. Success will look like reduced patient confusion about the 72-hour rule, increased group participation, decreased patient-staff conflict, and improved Press Ganey scores. What we are asking from you is to use a standardized, scripted informed consent process, flow chart, and pocket card during the voluntary admission process.
Additionally, brainstorming sessions were conducted with physician assistants, nurses, and residents to discuss options to improve the process and elicit a list of barriers.
Data Gathering
Several metrics were tracked to further understand the issue. Overall Press Ganey scores, in addition to admission and discharge subsection scores, were tracked for the 8 months prior to implementing the quality improvement procedures (March 2017-October 2017). Additionally, the treatment team members answered survey questions related to perceived patient understanding at the beginning of training sessions in the 5-week period immediately prior to implementing the quality improvement procedures. This survey was administered using a 6-point Likert scale, ranging from 1 (never) to 6 (frequently), and included the following questions:
- How often do you have to explain: (a) Request for Voluntary Admission form, (b) 72-Hour Rule, (c) Request to Discharge form?
- How often is there confusion about the 72-hour rule and RTD form once admitted to the adult inpatient psychiatric unit?
- How often do you need to re-explain the 72-hour rule and RTD form once admitted to the adult inpatient psychiatric unit?
In-depth interviews were conducted with 4 resident physicians, 4 physician assistants, and 3 nurses to identify specific shortcomings of the admission procedure. A key finding from these interviews was that some patients tended not to understand that the treatment team had 72 hours to respond to the RTD application. Instead, several patients had indicated that they thought that they could immediately discharge themselves since they were on the unit “voluntarily” or that they could categorically discharge themselves after 72 hours of being admitted. This feedback was crucial in determining the next steps that could be taken to minimize confusion.
Process Changes
In preparation for this quality improvement project, the language and layout of the Request for Voluntary Admission form was revised and approved internally by the hospital’s Forms Committee to emphasize the 72-hour rule and the process for completing a RTD form. Additionally, these interviews indicated that it was difficult to track patients who were admitted voluntarily versus involuntarily. To rectify this problem, a field was added to the electronic medical record system to include current psychiatric admission status, allowing the selection to be either “Voluntary” or “Involuntary.” This new field in the electronic medical record system gives nurses the ability to easily update legal status daily as appropriate, which minimizes the risk of information not being effectively communicated at shift changes, while also allowing various members of the treatment team to be updated on the admission status of each patient.
After reviewing data and obtaining staff involvement related to the problem, a new psychiatric admission and consent process was created. The new consent and admission process was characterized by a standardized procedure and scripted language to present to candidates for voluntary admission. The standardized procedure begins with the admitting staff member reading scripted consent language from a pocket card that includes 3 key points describing the voluntary admission procedure (see script in Figure 1). The first key point is to describe the 72-hour rule. Next, the staff member describes the purpose of the RTD form and shows an example to the patient. Finally, the staff member responsible for consenting describes the possibility of the patient being required to remain on the unit involuntarily in the event that he or she wants to leave before the treatment team sees fit and is deemed to be a danger to himself or herself or others.
On the reverse side of the pocket card, an example of the RTD form is available to show to the patient. The subsequent teach-back procedure is summarized using the flow chart in Figure 2, and this was made available to staff who participate in the admission and discharge processes. After reading the consent script, the consenting staff member must ask the patient to recall the 3 key points. For each key point that the patient cannot recall, the relevant section of the scripted language is re-read to the patient, who is asked to explain it again. If the patient recalls the 3 key points, then he or she is deemed to have cognitive capacity and thus can become a candidate for voluntary admission.
Flow charts, scripts, and pocket cards were created and distributed to relevant physicians, physician assistants, and nurses who participate in the admission or discharge process. Additional copies of pocket cards were made available within the department. In October 2017, an attending psychiatrist and medical student trained psychiatry physician assistants, nurses, and resident physicians who participated in the admission process in the ED or patient care on the unit on how to use the new materials. The new process was first implemented on November 1, 2017.
Measurements
Press Ganey scores were compared for 8 months before and 8 months after implementing the new process to monitor changes from the patients’ perspective. Additionally, the treatment team members answered survey questions related to perceived patient understanding at the beginning of training sessions in mid-September through mid-October and again 5 weeks after the new process was implemented.
Results
The behavioral health unit’s Press Ganey (overall and discharge) scores increased during the 8-month period following implementation of the quality improvement project (Figure 3). There was a notable upward trend of overall and discharge Press Ganey scores on a month-by-month basis from November through April. In total, 181 Press Ganey score reports were available for the 6-month period prior to the new process versus 157 score reports after (Figure 4). The average overall Press Ganey score for respondents improved from 77.1 to 81.6 (P = 0.003), while the average discharge score improved from 83.0 to 87.5 (P = 0.023).
In recent months, the behavioral health discharge satisfaction score has become one of the highest performing aspects of the department according to Press Ganey reports. From April through June 2018, the department has performed in the 98th percentile or higher in “information about patient’s rights” during admission and “discharge instructions if help is needed.”
The survey related to perceived patient satisfaction and confusion also indicated significant improvement. Survey respondents indicated that there was less confusion about the 72-hour rule and RTD form after the quality improvement procedure was implemented (P = 0.039) and that fewer attempts to re-explain these concepts were required as well (P = 0.035).
Discussion
The Press Ganey scores for this unit indicated an improvement in patient satisfaction, in particular with the discharge process. While the overall Press Ganey scores on the inpatient behavioral health unit showed a significant improvement, it remained stagnant, around 80, during the 8-month period after implementing the new standardized admission process. However, the discharge score consistently improved over the same 8 months, from 82 to 95 in the most recent month. Also, the overall and discharge scores indicated a brief spike/improvement in October, immediately preceding the implementation of the new scripted language. Given the timeline, this spike is likely related to the ongoing meetings, trainings, and awareness of the upcoming process improvement.
With hospital and health system reimbursements becoming increasingly tied with patient outcomes, quality improvement efforts to improve patient care and satisfaction are of the utmost importance. In order to develop the rapport with patients needed for a high level of cooperation and excellent outcomes on an inpatient psychiatric unit, it is essential that all patients receive specific information about what the admission entails and what the options are for being discharged from the unit. Since a voluntary admission can be converted to an involuntary admission if a patient is deemed a threat to himself or herself or others despite already signing a RTD form, it is essential that this is not only discussed prior to admission, but that these details are explicitly checked for understanding. This allows the treatment team to assess for capacity and the patient to demonstrate informed consent. Differing expectations or understanding in what the voluntary admission or discharge process entails can lead to patient frustration and hostility, lack of trust in the treatment team, poor attendance and participation in group therapy activities, and medication refusal. Altogether, this can lead to longer inpatient stays, increased costs, decreased outcomes, and decreased patient satisfaction.
These initiatives were relatively easy to implement and are backed by evidence that they ultimately increased patient satisfaction. These findings could be extended to other institutions to improve the voluntary admission process and, ultimately, the patient experience. Additionally, the methods could be applied to other patient care processes within psychiatric facilities, and to improve other aspects of the patient care experience that have room for improvement, as illustrated by the department’s Press Ganey subsection scores, or areas that the treatment team would like to focus on.
Limitations
There are several limitations in the design and evaluation of this project. The assessment of patient understanding, especially in psychiatric patients, is very difficult to quantify. The principal measure of assessing patient understanding was limited to health care professional survey results. This may have led to a slight social desirability bias. An objective assessment of understanding directly from the patients was not readily attainable in our study, but future studies could look at this metric in addition to health care professional survey results.
Additionally, the overall Press Ganey scores may be influenced by factors beyond the admission process and the applied improvement procedures. It is difficult to discern whether there were any other factors that also contributed to the overall increase. However, the discharge score was a more direct measure specifically related to the modified procedures, and the temporal association of the intervention with the increased scores suggests that the intervention was responsible.
Conclusion
Standardization of the consent process ensures that all patients receive the necessary information every time in busy clinical settings. Incorporating an opportunity to “teach back” specific important information about the voluntary admission process, specifically what the 72-hour rule is, what the RTD form is, and the possibility of involuntary commitment, allows clinicians to assess capacity, while simultaneously allowing patients to have realistic expectations of the admission. Concise, standardized answers regarding these points minimizes variation in information being dispersed and decreases the possibility of omitting important information. At a major academic medical center, easy-to-implement quality improvement techniques significantly decreased patient confusion surrounding the 72-hour rule and the RTD form, along with the frequency in which these policies needed to be re-explained on the adult inpatient psychiatric unit. These changes ultimately led to improvement in patient satisfaction, as indicated by significant improvement in both overall and discharge patient satisfaction scores.
Corresponding author: Jennifer F. Newman, 475 Vine St., Winston-Salem, NC, 27101; jnewman9@u.rochester.edu.
Financial disclosures: None.
1. Redfern E, Brown R, Vincent C. Improving communication in the emergency department. Emerg Med J. 2009;26:658-661.
2. Payne CE, Stein JM, Leong T, Dressler DD. Avoiding handover fumbles: a controlled trial of a structured handover tool versus traditional handover methods. BMJ Qual Saf. 2012;21:925-932.
3. Weller J, Boyd M, Cumin D. Teams, tribes and patient safety: overcoming barriers to effective teamwork in healthcare. Postgrad Med J. 2014;90:149-154.
4. DiMatteo MR. The role of the physician in the emerging health care environment. Western J Med. 1998;168:328.
5. The Psychiatry Milestone Project. J Grad Med Educ. 2014;6(1 Suppl 1):284-304.
6. Garakani A, Shalenberg E, Burstin SC, et al. Voluntary psychiatric hospitalization and patient-driven requests for discharge: a statutory review and analysis of implications for the capacity to consent to voluntary hospitalization. Harv Rev Psychiatry. 2014;22:241-249.
7. Procedure for Admission and Discharge of Clients Act, 211 § 122C-211(2014).
1. Redfern E, Brown R, Vincent C. Improving communication in the emergency department. Emerg Med J. 2009;26:658-661.
2. Payne CE, Stein JM, Leong T, Dressler DD. Avoiding handover fumbles: a controlled trial of a structured handover tool versus traditional handover methods. BMJ Qual Saf. 2012;21:925-932.
3. Weller J, Boyd M, Cumin D. Teams, tribes and patient safety: overcoming barriers to effective teamwork in healthcare. Postgrad Med J. 2014;90:149-154.
4. DiMatteo MR. The role of the physician in the emerging health care environment. Western J Med. 1998;168:328.
5. The Psychiatry Milestone Project. J Grad Med Educ. 2014;6(1 Suppl 1):284-304.
6. Garakani A, Shalenberg E, Burstin SC, et al. Voluntary psychiatric hospitalization and patient-driven requests for discharge: a statutory review and analysis of implications for the capacity to consent to voluntary hospitalization. Harv Rev Psychiatry. 2014;22:241-249.
7. Procedure for Admission and Discharge of Clients Act, 211 § 122C-211(2014).
Cardioprotective Effect of Metformin in Patients with Decreased Renal Function
Study Overview
Objective. To assess whether metformin use is associated with lower risk of fatal or nonfatal major adverse cardiovascular events (MACE) as compared to sulfonylurea use among diabetic patients with reduced kidney function.
Design. Retrospective cohort study of US Veterans receiving care within the Veterans Health Administration, with data supplemented by linkage to Medicare, Medicaid, and National Death Index data from 2001 through 2016.
Setting and participants. A retrospective cohort of Veterans Health Administration (VHA) patients, aged 18 years and older. Pharmacy data included medication, date filled, days supplied, and number of pills dispensed. For Medicare and Medicaid patients, enrollees’ claims files and prescription (Part D) data were obtained. In addition, dates and cause of death were obtained from vital status and the National Death Index files.
Patients with new-onset type 2 diabetes were identified by selecting new users of metformin, glipizide, glyburide, or glimepiride. These patients were followed longitudinally and the date of cohort entry and start of follow-up was the day of reaching a reduced kidney function threshold, defined as either an estimated glomerular filtration rate (eGFR) of less than 60 mL/m
Main outcome measures. Primary outcome was the composite of MACE including hospitalization for acute myocardial infarction (AMI), ischemic or hemorrhagic stroke, transient ischemic attack (TIA), or date of cardiovascular death. The secondary outcome excluded TIA as part of the composite MACE event because not all patients who sustain a TIA are admitted to the hospital.
Main results. From January 1, 2002 through December 30, 2015, 67,749 new metformin users and 28,976 new sulfonylurea users who persisted with treatment were identified. After using propensity score-weighted matching, 24,679 metformin users and 24,799 sulfonylurea users entered the final analysis. Cohort patients were 98% male and 81.8% white. Metformin users were younger than sulfonylurea users, with a median age of 61 years versus 71 years, respectively.
For the main outcome, there were 1048 composite MACE events among metformin patients with reduced kidney function and 1394 MACE events among sulfonylurea patients, yielding 23.0 (95% confidence interval [CI], 21.7-24.4) versus 29.2 (95% CI, 27.7-30.7) events per 1000 person-years of use, respectively, after propensity score-weighting. After covariate adjustment, the cause-specific adjusted hazard ratio (aHR) for MACE was 0.80 (95% CI, 0.75-0.86) among metformin users compared with sulfonylurea users. The adjusted incidence rate difference was 5.8 (95% CI, 4.1-7.3) fewer events per 1000-person years for metformin compared with sulfonylurea users. Results were also consistent for each component of the primary outcome, including cardiovascular hospitalizations (aHR, 0.87; 95% CI, 0.80-0.95) and cardiovascular deaths (aHR, 0.70; 95% CI, 0.63-0.78).
Analysis of secondary outcomes, which included AMI, stroke, and cardiovascular death and excluded TIA, demonstrated similar results, with a cause-specific aHR of 0.78 (95% CI, 0.72-0.84) among metformin users compared with sulfonylurea users. The adjusted incidence rate difference was 5.9 (95% CI, 4.3-7.6) fewer events per 1000-person years for metformin compared with sulfonylurea users.
Conclusion. For patients with diabetes and reduced kidney function, treatment with metformin monotherapy, as compared with a sulfonylurea, was associated with a lower risk of MACE.
Commentary
There are approximately 30 million US adults with a diagnosis of type 2 diabetes (T2DM), of whom 20% also have impaired kidney function or chronic kidney disease (CKD).1 Metformin hydrochloride has remained the preferred first-line treatment for T2DM based on safety and effectiveness, as well as low cost.2 Metformin is eliminated by the kidneys and can accumulate as eGFR declines. Based on the negative clinical experience, the US Food and Drug Administration (FDA) issued a safety warning restricting metformin for patients with serum creatinine levels of 1.5 mg/dL or greater for men or 1.4 mg/dL or greater for women. The FDA recommended against starting metformin therapy in patients with CKD with eGFR between 30 and 45 mL/min/1.73 m2, although patients already taking metformin can continue with caution in that setting.1,3
There are several limitations in conducting observational studies comparing metformin to other glucose-lowering medications. First, metformin trials typically excluded patients with CKD due to the FDA warnings. Second, there is usually a time-lag bias in which patients who initiate glucose-lowering medications other than metformin are at a later stage of disease. Third, there is often an allocation bias, as there are substantial differences in baseline characteristics between metformin and sulfonylurea monotherapy users, with metformin users usually being younger and healthier.4
In this retrospective cohort study by Roumie et al, the authors used propensity score–weighted matching to reduce the impacts on time-lag and allocation bias. However, several major limitations remained in this study. First, the study design excluded those who began diabetes treatment after the onset of reduced kidney function; therefore, this study cannot be generalized to patients who already have reduced eGFR at the time of metformin initiation. Second, cohort entry and the start of follow-up was either an elevated serum creatinine or reduced eGFR less than 60 mL/min/1.73 m2. The cohort may have included some patients with an acute kidney injury event, rather than progression to CKD, who recovered from their acute kidney injury. Third, the study population was mostly elderly white men; together with the lack of dose analysis, this study may not be generalizable to other populations.
Applications for Clinical Practice
The current study demonstrated that metformin use, as compared to sulfonylureas, has a lower risk of fatal or nonfatal major adverse cardiovascular events among patients with reduced kidney function. When clinicians are managing hyperglycemia in patients with type 2 diabetes, it is important to keep in mind that all medications have adverse effects. There are now 11 drug classes for treating diabetes, in addition to multiple insulin options, and the challenge for clinicians is to present clear information to guide patients using shared decision making, based on each patient’s clinical circumstances and preferences, to achieve individualized glycemic target ranges.
–Ka Ming Gordon Ngai, MD, MPH
1. Geiss LS, Kirtland K, Lin J, et al. Changes in diagnosed diabetes, obesity, and physical inactivity prevalence in US counties, 2004-2012. PLoS One. 2017;12:e0173428.
2. Good CB, Pogach LM. Should metformin be first-line therapy for patients with type 2 diabetes and chronic kidney disease? JAMA Intern Med. 2018;178:911-912.
3. US Food and Drug Administration. FDA revises warnings regarding use of the diabetes medicine metformin in certain patients with reduced kidney function. https://www.fda.gov/downloads/Drugs/DrugSafety/UCM494140.pdf. Accessed September 30, 2019.
4. Wexler DJ. Sulfonylureas and cardiovascular safety the final verdict? JAMA. 2019;322:1147-1149.
Study Overview
Objective. To assess whether metformin use is associated with lower risk of fatal or nonfatal major adverse cardiovascular events (MACE) as compared to sulfonylurea use among diabetic patients with reduced kidney function.
Design. Retrospective cohort study of US Veterans receiving care within the Veterans Health Administration, with data supplemented by linkage to Medicare, Medicaid, and National Death Index data from 2001 through 2016.
Setting and participants. A retrospective cohort of Veterans Health Administration (VHA) patients, aged 18 years and older. Pharmacy data included medication, date filled, days supplied, and number of pills dispensed. For Medicare and Medicaid patients, enrollees’ claims files and prescription (Part D) data were obtained. In addition, dates and cause of death were obtained from vital status and the National Death Index files.
Patients with new-onset type 2 diabetes were identified by selecting new users of metformin, glipizide, glyburide, or glimepiride. These patients were followed longitudinally and the date of cohort entry and start of follow-up was the day of reaching a reduced kidney function threshold, defined as either an estimated glomerular filtration rate (eGFR) of less than 60 mL/m
Main outcome measures. Primary outcome was the composite of MACE including hospitalization for acute myocardial infarction (AMI), ischemic or hemorrhagic stroke, transient ischemic attack (TIA), or date of cardiovascular death. The secondary outcome excluded TIA as part of the composite MACE event because not all patients who sustain a TIA are admitted to the hospital.
Main results. From January 1, 2002 through December 30, 2015, 67,749 new metformin users and 28,976 new sulfonylurea users who persisted with treatment were identified. After using propensity score-weighted matching, 24,679 metformin users and 24,799 sulfonylurea users entered the final analysis. Cohort patients were 98% male and 81.8% white. Metformin users were younger than sulfonylurea users, with a median age of 61 years versus 71 years, respectively.
For the main outcome, there were 1048 composite MACE events among metformin patients with reduced kidney function and 1394 MACE events among sulfonylurea patients, yielding 23.0 (95% confidence interval [CI], 21.7-24.4) versus 29.2 (95% CI, 27.7-30.7) events per 1000 person-years of use, respectively, after propensity score-weighting. After covariate adjustment, the cause-specific adjusted hazard ratio (aHR) for MACE was 0.80 (95% CI, 0.75-0.86) among metformin users compared with sulfonylurea users. The adjusted incidence rate difference was 5.8 (95% CI, 4.1-7.3) fewer events per 1000-person years for metformin compared with sulfonylurea users. Results were also consistent for each component of the primary outcome, including cardiovascular hospitalizations (aHR, 0.87; 95% CI, 0.80-0.95) and cardiovascular deaths (aHR, 0.70; 95% CI, 0.63-0.78).
Analysis of secondary outcomes, which included AMI, stroke, and cardiovascular death and excluded TIA, demonstrated similar results, with a cause-specific aHR of 0.78 (95% CI, 0.72-0.84) among metformin users compared with sulfonylurea users. The adjusted incidence rate difference was 5.9 (95% CI, 4.3-7.6) fewer events per 1000-person years for metformin compared with sulfonylurea users.
Conclusion. For patients with diabetes and reduced kidney function, treatment with metformin monotherapy, as compared with a sulfonylurea, was associated with a lower risk of MACE.
Commentary
There are approximately 30 million US adults with a diagnosis of type 2 diabetes (T2DM), of whom 20% also have impaired kidney function or chronic kidney disease (CKD).1 Metformin hydrochloride has remained the preferred first-line treatment for T2DM based on safety and effectiveness, as well as low cost.2 Metformin is eliminated by the kidneys and can accumulate as eGFR declines. Based on the negative clinical experience, the US Food and Drug Administration (FDA) issued a safety warning restricting metformin for patients with serum creatinine levels of 1.5 mg/dL or greater for men or 1.4 mg/dL or greater for women. The FDA recommended against starting metformin therapy in patients with CKD with eGFR between 30 and 45 mL/min/1.73 m2, although patients already taking metformin can continue with caution in that setting.1,3
There are several limitations in conducting observational studies comparing metformin to other glucose-lowering medications. First, metformin trials typically excluded patients with CKD due to the FDA warnings. Second, there is usually a time-lag bias in which patients who initiate glucose-lowering medications other than metformin are at a later stage of disease. Third, there is often an allocation bias, as there are substantial differences in baseline characteristics between metformin and sulfonylurea monotherapy users, with metformin users usually being younger and healthier.4
In this retrospective cohort study by Roumie et al, the authors used propensity score–weighted matching to reduce the impacts on time-lag and allocation bias. However, several major limitations remained in this study. First, the study design excluded those who began diabetes treatment after the onset of reduced kidney function; therefore, this study cannot be generalized to patients who already have reduced eGFR at the time of metformin initiation. Second, cohort entry and the start of follow-up was either an elevated serum creatinine or reduced eGFR less than 60 mL/min/1.73 m2. The cohort may have included some patients with an acute kidney injury event, rather than progression to CKD, who recovered from their acute kidney injury. Third, the study population was mostly elderly white men; together with the lack of dose analysis, this study may not be generalizable to other populations.
Applications for Clinical Practice
The current study demonstrated that metformin use, as compared to sulfonylureas, has a lower risk of fatal or nonfatal major adverse cardiovascular events among patients with reduced kidney function. When clinicians are managing hyperglycemia in patients with type 2 diabetes, it is important to keep in mind that all medications have adverse effects. There are now 11 drug classes for treating diabetes, in addition to multiple insulin options, and the challenge for clinicians is to present clear information to guide patients using shared decision making, based on each patient’s clinical circumstances and preferences, to achieve individualized glycemic target ranges.
–Ka Ming Gordon Ngai, MD, MPH
Study Overview
Objective. To assess whether metformin use is associated with lower risk of fatal or nonfatal major adverse cardiovascular events (MACE) as compared to sulfonylurea use among diabetic patients with reduced kidney function.
Design. Retrospective cohort study of US Veterans receiving care within the Veterans Health Administration, with data supplemented by linkage to Medicare, Medicaid, and National Death Index data from 2001 through 2016.
Setting and participants. A retrospective cohort of Veterans Health Administration (VHA) patients, aged 18 years and older. Pharmacy data included medication, date filled, days supplied, and number of pills dispensed. For Medicare and Medicaid patients, enrollees’ claims files and prescription (Part D) data were obtained. In addition, dates and cause of death were obtained from vital status and the National Death Index files.
Patients with new-onset type 2 diabetes were identified by selecting new users of metformin, glipizide, glyburide, or glimepiride. These patients were followed longitudinally and the date of cohort entry and start of follow-up was the day of reaching a reduced kidney function threshold, defined as either an estimated glomerular filtration rate (eGFR) of less than 60 mL/m
Main outcome measures. Primary outcome was the composite of MACE including hospitalization for acute myocardial infarction (AMI), ischemic or hemorrhagic stroke, transient ischemic attack (TIA), or date of cardiovascular death. The secondary outcome excluded TIA as part of the composite MACE event because not all patients who sustain a TIA are admitted to the hospital.
Main results. From January 1, 2002 through December 30, 2015, 67,749 new metformin users and 28,976 new sulfonylurea users who persisted with treatment were identified. After using propensity score-weighted matching, 24,679 metformin users and 24,799 sulfonylurea users entered the final analysis. Cohort patients were 98% male and 81.8% white. Metformin users were younger than sulfonylurea users, with a median age of 61 years versus 71 years, respectively.
For the main outcome, there were 1048 composite MACE events among metformin patients with reduced kidney function and 1394 MACE events among sulfonylurea patients, yielding 23.0 (95% confidence interval [CI], 21.7-24.4) versus 29.2 (95% CI, 27.7-30.7) events per 1000 person-years of use, respectively, after propensity score-weighting. After covariate adjustment, the cause-specific adjusted hazard ratio (aHR) for MACE was 0.80 (95% CI, 0.75-0.86) among metformin users compared with sulfonylurea users. The adjusted incidence rate difference was 5.8 (95% CI, 4.1-7.3) fewer events per 1000-person years for metformin compared with sulfonylurea users. Results were also consistent for each component of the primary outcome, including cardiovascular hospitalizations (aHR, 0.87; 95% CI, 0.80-0.95) and cardiovascular deaths (aHR, 0.70; 95% CI, 0.63-0.78).
Analysis of secondary outcomes, which included AMI, stroke, and cardiovascular death and excluded TIA, demonstrated similar results, with a cause-specific aHR of 0.78 (95% CI, 0.72-0.84) among metformin users compared with sulfonylurea users. The adjusted incidence rate difference was 5.9 (95% CI, 4.3-7.6) fewer events per 1000-person years for metformin compared with sulfonylurea users.
Conclusion. For patients with diabetes and reduced kidney function, treatment with metformin monotherapy, as compared with a sulfonylurea, was associated with a lower risk of MACE.
Commentary
There are approximately 30 million US adults with a diagnosis of type 2 diabetes (T2DM), of whom 20% also have impaired kidney function or chronic kidney disease (CKD).1 Metformin hydrochloride has remained the preferred first-line treatment for T2DM based on safety and effectiveness, as well as low cost.2 Metformin is eliminated by the kidneys and can accumulate as eGFR declines. Based on the negative clinical experience, the US Food and Drug Administration (FDA) issued a safety warning restricting metformin for patients with serum creatinine levels of 1.5 mg/dL or greater for men or 1.4 mg/dL or greater for women. The FDA recommended against starting metformin therapy in patients with CKD with eGFR between 30 and 45 mL/min/1.73 m2, although patients already taking metformin can continue with caution in that setting.1,3
There are several limitations in conducting observational studies comparing metformin to other glucose-lowering medications. First, metformin trials typically excluded patients with CKD due to the FDA warnings. Second, there is usually a time-lag bias in which patients who initiate glucose-lowering medications other than metformin are at a later stage of disease. Third, there is often an allocation bias, as there are substantial differences in baseline characteristics between metformin and sulfonylurea monotherapy users, with metformin users usually being younger and healthier.4
In this retrospective cohort study by Roumie et al, the authors used propensity score–weighted matching to reduce the impacts on time-lag and allocation bias. However, several major limitations remained in this study. First, the study design excluded those who began diabetes treatment after the onset of reduced kidney function; therefore, this study cannot be generalized to patients who already have reduced eGFR at the time of metformin initiation. Second, cohort entry and the start of follow-up was either an elevated serum creatinine or reduced eGFR less than 60 mL/min/1.73 m2. The cohort may have included some patients with an acute kidney injury event, rather than progression to CKD, who recovered from their acute kidney injury. Third, the study population was mostly elderly white men; together with the lack of dose analysis, this study may not be generalizable to other populations.
Applications for Clinical Practice
The current study demonstrated that metformin use, as compared to sulfonylureas, has a lower risk of fatal or nonfatal major adverse cardiovascular events among patients with reduced kidney function. When clinicians are managing hyperglycemia in patients with type 2 diabetes, it is important to keep in mind that all medications have adverse effects. There are now 11 drug classes for treating diabetes, in addition to multiple insulin options, and the challenge for clinicians is to present clear information to guide patients using shared decision making, based on each patient’s clinical circumstances and preferences, to achieve individualized glycemic target ranges.
–Ka Ming Gordon Ngai, MD, MPH
1. Geiss LS, Kirtland K, Lin J, et al. Changes in diagnosed diabetes, obesity, and physical inactivity prevalence in US counties, 2004-2012. PLoS One. 2017;12:e0173428.
2. Good CB, Pogach LM. Should metformin be first-line therapy for patients with type 2 diabetes and chronic kidney disease? JAMA Intern Med. 2018;178:911-912.
3. US Food and Drug Administration. FDA revises warnings regarding use of the diabetes medicine metformin in certain patients with reduced kidney function. https://www.fda.gov/downloads/Drugs/DrugSafety/UCM494140.pdf. Accessed September 30, 2019.
4. Wexler DJ. Sulfonylureas and cardiovascular safety the final verdict? JAMA. 2019;322:1147-1149.
1. Geiss LS, Kirtland K, Lin J, et al. Changes in diagnosed diabetes, obesity, and physical inactivity prevalence in US counties, 2004-2012. PLoS One. 2017;12:e0173428.
2. Good CB, Pogach LM. Should metformin be first-line therapy for patients with type 2 diabetes and chronic kidney disease? JAMA Intern Med. 2018;178:911-912.
3. US Food and Drug Administration. FDA revises warnings regarding use of the diabetes medicine metformin in certain patients with reduced kidney function. https://www.fda.gov/downloads/Drugs/DrugSafety/UCM494140.pdf. Accessed September 30, 2019.
4. Wexler DJ. Sulfonylureas and cardiovascular safety the final verdict? JAMA. 2019;322:1147-1149.
Prasugrel Superior to Ticagrelor in Acute Coronary Syndromes
Study Overview
Objective. To assess the relative merits of ticagrelor compared to prasugrel in patients with acute coronary syndromes who will undergo invasive evaluation.
Design. Multicenter, open-label, prospective randomized controlled trial.
Setting and participants. A total of 4018 patients who presented with ACS with or without ST-segment elevation.
Intervention. Patients were randomly assigned to receive either ticagrelor or prasugrel.
Main outcome measures. The primary end point was the composite of death, myocardial infarction, or stroke at 1 year. The secondary end point was bleeding.
Main results. At 1 year, a primary end point event occurred in 184 of 2012 patients (9.3%) in the ticagrelor group and 137 of 2006 patients (6.9%) in the prasugrel group (hazard ratio [HR], 1.36; 95% confidence interval [CI], 1.09-1.70; P = 0.006). In the comparison between
Conclusion. In patients who presented with ACS with or without ST-segment elevation, the incidence of death, myocardial infarction, or stroke was significantly lower among those who received prasugrel as compared to those who received ticagrelor, and incidence of major bleeding was not significantly different.
Commentary
Dual antiplatelet therapy combining an adenosine disphosphate (ADP) receptor antagonist and aspirin is standard treatment for patients presenting with ACS. The limitation of clopidogrel has been its modest antiplatelet effect, with substantial interpatient variability. The newer generation thienopyridine prasugrel and the reversible direct-acting oral antagonist of the ADP receptor ticagrelor provide consistent and greater antiplatelet effect compared to clopidogrel. It has been previously reported that these agents are superior in reducing ischemic events when compared to clopidogrel.1,2 Therefore, current guidelines recommend ticagrelor and prasugrel in preference to clopidogrel.3,4 However, there has been no large randomized controlled study comparing the effect of ticagrelor and prasugrel. In this context, Shupke et al investigated this clinical question by performing a well-designed multicenter randomized controlled trial in patients presenting with ACS. At 12-month follow-up, the composite of death, myocardial infarction, and stroke occurred more frequently in the ticagrelor group compared to the prasugrel group (9.3% versus 6.9%; HR, 1.36; 95% CI, 1.09-1.70; P < 0.01). The incidence of major bleeding was not significantly different between the 2 groups (5.4% versus 4.8%; P = 0.46).
The strengths of this current study include the randomized design and the large number of patients enrolled, with adequate power to evaluate for superiority. This was a multicenter trial in Europe with 23 participating centers (21 from Germany). Furthermore, the interventional technique used by the operators reflects more contemporary technique compared to the previous studies comparing each agent to clopidogrel,1,2 with more frequent use of radial access (37%) and drug-eluting stents (90%) and reduced use of GPIIb/IIIa inhibitors (12%).
There are a few important points to consider due to the differences between the 2 agents compared in this study. First, the loading dose of ticagrelor and prasugrel was administered differently in patients presenting with ACS without ST elevation. Ticagrelor was administered as soon as possible prior to the coronary angiogram, but prasugrel was administered after the coronary anatomy was defined prior to the intervention, which is how this agent is administered in current clinical practice. Therefore, this trial was an open-label study that compared not only different medications, but different administration strategies. Second, ticagrelor and prasugrel have different side-effect profiles. The side effects unique to ticagrelor are dyspnea and bradycardia. On the other hand, a contraindication unique to prasugrel is patients with a history of transient ischemic attack or stroke due to increased risk of thrombotic and hemorrhagic stroke.1 In addition, prasugrel has increased bleeding risk in patients older than 75 years of age and those with low body weight (< 60 kg). In this study, the overall medication discontinuation rate was higher in the ticagrelor group specifically due to dyspnea, and the reduced dose of 5 mg of prasugrel was used in patients older than 75 years or with low body weight.
Since the timing of administration of ticagrelor (preloading prior to coronary angiography is recommended) is similar to that of clopidogrel, and given the theoretical benefit of reversible inhibition of the ADP receptor, ticagrelor has been used more commonly in clinical practice than prasugrel, and it has been implemented in the ACS protocol in many hospitals. In light of the results from this first head-to-head comparison utilizing more contemporary interventional techniques, these protocols may need to be adjusted in favor of prasugrel for patients presenting with ACS. However, given the difference in timing of administration and the difference in side-effect profile, operators must also tailor these agents depending on the patient profile.
Applications for Clinical Practice
In patients presenting with ACS, prasugrel was superior to ticagrelor, with a lower composite of death, myocardial infarction, and stroke at 12 months. Prasugrel should be considered as a first-line treatment for ACS.
– Taishi Hirai, MD, and Arun Kumar, MD, University of Missouri, Columbia, MO
1. Wiviott SD, Braunwald E, McCabe CH, et al. Prasugrel versus clopidogrel in patients with acute coronary syndromes. N Engl J Med. 2007;357:2001-2015.
2. Wallentin L, Becker RC, Budaj A, et al. Ticagrelor versus clopidogrel in patients with acute coronary syndromes. N Engl J Med. 2009;361:1045-1057.
3. Ibanez B, James S, Agewall S, et al. 2017 ESC Guidelines for the management of acute myocardial infarction in patients presenting with ST-segment elevation: The Task Force for the management of acute myocardial infarction in patients presenting with ST-segment elevation of the European Society of Cardiology (ESC). Eur Heart J. 2018;39:119-177.
4. Levine GN, Bates ER, Bittl JA, et al. 2016 ACC/AHA guideline focused update on duration of dual antiplatelet therapy in patients with coronary artery disease: a report of the American College of Cardiology/American Heart Association Task Force on Clinical Practice Guidelines. J Am Coll Cardiol. 2016;68:1082-1115.
Study Overview
Objective. To assess the relative merits of ticagrelor compared to prasugrel in patients with acute coronary syndromes who will undergo invasive evaluation.
Design. Multicenter, open-label, prospective randomized controlled trial.
Setting and participants. A total of 4018 patients who presented with ACS with or without ST-segment elevation.
Intervention. Patients were randomly assigned to receive either ticagrelor or prasugrel.
Main outcome measures. The primary end point was the composite of death, myocardial infarction, or stroke at 1 year. The secondary end point was bleeding.
Main results. At 1 year, a primary end point event occurred in 184 of 2012 patients (9.3%) in the ticagrelor group and 137 of 2006 patients (6.9%) in the prasugrel group (hazard ratio [HR], 1.36; 95% confidence interval [CI], 1.09-1.70; P = 0.006). In the comparison between
Conclusion. In patients who presented with ACS with or without ST-segment elevation, the incidence of death, myocardial infarction, or stroke was significantly lower among those who received prasugrel as compared to those who received ticagrelor, and incidence of major bleeding was not significantly different.
Commentary
Dual antiplatelet therapy combining an adenosine disphosphate (ADP) receptor antagonist and aspirin is standard treatment for patients presenting with ACS. The limitation of clopidogrel has been its modest antiplatelet effect, with substantial interpatient variability. The newer generation thienopyridine prasugrel and the reversible direct-acting oral antagonist of the ADP receptor ticagrelor provide consistent and greater antiplatelet effect compared to clopidogrel. It has been previously reported that these agents are superior in reducing ischemic events when compared to clopidogrel.1,2 Therefore, current guidelines recommend ticagrelor and prasugrel in preference to clopidogrel.3,4 However, there has been no large randomized controlled study comparing the effect of ticagrelor and prasugrel. In this context, Shupke et al investigated this clinical question by performing a well-designed multicenter randomized controlled trial in patients presenting with ACS. At 12-month follow-up, the composite of death, myocardial infarction, and stroke occurred more frequently in the ticagrelor group compared to the prasugrel group (9.3% versus 6.9%; HR, 1.36; 95% CI, 1.09-1.70; P < 0.01). The incidence of major bleeding was not significantly different between the 2 groups (5.4% versus 4.8%; P = 0.46).
The strengths of this current study include the randomized design and the large number of patients enrolled, with adequate power to evaluate for superiority. This was a multicenter trial in Europe with 23 participating centers (21 from Germany). Furthermore, the interventional technique used by the operators reflects more contemporary technique compared to the previous studies comparing each agent to clopidogrel,1,2 with more frequent use of radial access (37%) and drug-eluting stents (90%) and reduced use of GPIIb/IIIa inhibitors (12%).
There are a few important points to consider due to the differences between the 2 agents compared in this study. First, the loading dose of ticagrelor and prasugrel was administered differently in patients presenting with ACS without ST elevation. Ticagrelor was administered as soon as possible prior to the coronary angiogram, but prasugrel was administered after the coronary anatomy was defined prior to the intervention, which is how this agent is administered in current clinical practice. Therefore, this trial was an open-label study that compared not only different medications, but different administration strategies. Second, ticagrelor and prasugrel have different side-effect profiles. The side effects unique to ticagrelor are dyspnea and bradycardia. On the other hand, a contraindication unique to prasugrel is patients with a history of transient ischemic attack or stroke due to increased risk of thrombotic and hemorrhagic stroke.1 In addition, prasugrel has increased bleeding risk in patients older than 75 years of age and those with low body weight (< 60 kg). In this study, the overall medication discontinuation rate was higher in the ticagrelor group specifically due to dyspnea, and the reduced dose of 5 mg of prasugrel was used in patients older than 75 years or with low body weight.
Since the timing of administration of ticagrelor (preloading prior to coronary angiography is recommended) is similar to that of clopidogrel, and given the theoretical benefit of reversible inhibition of the ADP receptor, ticagrelor has been used more commonly in clinical practice than prasugrel, and it has been implemented in the ACS protocol in many hospitals. In light of the results from this first head-to-head comparison utilizing more contemporary interventional techniques, these protocols may need to be adjusted in favor of prasugrel for patients presenting with ACS. However, given the difference in timing of administration and the difference in side-effect profile, operators must also tailor these agents depending on the patient profile.
Applications for Clinical Practice
In patients presenting with ACS, prasugrel was superior to ticagrelor, with a lower composite of death, myocardial infarction, and stroke at 12 months. Prasugrel should be considered as a first-line treatment for ACS.
– Taishi Hirai, MD, and Arun Kumar, MD, University of Missouri, Columbia, MO
Study Overview
Objective. To assess the relative merits of ticagrelor compared to prasugrel in patients with acute coronary syndromes who will undergo invasive evaluation.
Design. Multicenter, open-label, prospective randomized controlled trial.
Setting and participants. A total of 4018 patients who presented with ACS with or without ST-segment elevation.
Intervention. Patients were randomly assigned to receive either ticagrelor or prasugrel.
Main outcome measures. The primary end point was the composite of death, myocardial infarction, or stroke at 1 year. The secondary end point was bleeding.
Main results. At 1 year, a primary end point event occurred in 184 of 2012 patients (9.3%) in the ticagrelor group and 137 of 2006 patients (6.9%) in the prasugrel group (hazard ratio [HR], 1.36; 95% confidence interval [CI], 1.09-1.70; P = 0.006). In the comparison between
Conclusion. In patients who presented with ACS with or without ST-segment elevation, the incidence of death, myocardial infarction, or stroke was significantly lower among those who received prasugrel as compared to those who received ticagrelor, and incidence of major bleeding was not significantly different.
Commentary
Dual antiplatelet therapy combining an adenosine disphosphate (ADP) receptor antagonist and aspirin is standard treatment for patients presenting with ACS. The limitation of clopidogrel has been its modest antiplatelet effect, with substantial interpatient variability. The newer generation thienopyridine prasugrel and the reversible direct-acting oral antagonist of the ADP receptor ticagrelor provide consistent and greater antiplatelet effect compared to clopidogrel. It has been previously reported that these agents are superior in reducing ischemic events when compared to clopidogrel.1,2 Therefore, current guidelines recommend ticagrelor and prasugrel in preference to clopidogrel.3,4 However, there has been no large randomized controlled study comparing the effect of ticagrelor and prasugrel. In this context, Shupke et al investigated this clinical question by performing a well-designed multicenter randomized controlled trial in patients presenting with ACS. At 12-month follow-up, the composite of death, myocardial infarction, and stroke occurred more frequently in the ticagrelor group compared to the prasugrel group (9.3% versus 6.9%; HR, 1.36; 95% CI, 1.09-1.70; P < 0.01). The incidence of major bleeding was not significantly different between the 2 groups (5.4% versus 4.8%; P = 0.46).
The strengths of this current study include the randomized design and the large number of patients enrolled, with adequate power to evaluate for superiority. This was a multicenter trial in Europe with 23 participating centers (21 from Germany). Furthermore, the interventional technique used by the operators reflects more contemporary technique compared to the previous studies comparing each agent to clopidogrel,1,2 with more frequent use of radial access (37%) and drug-eluting stents (90%) and reduced use of GPIIb/IIIa inhibitors (12%).
There are a few important points to consider due to the differences between the 2 agents compared in this study. First, the loading dose of ticagrelor and prasugrel was administered differently in patients presenting with ACS without ST elevation. Ticagrelor was administered as soon as possible prior to the coronary angiogram, but prasugrel was administered after the coronary anatomy was defined prior to the intervention, which is how this agent is administered in current clinical practice. Therefore, this trial was an open-label study that compared not only different medications, but different administration strategies. Second, ticagrelor and prasugrel have different side-effect profiles. The side effects unique to ticagrelor are dyspnea and bradycardia. On the other hand, a contraindication unique to prasugrel is patients with a history of transient ischemic attack or stroke due to increased risk of thrombotic and hemorrhagic stroke.1 In addition, prasugrel has increased bleeding risk in patients older than 75 years of age and those with low body weight (< 60 kg). In this study, the overall medication discontinuation rate was higher in the ticagrelor group specifically due to dyspnea, and the reduced dose of 5 mg of prasugrel was used in patients older than 75 years or with low body weight.
Since the timing of administration of ticagrelor (preloading prior to coronary angiography is recommended) is similar to that of clopidogrel, and given the theoretical benefit of reversible inhibition of the ADP receptor, ticagrelor has been used more commonly in clinical practice than prasugrel, and it has been implemented in the ACS protocol in many hospitals. In light of the results from this first head-to-head comparison utilizing more contemporary interventional techniques, these protocols may need to be adjusted in favor of prasugrel for patients presenting with ACS. However, given the difference in timing of administration and the difference in side-effect profile, operators must also tailor these agents depending on the patient profile.
Applications for Clinical Practice
In patients presenting with ACS, prasugrel was superior to ticagrelor, with a lower composite of death, myocardial infarction, and stroke at 12 months. Prasugrel should be considered as a first-line treatment for ACS.
– Taishi Hirai, MD, and Arun Kumar, MD, University of Missouri, Columbia, MO
1. Wiviott SD, Braunwald E, McCabe CH, et al. Prasugrel versus clopidogrel in patients with acute coronary syndromes. N Engl J Med. 2007;357:2001-2015.
2. Wallentin L, Becker RC, Budaj A, et al. Ticagrelor versus clopidogrel in patients with acute coronary syndromes. N Engl J Med. 2009;361:1045-1057.
3. Ibanez B, James S, Agewall S, et al. 2017 ESC Guidelines for the management of acute myocardial infarction in patients presenting with ST-segment elevation: The Task Force for the management of acute myocardial infarction in patients presenting with ST-segment elevation of the European Society of Cardiology (ESC). Eur Heart J. 2018;39:119-177.
4. Levine GN, Bates ER, Bittl JA, et al. 2016 ACC/AHA guideline focused update on duration of dual antiplatelet therapy in patients with coronary artery disease: a report of the American College of Cardiology/American Heart Association Task Force on Clinical Practice Guidelines. J Am Coll Cardiol. 2016;68:1082-1115.
1. Wiviott SD, Braunwald E, McCabe CH, et al. Prasugrel versus clopidogrel in patients with acute coronary syndromes. N Engl J Med. 2007;357:2001-2015.
2. Wallentin L, Becker RC, Budaj A, et al. Ticagrelor versus clopidogrel in patients with acute coronary syndromes. N Engl J Med. 2009;361:1045-1057.
3. Ibanez B, James S, Agewall S, et al. 2017 ESC Guidelines for the management of acute myocardial infarction in patients presenting with ST-segment elevation: The Task Force for the management of acute myocardial infarction in patients presenting with ST-segment elevation of the European Society of Cardiology (ESC). Eur Heart J. 2018;39:119-177.
4. Levine GN, Bates ER, Bittl JA, et al. 2016 ACC/AHA guideline focused update on duration of dual antiplatelet therapy in patients with coronary artery disease: a report of the American College of Cardiology/American Heart Association Task Force on Clinical Practice Guidelines. J Am Coll Cardiol. 2016;68:1082-1115.
Combination Encorafenib, Cetuximab, and Binimetinib Improves Survival in BRAF V600E–Mutated Metastatic Colon Cancer
Study Overview
Objective. To evaluate whether the combination of encorafenib plus cetuximab with or without the MEK inhibitor binimetin
Design. Global, multicenter, randomized, open-label, phase 3 trial.
Intervention. Patients were randomized in a 1:1:1 fashion to 1 of 3 groups: triplet-therapy group (encorafenib 300 mg daily, binimetinib 45 mg twice daily, and cetuximab 400 mg/m2 of body surface area initially, then 250 mg/m2 weekly), doublet-therapy group (encorafenib and cetuximab in same doses and schedule as the triplet-therapy group), and control group (investigators choice of cetuximab and irinotecan or cetuximab and FOLFIRI). The randomization was stratified by performance status and prior irinotecan use. Treatment was given until progression or unacceptable toxicities on a 28-day cycle. No crossover was permitted.
Setting and participants. 665 patients underwent randomization: 224 patients to triplet-therapy, 220 to doublet-therapy, and 221 to the control group. Eligible patients had histologically confirmed metastatic colorectal cancer with a BRAF V600E mutation. Patients all had disease progression after 1 or 2 previous lines of therapy.
Main outcome measures. The primary end point of the study was OS and objective response rate (ORR) in the triplet-therapy group compared with the control group. Secondary endpoints included OS in the doublet-therapy group compared with the control group, as well as progression-free survival (PFS), duration of response (DOR), and safety. Assessments were performed every 6 weeks for the first 24 weeks and then every 12 weeks thereafter.
Results. The baseline characteristics were well balanced between the treatment arms. At the time of data cutoff, the median duration of follow-up was 7.8 months for each group. The median OS was 9 months in the triplet-therapy group and 5.4 months in the control group (hazard ratio [HR] for death, 0.52; 95% confidence interval [CI], 0.39-0.70; P < 0.001). The median OS was 8.4 months for the doublet-therapy group, resulting in a significant reduction in the risk of death compared with the control group (HR, 0.6; 95% CI, 0.45-0.79; P < 0.001). The estimated 6-month survival was 71% for the triplet-therapy group, 65% for the doublet-therapy group, and 47% for the control group. The triplet-therapy group had a higher ORR compared with the control group (26% versus 2%, P < 0.001). The ORR in the doublet-therapy group was also significantly higher than that in the control group (20% versus 2%, P < 0.001). Complete responses were seen in 4% of patients in the triplet-therapy group, 5% of the doublet-therapy group, and no patients in the control group. PFS was significantly longer in both the triplet-therapy and doublet-therapy groups compared with the control group (median PFS: 4.3 months, 4.2 months, 1.5 months, respectively). This translated into a 62% and 60% reduction in the risk for disease progression or death in the triplet-therapy and doublet-therapy groups, respectively, compared to the control group.
The most common adverse event reported in the triplet-therapy group was gastrointestinal (GI) related (diarrhea, nausea, and vomiting), with grade 3 or higher GI toxicity seen in 10% of patients. Skin toxicity in the form of acneiform dermatitis was seen in almost 50% of those in the triplet-therapy arm; however, grade 3 or higher skin toxicity was uncommon (2%). Overall, adverse events grade 3 or higher were observed in 58% of those in the triplet-therapy group, 50% in the doublet-therapy group, and 61% in the control group. Adverse events leading to drug discontinuation occurred in 7% in the triplet-therapy group, 8% in the doublet-therapy group, and 11% in the control group. Three deaths were considered treatment related: 1 in the triplet-therapy group (bowel perforation) and 2 in the control group (anaphylaxis and respiratory failure).
Conclusion. The triplet-combination of encorafenib, binimetinib, and cetuximab as well as the doublet-regimen of encorafenib and cetuximab improved both PFS and OS in patients with metastatic, BRAF V600E–mutated colorectal cancer that has progressed after 1 or 2 lines of therapy.
Commentary
The current interim analysis of the BEACON CRC trial demonstrates improved response rates, PFS, and, importantly, OS with the triplet regimen of encorafenib, binimetinib, and cetuximab in patients with metastatic BRAF V600E–mutated colorectal cancer compared to standard irinotecan-based therapy. Similarly, a doublet-regimen of encorafenib and cetuximab also improved outcomes compared with irinotecan-based chemotherapy, resulting in significantly higher response rates, PFS, and OS.
BRAF mutations are seen in approximately 5% to 15% of colorectal cancers and are more commonly seen in right-sided disease. BRAF-mutated colorectal cancer has a poor prognosis, and the presence of a BRAF mutation is an independent prognostic factor for decreased survival.1 Previous work to improve outcomes in this subset of patients has been largely disappointing. For example, Kopetz and colleagues have previously shown that single-agent BRAF inhibition with vemurafenib in metastatic BRAF-mutated colorectal cancer did not show meaningful clinical activity.2 Preclinical studies have suggested that single-agent BRAF or MEK inhibition alone do not lead to sustained MAPK pathway inhibition. Mechanistically, inhibition of BRAF has been shown to lead to feedback activation of EGFR; thus, inhibition of BRAF alone does not lead to cessation of proliferation.3 In light of this, the combination of EGFR and BRAF inhibition has been an attractive therapeutic strategy. Yaeger and colleagues enrolled 15 patients in a pilot study looking at the efficacy and safety of the BRAF inhibitor vemurafenib and the EGFR antibody panitumumab in patients with BRAF-mutated metastatic colorectal cancer. In this cohort, combined BRAF and EGFR inhibition showed tumor regression in 10 of 12 patients.4 This finding was validated in other subsequent studies.5
The current study is the first phase 3 trial to validate the efficacy of BRAF, MEK, and EGFR inhibition in patients with BRAF-mutant metastatic colorectal cancer. The results of this study represent a very important step forward in treating this patient cohort that has historically had very poor clinical outcomes. The combination of encorafenib, binimetinib, and cetuximab improved OS by 48% compared with standard irinotecan-based chemotherapy. In light of this, we now have a chemotherapy-free targeted combination that improves survival and likely represents the new standard of care in patients with BRAF-mutated colorectal cancer after progression on 1 or 2 prior lines of therapy. Ongoing trials are being pursued to investigate the efficacy of these combinations in the upfront setting, and the results of these trials are eagerly awaited.
Applications for Clinical Practice
The combination of encorafenib, binimetinib, and cetuximab improved OS in patients with BRAF-mutated metastatic colorectal cancer after progression on 1 or 2 prior lines of therapy. This combination represents a potential new standard of care in this patient population.
–Daniel Isaac, DO, MS
1. Souglakos J, Philips J, Wang, R, et al. Prognostic and predictive value of common mutations for treatment response and survival in patients with metastatic colorectal cancer. Br J Cancer. 2009;101:465-472.
2. Kopetz S, Desai J, Chan E, et al. Phase II pilot study of vemurafenib in patients with metastatic BRAF-mutated colorectal cancer. J Clin Oncol. 2015;33:4032-4038.
3. Prahallad A, Sun C, Huang S, et al. Unresponsiveness of colon cancer to BRAF (V600e) inhibition through feedback activation of EGFR. Nature. 2012;483:100-103.
4. Yaeger R, Cercek A, O’Reilly EM, et al. Pilot trial of combined BRAF and EGFR inhibition in BRAF-mutant metastatic colorectal cancer patients. Clin Cancer Res. 2015;21:1313-1320.
5. Van Geel EMJM, Tabernero J, Elez E, et al. A phase Ib dose-escalation study of encorafenib and cetuximab with or without alpelisib in metastatic BRAF-mutant colorectal cancer. Cancer Discov. 2017;7:610-619.
Study Overview
Objective. To evaluate whether the combination of encorafenib plus cetuximab with or without the MEK inhibitor binimetin
Design. Global, multicenter, randomized, open-label, phase 3 trial.
Intervention. Patients were randomized in a 1:1:1 fashion to 1 of 3 groups: triplet-therapy group (encorafenib 300 mg daily, binimetinib 45 mg twice daily, and cetuximab 400 mg/m2 of body surface area initially, then 250 mg/m2 weekly), doublet-therapy group (encorafenib and cetuximab in same doses and schedule as the triplet-therapy group), and control group (investigators choice of cetuximab and irinotecan or cetuximab and FOLFIRI). The randomization was stratified by performance status and prior irinotecan use. Treatment was given until progression or unacceptable toxicities on a 28-day cycle. No crossover was permitted.
Setting and participants. 665 patients underwent randomization: 224 patients to triplet-therapy, 220 to doublet-therapy, and 221 to the control group. Eligible patients had histologically confirmed metastatic colorectal cancer with a BRAF V600E mutation. Patients all had disease progression after 1 or 2 previous lines of therapy.
Main outcome measures. The primary end point of the study was OS and objective response rate (ORR) in the triplet-therapy group compared with the control group. Secondary endpoints included OS in the doublet-therapy group compared with the control group, as well as progression-free survival (PFS), duration of response (DOR), and safety. Assessments were performed every 6 weeks for the first 24 weeks and then every 12 weeks thereafter.
Results. The baseline characteristics were well balanced between the treatment arms. At the time of data cutoff, the median duration of follow-up was 7.8 months for each group. The median OS was 9 months in the triplet-therapy group and 5.4 months in the control group (hazard ratio [HR] for death, 0.52; 95% confidence interval [CI], 0.39-0.70; P < 0.001). The median OS was 8.4 months for the doublet-therapy group, resulting in a significant reduction in the risk of death compared with the control group (HR, 0.6; 95% CI, 0.45-0.79; P < 0.001). The estimated 6-month survival was 71% for the triplet-therapy group, 65% for the doublet-therapy group, and 47% for the control group. The triplet-therapy group had a higher ORR compared with the control group (26% versus 2%, P < 0.001). The ORR in the doublet-therapy group was also significantly higher than that in the control group (20% versus 2%, P < 0.001). Complete responses were seen in 4% of patients in the triplet-therapy group, 5% of the doublet-therapy group, and no patients in the control group. PFS was significantly longer in both the triplet-therapy and doublet-therapy groups compared with the control group (median PFS: 4.3 months, 4.2 months, 1.5 months, respectively). This translated into a 62% and 60% reduction in the risk for disease progression or death in the triplet-therapy and doublet-therapy groups, respectively, compared to the control group.
The most common adverse event reported in the triplet-therapy group was gastrointestinal (GI) related (diarrhea, nausea, and vomiting), with grade 3 or higher GI toxicity seen in 10% of patients. Skin toxicity in the form of acneiform dermatitis was seen in almost 50% of those in the triplet-therapy arm; however, grade 3 or higher skin toxicity was uncommon (2%). Overall, adverse events grade 3 or higher were observed in 58% of those in the triplet-therapy group, 50% in the doublet-therapy group, and 61% in the control group. Adverse events leading to drug discontinuation occurred in 7% in the triplet-therapy group, 8% in the doublet-therapy group, and 11% in the control group. Three deaths were considered treatment related: 1 in the triplet-therapy group (bowel perforation) and 2 in the control group (anaphylaxis and respiratory failure).
Conclusion. The triplet-combination of encorafenib, binimetinib, and cetuximab as well as the doublet-regimen of encorafenib and cetuximab improved both PFS and OS in patients with metastatic, BRAF V600E–mutated colorectal cancer that has progressed after 1 or 2 lines of therapy.
Commentary
The current interim analysis of the BEACON CRC trial demonstrates improved response rates, PFS, and, importantly, OS with the triplet regimen of encorafenib, binimetinib, and cetuximab in patients with metastatic BRAF V600E–mutated colorectal cancer compared to standard irinotecan-based therapy. Similarly, a doublet-regimen of encorafenib and cetuximab also improved outcomes compared with irinotecan-based chemotherapy, resulting in significantly higher response rates, PFS, and OS.
BRAF mutations are seen in approximately 5% to 15% of colorectal cancers and are more commonly seen in right-sided disease. BRAF-mutated colorectal cancer has a poor prognosis, and the presence of a BRAF mutation is an independent prognostic factor for decreased survival.1 Previous work to improve outcomes in this subset of patients has been largely disappointing. For example, Kopetz and colleagues have previously shown that single-agent BRAF inhibition with vemurafenib in metastatic BRAF-mutated colorectal cancer did not show meaningful clinical activity.2 Preclinical studies have suggested that single-agent BRAF or MEK inhibition alone do not lead to sustained MAPK pathway inhibition. Mechanistically, inhibition of BRAF has been shown to lead to feedback activation of EGFR; thus, inhibition of BRAF alone does not lead to cessation of proliferation.3 In light of this, the combination of EGFR and BRAF inhibition has been an attractive therapeutic strategy. Yaeger and colleagues enrolled 15 patients in a pilot study looking at the efficacy and safety of the BRAF inhibitor vemurafenib and the EGFR antibody panitumumab in patients with BRAF-mutated metastatic colorectal cancer. In this cohort, combined BRAF and EGFR inhibition showed tumor regression in 10 of 12 patients.4 This finding was validated in other subsequent studies.5
The current study is the first phase 3 trial to validate the efficacy of BRAF, MEK, and EGFR inhibition in patients with BRAF-mutant metastatic colorectal cancer. The results of this study represent a very important step forward in treating this patient cohort that has historically had very poor clinical outcomes. The combination of encorafenib, binimetinib, and cetuximab improved OS by 48% compared with standard irinotecan-based chemotherapy. In light of this, we now have a chemotherapy-free targeted combination that improves survival and likely represents the new standard of care in patients with BRAF-mutated colorectal cancer after progression on 1 or 2 prior lines of therapy. Ongoing trials are being pursued to investigate the efficacy of these combinations in the upfront setting, and the results of these trials are eagerly awaited.
Applications for Clinical Practice
The combination of encorafenib, binimetinib, and cetuximab improved OS in patients with BRAF-mutated metastatic colorectal cancer after progression on 1 or 2 prior lines of therapy. This combination represents a potential new standard of care in this patient population.
–Daniel Isaac, DO, MS
Study Overview
Objective. To evaluate whether the combination of encorafenib plus cetuximab with or without the MEK inhibitor binimetin
Design. Global, multicenter, randomized, open-label, phase 3 trial.
Intervention. Patients were randomized in a 1:1:1 fashion to 1 of 3 groups: triplet-therapy group (encorafenib 300 mg daily, binimetinib 45 mg twice daily, and cetuximab 400 mg/m2 of body surface area initially, then 250 mg/m2 weekly), doublet-therapy group (encorafenib and cetuximab in same doses and schedule as the triplet-therapy group), and control group (investigators choice of cetuximab and irinotecan or cetuximab and FOLFIRI). The randomization was stratified by performance status and prior irinotecan use. Treatment was given until progression or unacceptable toxicities on a 28-day cycle. No crossover was permitted.
Setting and participants. 665 patients underwent randomization: 224 patients to triplet-therapy, 220 to doublet-therapy, and 221 to the control group. Eligible patients had histologically confirmed metastatic colorectal cancer with a BRAF V600E mutation. Patients all had disease progression after 1 or 2 previous lines of therapy.
Main outcome measures. The primary end point of the study was OS and objective response rate (ORR) in the triplet-therapy group compared with the control group. Secondary endpoints included OS in the doublet-therapy group compared with the control group, as well as progression-free survival (PFS), duration of response (DOR), and safety. Assessments were performed every 6 weeks for the first 24 weeks and then every 12 weeks thereafter.
Results. The baseline characteristics were well balanced between the treatment arms. At the time of data cutoff, the median duration of follow-up was 7.8 months for each group. The median OS was 9 months in the triplet-therapy group and 5.4 months in the control group (hazard ratio [HR] for death, 0.52; 95% confidence interval [CI], 0.39-0.70; P < 0.001). The median OS was 8.4 months for the doublet-therapy group, resulting in a significant reduction in the risk of death compared with the control group (HR, 0.6; 95% CI, 0.45-0.79; P < 0.001). The estimated 6-month survival was 71% for the triplet-therapy group, 65% for the doublet-therapy group, and 47% for the control group. The triplet-therapy group had a higher ORR compared with the control group (26% versus 2%, P < 0.001). The ORR in the doublet-therapy group was also significantly higher than that in the control group (20% versus 2%, P < 0.001). Complete responses were seen in 4% of patients in the triplet-therapy group, 5% of the doublet-therapy group, and no patients in the control group. PFS was significantly longer in both the triplet-therapy and doublet-therapy groups compared with the control group (median PFS: 4.3 months, 4.2 months, 1.5 months, respectively). This translated into a 62% and 60% reduction in the risk for disease progression or death in the triplet-therapy and doublet-therapy groups, respectively, compared to the control group.
The most common adverse event reported in the triplet-therapy group was gastrointestinal (GI) related (diarrhea, nausea, and vomiting), with grade 3 or higher GI toxicity seen in 10% of patients. Skin toxicity in the form of acneiform dermatitis was seen in almost 50% of those in the triplet-therapy arm; however, grade 3 or higher skin toxicity was uncommon (2%). Overall, adverse events grade 3 or higher were observed in 58% of those in the triplet-therapy group, 50% in the doublet-therapy group, and 61% in the control group. Adverse events leading to drug discontinuation occurred in 7% in the triplet-therapy group, 8% in the doublet-therapy group, and 11% in the control group. Three deaths were considered treatment related: 1 in the triplet-therapy group (bowel perforation) and 2 in the control group (anaphylaxis and respiratory failure).
Conclusion. The triplet-combination of encorafenib, binimetinib, and cetuximab as well as the doublet-regimen of encorafenib and cetuximab improved both PFS and OS in patients with metastatic, BRAF V600E–mutated colorectal cancer that has progressed after 1 or 2 lines of therapy.
Commentary
The current interim analysis of the BEACON CRC trial demonstrates improved response rates, PFS, and, importantly, OS with the triplet regimen of encorafenib, binimetinib, and cetuximab in patients with metastatic BRAF V600E–mutated colorectal cancer compared to standard irinotecan-based therapy. Similarly, a doublet-regimen of encorafenib and cetuximab also improved outcomes compared with irinotecan-based chemotherapy, resulting in significantly higher response rates, PFS, and OS.
BRAF mutations are seen in approximately 5% to 15% of colorectal cancers and are more commonly seen in right-sided disease. BRAF-mutated colorectal cancer has a poor prognosis, and the presence of a BRAF mutation is an independent prognostic factor for decreased survival.1 Previous work to improve outcomes in this subset of patients has been largely disappointing. For example, Kopetz and colleagues have previously shown that single-agent BRAF inhibition with vemurafenib in metastatic BRAF-mutated colorectal cancer did not show meaningful clinical activity.2 Preclinical studies have suggested that single-agent BRAF or MEK inhibition alone do not lead to sustained MAPK pathway inhibition. Mechanistically, inhibition of BRAF has been shown to lead to feedback activation of EGFR; thus, inhibition of BRAF alone does not lead to cessation of proliferation.3 In light of this, the combination of EGFR and BRAF inhibition has been an attractive therapeutic strategy. Yaeger and colleagues enrolled 15 patients in a pilot study looking at the efficacy and safety of the BRAF inhibitor vemurafenib and the EGFR antibody panitumumab in patients with BRAF-mutated metastatic colorectal cancer. In this cohort, combined BRAF and EGFR inhibition showed tumor regression in 10 of 12 patients.4 This finding was validated in other subsequent studies.5
The current study is the first phase 3 trial to validate the efficacy of BRAF, MEK, and EGFR inhibition in patients with BRAF-mutant metastatic colorectal cancer. The results of this study represent a very important step forward in treating this patient cohort that has historically had very poor clinical outcomes. The combination of encorafenib, binimetinib, and cetuximab improved OS by 48% compared with standard irinotecan-based chemotherapy. In light of this, we now have a chemotherapy-free targeted combination that improves survival and likely represents the new standard of care in patients with BRAF-mutated colorectal cancer after progression on 1 or 2 prior lines of therapy. Ongoing trials are being pursued to investigate the efficacy of these combinations in the upfront setting, and the results of these trials are eagerly awaited.
Applications for Clinical Practice
The combination of encorafenib, binimetinib, and cetuximab improved OS in patients with BRAF-mutated metastatic colorectal cancer after progression on 1 or 2 prior lines of therapy. This combination represents a potential new standard of care in this patient population.
–Daniel Isaac, DO, MS
1. Souglakos J, Philips J, Wang, R, et al. Prognostic and predictive value of common mutations for treatment response and survival in patients with metastatic colorectal cancer. Br J Cancer. 2009;101:465-472.
2. Kopetz S, Desai J, Chan E, et al. Phase II pilot study of vemurafenib in patients with metastatic BRAF-mutated colorectal cancer. J Clin Oncol. 2015;33:4032-4038.
3. Prahallad A, Sun C, Huang S, et al. Unresponsiveness of colon cancer to BRAF (V600e) inhibition through feedback activation of EGFR. Nature. 2012;483:100-103.
4. Yaeger R, Cercek A, O’Reilly EM, et al. Pilot trial of combined BRAF and EGFR inhibition in BRAF-mutant metastatic colorectal cancer patients. Clin Cancer Res. 2015;21:1313-1320.
5. Van Geel EMJM, Tabernero J, Elez E, et al. A phase Ib dose-escalation study of encorafenib and cetuximab with or without alpelisib in metastatic BRAF-mutant colorectal cancer. Cancer Discov. 2017;7:610-619.
1. Souglakos J, Philips J, Wang, R, et al. Prognostic and predictive value of common mutations for treatment response and survival in patients with metastatic colorectal cancer. Br J Cancer. 2009;101:465-472.
2. Kopetz S, Desai J, Chan E, et al. Phase II pilot study of vemurafenib in patients with metastatic BRAF-mutated colorectal cancer. J Clin Oncol. 2015;33:4032-4038.
3. Prahallad A, Sun C, Huang S, et al. Unresponsiveness of colon cancer to BRAF (V600e) inhibition through feedback activation of EGFR. Nature. 2012;483:100-103.
4. Yaeger R, Cercek A, O’Reilly EM, et al. Pilot trial of combined BRAF and EGFR inhibition in BRAF-mutant metastatic colorectal cancer patients. Clin Cancer Res. 2015;21:1313-1320.
5. Van Geel EMJM, Tabernero J, Elez E, et al. A phase Ib dose-escalation study of encorafenib and cetuximab with or without alpelisib in metastatic BRAF-mutant colorectal cancer. Cancer Discov. 2017;7:610-619.
Quantifying the EHR connection to burnout
While plenty of anecdotal and other evidence exists to connect the use of electronic health records to physician burnout, new research puts a more standard, quantifiable measure to it in an effort to help measure progress in improving the usability of EHRs.

Researchers used the System Usability Scale (SUS), “favored as an industry standard as a short, simple, and reliable measurement of technology usability with solid benchmarks to easily interpret its results, as the measure in this research, Edward Melnick, MD, of Yale University, New Haven, Conn., and colleagues wrote in Mayo Clinic Proceedings.
“The previous studies have definitely hinted at [the link between EHRs and burnout], but never really quantified it,” Dr. Melnick said in an interview.
Among the 870 physicians evaluating their EHRs’ usability, the mean score on a scale of 0-100 (higher being more usable) was 45.9. As a point of comparison, Microsoft Excel has an SUS score of 57, digital video recorders score 74, Amazon scores 82, microwave ovens score 87, and Google search scores 93.
“A score of 45.9 is in the bottom 9% of usability scores across studies in other industries and is categorized as in the ‘not acceptable’ range with a grade of F,” the authors wrote. “In aggregate, 733 of 870 (84.2%) of respondents rated their EHR less than 68 on the SUS, the average score across industries.”
In tying the SUS results to burnout, which was measured using the Maslach Burnout Inventory, the authors noted that the scores “were strongly and independently associated with physician burnout in a dose-response relationship. The odds of burnout were lower for each 1 point more favorable SUS score, a finding that persisted after adjusting for an extensive array of other personal and professional characteristics. The relationship between SUS score and burnout also persisted when emotional exhaustion and depersonalization were treated as continuous variables.”
The authors did note that, despite the strong relationship, they could not determine a causation given the cross-sectional nature of the data.
“I’m hoping that this paper will spark conversation and drive change and be a way of tracking improvements,” Dr. Melnick said. “So, if you bring in something new and say this is going to be better, how do you know it is going to be better? Well maybe you measure it using the System Usability Scale” to give it a quantifiable measure of improvement. He said it is an advantage “of having a metric that has been standardized and used in other industries,” allowing EHR stakeholders to measure improvement. “Once you can measure it, you can manage it and make improvements faster.”
The findings “will not come as a surprise to anyone who practices medicine,” Patrice Harris, MD, president of the American Medical Association, said in a statement. “It is a national imperative to overhaul the design and use of EHRs and reframe the technology to focus primarily on its most critical function: helping physicians care for patients. Significantly enhancing EHR usability is key and the AMA is working to ensure a new generation of EHRs are designed to prioritize time with patients, rather than overload physicians with type-and-click tasks.”
Funding for the study was provided by the Stanford Medicine WebMD Center, AMA, and the Mayo Clinic Department of Medicine Program on Physician Well-Being. No conflicts of interest were reported by the authors.
SOURCE: Melnick E et al. Mayo Clinic Proceedings 2019 Nov 14. doi: 10.1016/j.mayocp.2019.09.024.
While plenty of anecdotal and other evidence exists to connect the use of electronic health records to physician burnout, new research puts a more standard, quantifiable measure to it in an effort to help measure progress in improving the usability of EHRs.
Researchers used the System Usability Scale (SUS), “favored as an industry standard as a short, simple, and reliable measurement of technology usability with solid benchmarks to easily interpret its results, as the measure in this research, Edward Melnick, MD, of Yale University, New Haven, Conn., and colleagues wrote in Mayo Clinic Proceedings.
“The previous studies have definitely hinted at [the link between EHRs and burnout], but never really quantified it,” Dr. Melnick said in an interview.
Among the 870 physicians evaluating their EHRs’ usability, the mean score on a scale of 0-100 (higher being more usable) was 45.9. As a point of comparison, Microsoft Excel has an SUS score of 57, digital video recorders score 74, Amazon scores 82, microwave ovens score 87, and Google search scores 93.
“A score of 45.9 is in the bottom 9% of usability scores across studies in other industries and is categorized as in the ‘not acceptable’ range with a grade of F,” the authors wrote. “In aggregate, 733 of 870 (84.2%) of respondents rated their EHR less than 68 on the SUS, the average score across industries.”
In tying the SUS results to burnout, which was measured using the Maslach Burnout Inventory, the authors noted that the scores “were strongly and independently associated with physician burnout in a dose-response relationship. The odds of burnout were lower for each 1 point more favorable SUS score, a finding that persisted after adjusting for an extensive array of other personal and professional characteristics. The relationship between SUS score and burnout also persisted when emotional exhaustion and depersonalization were treated as continuous variables.”
The authors did note that, despite the strong relationship, they could not determine a causation given the cross-sectional nature of the data.
“I’m hoping that this paper will spark conversation and drive change and be a way of tracking improvements,” Dr. Melnick said. “So, if you bring in something new and say this is going to be better, how do you know it is going to be better? Well maybe you measure it using the System Usability Scale” to give it a quantifiable measure of improvement. He said it is an advantage “of having a metric that has been standardized and used in other industries,” allowing EHR stakeholders to measure improvement. “Once you can measure it, you can manage it and make improvements faster.”
The findings “will not come as a surprise to anyone who practices medicine,” Patrice Harris, MD, president of the American Medical Association, said in a statement. “It is a national imperative to overhaul the design and use of EHRs and reframe the technology to focus primarily on its most critical function: helping physicians care for patients. Significantly enhancing EHR usability is key and the AMA is working to ensure a new generation of EHRs are designed to prioritize time with patients, rather than overload physicians with type-and-click tasks.”
Funding for the study was provided by the Stanford Medicine WebMD Center, AMA, and the Mayo Clinic Department of Medicine Program on Physician Well-Being. No conflicts of interest were reported by the authors.
SOURCE: Melnick E et al. Mayo Clinic Proceedings 2019 Nov 14. doi: 10.1016/j.mayocp.2019.09.024.
While plenty of anecdotal and other evidence exists to connect the use of electronic health records to physician burnout, new research puts a more standard, quantifiable measure to it in an effort to help measure progress in improving the usability of EHRs.
Researchers used the System Usability Scale (SUS), “favored as an industry standard as a short, simple, and reliable measurement of technology usability with solid benchmarks to easily interpret its results, as the measure in this research, Edward Melnick, MD, of Yale University, New Haven, Conn., and colleagues wrote in Mayo Clinic Proceedings.
“The previous studies have definitely hinted at [the link between EHRs and burnout], but never really quantified it,” Dr. Melnick said in an interview.
Among the 870 physicians evaluating their EHRs’ usability, the mean score on a scale of 0-100 (higher being more usable) was 45.9. As a point of comparison, Microsoft Excel has an SUS score of 57, digital video recorders score 74, Amazon scores 82, microwave ovens score 87, and Google search scores 93.
“A score of 45.9 is in the bottom 9% of usability scores across studies in other industries and is categorized as in the ‘not acceptable’ range with a grade of F,” the authors wrote. “In aggregate, 733 of 870 (84.2%) of respondents rated their EHR less than 68 on the SUS, the average score across industries.”
In tying the SUS results to burnout, which was measured using the Maslach Burnout Inventory, the authors noted that the scores “were strongly and independently associated with physician burnout in a dose-response relationship. The odds of burnout were lower for each 1 point more favorable SUS score, a finding that persisted after adjusting for an extensive array of other personal and professional characteristics. The relationship between SUS score and burnout also persisted when emotional exhaustion and depersonalization were treated as continuous variables.”
The authors did note that, despite the strong relationship, they could not determine a causation given the cross-sectional nature of the data.
“I’m hoping that this paper will spark conversation and drive change and be a way of tracking improvements,” Dr. Melnick said. “So, if you bring in something new and say this is going to be better, how do you know it is going to be better? Well maybe you measure it using the System Usability Scale” to give it a quantifiable measure of improvement. He said it is an advantage “of having a metric that has been standardized and used in other industries,” allowing EHR stakeholders to measure improvement. “Once you can measure it, you can manage it and make improvements faster.”
The findings “will not come as a surprise to anyone who practices medicine,” Patrice Harris, MD, president of the American Medical Association, said in a statement. “It is a national imperative to overhaul the design and use of EHRs and reframe the technology to focus primarily on its most critical function: helping physicians care for patients. Significantly enhancing EHR usability is key and the AMA is working to ensure a new generation of EHRs are designed to prioritize time with patients, rather than overload physicians with type-and-click tasks.”
Funding for the study was provided by the Stanford Medicine WebMD Center, AMA, and the Mayo Clinic Department of Medicine Program on Physician Well-Being. No conflicts of interest were reported by the authors.
SOURCE: Melnick E et al. Mayo Clinic Proceedings 2019 Nov 14. doi: 10.1016/j.mayocp.2019.09.024.
FROM MAYO CLINIC PROCEEDINGS
CDC finds that efforts to reduce new HIV infections have stalled
, according to a Vital Signs report published by the Centers for Disease Control and Prevention based upon a simultaneous MMWR Early Release. The report indicates that many Americans with HIV are not aware of their status or are not receiving effective treatment. Furthermore, the data suggest that few Americans who could benefit from preexposure prophylaxis (PrEP), a daily pill that prevents HIV, are receiving it.
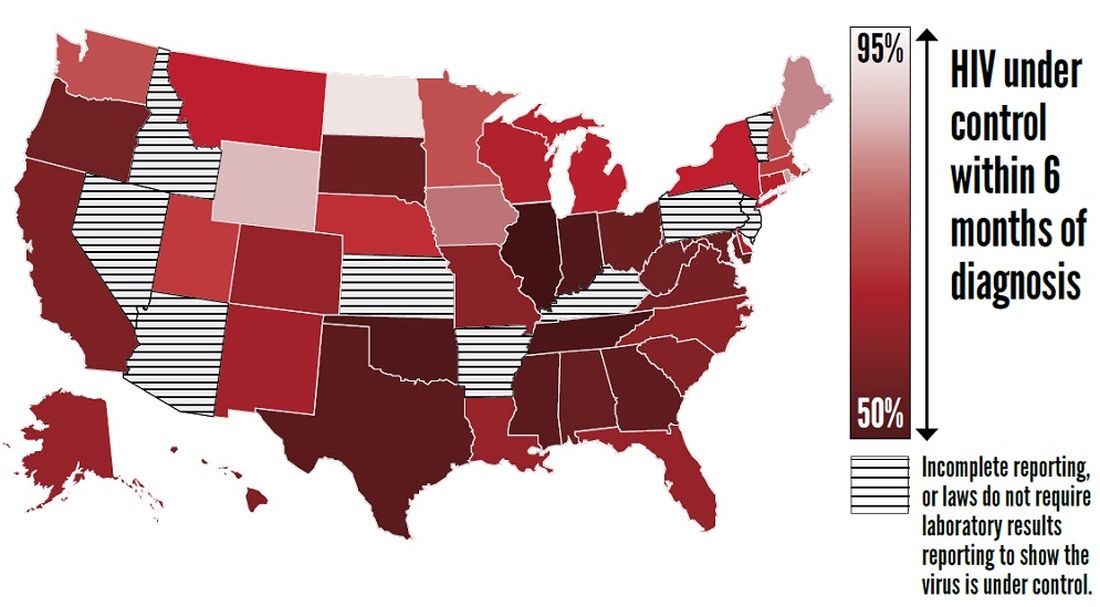
The report “shows that HIV testing, treatment, and prevention have not reached enough Americans, and it emphasizes the continued urgent need to increase these interventions,” said Jay C. Butler, MD, deputy director for infectious diseases at the CDC, at a press conference. “We made a lot of progress in the late ’90s and into the early part of the 21st century in reducing the number of new cases of HIV. But HIV prevention progress has stalled in America since 2013. This stalling underscores the need to increase resources, deploy new technologies, and build expertise, particularly in areas where they’re needed most.”
To achieve these objectives, the CDC has proposed a federal initiative called Ending the HIV Epidemic: A Plan for America. The goal of the initiative is to reduce new HIV infections by 90% by 2030, in part by expanding access to PrEP medications.
Data suggest shortcomings in diagnosis, treatment, and prevention
In its review of data on HIV testing and treatment in 2017, the Vital Signs report found that approximately 154,000 people with HIV (that is, 14% of the total population with HIV) were unaware that they had the virus. These patients consequently could not take advantage of HIV treatment to maintain health, control the virus, and prevent HIV transmission. Young people aged 13-24 years were less likely to know their HIV status than did those aged 25 years and older, according to the report.
Furthermore, approximately two-thirds (63%) of patients who knew that they had HIV had the virus under control through effective treatment. Young people and African Americans were least likely to have the virus under control, according to the report.
The report also examines data about treatment with PrEP in 2018. About 1.2 million Americans could benefit from PrEP, but only 219,700 (18%) of them had received a prescription for the drug. The eligible groups with the lowest rates of coverage were young people, African Americans, and Latinos.
The report presents a conservative estimate of PrEP coverage, however. Researchers examined data from 92% of prescriptions from retail pharmacies in the United States but did not include prescriptions from closed health care systems such as managed care organizations and military health plans. PrEP coverage in 2018 likely was higher than these estimates indicate, according to the CDC.
“There has been a rapid increase in the number of people taking PrEP over the past 3 years, but there is no doubt that PrEP uptake is too low,” said Eugene McCray, MD, director of CDC’s division of HIV/AIDS prevention. “We are working hard to increase access to PrEP, especially among gay and bisexual men, women, transgender people, young people, African Americans, and Latinos.”
The rate of new HIV infections has not decreased, but remained stable, according to the report. The CDC estimates that there were about 38,000 new infections per year from 2013 to 2017.
Proposed initiative focuses on areas of greatest need
The proposed Ending the HIV Epidemic initiative, if it is funded, will target the locations of greatest need throughout the country. Its initial focus will be on 50 areas that account for more than half of new HIV diagnoses, including 48 counties; San Juan, Puerto Rico; and Washington, D.C. It also will direct resources to seven states with high rates of infection in rural areas. In a second phase, the initiative will expand nationwide, provided that additional resources are made available.
The proposed initiative relies on four science-based strategies. First, it will aim to diagnose all Americans with HIV (at least 95% of HIV infections) as early as possible. Second, the initiative will enable people with HIV to receive treatment rapidly and effectively. The CDC’s target is to achieve viral suppression in at least 95% of people with diagnosed HIV. Third, the initiative will use proven interventions such as PrEP and syringe services programs to prevent new HIV transmissions. One related goal is for at least 50% of people who could benefit from PrEP to receive a prescription. Finally, the initiative is intended to respond quickly to potential HIV outbreaks and provide prevention and treatment to those who need them.
The U.S. Department of Health & Human Services already has taken steps to enable the initiative to be implemented quickly if it is funded in 2020. The department has provided funding to Baltimore City, Md.; DeKalb County, Ga.; and East Baton Rouge Parish, La. to begin pursuing parts of the initiative. These communities are encouraged to share the lessons of their experiences with other communities. HHS also has supported local efforts to develop plans under the initiative in all priority geographic areas. These plans draw upon recommendations from the community, HIV-planning bodies, and health care providers.
“Ending the HIV epidemic would be one of the greatest public health triumphs in our nation’s history,” said Dr. McCray.
SOURCES: Centers for Disease Control and Prevention. CDC Vital Signs. 2019 Dec 3. and Harris NS et al. MMWR Morb Mortal Wkly Rep. 2019 Dec 3.
, according to a Vital Signs report published by the Centers for Disease Control and Prevention based upon a simultaneous MMWR Early Release. The report indicates that many Americans with HIV are not aware of their status or are not receiving effective treatment. Furthermore, the data suggest that few Americans who could benefit from preexposure prophylaxis (PrEP), a daily pill that prevents HIV, are receiving it.
The report “shows that HIV testing, treatment, and prevention have not reached enough Americans, and it emphasizes the continued urgent need to increase these interventions,” said Jay C. Butler, MD, deputy director for infectious diseases at the CDC, at a press conference. “We made a lot of progress in the late ’90s and into the early part of the 21st century in reducing the number of new cases of HIV. But HIV prevention progress has stalled in America since 2013. This stalling underscores the need to increase resources, deploy new technologies, and build expertise, particularly in areas where they’re needed most.”
To achieve these objectives, the CDC has proposed a federal initiative called Ending the HIV Epidemic: A Plan for America. The goal of the initiative is to reduce new HIV infections by 90% by 2030, in part by expanding access to PrEP medications.
Data suggest shortcomings in diagnosis, treatment, and prevention
In its review of data on HIV testing and treatment in 2017, the Vital Signs report found that approximately 154,000 people with HIV (that is, 14% of the total population with HIV) were unaware that they had the virus. These patients consequently could not take advantage of HIV treatment to maintain health, control the virus, and prevent HIV transmission. Young people aged 13-24 years were less likely to know their HIV status than did those aged 25 years and older, according to the report.
Furthermore, approximately two-thirds (63%) of patients who knew that they had HIV had the virus under control through effective treatment. Young people and African Americans were least likely to have the virus under control, according to the report.
The report also examines data about treatment with PrEP in 2018. About 1.2 million Americans could benefit from PrEP, but only 219,700 (18%) of them had received a prescription for the drug. The eligible groups with the lowest rates of coverage were young people, African Americans, and Latinos.
The report presents a conservative estimate of PrEP coverage, however. Researchers examined data from 92% of prescriptions from retail pharmacies in the United States but did not include prescriptions from closed health care systems such as managed care organizations and military health plans. PrEP coverage in 2018 likely was higher than these estimates indicate, according to the CDC.
“There has been a rapid increase in the number of people taking PrEP over the past 3 years, but there is no doubt that PrEP uptake is too low,” said Eugene McCray, MD, director of CDC’s division of HIV/AIDS prevention. “We are working hard to increase access to PrEP, especially among gay and bisexual men, women, transgender people, young people, African Americans, and Latinos.”
The rate of new HIV infections has not decreased, but remained stable, according to the report. The CDC estimates that there were about 38,000 new infections per year from 2013 to 2017.
Proposed initiative focuses on areas of greatest need
The proposed Ending the HIV Epidemic initiative, if it is funded, will target the locations of greatest need throughout the country. Its initial focus will be on 50 areas that account for more than half of new HIV diagnoses, including 48 counties; San Juan, Puerto Rico; and Washington, D.C. It also will direct resources to seven states with high rates of infection in rural areas. In a second phase, the initiative will expand nationwide, provided that additional resources are made available.
The proposed initiative relies on four science-based strategies. First, it will aim to diagnose all Americans with HIV (at least 95% of HIV infections) as early as possible. Second, the initiative will enable people with HIV to receive treatment rapidly and effectively. The CDC’s target is to achieve viral suppression in at least 95% of people with diagnosed HIV. Third, the initiative will use proven interventions such as PrEP and syringe services programs to prevent new HIV transmissions. One related goal is for at least 50% of people who could benefit from PrEP to receive a prescription. Finally, the initiative is intended to respond quickly to potential HIV outbreaks and provide prevention and treatment to those who need them.
The U.S. Department of Health & Human Services already has taken steps to enable the initiative to be implemented quickly if it is funded in 2020. The department has provided funding to Baltimore City, Md.; DeKalb County, Ga.; and East Baton Rouge Parish, La. to begin pursuing parts of the initiative. These communities are encouraged to share the lessons of their experiences with other communities. HHS also has supported local efforts to develop plans under the initiative in all priority geographic areas. These plans draw upon recommendations from the community, HIV-planning bodies, and health care providers.
“Ending the HIV epidemic would be one of the greatest public health triumphs in our nation’s history,” said Dr. McCray.
SOURCES: Centers for Disease Control and Prevention. CDC Vital Signs. 2019 Dec 3. and Harris NS et al. MMWR Morb Mortal Wkly Rep. 2019 Dec 3.
, according to a Vital Signs report published by the Centers for Disease Control and Prevention based upon a simultaneous MMWR Early Release. The report indicates that many Americans with HIV are not aware of their status or are not receiving effective treatment. Furthermore, the data suggest that few Americans who could benefit from preexposure prophylaxis (PrEP), a daily pill that prevents HIV, are receiving it.
The report “shows that HIV testing, treatment, and prevention have not reached enough Americans, and it emphasizes the continued urgent need to increase these interventions,” said Jay C. Butler, MD, deputy director for infectious diseases at the CDC, at a press conference. “We made a lot of progress in the late ’90s and into the early part of the 21st century in reducing the number of new cases of HIV. But HIV prevention progress has stalled in America since 2013. This stalling underscores the need to increase resources, deploy new technologies, and build expertise, particularly in areas where they’re needed most.”
To achieve these objectives, the CDC has proposed a federal initiative called Ending the HIV Epidemic: A Plan for America. The goal of the initiative is to reduce new HIV infections by 90% by 2030, in part by expanding access to PrEP medications.
Data suggest shortcomings in diagnosis, treatment, and prevention
In its review of data on HIV testing and treatment in 2017, the Vital Signs report found that approximately 154,000 people with HIV (that is, 14% of the total population with HIV) were unaware that they had the virus. These patients consequently could not take advantage of HIV treatment to maintain health, control the virus, and prevent HIV transmission. Young people aged 13-24 years were less likely to know their HIV status than did those aged 25 years and older, according to the report.
Furthermore, approximately two-thirds (63%) of patients who knew that they had HIV had the virus under control through effective treatment. Young people and African Americans were least likely to have the virus under control, according to the report.
The report also examines data about treatment with PrEP in 2018. About 1.2 million Americans could benefit from PrEP, but only 219,700 (18%) of them had received a prescription for the drug. The eligible groups with the lowest rates of coverage were young people, African Americans, and Latinos.
The report presents a conservative estimate of PrEP coverage, however. Researchers examined data from 92% of prescriptions from retail pharmacies in the United States but did not include prescriptions from closed health care systems such as managed care organizations and military health plans. PrEP coverage in 2018 likely was higher than these estimates indicate, according to the CDC.
“There has been a rapid increase in the number of people taking PrEP over the past 3 years, but there is no doubt that PrEP uptake is too low,” said Eugene McCray, MD, director of CDC’s division of HIV/AIDS prevention. “We are working hard to increase access to PrEP, especially among gay and bisexual men, women, transgender people, young people, African Americans, and Latinos.”
The rate of new HIV infections has not decreased, but remained stable, according to the report. The CDC estimates that there were about 38,000 new infections per year from 2013 to 2017.
Proposed initiative focuses on areas of greatest need
The proposed Ending the HIV Epidemic initiative, if it is funded, will target the locations of greatest need throughout the country. Its initial focus will be on 50 areas that account for more than half of new HIV diagnoses, including 48 counties; San Juan, Puerto Rico; and Washington, D.C. It also will direct resources to seven states with high rates of infection in rural areas. In a second phase, the initiative will expand nationwide, provided that additional resources are made available.
The proposed initiative relies on four science-based strategies. First, it will aim to diagnose all Americans with HIV (at least 95% of HIV infections) as early as possible. Second, the initiative will enable people with HIV to receive treatment rapidly and effectively. The CDC’s target is to achieve viral suppression in at least 95% of people with diagnosed HIV. Third, the initiative will use proven interventions such as PrEP and syringe services programs to prevent new HIV transmissions. One related goal is for at least 50% of people who could benefit from PrEP to receive a prescription. Finally, the initiative is intended to respond quickly to potential HIV outbreaks and provide prevention and treatment to those who need them.
The U.S. Department of Health & Human Services already has taken steps to enable the initiative to be implemented quickly if it is funded in 2020. The department has provided funding to Baltimore City, Md.; DeKalb County, Ga.; and East Baton Rouge Parish, La. to begin pursuing parts of the initiative. These communities are encouraged to share the lessons of their experiences with other communities. HHS also has supported local efforts to develop plans under the initiative in all priority geographic areas. These plans draw upon recommendations from the community, HIV-planning bodies, and health care providers.
“Ending the HIV epidemic would be one of the greatest public health triumphs in our nation’s history,” said Dr. McCray.
SOURCES: Centers for Disease Control and Prevention. CDC Vital Signs. 2019 Dec 3. and Harris NS et al. MMWR Morb Mortal Wkly Rep. 2019 Dec 3.
FROM THE CDC
Early colonoscopy for acute lower GI bleeding fails to improve diagnostic yield or reduce rebleeding rate
While generally recommended for diagnosis and treatment of severe bleeding, early colonoscopy did not improve stigmata identification or reduce rebleeding rates in patients admitted for acute lower gastrointestinal bleeding in a relatively large, multicenter randomized trial, investigators report.
The proportion of patients with identified stigmata of recent hemorrhage (SRH) was not statistically significantly different between groups of patients who had early colonoscopy versus those who had a procedure 24 hours or more after admission, according to results of the 170-patient randomized study.
Although rebleeding rate was only a secondary endpoint, a larger study would be “unlikely to show a benefit” of the urgent approach, said investigators led by Ryota Niikura, MD, PhD, of the department of gastroenterology in the graduate school of medicine at the University of Tokyo.
“Our results for rebleeding suggested that early colonoscopy does not improve rebleeding outcomes, even if we chose rebleeding as the primary outcome,” Dr. Niikura and colleagues said in a discussion of the results, which appear in Gastroenterology.
Leading up to this trial, there was “controversy” over whether early colonoscopy could improve significant clinical outcomes such as rebleeding, transfusion need, and mortality, according to the authors, who said this is the largest of four randomized, controlled trials reported on the subject to date, and the first multicenter trial among that group.
One of those randomized studies, reported by Green and colleagues in the American Journal of Gastroenterology in 2005, found no differences in mortality, hospital stay, intensive care unit stay, transfusion requirements, rebleeding, or surgery for urgent colonoscopy versus care provided according to a standard algorithm.
Similarly, Laine and Shah said urgent colonoscopy had no edge over routine elective colonoscopy in terms of clinical outcomes or lowering costs, in a randomized study reported in 2010, also in the American Journal of Gastroenterology.
In September 2019, van Rongen and colleagues reported results of the BLEED study of early versus standard colonoscopy. Length of hospital stay was significantly shorter among patients randomized to the urgent approach; however, the rate of recurrent bleeding and hospital readmission was significantly higher in that group, according to results published in the Journal of Clinical Gastroenterology.
Two out of three of the previous randomized trials also showed no improvement in diagnostic yield with early colonoscopy, though “some meta-analyses” do suggest such a benefit, Dr. Niikura and coauthors said.
The latest reported randomized trial by Dr. Niikura and coinvestigators included patients 20 years of age or older who had moderate to severe hematochezia or melena within 24 hours of admission. A total of 162 adult patients at 15 hospitals in Japan were randomized to undergo early colonoscopy within 24 hours, or elective colonoscopy between 24 and 72 hours.
The primary outcome, identification of SRH, was not significantly different for the early versus later colonoscopy. Investigators said SRH was observed in 17 of 79 patients undergoing early colonoscopy or 21.5%, and in 17 of 80 patients in the elective colonoscopy group, or 21.3% (P = .967).
Similar rates of SRH between early and elective colonoscopy is a finding “in line” with the two of three previous randomized trials that found no increase in diagnostic yield, Dr. Niikura and coinvestigators noted in their report.
Rebleeding within 30 days, the “key secondary outcome” of the study according to investigators, was seen in 11 of 72 patients in the early colonoscopy group, or 15.3%, and in 5 of 75 patients in the elective colonoscopy group, or 6.7%, for a difference of 8.6 percentage points (95% confidence interval, –1.4 to 18.7).
Taken together, these findings suggest that early colonoscopy did not improve the SRH identification rate and that the 30-day rebleeding rate was not different, the authors said in a discussion of the results.
“Guidelines and prior studies often recommend that early colonoscopy be performed within 8-24 hours of admission to increase diagnostic yield and the likelihood of a therapeutic intervention,” they added in their discussion.
Dr. Niikura and coauthors acknowledged receiving grant funding from the Japanese Gastroenterological Association. Study coauthor Mitsuhiro Fujishiro, MD, PhD, reported disclosures related to Takeda, AstraZeneca, Zeria, Daiichi-Sankyo, and EA Pharma. The remaining authors did not declare competing interests.
SOURCE: Niikura R et al. Gastroenterology. 2019. doi: 10.1053/j.gastro.2019.09.010.
When to perform colonoscopy for the evaluation of acute lower gastrointestinal bleeding (LGIB) is controversial. Multiple observational studies, three small, single center randomized controlled trials, and several meta-analyses have produced mixed results. Therefore, a large, multicenter trial is of high priority.

Overall, the results suggest that in most patients presenting with acute LGIB, we do not need to perform colonoscopy within 24 hours of admission. However, the mean time to colonoscopy in the elective group was 41 hours from presentation. Therefore, colonoscopy should be performed on a next available basis. Further delays add unnecessary hospital days and increase cost of care. Future studies are needed to identify alternative ways to improve outcomes in LGIB, define the management of unstable patients with acute LGIB, and perfect the approach to endoscopic hemostasis in the colon.
Lisa L. Strate, MD, is professor of medicine, University of Washington, and section chief, gastroenterology, Harborview Medical Center, Seattle.
When to perform colonoscopy for the evaluation of acute lower gastrointestinal bleeding (LGIB) is controversial. Multiple observational studies, three small, single center randomized controlled trials, and several meta-analyses have produced mixed results. Therefore, a large, multicenter trial is of high priority.
Overall, the results suggest that in most patients presenting with acute LGIB, we do not need to perform colonoscopy within 24 hours of admission. However, the mean time to colonoscopy in the elective group was 41 hours from presentation. Therefore, colonoscopy should be performed on a next available basis. Further delays add unnecessary hospital days and increase cost of care. Future studies are needed to identify alternative ways to improve outcomes in LGIB, define the management of unstable patients with acute LGIB, and perfect the approach to endoscopic hemostasis in the colon.
Lisa L. Strate, MD, is professor of medicine, University of Washington, and section chief, gastroenterology, Harborview Medical Center, Seattle.
When to perform colonoscopy for the evaluation of acute lower gastrointestinal bleeding (LGIB) is controversial. Multiple observational studies, three small, single center randomized controlled trials, and several meta-analyses have produced mixed results. Therefore, a large, multicenter trial is of high priority.
Overall, the results suggest that in most patients presenting with acute LGIB, we do not need to perform colonoscopy within 24 hours of admission. However, the mean time to colonoscopy in the elective group was 41 hours from presentation. Therefore, colonoscopy should be performed on a next available basis. Further delays add unnecessary hospital days and increase cost of care. Future studies are needed to identify alternative ways to improve outcomes in LGIB, define the management of unstable patients with acute LGIB, and perfect the approach to endoscopic hemostasis in the colon.
Lisa L. Strate, MD, is professor of medicine, University of Washington, and section chief, gastroenterology, Harborview Medical Center, Seattle.
While generally recommended for diagnosis and treatment of severe bleeding, early colonoscopy did not improve stigmata identification or reduce rebleeding rates in patients admitted for acute lower gastrointestinal bleeding in a relatively large, multicenter randomized trial, investigators report.
The proportion of patients with identified stigmata of recent hemorrhage (SRH) was not statistically significantly different between groups of patients who had early colonoscopy versus those who had a procedure 24 hours or more after admission, according to results of the 170-patient randomized study.
Although rebleeding rate was only a secondary endpoint, a larger study would be “unlikely to show a benefit” of the urgent approach, said investigators led by Ryota Niikura, MD, PhD, of the department of gastroenterology in the graduate school of medicine at the University of Tokyo.
“Our results for rebleeding suggested that early colonoscopy does not improve rebleeding outcomes, even if we chose rebleeding as the primary outcome,” Dr. Niikura and colleagues said in a discussion of the results, which appear in Gastroenterology.
Leading up to this trial, there was “controversy” over whether early colonoscopy could improve significant clinical outcomes such as rebleeding, transfusion need, and mortality, according to the authors, who said this is the largest of four randomized, controlled trials reported on the subject to date, and the first multicenter trial among that group.
One of those randomized studies, reported by Green and colleagues in the American Journal of Gastroenterology in 2005, found no differences in mortality, hospital stay, intensive care unit stay, transfusion requirements, rebleeding, or surgery for urgent colonoscopy versus care provided according to a standard algorithm.
Similarly, Laine and Shah said urgent colonoscopy had no edge over routine elective colonoscopy in terms of clinical outcomes or lowering costs, in a randomized study reported in 2010, also in the American Journal of Gastroenterology.
In September 2019, van Rongen and colleagues reported results of the BLEED study of early versus standard colonoscopy. Length of hospital stay was significantly shorter among patients randomized to the urgent approach; however, the rate of recurrent bleeding and hospital readmission was significantly higher in that group, according to results published in the Journal of Clinical Gastroenterology.
Two out of three of the previous randomized trials also showed no improvement in diagnostic yield with early colonoscopy, though “some meta-analyses” do suggest such a benefit, Dr. Niikura and coauthors said.
The latest reported randomized trial by Dr. Niikura and coinvestigators included patients 20 years of age or older who had moderate to severe hematochezia or melena within 24 hours of admission. A total of 162 adult patients at 15 hospitals in Japan were randomized to undergo early colonoscopy within 24 hours, or elective colonoscopy between 24 and 72 hours.
The primary outcome, identification of SRH, was not significantly different for the early versus later colonoscopy. Investigators said SRH was observed in 17 of 79 patients undergoing early colonoscopy or 21.5%, and in 17 of 80 patients in the elective colonoscopy group, or 21.3% (P = .967).
Similar rates of SRH between early and elective colonoscopy is a finding “in line” with the two of three previous randomized trials that found no increase in diagnostic yield, Dr. Niikura and coinvestigators noted in their report.
Rebleeding within 30 days, the “key secondary outcome” of the study according to investigators, was seen in 11 of 72 patients in the early colonoscopy group, or 15.3%, and in 5 of 75 patients in the elective colonoscopy group, or 6.7%, for a difference of 8.6 percentage points (95% confidence interval, –1.4 to 18.7).
Taken together, these findings suggest that early colonoscopy did not improve the SRH identification rate and that the 30-day rebleeding rate was not different, the authors said in a discussion of the results.
“Guidelines and prior studies often recommend that early colonoscopy be performed within 8-24 hours of admission to increase diagnostic yield and the likelihood of a therapeutic intervention,” they added in their discussion.
Dr. Niikura and coauthors acknowledged receiving grant funding from the Japanese Gastroenterological Association. Study coauthor Mitsuhiro Fujishiro, MD, PhD, reported disclosures related to Takeda, AstraZeneca, Zeria, Daiichi-Sankyo, and EA Pharma. The remaining authors did not declare competing interests.
SOURCE: Niikura R et al. Gastroenterology. 2019. doi: 10.1053/j.gastro.2019.09.010.
While generally recommended for diagnosis and treatment of severe bleeding, early colonoscopy did not improve stigmata identification or reduce rebleeding rates in patients admitted for acute lower gastrointestinal bleeding in a relatively large, multicenter randomized trial, investigators report.
The proportion of patients with identified stigmata of recent hemorrhage (SRH) was not statistically significantly different between groups of patients who had early colonoscopy versus those who had a procedure 24 hours or more after admission, according to results of the 170-patient randomized study.
Although rebleeding rate was only a secondary endpoint, a larger study would be “unlikely to show a benefit” of the urgent approach, said investigators led by Ryota Niikura, MD, PhD, of the department of gastroenterology in the graduate school of medicine at the University of Tokyo.
“Our results for rebleeding suggested that early colonoscopy does not improve rebleeding outcomes, even if we chose rebleeding as the primary outcome,” Dr. Niikura and colleagues said in a discussion of the results, which appear in Gastroenterology.
Leading up to this trial, there was “controversy” over whether early colonoscopy could improve significant clinical outcomes such as rebleeding, transfusion need, and mortality, according to the authors, who said this is the largest of four randomized, controlled trials reported on the subject to date, and the first multicenter trial among that group.
One of those randomized studies, reported by Green and colleagues in the American Journal of Gastroenterology in 2005, found no differences in mortality, hospital stay, intensive care unit stay, transfusion requirements, rebleeding, or surgery for urgent colonoscopy versus care provided according to a standard algorithm.
Similarly, Laine and Shah said urgent colonoscopy had no edge over routine elective colonoscopy in terms of clinical outcomes or lowering costs, in a randomized study reported in 2010, also in the American Journal of Gastroenterology.
In September 2019, van Rongen and colleagues reported results of the BLEED study of early versus standard colonoscopy. Length of hospital stay was significantly shorter among patients randomized to the urgent approach; however, the rate of recurrent bleeding and hospital readmission was significantly higher in that group, according to results published in the Journal of Clinical Gastroenterology.
Two out of three of the previous randomized trials also showed no improvement in diagnostic yield with early colonoscopy, though “some meta-analyses” do suggest such a benefit, Dr. Niikura and coauthors said.
The latest reported randomized trial by Dr. Niikura and coinvestigators included patients 20 years of age or older who had moderate to severe hematochezia or melena within 24 hours of admission. A total of 162 adult patients at 15 hospitals in Japan were randomized to undergo early colonoscopy within 24 hours, or elective colonoscopy between 24 and 72 hours.
The primary outcome, identification of SRH, was not significantly different for the early versus later colonoscopy. Investigators said SRH was observed in 17 of 79 patients undergoing early colonoscopy or 21.5%, and in 17 of 80 patients in the elective colonoscopy group, or 21.3% (P = .967).
Similar rates of SRH between early and elective colonoscopy is a finding “in line” with the two of three previous randomized trials that found no increase in diagnostic yield, Dr. Niikura and coinvestigators noted in their report.
Rebleeding within 30 days, the “key secondary outcome” of the study according to investigators, was seen in 11 of 72 patients in the early colonoscopy group, or 15.3%, and in 5 of 75 patients in the elective colonoscopy group, or 6.7%, for a difference of 8.6 percentage points (95% confidence interval, –1.4 to 18.7).
Taken together, these findings suggest that early colonoscopy did not improve the SRH identification rate and that the 30-day rebleeding rate was not different, the authors said in a discussion of the results.
“Guidelines and prior studies often recommend that early colonoscopy be performed within 8-24 hours of admission to increase diagnostic yield and the likelihood of a therapeutic intervention,” they added in their discussion.
Dr. Niikura and coauthors acknowledged receiving grant funding from the Japanese Gastroenterological Association. Study coauthor Mitsuhiro Fujishiro, MD, PhD, reported disclosures related to Takeda, AstraZeneca, Zeria, Daiichi-Sankyo, and EA Pharma. The remaining authors did not declare competing interests.
SOURCE: Niikura R et al. Gastroenterology. 2019. doi: 10.1053/j.gastro.2019.09.010.
FROM GASTROENTEROLOGY
Have lower readmission rates led to higher mortality for patients with COPD?
Be careful what you wish for
There is at least one aspect of “Obamacare” that my mother-in-law and I can firmly agree on: Hospitals should not get paid for frequent readmissions.

The Hospital Readmission Reduction Program (HRRP), enacted by the Centers for Medicare & Medicaid Services in 2012 with the goal of penalizing hospitals for excessive readmissions, has great face validity – and noble intentions. Does it also have a potentially disastrous downside?
On one side of the coin, the HRRP has been a remarkable success. It moved the national needle significantly on readmission rates. Yes, there are some caveats about increases in observation status patients and other shifts that could account for some of the difference, but it is fairly uncontroversial that overall, there are fewer 30-day readmissions across the country following initiation of HRRP. That is perhaps encouraging evidence of the potential positive impact that policy can make to drive changes for specific targets.
However, there is also a murkier – and more controversial – side. There have been a number of studies that have suggested reductions in readmission rates may have been associated with an increase in mortality in some patient groups. You discharge a patient and hope they won’t return to the hospital, but perhaps you should be more careful what you actually wish for.
Overall, the evidence of an association between readmissions and mortality has been complicated and conflicting. Headlines have alternately raised alarm about increased deaths and then reassured that there has been no change or perhaps even some concordant improvements in mortality. Not necessarily surprising, considering that these studies are all unavoidably of observational design and use different criteria, datasets and analytic models, which then drive their seemingly conflicting results.
An article published recently in the Journal of Hospital Medicine enters into this fray. The researchers examined the potential association between changes in rates of chronic obstructive pulmonary disease (COPD) readmissions and 30-day mortality following HRRP introduction. While the initial HRRP program and subsequent analyses included patients with heart failure, acute MI, and pneumonia, the program was extended in 2014 to include patients with COPD. So, what happened in this patient group?
Through a number of statistical gymnastics, which as a nonstatistician I am having difficulty truly wrapping my head around, the researchers seem to have found a number of important insights:
- The all-cause 30-day risk-standardized readmission rate declined from 2010 to 2017.
- The all-cause 30-day risk-standardized mortality rate increased from 2010 to 2017, and the rate of increase in mortality appears to be accelerating.
- Hospitals with higher readmission rates prior to COPD readmission penalties had a lower rate of increase in mortalities.
- Hospitals that had a larger decrease in readmission rates had a larger rate of increase in mortality.
These researchers could not evaluate data at the patient level and could not adjust for changes in disease severity. However, taken together, these findings suggest that something bad may be truly happening here.
The authors of this study also point out that the associations with increased mortality have largely been seen in patients with heart failure – and now in patients with COPD – which are both chronic diseases characterized by exacerbations, as opposed to acute MI and pneumonia, which are episodic and treatable. Perhaps in those types of disease, efforts to avoid readmissions may be more universally helpful. Maybe.
Even if it is challenging for me to adjudicate the complicated methods and results of this study, I find it concerning that there is “biological plausibility” for this association. Hospitalists know exactly how this might have happened. Have you heard of the pop-up alerts that fire in the emergency department to let the physicians know that this patient was discharged within the past 30 days? You know that alert is not meant to tell you what to do, but you just might want to consider trying to discharge them or at least place them in observation – use your clinical judgment, if you know what I mean.
Within the past decade, observation units quickly cropped up all over the country, often not staffed by hospitalists nor cardiologists, where patients with decompensated heart failure, chest pain, and/or COPD, can be given Lasix and/or nebulizer treatments – at least just enough to let them walk on back out that door without a hospital admission.
At the end of the day, whether mortality rates have truly increased in the real world, this well-intentioned program seems to have serious issues. As Ashish Jha, MD, wrote in 2018, “Right now, a high-readmission, low-mortality hospital will be penalized at 6-10 times the rate of a low-readmission, high-mortality hospital. The signal from policy makers is clear – readmissions matter a lot more than mortality – and this signal needs to stop.”
Dr. Moriates is a hospitalist, the assistant dean for health care value, and an associate professor of internal medicine at Dell Medical School at University of Texas, Austin. He is also director of implementation initiatives at Costs of Care. This article first appeared on the Hospital Leader, SHM’s official blog, at hospitalleader.org.
Be careful what you wish for
Be careful what you wish for
There is at least one aspect of “Obamacare” that my mother-in-law and I can firmly agree on: Hospitals should not get paid for frequent readmissions.
The Hospital Readmission Reduction Program (HRRP), enacted by the Centers for Medicare & Medicaid Services in 2012 with the goal of penalizing hospitals for excessive readmissions, has great face validity – and noble intentions. Does it also have a potentially disastrous downside?
On one side of the coin, the HRRP has been a remarkable success. It moved the national needle significantly on readmission rates. Yes, there are some caveats about increases in observation status patients and other shifts that could account for some of the difference, but it is fairly uncontroversial that overall, there are fewer 30-day readmissions across the country following initiation of HRRP. That is perhaps encouraging evidence of the potential positive impact that policy can make to drive changes for specific targets.
However, there is also a murkier – and more controversial – side. There have been a number of studies that have suggested reductions in readmission rates may have been associated with an increase in mortality in some patient groups. You discharge a patient and hope they won’t return to the hospital, but perhaps you should be more careful what you actually wish for.
Overall, the evidence of an association between readmissions and mortality has been complicated and conflicting. Headlines have alternately raised alarm about increased deaths and then reassured that there has been no change or perhaps even some concordant improvements in mortality. Not necessarily surprising, considering that these studies are all unavoidably of observational design and use different criteria, datasets and analytic models, which then drive their seemingly conflicting results.
An article published recently in the Journal of Hospital Medicine enters into this fray. The researchers examined the potential association between changes in rates of chronic obstructive pulmonary disease (COPD) readmissions and 30-day mortality following HRRP introduction. While the initial HRRP program and subsequent analyses included patients with heart failure, acute MI, and pneumonia, the program was extended in 2014 to include patients with COPD. So, what happened in this patient group?
Through a number of statistical gymnastics, which as a nonstatistician I am having difficulty truly wrapping my head around, the researchers seem to have found a number of important insights:
- The all-cause 30-day risk-standardized readmission rate declined from 2010 to 2017.
- The all-cause 30-day risk-standardized mortality rate increased from 2010 to 2017, and the rate of increase in mortality appears to be accelerating.
- Hospitals with higher readmission rates prior to COPD readmission penalties had a lower rate of increase in mortalities.
- Hospitals that had a larger decrease in readmission rates had a larger rate of increase in mortality.
These researchers could not evaluate data at the patient level and could not adjust for changes in disease severity. However, taken together, these findings suggest that something bad may be truly happening here.
The authors of this study also point out that the associations with increased mortality have largely been seen in patients with heart failure – and now in patients with COPD – which are both chronic diseases characterized by exacerbations, as opposed to acute MI and pneumonia, which are episodic and treatable. Perhaps in those types of disease, efforts to avoid readmissions may be more universally helpful. Maybe.
Even if it is challenging for me to adjudicate the complicated methods and results of this study, I find it concerning that there is “biological plausibility” for this association. Hospitalists know exactly how this might have happened. Have you heard of the pop-up alerts that fire in the emergency department to let the physicians know that this patient was discharged within the past 30 days? You know that alert is not meant to tell you what to do, but you just might want to consider trying to discharge them or at least place them in observation – use your clinical judgment, if you know what I mean.
Within the past decade, observation units quickly cropped up all over the country, often not staffed by hospitalists nor cardiologists, where patients with decompensated heart failure, chest pain, and/or COPD, can be given Lasix and/or nebulizer treatments – at least just enough to let them walk on back out that door without a hospital admission.
At the end of the day, whether mortality rates have truly increased in the real world, this well-intentioned program seems to have serious issues. As Ashish Jha, MD, wrote in 2018, “Right now, a high-readmission, low-mortality hospital will be penalized at 6-10 times the rate of a low-readmission, high-mortality hospital. The signal from policy makers is clear – readmissions matter a lot more than mortality – and this signal needs to stop.”
Dr. Moriates is a hospitalist, the assistant dean for health care value, and an associate professor of internal medicine at Dell Medical School at University of Texas, Austin. He is also director of implementation initiatives at Costs of Care. This article first appeared on the Hospital Leader, SHM’s official blog, at hospitalleader.org.
There is at least one aspect of “Obamacare” that my mother-in-law and I can firmly agree on: Hospitals should not get paid for frequent readmissions.
The Hospital Readmission Reduction Program (HRRP), enacted by the Centers for Medicare & Medicaid Services in 2012 with the goal of penalizing hospitals for excessive readmissions, has great face validity – and noble intentions. Does it also have a potentially disastrous downside?
On one side of the coin, the HRRP has been a remarkable success. It moved the national needle significantly on readmission rates. Yes, there are some caveats about increases in observation status patients and other shifts that could account for some of the difference, but it is fairly uncontroversial that overall, there are fewer 30-day readmissions across the country following initiation of HRRP. That is perhaps encouraging evidence of the potential positive impact that policy can make to drive changes for specific targets.
However, there is also a murkier – and more controversial – side. There have been a number of studies that have suggested reductions in readmission rates may have been associated with an increase in mortality in some patient groups. You discharge a patient and hope they won’t return to the hospital, but perhaps you should be more careful what you actually wish for.
Overall, the evidence of an association between readmissions and mortality has been complicated and conflicting. Headlines have alternately raised alarm about increased deaths and then reassured that there has been no change or perhaps even some concordant improvements in mortality. Not necessarily surprising, considering that these studies are all unavoidably of observational design and use different criteria, datasets and analytic models, which then drive their seemingly conflicting results.
An article published recently in the Journal of Hospital Medicine enters into this fray. The researchers examined the potential association between changes in rates of chronic obstructive pulmonary disease (COPD) readmissions and 30-day mortality following HRRP introduction. While the initial HRRP program and subsequent analyses included patients with heart failure, acute MI, and pneumonia, the program was extended in 2014 to include patients with COPD. So, what happened in this patient group?
Through a number of statistical gymnastics, which as a nonstatistician I am having difficulty truly wrapping my head around, the researchers seem to have found a number of important insights:
- The all-cause 30-day risk-standardized readmission rate declined from 2010 to 2017.
- The all-cause 30-day risk-standardized mortality rate increased from 2010 to 2017, and the rate of increase in mortality appears to be accelerating.
- Hospitals with higher readmission rates prior to COPD readmission penalties had a lower rate of increase in mortalities.
- Hospitals that had a larger decrease in readmission rates had a larger rate of increase in mortality.
These researchers could not evaluate data at the patient level and could not adjust for changes in disease severity. However, taken together, these findings suggest that something bad may be truly happening here.
The authors of this study also point out that the associations with increased mortality have largely been seen in patients with heart failure – and now in patients with COPD – which are both chronic diseases characterized by exacerbations, as opposed to acute MI and pneumonia, which are episodic and treatable. Perhaps in those types of disease, efforts to avoid readmissions may be more universally helpful. Maybe.
Even if it is challenging for me to adjudicate the complicated methods and results of this study, I find it concerning that there is “biological plausibility” for this association. Hospitalists know exactly how this might have happened. Have you heard of the pop-up alerts that fire in the emergency department to let the physicians know that this patient was discharged within the past 30 days? You know that alert is not meant to tell you what to do, but you just might want to consider trying to discharge them or at least place them in observation – use your clinical judgment, if you know what I mean.
Within the past decade, observation units quickly cropped up all over the country, often not staffed by hospitalists nor cardiologists, where patients with decompensated heart failure, chest pain, and/or COPD, can be given Lasix and/or nebulizer treatments – at least just enough to let them walk on back out that door without a hospital admission.
At the end of the day, whether mortality rates have truly increased in the real world, this well-intentioned program seems to have serious issues. As Ashish Jha, MD, wrote in 2018, “Right now, a high-readmission, low-mortality hospital will be penalized at 6-10 times the rate of a low-readmission, high-mortality hospital. The signal from policy makers is clear – readmissions matter a lot more than mortality – and this signal needs to stop.”
Dr. Moriates is a hospitalist, the assistant dean for health care value, and an associate professor of internal medicine at Dell Medical School at University of Texas, Austin. He is also director of implementation initiatives at Costs of Care. This article first appeared on the Hospital Leader, SHM’s official blog, at hospitalleader.org.
Upadacitinib doubles ASAS 40 response vs. placebo in ankylosing spondylitis
ATLANTA – in the randomized, placebo-controlled, phase 2/3 SELECT-AXIS 1 study.

Physical functioning and imaging measures also were improved with upadacitinib in the double-blind, multicenter study, Désirée van der Heijde, MD, PhD, reported at the annual meeting of the American College of Rheumatology.
The findings are notable because patients with ankylosing spondylitis (AS) who have an inadequate response or contraindication to NSAIDs have limited treatment options other than biologic disease-modifying antirheumatic drugs (bDMARDs). The JAK pathway has emerged as a potential therapeutic target in AS, and given its recent approval for the treatment of RA as well as ongoing studies of the agent for several other chronic immune-mediated inflammatory diseases, Dr. van der Heijde and colleagues sought to assess its efficacy and safety in bDMARD-naive patients with active AS.
Of 93 AS patients aged 18 years and older who were randomized to receive 15 mg of upadacitinib daily, 51.6% achieved the primary study endpoint of 40% improvement in Assessment of Spondyloarthritis International Society response criteria (ASAS 40) at week 14, compared with 25.5% of 94 patients who received placebo, said Dr. van der Heijde, professor of rheumatology at Leiden (the Netherlands) University Medical Center.
The effect was rapid, with a clear difference emerging between the treatment and placebo groups within 2 weeks, she noted.
Significant improvements were also seen with upadacitinib for several key secondary endpoints including change from baseline to week 14 in the Ankylosing Spondylitis Disease Activity Score, Spondyloarthritis Research Consortium of Canada MRI Spine, a 50% improvement of the initial Bath Ankylosing Spondylitis Disease Activity Index (BASDAI 50), ASAS partial remission, and Bath Ankylosing Spondylitis Functional Index.
SELECT-AXIS 1 patients were adults with a mean age of 45 years who were enrolled from 60 sites in 20 countries. All met modified New York criteria for AS based on central reading of radiographs, had a BASDAI score of at least 4, had a patient assessment of total back pain of 4 or greater on a 0-10 scale at screening and baseline, were naive to bDMARDs, and had either an inadequate response to at least two NSAIDs or an intolerance/contraindication to NSAIDs.
Most patients (70.6%) were men, and 76.5% were HLA-B27 positive. Mean symptom duration was 14-15 years, and mean disease duration was 7-8 years, Dr. van der Heijde said, adding that baseline disease characteristics were balanced between the two arms.
All randomized patients received their assigned treatment, and 95.7% completed the study through week 14, including 90 of 94 placebo group patients and 89 of 93 upadacitinib patients.
“Treatment was generally well tolerated,” she said.
The proportions of patients in the treatment and placebo groups, respectively, were similar with respect to adverse events leading to discontinuation (2.2% vs. 3.2%), serious adverse events (1.1% in each group), and infections (20.4% vs. 27.7%). No serious infections, herpes zoster, malignancy, venous thromboembolic events, or deaths were reported. Also, no differences were seen between the groups in relevant laboratory abnormalities, and no new safety finding were observed in comparison with previous upadacitinib studies in other diseases, she noted.
Dr. van der Heijde concluded that “these results support further investigation of upadacitinib for the treatment of ankylosing spondyloarthritis.”
AbbVie, which markets upadacitinib, funded the study. Dr. van der Heijde disclosed financial relationships with AbbVie and 20 other pharmaceutical companies. Many other authors also reported financial relationships with industry, including AbbVie.
SOURCE: van der Heijde D et al. Arthritis Rheumatol. 2019;71(suppl 10), Abstract 2728.
ATLANTA – in the randomized, placebo-controlled, phase 2/3 SELECT-AXIS 1 study.
Physical functioning and imaging measures also were improved with upadacitinib in the double-blind, multicenter study, Désirée van der Heijde, MD, PhD, reported at the annual meeting of the American College of Rheumatology.
The findings are notable because patients with ankylosing spondylitis (AS) who have an inadequate response or contraindication to NSAIDs have limited treatment options other than biologic disease-modifying antirheumatic drugs (bDMARDs). The JAK pathway has emerged as a potential therapeutic target in AS, and given its recent approval for the treatment of RA as well as ongoing studies of the agent for several other chronic immune-mediated inflammatory diseases, Dr. van der Heijde and colleagues sought to assess its efficacy and safety in bDMARD-naive patients with active AS.
Of 93 AS patients aged 18 years and older who were randomized to receive 15 mg of upadacitinib daily, 51.6% achieved the primary study endpoint of 40% improvement in Assessment of Spondyloarthritis International Society response criteria (ASAS 40) at week 14, compared with 25.5% of 94 patients who received placebo, said Dr. van der Heijde, professor of rheumatology at Leiden (the Netherlands) University Medical Center.
The effect was rapid, with a clear difference emerging between the treatment and placebo groups within 2 weeks, she noted.
Significant improvements were also seen with upadacitinib for several key secondary endpoints including change from baseline to week 14 in the Ankylosing Spondylitis Disease Activity Score, Spondyloarthritis Research Consortium of Canada MRI Spine, a 50% improvement of the initial Bath Ankylosing Spondylitis Disease Activity Index (BASDAI 50), ASAS partial remission, and Bath Ankylosing Spondylitis Functional Index.
SELECT-AXIS 1 patients were adults with a mean age of 45 years who were enrolled from 60 sites in 20 countries. All met modified New York criteria for AS based on central reading of radiographs, had a BASDAI score of at least 4, had a patient assessment of total back pain of 4 or greater on a 0-10 scale at screening and baseline, were naive to bDMARDs, and had either an inadequate response to at least two NSAIDs or an intolerance/contraindication to NSAIDs.
Most patients (70.6%) were men, and 76.5% were HLA-B27 positive. Mean symptom duration was 14-15 years, and mean disease duration was 7-8 years, Dr. van der Heijde said, adding that baseline disease characteristics were balanced between the two arms.
All randomized patients received their assigned treatment, and 95.7% completed the study through week 14, including 90 of 94 placebo group patients and 89 of 93 upadacitinib patients.
“Treatment was generally well tolerated,” she said.
The proportions of patients in the treatment and placebo groups, respectively, were similar with respect to adverse events leading to discontinuation (2.2% vs. 3.2%), serious adverse events (1.1% in each group), and infections (20.4% vs. 27.7%). No serious infections, herpes zoster, malignancy, venous thromboembolic events, or deaths were reported. Also, no differences were seen between the groups in relevant laboratory abnormalities, and no new safety finding were observed in comparison with previous upadacitinib studies in other diseases, she noted.
Dr. van der Heijde concluded that “these results support further investigation of upadacitinib for the treatment of ankylosing spondyloarthritis.”
AbbVie, which markets upadacitinib, funded the study. Dr. van der Heijde disclosed financial relationships with AbbVie and 20 other pharmaceutical companies. Many other authors also reported financial relationships with industry, including AbbVie.
SOURCE: van der Heijde D et al. Arthritis Rheumatol. 2019;71(suppl 10), Abstract 2728.
ATLANTA – in the randomized, placebo-controlled, phase 2/3 SELECT-AXIS 1 study.
Physical functioning and imaging measures also were improved with upadacitinib in the double-blind, multicenter study, Désirée van der Heijde, MD, PhD, reported at the annual meeting of the American College of Rheumatology.
The findings are notable because patients with ankylosing spondylitis (AS) who have an inadequate response or contraindication to NSAIDs have limited treatment options other than biologic disease-modifying antirheumatic drugs (bDMARDs). The JAK pathway has emerged as a potential therapeutic target in AS, and given its recent approval for the treatment of RA as well as ongoing studies of the agent for several other chronic immune-mediated inflammatory diseases, Dr. van der Heijde and colleagues sought to assess its efficacy and safety in bDMARD-naive patients with active AS.
Of 93 AS patients aged 18 years and older who were randomized to receive 15 mg of upadacitinib daily, 51.6% achieved the primary study endpoint of 40% improvement in Assessment of Spondyloarthritis International Society response criteria (ASAS 40) at week 14, compared with 25.5% of 94 patients who received placebo, said Dr. van der Heijde, professor of rheumatology at Leiden (the Netherlands) University Medical Center.
The effect was rapid, with a clear difference emerging between the treatment and placebo groups within 2 weeks, she noted.
Significant improvements were also seen with upadacitinib for several key secondary endpoints including change from baseline to week 14 in the Ankylosing Spondylitis Disease Activity Score, Spondyloarthritis Research Consortium of Canada MRI Spine, a 50% improvement of the initial Bath Ankylosing Spondylitis Disease Activity Index (BASDAI 50), ASAS partial remission, and Bath Ankylosing Spondylitis Functional Index.
SELECT-AXIS 1 patients were adults with a mean age of 45 years who were enrolled from 60 sites in 20 countries. All met modified New York criteria for AS based on central reading of radiographs, had a BASDAI score of at least 4, had a patient assessment of total back pain of 4 or greater on a 0-10 scale at screening and baseline, were naive to bDMARDs, and had either an inadequate response to at least two NSAIDs or an intolerance/contraindication to NSAIDs.
Most patients (70.6%) were men, and 76.5% were HLA-B27 positive. Mean symptom duration was 14-15 years, and mean disease duration was 7-8 years, Dr. van der Heijde said, adding that baseline disease characteristics were balanced between the two arms.
All randomized patients received their assigned treatment, and 95.7% completed the study through week 14, including 90 of 94 placebo group patients and 89 of 93 upadacitinib patients.
“Treatment was generally well tolerated,” she said.
The proportions of patients in the treatment and placebo groups, respectively, were similar with respect to adverse events leading to discontinuation (2.2% vs. 3.2%), serious adverse events (1.1% in each group), and infections (20.4% vs. 27.7%). No serious infections, herpes zoster, malignancy, venous thromboembolic events, or deaths were reported. Also, no differences were seen between the groups in relevant laboratory abnormalities, and no new safety finding were observed in comparison with previous upadacitinib studies in other diseases, she noted.
Dr. van der Heijde concluded that “these results support further investigation of upadacitinib for the treatment of ankylosing spondyloarthritis.”
AbbVie, which markets upadacitinib, funded the study. Dr. van der Heijde disclosed financial relationships with AbbVie and 20 other pharmaceutical companies. Many other authors also reported financial relationships with industry, including AbbVie.
SOURCE: van der Heijde D et al. Arthritis Rheumatol. 2019;71(suppl 10), Abstract 2728.
REPORTING FROM ACR 2019

Headache may be a significant outcome of pediatric hemispherectomy
CHARLOTTE, N.C. – , according to a study presented at the annual meeting of the Child Neurology Society. Patients with headache before hemispherectomy may be at risk of increased headache frequency after the procedure. The most common type of headache reported is nonmigrainous headache.
“We recommend that hemispherectomy patients be evaluated and followed closely postoperatively and questioned regarding the presence of headache,” said William Bingaman, MD, vice-chair of the neurological institute and head of the section of epilepsy surgery at the Cleveland Clinic, and colleagues. “Patients should be assessed and treated quickly to decrease prolonged pain and suffering and increase function.”
The two main types of hemispherectomy are anatomical and functional. Anatomical hemispherectomy entails the removal of a large amount of brain mass. Functional hemispherectomy entails the removal of a smaller amount of brain mass, as well as the disconnection of the brain’s hemispheres. Most patients are seizure free or have reduced seizure frequency after hemispherectomy. Other common postoperative outcomes include changes in behavior, cognition, motor function, and speech. Many studies have explored these outcomes, but few have examined the frequency of postoperative headache in children who undergo hemispherectomy.
Dr. Bingaman and colleagues retrospectively reviewed the charts of 74 children who underwent hemispherectomy at the Cleveland Clinic during the previous 5 years. They excluded 14 patients who were too young to respond for the analysis. The investigators sent the remaining 60 patients an informative letter and followed up with a 10-minute phone questionnaire about patients’ postoperative headache symptoms.
Twenty-two (36.7%) eligible patients completed the questionnaire. Thirty-eight patients could not be reached or declined to participate. Half of the 22 respondents were male. Participants’ median age at surgery was 6.5 years. The most common types of hemispherectomy were left functional (50%) and right functional (31.8%).
Nine (39.1%) of the 22 respondents had headache before surgery, and seven (31.8%) reported a family history of headache. In all, 19 (86.4%) patients had headache after surgery, and 10 (45.5%) had headaches that began after the surgery. Of the nine patients with preoperative headache, six (66.6%) had an increase in headache frequency after surgery, two (22.2%) reported no change, and one (11.1%) had decreased headache frequency. The most common type of headache reported was tension-type headache, and migraine was the second most common.
“The cause of any posthemispherectomy headache has thus far only been attributed to hydrocephalus,” wrote Dr. Bingaman and colleagues. “The tendency of headache to worsen following stresses such as illness, stroke, trauma, etc. has been studied extensively. The pathophysiology of posthemispherectomy headache can be investigated further by classifying hemispherectomy as a type of trauma or injury, which would explain the development of postoperative headache. Previous studies on posttraumatic headache have ascribed these headaches to neuroinflammation following the injury. Additionally, posthemispherectomy headache could also be due to the buildup of debris and fluid following the operation. Future hemispherectomy patients should be treated prophylactically for headache.”
The authors did not report funding for their study or declare any disclosures.
SOURCE: Pandit I et al. CNS 2019. Abstract 99.
CHARLOTTE, N.C. – , according to a study presented at the annual meeting of the Child Neurology Society. Patients with headache before hemispherectomy may be at risk of increased headache frequency after the procedure. The most common type of headache reported is nonmigrainous headache.
“We recommend that hemispherectomy patients be evaluated and followed closely postoperatively and questioned regarding the presence of headache,” said William Bingaman, MD, vice-chair of the neurological institute and head of the section of epilepsy surgery at the Cleveland Clinic, and colleagues. “Patients should be assessed and treated quickly to decrease prolonged pain and suffering and increase function.”
The two main types of hemispherectomy are anatomical and functional. Anatomical hemispherectomy entails the removal of a large amount of brain mass. Functional hemispherectomy entails the removal of a smaller amount of brain mass, as well as the disconnection of the brain’s hemispheres. Most patients are seizure free or have reduced seizure frequency after hemispherectomy. Other common postoperative outcomes include changes in behavior, cognition, motor function, and speech. Many studies have explored these outcomes, but few have examined the frequency of postoperative headache in children who undergo hemispherectomy.
Dr. Bingaman and colleagues retrospectively reviewed the charts of 74 children who underwent hemispherectomy at the Cleveland Clinic during the previous 5 years. They excluded 14 patients who were too young to respond for the analysis. The investigators sent the remaining 60 patients an informative letter and followed up with a 10-minute phone questionnaire about patients’ postoperative headache symptoms.
Twenty-two (36.7%) eligible patients completed the questionnaire. Thirty-eight patients could not be reached or declined to participate. Half of the 22 respondents were male. Participants’ median age at surgery was 6.5 years. The most common types of hemispherectomy were left functional (50%) and right functional (31.8%).
Nine (39.1%) of the 22 respondents had headache before surgery, and seven (31.8%) reported a family history of headache. In all, 19 (86.4%) patients had headache after surgery, and 10 (45.5%) had headaches that began after the surgery. Of the nine patients with preoperative headache, six (66.6%) had an increase in headache frequency after surgery, two (22.2%) reported no change, and one (11.1%) had decreased headache frequency. The most common type of headache reported was tension-type headache, and migraine was the second most common.
“The cause of any posthemispherectomy headache has thus far only been attributed to hydrocephalus,” wrote Dr. Bingaman and colleagues. “The tendency of headache to worsen following stresses such as illness, stroke, trauma, etc. has been studied extensively. The pathophysiology of posthemispherectomy headache can be investigated further by classifying hemispherectomy as a type of trauma or injury, which would explain the development of postoperative headache. Previous studies on posttraumatic headache have ascribed these headaches to neuroinflammation following the injury. Additionally, posthemispherectomy headache could also be due to the buildup of debris and fluid following the operation. Future hemispherectomy patients should be treated prophylactically for headache.”
The authors did not report funding for their study or declare any disclosures.
SOURCE: Pandit I et al. CNS 2019. Abstract 99.
CHARLOTTE, N.C. – , according to a study presented at the annual meeting of the Child Neurology Society. Patients with headache before hemispherectomy may be at risk of increased headache frequency after the procedure. The most common type of headache reported is nonmigrainous headache.
“We recommend that hemispherectomy patients be evaluated and followed closely postoperatively and questioned regarding the presence of headache,” said William Bingaman, MD, vice-chair of the neurological institute and head of the section of epilepsy surgery at the Cleveland Clinic, and colleagues. “Patients should be assessed and treated quickly to decrease prolonged pain and suffering and increase function.”
The two main types of hemispherectomy are anatomical and functional. Anatomical hemispherectomy entails the removal of a large amount of brain mass. Functional hemispherectomy entails the removal of a smaller amount of brain mass, as well as the disconnection of the brain’s hemispheres. Most patients are seizure free or have reduced seizure frequency after hemispherectomy. Other common postoperative outcomes include changes in behavior, cognition, motor function, and speech. Many studies have explored these outcomes, but few have examined the frequency of postoperative headache in children who undergo hemispherectomy.
Dr. Bingaman and colleagues retrospectively reviewed the charts of 74 children who underwent hemispherectomy at the Cleveland Clinic during the previous 5 years. They excluded 14 patients who were too young to respond for the analysis. The investigators sent the remaining 60 patients an informative letter and followed up with a 10-minute phone questionnaire about patients’ postoperative headache symptoms.
Twenty-two (36.7%) eligible patients completed the questionnaire. Thirty-eight patients could not be reached or declined to participate. Half of the 22 respondents were male. Participants’ median age at surgery was 6.5 years. The most common types of hemispherectomy were left functional (50%) and right functional (31.8%).
Nine (39.1%) of the 22 respondents had headache before surgery, and seven (31.8%) reported a family history of headache. In all, 19 (86.4%) patients had headache after surgery, and 10 (45.5%) had headaches that began after the surgery. Of the nine patients with preoperative headache, six (66.6%) had an increase in headache frequency after surgery, two (22.2%) reported no change, and one (11.1%) had decreased headache frequency. The most common type of headache reported was tension-type headache, and migraine was the second most common.
“The cause of any posthemispherectomy headache has thus far only been attributed to hydrocephalus,” wrote Dr. Bingaman and colleagues. “The tendency of headache to worsen following stresses such as illness, stroke, trauma, etc. has been studied extensively. The pathophysiology of posthemispherectomy headache can be investigated further by classifying hemispherectomy as a type of trauma or injury, which would explain the development of postoperative headache. Previous studies on posttraumatic headache have ascribed these headaches to neuroinflammation following the injury. Additionally, posthemispherectomy headache could also be due to the buildup of debris and fluid following the operation. Future hemispherectomy patients should be treated prophylactically for headache.”
The authors did not report funding for their study or declare any disclosures.
SOURCE: Pandit I et al. CNS 2019. Abstract 99.
REPORTING FROM CNS 2019