User login
Combined PH subtypes predicts poor survival in kidney disease
based on data from a retrospective study of 12,618 patients.
Pulmonary hypertension (PH) occurs in up to 41% of chronic kidney disease (CKD) patients, but most studies of PH in this population have not examined PH subtypes, wrote Daniel L. Edmonston, MD, of Duke University, Durham, N.C., and colleagues.
“Among patients with CKD with PH, the combined pre- and postcapillary PH subtype (elevated pulmonary capillary wedge pressure with increased pulmonary vascular resistance) may be a substantial contributor to the overall PH burden in CKD” because of factors including chronic volume overload, pulmonary vascular remodeling, inflammation, and comorbid lung disease, they wrote.
In a study published in the American Journal of Kidney Diseases, The researchers investigated subtypes of precapillary, postcapillary, and combination PH, and their associations with all-cause mortality for different levels of CKD severity. The study population included 12,618 adults aged 18 years and older with qualifying right-heart catheterizations. Of these, 4,772 had chronic kidney disease. The average age was 57 years in patients without CKD and 69 years in patients with CKD.
Overall, 73.4% of patients with CKD and 56.9% of patients without CKD had PH. For CKD patients, the most common PH subtypes were isolated postcapillary (39.0%) and combined pre- and postcapillary (38.3%).
Combined pre- and postcapillary PH was associated with higher mortality risk, compared with no PH in CKD patients, with adjusted hazard ratios of 1.89, 1.87, 2.13, and 1.63 for glomerular filtration rate categories G3a, G3b, G4, and G5/G5D, respectively.
For patients without CKD, precapillary PH was the most common subtype (35.9%) and was associated with the highest mortality risk, compared with no PH (HR, 2.27).
Relationships between mortality and specific PH features of mean pulmonary artery pressure, pulmonary capillary wedge pressure, and right atrial pressure were similar for patients with and without CKD.
The study findings were limited by several factors including the observational design, potential lack of generalizability because of the use of data from a single center, and lack of data on vascular access for hemodialysis, and exclusion of patients with heart or lung transplants, the researchers noted.
However, the results suggest that “processes that increase pulmonary vascular resistance and/ or remodeling represent a prominent mechanism and potential therapeutic target for patients with CKD that is complicated by PH,” they said.
Patients with CKD and combined pre- and postcapillary PH are at increased risk for mortality and “recognition of this large combined pre- and postcapillary PH cohort in CKD may present new therapeutic options,” they concluded.
The study was supported by the National Institutes of Health and the American Society of Nephrology. The researchers had no financial conflicts to disclose.
SOURCE: Edmonston DL et al. Am J Kidney Dis. 2019;75:713-24.
.
based on data from a retrospective study of 12,618 patients.
Pulmonary hypertension (PH) occurs in up to 41% of chronic kidney disease (CKD) patients, but most studies of PH in this population have not examined PH subtypes, wrote Daniel L. Edmonston, MD, of Duke University, Durham, N.C., and colleagues.
“Among patients with CKD with PH, the combined pre- and postcapillary PH subtype (elevated pulmonary capillary wedge pressure with increased pulmonary vascular resistance) may be a substantial contributor to the overall PH burden in CKD” because of factors including chronic volume overload, pulmonary vascular remodeling, inflammation, and comorbid lung disease, they wrote.
In a study published in the American Journal of Kidney Diseases, The researchers investigated subtypes of precapillary, postcapillary, and combination PH, and their associations with all-cause mortality for different levels of CKD severity. The study population included 12,618 adults aged 18 years and older with qualifying right-heart catheterizations. Of these, 4,772 had chronic kidney disease. The average age was 57 years in patients without CKD and 69 years in patients with CKD.
Overall, 73.4% of patients with CKD and 56.9% of patients without CKD had PH. For CKD patients, the most common PH subtypes were isolated postcapillary (39.0%) and combined pre- and postcapillary (38.3%).
Combined pre- and postcapillary PH was associated with higher mortality risk, compared with no PH in CKD patients, with adjusted hazard ratios of 1.89, 1.87, 2.13, and 1.63 for glomerular filtration rate categories G3a, G3b, G4, and G5/G5D, respectively.
For patients without CKD, precapillary PH was the most common subtype (35.9%) and was associated with the highest mortality risk, compared with no PH (HR, 2.27).
Relationships between mortality and specific PH features of mean pulmonary artery pressure, pulmonary capillary wedge pressure, and right atrial pressure were similar for patients with and without CKD.
The study findings were limited by several factors including the observational design, potential lack of generalizability because of the use of data from a single center, and lack of data on vascular access for hemodialysis, and exclusion of patients with heart or lung transplants, the researchers noted.
However, the results suggest that “processes that increase pulmonary vascular resistance and/ or remodeling represent a prominent mechanism and potential therapeutic target for patients with CKD that is complicated by PH,” they said.
Patients with CKD and combined pre- and postcapillary PH are at increased risk for mortality and “recognition of this large combined pre- and postcapillary PH cohort in CKD may present new therapeutic options,” they concluded.
The study was supported by the National Institutes of Health and the American Society of Nephrology. The researchers had no financial conflicts to disclose.
SOURCE: Edmonston DL et al. Am J Kidney Dis. 2019;75:713-24.
.
based on data from a retrospective study of 12,618 patients.
Pulmonary hypertension (PH) occurs in up to 41% of chronic kidney disease (CKD) patients, but most studies of PH in this population have not examined PH subtypes, wrote Daniel L. Edmonston, MD, of Duke University, Durham, N.C., and colleagues.
“Among patients with CKD with PH, the combined pre- and postcapillary PH subtype (elevated pulmonary capillary wedge pressure with increased pulmonary vascular resistance) may be a substantial contributor to the overall PH burden in CKD” because of factors including chronic volume overload, pulmonary vascular remodeling, inflammation, and comorbid lung disease, they wrote.
In a study published in the American Journal of Kidney Diseases, The researchers investigated subtypes of precapillary, postcapillary, and combination PH, and their associations with all-cause mortality for different levels of CKD severity. The study population included 12,618 adults aged 18 years and older with qualifying right-heart catheterizations. Of these, 4,772 had chronic kidney disease. The average age was 57 years in patients without CKD and 69 years in patients with CKD.
Overall, 73.4% of patients with CKD and 56.9% of patients without CKD had PH. For CKD patients, the most common PH subtypes were isolated postcapillary (39.0%) and combined pre- and postcapillary (38.3%).
Combined pre- and postcapillary PH was associated with higher mortality risk, compared with no PH in CKD patients, with adjusted hazard ratios of 1.89, 1.87, 2.13, and 1.63 for glomerular filtration rate categories G3a, G3b, G4, and G5/G5D, respectively.
For patients without CKD, precapillary PH was the most common subtype (35.9%) and was associated with the highest mortality risk, compared with no PH (HR, 2.27).
Relationships between mortality and specific PH features of mean pulmonary artery pressure, pulmonary capillary wedge pressure, and right atrial pressure were similar for patients with and without CKD.
The study findings were limited by several factors including the observational design, potential lack of generalizability because of the use of data from a single center, and lack of data on vascular access for hemodialysis, and exclusion of patients with heart or lung transplants, the researchers noted.
However, the results suggest that “processes that increase pulmonary vascular resistance and/ or remodeling represent a prominent mechanism and potential therapeutic target for patients with CKD that is complicated by PH,” they said.
Patients with CKD and combined pre- and postcapillary PH are at increased risk for mortality and “recognition of this large combined pre- and postcapillary PH cohort in CKD may present new therapeutic options,” they concluded.
The study was supported by the National Institutes of Health and the American Society of Nephrology. The researchers had no financial conflicts to disclose.
SOURCE: Edmonston DL et al. Am J Kidney Dis. 2019;75:713-24.
.
FROM THE AMERICAN JOURNAL OF KIDNEY DISEASES
Radiation Recall Dermatitis Triggered by Prednisone
To the Editor:
A 69-year-old woman presented to the allergy clinic for evaluation of a rash on the left breast. The patient had a history of breast cancer that was treated with a lumpectomy followed by external beam radiation therapy (total dose, 6000 cGy) to the lateral aspect of the left breast approximately 4 years prior. She developed acute breast dermatitis from the radiation, which was self-treated with over-the-counter hydrocortisone cream. The patient subsequently developed a blistering skin eruption over the area where she applied the cream. She did not recall the subtype of hydrocortisone she used (butyrate and acetate are available over-the-counter). She discontinued the hydrocortisone and was started on triamcinolone cream 0.1%, which was well tolerated, and the rash resolved.
The patient had a history of a similar reaction to hydrocortisone butyrate after blepharoplasty approximately 10 years prior to the current presentation, characterized by facial erythema, pruritus, and blistering. A patch test confirmed reactivity to hydrocortisone-17-butyrate and tixocortol pivalate. However, a skin-prick test for hydrocortisone acetate cream 1% was negative.
Subsequently, the patient developed acute-onset dyspepsia, gnawing epigastric pain, regurgitation, and bloating. A diagnosis of eosinophilic gastritis was established via biopsy, which found increased eosinophils in the lamina propria (>50 eosinophils per high-power field). Helicobacter pylori was not identified. She was started on the proton-pump inhibitor dexlansoprazole but symptoms did not improve. Her other medications included benazepril, alprazolam as needed, vitamin D, and magnesium. The patient subsequently was started on a trial of oral prednisone 40 mg/d. Three days after initiation, she developed an erythematous macular rash over the left breast.
The next day she presented to the allergy clinic. Physical examination of the left breast revealed a 20×10-cm, nipple-sparing patch of well-demarcated erythema without fluctuance or overlying lesions. The area of erythema overlapped with the prior radiation field based on radiation marker tattoos and the lumpectomy scar (Figure). There was no evidence to suggest inflammation of deeper tissue or the pectoral muscles. Vital signs were normal, and the remainder of the examination was unremarkable, including breast, lymph node, and complete skin examinations.
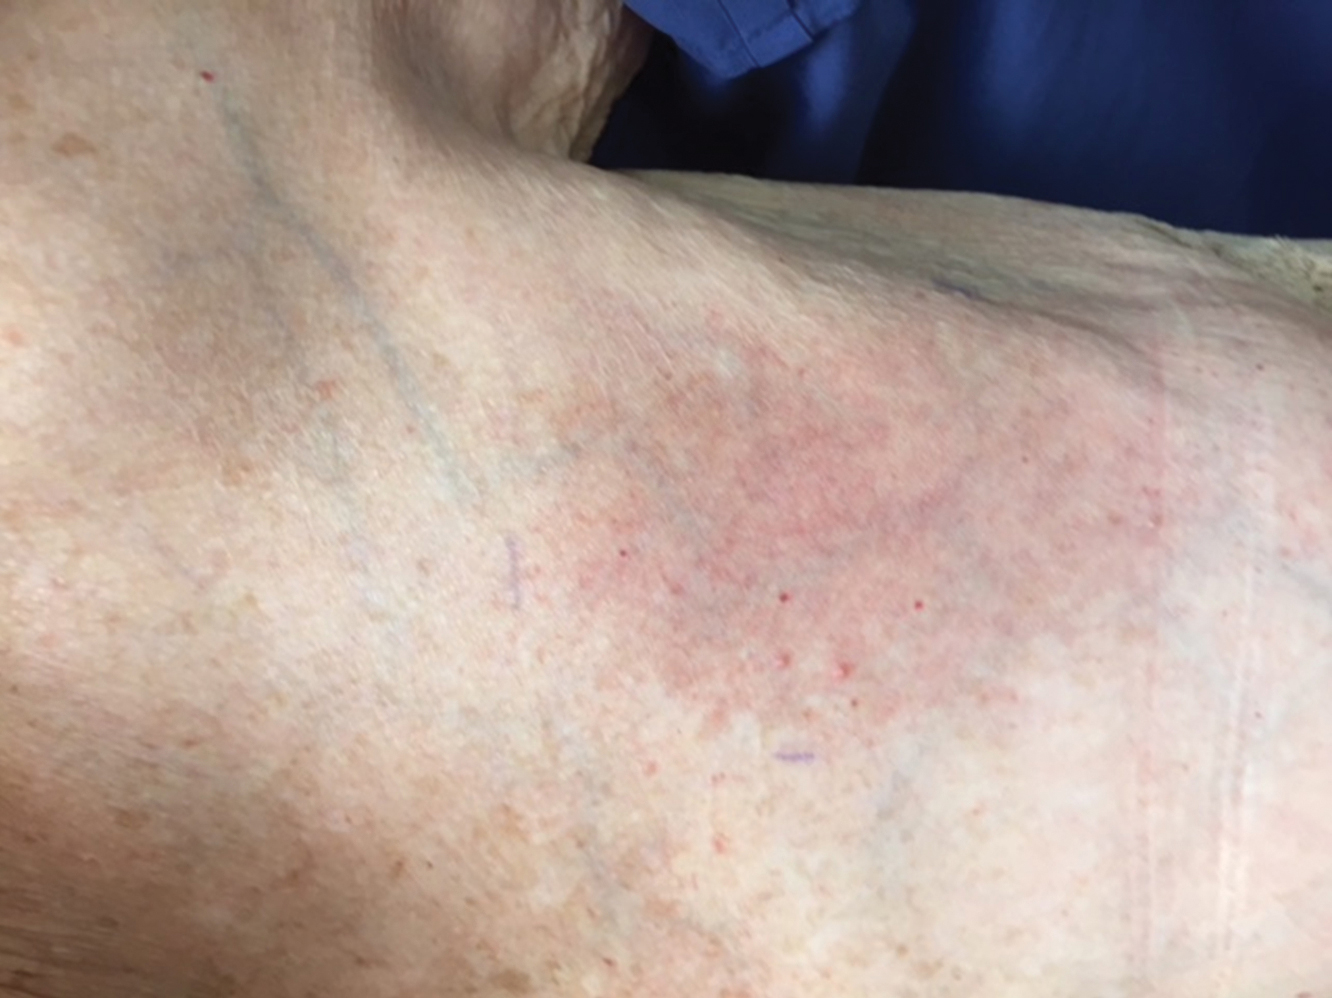
At evaluation, the differential diagnosis included contact dermatitis, fixed drug eruption, infection, tumor recurrence with overlying skin changes, and radiation recall dermatitis. Given that the dermatitis had developed at the site of previously irradiated skin in the absence of fever or an associated mass, the presentation was thought to be most consistent with radiation recall dermatitis.
Oral prednisone was discontinued, and the dermatitis spontaneously improved in a few weeks. Given the patient’s test results and prior tolerance to triamcinolone, eosinophilic gastroenteritis was treated with triamcinolone acetonide 40 mg via intramuscular injection, which was well tolerated.
Radiation recall dermatitis is an acute inflammatory reaction over an area of skin that was previously irradiated. It is most often triggered by chemotherapy agents and occurs in as many as 9% of patients who receive chemotherapy after radiation.1 Commonly implicated chemotherapy agents include anthracyclines, taxanes, antimetabolites, and alkylating agents. Newer targeted cancer treatments also have been reported to trigger radiation recall dermatitis, including epidermal growth factor receptor inhibitors, vascular endothelial growth factor receptor inhibitors, mammalian target of rapamycin inhibitors, and anti–programmed cell death protein 1 monoclonal antibodies.2-5 Radiation recall dermatitis also has been reported to be triggered by intravenous contrast dye.6
The clinical presentation of radiation recall dermatitis ranges from mild rash to skin necrosis and desquamation. Patients often report pruritus or pain in the affected area. The US National Cancer Institute’s Common Terminology Criteria for Adverse Events (CTCAE) includes a 5-point scale for grading the severity of radiation recall dermatitis: grade 1, faint erythema or dry desquamation; grade 2, moderate to brisk erythema or patchy moist desquamation, mostly confined to skin folds and creases; grade 3, moist desquamation in areas other than skin folds and creases, with bleeding induced by minor trauma or abrasion; grade 4, skin necrosis or ulceration of full-thickness dermis, with spontaneous bleeding; grade 5, death.7 Based on these criteria, our patient had grade 2 radiation recall dermatitis.
In addition to cutaneous inflammation, additional sites can be inflamed, including the gastrointestinal tract, lungs, and oral mucosa. Cases of myocarditis, sialadenitis, and cystitis also have been reported.⁷
Radiation recall dermatitis can occur even if dermatitis did not occur upon initial treatment. The inflammatory reaction can occur weeks or years after initial irradiation. A study evaluating targeted chemotherapy agents found the median time from initiation of chemotherapy to radiation recall dermatitis was 16.9 weeks (range, 1–86.9 weeks). Inflammation usually lasts approximately 1 to 2 weeks but has been reported to persist as long as 14 weeks.8 Withdrawal of the offending agent in addition to administration of corticosteroids or nonsteroidal anti-inflammatory agents typically results in clinical improvement. Histology on skin biopsy is nonspecific and can reveal mixed infiltrates.7
The pathophysiology of radiation recall dermatitis remains unknown; the condition might be an idiosyncratic drug reaction. It has been hypothesized that prior radiation lowers the threshold for an inflammatory reaction, an example of Ruocco immunocompromised cutaneous districts, in which a prior injury at a cutaneous site increases the likelihood of opportunistic infection, tumor, and immune reactions.9 Because radiation can induce expression of inflammatory cytokines, such as IL-1, IL-6, platelet-derived growth factor β, and tumor necrosis factor α, cells in irradiated areas can continue to secrete low levels of these cytokines after radiation therapy, thus priming an inflammatory reaction in the future.10 An alternative theory is that radiation induces mutations within surviving stem cells, rendering them unable to tolerate or unusually sensitive to subsequent chemotherapy and cytotoxic drugs. However, this premise would not explain how noncytotoxic drugs also can trigger radiation recall dermatitis, as described in our case.11
Prednisone-triggered radiation recall dermatitis is curious, as corticosteroids are used to treat the condition. Corticosteroids are classified by their chemical structure, and patch testing can be used to distinguish allergies across the various classes. Hydrocortisone acetate,
In contrast, triamcinolone is a class B steroid, which has a C16,17-cis-diol or -ketal. Other than budesonide, which can cross-react with D2 steroids, class B steroids do not cross-react with hydrocortisone or prednisone. Triamcinolone does not usually cross-react with D2 corticosteroids, which likely explains why our patient was later able to tolerate triamcinolone to treat eosinophilic gastrointestinal tract disease.
In summary, we present a case of radiation recall dermatitis triggered by prednisone. Radiation can prime an area for a future inflammatory response by upregulating proinflammatory cytokines or triggering stem cell mutation. In our case, clinical reactivity to hydrocortisone-17-butyrate and sensitization to tixocortol pivalate via patch testing could have increased the likelihood of a reaction with prednisone use due to cross-reactivity. This case instructs dermatologists, allergists, and oncologists to be aware of prednisone as a potential trigger of radiation recall dermatitis.
- Kodym E, Kalinska R, Ehringfeld C, et al. Frequency of radiation recall dermatitis in adult cancer patients. Onkologie. 2005;28:18-21.
- Seidel C, Janssen S, Karstens JH, et al. Recall pneumonitis during systemic treatment with sunitinib. Ann Oncol. 2010;21:2119-2120.
- Togashi Y, Masago K, Mishima M, et al. A case of radiation recall pneumonitis induced by erlotinib, which can be related to high plasma concentration. J Thorac Oncol. 2010;5:924-925.
- Bourgier C, Massard C, Moldovan C, et al. Total recall of radiotherapy with mTOR inhibitors: a novel and potentially frequent side-effect? Ann Oncol. 2011;22:485-486.
- Korman AM, Tyler KH, Kaffenberger BH. Radiation recall dermatitis associated with nivolumab for metastatic malignant melanoma. Int J Dermatol. 2017;56:e75-e77.
- Lau SKM, Rahimi A. Radiation recall precipitated by iodinated nonionic contrast. Pract Radiat Oncol. 2015;5:263-266.
- US Department of Health and Human Services. Common Terminology Criteria for Adverse Events (CTCAE) Version 5.0. https://ctep.cancer.gov/protocoldevelopment/electronic
_applications/docs/CTCAE_v5_Quick_Reference_8.5x11.pdf. Published November 27, 2017. Accessed June 10, 2020.] - Levy A, Hollebecque A, Bourgier C, et al. Targeted therapy-induced radiation recall. Eur J Cancer. 2013;49:1662-1668.
- Piccolo V, Baroni A, Russo T, et al. Ruocco’s immunocompromised cutaneous district. Int J Dermatol. 2016;55:135-141.
- Johnson CJ, Piedboeuf P, Rubin P, et al. Early and persistent alterations in the expression of interleukin-1 alpha, interleukin-1 beta and tumour necrosis factor alpha mRNA levels in fibrosis-resistant and sensitive mice after thoracic irradiation. Radiat Res. 1996;145:762-767.
- Azira D, Magné N, Zouhair A, et al. Radiation recall: a well recognized but neglected phenomenon. Cancer Treat Rev. 2005;31:555-570.
- Jacob SE, Steele T. Corticosteroid classes: a quick reference guide including patch test substances and cross-reactivity. J Am Acad Dermatol. 2006;54:723-727.
To the Editor:
A 69-year-old woman presented to the allergy clinic for evaluation of a rash on the left breast. The patient had a history of breast cancer that was treated with a lumpectomy followed by external beam radiation therapy (total dose, 6000 cGy) to the lateral aspect of the left breast approximately 4 years prior. She developed acute breast dermatitis from the radiation, which was self-treated with over-the-counter hydrocortisone cream. The patient subsequently developed a blistering skin eruption over the area where she applied the cream. She did not recall the subtype of hydrocortisone she used (butyrate and acetate are available over-the-counter). She discontinued the hydrocortisone and was started on triamcinolone cream 0.1%, which was well tolerated, and the rash resolved.
The patient had a history of a similar reaction to hydrocortisone butyrate after blepharoplasty approximately 10 years prior to the current presentation, characterized by facial erythema, pruritus, and blistering. A patch test confirmed reactivity to hydrocortisone-17-butyrate and tixocortol pivalate. However, a skin-prick test for hydrocortisone acetate cream 1% was negative.
Subsequently, the patient developed acute-onset dyspepsia, gnawing epigastric pain, regurgitation, and bloating. A diagnosis of eosinophilic gastritis was established via biopsy, which found increased eosinophils in the lamina propria (>50 eosinophils per high-power field). Helicobacter pylori was not identified. She was started on the proton-pump inhibitor dexlansoprazole but symptoms did not improve. Her other medications included benazepril, alprazolam as needed, vitamin D, and magnesium. The patient subsequently was started on a trial of oral prednisone 40 mg/d. Three days after initiation, she developed an erythematous macular rash over the left breast.
The next day she presented to the allergy clinic. Physical examination of the left breast revealed a 20×10-cm, nipple-sparing patch of well-demarcated erythema without fluctuance or overlying lesions. The area of erythema overlapped with the prior radiation field based on radiation marker tattoos and the lumpectomy scar (Figure). There was no evidence to suggest inflammation of deeper tissue or the pectoral muscles. Vital signs were normal, and the remainder of the examination was unremarkable, including breast, lymph node, and complete skin examinations.
At evaluation, the differential diagnosis included contact dermatitis, fixed drug eruption, infection, tumor recurrence with overlying skin changes, and radiation recall dermatitis. Given that the dermatitis had developed at the site of previously irradiated skin in the absence of fever or an associated mass, the presentation was thought to be most consistent with radiation recall dermatitis.
Oral prednisone was discontinued, and the dermatitis spontaneously improved in a few weeks. Given the patient’s test results and prior tolerance to triamcinolone, eosinophilic gastroenteritis was treated with triamcinolone acetonide 40 mg via intramuscular injection, which was well tolerated.
Radiation recall dermatitis is an acute inflammatory reaction over an area of skin that was previously irradiated. It is most often triggered by chemotherapy agents and occurs in as many as 9% of patients who receive chemotherapy after radiation.1 Commonly implicated chemotherapy agents include anthracyclines, taxanes, antimetabolites, and alkylating agents. Newer targeted cancer treatments also have been reported to trigger radiation recall dermatitis, including epidermal growth factor receptor inhibitors, vascular endothelial growth factor receptor inhibitors, mammalian target of rapamycin inhibitors, and anti–programmed cell death protein 1 monoclonal antibodies.2-5 Radiation recall dermatitis also has been reported to be triggered by intravenous contrast dye.6
The clinical presentation of radiation recall dermatitis ranges from mild rash to skin necrosis and desquamation. Patients often report pruritus or pain in the affected area. The US National Cancer Institute’s Common Terminology Criteria for Adverse Events (CTCAE) includes a 5-point scale for grading the severity of radiation recall dermatitis: grade 1, faint erythema or dry desquamation; grade 2, moderate to brisk erythema or patchy moist desquamation, mostly confined to skin folds and creases; grade 3, moist desquamation in areas other than skin folds and creases, with bleeding induced by minor trauma or abrasion; grade 4, skin necrosis or ulceration of full-thickness dermis, with spontaneous bleeding; grade 5, death.7 Based on these criteria, our patient had grade 2 radiation recall dermatitis.
In addition to cutaneous inflammation, additional sites can be inflamed, including the gastrointestinal tract, lungs, and oral mucosa. Cases of myocarditis, sialadenitis, and cystitis also have been reported.⁷
Radiation recall dermatitis can occur even if dermatitis did not occur upon initial treatment. The inflammatory reaction can occur weeks or years after initial irradiation. A study evaluating targeted chemotherapy agents found the median time from initiation of chemotherapy to radiation recall dermatitis was 16.9 weeks (range, 1–86.9 weeks). Inflammation usually lasts approximately 1 to 2 weeks but has been reported to persist as long as 14 weeks.8 Withdrawal of the offending agent in addition to administration of corticosteroids or nonsteroidal anti-inflammatory agents typically results in clinical improvement. Histology on skin biopsy is nonspecific and can reveal mixed infiltrates.7
The pathophysiology of radiation recall dermatitis remains unknown; the condition might be an idiosyncratic drug reaction. It has been hypothesized that prior radiation lowers the threshold for an inflammatory reaction, an example of Ruocco immunocompromised cutaneous districts, in which a prior injury at a cutaneous site increases the likelihood of opportunistic infection, tumor, and immune reactions.9 Because radiation can induce expression of inflammatory cytokines, such as IL-1, IL-6, platelet-derived growth factor β, and tumor necrosis factor α, cells in irradiated areas can continue to secrete low levels of these cytokines after radiation therapy, thus priming an inflammatory reaction in the future.10 An alternative theory is that radiation induces mutations within surviving stem cells, rendering them unable to tolerate or unusually sensitive to subsequent chemotherapy and cytotoxic drugs. However, this premise would not explain how noncytotoxic drugs also can trigger radiation recall dermatitis, as described in our case.11
Prednisone-triggered radiation recall dermatitis is curious, as corticosteroids are used to treat the condition. Corticosteroids are classified by their chemical structure, and patch testing can be used to distinguish allergies across the various classes. Hydrocortisone acetate,
In contrast, triamcinolone is a class B steroid, which has a C16,17-cis-diol or -ketal. Other than budesonide, which can cross-react with D2 steroids, class B steroids do not cross-react with hydrocortisone or prednisone. Triamcinolone does not usually cross-react with D2 corticosteroids, which likely explains why our patient was later able to tolerate triamcinolone to treat eosinophilic gastrointestinal tract disease.
In summary, we present a case of radiation recall dermatitis triggered by prednisone. Radiation can prime an area for a future inflammatory response by upregulating proinflammatory cytokines or triggering stem cell mutation. In our case, clinical reactivity to hydrocortisone-17-butyrate and sensitization to tixocortol pivalate via patch testing could have increased the likelihood of a reaction with prednisone use due to cross-reactivity. This case instructs dermatologists, allergists, and oncologists to be aware of prednisone as a potential trigger of radiation recall dermatitis.
To the Editor:
A 69-year-old woman presented to the allergy clinic for evaluation of a rash on the left breast. The patient had a history of breast cancer that was treated with a lumpectomy followed by external beam radiation therapy (total dose, 6000 cGy) to the lateral aspect of the left breast approximately 4 years prior. She developed acute breast dermatitis from the radiation, which was self-treated with over-the-counter hydrocortisone cream. The patient subsequently developed a blistering skin eruption over the area where she applied the cream. She did not recall the subtype of hydrocortisone she used (butyrate and acetate are available over-the-counter). She discontinued the hydrocortisone and was started on triamcinolone cream 0.1%, which was well tolerated, and the rash resolved.
The patient had a history of a similar reaction to hydrocortisone butyrate after blepharoplasty approximately 10 years prior to the current presentation, characterized by facial erythema, pruritus, and blistering. A patch test confirmed reactivity to hydrocortisone-17-butyrate and tixocortol pivalate. However, a skin-prick test for hydrocortisone acetate cream 1% was negative.
Subsequently, the patient developed acute-onset dyspepsia, gnawing epigastric pain, regurgitation, and bloating. A diagnosis of eosinophilic gastritis was established via biopsy, which found increased eosinophils in the lamina propria (>50 eosinophils per high-power field). Helicobacter pylori was not identified. She was started on the proton-pump inhibitor dexlansoprazole but symptoms did not improve. Her other medications included benazepril, alprazolam as needed, vitamin D, and magnesium. The patient subsequently was started on a trial of oral prednisone 40 mg/d. Three days after initiation, she developed an erythematous macular rash over the left breast.
The next day she presented to the allergy clinic. Physical examination of the left breast revealed a 20×10-cm, nipple-sparing patch of well-demarcated erythema without fluctuance or overlying lesions. The area of erythema overlapped with the prior radiation field based on radiation marker tattoos and the lumpectomy scar (Figure). There was no evidence to suggest inflammation of deeper tissue or the pectoral muscles. Vital signs were normal, and the remainder of the examination was unremarkable, including breast, lymph node, and complete skin examinations.
At evaluation, the differential diagnosis included contact dermatitis, fixed drug eruption, infection, tumor recurrence with overlying skin changes, and radiation recall dermatitis. Given that the dermatitis had developed at the site of previously irradiated skin in the absence of fever or an associated mass, the presentation was thought to be most consistent with radiation recall dermatitis.
Oral prednisone was discontinued, and the dermatitis spontaneously improved in a few weeks. Given the patient’s test results and prior tolerance to triamcinolone, eosinophilic gastroenteritis was treated with triamcinolone acetonide 40 mg via intramuscular injection, which was well tolerated.
Radiation recall dermatitis is an acute inflammatory reaction over an area of skin that was previously irradiated. It is most often triggered by chemotherapy agents and occurs in as many as 9% of patients who receive chemotherapy after radiation.1 Commonly implicated chemotherapy agents include anthracyclines, taxanes, antimetabolites, and alkylating agents. Newer targeted cancer treatments also have been reported to trigger radiation recall dermatitis, including epidermal growth factor receptor inhibitors, vascular endothelial growth factor receptor inhibitors, mammalian target of rapamycin inhibitors, and anti–programmed cell death protein 1 monoclonal antibodies.2-5 Radiation recall dermatitis also has been reported to be triggered by intravenous contrast dye.6
The clinical presentation of radiation recall dermatitis ranges from mild rash to skin necrosis and desquamation. Patients often report pruritus or pain in the affected area. The US National Cancer Institute’s Common Terminology Criteria for Adverse Events (CTCAE) includes a 5-point scale for grading the severity of radiation recall dermatitis: grade 1, faint erythema or dry desquamation; grade 2, moderate to brisk erythema or patchy moist desquamation, mostly confined to skin folds and creases; grade 3, moist desquamation in areas other than skin folds and creases, with bleeding induced by minor trauma or abrasion; grade 4, skin necrosis or ulceration of full-thickness dermis, with spontaneous bleeding; grade 5, death.7 Based on these criteria, our patient had grade 2 radiation recall dermatitis.
In addition to cutaneous inflammation, additional sites can be inflamed, including the gastrointestinal tract, lungs, and oral mucosa. Cases of myocarditis, sialadenitis, and cystitis also have been reported.⁷
Radiation recall dermatitis can occur even if dermatitis did not occur upon initial treatment. The inflammatory reaction can occur weeks or years after initial irradiation. A study evaluating targeted chemotherapy agents found the median time from initiation of chemotherapy to radiation recall dermatitis was 16.9 weeks (range, 1–86.9 weeks). Inflammation usually lasts approximately 1 to 2 weeks but has been reported to persist as long as 14 weeks.8 Withdrawal of the offending agent in addition to administration of corticosteroids or nonsteroidal anti-inflammatory agents typically results in clinical improvement. Histology on skin biopsy is nonspecific and can reveal mixed infiltrates.7
The pathophysiology of radiation recall dermatitis remains unknown; the condition might be an idiosyncratic drug reaction. It has been hypothesized that prior radiation lowers the threshold for an inflammatory reaction, an example of Ruocco immunocompromised cutaneous districts, in which a prior injury at a cutaneous site increases the likelihood of opportunistic infection, tumor, and immune reactions.9 Because radiation can induce expression of inflammatory cytokines, such as IL-1, IL-6, platelet-derived growth factor β, and tumor necrosis factor α, cells in irradiated areas can continue to secrete low levels of these cytokines after radiation therapy, thus priming an inflammatory reaction in the future.10 An alternative theory is that radiation induces mutations within surviving stem cells, rendering them unable to tolerate or unusually sensitive to subsequent chemotherapy and cytotoxic drugs. However, this premise would not explain how noncytotoxic drugs also can trigger radiation recall dermatitis, as described in our case.11
Prednisone-triggered radiation recall dermatitis is curious, as corticosteroids are used to treat the condition. Corticosteroids are classified by their chemical structure, and patch testing can be used to distinguish allergies across the various classes. Hydrocortisone acetate,
In contrast, triamcinolone is a class B steroid, which has a C16,17-cis-diol or -ketal. Other than budesonide, which can cross-react with D2 steroids, class B steroids do not cross-react with hydrocortisone or prednisone. Triamcinolone does not usually cross-react with D2 corticosteroids, which likely explains why our patient was later able to tolerate triamcinolone to treat eosinophilic gastrointestinal tract disease.
In summary, we present a case of radiation recall dermatitis triggered by prednisone. Radiation can prime an area for a future inflammatory response by upregulating proinflammatory cytokines or triggering stem cell mutation. In our case, clinical reactivity to hydrocortisone-17-butyrate and sensitization to tixocortol pivalate via patch testing could have increased the likelihood of a reaction with prednisone use due to cross-reactivity. This case instructs dermatologists, allergists, and oncologists to be aware of prednisone as a potential trigger of radiation recall dermatitis.
- Kodym E, Kalinska R, Ehringfeld C, et al. Frequency of radiation recall dermatitis in adult cancer patients. Onkologie. 2005;28:18-21.
- Seidel C, Janssen S, Karstens JH, et al. Recall pneumonitis during systemic treatment with sunitinib. Ann Oncol. 2010;21:2119-2120.
- Togashi Y, Masago K, Mishima M, et al. A case of radiation recall pneumonitis induced by erlotinib, which can be related to high plasma concentration. J Thorac Oncol. 2010;5:924-925.
- Bourgier C, Massard C, Moldovan C, et al. Total recall of radiotherapy with mTOR inhibitors: a novel and potentially frequent side-effect? Ann Oncol. 2011;22:485-486.
- Korman AM, Tyler KH, Kaffenberger BH. Radiation recall dermatitis associated with nivolumab for metastatic malignant melanoma. Int J Dermatol. 2017;56:e75-e77.
- Lau SKM, Rahimi A. Radiation recall precipitated by iodinated nonionic contrast. Pract Radiat Oncol. 2015;5:263-266.
- US Department of Health and Human Services. Common Terminology Criteria for Adverse Events (CTCAE) Version 5.0. https://ctep.cancer.gov/protocoldevelopment/electronic
_applications/docs/CTCAE_v5_Quick_Reference_8.5x11.pdf. Published November 27, 2017. Accessed June 10, 2020.] - Levy A, Hollebecque A, Bourgier C, et al. Targeted therapy-induced radiation recall. Eur J Cancer. 2013;49:1662-1668.
- Piccolo V, Baroni A, Russo T, et al. Ruocco’s immunocompromised cutaneous district. Int J Dermatol. 2016;55:135-141.
- Johnson CJ, Piedboeuf P, Rubin P, et al. Early and persistent alterations in the expression of interleukin-1 alpha, interleukin-1 beta and tumour necrosis factor alpha mRNA levels in fibrosis-resistant and sensitive mice after thoracic irradiation. Radiat Res. 1996;145:762-767.
- Azira D, Magné N, Zouhair A, et al. Radiation recall: a well recognized but neglected phenomenon. Cancer Treat Rev. 2005;31:555-570.
- Jacob SE, Steele T. Corticosteroid classes: a quick reference guide including patch test substances and cross-reactivity. J Am Acad Dermatol. 2006;54:723-727.
- Kodym E, Kalinska R, Ehringfeld C, et al. Frequency of radiation recall dermatitis in adult cancer patients. Onkologie. 2005;28:18-21.
- Seidel C, Janssen S, Karstens JH, et al. Recall pneumonitis during systemic treatment with sunitinib. Ann Oncol. 2010;21:2119-2120.
- Togashi Y, Masago K, Mishima M, et al. A case of radiation recall pneumonitis induced by erlotinib, which can be related to high plasma concentration. J Thorac Oncol. 2010;5:924-925.
- Bourgier C, Massard C, Moldovan C, et al. Total recall of radiotherapy with mTOR inhibitors: a novel and potentially frequent side-effect? Ann Oncol. 2011;22:485-486.
- Korman AM, Tyler KH, Kaffenberger BH. Radiation recall dermatitis associated with nivolumab for metastatic malignant melanoma. Int J Dermatol. 2017;56:e75-e77.
- Lau SKM, Rahimi A. Radiation recall precipitated by iodinated nonionic contrast. Pract Radiat Oncol. 2015;5:263-266.
- US Department of Health and Human Services. Common Terminology Criteria for Adverse Events (CTCAE) Version 5.0. https://ctep.cancer.gov/protocoldevelopment/electronic
_applications/docs/CTCAE_v5_Quick_Reference_8.5x11.pdf. Published November 27, 2017. Accessed June 10, 2020.] - Levy A, Hollebecque A, Bourgier C, et al. Targeted therapy-induced radiation recall. Eur J Cancer. 2013;49:1662-1668.
- Piccolo V, Baroni A, Russo T, et al. Ruocco’s immunocompromised cutaneous district. Int J Dermatol. 2016;55:135-141.
- Johnson CJ, Piedboeuf P, Rubin P, et al. Early and persistent alterations in the expression of interleukin-1 alpha, interleukin-1 beta and tumour necrosis factor alpha mRNA levels in fibrosis-resistant and sensitive mice after thoracic irradiation. Radiat Res. 1996;145:762-767.
- Azira D, Magné N, Zouhair A, et al. Radiation recall: a well recognized but neglected phenomenon. Cancer Treat Rev. 2005;31:555-570.
- Jacob SE, Steele T. Corticosteroid classes: a quick reference guide including patch test substances and cross-reactivity. J Am Acad Dermatol. 2006;54:723-727.
Practice Points
- Consider the diagnosis of radiation recall dermatitis for a skin eruption that occurs in the same location as prior radiation exposure.
- Prednisone may be a trigger for radiation recall dermatitis in patients with sensitization to cross-reactive topical steroids such as tixocortol pivalate.
- Radiation therapy may prime the skin for a future inflammatory response by upregulating proinflammatory cytokines that persist after the conclusion of treatment.
Diabetes control in U.S. youth has worsened over time
Glycemic control among youth with diabetes is no better today than it was in 2002 and in some subgroups it’s worse, despite increased availability of diabetes technology, newer therapies, and more aggressive recommended blood glucose targets, new research finds.
The sobering data from 6,399 participants in the longitudinal SEARCH for Diabetes in Youth study were presented June 15 at the virtual American Diabetes Association 80th Scientific Sessions by Faisal S. Malik, MD, of the University of Washington, Seattle, and Seattle Children’s Research Institute.
“Our finding that current youth and young adults with diabetes are not demonstrating improved glycemic control, compared to earlier cohorts in the SEARCH study was surprising given how the landscape of diabetes management has changed dramatically over the past decade,” Dr. Malik said in an interview.
Urgent need to improve glycemic control in youth with diabetes
The SEARCH study, funded by the National Institute of Diabetes and Digestive and Kidney Diseases and the Centers for Disease Control and Prevention, is the largest and most diverse study of diabetes in youth in the United States. It has over 27,000 participants seen at five study sites in California, Colorado, Ohio, South Carolina, and Washington state.
Among youth with type 1 diabetes in the study, average hemoglobin A1c rose from 8.6% in 2002-2007 (n = 3,451) to 8.8% in 2008-2014 (n = 2,254), and remained at 8.8% in 2014-2019 (n = 1,651).
Among those with type 2 diabetes, A1c levels fluctuated from 8.8% (n = 379) to 8.4% (n = 327) to 8.5% (n = 469) in the three time periods, respectively.
By contrast, in 2014 the ADA recommended an A1c of less than 7.5% for youth of all ages with type 1 diabetes, down from prior less stringent targets.
In 2018, the ADA advised A1c levels below 7% for youth with type 2 diabetes. In both cases, targets may be adjusted based on individual circumstances.
A particularly striking data point was seen among youth who had type 2 diabetes for 10 years or more: average A1c skyrocketed from 7.9% in 2008-2013 to 10.1% in 2014-2019. The numbers were small, 25 patients in the earlier cohort and 149 patients in the later, yet the difference was still significant (P < .01). And in those with type 1 diabetes for 5-9 years, average A1c rose from 8.7% in 2002-2007 (n = 769) to 9.2% in 2014-2019 (n = 654) (P < .01).
“These results suggest that not all youth with diabetes are directly benefiting from the increased availability of diabetes technology, newer therapies, and the use of more aggressive glycemic targets for youth with diabetes over time,” Dr. Malik said.
“Recognizing that lower A1c levels in adolescence and young adulthood is associated with lower risk and rate of microvascular and macrovascular complications, this study further underscores the urgent need for effective treatment strategies to improve glycemic control in youth and young adults with diabetes,” he added.
Asked to comment, David M. Maahs, MD, said in an interview that the type 1 diabetes data are “very consistent” with those found in the T1D Exchange registry study but that both datasets include patients seen at diabetes centers and therefore may not represent the entire population.
“I don’t think there’s reason to think we’re actually doing any better than these data indicate,” said Dr. Maahs, professor of pediatrics and division chief of pediatric endocrinology at Stanford (Calif.) University.
Other countries improving, U.S. getting worse
Dr. Maahs contrasted the U.S. situation with that of the English/Welsh National Paediatric Diabetes Audit and some European countries that have improved pediatric diabetes control and outcomes using a population-based approach.
“In the United States we have a disjointed irrational health care system that doesn’t invest in diabetes education and in the basic care and monitoring that children with diabetes need to get better glucose control,” he said.
“We’re not having systematic approaches to it as many European countries have. They have gotten better results over this same time period. In the United States we’re getting worse,” Dr. Maahs observed.
And as far as diabetes technology is concerned, Dr. Maahs said, “there’s more to it than just throwing technology at it. People who are using technology are getting better outcomes, but there are a lot of people who don’t get access to it.”
Indeed, Dr. Malik pointed out, “while the recent SEARCH [type 1 diabetes] cohorts had increased insulin pump use, it’s worth noting that more than half of the participants in the most recent cohort were not using diabetes technology.” And even “fewer participants were likely using continuous glucose monitors during our study period.”
Barriers to care, type 1 diabetes is “very labor intensive”
Dr. Malik said that barriers to care include “high cost, alarm fatigue, and encumbrances of wearing a mechanical device [that] continue to present challenges around technology use,” as well as “inequities in the use of these technologies across socioeconomic status, health insurance, and race/ethnicity, which need to be addressed.”
Dr. Maahs did have a recommendation for U.S. primary care physicians who are managing youth with either type of diabetes: a tele-education program called Project ECHO (Extension for Community Healthcare Outcomes), which uses a train-the-trainer model, rather than direct telehealth, to bring tele-education to primary care providers.
Such programs in diabetes have shown some success, he said.
Type 1 diabetes, Dr. Malik noted, “is very labor intensive. Frequent or constant monitoring of glucose and multiple daily doses of basal and bolus insulin are commonly recommended by type 1 diabetes care providers in the United States.”
“This has led to increasingly burdensome management for children and their caregivers, which often results in suboptimal adherence, suboptimal glycemic control, and greater risk of complications.”
Dr. Malik encourages providers “to engage in person-centered collaborative care as recommended by the ADA, which is guided by shared decision-making in treatment regimen selection, facilitation of obtaining needed medical and psychosocial resources, and shared monitoring of agreed-upon regimen and lifestyle.”
Dr. Malik has reported no relevant financial relationships. Dr. Maahs has reported being on advisory boards for Medtronic, Lilly, and Abbott.
A version of this article originally appeared on Medscape.com.
Glycemic control among youth with diabetes is no better today than it was in 2002 and in some subgroups it’s worse, despite increased availability of diabetes technology, newer therapies, and more aggressive recommended blood glucose targets, new research finds.
The sobering data from 6,399 participants in the longitudinal SEARCH for Diabetes in Youth study were presented June 15 at the virtual American Diabetes Association 80th Scientific Sessions by Faisal S. Malik, MD, of the University of Washington, Seattle, and Seattle Children’s Research Institute.
“Our finding that current youth and young adults with diabetes are not demonstrating improved glycemic control, compared to earlier cohorts in the SEARCH study was surprising given how the landscape of diabetes management has changed dramatically over the past decade,” Dr. Malik said in an interview.
Urgent need to improve glycemic control in youth with diabetes
The SEARCH study, funded by the National Institute of Diabetes and Digestive and Kidney Diseases and the Centers for Disease Control and Prevention, is the largest and most diverse study of diabetes in youth in the United States. It has over 27,000 participants seen at five study sites in California, Colorado, Ohio, South Carolina, and Washington state.
Among youth with type 1 diabetes in the study, average hemoglobin A1c rose from 8.6% in 2002-2007 (n = 3,451) to 8.8% in 2008-2014 (n = 2,254), and remained at 8.8% in 2014-2019 (n = 1,651).
Among those with type 2 diabetes, A1c levels fluctuated from 8.8% (n = 379) to 8.4% (n = 327) to 8.5% (n = 469) in the three time periods, respectively.
By contrast, in 2014 the ADA recommended an A1c of less than 7.5% for youth of all ages with type 1 diabetes, down from prior less stringent targets.
In 2018, the ADA advised A1c levels below 7% for youth with type 2 diabetes. In both cases, targets may be adjusted based on individual circumstances.
A particularly striking data point was seen among youth who had type 2 diabetes for 10 years or more: average A1c skyrocketed from 7.9% in 2008-2013 to 10.1% in 2014-2019. The numbers were small, 25 patients in the earlier cohort and 149 patients in the later, yet the difference was still significant (P < .01). And in those with type 1 diabetes for 5-9 years, average A1c rose from 8.7% in 2002-2007 (n = 769) to 9.2% in 2014-2019 (n = 654) (P < .01).
“These results suggest that not all youth with diabetes are directly benefiting from the increased availability of diabetes technology, newer therapies, and the use of more aggressive glycemic targets for youth with diabetes over time,” Dr. Malik said.
“Recognizing that lower A1c levels in adolescence and young adulthood is associated with lower risk and rate of microvascular and macrovascular complications, this study further underscores the urgent need for effective treatment strategies to improve glycemic control in youth and young adults with diabetes,” he added.
Asked to comment, David M. Maahs, MD, said in an interview that the type 1 diabetes data are “very consistent” with those found in the T1D Exchange registry study but that both datasets include patients seen at diabetes centers and therefore may not represent the entire population.
“I don’t think there’s reason to think we’re actually doing any better than these data indicate,” said Dr. Maahs, professor of pediatrics and division chief of pediatric endocrinology at Stanford (Calif.) University.
Other countries improving, U.S. getting worse
Dr. Maahs contrasted the U.S. situation with that of the English/Welsh National Paediatric Diabetes Audit and some European countries that have improved pediatric diabetes control and outcomes using a population-based approach.
“In the United States we have a disjointed irrational health care system that doesn’t invest in diabetes education and in the basic care and monitoring that children with diabetes need to get better glucose control,” he said.
“We’re not having systematic approaches to it as many European countries have. They have gotten better results over this same time period. In the United States we’re getting worse,” Dr. Maahs observed.
And as far as diabetes technology is concerned, Dr. Maahs said, “there’s more to it than just throwing technology at it. People who are using technology are getting better outcomes, but there are a lot of people who don’t get access to it.”
Indeed, Dr. Malik pointed out, “while the recent SEARCH [type 1 diabetes] cohorts had increased insulin pump use, it’s worth noting that more than half of the participants in the most recent cohort were not using diabetes technology.” And even “fewer participants were likely using continuous glucose monitors during our study period.”
Barriers to care, type 1 diabetes is “very labor intensive”
Dr. Malik said that barriers to care include “high cost, alarm fatigue, and encumbrances of wearing a mechanical device [that] continue to present challenges around technology use,” as well as “inequities in the use of these technologies across socioeconomic status, health insurance, and race/ethnicity, which need to be addressed.”
Dr. Maahs did have a recommendation for U.S. primary care physicians who are managing youth with either type of diabetes: a tele-education program called Project ECHO (Extension for Community Healthcare Outcomes), which uses a train-the-trainer model, rather than direct telehealth, to bring tele-education to primary care providers.
Such programs in diabetes have shown some success, he said.
Type 1 diabetes, Dr. Malik noted, “is very labor intensive. Frequent or constant monitoring of glucose and multiple daily doses of basal and bolus insulin are commonly recommended by type 1 diabetes care providers in the United States.”
“This has led to increasingly burdensome management for children and their caregivers, which often results in suboptimal adherence, suboptimal glycemic control, and greater risk of complications.”
Dr. Malik encourages providers “to engage in person-centered collaborative care as recommended by the ADA, which is guided by shared decision-making in treatment regimen selection, facilitation of obtaining needed medical and psychosocial resources, and shared monitoring of agreed-upon regimen and lifestyle.”
Dr. Malik has reported no relevant financial relationships. Dr. Maahs has reported being on advisory boards for Medtronic, Lilly, and Abbott.
A version of this article originally appeared on Medscape.com.
Glycemic control among youth with diabetes is no better today than it was in 2002 and in some subgroups it’s worse, despite increased availability of diabetes technology, newer therapies, and more aggressive recommended blood glucose targets, new research finds.
The sobering data from 6,399 participants in the longitudinal SEARCH for Diabetes in Youth study were presented June 15 at the virtual American Diabetes Association 80th Scientific Sessions by Faisal S. Malik, MD, of the University of Washington, Seattle, and Seattle Children’s Research Institute.
“Our finding that current youth and young adults with diabetes are not demonstrating improved glycemic control, compared to earlier cohorts in the SEARCH study was surprising given how the landscape of diabetes management has changed dramatically over the past decade,” Dr. Malik said in an interview.
Urgent need to improve glycemic control in youth with diabetes
The SEARCH study, funded by the National Institute of Diabetes and Digestive and Kidney Diseases and the Centers for Disease Control and Prevention, is the largest and most diverse study of diabetes in youth in the United States. It has over 27,000 participants seen at five study sites in California, Colorado, Ohio, South Carolina, and Washington state.
Among youth with type 1 diabetes in the study, average hemoglobin A1c rose from 8.6% in 2002-2007 (n = 3,451) to 8.8% in 2008-2014 (n = 2,254), and remained at 8.8% in 2014-2019 (n = 1,651).
Among those with type 2 diabetes, A1c levels fluctuated from 8.8% (n = 379) to 8.4% (n = 327) to 8.5% (n = 469) in the three time periods, respectively.
By contrast, in 2014 the ADA recommended an A1c of less than 7.5% for youth of all ages with type 1 diabetes, down from prior less stringent targets.
In 2018, the ADA advised A1c levels below 7% for youth with type 2 diabetes. In both cases, targets may be adjusted based on individual circumstances.
A particularly striking data point was seen among youth who had type 2 diabetes for 10 years or more: average A1c skyrocketed from 7.9% in 2008-2013 to 10.1% in 2014-2019. The numbers were small, 25 patients in the earlier cohort and 149 patients in the later, yet the difference was still significant (P < .01). And in those with type 1 diabetes for 5-9 years, average A1c rose from 8.7% in 2002-2007 (n = 769) to 9.2% in 2014-2019 (n = 654) (P < .01).
“These results suggest that not all youth with diabetes are directly benefiting from the increased availability of diabetes technology, newer therapies, and the use of more aggressive glycemic targets for youth with diabetes over time,” Dr. Malik said.
“Recognizing that lower A1c levels in adolescence and young adulthood is associated with lower risk and rate of microvascular and macrovascular complications, this study further underscores the urgent need for effective treatment strategies to improve glycemic control in youth and young adults with diabetes,” he added.
Asked to comment, David M. Maahs, MD, said in an interview that the type 1 diabetes data are “very consistent” with those found in the T1D Exchange registry study but that both datasets include patients seen at diabetes centers and therefore may not represent the entire population.
“I don’t think there’s reason to think we’re actually doing any better than these data indicate,” said Dr. Maahs, professor of pediatrics and division chief of pediatric endocrinology at Stanford (Calif.) University.
Other countries improving, U.S. getting worse
Dr. Maahs contrasted the U.S. situation with that of the English/Welsh National Paediatric Diabetes Audit and some European countries that have improved pediatric diabetes control and outcomes using a population-based approach.
“In the United States we have a disjointed irrational health care system that doesn’t invest in diabetes education and in the basic care and monitoring that children with diabetes need to get better glucose control,” he said.
“We’re not having systematic approaches to it as many European countries have. They have gotten better results over this same time period. In the United States we’re getting worse,” Dr. Maahs observed.
And as far as diabetes technology is concerned, Dr. Maahs said, “there’s more to it than just throwing technology at it. People who are using technology are getting better outcomes, but there are a lot of people who don’t get access to it.”
Indeed, Dr. Malik pointed out, “while the recent SEARCH [type 1 diabetes] cohorts had increased insulin pump use, it’s worth noting that more than half of the participants in the most recent cohort were not using diabetes technology.” And even “fewer participants were likely using continuous glucose monitors during our study period.”
Barriers to care, type 1 diabetes is “very labor intensive”
Dr. Malik said that barriers to care include “high cost, alarm fatigue, and encumbrances of wearing a mechanical device [that] continue to present challenges around technology use,” as well as “inequities in the use of these technologies across socioeconomic status, health insurance, and race/ethnicity, which need to be addressed.”
Dr. Maahs did have a recommendation for U.S. primary care physicians who are managing youth with either type of diabetes: a tele-education program called Project ECHO (Extension for Community Healthcare Outcomes), which uses a train-the-trainer model, rather than direct telehealth, to bring tele-education to primary care providers.
Such programs in diabetes have shown some success, he said.
Type 1 diabetes, Dr. Malik noted, “is very labor intensive. Frequent or constant monitoring of glucose and multiple daily doses of basal and bolus insulin are commonly recommended by type 1 diabetes care providers in the United States.”
“This has led to increasingly burdensome management for children and their caregivers, which often results in suboptimal adherence, suboptimal glycemic control, and greater risk of complications.”
Dr. Malik encourages providers “to engage in person-centered collaborative care as recommended by the ADA, which is guided by shared decision-making in treatment regimen selection, facilitation of obtaining needed medical and psychosocial resources, and shared monitoring of agreed-upon regimen and lifestyle.”
Dr. Malik has reported no relevant financial relationships. Dr. Maahs has reported being on advisory boards for Medtronic, Lilly, and Abbott.
A version of this article originally appeared on Medscape.com.
FROM ADA 2020
SHM responds to racism in the United States
The Society of Hospital Medicine deplores the negative impact of racism in our nation and will always strive to remedy racial inequities in our health care system. Racism in our society cannot be ignored. Nor will SHM ignore racism’s impact on public health. SHM enthusiastically supports its members working to promote equity and reduce the adverse impact of racism. We are committed to using our platform to improve the health of patients everywhere.
SHM would like to reaffirm its long-valued dedication to diversity and inclusion. We remain committed to promoting healthy discussions and action throughout our publications, resources and member communities, as outlined by our diversity and inclusion statement.
SHM Diversity and Inclusion Statement
Hospitalists are charged with treating individuals at their most vulnerable moments, when being respected as a whole person is crucial to advance patients’ healing and wellness. Within our workforce, diversity is a strength in all its forms, which helps us learn about the human experience, grow as leaders, and ultimately create a respectful environment for all regardless of age, race, religion, national origin, gender identity, sexual orientation, socioeconomic status, appearance, or ability.
To this end, the Society of Hospital Medicine will work to eliminate health disparities for our patients and foster inclusive and equitable cultures across our care teams and institutions with the goal of moving medicine and humanity forward.
The Society of Hospital Medicine deplores the negative impact of racism in our nation and will always strive to remedy racial inequities in our health care system. Racism in our society cannot be ignored. Nor will SHM ignore racism’s impact on public health. SHM enthusiastically supports its members working to promote equity and reduce the adverse impact of racism. We are committed to using our platform to improve the health of patients everywhere.
SHM would like to reaffirm its long-valued dedication to diversity and inclusion. We remain committed to promoting healthy discussions and action throughout our publications, resources and member communities, as outlined by our diversity and inclusion statement.
SHM Diversity and Inclusion Statement
Hospitalists are charged with treating individuals at their most vulnerable moments, when being respected as a whole person is crucial to advance patients’ healing and wellness. Within our workforce, diversity is a strength in all its forms, which helps us learn about the human experience, grow as leaders, and ultimately create a respectful environment for all regardless of age, race, religion, national origin, gender identity, sexual orientation, socioeconomic status, appearance, or ability.
To this end, the Society of Hospital Medicine will work to eliminate health disparities for our patients and foster inclusive and equitable cultures across our care teams and institutions with the goal of moving medicine and humanity forward.
The Society of Hospital Medicine deplores the negative impact of racism in our nation and will always strive to remedy racial inequities in our health care system. Racism in our society cannot be ignored. Nor will SHM ignore racism’s impact on public health. SHM enthusiastically supports its members working to promote equity and reduce the adverse impact of racism. We are committed to using our platform to improve the health of patients everywhere.
SHM would like to reaffirm its long-valued dedication to diversity and inclusion. We remain committed to promoting healthy discussions and action throughout our publications, resources and member communities, as outlined by our diversity and inclusion statement.
SHM Diversity and Inclusion Statement
Hospitalists are charged with treating individuals at their most vulnerable moments, when being respected as a whole person is crucial to advance patients’ healing and wellness. Within our workforce, diversity is a strength in all its forms, which helps us learn about the human experience, grow as leaders, and ultimately create a respectful environment for all regardless of age, race, religion, national origin, gender identity, sexual orientation, socioeconomic status, appearance, or ability.
To this end, the Society of Hospital Medicine will work to eliminate health disparities for our patients and foster inclusive and equitable cultures across our care teams and institutions with the goal of moving medicine and humanity forward.
In scleroderma, GERD questionnaires are essential tools
Every rheumatologist ought to be comfortable in using a validated gastrointestinal symptom scale for evaluation of gastroesophageal reflux disease in patients with scleroderma, Tracy M. Frech, MD, declared at the virtual edition of the American College of Rheumatology’s 2020 State-of-the-Art Clinical Symposium.

About 90% of scleroderma patients will develop GI tract involvement during the course of their connective tissue disease. And while any portion of the GI tract from esophagus to anus can be involved, the most common GI manifestation is gastroesophageal reflux disease (GERD), affecting up to 90% of scleroderma patients, observed Dr. Frech, a rheumatologist and director of the systemic sclerosis clinic at the University of Utah and the George E. Wahlen Department of Veterans Affairs Medical Center, both in Salt Lake City.
“It is essential to ask scleroderma patients questions in order to understand their gastrointestinal tract symptoms. The questionnaires are really critical for us to grade the severity and then properly order tests,” she explained. “The goal is symptom identification, ideally with minimal time burden and at no cost, to guide decisions that move our patients’ care forward.”
Three of the most useful validated instruments for assessment of GERD symptoms in scleroderma patients in routine clinical practice are the GerdQ, the University of California, Los Angeles, Scleroderma Clinical Trial Consortium GI Tract Questionnaire (UCLA GIT) 2.0 reflux scale, and the Patient-Reported Outcomes Measurement Information System (PROMIS) reflux scale.
The GerdQ is a six-item, self-administered questionnaire in which patients specify how many days in the past week they have experienced heartburn, regurgitation, nausea, sleep interference, upper abdominal pain, and need for medication. A free online tool is available for calculating the likelihood of having GERD based upon GerdQ score. A score of 8 or more points out of a possible 18 has the highest sensitivity and specificity for diagnosis of GERD.
The UCLA GIT 2.0 – the most commonly used instrument for GI symptom assessment in scleroderma patients – includes 34 items. It takes 6-8 minutes to complete the whole thing, but patients being assessed for GERD only need answer the eight GERD-specific questions. Six of these eight questions are the same as in the GerdQ. One of the two extra questions asks about difficulty in swallowing solid food, which if answered affirmatively warrants early referral to a gastroenterologist. The other question inquires about any food triggers for the reflux, providing an opportunity for a rheumatologist to educate the patient about the importance of avoiding acidic foods, such as tomatoes, and other food and drink generally considered healthy but which actually exacerbate GERD.
The National Institutes of Health PROMIS scale, the newest of the three instruments, is a 60-item questionnaire; however, only 20 questions relate to reflux and dysphagia and are thus germane to a focused GERD assessment in scleroderma.
When a clinical diagnosis of GERD is made in a scleroderma patient based upon symptoms elicited by questionnaire, guidelines recommend a trial of empiric proton pump inhibitor therapy and behavioral interventions, such as raising the head of the bed, in order to confirm the diagnosis. If the patient reports feeling better after these basic interventions, the diagnosis is confirmed. If not, it’s time to make a referral to a gastroenterologist for specialized care, Dr. Frech said.
Dr. Frech was a coinvestigator in an international, prospective, longitudinal study of patient-reported outcomes measures in 116 patients with scleroderma and GERD. All study participants had to complete the UCLA GIT 2.0, the PROMIS reflux scale, and a third patient-reported GERD measure both before and after the therapeutic intervention. The UCLA GIT 2.0 and PROMIS instruments demonstrated similarly robust sensitivity for identifying changes in GERD symptoms after therapeutic intervention.
“It doesn’t really matter what questionnaire we’re using,” according to the rheumatologist. “But I will point out that there is significant overlap in symptoms among GERD, gastroparesis, functional dyspepsia, and eosinophilic esophagitis, all of which cause symptoms of heartburn and regurgitation. So we don’t want to ask these questions just once, we want to make an intervention and then reask the questions to ensure that we’re continuously moving forward with the gastrointestinal tract management plan.”
Dr. Frech reported having no financial conflicts regarding her presentation.
Every rheumatologist ought to be comfortable in using a validated gastrointestinal symptom scale for evaluation of gastroesophageal reflux disease in patients with scleroderma, Tracy M. Frech, MD, declared at the virtual edition of the American College of Rheumatology’s 2020 State-of-the-Art Clinical Symposium.
About 90% of scleroderma patients will develop GI tract involvement during the course of their connective tissue disease. And while any portion of the GI tract from esophagus to anus can be involved, the most common GI manifestation is gastroesophageal reflux disease (GERD), affecting up to 90% of scleroderma patients, observed Dr. Frech, a rheumatologist and director of the systemic sclerosis clinic at the University of Utah and the George E. Wahlen Department of Veterans Affairs Medical Center, both in Salt Lake City.
“It is essential to ask scleroderma patients questions in order to understand their gastrointestinal tract symptoms. The questionnaires are really critical for us to grade the severity and then properly order tests,” she explained. “The goal is symptom identification, ideally with minimal time burden and at no cost, to guide decisions that move our patients’ care forward.”
Three of the most useful validated instruments for assessment of GERD symptoms in scleroderma patients in routine clinical practice are the GerdQ, the University of California, Los Angeles, Scleroderma Clinical Trial Consortium GI Tract Questionnaire (UCLA GIT) 2.0 reflux scale, and the Patient-Reported Outcomes Measurement Information System (PROMIS) reflux scale.
The GerdQ is a six-item, self-administered questionnaire in which patients specify how many days in the past week they have experienced heartburn, regurgitation, nausea, sleep interference, upper abdominal pain, and need for medication. A free online tool is available for calculating the likelihood of having GERD based upon GerdQ score. A score of 8 or more points out of a possible 18 has the highest sensitivity and specificity for diagnosis of GERD.
The UCLA GIT 2.0 – the most commonly used instrument for GI symptom assessment in scleroderma patients – includes 34 items. It takes 6-8 minutes to complete the whole thing, but patients being assessed for GERD only need answer the eight GERD-specific questions. Six of these eight questions are the same as in the GerdQ. One of the two extra questions asks about difficulty in swallowing solid food, which if answered affirmatively warrants early referral to a gastroenterologist. The other question inquires about any food triggers for the reflux, providing an opportunity for a rheumatologist to educate the patient about the importance of avoiding acidic foods, such as tomatoes, and other food and drink generally considered healthy but which actually exacerbate GERD.
The National Institutes of Health PROMIS scale, the newest of the three instruments, is a 60-item questionnaire; however, only 20 questions relate to reflux and dysphagia and are thus germane to a focused GERD assessment in scleroderma.
When a clinical diagnosis of GERD is made in a scleroderma patient based upon symptoms elicited by questionnaire, guidelines recommend a trial of empiric proton pump inhibitor therapy and behavioral interventions, such as raising the head of the bed, in order to confirm the diagnosis. If the patient reports feeling better after these basic interventions, the diagnosis is confirmed. If not, it’s time to make a referral to a gastroenterologist for specialized care, Dr. Frech said.
Dr. Frech was a coinvestigator in an international, prospective, longitudinal study of patient-reported outcomes measures in 116 patients with scleroderma and GERD. All study participants had to complete the UCLA GIT 2.0, the PROMIS reflux scale, and a third patient-reported GERD measure both before and after the therapeutic intervention. The UCLA GIT 2.0 and PROMIS instruments demonstrated similarly robust sensitivity for identifying changes in GERD symptoms after therapeutic intervention.
“It doesn’t really matter what questionnaire we’re using,” according to the rheumatologist. “But I will point out that there is significant overlap in symptoms among GERD, gastroparesis, functional dyspepsia, and eosinophilic esophagitis, all of which cause symptoms of heartburn and regurgitation. So we don’t want to ask these questions just once, we want to make an intervention and then reask the questions to ensure that we’re continuously moving forward with the gastrointestinal tract management plan.”
Dr. Frech reported having no financial conflicts regarding her presentation.
Every rheumatologist ought to be comfortable in using a validated gastrointestinal symptom scale for evaluation of gastroesophageal reflux disease in patients with scleroderma, Tracy M. Frech, MD, declared at the virtual edition of the American College of Rheumatology’s 2020 State-of-the-Art Clinical Symposium.
About 90% of scleroderma patients will develop GI tract involvement during the course of their connective tissue disease. And while any portion of the GI tract from esophagus to anus can be involved, the most common GI manifestation is gastroesophageal reflux disease (GERD), affecting up to 90% of scleroderma patients, observed Dr. Frech, a rheumatologist and director of the systemic sclerosis clinic at the University of Utah and the George E. Wahlen Department of Veterans Affairs Medical Center, both in Salt Lake City.
“It is essential to ask scleroderma patients questions in order to understand their gastrointestinal tract symptoms. The questionnaires are really critical for us to grade the severity and then properly order tests,” she explained. “The goal is symptom identification, ideally with minimal time burden and at no cost, to guide decisions that move our patients’ care forward.”
Three of the most useful validated instruments for assessment of GERD symptoms in scleroderma patients in routine clinical practice are the GerdQ, the University of California, Los Angeles, Scleroderma Clinical Trial Consortium GI Tract Questionnaire (UCLA GIT) 2.0 reflux scale, and the Patient-Reported Outcomes Measurement Information System (PROMIS) reflux scale.
The GerdQ is a six-item, self-administered questionnaire in which patients specify how many days in the past week they have experienced heartburn, regurgitation, nausea, sleep interference, upper abdominal pain, and need for medication. A free online tool is available for calculating the likelihood of having GERD based upon GerdQ score. A score of 8 or more points out of a possible 18 has the highest sensitivity and specificity for diagnosis of GERD.
The UCLA GIT 2.0 – the most commonly used instrument for GI symptom assessment in scleroderma patients – includes 34 items. It takes 6-8 minutes to complete the whole thing, but patients being assessed for GERD only need answer the eight GERD-specific questions. Six of these eight questions are the same as in the GerdQ. One of the two extra questions asks about difficulty in swallowing solid food, which if answered affirmatively warrants early referral to a gastroenterologist. The other question inquires about any food triggers for the reflux, providing an opportunity for a rheumatologist to educate the patient about the importance of avoiding acidic foods, such as tomatoes, and other food and drink generally considered healthy but which actually exacerbate GERD.
The National Institutes of Health PROMIS scale, the newest of the three instruments, is a 60-item questionnaire; however, only 20 questions relate to reflux and dysphagia and are thus germane to a focused GERD assessment in scleroderma.
When a clinical diagnosis of GERD is made in a scleroderma patient based upon symptoms elicited by questionnaire, guidelines recommend a trial of empiric proton pump inhibitor therapy and behavioral interventions, such as raising the head of the bed, in order to confirm the diagnosis. If the patient reports feeling better after these basic interventions, the diagnosis is confirmed. If not, it’s time to make a referral to a gastroenterologist for specialized care, Dr. Frech said.
Dr. Frech was a coinvestigator in an international, prospective, longitudinal study of patient-reported outcomes measures in 116 patients with scleroderma and GERD. All study participants had to complete the UCLA GIT 2.0, the PROMIS reflux scale, and a third patient-reported GERD measure both before and after the therapeutic intervention. The UCLA GIT 2.0 and PROMIS instruments demonstrated similarly robust sensitivity for identifying changes in GERD symptoms after therapeutic intervention.
“It doesn’t really matter what questionnaire we’re using,” according to the rheumatologist. “But I will point out that there is significant overlap in symptoms among GERD, gastroparesis, functional dyspepsia, and eosinophilic esophagitis, all of which cause symptoms of heartburn and regurgitation. So we don’t want to ask these questions just once, we want to make an intervention and then reask the questions to ensure that we’re continuously moving forward with the gastrointestinal tract management plan.”
Dr. Frech reported having no financial conflicts regarding her presentation.
FROM SOTA 2020
Azacitidine plus enasidenib improves response, but not survival, in mIDH2 AML
Azacitidine plus enasidenib improved complete and overall responses in newly diagnosed acute myelogenous leukemia with isocitrate dehydrogenase 2 gene mutations, compared with azacitidine alone, but it did not improve overall survival in an open-label, phase 2 trial reported at the virtual annual congress of the European Hematology Association.
“Given the very high cost of” enasidenib, and the lack of survival benefit, Gunnar Juliusson, MD, PhD, of Lund University, Sweden, who moderated the study presentation, wondered if it might make more sense to hold enasidenib in reserve until after progression on azacitidine.
“The challenge is going to be exactly” that, “trying to figure out [if] you use both things together” or in sequence. “You can look at it in both ways,” said lead investigator Courtney DiNardo, MD, associate professor in the department of leukemia at the University of Texas MD Anderson Cancer Center, Houston.
“We do know” that with enasidenib monotherapy, there’s “a decrement in the rates of remission and in the duration of response” and overall survival in the salvage setting, so there’s “a clear rationale to give it earlier rather than later,” but “I think this study in some ways provides a few more questions than it really answers,” she said at the meeting.
About 15% of AML patients have leukemogenic isocitrate dehydrogenase 2 (IDH2) mutations; enasidenib, an oral small molecule, inhibits the mutant enzyme. The older AML patients are, the more likely they are to have an IDH2 mutation, so the work “is relevant to our older chemotherapy ineligible population,” Dr. DiNardo said.
The trial was prompted by preclinical indications of synergy with azacitidine; alone, each agent has an overall response rate of about 30% in newly diagnosed AML, and a complete remission (CR) rate of about 20%, she explained.
Her team randomized 68 adults with newly diagnosed AML and an IDH2 mutation to enasidenib 100 mg daily on a 28-day cycle with subcutaneous azacitidine 75 mg/m2 for 7 days during the cycle, and 33 others to just the azacitidine alone.
Their subjects were ineligible for intensive chemotherapy and had intermediate to poor risk cytogenetics. The median age was 75 years, and Eastern Cooperative Oncology Group performance scores were 2 or less.
The overall response rate was 71% with the combination and 42% in the azacitidine alone arm (P = .0064). Fifty-three percent of combination patients, but 12% of azacitidine alone subjects, had complete remissions (P = .0001). The median duration of response with combination therapy was 24.1 months, versus 12.1 months.
Enasidenib plus azacitidine subjects also had greater drops in mutant IDH2 variant allele frequency (median 83.4% versus 17.7%, P < .01) and levels of the downstream oncometabolite 2-hydroxyglutarate (97.8% versus 54.3%; P < .01).
However, median OS was 22 months in both arms (HR 0.99, 95% CI 0.52, 1.87, P = .97). Although median event-free survival favored the combination – 17.2 months versus 10.8 – the results were not statistically significant (HR 0.59, 95% CI 0.30, 1.17, P = .13).
A possible reason for the lack of survival benefit, Dr. DiNardo said, was that seven azacitidine-alone patients (21%) went on to enasidenib after leaving the study, most commonly for disease progression, which occurred in 31% of combination patients versus 52% in the azacitidine-alone arm.
Combination subjects had a median of 10 treatment cycles, vs. 7 in the azacitidine-alone group. Grade 3-4 adverse events included thrombocytopenia (37% combination, 19% azacitidine-alone), neutropenia (35% vs. 22%), anemia (19% vs. 22%), and febrile neutropenia (15% vs. 16%). Grade 3-4 infections were more common with azacitidine monotherapy (31% vs. 18%).
Twelve enasidenib/azacitidine subjects (18%) developed isocitrate dehydrogenase differentiation syndrome, a complication that carries a black box warning in enasidenib’s label.
The work was funded by enasidenib marketer Celgene. Dr. DiNardo is an adviser to, and receives research funding from, the company. Dr. Juliusson’s disclosures, if any, were not reported.
SOURCE: DiNardo CD et al. EHA Congress, abstract S139.
Azacitidine plus enasidenib improved complete and overall responses in newly diagnosed acute myelogenous leukemia with isocitrate dehydrogenase 2 gene mutations, compared with azacitidine alone, but it did not improve overall survival in an open-label, phase 2 trial reported at the virtual annual congress of the European Hematology Association.
“Given the very high cost of” enasidenib, and the lack of survival benefit, Gunnar Juliusson, MD, PhD, of Lund University, Sweden, who moderated the study presentation, wondered if it might make more sense to hold enasidenib in reserve until after progression on azacitidine.
“The challenge is going to be exactly” that, “trying to figure out [if] you use both things together” or in sequence. “You can look at it in both ways,” said lead investigator Courtney DiNardo, MD, associate professor in the department of leukemia at the University of Texas MD Anderson Cancer Center, Houston.
“We do know” that with enasidenib monotherapy, there’s “a decrement in the rates of remission and in the duration of response” and overall survival in the salvage setting, so there’s “a clear rationale to give it earlier rather than later,” but “I think this study in some ways provides a few more questions than it really answers,” she said at the meeting.
About 15% of AML patients have leukemogenic isocitrate dehydrogenase 2 (IDH2) mutations; enasidenib, an oral small molecule, inhibits the mutant enzyme. The older AML patients are, the more likely they are to have an IDH2 mutation, so the work “is relevant to our older chemotherapy ineligible population,” Dr. DiNardo said.
The trial was prompted by preclinical indications of synergy with azacitidine; alone, each agent has an overall response rate of about 30% in newly diagnosed AML, and a complete remission (CR) rate of about 20%, she explained.
Her team randomized 68 adults with newly diagnosed AML and an IDH2 mutation to enasidenib 100 mg daily on a 28-day cycle with subcutaneous azacitidine 75 mg/m2 for 7 days during the cycle, and 33 others to just the azacitidine alone.
Their subjects were ineligible for intensive chemotherapy and had intermediate to poor risk cytogenetics. The median age was 75 years, and Eastern Cooperative Oncology Group performance scores were 2 or less.
The overall response rate was 71% with the combination and 42% in the azacitidine alone arm (P = .0064). Fifty-three percent of combination patients, but 12% of azacitidine alone subjects, had complete remissions (P = .0001). The median duration of response with combination therapy was 24.1 months, versus 12.1 months.
Enasidenib plus azacitidine subjects also had greater drops in mutant IDH2 variant allele frequency (median 83.4% versus 17.7%, P < .01) and levels of the downstream oncometabolite 2-hydroxyglutarate (97.8% versus 54.3%; P < .01).
However, median OS was 22 months in both arms (HR 0.99, 95% CI 0.52, 1.87, P = .97). Although median event-free survival favored the combination – 17.2 months versus 10.8 – the results were not statistically significant (HR 0.59, 95% CI 0.30, 1.17, P = .13).
A possible reason for the lack of survival benefit, Dr. DiNardo said, was that seven azacitidine-alone patients (21%) went on to enasidenib after leaving the study, most commonly for disease progression, which occurred in 31% of combination patients versus 52% in the azacitidine-alone arm.
Combination subjects had a median of 10 treatment cycles, vs. 7 in the azacitidine-alone group. Grade 3-4 adverse events included thrombocytopenia (37% combination, 19% azacitidine-alone), neutropenia (35% vs. 22%), anemia (19% vs. 22%), and febrile neutropenia (15% vs. 16%). Grade 3-4 infections were more common with azacitidine monotherapy (31% vs. 18%).
Twelve enasidenib/azacitidine subjects (18%) developed isocitrate dehydrogenase differentiation syndrome, a complication that carries a black box warning in enasidenib’s label.
The work was funded by enasidenib marketer Celgene. Dr. DiNardo is an adviser to, and receives research funding from, the company. Dr. Juliusson’s disclosures, if any, were not reported.
SOURCE: DiNardo CD et al. EHA Congress, abstract S139.
Azacitidine plus enasidenib improved complete and overall responses in newly diagnosed acute myelogenous leukemia with isocitrate dehydrogenase 2 gene mutations, compared with azacitidine alone, but it did not improve overall survival in an open-label, phase 2 trial reported at the virtual annual congress of the European Hematology Association.
“Given the very high cost of” enasidenib, and the lack of survival benefit, Gunnar Juliusson, MD, PhD, of Lund University, Sweden, who moderated the study presentation, wondered if it might make more sense to hold enasidenib in reserve until after progression on azacitidine.
“The challenge is going to be exactly” that, “trying to figure out [if] you use both things together” or in sequence. “You can look at it in both ways,” said lead investigator Courtney DiNardo, MD, associate professor in the department of leukemia at the University of Texas MD Anderson Cancer Center, Houston.
“We do know” that with enasidenib monotherapy, there’s “a decrement in the rates of remission and in the duration of response” and overall survival in the salvage setting, so there’s “a clear rationale to give it earlier rather than later,” but “I think this study in some ways provides a few more questions than it really answers,” she said at the meeting.
About 15% of AML patients have leukemogenic isocitrate dehydrogenase 2 (IDH2) mutations; enasidenib, an oral small molecule, inhibits the mutant enzyme. The older AML patients are, the more likely they are to have an IDH2 mutation, so the work “is relevant to our older chemotherapy ineligible population,” Dr. DiNardo said.
The trial was prompted by preclinical indications of synergy with azacitidine; alone, each agent has an overall response rate of about 30% in newly diagnosed AML, and a complete remission (CR) rate of about 20%, she explained.
Her team randomized 68 adults with newly diagnosed AML and an IDH2 mutation to enasidenib 100 mg daily on a 28-day cycle with subcutaneous azacitidine 75 mg/m2 for 7 days during the cycle, and 33 others to just the azacitidine alone.
Their subjects were ineligible for intensive chemotherapy and had intermediate to poor risk cytogenetics. The median age was 75 years, and Eastern Cooperative Oncology Group performance scores were 2 or less.
The overall response rate was 71% with the combination and 42% in the azacitidine alone arm (P = .0064). Fifty-three percent of combination patients, but 12% of azacitidine alone subjects, had complete remissions (P = .0001). The median duration of response with combination therapy was 24.1 months, versus 12.1 months.
Enasidenib plus azacitidine subjects also had greater drops in mutant IDH2 variant allele frequency (median 83.4% versus 17.7%, P < .01) and levels of the downstream oncometabolite 2-hydroxyglutarate (97.8% versus 54.3%; P < .01).
However, median OS was 22 months in both arms (HR 0.99, 95% CI 0.52, 1.87, P = .97). Although median event-free survival favored the combination – 17.2 months versus 10.8 – the results were not statistically significant (HR 0.59, 95% CI 0.30, 1.17, P = .13).
A possible reason for the lack of survival benefit, Dr. DiNardo said, was that seven azacitidine-alone patients (21%) went on to enasidenib after leaving the study, most commonly for disease progression, which occurred in 31% of combination patients versus 52% in the azacitidine-alone arm.
Combination subjects had a median of 10 treatment cycles, vs. 7 in the azacitidine-alone group. Grade 3-4 adverse events included thrombocytopenia (37% combination, 19% azacitidine-alone), neutropenia (35% vs. 22%), anemia (19% vs. 22%), and febrile neutropenia (15% vs. 16%). Grade 3-4 infections were more common with azacitidine monotherapy (31% vs. 18%).
Twelve enasidenib/azacitidine subjects (18%) developed isocitrate dehydrogenase differentiation syndrome, a complication that carries a black box warning in enasidenib’s label.
The work was funded by enasidenib marketer Celgene. Dr. DiNardo is an adviser to, and receives research funding from, the company. Dr. Juliusson’s disclosures, if any, were not reported.
SOURCE: DiNardo CD et al. EHA Congress, abstract S139.
FROM EHA CONGRESS
More than 10,000 excess cancer deaths because of COVID-19 delays
A model created by the National Cancer Institute predicts that tens of thousands of excess cancer deaths will occur over the next decade as a result of missed screenings, delays in diagnosis, and reductions in oncology care caused by the COVID-19 pandemic.
“As director of NCI, I am deeply concerned about the potential impacts of delayed diagnoses and deferred or modified treatment plans on cancer incidence and mortality,” said Norman “Ned” Sharpless, MD.
“In the past 3 decades, we have seen steady and strong progress against death and suffering from cancer, thanks to improvements in prevention, screening, diagnosis, and treatment. I worry that the SARS-CoV-2 pandemic has put those decades of steady progress at risk and may precipitate reversals of these trends.”
In an editorial published June 19 in Science, Dr. Sharpless highlighted modeling performed by the NCI that predicts an excess of 10,000 deaths from breast and colorectal cancer over the next 10 years.
The number of excess deaths per year would peak in the next year or 2, likely sooner for colorectal than for breast cancer, but “for both cancer types, we believe the pandemic will influence cancer deaths for at least a decade.”
In an interview, Dr. Sharpless pointed out that this analysis is conservative because the researchers only evaluated two types of cancer. They chose breast and colorectal cancer because these are common cancers (accounting for about one-sixth of all cancers) with relatively high screening rates.
“We didn’t model other cancer types, but we have no reason to think that we’re not going to see the same thing with other types of malignancies,” he said. “That is a significant amount of excess mortality.”
Delayed diagnosis, modified therapy
One of the effects of the pandemic has been to cause delays in cancer diagnosis. “Routine screening has plummeted and is running at less than 90% in some systems,” Dr. Sharpless said.
“Most cancers are diagnosed when people experience symptoms and go see their doctors, and those symptomatic screening events are also not happening,” he continued. “Fear of contracting the coronavirus in health care settings has dissuaded people from visits.”
In some cases, a delay in diagnosis will allow the cancer to progress to a more advanced stage. “The earlier the diagnosis, the better, and if the stages are more advanced, patients will not do as well for virtually every kind of cancer,” he said.
In addition to delays in diagnosis, treatments are being postponed or modified for patients recently diagnosed with cancer. Because of delays and reductions in curative therapies, patients may be receiving less than optimal care.
“We are seeing a lot of nonstandard care,” said Dr. Sharpless. “All of these things add up to increased cancer morbidity and mortality.”
He also pointed out that the term “elective” is confusing and problematic. “It doesn’t mean that it’s not needed, just that it’s not an emergency and doesn’t need to be done today,” said Dr. Sharpless. “But if we’re talking about chemotherapy and surgery, we don’t think they can be delayed for too long – maybe a week, but not for several months.”
Dr. Sharpless feels that overall it is time for cancer care to resume as much as possible, because “ignoring cancer for too long is an untenable choice and may turn one public health crisis into another.”
“If we act now, we can make up for lost time,” he wrote in the editorial. “Clearly, postponing procedures and deferring care due to the pandemic was prudent at one time, but now that we have made it through the initial shock of the pandemic, I believe it is time to resume robust cancer care.”
Through their network of cancer centers, researchers with the NCI can develop innovative solutions that allow screening and treatment to move forward while maintaining safety. “We need to make patients feel safe, and we have to answer important questions quickly,” he said.
Impact of COVID-19 on cancer care
The COVID-19 pandemic has overwhelmed health care systems worldwide and has created major challenges for clinicians who are caring for patients with cancer.
As previously reported, hospitals reprioritized resources for an impending onslaught of COVID-19 patients. Services and procedures deemed to be nonessential were canceled or delayed, including surgeries and imaging.
In a survey conducted by the American Cancer Society Cancer Action Network, half of the 1219 respondents reported changes, delays, or disruptions to the care they were receiving. The services most frequently affected included in-person provider visits (50%), supportive services (20%), and imaging procedures to monitor tumor growth (20%).
In addition, 8% reported that their treatment, including chemotherapy and immunotherapy, had been affected by the COVID-19 pandemic.
In the United Kingdom, Cancer Research UK estimated that because of the disruption to cancer services, 2.4 million people did not undergo cancer screening or further testing or did not receive cancer treatment and that tens of thousands of cases have gone undiagnosed.
Similarly, a survey by Macmillan Cancer Support showed that almost half (45%) of cancer patients have experienced delays or cancellations of cancer treatments, or their treatments have been altered as a result of coronavirus, leaving many living in fear. Calling cancer “the forgotten C” of the pandemic, it warned of a potential cancer “time bomb” when, as the number of deaths from COVID-19 falls, cancer returns as the leading cause of death in the United Kingdom.
Last month, a report also predicted that there will be an excess of cancer deaths in both the United States and United Kingdom because of patients not accessing health care services.
The authors calculated that there will be 6270 excess deaths among cancer patients 1 year from now in England and 33,890 excess deaths among cancer patients older than 40 years in the United States.
This article first appeared on Medscape.com.
A model created by the National Cancer Institute predicts that tens of thousands of excess cancer deaths will occur over the next decade as a result of missed screenings, delays in diagnosis, and reductions in oncology care caused by the COVID-19 pandemic.
“As director of NCI, I am deeply concerned about the potential impacts of delayed diagnoses and deferred or modified treatment plans on cancer incidence and mortality,” said Norman “Ned” Sharpless, MD.
“In the past 3 decades, we have seen steady and strong progress against death and suffering from cancer, thanks to improvements in prevention, screening, diagnosis, and treatment. I worry that the SARS-CoV-2 pandemic has put those decades of steady progress at risk and may precipitate reversals of these trends.”
In an editorial published June 19 in Science, Dr. Sharpless highlighted modeling performed by the NCI that predicts an excess of 10,000 deaths from breast and colorectal cancer over the next 10 years.
The number of excess deaths per year would peak in the next year or 2, likely sooner for colorectal than for breast cancer, but “for both cancer types, we believe the pandemic will influence cancer deaths for at least a decade.”
In an interview, Dr. Sharpless pointed out that this analysis is conservative because the researchers only evaluated two types of cancer. They chose breast and colorectal cancer because these are common cancers (accounting for about one-sixth of all cancers) with relatively high screening rates.
“We didn’t model other cancer types, but we have no reason to think that we’re not going to see the same thing with other types of malignancies,” he said. “That is a significant amount of excess mortality.”
Delayed diagnosis, modified therapy
One of the effects of the pandemic has been to cause delays in cancer diagnosis. “Routine screening has plummeted and is running at less than 90% in some systems,” Dr. Sharpless said.
“Most cancers are diagnosed when people experience symptoms and go see their doctors, and those symptomatic screening events are also not happening,” he continued. “Fear of contracting the coronavirus in health care settings has dissuaded people from visits.”
In some cases, a delay in diagnosis will allow the cancer to progress to a more advanced stage. “The earlier the diagnosis, the better, and if the stages are more advanced, patients will not do as well for virtually every kind of cancer,” he said.
In addition to delays in diagnosis, treatments are being postponed or modified for patients recently diagnosed with cancer. Because of delays and reductions in curative therapies, patients may be receiving less than optimal care.
“We are seeing a lot of nonstandard care,” said Dr. Sharpless. “All of these things add up to increased cancer morbidity and mortality.”
He also pointed out that the term “elective” is confusing and problematic. “It doesn’t mean that it’s not needed, just that it’s not an emergency and doesn’t need to be done today,” said Dr. Sharpless. “But if we’re talking about chemotherapy and surgery, we don’t think they can be delayed for too long – maybe a week, but not for several months.”
Dr. Sharpless feels that overall it is time for cancer care to resume as much as possible, because “ignoring cancer for too long is an untenable choice and may turn one public health crisis into another.”
“If we act now, we can make up for lost time,” he wrote in the editorial. “Clearly, postponing procedures and deferring care due to the pandemic was prudent at one time, but now that we have made it through the initial shock of the pandemic, I believe it is time to resume robust cancer care.”
Through their network of cancer centers, researchers with the NCI can develop innovative solutions that allow screening and treatment to move forward while maintaining safety. “We need to make patients feel safe, and we have to answer important questions quickly,” he said.
Impact of COVID-19 on cancer care
The COVID-19 pandemic has overwhelmed health care systems worldwide and has created major challenges for clinicians who are caring for patients with cancer.
As previously reported, hospitals reprioritized resources for an impending onslaught of COVID-19 patients. Services and procedures deemed to be nonessential were canceled or delayed, including surgeries and imaging.
In a survey conducted by the American Cancer Society Cancer Action Network, half of the 1219 respondents reported changes, delays, or disruptions to the care they were receiving. The services most frequently affected included in-person provider visits (50%), supportive services (20%), and imaging procedures to monitor tumor growth (20%).
In addition, 8% reported that their treatment, including chemotherapy and immunotherapy, had been affected by the COVID-19 pandemic.
In the United Kingdom, Cancer Research UK estimated that because of the disruption to cancer services, 2.4 million people did not undergo cancer screening or further testing or did not receive cancer treatment and that tens of thousands of cases have gone undiagnosed.
Similarly, a survey by Macmillan Cancer Support showed that almost half (45%) of cancer patients have experienced delays or cancellations of cancer treatments, or their treatments have been altered as a result of coronavirus, leaving many living in fear. Calling cancer “the forgotten C” of the pandemic, it warned of a potential cancer “time bomb” when, as the number of deaths from COVID-19 falls, cancer returns as the leading cause of death in the United Kingdom.
Last month, a report also predicted that there will be an excess of cancer deaths in both the United States and United Kingdom because of patients not accessing health care services.
The authors calculated that there will be 6270 excess deaths among cancer patients 1 year from now in England and 33,890 excess deaths among cancer patients older than 40 years in the United States.
This article first appeared on Medscape.com.
A model created by the National Cancer Institute predicts that tens of thousands of excess cancer deaths will occur over the next decade as a result of missed screenings, delays in diagnosis, and reductions in oncology care caused by the COVID-19 pandemic.
“As director of NCI, I am deeply concerned about the potential impacts of delayed diagnoses and deferred or modified treatment plans on cancer incidence and mortality,” said Norman “Ned” Sharpless, MD.
“In the past 3 decades, we have seen steady and strong progress against death and suffering from cancer, thanks to improvements in prevention, screening, diagnosis, and treatment. I worry that the SARS-CoV-2 pandemic has put those decades of steady progress at risk and may precipitate reversals of these trends.”
In an editorial published June 19 in Science, Dr. Sharpless highlighted modeling performed by the NCI that predicts an excess of 10,000 deaths from breast and colorectal cancer over the next 10 years.
The number of excess deaths per year would peak in the next year or 2, likely sooner for colorectal than for breast cancer, but “for both cancer types, we believe the pandemic will influence cancer deaths for at least a decade.”
In an interview, Dr. Sharpless pointed out that this analysis is conservative because the researchers only evaluated two types of cancer. They chose breast and colorectal cancer because these are common cancers (accounting for about one-sixth of all cancers) with relatively high screening rates.
“We didn’t model other cancer types, but we have no reason to think that we’re not going to see the same thing with other types of malignancies,” he said. “That is a significant amount of excess mortality.”
Delayed diagnosis, modified therapy
One of the effects of the pandemic has been to cause delays in cancer diagnosis. “Routine screening has plummeted and is running at less than 90% in some systems,” Dr. Sharpless said.
“Most cancers are diagnosed when people experience symptoms and go see their doctors, and those symptomatic screening events are also not happening,” he continued. “Fear of contracting the coronavirus in health care settings has dissuaded people from visits.”
In some cases, a delay in diagnosis will allow the cancer to progress to a more advanced stage. “The earlier the diagnosis, the better, and if the stages are more advanced, patients will not do as well for virtually every kind of cancer,” he said.
In addition to delays in diagnosis, treatments are being postponed or modified for patients recently diagnosed with cancer. Because of delays and reductions in curative therapies, patients may be receiving less than optimal care.
“We are seeing a lot of nonstandard care,” said Dr. Sharpless. “All of these things add up to increased cancer morbidity and mortality.”
He also pointed out that the term “elective” is confusing and problematic. “It doesn’t mean that it’s not needed, just that it’s not an emergency and doesn’t need to be done today,” said Dr. Sharpless. “But if we’re talking about chemotherapy and surgery, we don’t think they can be delayed for too long – maybe a week, but not for several months.”
Dr. Sharpless feels that overall it is time for cancer care to resume as much as possible, because “ignoring cancer for too long is an untenable choice and may turn one public health crisis into another.”
“If we act now, we can make up for lost time,” he wrote in the editorial. “Clearly, postponing procedures and deferring care due to the pandemic was prudent at one time, but now that we have made it through the initial shock of the pandemic, I believe it is time to resume robust cancer care.”
Through their network of cancer centers, researchers with the NCI can develop innovative solutions that allow screening and treatment to move forward while maintaining safety. “We need to make patients feel safe, and we have to answer important questions quickly,” he said.
Impact of COVID-19 on cancer care
The COVID-19 pandemic has overwhelmed health care systems worldwide and has created major challenges for clinicians who are caring for patients with cancer.
As previously reported, hospitals reprioritized resources for an impending onslaught of COVID-19 patients. Services and procedures deemed to be nonessential were canceled or delayed, including surgeries and imaging.
In a survey conducted by the American Cancer Society Cancer Action Network, half of the 1219 respondents reported changes, delays, or disruptions to the care they were receiving. The services most frequently affected included in-person provider visits (50%), supportive services (20%), and imaging procedures to monitor tumor growth (20%).
In addition, 8% reported that their treatment, including chemotherapy and immunotherapy, had been affected by the COVID-19 pandemic.
In the United Kingdom, Cancer Research UK estimated that because of the disruption to cancer services, 2.4 million people did not undergo cancer screening or further testing or did not receive cancer treatment and that tens of thousands of cases have gone undiagnosed.
Similarly, a survey by Macmillan Cancer Support showed that almost half (45%) of cancer patients have experienced delays or cancellations of cancer treatments, or their treatments have been altered as a result of coronavirus, leaving many living in fear. Calling cancer “the forgotten C” of the pandemic, it warned of a potential cancer “time bomb” when, as the number of deaths from COVID-19 falls, cancer returns as the leading cause of death in the United Kingdom.
Last month, a report also predicted that there will be an excess of cancer deaths in both the United States and United Kingdom because of patients not accessing health care services.
The authors calculated that there will be 6270 excess deaths among cancer patients 1 year from now in England and 33,890 excess deaths among cancer patients older than 40 years in the United States.
This article first appeared on Medscape.com.
Early hypertensive disorders in pregnancy linked to obesity
Rising classes of obesity are linked with progressively increased risk of early-onset hypertensive disorders in pregnant women, as has been established for late-onset hypertensive disorders, according to a U.S.-based retrospective cohort study.

Between 4% and 8% of pregnancies are impacted by hypertensive disorders, and preeclampsia is associated with a doubling of adverse neonatal events and causes 16% of maternal deaths in developed countries, previous studies have found. This study showed a clear risk of early-onset hypertensive disorders (less than 34 weeks’ gestation), which may be more deadly than late-onset disease: Compared with later-developing disorders, early hypertensive disorders are linked to a 400% increased risk of perinatal death and a 100%-300% increased risk of severe cardiovascular, renal, or hepatic maternal morbidity, according to previous studies.
The new research, led by Matthew Bicocca, MD, of the University of Texas Health Science Center, Houston, was published in Obstetrics & Gynecology. The researchers analyzed data from U.S. Vital Statistics, including over 14 million singleton births. The sample excluded women with chronic hypertension and a body mass index (BMI) below 18.5 kg/m2.
Previous studies demonstrated that obesity is a risk factor for late-onset hypertensive disorders, but studies of early-onset hypertensive disorders have yielded conflicting results. That could be because early-onset disorders are rare, representing just 5%-10% of hypertensive disorders during pregnancy, making it difficult to obtain a sufficient sample size to show a relationship.
“We know that obese pregnant women are at increased risk for adverse pregnancy outcomes, and this is of particular importance with the increasing prevalence of obesity in the United States. As this is a nationwide cohort with a large sample size, it allowed for evaluation of the rare outcome of early-onset hypertensive disorders of pregnancy,” said Iris Krishna, MD, MPH, an assistant professor of maternal-fetal medicine at Emory University, Atlanta, who was asked to comment on the study.
The researchers classified the women in the study as nonobese (BMI, 18.5-29.9 kg/m2; 46%), class I obese (BMI, 30.0-34.9; 29%), class II obese (BMI, 35.0-39.9; 15%), or class III obese (BMI, 40 or higher; 10%). About 6% of the participants developed hypertensive disorders during pregnancy (0.3% early onset), and the associated risk was greater with increasing class of obesity. Compared with nonobese women, class III obesity was associated with the highest adjusted risk ratio (2.18; 95% confidence interval, 2.12-2.24) for early-onset hypertensive disorders, followed by class II obesity (aRR, 1.57; 95% CI, 1.53-1.62) and class I (aRR, 1.13; 95% CI, 1.10-1.16). A similar pattern was observed with late-onset hypertensive disorders, with the highest risk associated with class III obese (aRR, 3.93; 95% CI, 3.91-3.96), followed by class II (aRR, 2.60; 95% CI, 2.58-2.62) and class I (aRR, 1.71; 95% CI, 1.70-1.73).
The mechanism underlying any potential link between obesity and risk of hypertensive orders of pregnancy isn’t completely understood, especially because the early-onset and late-onset hypertensive disorders have differing pathophysiology. “Early onset is the result from abnormal placentation [leading to] chronic placental insufficiency, and late onset likely [results from] placental insufficiency paired with oxidative stress from conditions such as obesity and insulin resistance,” Dr. Krishna said.
The new research reinforces the need for obese women to receive early prenatal care and counseling on nutrition and exercise “to mitigate weight gain during pregnancy in hopes of reducing their risk for adverse pregnancy outcomes, such as hypertensive disorders of pregnancy,” she concluded.
No source of funding was disclosed. The authors reported having no potential conflicts of interest.
SOURCE: Bicocca M et al. Obstet Gynecol. 2020 Jun 11. doi: 10.1097/AOG.0000000000003901.
Rising classes of obesity are linked with progressively increased risk of early-onset hypertensive disorders in pregnant women, as has been established for late-onset hypertensive disorders, according to a U.S.-based retrospective cohort study.
Between 4% and 8% of pregnancies are impacted by hypertensive disorders, and preeclampsia is associated with a doubling of adverse neonatal events and causes 16% of maternal deaths in developed countries, previous studies have found. This study showed a clear risk of early-onset hypertensive disorders (less than 34 weeks’ gestation), which may be more deadly than late-onset disease: Compared with later-developing disorders, early hypertensive disorders are linked to a 400% increased risk of perinatal death and a 100%-300% increased risk of severe cardiovascular, renal, or hepatic maternal morbidity, according to previous studies.
The new research, led by Matthew Bicocca, MD, of the University of Texas Health Science Center, Houston, was published in Obstetrics & Gynecology. The researchers analyzed data from U.S. Vital Statistics, including over 14 million singleton births. The sample excluded women with chronic hypertension and a body mass index (BMI) below 18.5 kg/m2.
Previous studies demonstrated that obesity is a risk factor for late-onset hypertensive disorders, but studies of early-onset hypertensive disorders have yielded conflicting results. That could be because early-onset disorders are rare, representing just 5%-10% of hypertensive disorders during pregnancy, making it difficult to obtain a sufficient sample size to show a relationship.
“We know that obese pregnant women are at increased risk for adverse pregnancy outcomes, and this is of particular importance with the increasing prevalence of obesity in the United States. As this is a nationwide cohort with a large sample size, it allowed for evaluation of the rare outcome of early-onset hypertensive disorders of pregnancy,” said Iris Krishna, MD, MPH, an assistant professor of maternal-fetal medicine at Emory University, Atlanta, who was asked to comment on the study.
The researchers classified the women in the study as nonobese (BMI, 18.5-29.9 kg/m2; 46%), class I obese (BMI, 30.0-34.9; 29%), class II obese (BMI, 35.0-39.9; 15%), or class III obese (BMI, 40 or higher; 10%). About 6% of the participants developed hypertensive disorders during pregnancy (0.3% early onset), and the associated risk was greater with increasing class of obesity. Compared with nonobese women, class III obesity was associated with the highest adjusted risk ratio (2.18; 95% confidence interval, 2.12-2.24) for early-onset hypertensive disorders, followed by class II obesity (aRR, 1.57; 95% CI, 1.53-1.62) and class I (aRR, 1.13; 95% CI, 1.10-1.16). A similar pattern was observed with late-onset hypertensive disorders, with the highest risk associated with class III obese (aRR, 3.93; 95% CI, 3.91-3.96), followed by class II (aRR, 2.60; 95% CI, 2.58-2.62) and class I (aRR, 1.71; 95% CI, 1.70-1.73).
The mechanism underlying any potential link between obesity and risk of hypertensive orders of pregnancy isn’t completely understood, especially because the early-onset and late-onset hypertensive disorders have differing pathophysiology. “Early onset is the result from abnormal placentation [leading to] chronic placental insufficiency, and late onset likely [results from] placental insufficiency paired with oxidative stress from conditions such as obesity and insulin resistance,” Dr. Krishna said.
The new research reinforces the need for obese women to receive early prenatal care and counseling on nutrition and exercise “to mitigate weight gain during pregnancy in hopes of reducing their risk for adverse pregnancy outcomes, such as hypertensive disorders of pregnancy,” she concluded.
No source of funding was disclosed. The authors reported having no potential conflicts of interest.
SOURCE: Bicocca M et al. Obstet Gynecol. 2020 Jun 11. doi: 10.1097/AOG.0000000000003901.
Rising classes of obesity are linked with progressively increased risk of early-onset hypertensive disorders in pregnant women, as has been established for late-onset hypertensive disorders, according to a U.S.-based retrospective cohort study.
Between 4% and 8% of pregnancies are impacted by hypertensive disorders, and preeclampsia is associated with a doubling of adverse neonatal events and causes 16% of maternal deaths in developed countries, previous studies have found. This study showed a clear risk of early-onset hypertensive disorders (less than 34 weeks’ gestation), which may be more deadly than late-onset disease: Compared with later-developing disorders, early hypertensive disorders are linked to a 400% increased risk of perinatal death and a 100%-300% increased risk of severe cardiovascular, renal, or hepatic maternal morbidity, according to previous studies.
The new research, led by Matthew Bicocca, MD, of the University of Texas Health Science Center, Houston, was published in Obstetrics & Gynecology. The researchers analyzed data from U.S. Vital Statistics, including over 14 million singleton births. The sample excluded women with chronic hypertension and a body mass index (BMI) below 18.5 kg/m2.
Previous studies demonstrated that obesity is a risk factor for late-onset hypertensive disorders, but studies of early-onset hypertensive disorders have yielded conflicting results. That could be because early-onset disorders are rare, representing just 5%-10% of hypertensive disorders during pregnancy, making it difficult to obtain a sufficient sample size to show a relationship.
“We know that obese pregnant women are at increased risk for adverse pregnancy outcomes, and this is of particular importance with the increasing prevalence of obesity in the United States. As this is a nationwide cohort with a large sample size, it allowed for evaluation of the rare outcome of early-onset hypertensive disorders of pregnancy,” said Iris Krishna, MD, MPH, an assistant professor of maternal-fetal medicine at Emory University, Atlanta, who was asked to comment on the study.
The researchers classified the women in the study as nonobese (BMI, 18.5-29.9 kg/m2; 46%), class I obese (BMI, 30.0-34.9; 29%), class II obese (BMI, 35.0-39.9; 15%), or class III obese (BMI, 40 or higher; 10%). About 6% of the participants developed hypertensive disorders during pregnancy (0.3% early onset), and the associated risk was greater with increasing class of obesity. Compared with nonobese women, class III obesity was associated with the highest adjusted risk ratio (2.18; 95% confidence interval, 2.12-2.24) for early-onset hypertensive disorders, followed by class II obesity (aRR, 1.57; 95% CI, 1.53-1.62) and class I (aRR, 1.13; 95% CI, 1.10-1.16). A similar pattern was observed with late-onset hypertensive disorders, with the highest risk associated with class III obese (aRR, 3.93; 95% CI, 3.91-3.96), followed by class II (aRR, 2.60; 95% CI, 2.58-2.62) and class I (aRR, 1.71; 95% CI, 1.70-1.73).
The mechanism underlying any potential link between obesity and risk of hypertensive orders of pregnancy isn’t completely understood, especially because the early-onset and late-onset hypertensive disorders have differing pathophysiology. “Early onset is the result from abnormal placentation [leading to] chronic placental insufficiency, and late onset likely [results from] placental insufficiency paired with oxidative stress from conditions such as obesity and insulin resistance,” Dr. Krishna said.
The new research reinforces the need for obese women to receive early prenatal care and counseling on nutrition and exercise “to mitigate weight gain during pregnancy in hopes of reducing their risk for adverse pregnancy outcomes, such as hypertensive disorders of pregnancy,” she concluded.
No source of funding was disclosed. The authors reported having no potential conflicts of interest.
SOURCE: Bicocca M et al. Obstet Gynecol. 2020 Jun 11. doi: 10.1097/AOG.0000000000003901.
FROM OBSTETRICS & GYNECOLOGY

Ringing the alarm about black youth suicide
A “growing and disturbing” increase in suicidal behavior among black youth has quietly been underway in the United States during the past several decades, even while rates in white and Latino youth have declined, Michael A. Lindsey, PhD, MSW, MPH, declared at the virtual annual meeting of the American Association of Suicidology.
Until recently this trend remained below the radar of public awareness. That’s changing. Dr. Lindsey was coauthor of a December 2019 report to Congress prepared in collaboration with the Congressional Black Caucus entitled, “Ring the Alarm: The Crisis of Black Youth Suicide In America.” Release of the report was accompanied by submission of an omnibus bill aimed at addressing the issue comprehensively, including what Dr. Lindsey considers to be the single most important policy imperative: providing federal resources to support more and better school mental health services proportionate to student needs.
“Black youth, relative to white youth, do not receive treatment for depression, which may be a precursor issue. They’re often disconnected from mental health therapy. This is perhaps a reason why we’re seeing this uptick in suicide expression among black youth,” according to Dr. Lindsey, executive director of the McSilver Institute for Poverty Policy and Research and professor of poverty studies at New York University.
Investigators at Ohio State University analyzed youth suicide data for the years 2001-2015 obtained from the Centers for Disease Control and Prevention. They determined that black children aged 5-12 years had an 82% higher incidence of completed suicide than white children (JAMA Pediatr. 2018 Jul 1;172[7]:697-9).
This report was followed by a study of trends in suicidal behaviors among U.S. high school students during 1991-2017. The study, led by Dr. Lindsey, used data from the Youth Risk Behavior Survey covering the years 1991-2017 to document an overall 19% prevalence of thoughts about suicide, while 15% of high school students had a suicide plan. During the study years there was a 73% increase in suicide attempts among black adolescents, while rates in white and Latino teens fell by 7.5% and 11.4%, respectively (Pediatrics. 2019 Nov;144[5]:e20191187).
Dr. Lindsey cited multiple reasons for undertreatment of depression in black youth. The lack of adequate mental health services in many schools figures prominently. As a result of this situation, mental health problems in black youth are often misinterpreted as conduct problems, leading to well-documented overuse of school suspensions and expulsions.
“We tend to oversuspend and expel black kids from school for problems that are treatable. This becomes a major, major issue in the pathway from schools to prisons,” he said.
Another factor in underutilization of mental health services by black youth is the stigma involved. Many black families see mental health therapy as irrelevant. Dr. Lindsey has received grant support from the National Institute of Mental Health for development of engagement interventions that focus on stigma reduction and enhancing family support for mental health therapy in black youth. He has found that, once those barriers are lowered, therapies seem to be as effective in black youth as in other populations, despite the cultural differences.
Yet another potential explanation for the racial disparity in pediatric suicide might be that suicide may, in some cases, be more of an impulsive behavior in black youth. Dr. Lindsey presented data from a soon-to-be-published analysis of Youth Risk Behavior Survey data on nearly 5,000 adolescents with suicidal thoughts, plans, and/or attempts within the previous 12 months. About 23% had suicidal thoughts only, 37% had suicidal thoughts and a plan, another 37% had thoughts, plans, and suicide attempts, and 3% had attempts without thoughts or a plan.
Black youth were 3.7 times more likely than white youth to have attempted suicide in the absence of background suicidal thoughts and 3.3 times more likely to have attempted suicide without having suicidal thoughts and plans.
He and his coinvestigators identified a similar pattern of suicide as an impulsive behavior in youths of all races with a history of sexual assault. They were 4.2 times more likely to have attempted suicide without prior suicidal thoughts than individuals without such a history and 3.9 times more likely to have attempted suicide without thinking about it or having a plan.
“This has implications for screening and prevention; warning signs may not be present,” he said.
Dr. Lindsey reported having no financial conflicts regarding his presentation.
A “growing and disturbing” increase in suicidal behavior among black youth has quietly been underway in the United States during the past several decades, even while rates in white and Latino youth have declined, Michael A. Lindsey, PhD, MSW, MPH, declared at the virtual annual meeting of the American Association of Suicidology.
Until recently this trend remained below the radar of public awareness. That’s changing. Dr. Lindsey was coauthor of a December 2019 report to Congress prepared in collaboration with the Congressional Black Caucus entitled, “Ring the Alarm: The Crisis of Black Youth Suicide In America.” Release of the report was accompanied by submission of an omnibus bill aimed at addressing the issue comprehensively, including what Dr. Lindsey considers to be the single most important policy imperative: providing federal resources to support more and better school mental health services proportionate to student needs.
“Black youth, relative to white youth, do not receive treatment for depression, which may be a precursor issue. They’re often disconnected from mental health therapy. This is perhaps a reason why we’re seeing this uptick in suicide expression among black youth,” according to Dr. Lindsey, executive director of the McSilver Institute for Poverty Policy and Research and professor of poverty studies at New York University.
Investigators at Ohio State University analyzed youth suicide data for the years 2001-2015 obtained from the Centers for Disease Control and Prevention. They determined that black children aged 5-12 years had an 82% higher incidence of completed suicide than white children (JAMA Pediatr. 2018 Jul 1;172[7]:697-9).
This report was followed by a study of trends in suicidal behaviors among U.S. high school students during 1991-2017. The study, led by Dr. Lindsey, used data from the Youth Risk Behavior Survey covering the years 1991-2017 to document an overall 19% prevalence of thoughts about suicide, while 15% of high school students had a suicide plan. During the study years there was a 73% increase in suicide attempts among black adolescents, while rates in white and Latino teens fell by 7.5% and 11.4%, respectively (Pediatrics. 2019 Nov;144[5]:e20191187).
Dr. Lindsey cited multiple reasons for undertreatment of depression in black youth. The lack of adequate mental health services in many schools figures prominently. As a result of this situation, mental health problems in black youth are often misinterpreted as conduct problems, leading to well-documented overuse of school suspensions and expulsions.
“We tend to oversuspend and expel black kids from school for problems that are treatable. This becomes a major, major issue in the pathway from schools to prisons,” he said.
Another factor in underutilization of mental health services by black youth is the stigma involved. Many black families see mental health therapy as irrelevant. Dr. Lindsey has received grant support from the National Institute of Mental Health for development of engagement interventions that focus on stigma reduction and enhancing family support for mental health therapy in black youth. He has found that, once those barriers are lowered, therapies seem to be as effective in black youth as in other populations, despite the cultural differences.
Yet another potential explanation for the racial disparity in pediatric suicide might be that suicide may, in some cases, be more of an impulsive behavior in black youth. Dr. Lindsey presented data from a soon-to-be-published analysis of Youth Risk Behavior Survey data on nearly 5,000 adolescents with suicidal thoughts, plans, and/or attempts within the previous 12 months. About 23% had suicidal thoughts only, 37% had suicidal thoughts and a plan, another 37% had thoughts, plans, and suicide attempts, and 3% had attempts without thoughts or a plan.
Black youth were 3.7 times more likely than white youth to have attempted suicide in the absence of background suicidal thoughts and 3.3 times more likely to have attempted suicide without having suicidal thoughts and plans.
He and his coinvestigators identified a similar pattern of suicide as an impulsive behavior in youths of all races with a history of sexual assault. They were 4.2 times more likely to have attempted suicide without prior suicidal thoughts than individuals without such a history and 3.9 times more likely to have attempted suicide without thinking about it or having a plan.
“This has implications for screening and prevention; warning signs may not be present,” he said.
Dr. Lindsey reported having no financial conflicts regarding his presentation.
A “growing and disturbing” increase in suicidal behavior among black youth has quietly been underway in the United States during the past several decades, even while rates in white and Latino youth have declined, Michael A. Lindsey, PhD, MSW, MPH, declared at the virtual annual meeting of the American Association of Suicidology.
Until recently this trend remained below the radar of public awareness. That’s changing. Dr. Lindsey was coauthor of a December 2019 report to Congress prepared in collaboration with the Congressional Black Caucus entitled, “Ring the Alarm: The Crisis of Black Youth Suicide In America.” Release of the report was accompanied by submission of an omnibus bill aimed at addressing the issue comprehensively, including what Dr. Lindsey considers to be the single most important policy imperative: providing federal resources to support more and better school mental health services proportionate to student needs.
“Black youth, relative to white youth, do not receive treatment for depression, which may be a precursor issue. They’re often disconnected from mental health therapy. This is perhaps a reason why we’re seeing this uptick in suicide expression among black youth,” according to Dr. Lindsey, executive director of the McSilver Institute for Poverty Policy and Research and professor of poverty studies at New York University.
Investigators at Ohio State University analyzed youth suicide data for the years 2001-2015 obtained from the Centers for Disease Control and Prevention. They determined that black children aged 5-12 years had an 82% higher incidence of completed suicide than white children (JAMA Pediatr. 2018 Jul 1;172[7]:697-9).
This report was followed by a study of trends in suicidal behaviors among U.S. high school students during 1991-2017. The study, led by Dr. Lindsey, used data from the Youth Risk Behavior Survey covering the years 1991-2017 to document an overall 19% prevalence of thoughts about suicide, while 15% of high school students had a suicide plan. During the study years there was a 73% increase in suicide attempts among black adolescents, while rates in white and Latino teens fell by 7.5% and 11.4%, respectively (Pediatrics. 2019 Nov;144[5]:e20191187).
Dr. Lindsey cited multiple reasons for undertreatment of depression in black youth. The lack of adequate mental health services in many schools figures prominently. As a result of this situation, mental health problems in black youth are often misinterpreted as conduct problems, leading to well-documented overuse of school suspensions and expulsions.
“We tend to oversuspend and expel black kids from school for problems that are treatable. This becomes a major, major issue in the pathway from schools to prisons,” he said.
Another factor in underutilization of mental health services by black youth is the stigma involved. Many black families see mental health therapy as irrelevant. Dr. Lindsey has received grant support from the National Institute of Mental Health for development of engagement interventions that focus on stigma reduction and enhancing family support for mental health therapy in black youth. He has found that, once those barriers are lowered, therapies seem to be as effective in black youth as in other populations, despite the cultural differences.
Yet another potential explanation for the racial disparity in pediatric suicide might be that suicide may, in some cases, be more of an impulsive behavior in black youth. Dr. Lindsey presented data from a soon-to-be-published analysis of Youth Risk Behavior Survey data on nearly 5,000 adolescents with suicidal thoughts, plans, and/or attempts within the previous 12 months. About 23% had suicidal thoughts only, 37% had suicidal thoughts and a plan, another 37% had thoughts, plans, and suicide attempts, and 3% had attempts without thoughts or a plan.
Black youth were 3.7 times more likely than white youth to have attempted suicide in the absence of background suicidal thoughts and 3.3 times more likely to have attempted suicide without having suicidal thoughts and plans.
He and his coinvestigators identified a similar pattern of suicide as an impulsive behavior in youths of all races with a history of sexual assault. They were 4.2 times more likely to have attempted suicide without prior suicidal thoughts than individuals without such a history and 3.9 times more likely to have attempted suicide without thinking about it or having a plan.
“This has implications for screening and prevention; warning signs may not be present,” he said.
Dr. Lindsey reported having no financial conflicts regarding his presentation.
FROM AAS 2020
Consistent effects for galcanezumab in cluster headache
new research suggests. A post hoc analysis of patients from the phase 3 CGAL study who also entered the open-label CGAR extension study was conducted. Results showed that the majority of participants whose scores on the Patient Global Impression of Improvement (PGI-I) showed improvement 1 month after the initial dose of galcanezumab in the CGAL study also showed improvement after treatment for subsequent cluster bouts during the CGAR study.
“There was good agreement between PGI-I between the two [cluster headache] periods,” noted the investigators, led by Brian Plato, DO, a neurologist at Norton Neuroscience Institute in Louisville, Ky.
The findings were presented at the virtual annual meeting of the American Headache Society.
Two cluster periods
Galcanezumab was approved by the Food and Drug Administration in 2019 for the treatment of episodic cluster headache in adults.
In cluster headache, attacks of recurrent, unilateral headaches with cranial autonomic symptoms last for weeks or months and are followed by periods of remission. Most studies of therapies for cluster headache examine only one cluster period. Few data about the consistency of treatment response throughout consecutive cluster periods are available, the investigators noted.
The current analysis was undertaken to examine the consistency of galcanezumab’s effect in episodic cluster headache during two cluster periods. Patients eligible for inclusion in the analysis had completed the double-blind phase of the CGAL study and had entered the open-label CGAR study.
CGAL was a phase 3, multicenter, randomized, double-blind study in which patients with episodic cluster headache were assigned to receive galcanezumab 300 mg per month or placebo. Patients who completed the double-blind and washout phases of this study were eligible for enrollment into CGAR, a phase 3b, single-arm safety study. The investigators determined the dose of galcanezumab in accordance with each patient’s symptoms and clinical response.
Response agreement
In both studies, the PGI-I was administered 1 month after the initial dose of galcanezumab. Only patients who were in an active cluster bout on entry into CGAR and who had valid PGI-I results 1 month after the first dose in CGAL and CGAR were included in the analysis.
PGI-I responses ranged from 1, signifying very much better, to 7, signifying very much worse. The investigators summarized the proportions of patients who reported each level of PGI-I score in CGAR and analyzed the results by dichotomizing PGI-I scores at both time points in two ways.
Fifty patients entered CGAR (78% men; mean age, 46.8 years). Of this group, Dr. Plato and colleagues included 39 in their analysis. Of the 17 patients who had a PGI-I score of 1 or 2 in CGAL, 12 (70.6%) had a score in the same range in CGAR. All four participants who had a score of 3 or higher in CGAL had a score in the same range in CGAR. Eighteen participants had a PGI-I score of 1, 2, or 3 in CGAL. Of this group, 15 patients (83.3%) had a score in the same range in CGAR. Of the three patients who had a score above 3 in CGAL, two (66.7%) had a score in the same range in CGAR.
The results indicate that most patients whose PGI-I score improved in one cluster bout, such as in CGAL, also improved in a subsequent bout, such as in CGAR, the investigators noted.
‘Encouraging’ results
Commenting on the study, Brian E. McGeeney, MD, a neurologist at the John R. Graham Headache Center, Brigham and Women’s Faulkner Hospital, Boston, noted that the PGI-I is an “easy-to-understand” outcome that has been widely used in headache medicine.
“Patient-assessed outcomes have become increasingly important and are an important complement to other outcomes,” said Dr. McGeeney, who was not involved in the research. However, a disadvantage is that “it is entirely subjective and may or may not reflect a change on other outcome measures that reflect the disorder itself,” he said.
“It can be difficult to demonstrate how much usefulness a treatment has with the helpful but simple outcome measures that are seen in CGAL and CGAR,” Dr. McGeeney added. “This is due to the nature of cluster headache and not to any methodological shortcomings of those studies.”
He said this is a core problem in general with cluster headache studies, “of which there are very few.”
In addition, CGAR only included episodic cluster headache, and the study period was relatively short; and CGAL only explored one cluster period per patient, Dr. McGeeney noted.
The current research attempts to provide insight that was previously unavailable, he said. “Many headache medicine clinical trial results reflect only one episode, and in general, we infer repeated usefulness – although it is not demonstrated in clinical trials,” said Dr. McGeeney.
“In this recent presentation, the authors attempt to go further and demonstrate some consistency across multiple cluster periods. The results are encouraging and what one might expect,” he said. However, “the small numbers and ad hoc nature preclude much inference from this study alone.”
Dr. Plato has received honoraria for speaking from Allergan, Amgen/Novartis, and Eli Lilly. He has also received research grants and support from Electrocore and Teva. Dr. McGeeney has consulted for Upsher-Smith and Theranica.
A version of this article originally appeared on Medscape.com.
new research suggests. A post hoc analysis of patients from the phase 3 CGAL study who also entered the open-label CGAR extension study was conducted. Results showed that the majority of participants whose scores on the Patient Global Impression of Improvement (PGI-I) showed improvement 1 month after the initial dose of galcanezumab in the CGAL study also showed improvement after treatment for subsequent cluster bouts during the CGAR study.
“There was good agreement between PGI-I between the two [cluster headache] periods,” noted the investigators, led by Brian Plato, DO, a neurologist at Norton Neuroscience Institute in Louisville, Ky.
The findings were presented at the virtual annual meeting of the American Headache Society.
Two cluster periods
Galcanezumab was approved by the Food and Drug Administration in 2019 for the treatment of episodic cluster headache in adults.
In cluster headache, attacks of recurrent, unilateral headaches with cranial autonomic symptoms last for weeks or months and are followed by periods of remission. Most studies of therapies for cluster headache examine only one cluster period. Few data about the consistency of treatment response throughout consecutive cluster periods are available, the investigators noted.
The current analysis was undertaken to examine the consistency of galcanezumab’s effect in episodic cluster headache during two cluster periods. Patients eligible for inclusion in the analysis had completed the double-blind phase of the CGAL study and had entered the open-label CGAR study.
CGAL was a phase 3, multicenter, randomized, double-blind study in which patients with episodic cluster headache were assigned to receive galcanezumab 300 mg per month or placebo. Patients who completed the double-blind and washout phases of this study were eligible for enrollment into CGAR, a phase 3b, single-arm safety study. The investigators determined the dose of galcanezumab in accordance with each patient’s symptoms and clinical response.
Response agreement
In both studies, the PGI-I was administered 1 month after the initial dose of galcanezumab. Only patients who were in an active cluster bout on entry into CGAR and who had valid PGI-I results 1 month after the first dose in CGAL and CGAR were included in the analysis.
PGI-I responses ranged from 1, signifying very much better, to 7, signifying very much worse. The investigators summarized the proportions of patients who reported each level of PGI-I score in CGAR and analyzed the results by dichotomizing PGI-I scores at both time points in two ways.
Fifty patients entered CGAR (78% men; mean age, 46.8 years). Of this group, Dr. Plato and colleagues included 39 in their analysis. Of the 17 patients who had a PGI-I score of 1 or 2 in CGAL, 12 (70.6%) had a score in the same range in CGAR. All four participants who had a score of 3 or higher in CGAL had a score in the same range in CGAR. Eighteen participants had a PGI-I score of 1, 2, or 3 in CGAL. Of this group, 15 patients (83.3%) had a score in the same range in CGAR. Of the three patients who had a score above 3 in CGAL, two (66.7%) had a score in the same range in CGAR.
The results indicate that most patients whose PGI-I score improved in one cluster bout, such as in CGAL, also improved in a subsequent bout, such as in CGAR, the investigators noted.
‘Encouraging’ results
Commenting on the study, Brian E. McGeeney, MD, a neurologist at the John R. Graham Headache Center, Brigham and Women’s Faulkner Hospital, Boston, noted that the PGI-I is an “easy-to-understand” outcome that has been widely used in headache medicine.
“Patient-assessed outcomes have become increasingly important and are an important complement to other outcomes,” said Dr. McGeeney, who was not involved in the research. However, a disadvantage is that “it is entirely subjective and may or may not reflect a change on other outcome measures that reflect the disorder itself,” he said.
“It can be difficult to demonstrate how much usefulness a treatment has with the helpful but simple outcome measures that are seen in CGAL and CGAR,” Dr. McGeeney added. “This is due to the nature of cluster headache and not to any methodological shortcomings of those studies.”
He said this is a core problem in general with cluster headache studies, “of which there are very few.”
In addition, CGAR only included episodic cluster headache, and the study period was relatively short; and CGAL only explored one cluster period per patient, Dr. McGeeney noted.
The current research attempts to provide insight that was previously unavailable, he said. “Many headache medicine clinical trial results reflect only one episode, and in general, we infer repeated usefulness – although it is not demonstrated in clinical trials,” said Dr. McGeeney.
“In this recent presentation, the authors attempt to go further and demonstrate some consistency across multiple cluster periods. The results are encouraging and what one might expect,” he said. However, “the small numbers and ad hoc nature preclude much inference from this study alone.”
Dr. Plato has received honoraria for speaking from Allergan, Amgen/Novartis, and Eli Lilly. He has also received research grants and support from Electrocore and Teva. Dr. McGeeney has consulted for Upsher-Smith and Theranica.
A version of this article originally appeared on Medscape.com.
new research suggests. A post hoc analysis of patients from the phase 3 CGAL study who also entered the open-label CGAR extension study was conducted. Results showed that the majority of participants whose scores on the Patient Global Impression of Improvement (PGI-I) showed improvement 1 month after the initial dose of galcanezumab in the CGAL study also showed improvement after treatment for subsequent cluster bouts during the CGAR study.
“There was good agreement between PGI-I between the two [cluster headache] periods,” noted the investigators, led by Brian Plato, DO, a neurologist at Norton Neuroscience Institute in Louisville, Ky.
The findings were presented at the virtual annual meeting of the American Headache Society.
Two cluster periods
Galcanezumab was approved by the Food and Drug Administration in 2019 for the treatment of episodic cluster headache in adults.
In cluster headache, attacks of recurrent, unilateral headaches with cranial autonomic symptoms last for weeks or months and are followed by periods of remission. Most studies of therapies for cluster headache examine only one cluster period. Few data about the consistency of treatment response throughout consecutive cluster periods are available, the investigators noted.
The current analysis was undertaken to examine the consistency of galcanezumab’s effect in episodic cluster headache during two cluster periods. Patients eligible for inclusion in the analysis had completed the double-blind phase of the CGAL study and had entered the open-label CGAR study.
CGAL was a phase 3, multicenter, randomized, double-blind study in which patients with episodic cluster headache were assigned to receive galcanezumab 300 mg per month or placebo. Patients who completed the double-blind and washout phases of this study were eligible for enrollment into CGAR, a phase 3b, single-arm safety study. The investigators determined the dose of galcanezumab in accordance with each patient’s symptoms and clinical response.
Response agreement
In both studies, the PGI-I was administered 1 month after the initial dose of galcanezumab. Only patients who were in an active cluster bout on entry into CGAR and who had valid PGI-I results 1 month after the first dose in CGAL and CGAR were included in the analysis.
PGI-I responses ranged from 1, signifying very much better, to 7, signifying very much worse. The investigators summarized the proportions of patients who reported each level of PGI-I score in CGAR and analyzed the results by dichotomizing PGI-I scores at both time points in two ways.
Fifty patients entered CGAR (78% men; mean age, 46.8 years). Of this group, Dr. Plato and colleagues included 39 in their analysis. Of the 17 patients who had a PGI-I score of 1 or 2 in CGAL, 12 (70.6%) had a score in the same range in CGAR. All four participants who had a score of 3 or higher in CGAL had a score in the same range in CGAR. Eighteen participants had a PGI-I score of 1, 2, or 3 in CGAL. Of this group, 15 patients (83.3%) had a score in the same range in CGAR. Of the three patients who had a score above 3 in CGAL, two (66.7%) had a score in the same range in CGAR.
The results indicate that most patients whose PGI-I score improved in one cluster bout, such as in CGAL, also improved in a subsequent bout, such as in CGAR, the investigators noted.
‘Encouraging’ results
Commenting on the study, Brian E. McGeeney, MD, a neurologist at the John R. Graham Headache Center, Brigham and Women’s Faulkner Hospital, Boston, noted that the PGI-I is an “easy-to-understand” outcome that has been widely used in headache medicine.
“Patient-assessed outcomes have become increasingly important and are an important complement to other outcomes,” said Dr. McGeeney, who was not involved in the research. However, a disadvantage is that “it is entirely subjective and may or may not reflect a change on other outcome measures that reflect the disorder itself,” he said.
“It can be difficult to demonstrate how much usefulness a treatment has with the helpful but simple outcome measures that are seen in CGAL and CGAR,” Dr. McGeeney added. “This is due to the nature of cluster headache and not to any methodological shortcomings of those studies.”
He said this is a core problem in general with cluster headache studies, “of which there are very few.”
In addition, CGAR only included episodic cluster headache, and the study period was relatively short; and CGAL only explored one cluster period per patient, Dr. McGeeney noted.
The current research attempts to provide insight that was previously unavailable, he said. “Many headache medicine clinical trial results reflect only one episode, and in general, we infer repeated usefulness – although it is not demonstrated in clinical trials,” said Dr. McGeeney.
“In this recent presentation, the authors attempt to go further and demonstrate some consistency across multiple cluster periods. The results are encouraging and what one might expect,” he said. However, “the small numbers and ad hoc nature preclude much inference from this study alone.”
Dr. Plato has received honoraria for speaking from Allergan, Amgen/Novartis, and Eli Lilly. He has also received research grants and support from Electrocore and Teva. Dr. McGeeney has consulted for Upsher-Smith and Theranica.
A version of this article originally appeared on Medscape.com.
FROM AHS 2020