User login
SGLT2 inhibitors with metformin look safe for bone
The combination of sodium-glucose transporter-2 (SGLT-2) inhibitors and metformin is not associated with an increase in fracture risk among patients with type 2 diabetes (T2D), according to a new meta-analysis of 25 randomized, controlled trials.
Researchers at The Second Clinical College of Dalian Medical University in Jiangsu, China, compared fracture risk associated with the metformin/SLGT2 combination to metformin alone as well as other T2D therapeutics, and found no differences in risk. The study was published online Aug. 11 in Osteoporosis International.
T2D is associated with an increased risk of fracture, though causative mechanisms remain uncertain. Some lines of evidence suggest multiple factors may contribute to fractures, including hyperglycemia, oxidative stress, toxic effects of advanced glycosylation end-products, altered insulin levels, and treatment-induced hypoglycemia, as well as an association between T2D and increased risk of falls.
Antidiabetes drugs can have positive or negative effects on bone. thiazolidinediones, insulin, and sulfonylureas may increase risk of fractures, while dipeptidyl peptidase-4 (DPP-4) inhibitors and glucagon-like peptide-2 (GLP-2) receptor agonists may be protective. Metformin may also reduce fracture risk.
SGLT-2 inhibitors interrupt glucose reabsorption in the kidney, leading to improved glycemic control. Other benefits include improved renal and cardiovascular outcomes, weight loss, and reduced blood pressure, liver fat, and serum uric acid levels.
These properties have made SGLT-2 inhibitors combined with metformin an important therapy for patients at high risk of atherosclerotic disease, or who have heart failure or chronic kidney disease.
But SGLT-2 inhibition increases osmotic diuresis, and this could alter the mineral balance within bone. Some studies also showed that SGLT-2 inhibitors led to changes in bone turnover markers, bone mineral density, and bone microarchitecture. Observational studies of the SGLT-2 inhibitor canagliflozin found associations with a higher rate of fracture risk in patients taking the drug.
Such studies carry the risk of confounding factors, so the researchers took advantage of the fact that many recent clinical trials have examined the impact of SGLT-2 inhibitors on T2D. They pooled data from 25 clinical trials with a total of 19,500 participants, 9,662 of whom received SGLT-2 inhibitors plus metformin; 9,838 received other active comparators.
The fracture rate was 0.91% in the SGLT-2 inhibitors/metformin group, and 0.80% among controls (odds ratio, 0.97; 95% CI, 0.71-1.32), with no heterogeneity. Metformin alone was not associated with a change in fracture rate (OR, 0.95; 95% CI, 0.44-2.08), nor were other forms of diabetes control (OR, 0.95; 95% CI, 0.69-1.31).
There were some differences in fracture risk among SGLT-2 inhibitors when studied individually, though none differed significantly from controls. The highest risk was associated with the canagliflozin/metformin (OR, 2.19; 95% CI, 0.66-7.27), followed by dapagliflozin/metformin (OR, 0.91; 95% CI, 0.50-1.64), empagliflozin/metformin (OR, 0.94; 95% CI, 0.59-1.50), and ertugliflozin/metformin (OR, 0.76; 95% CI, 0.38-1.54).
There were no differences with respect to hip or lumbar spine fractures, or other fractures. The researchers found no differences in bone mineral density or bone turnover markers.
The meta-analysis is limited by the relatively short average follow-up in the included studies, which was 61 weeks. Bone damage may occur over longer time periods. Bone fractures were also not a prespecified adverse event in most included studies.
The studies also did not provide detailed information on the types of fractures experienced, such as whether they were result of a fall, or the location of the fracture, or bone health parameters. Although the results support a belief that SGLT-2 inhibitors do not adversely affect bone health, “given limited information on bone health outcomes, further work is needed to validate this conclusion,” the authors wrote.
The authors did not disclose any funding and had no relevant conflicts of interest.
SOURCE: B-B Qian et al. Osteoporosis Int. 2020 Aug 11. doi: 10.1007/s00198-020-05590-y.
The combination of sodium-glucose transporter-2 (SGLT-2) inhibitors and metformin is not associated with an increase in fracture risk among patients with type 2 diabetes (T2D), according to a new meta-analysis of 25 randomized, controlled trials.
Researchers at The Second Clinical College of Dalian Medical University in Jiangsu, China, compared fracture risk associated with the metformin/SLGT2 combination to metformin alone as well as other T2D therapeutics, and found no differences in risk. The study was published online Aug. 11 in Osteoporosis International.
T2D is associated with an increased risk of fracture, though causative mechanisms remain uncertain. Some lines of evidence suggest multiple factors may contribute to fractures, including hyperglycemia, oxidative stress, toxic effects of advanced glycosylation end-products, altered insulin levels, and treatment-induced hypoglycemia, as well as an association between T2D and increased risk of falls.
Antidiabetes drugs can have positive or negative effects on bone. thiazolidinediones, insulin, and sulfonylureas may increase risk of fractures, while dipeptidyl peptidase-4 (DPP-4) inhibitors and glucagon-like peptide-2 (GLP-2) receptor agonists may be protective. Metformin may also reduce fracture risk.
SGLT-2 inhibitors interrupt glucose reabsorption in the kidney, leading to improved glycemic control. Other benefits include improved renal and cardiovascular outcomes, weight loss, and reduced blood pressure, liver fat, and serum uric acid levels.
These properties have made SGLT-2 inhibitors combined with metformin an important therapy for patients at high risk of atherosclerotic disease, or who have heart failure or chronic kidney disease.
But SGLT-2 inhibition increases osmotic diuresis, and this could alter the mineral balance within bone. Some studies also showed that SGLT-2 inhibitors led to changes in bone turnover markers, bone mineral density, and bone microarchitecture. Observational studies of the SGLT-2 inhibitor canagliflozin found associations with a higher rate of fracture risk in patients taking the drug.
Such studies carry the risk of confounding factors, so the researchers took advantage of the fact that many recent clinical trials have examined the impact of SGLT-2 inhibitors on T2D. They pooled data from 25 clinical trials with a total of 19,500 participants, 9,662 of whom received SGLT-2 inhibitors plus metformin; 9,838 received other active comparators.
The fracture rate was 0.91% in the SGLT-2 inhibitors/metformin group, and 0.80% among controls (odds ratio, 0.97; 95% CI, 0.71-1.32), with no heterogeneity. Metformin alone was not associated with a change in fracture rate (OR, 0.95; 95% CI, 0.44-2.08), nor were other forms of diabetes control (OR, 0.95; 95% CI, 0.69-1.31).
There were some differences in fracture risk among SGLT-2 inhibitors when studied individually, though none differed significantly from controls. The highest risk was associated with the canagliflozin/metformin (OR, 2.19; 95% CI, 0.66-7.27), followed by dapagliflozin/metformin (OR, 0.91; 95% CI, 0.50-1.64), empagliflozin/metformin (OR, 0.94; 95% CI, 0.59-1.50), and ertugliflozin/metformin (OR, 0.76; 95% CI, 0.38-1.54).
There were no differences with respect to hip or lumbar spine fractures, or other fractures. The researchers found no differences in bone mineral density or bone turnover markers.
The meta-analysis is limited by the relatively short average follow-up in the included studies, which was 61 weeks. Bone damage may occur over longer time periods. Bone fractures were also not a prespecified adverse event in most included studies.
The studies also did not provide detailed information on the types of fractures experienced, such as whether they were result of a fall, or the location of the fracture, or bone health parameters. Although the results support a belief that SGLT-2 inhibitors do not adversely affect bone health, “given limited information on bone health outcomes, further work is needed to validate this conclusion,” the authors wrote.
The authors did not disclose any funding and had no relevant conflicts of interest.
SOURCE: B-B Qian et al. Osteoporosis Int. 2020 Aug 11. doi: 10.1007/s00198-020-05590-y.
The combination of sodium-glucose transporter-2 (SGLT-2) inhibitors and metformin is not associated with an increase in fracture risk among patients with type 2 diabetes (T2D), according to a new meta-analysis of 25 randomized, controlled trials.
Researchers at The Second Clinical College of Dalian Medical University in Jiangsu, China, compared fracture risk associated with the metformin/SLGT2 combination to metformin alone as well as other T2D therapeutics, and found no differences in risk. The study was published online Aug. 11 in Osteoporosis International.
T2D is associated with an increased risk of fracture, though causative mechanisms remain uncertain. Some lines of evidence suggest multiple factors may contribute to fractures, including hyperglycemia, oxidative stress, toxic effects of advanced glycosylation end-products, altered insulin levels, and treatment-induced hypoglycemia, as well as an association between T2D and increased risk of falls.
Antidiabetes drugs can have positive or negative effects on bone. thiazolidinediones, insulin, and sulfonylureas may increase risk of fractures, while dipeptidyl peptidase-4 (DPP-4) inhibitors and glucagon-like peptide-2 (GLP-2) receptor agonists may be protective. Metformin may also reduce fracture risk.
SGLT-2 inhibitors interrupt glucose reabsorption in the kidney, leading to improved glycemic control. Other benefits include improved renal and cardiovascular outcomes, weight loss, and reduced blood pressure, liver fat, and serum uric acid levels.
These properties have made SGLT-2 inhibitors combined with metformin an important therapy for patients at high risk of atherosclerotic disease, or who have heart failure or chronic kidney disease.
But SGLT-2 inhibition increases osmotic diuresis, and this could alter the mineral balance within bone. Some studies also showed that SGLT-2 inhibitors led to changes in bone turnover markers, bone mineral density, and bone microarchitecture. Observational studies of the SGLT-2 inhibitor canagliflozin found associations with a higher rate of fracture risk in patients taking the drug.
Such studies carry the risk of confounding factors, so the researchers took advantage of the fact that many recent clinical trials have examined the impact of SGLT-2 inhibitors on T2D. They pooled data from 25 clinical trials with a total of 19,500 participants, 9,662 of whom received SGLT-2 inhibitors plus metformin; 9,838 received other active comparators.
The fracture rate was 0.91% in the SGLT-2 inhibitors/metformin group, and 0.80% among controls (odds ratio, 0.97; 95% CI, 0.71-1.32), with no heterogeneity. Metformin alone was not associated with a change in fracture rate (OR, 0.95; 95% CI, 0.44-2.08), nor were other forms of diabetes control (OR, 0.95; 95% CI, 0.69-1.31).
There were some differences in fracture risk among SGLT-2 inhibitors when studied individually, though none differed significantly from controls. The highest risk was associated with the canagliflozin/metformin (OR, 2.19; 95% CI, 0.66-7.27), followed by dapagliflozin/metformin (OR, 0.91; 95% CI, 0.50-1.64), empagliflozin/metformin (OR, 0.94; 95% CI, 0.59-1.50), and ertugliflozin/metformin (OR, 0.76; 95% CI, 0.38-1.54).
There were no differences with respect to hip or lumbar spine fractures, or other fractures. The researchers found no differences in bone mineral density or bone turnover markers.
The meta-analysis is limited by the relatively short average follow-up in the included studies, which was 61 weeks. Bone damage may occur over longer time periods. Bone fractures were also not a prespecified adverse event in most included studies.
The studies also did not provide detailed information on the types of fractures experienced, such as whether they were result of a fall, or the location of the fracture, or bone health parameters. Although the results support a belief that SGLT-2 inhibitors do not adversely affect bone health, “given limited information on bone health outcomes, further work is needed to validate this conclusion,” the authors wrote.
The authors did not disclose any funding and had no relevant conflicts of interest.
SOURCE: B-B Qian et al. Osteoporosis Int. 2020 Aug 11. doi: 10.1007/s00198-020-05590-y.
FROM OSTEOPOROSIS INTERNATIONAL
COVID-19 child case count now over 400,000
according to a new report from the American Academy of Pediatrics and the Children’s Hospital Association.
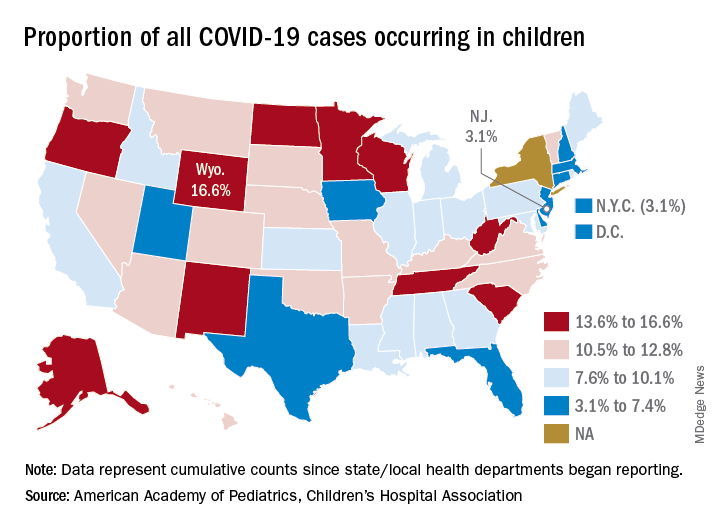
The 406,000 children who have tested positive for COVID-19 represent 9.1% of all cases reported so far by 49 states (New York does not provide age distribution), New York City, the District of Columbia, Puerto Rico, and Guam. Since the proportion of child cases also was 9.1% on Aug. 6, the most recent week is the first without an increase since tracking began in mid-April, the report shows.
State-level data show that Wyoming has the highest percentage of child cases (16.6%) after Alabama changed its “definition of child case from 0-24 to 0-17 years, resulting in a downward revision of cumulative child cases,” the AAP and the CHA said. Alabama’s proportion of such cases dropped from 22.5% to 9.0%.
New Jersey had the lowest rate (3.1%) again this week, along with New York City, but both were up slightly from the week before, when New Jersey was at 2.9% and N.Y.C. was 3.0%. The only states, other than Alabama, that saw declines over the last week were Arkansas, Massachusetts, Mississippi, South Dakota, Texas, and West Virginia. Texas, however, has reported age for only 8% of its confirmed cases, the report noted.
The overall rate of child COVID-19 cases as of Aug. 13 was 538 per 100,000 children, up from 500.7 per 100,000 a week earlier. Arizona was again highest among the states with a rate of 1,254 per 100,000 (up from 1,206) and Vermont was lowest at 121, although Puerto Rico (114) and Guam (88) were lower still, the AAP/CHA data indicate.
For the nine states that report testing information for children, Arizona has the highest positivity rate at 18.3% and West Virginia has the lowest at 3.6%. Data on hospitalizations – available from 21 states and N.Y.C. – show that 3,849 children have been admitted, with rates varying from 0.2% of children in Hawaii to 8.8% in the Big Apple, according to the report.
More specific information on child cases, such as symptoms or underlying conditions, is not being provided by states at this time, the AAP and CHA pointed out.
according to a new report from the American Academy of Pediatrics and the Children’s Hospital Association.
The 406,000 children who have tested positive for COVID-19 represent 9.1% of all cases reported so far by 49 states (New York does not provide age distribution), New York City, the District of Columbia, Puerto Rico, and Guam. Since the proportion of child cases also was 9.1% on Aug. 6, the most recent week is the first without an increase since tracking began in mid-April, the report shows.
State-level data show that Wyoming has the highest percentage of child cases (16.6%) after Alabama changed its “definition of child case from 0-24 to 0-17 years, resulting in a downward revision of cumulative child cases,” the AAP and the CHA said. Alabama’s proportion of such cases dropped from 22.5% to 9.0%.
New Jersey had the lowest rate (3.1%) again this week, along with New York City, but both were up slightly from the week before, when New Jersey was at 2.9% and N.Y.C. was 3.0%. The only states, other than Alabama, that saw declines over the last week were Arkansas, Massachusetts, Mississippi, South Dakota, Texas, and West Virginia. Texas, however, has reported age for only 8% of its confirmed cases, the report noted.
The overall rate of child COVID-19 cases as of Aug. 13 was 538 per 100,000 children, up from 500.7 per 100,000 a week earlier. Arizona was again highest among the states with a rate of 1,254 per 100,000 (up from 1,206) and Vermont was lowest at 121, although Puerto Rico (114) and Guam (88) were lower still, the AAP/CHA data indicate.
For the nine states that report testing information for children, Arizona has the highest positivity rate at 18.3% and West Virginia has the lowest at 3.6%. Data on hospitalizations – available from 21 states and N.Y.C. – show that 3,849 children have been admitted, with rates varying from 0.2% of children in Hawaii to 8.8% in the Big Apple, according to the report.
More specific information on child cases, such as symptoms or underlying conditions, is not being provided by states at this time, the AAP and CHA pointed out.
according to a new report from the American Academy of Pediatrics and the Children’s Hospital Association.
The 406,000 children who have tested positive for COVID-19 represent 9.1% of all cases reported so far by 49 states (New York does not provide age distribution), New York City, the District of Columbia, Puerto Rico, and Guam. Since the proportion of child cases also was 9.1% on Aug. 6, the most recent week is the first without an increase since tracking began in mid-April, the report shows.
State-level data show that Wyoming has the highest percentage of child cases (16.6%) after Alabama changed its “definition of child case from 0-24 to 0-17 years, resulting in a downward revision of cumulative child cases,” the AAP and the CHA said. Alabama’s proportion of such cases dropped from 22.5% to 9.0%.
New Jersey had the lowest rate (3.1%) again this week, along with New York City, but both were up slightly from the week before, when New Jersey was at 2.9% and N.Y.C. was 3.0%. The only states, other than Alabama, that saw declines over the last week were Arkansas, Massachusetts, Mississippi, South Dakota, Texas, and West Virginia. Texas, however, has reported age for only 8% of its confirmed cases, the report noted.
The overall rate of child COVID-19 cases as of Aug. 13 was 538 per 100,000 children, up from 500.7 per 100,000 a week earlier. Arizona was again highest among the states with a rate of 1,254 per 100,000 (up from 1,206) and Vermont was lowest at 121, although Puerto Rico (114) and Guam (88) were lower still, the AAP/CHA data indicate.
For the nine states that report testing information for children, Arizona has the highest positivity rate at 18.3% and West Virginia has the lowest at 3.6%. Data on hospitalizations – available from 21 states and N.Y.C. – show that 3,849 children have been admitted, with rates varying from 0.2% of children in Hawaii to 8.8% in the Big Apple, according to the report.
More specific information on child cases, such as symptoms or underlying conditions, is not being provided by states at this time, the AAP and CHA pointed out.
Are aging physicians a burden?
The evaluation of physicians with alleged cognitive decline
As forensic evaluators, we are often asked to review and assess the cognition of aging colleagues. The premise often involves a minor mistake, a poor choice of words, or a lapse in judgment. A physician gets reported for having difficulty using a new electronic form, forgetting the dose of a brand new medication, or getting upset in a public setting. Those behaviors often lead to mandatory psychiatric evaluations. Those requirements are often perceived by the provider as an insult, and betrayal by peers despite many years of dedicated work.
Interestingly, we have noticed many independent evaluators and hospital administrators using this opportunity to send many of our colleagues to pasture. There seems to be an unspoken rule among some forensic evaluators that physicians should represent some form of apex of humanity, beyond reproach, and beyond any fault. Those evaluators will point to any mistake on cognitive scales as proof that the aging physician is no longer safe to practice.1 Forgetting that Jill is from Illinois in the Saint Louis University Mental Status Examination test or how to copy a three-dimensional cube on the Montreal Cognitive Assessment can cost someone their license.2 We are also aware of some evaluators even taking the step further and opining that physicians not only need to score adequately but also demonstrate cognition significantly above average to maintain their privileges.
There is certainly significant appeal in setting a high bar for physicians. In many ways, physicians are characterized in society by their astuteness, intelligence, and high ethical standards. Patients place their lives in the hands of physicians and should trust that those physicians have the cognitive tools to heal them. It could almost seem evident that physicians should have high IQs, score perfectly on screening tools for dementia, and complete a mandatory psychiatric evaluation without any reproach. Yet the reality is often more complex.
We have two main concerns about the idea that we should be intransigent with aging physicians. The first one is the vast differential diagnosis for minor mistakes. An aging physician refusing to comply with a new form or yelling at a clerk once when asked to learn a new electronic medical record are inappropriate though not specific assessments for dementia. Similarly, having significant difficulty learning a new electronic medical record system more often is a sign of ageism rather than cognitive impairment. Subsequently, when arriving for their evaluation, forgetting the date is a common sign of anxiety. A relatable analogy would be to compare the mistake with a medical student forgetting part of the anatomy while questioning by an attending during surgery. Imagine such medical students being referred to mandatory psychiatric evaluation when failing to answer a question during rounds.
In our practice, the most common reason for those minor mistakes during our clinical evaluation is anxiety. After all, patients who present for problems completely unrelated to cognitive decline make similar mistakes. Psychological stressors in physicians require no introduction. The concept is so prevalent and pervasive that it has its own name, “burnout.” Imagine having dedicated most of one’s life to a profession then being enumerated a list of complaints, having one’s privileges put on hold, then being told to complete an independent psychiatric evaluation. If burnout is in part caused by a lack of control, unclear job expectations, rapidly changing models of health care, and dysfunctional workplace dynamics, imagine the consequence of such a referral.
The militant evaluator will use jargon to vilify the reviewed physician. If the physician complains too voraciously, he will be described as having signs of frontotemporal dementia. If the physician comes with a written list of rebuttals, he will be described as having memory problems requiring aids. If the physician is demoralized and quiet, he will be described as being withdrawn and apathetic. If the physician refuses to use or has difficulty with new forms or electronic systems, he will be described as having “impaired executive function,” an ominous term that surely should not be associated with a practicing physician.

The second concern arises from problems with the validity and use of diagnoses like mild cognitive impairment (MCI). MCI is considered to be a transition stage when one maintains “normal activities of daily living, and normal general cognitive function.”3 The American Psychiatric Association Textbook of Psychiatry mentions that there are “however, many cases of nonprogressive MCI.” Should a disorder with generally normal cognition and unclear progression to a more severe disorder require one to be dispensed of their privileges? Should any disorder trump an assessment of functioning?
It is our experience that many if not most physicians’ practice of medicine is not a job but a profession that defines who they are. As such, their occupational habits are an overly repeated and ingrained series of maneuvers analogous to so-called muscle memory. This kind of ritualistic pattern is precisely the kind of cognition that may persist as one starts to have some deficits. This requires the evaluator to be particularly sensitive and cognizant that one may still be able to perform professionally despite some mild but notable deficits. While it is facile to diagnose someone with MCI and justify removing their license, a review of their actual clinical skills is, despite being more time consuming, more pertinent to the evaluation.
In practice, we find that many cases lie in a gray area, which is hard to define. Physicians may come to our office for an evaluation after having said something odd at work. Maybe they misdosed a medication on one occasion. Maybe they wrote the wrong year on a chart. However, if the physician was 30 years old, would we consider any one of those incidents significant? As a psychiatrist rather than a physician practicing the specialty in review, it is particularly hard and sometimes unwise to condone or sanction individual incidents.
Evaluators find solace in neuropsychological testing. However the relevance to the safety of patients is unclear. Many of those tests end up being a simple proxy for age. A physicians’ ability to sort words or cards at a certain speed might correlate to cognitive performance but has unclear significance to the ability to care for patients. Using such tests becomes a de facto age limit on the practice of medicine. It seems essential to expand and refine our repertoire of evaluation tools for the assessment of physicians. As when we perform capacity evaluation in the hospital, we enlist the assistance of the treating team in understanding the questions being asked for a patient, medical boards could consider creating independent multidisciplinary teams where psychiatry has a seat along with the relevant specialties of the evaluee. Likewise, the assessment would benefit from a broad review of the physicians’ general practice rather than the more typical review of one or two incidents.
We are promoting a more individualized approach by medical boards to the many issues of the aging physician. Retiring is no longer the dream of older physicians, but rather working in the suitable position where their contributions, clinical experience, and wisdom are positive contributions to patient care. Furthermore, we encourage medical boards to consider more nuanced decisions. A binary approach fits few cases that we see. Surgeons are a prime example of this. A surgeon in the early stages of Parkinsonism may be unfit to perform surgery but very capable of continuing to contribute to the well-being of patients in other forms of clinical work, including postsurgical care that doesn’t involve physical dexterity. Similarly, medical boards could consider other forms of partial restrictions, including a ban on procedures, a ban on hospital privileges, as well as required supervision or working in teams. Accumulated clinical wisdom allows older physicians to be excellent mentors and educators for younger doctors. There is no simple method to predict which physicians may have the early stages of a progressive dementia, and which may have a stable MCI. A yearly reevaluation if there are no further complaints, is the best approach to determine progression of cognitive problems.
Few crises like the current COVID-19 pandemic can better remind us of the importance of the place of medicine in society. Many states have encouraged retired physicians to contribute their knowledge and expertise, putting themselves in particular risk because of their age. It is a good time to be reminded that we owe them significant respect and care when deciding to remove their license. We are encouraged by the diligent efforts of medical boards in supervising our colleagues but warn against zealot evaluators who use this opportunity to force physicians into retirement. We also encourage medical boards to expand their tools and approaches when facing such cases, as mislabeled cognitive diagnoses can be an easy scapegoat of a poor understanding of the more important psychological and biological factors in the evaluation.
References
1. Tariq SH et al. Am J Geriatr Psychiatry. 2006;14:900-10.
2. Nasreddine Z. mocatest.org. Version 2004 Nov 7.
3. Hales RE et al. The American Psychiatric Publishing Textbook of Psychiatry. Washington: American Psychiatric Association Publishing, 2014.
Dr. Badre is a forensic psychiatrist in San Diego and an expert in correctional mental health. He holds teaching positions at the University of California, San Diego, and the University of San Diego. He teaches medical education, psychopharmacology, ethics in psychiatry, and correctional care. Among his writings in chapter 7 in the book “Critical Psychiatry: Controversies and Clinical Implications” (Cham, Switzerland: Springer, 2019). He has no disclosures.
Dr. Abrams is a forensic psychiatrist and attorney in San Diego. He is an expert in addictionology, behavioral toxicology, psychopharmacology and correctional mental health. He holds a teaching positions at the University of California, San Diego. Among his writings are chapters about competency in national textbooks. Dr. Abrams has no disclosures.
The evaluation of physicians with alleged cognitive decline
The evaluation of physicians with alleged cognitive decline
As forensic evaluators, we are often asked to review and assess the cognition of aging colleagues. The premise often involves a minor mistake, a poor choice of words, or a lapse in judgment. A physician gets reported for having difficulty using a new electronic form, forgetting the dose of a brand new medication, or getting upset in a public setting. Those behaviors often lead to mandatory psychiatric evaluations. Those requirements are often perceived by the provider as an insult, and betrayal by peers despite many years of dedicated work.
Interestingly, we have noticed many independent evaluators and hospital administrators using this opportunity to send many of our colleagues to pasture. There seems to be an unspoken rule among some forensic evaluators that physicians should represent some form of apex of humanity, beyond reproach, and beyond any fault. Those evaluators will point to any mistake on cognitive scales as proof that the aging physician is no longer safe to practice.1 Forgetting that Jill is from Illinois in the Saint Louis University Mental Status Examination test or how to copy a three-dimensional cube on the Montreal Cognitive Assessment can cost someone their license.2 We are also aware of some evaluators even taking the step further and opining that physicians not only need to score adequately but also demonstrate cognition significantly above average to maintain their privileges.
There is certainly significant appeal in setting a high bar for physicians. In many ways, physicians are characterized in society by their astuteness, intelligence, and high ethical standards. Patients place their lives in the hands of physicians and should trust that those physicians have the cognitive tools to heal them. It could almost seem evident that physicians should have high IQs, score perfectly on screening tools for dementia, and complete a mandatory psychiatric evaluation without any reproach. Yet the reality is often more complex.
We have two main concerns about the idea that we should be intransigent with aging physicians. The first one is the vast differential diagnosis for minor mistakes. An aging physician refusing to comply with a new form or yelling at a clerk once when asked to learn a new electronic medical record are inappropriate though not specific assessments for dementia. Similarly, having significant difficulty learning a new electronic medical record system more often is a sign of ageism rather than cognitive impairment. Subsequently, when arriving for their evaluation, forgetting the date is a common sign of anxiety. A relatable analogy would be to compare the mistake with a medical student forgetting part of the anatomy while questioning by an attending during surgery. Imagine such medical students being referred to mandatory psychiatric evaluation when failing to answer a question during rounds.
In our practice, the most common reason for those minor mistakes during our clinical evaluation is anxiety. After all, patients who present for problems completely unrelated to cognitive decline make similar mistakes. Psychological stressors in physicians require no introduction. The concept is so prevalent and pervasive that it has its own name, “burnout.” Imagine having dedicated most of one’s life to a profession then being enumerated a list of complaints, having one’s privileges put on hold, then being told to complete an independent psychiatric evaluation. If burnout is in part caused by a lack of control, unclear job expectations, rapidly changing models of health care, and dysfunctional workplace dynamics, imagine the consequence of such a referral.
The militant evaluator will use jargon to vilify the reviewed physician. If the physician complains too voraciously, he will be described as having signs of frontotemporal dementia. If the physician comes with a written list of rebuttals, he will be described as having memory problems requiring aids. If the physician is demoralized and quiet, he will be described as being withdrawn and apathetic. If the physician refuses to use or has difficulty with new forms or electronic systems, he will be described as having “impaired executive function,” an ominous term that surely should not be associated with a practicing physician.
The second concern arises from problems with the validity and use of diagnoses like mild cognitive impairment (MCI). MCI is considered to be a transition stage when one maintains “normal activities of daily living, and normal general cognitive function.”3 The American Psychiatric Association Textbook of Psychiatry mentions that there are “however, many cases of nonprogressive MCI.” Should a disorder with generally normal cognition and unclear progression to a more severe disorder require one to be dispensed of their privileges? Should any disorder trump an assessment of functioning?
It is our experience that many if not most physicians’ practice of medicine is not a job but a profession that defines who they are. As such, their occupational habits are an overly repeated and ingrained series of maneuvers analogous to so-called muscle memory. This kind of ritualistic pattern is precisely the kind of cognition that may persist as one starts to have some deficits. This requires the evaluator to be particularly sensitive and cognizant that one may still be able to perform professionally despite some mild but notable deficits. While it is facile to diagnose someone with MCI and justify removing their license, a review of their actual clinical skills is, despite being more time consuming, more pertinent to the evaluation.
In practice, we find that many cases lie in a gray area, which is hard to define. Physicians may come to our office for an evaluation after having said something odd at work. Maybe they misdosed a medication on one occasion. Maybe they wrote the wrong year on a chart. However, if the physician was 30 years old, would we consider any one of those incidents significant? As a psychiatrist rather than a physician practicing the specialty in review, it is particularly hard and sometimes unwise to condone or sanction individual incidents.
Evaluators find solace in neuropsychological testing. However the relevance to the safety of patients is unclear. Many of those tests end up being a simple proxy for age. A physicians’ ability to sort words or cards at a certain speed might correlate to cognitive performance but has unclear significance to the ability to care for patients. Using such tests becomes a de facto age limit on the practice of medicine. It seems essential to expand and refine our repertoire of evaluation tools for the assessment of physicians. As when we perform capacity evaluation in the hospital, we enlist the assistance of the treating team in understanding the questions being asked for a patient, medical boards could consider creating independent multidisciplinary teams where psychiatry has a seat along with the relevant specialties of the evaluee. Likewise, the assessment would benefit from a broad review of the physicians’ general practice rather than the more typical review of one or two incidents.
We are promoting a more individualized approach by medical boards to the many issues of the aging physician. Retiring is no longer the dream of older physicians, but rather working in the suitable position where their contributions, clinical experience, and wisdom are positive contributions to patient care. Furthermore, we encourage medical boards to consider more nuanced decisions. A binary approach fits few cases that we see. Surgeons are a prime example of this. A surgeon in the early stages of Parkinsonism may be unfit to perform surgery but very capable of continuing to contribute to the well-being of patients in other forms of clinical work, including postsurgical care that doesn’t involve physical dexterity. Similarly, medical boards could consider other forms of partial restrictions, including a ban on procedures, a ban on hospital privileges, as well as required supervision or working in teams. Accumulated clinical wisdom allows older physicians to be excellent mentors and educators for younger doctors. There is no simple method to predict which physicians may have the early stages of a progressive dementia, and which may have a stable MCI. A yearly reevaluation if there are no further complaints, is the best approach to determine progression of cognitive problems.
Few crises like the current COVID-19 pandemic can better remind us of the importance of the place of medicine in society. Many states have encouraged retired physicians to contribute their knowledge and expertise, putting themselves in particular risk because of their age. It is a good time to be reminded that we owe them significant respect and care when deciding to remove their license. We are encouraged by the diligent efforts of medical boards in supervising our colleagues but warn against zealot evaluators who use this opportunity to force physicians into retirement. We also encourage medical boards to expand their tools and approaches when facing such cases, as mislabeled cognitive diagnoses can be an easy scapegoat of a poor understanding of the more important psychological and biological factors in the evaluation.
References
1. Tariq SH et al. Am J Geriatr Psychiatry. 2006;14:900-10.
2. Nasreddine Z. mocatest.org. Version 2004 Nov 7.
3. Hales RE et al. The American Psychiatric Publishing Textbook of Psychiatry. Washington: American Psychiatric Association Publishing, 2014.
Dr. Badre is a forensic psychiatrist in San Diego and an expert in correctional mental health. He holds teaching positions at the University of California, San Diego, and the University of San Diego. He teaches medical education, psychopharmacology, ethics in psychiatry, and correctional care. Among his writings in chapter 7 in the book “Critical Psychiatry: Controversies and Clinical Implications” (Cham, Switzerland: Springer, 2019). He has no disclosures.
Dr. Abrams is a forensic psychiatrist and attorney in San Diego. He is an expert in addictionology, behavioral toxicology, psychopharmacology and correctional mental health. He holds a teaching positions at the University of California, San Diego. Among his writings are chapters about competency in national textbooks. Dr. Abrams has no disclosures.
As forensic evaluators, we are often asked to review and assess the cognition of aging colleagues. The premise often involves a minor mistake, a poor choice of words, or a lapse in judgment. A physician gets reported for having difficulty using a new electronic form, forgetting the dose of a brand new medication, or getting upset in a public setting. Those behaviors often lead to mandatory psychiatric evaluations. Those requirements are often perceived by the provider as an insult, and betrayal by peers despite many years of dedicated work.
Interestingly, we have noticed many independent evaluators and hospital administrators using this opportunity to send many of our colleagues to pasture. There seems to be an unspoken rule among some forensic evaluators that physicians should represent some form of apex of humanity, beyond reproach, and beyond any fault. Those evaluators will point to any mistake on cognitive scales as proof that the aging physician is no longer safe to practice.1 Forgetting that Jill is from Illinois in the Saint Louis University Mental Status Examination test or how to copy a three-dimensional cube on the Montreal Cognitive Assessment can cost someone their license.2 We are also aware of some evaluators even taking the step further and opining that physicians not only need to score adequately but also demonstrate cognition significantly above average to maintain their privileges.
There is certainly significant appeal in setting a high bar for physicians. In many ways, physicians are characterized in society by their astuteness, intelligence, and high ethical standards. Patients place their lives in the hands of physicians and should trust that those physicians have the cognitive tools to heal them. It could almost seem evident that physicians should have high IQs, score perfectly on screening tools for dementia, and complete a mandatory psychiatric evaluation without any reproach. Yet the reality is often more complex.
We have two main concerns about the idea that we should be intransigent with aging physicians. The first one is the vast differential diagnosis for minor mistakes. An aging physician refusing to comply with a new form or yelling at a clerk once when asked to learn a new electronic medical record are inappropriate though not specific assessments for dementia. Similarly, having significant difficulty learning a new electronic medical record system more often is a sign of ageism rather than cognitive impairment. Subsequently, when arriving for their evaluation, forgetting the date is a common sign of anxiety. A relatable analogy would be to compare the mistake with a medical student forgetting part of the anatomy while questioning by an attending during surgery. Imagine such medical students being referred to mandatory psychiatric evaluation when failing to answer a question during rounds.
In our practice, the most common reason for those minor mistakes during our clinical evaluation is anxiety. After all, patients who present for problems completely unrelated to cognitive decline make similar mistakes. Psychological stressors in physicians require no introduction. The concept is so prevalent and pervasive that it has its own name, “burnout.” Imagine having dedicated most of one’s life to a profession then being enumerated a list of complaints, having one’s privileges put on hold, then being told to complete an independent psychiatric evaluation. If burnout is in part caused by a lack of control, unclear job expectations, rapidly changing models of health care, and dysfunctional workplace dynamics, imagine the consequence of such a referral.
The militant evaluator will use jargon to vilify the reviewed physician. If the physician complains too voraciously, he will be described as having signs of frontotemporal dementia. If the physician comes with a written list of rebuttals, he will be described as having memory problems requiring aids. If the physician is demoralized and quiet, he will be described as being withdrawn and apathetic. If the physician refuses to use or has difficulty with new forms or electronic systems, he will be described as having “impaired executive function,” an ominous term that surely should not be associated with a practicing physician.
The second concern arises from problems with the validity and use of diagnoses like mild cognitive impairment (MCI). MCI is considered to be a transition stage when one maintains “normal activities of daily living, and normal general cognitive function.”3 The American Psychiatric Association Textbook of Psychiatry mentions that there are “however, many cases of nonprogressive MCI.” Should a disorder with generally normal cognition and unclear progression to a more severe disorder require one to be dispensed of their privileges? Should any disorder trump an assessment of functioning?
It is our experience that many if not most physicians’ practice of medicine is not a job but a profession that defines who they are. As such, their occupational habits are an overly repeated and ingrained series of maneuvers analogous to so-called muscle memory. This kind of ritualistic pattern is precisely the kind of cognition that may persist as one starts to have some deficits. This requires the evaluator to be particularly sensitive and cognizant that one may still be able to perform professionally despite some mild but notable deficits. While it is facile to diagnose someone with MCI and justify removing their license, a review of their actual clinical skills is, despite being more time consuming, more pertinent to the evaluation.
In practice, we find that many cases lie in a gray area, which is hard to define. Physicians may come to our office for an evaluation after having said something odd at work. Maybe they misdosed a medication on one occasion. Maybe they wrote the wrong year on a chart. However, if the physician was 30 years old, would we consider any one of those incidents significant? As a psychiatrist rather than a physician practicing the specialty in review, it is particularly hard and sometimes unwise to condone or sanction individual incidents.
Evaluators find solace in neuropsychological testing. However the relevance to the safety of patients is unclear. Many of those tests end up being a simple proxy for age. A physicians’ ability to sort words or cards at a certain speed might correlate to cognitive performance but has unclear significance to the ability to care for patients. Using such tests becomes a de facto age limit on the practice of medicine. It seems essential to expand and refine our repertoire of evaluation tools for the assessment of physicians. As when we perform capacity evaluation in the hospital, we enlist the assistance of the treating team in understanding the questions being asked for a patient, medical boards could consider creating independent multidisciplinary teams where psychiatry has a seat along with the relevant specialties of the evaluee. Likewise, the assessment would benefit from a broad review of the physicians’ general practice rather than the more typical review of one or two incidents.
We are promoting a more individualized approach by medical boards to the many issues of the aging physician. Retiring is no longer the dream of older physicians, but rather working in the suitable position where their contributions, clinical experience, and wisdom are positive contributions to patient care. Furthermore, we encourage medical boards to consider more nuanced decisions. A binary approach fits few cases that we see. Surgeons are a prime example of this. A surgeon in the early stages of Parkinsonism may be unfit to perform surgery but very capable of continuing to contribute to the well-being of patients in other forms of clinical work, including postsurgical care that doesn’t involve physical dexterity. Similarly, medical boards could consider other forms of partial restrictions, including a ban on procedures, a ban on hospital privileges, as well as required supervision or working in teams. Accumulated clinical wisdom allows older physicians to be excellent mentors and educators for younger doctors. There is no simple method to predict which physicians may have the early stages of a progressive dementia, and which may have a stable MCI. A yearly reevaluation if there are no further complaints, is the best approach to determine progression of cognitive problems.
Few crises like the current COVID-19 pandemic can better remind us of the importance of the place of medicine in society. Many states have encouraged retired physicians to contribute their knowledge and expertise, putting themselves in particular risk because of their age. It is a good time to be reminded that we owe them significant respect and care when deciding to remove their license. We are encouraged by the diligent efforts of medical boards in supervising our colleagues but warn against zealot evaluators who use this opportunity to force physicians into retirement. We also encourage medical boards to expand their tools and approaches when facing such cases, as mislabeled cognitive diagnoses can be an easy scapegoat of a poor understanding of the more important psychological and biological factors in the evaluation.
References
1. Tariq SH et al. Am J Geriatr Psychiatry. 2006;14:900-10.
2. Nasreddine Z. mocatest.org. Version 2004 Nov 7.
3. Hales RE et al. The American Psychiatric Publishing Textbook of Psychiatry. Washington: American Psychiatric Association Publishing, 2014.
Dr. Badre is a forensic psychiatrist in San Diego and an expert in correctional mental health. He holds teaching positions at the University of California, San Diego, and the University of San Diego. He teaches medical education, psychopharmacology, ethics in psychiatry, and correctional care. Among his writings in chapter 7 in the book “Critical Psychiatry: Controversies and Clinical Implications” (Cham, Switzerland: Springer, 2019). He has no disclosures.
Dr. Abrams is a forensic psychiatrist and attorney in San Diego. He is an expert in addictionology, behavioral toxicology, psychopharmacology and correctional mental health. He holds a teaching positions at the University of California, San Diego. Among his writings are chapters about competency in national textbooks. Dr. Abrams has no disclosures.
HFNC more comfortable for posthypercapnic patients with COPD
Following invasive ventilation for severe hypercapnic respiratory failure, patients with chronic obstructive pulmonary disease had similar levels of treatment failure if they received high-flow nasal cannula oxygen therapy or noninvasive ventilation, recent research in Critical Care has suggested.
However, for patients with COPD weaned off invasive ventilation, high-flow nasal cannula (HFNC) oxygen therapy was “more comfortable and better tolerated,” compared with noninvasive ventilation (NIV). In addition, “airway care interventions and the incidence of nasofacial skin breakdown associated with HFNC were significantly lower than in NIV,” according to Dingyu Tan of the Clinical Medical College of Yangzhou (China) University, Northern Jiangsu People’s Hospital, and colleagues. “HFNC appears to be an effective means of respiratory support for COPD patients extubated after severe hypercapnic respiratory failure,” they said.
The investigators screened patients with COPD and hypercapnic respiratory failure for enrollment, including those who met Global Initiative for Obstructive Lung Disease (GOLD) criteria, were 85 years old or younger and caring for themselves, had bronchopulmonary infection–induced respiratory failure, and had achieved pulmonary infection control criteria. Exclusion criteria were:
- Patients under age 18 years.
- Presence of oral or facial trauma.
- Poor sputum excretion ability.
- Hemodynamic instability that would contraindicate use of NIV.
- Poor cough during PIC window.
- Poor short-term prognosis.
- Failure of the heart, brain, liver or kidney.
- Patients who could not consent to treatment.
Patients were determined to have failed treatment if they returned to invasive mechanical ventilation or switched from one treatment to another (HFNC to NIV or NIV to HFNC). Investigators also performed an arterial blood gas analysis, recorded the number of duration of airway care interventions, and monitored vital signs at 1 hour, 24 hours, and 48 hours after extubation as secondary analyses.
Overall, 44 patients randomized to receive HFNC and 42 patients randomized for NIV were available for analysis. The investigators found 22.7% of patients in the HFNC group and 28.6% in the NIV group experienced treatment failure (risk difference, –5.8%; 95% confidence interval, −23.8 to 12.4%; P = .535), with patients in the HFNC group experiencing a significantly lower level of treatment intolerance, compared with patients in the NIV group (risk difference, –50.0%; 95% CI, −74.6 to −12.9%; P = .015). There were no significant differences between either group regarding intubation (−0.65%; 95% CI, −16.01 to 14.46%), while rate of switching treatments was lower in the HFNC group but not significant (−5.2%; 95% CI, −19.82 to 9.05%).
Patients in both the HFNC and NIV groups had faster mean respiratory rates 1 hour after extubation (P < .050). After 24 hours, the NIV group had higher-than-baseline respiratory rates, compared with the HFNC group, which had returned to normal (20 vs. 24.5 breaths per minute; P < .050). Both groups had returned to baseline by 48 hours after extubation. At 1 hour after extubation, patients in the HFNC group had lower PaO2/FiO2 (P < .050) and pH values (P < .050), and higher PaCO2 values (P less than .050), compared with baseline. There were no statistically significant differences in PaO2/FiO2, pH, and PaCO2 values in either group at 24 hours or 48 hours after extubation.
Daily airway care interventions were significantly higher on average in the NIV group, compared with the HFNC group (7 vs. 6; P = .0006), and the HFNC group also had significantly better comfort scores (7 vs. 5; P < .001) as measured by a modified visual analog scale, as well as incidence of nasal and facial skin breakdown (0 vs. 9.6%; P = .027), compared with the NIV group.
Results difficult to apply to North American patients
David L. Bowton, MD, FCCP, a professor specializing in critical care at Wake Forest University, Winston-Salem, N.C., said in an interview the results of this trial may not be applicable for patients with infection-related respiratory failure and COPD in North America “due to the differences in common weaning practices between North America and China.”
For example, the trial used the pulmonary infection control (PIC) window criteria for extubation, which requires a significant decrease in radiographic infiltrates, improvement in quality and quantity of sputum, normalizing of leukocyte count, a synchronized intermittent mandatory ventilation (SIMV) rate of 10-12 breaths per minute, and pressure support less than 10-12 cm/H2O (Int J Chron Obstruct Pulmon Dis. 2017;12:1255-67).
“The process used to achieve these measures is not standardized. In North America, daily awakening and screening for spontaneous breathing trials would be usual, but this was not reported in the current trial,” he explained.
Differences in patient population also make the application of the results difficult, Dr. Bowton said. “Only 60% of the patients had spirometrically confirmed COPD and fewer than half were on at least dual inhaled therapy prior to hospitalization with only one-third taking beta agonists or anticholinergic agents,” he noted. “The cause of respiratory failure was infectious, requiring an infiltrate on chest radiograph; thus, patients with hypercarbic respiratory failure without a new infiltrate were excluded from the study. On average, patients were hypercarbic, yet alkalemic at the time of extubation; the PaCO2 and pH at the time of intubation were not reported.
“This study suggests that in some patients with COPD and respiratory failure requiring invasive mechanical ventilation, HFO [high-flow oxygen] may be better tolerated and equally effective as NIPPV [noninvasive positive-pressure ventilation] at mitigating the need for reintubation following extubation. In this patient population where hypoxemia prior to extubation was not severe, the mechanisms by which HFO is beneficial remain speculative,” he said.
This study was funded by the Rui E special fund for emergency medicine research and the Yangzhou Science and Technology Development Plan. The authors report no relevant conflicts of interest. Dr. Bowton reports no relevant conflicts of interest.
SOURCE: Tan D et al. Crit Care. 2020 Aug 6. doi: 10.1186/s13054-020-03214-9.
Following invasive ventilation for severe hypercapnic respiratory failure, patients with chronic obstructive pulmonary disease had similar levels of treatment failure if they received high-flow nasal cannula oxygen therapy or noninvasive ventilation, recent research in Critical Care has suggested.
However, for patients with COPD weaned off invasive ventilation, high-flow nasal cannula (HFNC) oxygen therapy was “more comfortable and better tolerated,” compared with noninvasive ventilation (NIV). In addition, “airway care interventions and the incidence of nasofacial skin breakdown associated with HFNC were significantly lower than in NIV,” according to Dingyu Tan of the Clinical Medical College of Yangzhou (China) University, Northern Jiangsu People’s Hospital, and colleagues. “HFNC appears to be an effective means of respiratory support for COPD patients extubated after severe hypercapnic respiratory failure,” they said.
The investigators screened patients with COPD and hypercapnic respiratory failure for enrollment, including those who met Global Initiative for Obstructive Lung Disease (GOLD) criteria, were 85 years old or younger and caring for themselves, had bronchopulmonary infection–induced respiratory failure, and had achieved pulmonary infection control criteria. Exclusion criteria were:
- Patients under age 18 years.
- Presence of oral or facial trauma.
- Poor sputum excretion ability.
- Hemodynamic instability that would contraindicate use of NIV.
- Poor cough during PIC window.
- Poor short-term prognosis.
- Failure of the heart, brain, liver or kidney.
- Patients who could not consent to treatment.
Patients were determined to have failed treatment if they returned to invasive mechanical ventilation or switched from one treatment to another (HFNC to NIV or NIV to HFNC). Investigators also performed an arterial blood gas analysis, recorded the number of duration of airway care interventions, and monitored vital signs at 1 hour, 24 hours, and 48 hours after extubation as secondary analyses.
Overall, 44 patients randomized to receive HFNC and 42 patients randomized for NIV were available for analysis. The investigators found 22.7% of patients in the HFNC group and 28.6% in the NIV group experienced treatment failure (risk difference, –5.8%; 95% confidence interval, −23.8 to 12.4%; P = .535), with patients in the HFNC group experiencing a significantly lower level of treatment intolerance, compared with patients in the NIV group (risk difference, –50.0%; 95% CI, −74.6 to −12.9%; P = .015). There were no significant differences between either group regarding intubation (−0.65%; 95% CI, −16.01 to 14.46%), while rate of switching treatments was lower in the HFNC group but not significant (−5.2%; 95% CI, −19.82 to 9.05%).
Patients in both the HFNC and NIV groups had faster mean respiratory rates 1 hour after extubation (P < .050). After 24 hours, the NIV group had higher-than-baseline respiratory rates, compared with the HFNC group, which had returned to normal (20 vs. 24.5 breaths per minute; P < .050). Both groups had returned to baseline by 48 hours after extubation. At 1 hour after extubation, patients in the HFNC group had lower PaO2/FiO2 (P < .050) and pH values (P < .050), and higher PaCO2 values (P less than .050), compared with baseline. There were no statistically significant differences in PaO2/FiO2, pH, and PaCO2 values in either group at 24 hours or 48 hours after extubation.
Daily airway care interventions were significantly higher on average in the NIV group, compared with the HFNC group (7 vs. 6; P = .0006), and the HFNC group also had significantly better comfort scores (7 vs. 5; P < .001) as measured by a modified visual analog scale, as well as incidence of nasal and facial skin breakdown (0 vs. 9.6%; P = .027), compared with the NIV group.
Results difficult to apply to North American patients
David L. Bowton, MD, FCCP, a professor specializing in critical care at Wake Forest University, Winston-Salem, N.C., said in an interview the results of this trial may not be applicable for patients with infection-related respiratory failure and COPD in North America “due to the differences in common weaning practices between North America and China.”
For example, the trial used the pulmonary infection control (PIC) window criteria for extubation, which requires a significant decrease in radiographic infiltrates, improvement in quality and quantity of sputum, normalizing of leukocyte count, a synchronized intermittent mandatory ventilation (SIMV) rate of 10-12 breaths per minute, and pressure support less than 10-12 cm/H2O (Int J Chron Obstruct Pulmon Dis. 2017;12:1255-67).
“The process used to achieve these measures is not standardized. In North America, daily awakening and screening for spontaneous breathing trials would be usual, but this was not reported in the current trial,” he explained.
Differences in patient population also make the application of the results difficult, Dr. Bowton said. “Only 60% of the patients had spirometrically confirmed COPD and fewer than half were on at least dual inhaled therapy prior to hospitalization with only one-third taking beta agonists or anticholinergic agents,” he noted. “The cause of respiratory failure was infectious, requiring an infiltrate on chest radiograph; thus, patients with hypercarbic respiratory failure without a new infiltrate were excluded from the study. On average, patients were hypercarbic, yet alkalemic at the time of extubation; the PaCO2 and pH at the time of intubation were not reported.
“This study suggests that in some patients with COPD and respiratory failure requiring invasive mechanical ventilation, HFO [high-flow oxygen] may be better tolerated and equally effective as NIPPV [noninvasive positive-pressure ventilation] at mitigating the need for reintubation following extubation. In this patient population where hypoxemia prior to extubation was not severe, the mechanisms by which HFO is beneficial remain speculative,” he said.
This study was funded by the Rui E special fund for emergency medicine research and the Yangzhou Science and Technology Development Plan. The authors report no relevant conflicts of interest. Dr. Bowton reports no relevant conflicts of interest.
SOURCE: Tan D et al. Crit Care. 2020 Aug 6. doi: 10.1186/s13054-020-03214-9.
Following invasive ventilation for severe hypercapnic respiratory failure, patients with chronic obstructive pulmonary disease had similar levels of treatment failure if they received high-flow nasal cannula oxygen therapy or noninvasive ventilation, recent research in Critical Care has suggested.
However, for patients with COPD weaned off invasive ventilation, high-flow nasal cannula (HFNC) oxygen therapy was “more comfortable and better tolerated,” compared with noninvasive ventilation (NIV). In addition, “airway care interventions and the incidence of nasofacial skin breakdown associated with HFNC were significantly lower than in NIV,” according to Dingyu Tan of the Clinical Medical College of Yangzhou (China) University, Northern Jiangsu People’s Hospital, and colleagues. “HFNC appears to be an effective means of respiratory support for COPD patients extubated after severe hypercapnic respiratory failure,” they said.
The investigators screened patients with COPD and hypercapnic respiratory failure for enrollment, including those who met Global Initiative for Obstructive Lung Disease (GOLD) criteria, were 85 years old or younger and caring for themselves, had bronchopulmonary infection–induced respiratory failure, and had achieved pulmonary infection control criteria. Exclusion criteria were:
- Patients under age 18 years.
- Presence of oral or facial trauma.
- Poor sputum excretion ability.
- Hemodynamic instability that would contraindicate use of NIV.
- Poor cough during PIC window.
- Poor short-term prognosis.
- Failure of the heart, brain, liver or kidney.
- Patients who could not consent to treatment.
Patients were determined to have failed treatment if they returned to invasive mechanical ventilation or switched from one treatment to another (HFNC to NIV or NIV to HFNC). Investigators also performed an arterial blood gas analysis, recorded the number of duration of airway care interventions, and monitored vital signs at 1 hour, 24 hours, and 48 hours after extubation as secondary analyses.
Overall, 44 patients randomized to receive HFNC and 42 patients randomized for NIV were available for analysis. The investigators found 22.7% of patients in the HFNC group and 28.6% in the NIV group experienced treatment failure (risk difference, –5.8%; 95% confidence interval, −23.8 to 12.4%; P = .535), with patients in the HFNC group experiencing a significantly lower level of treatment intolerance, compared with patients in the NIV group (risk difference, –50.0%; 95% CI, −74.6 to −12.9%; P = .015). There were no significant differences between either group regarding intubation (−0.65%; 95% CI, −16.01 to 14.46%), while rate of switching treatments was lower in the HFNC group but not significant (−5.2%; 95% CI, −19.82 to 9.05%).
Patients in both the HFNC and NIV groups had faster mean respiratory rates 1 hour after extubation (P < .050). After 24 hours, the NIV group had higher-than-baseline respiratory rates, compared with the HFNC group, which had returned to normal (20 vs. 24.5 breaths per minute; P < .050). Both groups had returned to baseline by 48 hours after extubation. At 1 hour after extubation, patients in the HFNC group had lower PaO2/FiO2 (P < .050) and pH values (P < .050), and higher PaCO2 values (P less than .050), compared with baseline. There were no statistically significant differences in PaO2/FiO2, pH, and PaCO2 values in either group at 24 hours or 48 hours after extubation.
Daily airway care interventions were significantly higher on average in the NIV group, compared with the HFNC group (7 vs. 6; P = .0006), and the HFNC group also had significantly better comfort scores (7 vs. 5; P < .001) as measured by a modified visual analog scale, as well as incidence of nasal and facial skin breakdown (0 vs. 9.6%; P = .027), compared with the NIV group.
Results difficult to apply to North American patients
David L. Bowton, MD, FCCP, a professor specializing in critical care at Wake Forest University, Winston-Salem, N.C., said in an interview the results of this trial may not be applicable for patients with infection-related respiratory failure and COPD in North America “due to the differences in common weaning practices between North America and China.”
For example, the trial used the pulmonary infection control (PIC) window criteria for extubation, which requires a significant decrease in radiographic infiltrates, improvement in quality and quantity of sputum, normalizing of leukocyte count, a synchronized intermittent mandatory ventilation (SIMV) rate of 10-12 breaths per minute, and pressure support less than 10-12 cm/H2O (Int J Chron Obstruct Pulmon Dis. 2017;12:1255-67).
“The process used to achieve these measures is not standardized. In North America, daily awakening and screening for spontaneous breathing trials would be usual, but this was not reported in the current trial,” he explained.
Differences in patient population also make the application of the results difficult, Dr. Bowton said. “Only 60% of the patients had spirometrically confirmed COPD and fewer than half were on at least dual inhaled therapy prior to hospitalization with only one-third taking beta agonists or anticholinergic agents,” he noted. “The cause of respiratory failure was infectious, requiring an infiltrate on chest radiograph; thus, patients with hypercarbic respiratory failure without a new infiltrate were excluded from the study. On average, patients were hypercarbic, yet alkalemic at the time of extubation; the PaCO2 and pH at the time of intubation were not reported.
“This study suggests that in some patients with COPD and respiratory failure requiring invasive mechanical ventilation, HFO [high-flow oxygen] may be better tolerated and equally effective as NIPPV [noninvasive positive-pressure ventilation] at mitigating the need for reintubation following extubation. In this patient population where hypoxemia prior to extubation was not severe, the mechanisms by which HFO is beneficial remain speculative,” he said.
This study was funded by the Rui E special fund for emergency medicine research and the Yangzhou Science and Technology Development Plan. The authors report no relevant conflicts of interest. Dr. Bowton reports no relevant conflicts of interest.
SOURCE: Tan D et al. Crit Care. 2020 Aug 6. doi: 10.1186/s13054-020-03214-9.
FROM CRITICAL CARE
Diabetes plus weight loss equals increased risk of pancreatic cancer
A new study has linked recent-onset diabetes and subsequent weight loss to an increased risk of pancreatic cancer, indicating a distinct group of individuals to screen early for this deadly disease.
“The likelihood of a pancreatic cancer diagnosis was even further elevated among individuals with older age, healthy weight before weight loss, and unintentional weight loss,” wrote Chen Yuan, ScD, of the Dana-Farber Cancer Institute and Harvard Medical School, both in Boston. The study was published in JAMA Oncology.
To determine whether an association exists between diabetes plus weight change and pancreatic cancer, the researchers analyzed decades of medical history data from the Nurses’ Health Study (NHS) and the Health Professionals Follow-Up Study (HPFS). The study population from the NHS included 112,818 women with a mean age of 59 years; the population from the HPFS included 46,207 men with a mean age of 65 years. Since enrollment – the baseline was 1978 for the NHS and 1988 for the HPFS – participants have provided follow-up information via biennial questionnaires.
Recent diabetes onset, weight loss boost cancer risk
From those combined groups, 1,116 incident cases of pancreatic cancer (0.7%) were identified. Compared with patients with no diabetes, patients with recent-onset diabetes had triple the risk of pancreatic cancer (age-adjusted hazard ratio, 2.97; 95% confidence interval, 2.31-3.82) and patients with longstanding diabetes had more than double the risk (HR, 2.16; 95% CI, 1.78-2.60). Patients with longer disease duration also had more than twice the risk of pancreatic cancer, with HRs of 2.25 for those with diabetes for 4-10 years (95% CI, 1.74-2.92) and 2.07 for more than 10 years (95% CI, 1.61-2.66).
Compared with patients who hadn’t lost any weight, patients who reported a 1- to 4-pound weight loss (HR, 1.25; 95% CI, 1.03-1.52), a 5- to 8-pound weight loss (HR, 1.33; 95% CI, 1.06-1.66), and a more than 8-pound weight loss (HR, 1.92; 95% CI, 1.58-2.32) had higher risks of pancreatic cancer. Patients with recent-onset diabetes and a 1- to 8-pound weight loss (91 incident cases per 100,000 person-years; 95% CI, 55-151) or a weight loss of more than 8 pounds (164 incident cases per 100,000 person years; 95% CI, 114-238) had a much higher incidence of pancreatic cancer, compared with patients with neither (16 incident cases per 100,000 person-years; 95% CI, 14-17).
After stratified analyses of patients with both recent-onset diabetes and weight loss, rates of pancreatic cancer were also notably high in those 70 years or older (234 cases per 100,000 person years), those with a body mass index of less than 25 kg/m2 before weight loss (400 cases per 100,000 person years), and those with a low likelihood of intentional weight loss (334 cases per 100,000 person years).
“I like the study because it reminds us of the importance of not thinking everyone that presents with type 2 diabetes necessarily has garden-variety diabetes,” Paul Jellinger, MD, of the Center for Diabetes and Endocrine Care in Hollywood, Fla., said in an interview. “I have always been concerned when a new-onset diabetic individual presents with no family history of diabetes or prediabetes, especially if they’re neither overweight nor obese. I have sometimes screened those individuals for pancreatic abnormalities.”
A call for screening
“This study highlights the consideration for further screening to those with weight loss at the time of diabetes diagnosis, which is very sensible given how unusual weight loss is as a presenting symptom at the time of diagnosis of typical type 2 diabetes,” Dr. Jellinger added. “The combination of weight loss and no family history of diabetes at the time of diagnosis should be an even stronger signal for pancreatic cancer screening and potential detection at a much earlier stage.”
The authors acknowledged their study’s limitations, including some patients with pancreatic cancer not returning their questionnaires and the timing of the questionnaires meaning that patients could’ve developed diabetes after returning it. In addition, they recognized that the participants were “predominantly White health professionals” and recommended a study of “additional patient populations” in the future.
The authors noted numerous potential conflicts of interest, including receiving grants and personal fees from various initiatives, organizations, and pharmaceutical companies.
SOURCE: Yuan C et al. JAMA Oncol. 2020 Aug 13. doi: 10.1001/jamaoncol.2020.2948.
A new study has linked recent-onset diabetes and subsequent weight loss to an increased risk of pancreatic cancer, indicating a distinct group of individuals to screen early for this deadly disease.
“The likelihood of a pancreatic cancer diagnosis was even further elevated among individuals with older age, healthy weight before weight loss, and unintentional weight loss,” wrote Chen Yuan, ScD, of the Dana-Farber Cancer Institute and Harvard Medical School, both in Boston. The study was published in JAMA Oncology.
To determine whether an association exists between diabetes plus weight change and pancreatic cancer, the researchers analyzed decades of medical history data from the Nurses’ Health Study (NHS) and the Health Professionals Follow-Up Study (HPFS). The study population from the NHS included 112,818 women with a mean age of 59 years; the population from the HPFS included 46,207 men with a mean age of 65 years. Since enrollment – the baseline was 1978 for the NHS and 1988 for the HPFS – participants have provided follow-up information via biennial questionnaires.
Recent diabetes onset, weight loss boost cancer risk
From those combined groups, 1,116 incident cases of pancreatic cancer (0.7%) were identified. Compared with patients with no diabetes, patients with recent-onset diabetes had triple the risk of pancreatic cancer (age-adjusted hazard ratio, 2.97; 95% confidence interval, 2.31-3.82) and patients with longstanding diabetes had more than double the risk (HR, 2.16; 95% CI, 1.78-2.60). Patients with longer disease duration also had more than twice the risk of pancreatic cancer, with HRs of 2.25 for those with diabetes for 4-10 years (95% CI, 1.74-2.92) and 2.07 for more than 10 years (95% CI, 1.61-2.66).
Compared with patients who hadn’t lost any weight, patients who reported a 1- to 4-pound weight loss (HR, 1.25; 95% CI, 1.03-1.52), a 5- to 8-pound weight loss (HR, 1.33; 95% CI, 1.06-1.66), and a more than 8-pound weight loss (HR, 1.92; 95% CI, 1.58-2.32) had higher risks of pancreatic cancer. Patients with recent-onset diabetes and a 1- to 8-pound weight loss (91 incident cases per 100,000 person-years; 95% CI, 55-151) or a weight loss of more than 8 pounds (164 incident cases per 100,000 person years; 95% CI, 114-238) had a much higher incidence of pancreatic cancer, compared with patients with neither (16 incident cases per 100,000 person-years; 95% CI, 14-17).
After stratified analyses of patients with both recent-onset diabetes and weight loss, rates of pancreatic cancer were also notably high in those 70 years or older (234 cases per 100,000 person years), those with a body mass index of less than 25 kg/m2 before weight loss (400 cases per 100,000 person years), and those with a low likelihood of intentional weight loss (334 cases per 100,000 person years).
“I like the study because it reminds us of the importance of not thinking everyone that presents with type 2 diabetes necessarily has garden-variety diabetes,” Paul Jellinger, MD, of the Center for Diabetes and Endocrine Care in Hollywood, Fla., said in an interview. “I have always been concerned when a new-onset diabetic individual presents with no family history of diabetes or prediabetes, especially if they’re neither overweight nor obese. I have sometimes screened those individuals for pancreatic abnormalities.”
A call for screening
“This study highlights the consideration for further screening to those with weight loss at the time of diabetes diagnosis, which is very sensible given how unusual weight loss is as a presenting symptom at the time of diagnosis of typical type 2 diabetes,” Dr. Jellinger added. “The combination of weight loss and no family history of diabetes at the time of diagnosis should be an even stronger signal for pancreatic cancer screening and potential detection at a much earlier stage.”
The authors acknowledged their study’s limitations, including some patients with pancreatic cancer not returning their questionnaires and the timing of the questionnaires meaning that patients could’ve developed diabetes after returning it. In addition, they recognized that the participants were “predominantly White health professionals” and recommended a study of “additional patient populations” in the future.
The authors noted numerous potential conflicts of interest, including receiving grants and personal fees from various initiatives, organizations, and pharmaceutical companies.
SOURCE: Yuan C et al. JAMA Oncol. 2020 Aug 13. doi: 10.1001/jamaoncol.2020.2948.
A new study has linked recent-onset diabetes and subsequent weight loss to an increased risk of pancreatic cancer, indicating a distinct group of individuals to screen early for this deadly disease.
“The likelihood of a pancreatic cancer diagnosis was even further elevated among individuals with older age, healthy weight before weight loss, and unintentional weight loss,” wrote Chen Yuan, ScD, of the Dana-Farber Cancer Institute and Harvard Medical School, both in Boston. The study was published in JAMA Oncology.
To determine whether an association exists between diabetes plus weight change and pancreatic cancer, the researchers analyzed decades of medical history data from the Nurses’ Health Study (NHS) and the Health Professionals Follow-Up Study (HPFS). The study population from the NHS included 112,818 women with a mean age of 59 years; the population from the HPFS included 46,207 men with a mean age of 65 years. Since enrollment – the baseline was 1978 for the NHS and 1988 for the HPFS – participants have provided follow-up information via biennial questionnaires.
Recent diabetes onset, weight loss boost cancer risk
From those combined groups, 1,116 incident cases of pancreatic cancer (0.7%) were identified. Compared with patients with no diabetes, patients with recent-onset diabetes had triple the risk of pancreatic cancer (age-adjusted hazard ratio, 2.97; 95% confidence interval, 2.31-3.82) and patients with longstanding diabetes had more than double the risk (HR, 2.16; 95% CI, 1.78-2.60). Patients with longer disease duration also had more than twice the risk of pancreatic cancer, with HRs of 2.25 for those with diabetes for 4-10 years (95% CI, 1.74-2.92) and 2.07 for more than 10 years (95% CI, 1.61-2.66).
Compared with patients who hadn’t lost any weight, patients who reported a 1- to 4-pound weight loss (HR, 1.25; 95% CI, 1.03-1.52), a 5- to 8-pound weight loss (HR, 1.33; 95% CI, 1.06-1.66), and a more than 8-pound weight loss (HR, 1.92; 95% CI, 1.58-2.32) had higher risks of pancreatic cancer. Patients with recent-onset diabetes and a 1- to 8-pound weight loss (91 incident cases per 100,000 person-years; 95% CI, 55-151) or a weight loss of more than 8 pounds (164 incident cases per 100,000 person years; 95% CI, 114-238) had a much higher incidence of pancreatic cancer, compared with patients with neither (16 incident cases per 100,000 person-years; 95% CI, 14-17).
After stratified analyses of patients with both recent-onset diabetes and weight loss, rates of pancreatic cancer were also notably high in those 70 years or older (234 cases per 100,000 person years), those with a body mass index of less than 25 kg/m2 before weight loss (400 cases per 100,000 person years), and those with a low likelihood of intentional weight loss (334 cases per 100,000 person years).
“I like the study because it reminds us of the importance of not thinking everyone that presents with type 2 diabetes necessarily has garden-variety diabetes,” Paul Jellinger, MD, of the Center for Diabetes and Endocrine Care in Hollywood, Fla., said in an interview. “I have always been concerned when a new-onset diabetic individual presents with no family history of diabetes or prediabetes, especially if they’re neither overweight nor obese. I have sometimes screened those individuals for pancreatic abnormalities.”
A call for screening
“This study highlights the consideration for further screening to those with weight loss at the time of diabetes diagnosis, which is very sensible given how unusual weight loss is as a presenting symptom at the time of diagnosis of typical type 2 diabetes,” Dr. Jellinger added. “The combination of weight loss and no family history of diabetes at the time of diagnosis should be an even stronger signal for pancreatic cancer screening and potential detection at a much earlier stage.”
The authors acknowledged their study’s limitations, including some patients with pancreatic cancer not returning their questionnaires and the timing of the questionnaires meaning that patients could’ve developed diabetes after returning it. In addition, they recognized that the participants were “predominantly White health professionals” and recommended a study of “additional patient populations” in the future.
The authors noted numerous potential conflicts of interest, including receiving grants and personal fees from various initiatives, organizations, and pharmaceutical companies.
SOURCE: Yuan C et al. JAMA Oncol. 2020 Aug 13. doi: 10.1001/jamaoncol.2020.2948.
FROM JAMA ONCOLOGY
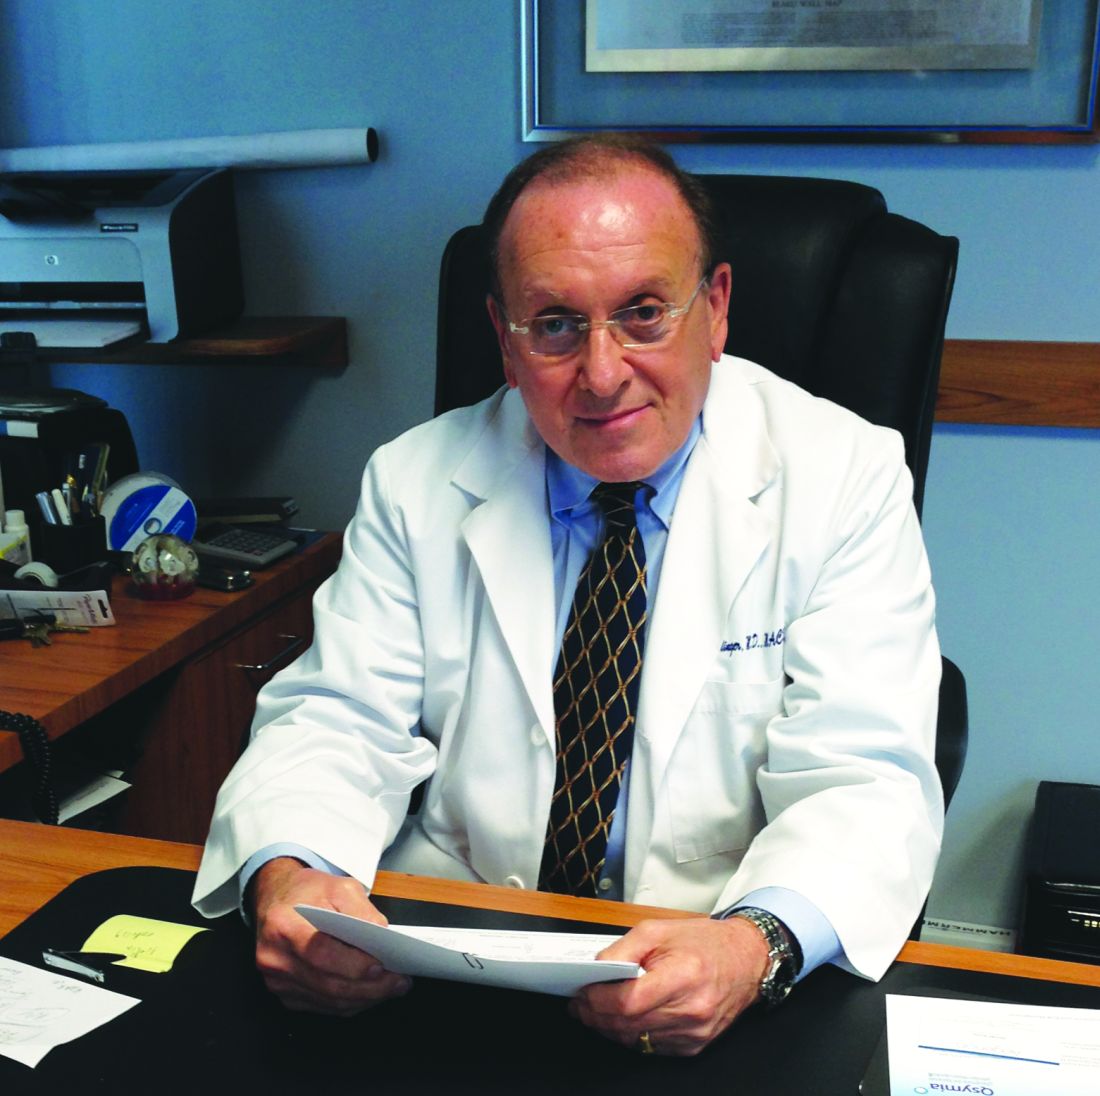
Obesity negatively affects axial spondyloarthritis disease activity
Obesity in adults with axial spondyloarthritis is associated with significantly worse scores on measures of disease activity when compared with normal-weight patients, according to findings from a meta-analysis of 10 studies.
Obesity or overweight could influence axial spondyloarthritis (axSpA) disease activity in several ways, including production of inflammatory mediators by adipose tissue, joint pain caused by excess weight, loss of muscle mass, and increased atherosclerosis, wrote Augusta Ortolan, MD, of the University of Padova (Italy), and colleagues.
However, “it is less clear whether overweight or obesity per se may be a cause of higher disease activity scores,” they added.
In a systematic review published in Arthritis Care & Research, the investigators identified 10 studies to use in the meta-analysis that involved associations between body mass index (BMI) and disease activity in adults with axSpA. The review included three cohort studies and seven cross-sectional studies of patients aged 18 years and older. Disease activity was assessed using the Bath Ankylosing Spondylitis Disease Activity Index (BASDAI) and the Ankylosing Spondylitis Disease Activity Score (ASDAS).
Overall, the mean difference in BASDAI between patients with normal BMI and overweight or obese patients was –0.38 (P < .0001), and the mean difference in ASDAS between the same groups was –0.19 (P < .0001). When separated into overweight and obese categories, only the difference between normal weight and obesity remained significantly associated with differences in scores on both measures (–0.78 and –0.42, respectively; P < .0001 for both measures). The difference in scores between normal-weight and overweight/obese patients increased with BMI categories, which suggests a possible “dose-effect” relationship between fat mass and disease activity, the researchers wrote.
The study findings were limited by several factors, including the lack of randomized, controlled trials, and potential bias and inconsistency involving BMI measurements, the researchers noted.
However, “we were able to mitigate such limitations via a strict methodology and consistency in the outcomes, thus allowing us to use mean differences – instead of standardized mean differences – as outcomes, which are much easier to interpret and can be directly related to the measurement unit of the outcome,” they wrote.
The results extend data from previous studies, which “could help interpret disease activity measures and understand the difference we could expect between an axSpA patient with normal BMI and increased BMI,” they concluded.
The study received no outside funding. The researchers had no financial conflicts to disclose.
SOURCE: Ortolan A et al. Arthritis Care Res. 2020 Aug 16. doi: 10.1002/acr.24416.
Obesity in adults with axial spondyloarthritis is associated with significantly worse scores on measures of disease activity when compared with normal-weight patients, according to findings from a meta-analysis of 10 studies.
Obesity or overweight could influence axial spondyloarthritis (axSpA) disease activity in several ways, including production of inflammatory mediators by adipose tissue, joint pain caused by excess weight, loss of muscle mass, and increased atherosclerosis, wrote Augusta Ortolan, MD, of the University of Padova (Italy), and colleagues.
However, “it is less clear whether overweight or obesity per se may be a cause of higher disease activity scores,” they added.
In a systematic review published in Arthritis Care & Research, the investigators identified 10 studies to use in the meta-analysis that involved associations between body mass index (BMI) and disease activity in adults with axSpA. The review included three cohort studies and seven cross-sectional studies of patients aged 18 years and older. Disease activity was assessed using the Bath Ankylosing Spondylitis Disease Activity Index (BASDAI) and the Ankylosing Spondylitis Disease Activity Score (ASDAS).
Overall, the mean difference in BASDAI between patients with normal BMI and overweight or obese patients was –0.38 (P < .0001), and the mean difference in ASDAS between the same groups was –0.19 (P < .0001). When separated into overweight and obese categories, only the difference between normal weight and obesity remained significantly associated with differences in scores on both measures (–0.78 and –0.42, respectively; P < .0001 for both measures). The difference in scores between normal-weight and overweight/obese patients increased with BMI categories, which suggests a possible “dose-effect” relationship between fat mass and disease activity, the researchers wrote.
The study findings were limited by several factors, including the lack of randomized, controlled trials, and potential bias and inconsistency involving BMI measurements, the researchers noted.
However, “we were able to mitigate such limitations via a strict methodology and consistency in the outcomes, thus allowing us to use mean differences – instead of standardized mean differences – as outcomes, which are much easier to interpret and can be directly related to the measurement unit of the outcome,” they wrote.
The results extend data from previous studies, which “could help interpret disease activity measures and understand the difference we could expect between an axSpA patient with normal BMI and increased BMI,” they concluded.
The study received no outside funding. The researchers had no financial conflicts to disclose.
SOURCE: Ortolan A et al. Arthritis Care Res. 2020 Aug 16. doi: 10.1002/acr.24416.
Obesity in adults with axial spondyloarthritis is associated with significantly worse scores on measures of disease activity when compared with normal-weight patients, according to findings from a meta-analysis of 10 studies.
Obesity or overweight could influence axial spondyloarthritis (axSpA) disease activity in several ways, including production of inflammatory mediators by adipose tissue, joint pain caused by excess weight, loss of muscle mass, and increased atherosclerosis, wrote Augusta Ortolan, MD, of the University of Padova (Italy), and colleagues.
However, “it is less clear whether overweight or obesity per se may be a cause of higher disease activity scores,” they added.
In a systematic review published in Arthritis Care & Research, the investigators identified 10 studies to use in the meta-analysis that involved associations between body mass index (BMI) and disease activity in adults with axSpA. The review included three cohort studies and seven cross-sectional studies of patients aged 18 years and older. Disease activity was assessed using the Bath Ankylosing Spondylitis Disease Activity Index (BASDAI) and the Ankylosing Spondylitis Disease Activity Score (ASDAS).
Overall, the mean difference in BASDAI between patients with normal BMI and overweight or obese patients was –0.38 (P < .0001), and the mean difference in ASDAS between the same groups was –0.19 (P < .0001). When separated into overweight and obese categories, only the difference between normal weight and obesity remained significantly associated with differences in scores on both measures (–0.78 and –0.42, respectively; P < .0001 for both measures). The difference in scores between normal-weight and overweight/obese patients increased with BMI categories, which suggests a possible “dose-effect” relationship between fat mass and disease activity, the researchers wrote.
The study findings were limited by several factors, including the lack of randomized, controlled trials, and potential bias and inconsistency involving BMI measurements, the researchers noted.
However, “we were able to mitigate such limitations via a strict methodology and consistency in the outcomes, thus allowing us to use mean differences – instead of standardized mean differences – as outcomes, which are much easier to interpret and can be directly related to the measurement unit of the outcome,” they wrote.
The results extend data from previous studies, which “could help interpret disease activity measures and understand the difference we could expect between an axSpA patient with normal BMI and increased BMI,” they concluded.
The study received no outside funding. The researchers had no financial conflicts to disclose.
SOURCE: Ortolan A et al. Arthritis Care Res. 2020 Aug 16. doi: 10.1002/acr.24416.
FROM ARTHRITIS CARE & RESEARCH
Evidence mounts for COVID-19 effects on thyroid gland
Rates of thyrotoxicosis are significantly higher among patients who are critically ill with COVID-19 than among patients who are critically ill but who do not not have COVID-19, suggesting an atypical form of thyroiditis related to the novel coronavirus infection, according to new research.
“We suggest routine assessment of thyroid function in patients with COVID-19 requiring high-intensity care because they frequently present with thyrotoxicosis due to a form of subacute thyroiditis related to SARS-CoV-2,” the authors wrote in correspondence published online in The Lancet Diabetes and Endocrinology.
However, notably, the study – which compared critically ill ICU patients who had COVID-19 with those who did not have COVID-19 or who had milder cases of COVID-19 – indicates that thyroid disorders do not appear to increase the risk of developing COVID-19, first author Ilaria Muller, MD, PhD, of the department of endocrinology, IRCCS Fondazione Ca’ Granda Ospedale Maggiore Policlinico, Milan, said in an interview.
“It is important to highlight that we did not find an increased prevalence of preexisting thyroid disorders in COVID-19 patients (contrary to early media reports),” she said. “So far, clinical observations do not support this fear, and we need to reassure people with thyroid disorders, since such disorders are very common among the general population.”
Yet the findings add to emerging evidence of a COVID-19/thyroid relationship, Angela M. Leung, MD, said in an interview.
“Given the health care impacts of the current COVID-19 pandemic worldwide, this study provides some insight on the potential systemic inflammation, as well as thyroid-specific inflammation, of the SARS-Cov-2 virus that is described in some emerging reports,” she said.
“This study joins at least six others that have reported a clinical presentation resembling subacute thyroiditis in critically ill patients with COVID-19,” noted Dr. Leung, of the division of endocrinology, diabetes, and metabolism in the department of medicine at the University of California, Los Angeles.
Thyroid function analysis in those with severe COVID-19
Dr. Muller explained that preliminary data from her institution showed thyroid abnormalities in patients who were severely ill with COVID-19. She and her team extended the evaluation to include thyroid data and other data on 93 patients with COVID-19 who were admitted to high-intensity care units (HICUs) in Italy during the 2020 pandemic.
Those data were compared with data on 101 critically ill patients admitted to the same HICUs in 2019 who did not have COVID-19. A third group of 52 patients with COVID-19 who were admitted to low-intensity care units (LICUs) in Italy in 2020 were also included in the analysis.
The mean age of the patients in the HICU 2020 group was 65.3 years; in the HICU 2019 group, it was 73 years; and in the LICU group, it was 70 years (P = .001). In addition, the HICU 2020 group included more men than the other two groups (69% vs. 56% and 48%; P = .03).
Of note, only 9% of patients in the HICU 2020 group had preexisting thyroid disorders, compared with 21% in the LICU group and 23% in the HICU 2019 group (P = .017).
These findings suggest that “such conditions are not a risk factor for SARS-CoV-2 infection or severity of COVID-19,” the authors wrote.
The patients with the preexisting thyroid conditions were excluded from the thyroid function analysis.
A significantly higher proportion of patients in the HICU 2020 group (13; 15%) were thyrotoxic upon admission, compared with just 1 (1%) of 78 patients in the HICU 2019 group (P = .002) and one (2%) of 41 patients in the LICU group (P = .025).
Among the 14 patients in the two COVID-19 groups who had thyrotoxicosis, the majority were male (9; 64%)
Among those in the HICU 2020 group, serum thyroid-stimulating hormone concentrations were lower than in either of the other two groups (P = .018), and serum free thyroxine (free T4) concentrations were higher than in the LICU group (P = .016) but not the HICU 2019 group.
Differences compared with other infection-related thyroiditis
Although thyrotoxicosis relating to subacute viral thyroiditis can result from a wide variety of viral infections, there are some key differences with COVID-19, Dr. Muller said.
“Thyroid dysfunction related to SARS-CoV-2 seems to be milder than that of classic subacute thyroiditis due to other viruses,” she explained. Furthermore, thyroid dysfunction associated with other viral infections is more common in women, whereas there were more male patients with the COVID-19–related atypical thyroiditis.
In addition, the thyroid effects developed early with COVID-19, whereas they usually emerge after the infections by other viruses.
Patients did not demonstrate the neck pain that is common with classic viral thyroiditis, and the thyroid abnormalities appear to correlate with the severity of COVID-19, whereas they are seen even in patients with mild symptoms when other viral infections are the cause.
In addition to the risk for subacute viral thyroiditis, critically ill patients in general are at risk of developing nonthyroidal illness syndrome, with alterations in thyroid function. However, thyroid hormone measures in the patients severely ill with COVID-19 were not consistent with that syndrome.
A subanalysis of eight HICU 2020 patients with thyroid dysfunction who were followed for 55 days after discharge showed that two experienced hyperthyroidism but likely not from COVID-19; in the remaining six, thyroid function normalized.
Muller speculated that, when ill with COVID-19, the patients likely had a combination of SARS-CoV-2–related atypical thyroiditis and nonthyroidal illness syndrome, known as T4 toxicosis.
Will there be any long-term effects?
Importantly, it remains unknown whether the novel coronavirus has longer-term effects on the thyroid, Dr. Muller said.
“We cannot predict what will be the long-lasting thyroid effects after COVID-19,” she said.
With classic subacute viral thyroiditis, “After a few years ... 5%-20% of patients develop permanent hypothyroidism, [and] the same might happen in COVID-19 patients,” she hypothesized. “We will follow our patients long term to answer this question – this study is already ongoing.”
In the meantime, diagnosis of thyroid dysfunction in patients with COVID-19 is important, inasmuch as it could worsen the already critical conditions of patients, Muller stressed.
“The gold-standard treatment for thyroiditis is steroids, so the presence of thyroid dysfunction might represent an additional indication to such treatment in COVID-19 patients, to be verified in properly designed clinical trials,” she advised.
ACE2 cell receptors highly expressed in thyroid
Dr. Muller and colleagues also noted recent research showing that ACE2 – demonstrated to be a key host-cell entry receptor for both SARS-CoV and SARS-CoV-2 – is expressed in even higher levels in the thyroid than the lungs, where it causes COVID-19’s notorious pulmonary effects.
Dr. Muller said the implications of ACE2 expression in the thyroid remain to be elucidated.
“If ACE2 is confirmed to be expressed at higher levels, compared with the lungs in the thyroid gland and other tissues, i.e., small intestine, testis, kidney, heart, etc, dedicated studies will be needed to correlate ACE2 expression with the organs’ susceptibility to SARS-CoV-2 reflected by clinical presentation,” she said.
Dr. Leung added that, as a take-home message from these and the other thyroid/COVID-19 studies, “data are starting to show us that COVID-19 infection may cause thyrotoxicosis that is possibly related to thyroid and systemic inflammation. However, the serum thyroid function test abnormalities seen in COVID-19 patients with subacute thyroiditis are also likely exacerbated to a substantial extent by nonthyroidal illness physiology.”
The authors have disclosed no relevant financial relationships. Dr. Leung is on the advisory board of Medscape Diabetes and Endocrinology.
A version of this article originally appeared on Medscape.com.
Rates of thyrotoxicosis are significantly higher among patients who are critically ill with COVID-19 than among patients who are critically ill but who do not not have COVID-19, suggesting an atypical form of thyroiditis related to the novel coronavirus infection, according to new research.
“We suggest routine assessment of thyroid function in patients with COVID-19 requiring high-intensity care because they frequently present with thyrotoxicosis due to a form of subacute thyroiditis related to SARS-CoV-2,” the authors wrote in correspondence published online in The Lancet Diabetes and Endocrinology.
However, notably, the study – which compared critically ill ICU patients who had COVID-19 with those who did not have COVID-19 or who had milder cases of COVID-19 – indicates that thyroid disorders do not appear to increase the risk of developing COVID-19, first author Ilaria Muller, MD, PhD, of the department of endocrinology, IRCCS Fondazione Ca’ Granda Ospedale Maggiore Policlinico, Milan, said in an interview.
“It is important to highlight that we did not find an increased prevalence of preexisting thyroid disorders in COVID-19 patients (contrary to early media reports),” she said. “So far, clinical observations do not support this fear, and we need to reassure people with thyroid disorders, since such disorders are very common among the general population.”
Yet the findings add to emerging evidence of a COVID-19/thyroid relationship, Angela M. Leung, MD, said in an interview.
“Given the health care impacts of the current COVID-19 pandemic worldwide, this study provides some insight on the potential systemic inflammation, as well as thyroid-specific inflammation, of the SARS-Cov-2 virus that is described in some emerging reports,” she said.
“This study joins at least six others that have reported a clinical presentation resembling subacute thyroiditis in critically ill patients with COVID-19,” noted Dr. Leung, of the division of endocrinology, diabetes, and metabolism in the department of medicine at the University of California, Los Angeles.
Thyroid function analysis in those with severe COVID-19
Dr. Muller explained that preliminary data from her institution showed thyroid abnormalities in patients who were severely ill with COVID-19. She and her team extended the evaluation to include thyroid data and other data on 93 patients with COVID-19 who were admitted to high-intensity care units (HICUs) in Italy during the 2020 pandemic.
Those data were compared with data on 101 critically ill patients admitted to the same HICUs in 2019 who did not have COVID-19. A third group of 52 patients with COVID-19 who were admitted to low-intensity care units (LICUs) in Italy in 2020 were also included in the analysis.
The mean age of the patients in the HICU 2020 group was 65.3 years; in the HICU 2019 group, it was 73 years; and in the LICU group, it was 70 years (P = .001). In addition, the HICU 2020 group included more men than the other two groups (69% vs. 56% and 48%; P = .03).
Of note, only 9% of patients in the HICU 2020 group had preexisting thyroid disorders, compared with 21% in the LICU group and 23% in the HICU 2019 group (P = .017).
These findings suggest that “such conditions are not a risk factor for SARS-CoV-2 infection or severity of COVID-19,” the authors wrote.
The patients with the preexisting thyroid conditions were excluded from the thyroid function analysis.
A significantly higher proportion of patients in the HICU 2020 group (13; 15%) were thyrotoxic upon admission, compared with just 1 (1%) of 78 patients in the HICU 2019 group (P = .002) and one (2%) of 41 patients in the LICU group (P = .025).
Among the 14 patients in the two COVID-19 groups who had thyrotoxicosis, the majority were male (9; 64%)
Among those in the HICU 2020 group, serum thyroid-stimulating hormone concentrations were lower than in either of the other two groups (P = .018), and serum free thyroxine (free T4) concentrations were higher than in the LICU group (P = .016) but not the HICU 2019 group.
Differences compared with other infection-related thyroiditis
Although thyrotoxicosis relating to subacute viral thyroiditis can result from a wide variety of viral infections, there are some key differences with COVID-19, Dr. Muller said.
“Thyroid dysfunction related to SARS-CoV-2 seems to be milder than that of classic subacute thyroiditis due to other viruses,” she explained. Furthermore, thyroid dysfunction associated with other viral infections is more common in women, whereas there were more male patients with the COVID-19–related atypical thyroiditis.
In addition, the thyroid effects developed early with COVID-19, whereas they usually emerge after the infections by other viruses.
Patients did not demonstrate the neck pain that is common with classic viral thyroiditis, and the thyroid abnormalities appear to correlate with the severity of COVID-19, whereas they are seen even in patients with mild symptoms when other viral infections are the cause.
In addition to the risk for subacute viral thyroiditis, critically ill patients in general are at risk of developing nonthyroidal illness syndrome, with alterations in thyroid function. However, thyroid hormone measures in the patients severely ill with COVID-19 were not consistent with that syndrome.
A subanalysis of eight HICU 2020 patients with thyroid dysfunction who were followed for 55 days after discharge showed that two experienced hyperthyroidism but likely not from COVID-19; in the remaining six, thyroid function normalized.
Muller speculated that, when ill with COVID-19, the patients likely had a combination of SARS-CoV-2–related atypical thyroiditis and nonthyroidal illness syndrome, known as T4 toxicosis.
Will there be any long-term effects?
Importantly, it remains unknown whether the novel coronavirus has longer-term effects on the thyroid, Dr. Muller said.
“We cannot predict what will be the long-lasting thyroid effects after COVID-19,” she said.
With classic subacute viral thyroiditis, “After a few years ... 5%-20% of patients develop permanent hypothyroidism, [and] the same might happen in COVID-19 patients,” she hypothesized. “We will follow our patients long term to answer this question – this study is already ongoing.”
In the meantime, diagnosis of thyroid dysfunction in patients with COVID-19 is important, inasmuch as it could worsen the already critical conditions of patients, Muller stressed.
“The gold-standard treatment for thyroiditis is steroids, so the presence of thyroid dysfunction might represent an additional indication to such treatment in COVID-19 patients, to be verified in properly designed clinical trials,” she advised.
ACE2 cell receptors highly expressed in thyroid
Dr. Muller and colleagues also noted recent research showing that ACE2 – demonstrated to be a key host-cell entry receptor for both SARS-CoV and SARS-CoV-2 – is expressed in even higher levels in the thyroid than the lungs, where it causes COVID-19’s notorious pulmonary effects.
Dr. Muller said the implications of ACE2 expression in the thyroid remain to be elucidated.
“If ACE2 is confirmed to be expressed at higher levels, compared with the lungs in the thyroid gland and other tissues, i.e., small intestine, testis, kidney, heart, etc, dedicated studies will be needed to correlate ACE2 expression with the organs’ susceptibility to SARS-CoV-2 reflected by clinical presentation,” she said.
Dr. Leung added that, as a take-home message from these and the other thyroid/COVID-19 studies, “data are starting to show us that COVID-19 infection may cause thyrotoxicosis that is possibly related to thyroid and systemic inflammation. However, the serum thyroid function test abnormalities seen in COVID-19 patients with subacute thyroiditis are also likely exacerbated to a substantial extent by nonthyroidal illness physiology.”
The authors have disclosed no relevant financial relationships. Dr. Leung is on the advisory board of Medscape Diabetes and Endocrinology.
A version of this article originally appeared on Medscape.com.
Rates of thyrotoxicosis are significantly higher among patients who are critically ill with COVID-19 than among patients who are critically ill but who do not not have COVID-19, suggesting an atypical form of thyroiditis related to the novel coronavirus infection, according to new research.
“We suggest routine assessment of thyroid function in patients with COVID-19 requiring high-intensity care because they frequently present with thyrotoxicosis due to a form of subacute thyroiditis related to SARS-CoV-2,” the authors wrote in correspondence published online in The Lancet Diabetes and Endocrinology.
However, notably, the study – which compared critically ill ICU patients who had COVID-19 with those who did not have COVID-19 or who had milder cases of COVID-19 – indicates that thyroid disorders do not appear to increase the risk of developing COVID-19, first author Ilaria Muller, MD, PhD, of the department of endocrinology, IRCCS Fondazione Ca’ Granda Ospedale Maggiore Policlinico, Milan, said in an interview.
“It is important to highlight that we did not find an increased prevalence of preexisting thyroid disorders in COVID-19 patients (contrary to early media reports),” she said. “So far, clinical observations do not support this fear, and we need to reassure people with thyroid disorders, since such disorders are very common among the general population.”
Yet the findings add to emerging evidence of a COVID-19/thyroid relationship, Angela M. Leung, MD, said in an interview.
“Given the health care impacts of the current COVID-19 pandemic worldwide, this study provides some insight on the potential systemic inflammation, as well as thyroid-specific inflammation, of the SARS-Cov-2 virus that is described in some emerging reports,” she said.
“This study joins at least six others that have reported a clinical presentation resembling subacute thyroiditis in critically ill patients with COVID-19,” noted Dr. Leung, of the division of endocrinology, diabetes, and metabolism in the department of medicine at the University of California, Los Angeles.
Thyroid function analysis in those with severe COVID-19
Dr. Muller explained that preliminary data from her institution showed thyroid abnormalities in patients who were severely ill with COVID-19. She and her team extended the evaluation to include thyroid data and other data on 93 patients with COVID-19 who were admitted to high-intensity care units (HICUs) in Italy during the 2020 pandemic.
Those data were compared with data on 101 critically ill patients admitted to the same HICUs in 2019 who did not have COVID-19. A third group of 52 patients with COVID-19 who were admitted to low-intensity care units (LICUs) in Italy in 2020 were also included in the analysis.
The mean age of the patients in the HICU 2020 group was 65.3 years; in the HICU 2019 group, it was 73 years; and in the LICU group, it was 70 years (P = .001). In addition, the HICU 2020 group included more men than the other two groups (69% vs. 56% and 48%; P = .03).
Of note, only 9% of patients in the HICU 2020 group had preexisting thyroid disorders, compared with 21% in the LICU group and 23% in the HICU 2019 group (P = .017).
These findings suggest that “such conditions are not a risk factor for SARS-CoV-2 infection or severity of COVID-19,” the authors wrote.
The patients with the preexisting thyroid conditions were excluded from the thyroid function analysis.
A significantly higher proportion of patients in the HICU 2020 group (13; 15%) were thyrotoxic upon admission, compared with just 1 (1%) of 78 patients in the HICU 2019 group (P = .002) and one (2%) of 41 patients in the LICU group (P = .025).
Among the 14 patients in the two COVID-19 groups who had thyrotoxicosis, the majority were male (9; 64%)
Among those in the HICU 2020 group, serum thyroid-stimulating hormone concentrations were lower than in either of the other two groups (P = .018), and serum free thyroxine (free T4) concentrations were higher than in the LICU group (P = .016) but not the HICU 2019 group.
Differences compared with other infection-related thyroiditis
Although thyrotoxicosis relating to subacute viral thyroiditis can result from a wide variety of viral infections, there are some key differences with COVID-19, Dr. Muller said.
“Thyroid dysfunction related to SARS-CoV-2 seems to be milder than that of classic subacute thyroiditis due to other viruses,” she explained. Furthermore, thyroid dysfunction associated with other viral infections is more common in women, whereas there were more male patients with the COVID-19–related atypical thyroiditis.
In addition, the thyroid effects developed early with COVID-19, whereas they usually emerge after the infections by other viruses.
Patients did not demonstrate the neck pain that is common with classic viral thyroiditis, and the thyroid abnormalities appear to correlate with the severity of COVID-19, whereas they are seen even in patients with mild symptoms when other viral infections are the cause.
In addition to the risk for subacute viral thyroiditis, critically ill patients in general are at risk of developing nonthyroidal illness syndrome, with alterations in thyroid function. However, thyroid hormone measures in the patients severely ill with COVID-19 were not consistent with that syndrome.
A subanalysis of eight HICU 2020 patients with thyroid dysfunction who were followed for 55 days after discharge showed that two experienced hyperthyroidism but likely not from COVID-19; in the remaining six, thyroid function normalized.
Muller speculated that, when ill with COVID-19, the patients likely had a combination of SARS-CoV-2–related atypical thyroiditis and nonthyroidal illness syndrome, known as T4 toxicosis.
Will there be any long-term effects?
Importantly, it remains unknown whether the novel coronavirus has longer-term effects on the thyroid, Dr. Muller said.
“We cannot predict what will be the long-lasting thyroid effects after COVID-19,” she said.
With classic subacute viral thyroiditis, “After a few years ... 5%-20% of patients develop permanent hypothyroidism, [and] the same might happen in COVID-19 patients,” she hypothesized. “We will follow our patients long term to answer this question – this study is already ongoing.”
In the meantime, diagnosis of thyroid dysfunction in patients with COVID-19 is important, inasmuch as it could worsen the already critical conditions of patients, Muller stressed.
“The gold-standard treatment for thyroiditis is steroids, so the presence of thyroid dysfunction might represent an additional indication to such treatment in COVID-19 patients, to be verified in properly designed clinical trials,” she advised.
ACE2 cell receptors highly expressed in thyroid
Dr. Muller and colleagues also noted recent research showing that ACE2 – demonstrated to be a key host-cell entry receptor for both SARS-CoV and SARS-CoV-2 – is expressed in even higher levels in the thyroid than the lungs, where it causes COVID-19’s notorious pulmonary effects.
Dr. Muller said the implications of ACE2 expression in the thyroid remain to be elucidated.
“If ACE2 is confirmed to be expressed at higher levels, compared with the lungs in the thyroid gland and other tissues, i.e., small intestine, testis, kidney, heart, etc, dedicated studies will be needed to correlate ACE2 expression with the organs’ susceptibility to SARS-CoV-2 reflected by clinical presentation,” she said.
Dr. Leung added that, as a take-home message from these and the other thyroid/COVID-19 studies, “data are starting to show us that COVID-19 infection may cause thyrotoxicosis that is possibly related to thyroid and systemic inflammation. However, the serum thyroid function test abnormalities seen in COVID-19 patients with subacute thyroiditis are also likely exacerbated to a substantial extent by nonthyroidal illness physiology.”
The authors have disclosed no relevant financial relationships. Dr. Leung is on the advisory board of Medscape Diabetes and Endocrinology.
A version of this article originally appeared on Medscape.com.
Non-COVID-19 clinical trials grind to a halt during pandemic
The COVID-19 pandemic has created unique and unprecedented challenges for the clinical research world, with potentially long-lasting consequences.
A new analysis of the extent of disruption shows that the average rate of stopped trials nearly doubled during the first 5 months of 2020, compared with the 2 previous years.
“Typically, clinical research precedes clinical practice by several years, so this disruption we’re seeing now will be felt for many years to come,” said Mario Guadino, MD, of Weill Cornell Medicine, New York.
The analysis was published online July 31 in the Journal of the American College of Cardiology.
The researchers used Python software to query meta-data from all trials reported on ClinicalTrials.gov. Of 321,218 non-COVID-19 trials queried, 28,672 (8.9%) were reported as stopped, defined as a switch in trial status from “recruiting” to “active and not recruiting,” “completed,” “suspended,” “terminated,” or “withdrawn.”
The average rate of discontinuation was 638 trials/month from January 2017 to December 2019, rising to 1,147 trials/month between January 2020 and May 2020 (P < .001 for trend).
Once stopped (as opposed to paused), restarting a trial is a tricky prospect, said Dr. Guadino. “You can’t stop and restart a trial because it creates a lot of issues, so we should expect many of these stopped trials to never be completed.”
He said these figures likely represent an underestimate of the true impact of the pandemic because there is typically a delay in the updating of the status of a trial on ClinicalTrials.gov.
“We are likely looking only at the tip of the iceberg,” he added. “My impression is that the number of trials that will be affected and even canceled will be very high.”
As for cardiology trials, one of the report’s authors, Deepak Bhatt, MD, Brigham and Women’s Hospital, Boston, without naming specific trials, had this to say: “Several cardiovascular trials were paused, and some were permanently discontinued. It may be a while before we fully appreciate just how much information was lost and how much might be salvaged.”
He’s not worried, however, that upcoming cardiology meetings, which have moved online for the foreseeable future, might get a bit boring. “Fortunately, there is enough good work going on in the cardiovascular and cardiometabolic space that I believe there will still be ample randomized and observational data of high quality to present at the major meetings,” Dr. Bhatt said in an email.
The researchers found a weak correlation between the national population-adjusted numbers of COVID-19 cases and the proportion of non-COVID-19 trials stopped by country.
Even for trials that stopped recruiting for a period of time but are continuing, there are myriad issues involving compliance, data integrity, statistical interpretability, etc.
“Even if there is just a temporary disruption, that will most likely lead to reduced enrollment, missing follow-up visits, and protocol deviations, all things that would be red flags during normal times and impact the quality of the clinical trial,” said Dr. Guadino.
“And if your outcome of interest is mortality, well, how exactly do you measure that during a pandemic?” he added.
Stopped for lack of funding
Besides the logistical issues, another reason trials may be in jeopardy is funding. A warning early in the pandemic from the research community in Canada that funding was quickly drying up, leaving both jobs and data at risk, led to an aid package from the government to keep the lights on.
The National Institutes of Health (NIH), the Canadian Institutes of Health Research, and similar groups “have devoted large sums of money to research in COVID, which is of course very appropriate, but that clearly reduces the amount of funding that is available for other researchers,” said Dr. Guadino.
Some funding agencies around the world have canceled or put on hold all non-COVID-19 clinical trials still at the design state, Dr. Guadino said in an interview.
The NIH, he stressed, has not canceled funding and has been “extremely open and cooperative” in trying to help trialists navigate the many COVID-generated issues. They’ve even issued guidance on how to manage trials during COVID-19.
Of note, in the survey, the majority of the trials stopped (95.4%) had nongovernmental funding.
“The data are not very granular, so we’re only able to make some very simple, descriptive comments, but it does seem like the more fragile trials – those that are smaller and industry-funded – are the ones more likely to be disrupted,” said Dr. Guadino.
In some cases, he said, priorities have shifted to COVID-19. “If a small company is sponsoring a trial and they decide they want to sponsor something related to COVID, or they realize that because of the slow enrollment, the trial becomes too expensive to complete, they may opt to just abandon it,” said Dr. Guadino.
At what cost? It will take years to sort that out, he said.
This study received no funding. Dr. Guadino and Dr. Bhatt are both active trialists, participating in both industry- and government-sponsored clinical research.
A version of this article originally appeared on Medscape.com.
The COVID-19 pandemic has created unique and unprecedented challenges for the clinical research world, with potentially long-lasting consequences.
A new analysis of the extent of disruption shows that the average rate of stopped trials nearly doubled during the first 5 months of 2020, compared with the 2 previous years.
“Typically, clinical research precedes clinical practice by several years, so this disruption we’re seeing now will be felt for many years to come,” said Mario Guadino, MD, of Weill Cornell Medicine, New York.
The analysis was published online July 31 in the Journal of the American College of Cardiology.
The researchers used Python software to query meta-data from all trials reported on ClinicalTrials.gov. Of 321,218 non-COVID-19 trials queried, 28,672 (8.9%) were reported as stopped, defined as a switch in trial status from “recruiting” to “active and not recruiting,” “completed,” “suspended,” “terminated,” or “withdrawn.”
The average rate of discontinuation was 638 trials/month from January 2017 to December 2019, rising to 1,147 trials/month between January 2020 and May 2020 (P < .001 for trend).
Once stopped (as opposed to paused), restarting a trial is a tricky prospect, said Dr. Guadino. “You can’t stop and restart a trial because it creates a lot of issues, so we should expect many of these stopped trials to never be completed.”
He said these figures likely represent an underestimate of the true impact of the pandemic because there is typically a delay in the updating of the status of a trial on ClinicalTrials.gov.
“We are likely looking only at the tip of the iceberg,” he added. “My impression is that the number of trials that will be affected and even canceled will be very high.”
As for cardiology trials, one of the report’s authors, Deepak Bhatt, MD, Brigham and Women’s Hospital, Boston, without naming specific trials, had this to say: “Several cardiovascular trials were paused, and some were permanently discontinued. It may be a while before we fully appreciate just how much information was lost and how much might be salvaged.”
He’s not worried, however, that upcoming cardiology meetings, which have moved online for the foreseeable future, might get a bit boring. “Fortunately, there is enough good work going on in the cardiovascular and cardiometabolic space that I believe there will still be ample randomized and observational data of high quality to present at the major meetings,” Dr. Bhatt said in an email.
The researchers found a weak correlation between the national population-adjusted numbers of COVID-19 cases and the proportion of non-COVID-19 trials stopped by country.
Even for trials that stopped recruiting for a period of time but are continuing, there are myriad issues involving compliance, data integrity, statistical interpretability, etc.
“Even if there is just a temporary disruption, that will most likely lead to reduced enrollment, missing follow-up visits, and protocol deviations, all things that would be red flags during normal times and impact the quality of the clinical trial,” said Dr. Guadino.
“And if your outcome of interest is mortality, well, how exactly do you measure that during a pandemic?” he added.
Stopped for lack of funding
Besides the logistical issues, another reason trials may be in jeopardy is funding. A warning early in the pandemic from the research community in Canada that funding was quickly drying up, leaving both jobs and data at risk, led to an aid package from the government to keep the lights on.
The National Institutes of Health (NIH), the Canadian Institutes of Health Research, and similar groups “have devoted large sums of money to research in COVID, which is of course very appropriate, but that clearly reduces the amount of funding that is available for other researchers,” said Dr. Guadino.
Some funding agencies around the world have canceled or put on hold all non-COVID-19 clinical trials still at the design state, Dr. Guadino said in an interview.
The NIH, he stressed, has not canceled funding and has been “extremely open and cooperative” in trying to help trialists navigate the many COVID-generated issues. They’ve even issued guidance on how to manage trials during COVID-19.
Of note, in the survey, the majority of the trials stopped (95.4%) had nongovernmental funding.
“The data are not very granular, so we’re only able to make some very simple, descriptive comments, but it does seem like the more fragile trials – those that are smaller and industry-funded – are the ones more likely to be disrupted,” said Dr. Guadino.
In some cases, he said, priorities have shifted to COVID-19. “If a small company is sponsoring a trial and they decide they want to sponsor something related to COVID, or they realize that because of the slow enrollment, the trial becomes too expensive to complete, they may opt to just abandon it,” said Dr. Guadino.
At what cost? It will take years to sort that out, he said.
This study received no funding. Dr. Guadino and Dr. Bhatt are both active trialists, participating in both industry- and government-sponsored clinical research.
A version of this article originally appeared on Medscape.com.
The COVID-19 pandemic has created unique and unprecedented challenges for the clinical research world, with potentially long-lasting consequences.
A new analysis of the extent of disruption shows that the average rate of stopped trials nearly doubled during the first 5 months of 2020, compared with the 2 previous years.
“Typically, clinical research precedes clinical practice by several years, so this disruption we’re seeing now will be felt for many years to come,” said Mario Guadino, MD, of Weill Cornell Medicine, New York.
The analysis was published online July 31 in the Journal of the American College of Cardiology.
The researchers used Python software to query meta-data from all trials reported on ClinicalTrials.gov. Of 321,218 non-COVID-19 trials queried, 28,672 (8.9%) were reported as stopped, defined as a switch in trial status from “recruiting” to “active and not recruiting,” “completed,” “suspended,” “terminated,” or “withdrawn.”
The average rate of discontinuation was 638 trials/month from January 2017 to December 2019, rising to 1,147 trials/month between January 2020 and May 2020 (P < .001 for trend).
Once stopped (as opposed to paused), restarting a trial is a tricky prospect, said Dr. Guadino. “You can’t stop and restart a trial because it creates a lot of issues, so we should expect many of these stopped trials to never be completed.”
He said these figures likely represent an underestimate of the true impact of the pandemic because there is typically a delay in the updating of the status of a trial on ClinicalTrials.gov.
“We are likely looking only at the tip of the iceberg,” he added. “My impression is that the number of trials that will be affected and even canceled will be very high.”
As for cardiology trials, one of the report’s authors, Deepak Bhatt, MD, Brigham and Women’s Hospital, Boston, without naming specific trials, had this to say: “Several cardiovascular trials were paused, and some were permanently discontinued. It may be a while before we fully appreciate just how much information was lost and how much might be salvaged.”
He’s not worried, however, that upcoming cardiology meetings, which have moved online for the foreseeable future, might get a bit boring. “Fortunately, there is enough good work going on in the cardiovascular and cardiometabolic space that I believe there will still be ample randomized and observational data of high quality to present at the major meetings,” Dr. Bhatt said in an email.
The researchers found a weak correlation between the national population-adjusted numbers of COVID-19 cases and the proportion of non-COVID-19 trials stopped by country.
Even for trials that stopped recruiting for a period of time but are continuing, there are myriad issues involving compliance, data integrity, statistical interpretability, etc.
“Even if there is just a temporary disruption, that will most likely lead to reduced enrollment, missing follow-up visits, and protocol deviations, all things that would be red flags during normal times and impact the quality of the clinical trial,” said Dr. Guadino.
“And if your outcome of interest is mortality, well, how exactly do you measure that during a pandemic?” he added.
Stopped for lack of funding
Besides the logistical issues, another reason trials may be in jeopardy is funding. A warning early in the pandemic from the research community in Canada that funding was quickly drying up, leaving both jobs and data at risk, led to an aid package from the government to keep the lights on.
The National Institutes of Health (NIH), the Canadian Institutes of Health Research, and similar groups “have devoted large sums of money to research in COVID, which is of course very appropriate, but that clearly reduces the amount of funding that is available for other researchers,” said Dr. Guadino.
Some funding agencies around the world have canceled or put on hold all non-COVID-19 clinical trials still at the design state, Dr. Guadino said in an interview.
The NIH, he stressed, has not canceled funding and has been “extremely open and cooperative” in trying to help trialists navigate the many COVID-generated issues. They’ve even issued guidance on how to manage trials during COVID-19.
Of note, in the survey, the majority of the trials stopped (95.4%) had nongovernmental funding.
“The data are not very granular, so we’re only able to make some very simple, descriptive comments, but it does seem like the more fragile trials – those that are smaller and industry-funded – are the ones more likely to be disrupted,” said Dr. Guadino.
In some cases, he said, priorities have shifted to COVID-19. “If a small company is sponsoring a trial and they decide they want to sponsor something related to COVID, or they realize that because of the slow enrollment, the trial becomes too expensive to complete, they may opt to just abandon it,” said Dr. Guadino.
At what cost? It will take years to sort that out, he said.
This study received no funding. Dr. Guadino and Dr. Bhatt are both active trialists, participating in both industry- and government-sponsored clinical research.
A version of this article originally appeared on Medscape.com.
Send kids to school safely if possible, supplement virtually
The abrupt transition to online learning for American children in kindergarten through 12th grade has left educators and parents unprepared, but virtual learning can be a successful part of education going forward, according to a viewpoint published in JAMA Pediatrics. However, schools also can reopen safely if precautions are taken, and students would benefit in many ways, according to a second viewpoint.

“As policy makers, health care professionals, and parents prepare for the fall semester and as public and private schools grapple with how to make that possible, a better understanding of K-12 virtual learning options and outcomes may facilitate those difficult decisions,” wrote Erik Black, PhD, of the University of Florida, Gainesville; Richard Ferdig, PhD, of Kent State University, Ohio; and Lindsay A. Thompson, MD, of the University of Florida, Gainesville.
“Importantly, K-12 virtual schooling is not suited for all students or all families.”
In a viewpoint published in JAMA Pediatrics, the authors noted that virtual schooling has existed in the United States in various forms for some time. “Just like the myriad options that are available for face-to-face schooling in the U.S., virtual schooling exists in a complex landscape of for-profit, charter, and public options.”
Not all virtual schools are equal
Consequently, not all virtual schools are created equal, they emphasized. Virtual education can be successful for many students when presented by trained online instructors using a curriculum designed to be effective in an online venue.
“Parents need to seek reviews and ask for educational outcomes from each virtual school system to assess the quality of the provided education,” Dr. Black, Dr. Ferdig, and Dr. Thompson emphasized.
Key questions for parents to consider when faced with online learning include the type of technology needed to participate; whether their child can maintain a study schedule and complete assignments with limited supervision; whether their child could ask for help and communicate with teachers through technology including phone, text, email, or video; and whether their child has the basic reading, math, and computer literacy skills to engage in online learning, the authors said. Other questions include the school’s expectations for parents and caregivers, how student information may be shared, and how the virtual school lines up with state standards for K-12 educators (in the case of options outside the public school system).
“The COVID-19 pandemic offers a unique challenge for educators, policymakers, and health care professionals to partner with parents to make the best local and individual decisions for children,” Dr. Black, Dr. Ferdig, and Dr. Thompson concluded.
Schools may be able to open safely
Children continue to make up a low percentage of COVID-19 cases and appear less likely to experience illness, wrote C. Jason Wang, MD, PhD, and Henry Bair, BS, of Stanford (Calif.) University in a second viewpoint also published in JAMA Pediatrics. The impact of long-term school closures extends beyond education and can “exacerbate socioeconomic disparities, amplify existing educational inequalities, and aggravate food insecurity, domestic violence, and mental health disorders,” they wrote.
Dr. Wang and Mr. Bair proposed that school districts “engage key stakeholders to establish a COVID-19 task force, composed of the superintendent, members of the school board, teachers, parents, and health care professionals to develop policies and procedures,” that would allow schools to open safely.
The authors outlined strategies including adapting teaching spaces to accommodate physical distance, with the addition of temporary modular buildings if needed. They advised assigned seating on school buses, and acknowledged the need for the availability of protective equipment, including hand sanitizer and masks, as well as the possible use of transparent barriers on the sides of student desks.
“As the AAP [American Academy of Pediatrics] guidance suggests, teachers who must work closely with students with special needs or with students who are unable to wear masks should wear N95 masks if possible or wear face shields in addition to surgical masks,” Dr. Wang and Mr. Bair noted. Other elements of the AAP guidance include the creation of fixed cohorts of students and teachers to limit virus exposure.
“Even with all the precautions in place, COVID-19 outbreaks within schools are still likely,” they said. “Therefore, schools will need to remain flexible and consider temporary closures if there is an outbreak involving multiple students and/or staff and be ready to transition to online education.”
The AAP guidance does not address operational approaches to identifying signs and symptoms of COVID-19, the authors noted. “To address this, we recommend that schools implement multilevel screening for students and staff.”
“In summary, to maximize health and educational outcomes, school districts should adopt some or all of the measures of the AAP guidance and prioritize them after considering local COVID-19 incidence, key stakeholder input, and budgetary constraints,” Dr. Wang and Mr. Bair concluded.
Schools opening is a regional decision
“The mission of the AAP is to attain optimal physical, mental, and social health and well-being for all infants, children, adolescents, and young adults,” Howard Smart, MD, said in an interview. The question of school reopening “is of national importance, and the AAP has a national role in making recommendations regarding national policy affecting the health of the children.”
“The decision to open schools will be made regionally, but it is important for a nonpolitical national voice to make expert recommendations,” he emphasized.
“Many of the recommendations are ideal goals,” noted Dr. Smart, chairman of the department of pediatrics at the Sharp Rees-Stealy Medical Group in San Diego. “It will be difficult, for example, to implement symptom screening every day before school, no matter where it is performed. Some of the measures may be quite costly, and take time to implement, or require expansion of school staff, for which there may be no budget.”
In addition, “[n]ot all students are likely to comply with masking, distance, and hand-washing recommendations. One student who is noncompliant will be able to infect many other students and staff, as has been seen in other countries.” Also, parental attitudes toward control measures are likely to affect student attitudes, he noted.
“I have interviewed many families at recent checkups, and most have felt that the rush to remote learning that occurred at the end of the last school year resulted in fairly disorganized instruction,” Dr. Smart said. “They are hoping that, having had the summer to plan ahead, the remote teaching will be handled better. Remote learning will certainly work best for self-motivated, organized students with good family support, as noted in the Black, Ferdig, and Thompson article,” he said.
Pediatricians can support the schools by being a source of evidence-based information for parents, Dr. Smart said. “Pediatricians with time and energy might want to volunteer to hold informational video conferences for parents and/or school personnel if they feel they are up to date on current COVID-19 science and want to handle potentially contentious questions.”
The decision parents make to send their children back to school comes down to a risk-benefit calculation. “In some communities this may be left to parents, while in other communities this will a public health decision,” he said. “It is still not clear whether having students attend school in person will result in increased spread of COVID-19 among the students, or in their communities. Although some evidence from early in the pandemic suggests that children may not spread the virus as much as adults, more recent evidence suggests that children 10 years and older do transmit the virus at least as much as adults.”
“The risk to the students and the community, therefore, is unknown,” and difficult to compare with the benefit of in-person schooling, Dr. Smart noted.
“We will learn quite a bit from communities where students do go back to in-person class, as we follow the progression of COVID-19 over the weeks following the resumption of instruction.” Ultimately, advice to parents will need to be tailored to the current conditions of COVID-19 transmission in the community, he concluded.
It’s not just about education
“The AAP released its guidance to ensure that as school districts were contemplating reopening they were considering the full array of risks for children and adolescents. These risks included not only those related to COVID-19, but also those related to the impact of not reopening in-person,” Nathaniel Beers, MD, president of the HSC Health Care System in Washington, said in an interview.
“Students and families are dependent on schools for much more than just an education, and those [elements] need to be factored into the decisions to reopen,” the pediatrician said.
However, “[t]he major barrier for schools is resources to safely reopen,” said Dr. Beers. “The additional staffing and supplies will require additional funding. There are increased demands regardless of whether students are learning in-person or virtually or through hybrid models.”
“Another significant barrier is ensuring that parents and staff are actively engaged in planning for the type of model being used,” he said.
“All of the models require buy-in by staff and parents. This will require significant outreach and strong communication plans. Schools also need to ensure they are planning not just for how to return students to schools, but what will happen when staff or students test positive for COVID-19. Students, families, and staff all will need to know what these plans are up front to feel confident in returning to school,” he emphasized.
“There are students who can thrive in a virtual learning environment,” Dr. Beers said. “There are also students who benefit from the virtual learning environment because of their own risk, or because of a family member’s risk for COVID-19 or the complications from it.”
“However, many children with disabilities have struggled in a virtual environment,” he said. “These students struggle to access the educational services without the adequate supports at home. They often receive additional services in school, such as speech, occupational therapy or physical therapy, or nursing services, that may not have transitioned to home but are critical for their health and development. Many students with disabilities are dependent on family members to successfully access the educational services they need.”
“Pediatricians can play a role in providing feedback on recommendations related to physical distancing and face coverings in particular,” said Dr. Beers. “In addition, they can be helpful in developing plans for children with disabilities as well as what the response plan should be for students who become sick during the school day.”
The Centers for Disease Control and Prevention released a decision tool for parents who are considering whether to send their child to in-person school, and pediatricians can help parents walk through these questions, Dr. Beers noted. “In addition, pediatricians play an important role in helping patients and families think about the risks of COVID for the patient and other family members, and this can be helpful in addressing the anxiety that parents and patients may be experiencing.”
Further information can be found in Return to School During COVID-19, which can be located at HealthyChildren.org, by the American Academy of Pediatrics.
The authors of the viewpoints had no relevant financial disclosures. Dr. Smart, a member of the Pediatric News editorial advisory board, had no relevant financial disclosures. Dr. Beers has served on the editorial advisory board of Pediatric News in the past, but had no relevant financial disclosures.
SOURCES: Black E, Ferdig R, Thompson LA. JAMA Pediatr. 2020 Aug 11. doi: 10.1001/jamapediatrics.2020.3800. Wang CJ and Bair H. JAMA Pediatr. Aug 11. doi: 10.1001/jamapediatrics.2020.3871.
The abrupt transition to online learning for American children in kindergarten through 12th grade has left educators and parents unprepared, but virtual learning can be a successful part of education going forward, according to a viewpoint published in JAMA Pediatrics. However, schools also can reopen safely if precautions are taken, and students would benefit in many ways, according to a second viewpoint.
“As policy makers, health care professionals, and parents prepare for the fall semester and as public and private schools grapple with how to make that possible, a better understanding of K-12 virtual learning options and outcomes may facilitate those difficult decisions,” wrote Erik Black, PhD, of the University of Florida, Gainesville; Richard Ferdig, PhD, of Kent State University, Ohio; and Lindsay A. Thompson, MD, of the University of Florida, Gainesville.
“Importantly, K-12 virtual schooling is not suited for all students or all families.”
In a viewpoint published in JAMA Pediatrics, the authors noted that virtual schooling has existed in the United States in various forms for some time. “Just like the myriad options that are available for face-to-face schooling in the U.S., virtual schooling exists in a complex landscape of for-profit, charter, and public options.”
Not all virtual schools are equal
Consequently, not all virtual schools are created equal, they emphasized. Virtual education can be successful for many students when presented by trained online instructors using a curriculum designed to be effective in an online venue.
“Parents need to seek reviews and ask for educational outcomes from each virtual school system to assess the quality of the provided education,” Dr. Black, Dr. Ferdig, and Dr. Thompson emphasized.
Key questions for parents to consider when faced with online learning include the type of technology needed to participate; whether their child can maintain a study schedule and complete assignments with limited supervision; whether their child could ask for help and communicate with teachers through technology including phone, text, email, or video; and whether their child has the basic reading, math, and computer literacy skills to engage in online learning, the authors said. Other questions include the school’s expectations for parents and caregivers, how student information may be shared, and how the virtual school lines up with state standards for K-12 educators (in the case of options outside the public school system).
“The COVID-19 pandemic offers a unique challenge for educators, policymakers, and health care professionals to partner with parents to make the best local and individual decisions for children,” Dr. Black, Dr. Ferdig, and Dr. Thompson concluded.
Schools may be able to open safely
Children continue to make up a low percentage of COVID-19 cases and appear less likely to experience illness, wrote C. Jason Wang, MD, PhD, and Henry Bair, BS, of Stanford (Calif.) University in a second viewpoint also published in JAMA Pediatrics. The impact of long-term school closures extends beyond education and can “exacerbate socioeconomic disparities, amplify existing educational inequalities, and aggravate food insecurity, domestic violence, and mental health disorders,” they wrote.
Dr. Wang and Mr. Bair proposed that school districts “engage key stakeholders to establish a COVID-19 task force, composed of the superintendent, members of the school board, teachers, parents, and health care professionals to develop policies and procedures,” that would allow schools to open safely.
The authors outlined strategies including adapting teaching spaces to accommodate physical distance, with the addition of temporary modular buildings if needed. They advised assigned seating on school buses, and acknowledged the need for the availability of protective equipment, including hand sanitizer and masks, as well as the possible use of transparent barriers on the sides of student desks.
“As the AAP [American Academy of Pediatrics] guidance suggests, teachers who must work closely with students with special needs or with students who are unable to wear masks should wear N95 masks if possible or wear face shields in addition to surgical masks,” Dr. Wang and Mr. Bair noted. Other elements of the AAP guidance include the creation of fixed cohorts of students and teachers to limit virus exposure.
“Even with all the precautions in place, COVID-19 outbreaks within schools are still likely,” they said. “Therefore, schools will need to remain flexible and consider temporary closures if there is an outbreak involving multiple students and/or staff and be ready to transition to online education.”
The AAP guidance does not address operational approaches to identifying signs and symptoms of COVID-19, the authors noted. “To address this, we recommend that schools implement multilevel screening for students and staff.”
“In summary, to maximize health and educational outcomes, school districts should adopt some or all of the measures of the AAP guidance and prioritize them after considering local COVID-19 incidence, key stakeholder input, and budgetary constraints,” Dr. Wang and Mr. Bair concluded.
Schools opening is a regional decision
“The mission of the AAP is to attain optimal physical, mental, and social health and well-being for all infants, children, adolescents, and young adults,” Howard Smart, MD, said in an interview. The question of school reopening “is of national importance, and the AAP has a national role in making recommendations regarding national policy affecting the health of the children.”
“The decision to open schools will be made regionally, but it is important for a nonpolitical national voice to make expert recommendations,” he emphasized.
“Many of the recommendations are ideal goals,” noted Dr. Smart, chairman of the department of pediatrics at the Sharp Rees-Stealy Medical Group in San Diego. “It will be difficult, for example, to implement symptom screening every day before school, no matter where it is performed. Some of the measures may be quite costly, and take time to implement, or require expansion of school staff, for which there may be no budget.”
In addition, “[n]ot all students are likely to comply with masking, distance, and hand-washing recommendations. One student who is noncompliant will be able to infect many other students and staff, as has been seen in other countries.” Also, parental attitudes toward control measures are likely to affect student attitudes, he noted.
“I have interviewed many families at recent checkups, and most have felt that the rush to remote learning that occurred at the end of the last school year resulted in fairly disorganized instruction,” Dr. Smart said. “They are hoping that, having had the summer to plan ahead, the remote teaching will be handled better. Remote learning will certainly work best for self-motivated, organized students with good family support, as noted in the Black, Ferdig, and Thompson article,” he said.
Pediatricians can support the schools by being a source of evidence-based information for parents, Dr. Smart said. “Pediatricians with time and energy might want to volunteer to hold informational video conferences for parents and/or school personnel if they feel they are up to date on current COVID-19 science and want to handle potentially contentious questions.”
The decision parents make to send their children back to school comes down to a risk-benefit calculation. “In some communities this may be left to parents, while in other communities this will a public health decision,” he said. “It is still not clear whether having students attend school in person will result in increased spread of COVID-19 among the students, or in their communities. Although some evidence from early in the pandemic suggests that children may not spread the virus as much as adults, more recent evidence suggests that children 10 years and older do transmit the virus at least as much as adults.”
“The risk to the students and the community, therefore, is unknown,” and difficult to compare with the benefit of in-person schooling, Dr. Smart noted.
“We will learn quite a bit from communities where students do go back to in-person class, as we follow the progression of COVID-19 over the weeks following the resumption of instruction.” Ultimately, advice to parents will need to be tailored to the current conditions of COVID-19 transmission in the community, he concluded.
It’s not just about education
“The AAP released its guidance to ensure that as school districts were contemplating reopening they were considering the full array of risks for children and adolescents. These risks included not only those related to COVID-19, but also those related to the impact of not reopening in-person,” Nathaniel Beers, MD, president of the HSC Health Care System in Washington, said in an interview.
“Students and families are dependent on schools for much more than just an education, and those [elements] need to be factored into the decisions to reopen,” the pediatrician said.
However, “[t]he major barrier for schools is resources to safely reopen,” said Dr. Beers. “The additional staffing and supplies will require additional funding. There are increased demands regardless of whether students are learning in-person or virtually or through hybrid models.”
“Another significant barrier is ensuring that parents and staff are actively engaged in planning for the type of model being used,” he said.
“All of the models require buy-in by staff and parents. This will require significant outreach and strong communication plans. Schools also need to ensure they are planning not just for how to return students to schools, but what will happen when staff or students test positive for COVID-19. Students, families, and staff all will need to know what these plans are up front to feel confident in returning to school,” he emphasized.
“There are students who can thrive in a virtual learning environment,” Dr. Beers said. “There are also students who benefit from the virtual learning environment because of their own risk, or because of a family member’s risk for COVID-19 or the complications from it.”
“However, many children with disabilities have struggled in a virtual environment,” he said. “These students struggle to access the educational services without the adequate supports at home. They often receive additional services in school, such as speech, occupational therapy or physical therapy, or nursing services, that may not have transitioned to home but are critical for their health and development. Many students with disabilities are dependent on family members to successfully access the educational services they need.”
“Pediatricians can play a role in providing feedback on recommendations related to physical distancing and face coverings in particular,” said Dr. Beers. “In addition, they can be helpful in developing plans for children with disabilities as well as what the response plan should be for students who become sick during the school day.”
The Centers for Disease Control and Prevention released a decision tool for parents who are considering whether to send their child to in-person school, and pediatricians can help parents walk through these questions, Dr. Beers noted. “In addition, pediatricians play an important role in helping patients and families think about the risks of COVID for the patient and other family members, and this can be helpful in addressing the anxiety that parents and patients may be experiencing.”
Further information can be found in Return to School During COVID-19, which can be located at HealthyChildren.org, by the American Academy of Pediatrics.
The authors of the viewpoints had no relevant financial disclosures. Dr. Smart, a member of the Pediatric News editorial advisory board, had no relevant financial disclosures. Dr. Beers has served on the editorial advisory board of Pediatric News in the past, but had no relevant financial disclosures.
SOURCES: Black E, Ferdig R, Thompson LA. JAMA Pediatr. 2020 Aug 11. doi: 10.1001/jamapediatrics.2020.3800. Wang CJ and Bair H. JAMA Pediatr. Aug 11. doi: 10.1001/jamapediatrics.2020.3871.
The abrupt transition to online learning for American children in kindergarten through 12th grade has left educators and parents unprepared, but virtual learning can be a successful part of education going forward, according to a viewpoint published in JAMA Pediatrics. However, schools also can reopen safely if precautions are taken, and students would benefit in many ways, according to a second viewpoint.
“As policy makers, health care professionals, and parents prepare for the fall semester and as public and private schools grapple with how to make that possible, a better understanding of K-12 virtual learning options and outcomes may facilitate those difficult decisions,” wrote Erik Black, PhD, of the University of Florida, Gainesville; Richard Ferdig, PhD, of Kent State University, Ohio; and Lindsay A. Thompson, MD, of the University of Florida, Gainesville.
“Importantly, K-12 virtual schooling is not suited for all students or all families.”
In a viewpoint published in JAMA Pediatrics, the authors noted that virtual schooling has existed in the United States in various forms for some time. “Just like the myriad options that are available for face-to-face schooling in the U.S., virtual schooling exists in a complex landscape of for-profit, charter, and public options.”
Not all virtual schools are equal
Consequently, not all virtual schools are created equal, they emphasized. Virtual education can be successful for many students when presented by trained online instructors using a curriculum designed to be effective in an online venue.
“Parents need to seek reviews and ask for educational outcomes from each virtual school system to assess the quality of the provided education,” Dr. Black, Dr. Ferdig, and Dr. Thompson emphasized.
Key questions for parents to consider when faced with online learning include the type of technology needed to participate; whether their child can maintain a study schedule and complete assignments with limited supervision; whether their child could ask for help and communicate with teachers through technology including phone, text, email, or video; and whether their child has the basic reading, math, and computer literacy skills to engage in online learning, the authors said. Other questions include the school’s expectations for parents and caregivers, how student information may be shared, and how the virtual school lines up with state standards for K-12 educators (in the case of options outside the public school system).
“The COVID-19 pandemic offers a unique challenge for educators, policymakers, and health care professionals to partner with parents to make the best local and individual decisions for children,” Dr. Black, Dr. Ferdig, and Dr. Thompson concluded.
Schools may be able to open safely
Children continue to make up a low percentage of COVID-19 cases and appear less likely to experience illness, wrote C. Jason Wang, MD, PhD, and Henry Bair, BS, of Stanford (Calif.) University in a second viewpoint also published in JAMA Pediatrics. The impact of long-term school closures extends beyond education and can “exacerbate socioeconomic disparities, amplify existing educational inequalities, and aggravate food insecurity, domestic violence, and mental health disorders,” they wrote.
Dr. Wang and Mr. Bair proposed that school districts “engage key stakeholders to establish a COVID-19 task force, composed of the superintendent, members of the school board, teachers, parents, and health care professionals to develop policies and procedures,” that would allow schools to open safely.
The authors outlined strategies including adapting teaching spaces to accommodate physical distance, with the addition of temporary modular buildings if needed. They advised assigned seating on school buses, and acknowledged the need for the availability of protective equipment, including hand sanitizer and masks, as well as the possible use of transparent barriers on the sides of student desks.
“As the AAP [American Academy of Pediatrics] guidance suggests, teachers who must work closely with students with special needs or with students who are unable to wear masks should wear N95 masks if possible or wear face shields in addition to surgical masks,” Dr. Wang and Mr. Bair noted. Other elements of the AAP guidance include the creation of fixed cohorts of students and teachers to limit virus exposure.
“Even with all the precautions in place, COVID-19 outbreaks within schools are still likely,” they said. “Therefore, schools will need to remain flexible and consider temporary closures if there is an outbreak involving multiple students and/or staff and be ready to transition to online education.”
The AAP guidance does not address operational approaches to identifying signs and symptoms of COVID-19, the authors noted. “To address this, we recommend that schools implement multilevel screening for students and staff.”
“In summary, to maximize health and educational outcomes, school districts should adopt some or all of the measures of the AAP guidance and prioritize them after considering local COVID-19 incidence, key stakeholder input, and budgetary constraints,” Dr. Wang and Mr. Bair concluded.
Schools opening is a regional decision
“The mission of the AAP is to attain optimal physical, mental, and social health and well-being for all infants, children, adolescents, and young adults,” Howard Smart, MD, said in an interview. The question of school reopening “is of national importance, and the AAP has a national role in making recommendations regarding national policy affecting the health of the children.”
“The decision to open schools will be made regionally, but it is important for a nonpolitical national voice to make expert recommendations,” he emphasized.
“Many of the recommendations are ideal goals,” noted Dr. Smart, chairman of the department of pediatrics at the Sharp Rees-Stealy Medical Group in San Diego. “It will be difficult, for example, to implement symptom screening every day before school, no matter where it is performed. Some of the measures may be quite costly, and take time to implement, or require expansion of school staff, for which there may be no budget.”
In addition, “[n]ot all students are likely to comply with masking, distance, and hand-washing recommendations. One student who is noncompliant will be able to infect many other students and staff, as has been seen in other countries.” Also, parental attitudes toward control measures are likely to affect student attitudes, he noted.
“I have interviewed many families at recent checkups, and most have felt that the rush to remote learning that occurred at the end of the last school year resulted in fairly disorganized instruction,” Dr. Smart said. “They are hoping that, having had the summer to plan ahead, the remote teaching will be handled better. Remote learning will certainly work best for self-motivated, organized students with good family support, as noted in the Black, Ferdig, and Thompson article,” he said.
Pediatricians can support the schools by being a source of evidence-based information for parents, Dr. Smart said. “Pediatricians with time and energy might want to volunteer to hold informational video conferences for parents and/or school personnel if they feel they are up to date on current COVID-19 science and want to handle potentially contentious questions.”
The decision parents make to send their children back to school comes down to a risk-benefit calculation. “In some communities this may be left to parents, while in other communities this will a public health decision,” he said. “It is still not clear whether having students attend school in person will result in increased spread of COVID-19 among the students, or in their communities. Although some evidence from early in the pandemic suggests that children may not spread the virus as much as adults, more recent evidence suggests that children 10 years and older do transmit the virus at least as much as adults.”
“The risk to the students and the community, therefore, is unknown,” and difficult to compare with the benefit of in-person schooling, Dr. Smart noted.
“We will learn quite a bit from communities where students do go back to in-person class, as we follow the progression of COVID-19 over the weeks following the resumption of instruction.” Ultimately, advice to parents will need to be tailored to the current conditions of COVID-19 transmission in the community, he concluded.
It’s not just about education
“The AAP released its guidance to ensure that as school districts were contemplating reopening they were considering the full array of risks for children and adolescents. These risks included not only those related to COVID-19, but also those related to the impact of not reopening in-person,” Nathaniel Beers, MD, president of the HSC Health Care System in Washington, said in an interview.
“Students and families are dependent on schools for much more than just an education, and those [elements] need to be factored into the decisions to reopen,” the pediatrician said.
However, “[t]he major barrier for schools is resources to safely reopen,” said Dr. Beers. “The additional staffing and supplies will require additional funding. There are increased demands regardless of whether students are learning in-person or virtually or through hybrid models.”
“Another significant barrier is ensuring that parents and staff are actively engaged in planning for the type of model being used,” he said.
“All of the models require buy-in by staff and parents. This will require significant outreach and strong communication plans. Schools also need to ensure they are planning not just for how to return students to schools, but what will happen when staff or students test positive for COVID-19. Students, families, and staff all will need to know what these plans are up front to feel confident in returning to school,” he emphasized.
“There are students who can thrive in a virtual learning environment,” Dr. Beers said. “There are also students who benefit from the virtual learning environment because of their own risk, or because of a family member’s risk for COVID-19 or the complications from it.”
“However, many children with disabilities have struggled in a virtual environment,” he said. “These students struggle to access the educational services without the adequate supports at home. They often receive additional services in school, such as speech, occupational therapy or physical therapy, or nursing services, that may not have transitioned to home but are critical for their health and development. Many students with disabilities are dependent on family members to successfully access the educational services they need.”
“Pediatricians can play a role in providing feedback on recommendations related to physical distancing and face coverings in particular,” said Dr. Beers. “In addition, they can be helpful in developing plans for children with disabilities as well as what the response plan should be for students who become sick during the school day.”
The Centers for Disease Control and Prevention released a decision tool for parents who are considering whether to send their child to in-person school, and pediatricians can help parents walk through these questions, Dr. Beers noted. “In addition, pediatricians play an important role in helping patients and families think about the risks of COVID for the patient and other family members, and this can be helpful in addressing the anxiety that parents and patients may be experiencing.”
Further information can be found in Return to School During COVID-19, which can be located at HealthyChildren.org, by the American Academy of Pediatrics.
The authors of the viewpoints had no relevant financial disclosures. Dr. Smart, a member of the Pediatric News editorial advisory board, had no relevant financial disclosures. Dr. Beers has served on the editorial advisory board of Pediatric News in the past, but had no relevant financial disclosures.
SOURCES: Black E, Ferdig R, Thompson LA. JAMA Pediatr. 2020 Aug 11. doi: 10.1001/jamapediatrics.2020.3800. Wang CJ and Bair H. JAMA Pediatr. Aug 11. doi: 10.1001/jamapediatrics.2020.3871.
FROM JAMA PEDIATRICS

Ultrabrief Screens for Detecting Delirium in Postoperative Cognitively Intact Older Adults
Delirium is the most common postsurgical complication for older adults, with incidence of 15%-54%, depending on surgery type.1 Increasing numbers of older adults are undergoing surgery2; and those who develop delirium experience negative consequences including longer lengths of stay, higher likelihood of institutional discharge, and increased morbidity and mortality.3 The American Geriatrics Society Expert Panel on Postoperative Delirium in Older Adults and the European Society of Anaesthesiology4 recommend routine screening for delirium in those at risk.
Ultrabrief screens are designed to rule out delirium quickly and identify a subset of patients who require further testing.5 Our group, and others, have previously published ultrabrief screens for the general medicine, nonsurgical population and for patients with dementia.5,6 The UB-2 is an ultrabrief screen consisting of “Months of the year backward” (MOYB) and “What day of the week is it?”, which has a sensitivity of 93% and specificity of 64% in hospitalized older adults and takes less than 40 seconds to administer.5 However, no such screens for delirium have been developed for the group with relatively high cognitive and physical functioning undergoing scheduled major surgery in which delirium may present differently. Thus, the purpose of this study was to develop an ultrabrief screen for postoperative delirium using data from a large study of delirium in cognitively intact, older adults undergoing scheduled major noncardiac surgery.
METHODS
We performed a secondary data analysis on 560 patients enrolled between June 18, 2010, and August 8, 2013, in the Successful Aging After Elective Surgery (SAGES) study,7 an ongoing prospective cohort study of older adults undergoing major elective surgeries (eg, total hip or knee replacement; lumbar, cervical, or sacral laminectomy; lower extremity arterial bypass surgery; open abdominal aortic aneurysm repair; and open or laparoscopic colectomy). Exclusion criteria included evidence of dementia, delirium, prior hospitalization within 3 months, legal blindness, severe deafness, terminal condition, history of schizophrenia or psychosis, and history of alcohol abuse or withdrawal. The Institutional Review Boards of Beth Israel Deaconess Medical Center, Brigham and Women’s Hospital, and Hebrew SeniorLife, all in Boston, Massachusetts, approved the study.
SAGES Delirium Assessment and Additional Variables
The presence or absence of delirium was based on daily in-hospital assessments by trained research staff using the Confusion Assessment Method (CAM)8 long form. The Delirium Symptom Interview (DSI)9 and information related to acute changes in mental status were also included as provided by nursing staff and/or family. Delirium severity was determined using the CAM-S.10 Participants in The SAGES Study had an initial baseline, presurgical assessment in their homes. Cognitive and physical functioning, depression, comorbidities, laboratory, and self-reported demographic data were collected.
Statistical Analyses
We included CAM delirium data from postoperative days (POD) 1 and 2 for each participant, if available; postoperative day 0 was not included because of potential residual anesthetic effects. We chose these days because most delirium began on POD1 or 2, and patients started being discharged on POD3. We considered all one-, two-, and three-item combinations of the 12 cognitive items of the 3D-CAM11 because of their demonstrated high information content for CAM diagnostic features per Item Response Theory.12 There were 12 possible one-item screens, 66 two-item screens, and 220 three-item screens. Sensitivity, specificity, and 95% confidence intervals for each were compared with CAM delirium determination. An ideal ultrabrief screen for delirium has high sensitivity with moderate specificity; general guidelines considered based on investigator consensus included screens with a sensitivity higher than 0.90 and specificity greater than 0.70. Because these screens are used to quickly rule out delirium, we also present the percent positive screen among the entire population (whether delirium is present or not). Screens with a positive screen rate of more than 50% are unlikely to be helpful in ruling out delirium quickly in a large enough fraction of the population. We also required that in multiple item screens, no two items should assess the same CAM feature. For instance, we would eliminate a two-item screen with MOYB and four-digit span since both items measure CAM Feature 2 (Inattention). Finally, we evaluated screen performance separately on POD1 and POD2. Switching screens by POD can be confusing, so we chose a single best screen that retained excellent performance over both days. Data analyses used SAS version 9.4 (SAS Institute, Cary, North Carolina).
RESULTS
The dataset included 560 adults who had an average age of 76.6 years (SD = 5.2), were 58% women, and were highly educated (15.0 years; SD = 2.9; Table). Postoperative delirium occurred during one or more days in 134 individuals (24%). A total of 1,100 delirium assessments were used, with 113 that were CAM positive (10.3%). For POD1, we used 551 assessments, 61 of which were positive (11.1%); for POD2, 549 assessments were used, with 51 positive (9.3%). Appendix Tables present the positive screen rates, sensitivities, specificities, and 95% confidence intervals of all 12 one-item screens and the 12 best performing two- and three-item screens in order of decreasing sensitivity.

The best ultrabrief screen from POD1 included the following three items: “Does the patient report feeling confused?”, MOYB, and “Does the patient appear sleepy?”, with a sensitivity of 0.95 (95% CI, 0.87-0.99) and specificity of 0.73 (95% CI, 0.69-0.77). The same combination of items has a sensitivity of 0.88 (95% CI, 0.77-0.96) and a specificity of 0.70 (95% CI, 0.66-0.74) on POD2. When POD1 and POD2 are combined, the sensitivity is 0.92 (95% CI, 0.85-0.96) and specificity is 0.72 (95% CI, 0.69-0.74). We consider this to be our best screen overall.
DISCUSSION
We identified a three-item screen for delirium after elective surgery consisting of “Does the patient report feeling confused?”, MOYB, and “Does the patient appear sleepy?” In our own prior work, we identified a two-item screen consisting of MOYB and “What is the day of the week?” as the best ultrabrief screen for delirium in general medicine populations (termed the “UB-2”)5 and a subsequent screen for patients with delirium superimposed on dementia (DSD) including “What type of place is this?”, Days of the Week Backward, and “Does the patient appear sleepy?”6 All three contain a test of attention (a cardinal feature of delirium) and a test of orientation, although the specific test for that varies. Both the surgical and DSD screens include “Does the patient appear sleepy?”, which addresses a reduced level of consciousness. This might be particularly important in the postoperative setting because of residual effects of anesthesia and/or postoperative analgesic medications contributing to delirium. Work done by others confirms our current findings, which is that MOYB is the best single item for most groups. Belleli et al13 and Han et al14 included MOYB as the single attentional item in the 4AT and B-CAM, respectively. The Nu-DESC has been used as a screen in surgical patients; however, it involves only nursing observations and no direct questioning of the patient.15
The Figure describes how our “best screen” could be integrated into clinical care. One or more “positive” or incorrect responses on these three items constitutes a positive screen that should be further evaluated with the CAM or 3D-CAM. If all three items are correct or negative, this effectively rules out delirium; however, continued periodic screening on a daily (or per shift) basis is indicated. On repeat testing, if any of the previously negative or correct items becomes positive or incorrect, this would be evidence for Acute Change, CAM Feature 1. Finally, it should be noted that, if all three items in our best screen are positive, full CAM criteria for delirium diagnosis are met within the screen itself, and no further testing is required. We envision this process being facilitated by use of an app-based program that generates optimal screening items based on patient and setting characteristics.

There are several limitations that must be noted. First, our three-item screen may not generalize to nonsurgical candidates or those undergoing emergent surgery and should be tested in these groups. Second, the SAGES sample is relatively homogenous with respect to racial and ethnic diversity and was highly educated with little functional impairment and no dementia. Therefore, results may not be generalizable to populations with lower educational attainment and/or preexisting mental and physical disabilities. A third limitation is that screen items were included in the reference standard delirium assessment, leading to a potential bias toward increased sensitivity. Finally, all screens were derived from secondary data analysis and further research will be needed to prospectively validate the results. Despite these limitations, this study has several strengths including the use of a well-characterized surgical population and a rigorous approach to delirium measurement. It is one of the first studies to identify a screening tool targeted to identifying delirium in postoperative older adults.
Future research should prospectively validate our screening tool and test its implementation in a real-world clinical environment. As part of this process, clinicians should document barriers and facilitators to widespread implementation. The goal of such screens is to facilitate early identification of postoperative delirium, which will allow timely intervention to address underlying causes and prevent adverse consequences, thereby improving the outcomes of vulnerable older surgical patients.
1. Marcantonio ER. Postoperative delirium: a 76-year-old woman with delirium following surgery. JAMA. 2012;308(1):73-81. https://doi.org/10.1001/jama.2012.6857
2. Seib CD, Rochefort H, Chomsky-Higgins K, et al. Association of patient frailty with increased morbidity after common ambulatory general surgery operations. JAMA Surg. 2018;153(2):160-168. https://doi.org/10.1001/jamasurg.2017.4007
3. Gleason LJ, Schmitt EM, Kosar CM, et al. Effect of delirium and other major complications after elective surgery in older adults. JAMA Surg. 2015;150(12):1134-1140. https://doi.org/10.1001/jamasurg.2015.2606
4. Aldecoa C, Bettelli G, Bilotta F, et al. European Society of Anaesthesiology evidence-based and consensus-based guideline on postoperative delirium. Eur J Anaesthesiol. 2017;34(4):192-214. https://doi.org/10.1097/EJA.0000000000000594
5. Fick DM, Inouye SK, Guess J, et al. Preliminary development of an ultrabrief two-item bedside test for delirium. J Hosp Med. 2015;10(10):645-650. https://doi.org/10.1002/jhm.2418
6. Steensma E, Zhou W, Ngo L, et al. Ultra-brief screeners for detecting delirium superimposed on dementia. J Am Med Dir Assoc. 2019;20(11):1391-1396.e1. https://doi.org/10.1016/j.jamda.2019.05.011
7. Schmitt EM, Marcantonio ER, Alsop DC, et al. Novel risk markers and long-term outcomes of delirium: the Successful Aging after Elective Surgery (SAGES) study design and methods. J Am Med Dir Assoc. 2012;13(9):818.e1-818.e810. https://doi.org/10.1016/j.jamda.2012.08.004
8. Inouye SK, van Dyck CH, Alessi CA, Balkin S, Siegal AP, Horwitz RI. Clarifying confusion: the confusion assessment method. a new method for detection of delirium. Ann Intern Med. 1990;113(12):941-948. https://doi.org/10.7326/0003-4819-113-12-941
9. Albert MS, Levkoff SE, Reilly C, et al. The delirium symptom interview: an interview for the detection of delirium symptoms in hospitalized patients. J Geriatr Psychiatry Neurol. 1992;5(1):14-21. https://doi.org/10.1177/002383099200500103
10. Inouye SK, Kosar CM, Tommet D, et al. The CAM-S: development and validation of a new scoring system for delirium severity in 2 cohorts. Ann Intern Med. 2014;160(8):526-533. https://doi.org/10.7326/M13-1927
11. Marcantonio ER, Ngo LH, O’Connor M, et al. 3D-CAM: derivation and validation of a 3-minute diagnostic interview for CAM-defined delirium: a cross-sectional diagnostic test study. Ann Intern Med. 2014;161(8):554-561. https://doi.org/10.7326/M14-0865
12. Yang FM, Jones RN, Inouye SK, et al. Selecting optimal screening items for delirium: an application of item response theory. BMC Med Res Methodol. 2013;13(1):8. https://doi.org/10.1186/1471-2288-13-8
13. Bellelli G, Morandi A, Davis DH, et al. Validation of the 4AT, a new instrument for rapid delirium screening: a study in 234 hospitalised older people. Age Ageing. 2014;43(4):496-502. https://doi.org/10.1093/ageing/afu021
14. Han JH, Wilson A, Vasilevskis EE, et al. Diagnosing delirium in older emergency department patients: validity and reliability of the Delirium Triage Screen and the Brief Confusion Assessment Method. Ann Emerg Med. 2013;62(5):457-465. https://doi.org/10.1016/j.annemergmed.2013.05.003
15. Gaudreau JD, Gagnon P, Harel F, Tremblay A, Roy MA. Fast, systematic, and continuous delirium assessment in hospitalized patients: the nursing delirium screening scale. J Pain Symptom Manage. 2005;29(4):368-375. https://doi.org/10.1016/j.jpainsymman.2004.07.009
Delirium is the most common postsurgical complication for older adults, with incidence of 15%-54%, depending on surgery type.1 Increasing numbers of older adults are undergoing surgery2; and those who develop delirium experience negative consequences including longer lengths of stay, higher likelihood of institutional discharge, and increased morbidity and mortality.3 The American Geriatrics Society Expert Panel on Postoperative Delirium in Older Adults and the European Society of Anaesthesiology4 recommend routine screening for delirium in those at risk.
Ultrabrief screens are designed to rule out delirium quickly and identify a subset of patients who require further testing.5 Our group, and others, have previously published ultrabrief screens for the general medicine, nonsurgical population and for patients with dementia.5,6 The UB-2 is an ultrabrief screen consisting of “Months of the year backward” (MOYB) and “What day of the week is it?”, which has a sensitivity of 93% and specificity of 64% in hospitalized older adults and takes less than 40 seconds to administer.5 However, no such screens for delirium have been developed for the group with relatively high cognitive and physical functioning undergoing scheduled major surgery in which delirium may present differently. Thus, the purpose of this study was to develop an ultrabrief screen for postoperative delirium using data from a large study of delirium in cognitively intact, older adults undergoing scheduled major noncardiac surgery.
METHODS
We performed a secondary data analysis on 560 patients enrolled between June 18, 2010, and August 8, 2013, in the Successful Aging After Elective Surgery (SAGES) study,7 an ongoing prospective cohort study of older adults undergoing major elective surgeries (eg, total hip or knee replacement; lumbar, cervical, or sacral laminectomy; lower extremity arterial bypass surgery; open abdominal aortic aneurysm repair; and open or laparoscopic colectomy). Exclusion criteria included evidence of dementia, delirium, prior hospitalization within 3 months, legal blindness, severe deafness, terminal condition, history of schizophrenia or psychosis, and history of alcohol abuse or withdrawal. The Institutional Review Boards of Beth Israel Deaconess Medical Center, Brigham and Women’s Hospital, and Hebrew SeniorLife, all in Boston, Massachusetts, approved the study.
SAGES Delirium Assessment and Additional Variables
The presence or absence of delirium was based on daily in-hospital assessments by trained research staff using the Confusion Assessment Method (CAM)8 long form. The Delirium Symptom Interview (DSI)9 and information related to acute changes in mental status were also included as provided by nursing staff and/or family. Delirium severity was determined using the CAM-S.10 Participants in The SAGES Study had an initial baseline, presurgical assessment in their homes. Cognitive and physical functioning, depression, comorbidities, laboratory, and self-reported demographic data were collected.
Statistical Analyses
We included CAM delirium data from postoperative days (POD) 1 and 2 for each participant, if available; postoperative day 0 was not included because of potential residual anesthetic effects. We chose these days because most delirium began on POD1 or 2, and patients started being discharged on POD3. We considered all one-, two-, and three-item combinations of the 12 cognitive items of the 3D-CAM11 because of their demonstrated high information content for CAM diagnostic features per Item Response Theory.12 There were 12 possible one-item screens, 66 two-item screens, and 220 three-item screens. Sensitivity, specificity, and 95% confidence intervals for each were compared with CAM delirium determination. An ideal ultrabrief screen for delirium has high sensitivity with moderate specificity; general guidelines considered based on investigator consensus included screens with a sensitivity higher than 0.90 and specificity greater than 0.70. Because these screens are used to quickly rule out delirium, we also present the percent positive screen among the entire population (whether delirium is present or not). Screens with a positive screen rate of more than 50% are unlikely to be helpful in ruling out delirium quickly in a large enough fraction of the population. We also required that in multiple item screens, no two items should assess the same CAM feature. For instance, we would eliminate a two-item screen with MOYB and four-digit span since both items measure CAM Feature 2 (Inattention). Finally, we evaluated screen performance separately on POD1 and POD2. Switching screens by POD can be confusing, so we chose a single best screen that retained excellent performance over both days. Data analyses used SAS version 9.4 (SAS Institute, Cary, North Carolina).
RESULTS
The dataset included 560 adults who had an average age of 76.6 years (SD = 5.2), were 58% women, and were highly educated (15.0 years; SD = 2.9; Table). Postoperative delirium occurred during one or more days in 134 individuals (24%). A total of 1,100 delirium assessments were used, with 113 that were CAM positive (10.3%). For POD1, we used 551 assessments, 61 of which were positive (11.1%); for POD2, 549 assessments were used, with 51 positive (9.3%). Appendix Tables present the positive screen rates, sensitivities, specificities, and 95% confidence intervals of all 12 one-item screens and the 12 best performing two- and three-item screens in order of decreasing sensitivity.
The best ultrabrief screen from POD1 included the following three items: “Does the patient report feeling confused?”, MOYB, and “Does the patient appear sleepy?”, with a sensitivity of 0.95 (95% CI, 0.87-0.99) and specificity of 0.73 (95% CI, 0.69-0.77). The same combination of items has a sensitivity of 0.88 (95% CI, 0.77-0.96) and a specificity of 0.70 (95% CI, 0.66-0.74) on POD2. When POD1 and POD2 are combined, the sensitivity is 0.92 (95% CI, 0.85-0.96) and specificity is 0.72 (95% CI, 0.69-0.74). We consider this to be our best screen overall.
DISCUSSION
We identified a three-item screen for delirium after elective surgery consisting of “Does the patient report feeling confused?”, MOYB, and “Does the patient appear sleepy?” In our own prior work, we identified a two-item screen consisting of MOYB and “What is the day of the week?” as the best ultrabrief screen for delirium in general medicine populations (termed the “UB-2”)5 and a subsequent screen for patients with delirium superimposed on dementia (DSD) including “What type of place is this?”, Days of the Week Backward, and “Does the patient appear sleepy?”6 All three contain a test of attention (a cardinal feature of delirium) and a test of orientation, although the specific test for that varies. Both the surgical and DSD screens include “Does the patient appear sleepy?”, which addresses a reduced level of consciousness. This might be particularly important in the postoperative setting because of residual effects of anesthesia and/or postoperative analgesic medications contributing to delirium. Work done by others confirms our current findings, which is that MOYB is the best single item for most groups. Belleli et al13 and Han et al14 included MOYB as the single attentional item in the 4AT and B-CAM, respectively. The Nu-DESC has been used as a screen in surgical patients; however, it involves only nursing observations and no direct questioning of the patient.15
The Figure describes how our “best screen” could be integrated into clinical care. One or more “positive” or incorrect responses on these three items constitutes a positive screen that should be further evaluated with the CAM or 3D-CAM. If all three items are correct or negative, this effectively rules out delirium; however, continued periodic screening on a daily (or per shift) basis is indicated. On repeat testing, if any of the previously negative or correct items becomes positive or incorrect, this would be evidence for Acute Change, CAM Feature 1. Finally, it should be noted that, if all three items in our best screen are positive, full CAM criteria for delirium diagnosis are met within the screen itself, and no further testing is required. We envision this process being facilitated by use of an app-based program that generates optimal screening items based on patient and setting characteristics.
There are several limitations that must be noted. First, our three-item screen may not generalize to nonsurgical candidates or those undergoing emergent surgery and should be tested in these groups. Second, the SAGES sample is relatively homogenous with respect to racial and ethnic diversity and was highly educated with little functional impairment and no dementia. Therefore, results may not be generalizable to populations with lower educational attainment and/or preexisting mental and physical disabilities. A third limitation is that screen items were included in the reference standard delirium assessment, leading to a potential bias toward increased sensitivity. Finally, all screens were derived from secondary data analysis and further research will be needed to prospectively validate the results. Despite these limitations, this study has several strengths including the use of a well-characterized surgical population and a rigorous approach to delirium measurement. It is one of the first studies to identify a screening tool targeted to identifying delirium in postoperative older adults.
Future research should prospectively validate our screening tool and test its implementation in a real-world clinical environment. As part of this process, clinicians should document barriers and facilitators to widespread implementation. The goal of such screens is to facilitate early identification of postoperative delirium, which will allow timely intervention to address underlying causes and prevent adverse consequences, thereby improving the outcomes of vulnerable older surgical patients.
Delirium is the most common postsurgical complication for older adults, with incidence of 15%-54%, depending on surgery type.1 Increasing numbers of older adults are undergoing surgery2; and those who develop delirium experience negative consequences including longer lengths of stay, higher likelihood of institutional discharge, and increased morbidity and mortality.3 The American Geriatrics Society Expert Panel on Postoperative Delirium in Older Adults and the European Society of Anaesthesiology4 recommend routine screening for delirium in those at risk.
Ultrabrief screens are designed to rule out delirium quickly and identify a subset of patients who require further testing.5 Our group, and others, have previously published ultrabrief screens for the general medicine, nonsurgical population and for patients with dementia.5,6 The UB-2 is an ultrabrief screen consisting of “Months of the year backward” (MOYB) and “What day of the week is it?”, which has a sensitivity of 93% and specificity of 64% in hospitalized older adults and takes less than 40 seconds to administer.5 However, no such screens for delirium have been developed for the group with relatively high cognitive and physical functioning undergoing scheduled major surgery in which delirium may present differently. Thus, the purpose of this study was to develop an ultrabrief screen for postoperative delirium using data from a large study of delirium in cognitively intact, older adults undergoing scheduled major noncardiac surgery.
METHODS
We performed a secondary data analysis on 560 patients enrolled between June 18, 2010, and August 8, 2013, in the Successful Aging After Elective Surgery (SAGES) study,7 an ongoing prospective cohort study of older adults undergoing major elective surgeries (eg, total hip or knee replacement; lumbar, cervical, or sacral laminectomy; lower extremity arterial bypass surgery; open abdominal aortic aneurysm repair; and open or laparoscopic colectomy). Exclusion criteria included evidence of dementia, delirium, prior hospitalization within 3 months, legal blindness, severe deafness, terminal condition, history of schizophrenia or psychosis, and history of alcohol abuse or withdrawal. The Institutional Review Boards of Beth Israel Deaconess Medical Center, Brigham and Women’s Hospital, and Hebrew SeniorLife, all in Boston, Massachusetts, approved the study.
SAGES Delirium Assessment and Additional Variables
The presence or absence of delirium was based on daily in-hospital assessments by trained research staff using the Confusion Assessment Method (CAM)8 long form. The Delirium Symptom Interview (DSI)9 and information related to acute changes in mental status were also included as provided by nursing staff and/or family. Delirium severity was determined using the CAM-S.10 Participants in The SAGES Study had an initial baseline, presurgical assessment in their homes. Cognitive and physical functioning, depression, comorbidities, laboratory, and self-reported demographic data were collected.
Statistical Analyses
We included CAM delirium data from postoperative days (POD) 1 and 2 for each participant, if available; postoperative day 0 was not included because of potential residual anesthetic effects. We chose these days because most delirium began on POD1 or 2, and patients started being discharged on POD3. We considered all one-, two-, and three-item combinations of the 12 cognitive items of the 3D-CAM11 because of their demonstrated high information content for CAM diagnostic features per Item Response Theory.12 There were 12 possible one-item screens, 66 two-item screens, and 220 three-item screens. Sensitivity, specificity, and 95% confidence intervals for each were compared with CAM delirium determination. An ideal ultrabrief screen for delirium has high sensitivity with moderate specificity; general guidelines considered based on investigator consensus included screens with a sensitivity higher than 0.90 and specificity greater than 0.70. Because these screens are used to quickly rule out delirium, we also present the percent positive screen among the entire population (whether delirium is present or not). Screens with a positive screen rate of more than 50% are unlikely to be helpful in ruling out delirium quickly in a large enough fraction of the population. We also required that in multiple item screens, no two items should assess the same CAM feature. For instance, we would eliminate a two-item screen with MOYB and four-digit span since both items measure CAM Feature 2 (Inattention). Finally, we evaluated screen performance separately on POD1 and POD2. Switching screens by POD can be confusing, so we chose a single best screen that retained excellent performance over both days. Data analyses used SAS version 9.4 (SAS Institute, Cary, North Carolina).
RESULTS
The dataset included 560 adults who had an average age of 76.6 years (SD = 5.2), were 58% women, and were highly educated (15.0 years; SD = 2.9; Table). Postoperative delirium occurred during one or more days in 134 individuals (24%). A total of 1,100 delirium assessments were used, with 113 that were CAM positive (10.3%). For POD1, we used 551 assessments, 61 of which were positive (11.1%); for POD2, 549 assessments were used, with 51 positive (9.3%). Appendix Tables present the positive screen rates, sensitivities, specificities, and 95% confidence intervals of all 12 one-item screens and the 12 best performing two- and three-item screens in order of decreasing sensitivity.
The best ultrabrief screen from POD1 included the following three items: “Does the patient report feeling confused?”, MOYB, and “Does the patient appear sleepy?”, with a sensitivity of 0.95 (95% CI, 0.87-0.99) and specificity of 0.73 (95% CI, 0.69-0.77). The same combination of items has a sensitivity of 0.88 (95% CI, 0.77-0.96) and a specificity of 0.70 (95% CI, 0.66-0.74) on POD2. When POD1 and POD2 are combined, the sensitivity is 0.92 (95% CI, 0.85-0.96) and specificity is 0.72 (95% CI, 0.69-0.74). We consider this to be our best screen overall.
DISCUSSION
We identified a three-item screen for delirium after elective surgery consisting of “Does the patient report feeling confused?”, MOYB, and “Does the patient appear sleepy?” In our own prior work, we identified a two-item screen consisting of MOYB and “What is the day of the week?” as the best ultrabrief screen for delirium in general medicine populations (termed the “UB-2”)5 and a subsequent screen for patients with delirium superimposed on dementia (DSD) including “What type of place is this?”, Days of the Week Backward, and “Does the patient appear sleepy?”6 All three contain a test of attention (a cardinal feature of delirium) and a test of orientation, although the specific test for that varies. Both the surgical and DSD screens include “Does the patient appear sleepy?”, which addresses a reduced level of consciousness. This might be particularly important in the postoperative setting because of residual effects of anesthesia and/or postoperative analgesic medications contributing to delirium. Work done by others confirms our current findings, which is that MOYB is the best single item for most groups. Belleli et al13 and Han et al14 included MOYB as the single attentional item in the 4AT and B-CAM, respectively. The Nu-DESC has been used as a screen in surgical patients; however, it involves only nursing observations and no direct questioning of the patient.15
The Figure describes how our “best screen” could be integrated into clinical care. One or more “positive” or incorrect responses on these three items constitutes a positive screen that should be further evaluated with the CAM or 3D-CAM. If all three items are correct or negative, this effectively rules out delirium; however, continued periodic screening on a daily (or per shift) basis is indicated. On repeat testing, if any of the previously negative or correct items becomes positive or incorrect, this would be evidence for Acute Change, CAM Feature 1. Finally, it should be noted that, if all three items in our best screen are positive, full CAM criteria for delirium diagnosis are met within the screen itself, and no further testing is required. We envision this process being facilitated by use of an app-based program that generates optimal screening items based on patient and setting characteristics.
There are several limitations that must be noted. First, our three-item screen may not generalize to nonsurgical candidates or those undergoing emergent surgery and should be tested in these groups. Second, the SAGES sample is relatively homogenous with respect to racial and ethnic diversity and was highly educated with little functional impairment and no dementia. Therefore, results may not be generalizable to populations with lower educational attainment and/or preexisting mental and physical disabilities. A third limitation is that screen items were included in the reference standard delirium assessment, leading to a potential bias toward increased sensitivity. Finally, all screens were derived from secondary data analysis and further research will be needed to prospectively validate the results. Despite these limitations, this study has several strengths including the use of a well-characterized surgical population and a rigorous approach to delirium measurement. It is one of the first studies to identify a screening tool targeted to identifying delirium in postoperative older adults.
Future research should prospectively validate our screening tool and test its implementation in a real-world clinical environment. As part of this process, clinicians should document barriers and facilitators to widespread implementation. The goal of such screens is to facilitate early identification of postoperative delirium, which will allow timely intervention to address underlying causes and prevent adverse consequences, thereby improving the outcomes of vulnerable older surgical patients.
1. Marcantonio ER. Postoperative delirium: a 76-year-old woman with delirium following surgery. JAMA. 2012;308(1):73-81. https://doi.org/10.1001/jama.2012.6857
2. Seib CD, Rochefort H, Chomsky-Higgins K, et al. Association of patient frailty with increased morbidity after common ambulatory general surgery operations. JAMA Surg. 2018;153(2):160-168. https://doi.org/10.1001/jamasurg.2017.4007
3. Gleason LJ, Schmitt EM, Kosar CM, et al. Effect of delirium and other major complications after elective surgery in older adults. JAMA Surg. 2015;150(12):1134-1140. https://doi.org/10.1001/jamasurg.2015.2606
4. Aldecoa C, Bettelli G, Bilotta F, et al. European Society of Anaesthesiology evidence-based and consensus-based guideline on postoperative delirium. Eur J Anaesthesiol. 2017;34(4):192-214. https://doi.org/10.1097/EJA.0000000000000594
5. Fick DM, Inouye SK, Guess J, et al. Preliminary development of an ultrabrief two-item bedside test for delirium. J Hosp Med. 2015;10(10):645-650. https://doi.org/10.1002/jhm.2418
6. Steensma E, Zhou W, Ngo L, et al. Ultra-brief screeners for detecting delirium superimposed on dementia. J Am Med Dir Assoc. 2019;20(11):1391-1396.e1. https://doi.org/10.1016/j.jamda.2019.05.011
7. Schmitt EM, Marcantonio ER, Alsop DC, et al. Novel risk markers and long-term outcomes of delirium: the Successful Aging after Elective Surgery (SAGES) study design and methods. J Am Med Dir Assoc. 2012;13(9):818.e1-818.e810. https://doi.org/10.1016/j.jamda.2012.08.004
8. Inouye SK, van Dyck CH, Alessi CA, Balkin S, Siegal AP, Horwitz RI. Clarifying confusion: the confusion assessment method. a new method for detection of delirium. Ann Intern Med. 1990;113(12):941-948. https://doi.org/10.7326/0003-4819-113-12-941
9. Albert MS, Levkoff SE, Reilly C, et al. The delirium symptom interview: an interview for the detection of delirium symptoms in hospitalized patients. J Geriatr Psychiatry Neurol. 1992;5(1):14-21. https://doi.org/10.1177/002383099200500103
10. Inouye SK, Kosar CM, Tommet D, et al. The CAM-S: development and validation of a new scoring system for delirium severity in 2 cohorts. Ann Intern Med. 2014;160(8):526-533. https://doi.org/10.7326/M13-1927
11. Marcantonio ER, Ngo LH, O’Connor M, et al. 3D-CAM: derivation and validation of a 3-minute diagnostic interview for CAM-defined delirium: a cross-sectional diagnostic test study. Ann Intern Med. 2014;161(8):554-561. https://doi.org/10.7326/M14-0865
12. Yang FM, Jones RN, Inouye SK, et al. Selecting optimal screening items for delirium: an application of item response theory. BMC Med Res Methodol. 2013;13(1):8. https://doi.org/10.1186/1471-2288-13-8
13. Bellelli G, Morandi A, Davis DH, et al. Validation of the 4AT, a new instrument for rapid delirium screening: a study in 234 hospitalised older people. Age Ageing. 2014;43(4):496-502. https://doi.org/10.1093/ageing/afu021
14. Han JH, Wilson A, Vasilevskis EE, et al. Diagnosing delirium in older emergency department patients: validity and reliability of the Delirium Triage Screen and the Brief Confusion Assessment Method. Ann Emerg Med. 2013;62(5):457-465. https://doi.org/10.1016/j.annemergmed.2013.05.003
15. Gaudreau JD, Gagnon P, Harel F, Tremblay A, Roy MA. Fast, systematic, and continuous delirium assessment in hospitalized patients: the nursing delirium screening scale. J Pain Symptom Manage. 2005;29(4):368-375. https://doi.org/10.1016/j.jpainsymman.2004.07.009
1. Marcantonio ER. Postoperative delirium: a 76-year-old woman with delirium following surgery. JAMA. 2012;308(1):73-81. https://doi.org/10.1001/jama.2012.6857
2. Seib CD, Rochefort H, Chomsky-Higgins K, et al. Association of patient frailty with increased morbidity after common ambulatory general surgery operations. JAMA Surg. 2018;153(2):160-168. https://doi.org/10.1001/jamasurg.2017.4007
3. Gleason LJ, Schmitt EM, Kosar CM, et al. Effect of delirium and other major complications after elective surgery in older adults. JAMA Surg. 2015;150(12):1134-1140. https://doi.org/10.1001/jamasurg.2015.2606
4. Aldecoa C, Bettelli G, Bilotta F, et al. European Society of Anaesthesiology evidence-based and consensus-based guideline on postoperative delirium. Eur J Anaesthesiol. 2017;34(4):192-214. https://doi.org/10.1097/EJA.0000000000000594
5. Fick DM, Inouye SK, Guess J, et al. Preliminary development of an ultrabrief two-item bedside test for delirium. J Hosp Med. 2015;10(10):645-650. https://doi.org/10.1002/jhm.2418
6. Steensma E, Zhou W, Ngo L, et al. Ultra-brief screeners for detecting delirium superimposed on dementia. J Am Med Dir Assoc. 2019;20(11):1391-1396.e1. https://doi.org/10.1016/j.jamda.2019.05.011
7. Schmitt EM, Marcantonio ER, Alsop DC, et al. Novel risk markers and long-term outcomes of delirium: the Successful Aging after Elective Surgery (SAGES) study design and methods. J Am Med Dir Assoc. 2012;13(9):818.e1-818.e810. https://doi.org/10.1016/j.jamda.2012.08.004
8. Inouye SK, van Dyck CH, Alessi CA, Balkin S, Siegal AP, Horwitz RI. Clarifying confusion: the confusion assessment method. a new method for detection of delirium. Ann Intern Med. 1990;113(12):941-948. https://doi.org/10.7326/0003-4819-113-12-941
9. Albert MS, Levkoff SE, Reilly C, et al. The delirium symptom interview: an interview for the detection of delirium symptoms in hospitalized patients. J Geriatr Psychiatry Neurol. 1992;5(1):14-21. https://doi.org/10.1177/002383099200500103
10. Inouye SK, Kosar CM, Tommet D, et al. The CAM-S: development and validation of a new scoring system for delirium severity in 2 cohorts. Ann Intern Med. 2014;160(8):526-533. https://doi.org/10.7326/M13-1927
11. Marcantonio ER, Ngo LH, O’Connor M, et al. 3D-CAM: derivation and validation of a 3-minute diagnostic interview for CAM-defined delirium: a cross-sectional diagnostic test study. Ann Intern Med. 2014;161(8):554-561. https://doi.org/10.7326/M14-0865
12. Yang FM, Jones RN, Inouye SK, et al. Selecting optimal screening items for delirium: an application of item response theory. BMC Med Res Methodol. 2013;13(1):8. https://doi.org/10.1186/1471-2288-13-8
13. Bellelli G, Morandi A, Davis DH, et al. Validation of the 4AT, a new instrument for rapid delirium screening: a study in 234 hospitalised older people. Age Ageing. 2014;43(4):496-502. https://doi.org/10.1093/ageing/afu021
14. Han JH, Wilson A, Vasilevskis EE, et al. Diagnosing delirium in older emergency department patients: validity and reliability of the Delirium Triage Screen and the Brief Confusion Assessment Method. Ann Emerg Med. 2013;62(5):457-465. https://doi.org/10.1016/j.annemergmed.2013.05.003
15. Gaudreau JD, Gagnon P, Harel F, Tremblay A, Roy MA. Fast, systematic, and continuous delirium assessment in hospitalized patients: the nursing delirium screening scale. J Pain Symptom Manage. 2005;29(4):368-375. https://doi.org/10.1016/j.jpainsymman.2004.07.009
© Society of Hospital Medicine