User login
Bringing you the latest news, research and reviews, exclusive interviews, podcasts, quizzes, and more.
div[contains(@class, 'header__large-screen')]
div[contains(@class, 'read-next-article')]
div[contains(@class, 'nav-primary')]
nav[contains(@class, 'nav-primary')]
section[contains(@class, 'footer-nav-section-wrapper')]
footer[@id='footer']
div[contains(@class, 'main-prefix')]
section[contains(@class, 'nav-hidden')]
div[contains(@class, 'ce-card-content')]
nav[contains(@class, 'nav-ce-stack')]
Strep A and tic worsening: Final word?
Exposure to Group A streptococcus (GAS) does not appear to worsen symptoms of Tourette syndrome and other chronic tic disorders (CTDs) in children and adolescents, new research suggests.
Investigators studied over 700 children and teenagers with CTDs, one-third of whom also had attention deficit hyperactivity disorder and one-third who had obsessive-compulsive disorder (OCD).
The youngsters were followed for an average of 16 months and evaluated at 4-month intervals to see if they were infected with GAS. Tic severity was monitored through telephone interviews, in-person visits, and parental reports.
A little less than half the children experienced worsening of tics during the study period, but the researchers found no association between these exacerbations and GAS exposure.
There was also no link between GAS and worsening OCD. However, researchers did find an association between GAS exposure and an increase in hyperactivity and impulsivity in patients with ADHD.
“This study does not support GAS exposures as contributing factors for tic exacerbations in children with CTD,” the authors note.
“Specific work-up or active management of GAS infections is unlikely to help modifying the course of tics in CTD and is therefore not recommended,” they conclude.
The study was published online in Neurology.
‘Intense debate’
The association between GAS and CTD stems from the description of Pediatric Autoimmune Neuropsychiatric Disorders Associated with Streptococcal infection (PANDAS) – a condition that is now incorporated in the pediatric acute neuropsychiatric syndromes (PANS), the authors note. Tics constitute an “accompanying feature” of this condition.
However, neither population-based nor longitudinal clinical studies “could definitely establish if tic exacerbations in CTD are associated with GAS infections,” they note.
“The link between streptococcus and tics in children is still a matter of intense debate,” said study author Davide Martino, MD, PhD, director of the Movement Disorders Program at the University of Calgary (Alta.), in a press release.
“We wanted to look at that question, as well as a possible link between strep and behavioral symptoms like obsessive-compulsive disorder and attention deficit hyperactivity disorder,” he said.
The researchers followed 715 children with CTD (mean age 10.7 years, 76.8% male) who were drawn from 16 specialist clinics in nine countries. Almost all (90.8%) had a diagnosis of Tourette syndrome (TS); 31.7% had OCD, and 36.1% had ADHD.
Participants received a throat swab at baseline, and of these, 8.4% tested positive for GAS.
Participants were evaluated over a 16- to 18-month period, consisting of:
- Face-to-face interviews and collection of throat swabs and serum at 4-month intervals.
- Telephone interviews at 4-month intervals, which took place at 2 months between study visit.
- Weekly diaries: Parents were asked to indicate any worsening of tics and focus on detecting the earliest possible tic exacerbation.
Beyond the regularly scheduled visits, parents were instructed to report, by phone or email, any noticeable increase in tic severity and then attend an in-person visit.
Tic exacerbations were defined as an increase of greater than or equal to 6 points on the Yale Global Tic Severity Scale-Total Tic Severity Score (YGTSS-TTS), compared with the previous assessment.
OCD and ADHD symptoms were assessed according to the Yale-Brown Obsessive-Compulsive Scale and the parent-reported Swanson, Nolan, and Pelham-IV (SNAP-IV) questionnaire.
The researchers divided GAS exposures into four categories: new definite exposure; new possible exposure; ongoing definite exposure; and ongoing possible exposure.
Unlikely trigger
During the follow-up period, 43.1% (n = 308) of participants experienced tic exacerbations. Of these, 218 participants experienced one exacerbation, while 90 participants experienced two, three, or four exacerbations.
The researchers did not find a significant association between GAS exposure status and tic exacerbation.
Participants who did develop a GAS-associated exacerbation (n = 49) were younger at study exit (9.63 vs. 11.4 years, P < .0001) and were more likely to be male (46/49 vs. 210/259, Fisher’s = .035), compared with participants who developed a non-GAS-associated tic exacerbation (n = 259).
Additional analyses were adjusted for sex, age at onset, exposure to psychotropic medications, exposures to antibiotics, geographical regions, and number of visits in the time interval of interest. These analyses continued to yield no significant association between new or ongoing concurrent GAS exposure episodes and tic exacerbation events.
Of the children in the study, 103 had a positive throat swab, indicating a new definite GAS exposure, whereas 46 had a positive throat swab indicating an ongoing definite exposure (n = 149 visits). Of these visits, only 20 corresponded to tic exacerbations.
There was also no association between GAS exposure and OCD symptom severity. However, it was associated with longitudinal changes (between 17% and 21%, depending on GAS exposure definition) in the severity of hyperactivity-impulsivity symptoms in children with ADHD.
“It is known that immune activation may concur with tic severity in youth with CTDs and that psychosocial stress levels may predict short-term future tic severity in these patients,” the authors write.
“Our findings suggest that GAS is unlikely to be the main trigger for immune activation in these patients,” they add.
Brick or cornerstone?
Commenting on the study for this news organization, Margo Thienemann, MD, clinical professor of psychiatry, Stanford (Calif.) University, said that in the clinic population they treat, GAS, other pathogens, and other stresses can “each be associated with PANS symptom exacerbations.”
However, these “would not be likely to cause PANS symptoms exacerbations in the vast majority of individuals, only individuals with genetic backgrounds and immunologic dysfunctions creating susceptibility,” said Dr. Thienemann, who also directs the Pediatric Acute-Onset Neuropsychiatric Syndrome (PANS) Clinic at Stanford Children’s Health. She was not involved with the study.
In an accompanying editorial, Andrea Cavanna, MD, PhD, honorary reader in neuropsychiatry, Birmingham (England) Medical School and Keith Coffman, MD, director, Tourette Syndrome Center of Excellence, Children’s Mercy Hospital, Kansas City, Mo., suggest that perhaps the “interaction of psychosocial stress and GAS infections contributes more to tic exacerbation than psychosocial stress alone.”
“Time will tell whether this study stands as another brick – a cornerstone? – in the wall that separates streptococcus from tics,” they write.
The study was supported by the European Union’s Seventh Framework Program. Dr. Martino has received honoraria for lecturing from the Movement Disorders Society, Tourette Syndrome Association of America, and Dystonia Medical Research Foundation Canada; research funding support from Dystonia Medical Research Foundation Canada, the University of Calgary (Alta.), the Michael P. Smith Family, the Owerko Foundation, Ipsen Corporate, the Parkinson Association of Alberta, and the Canadian Institutes for Health Research; and royalties from Springer-Verlag. The other authors’ disclosures are listed in the original article. Dr. Cavanna, Dr. Coffman, and Dr. Thienemann have disclosed no relevant financial relationships.
A version of this article first appeared on Medscape.com.
7 key changes: The 2021 child and adolescent immunization schedules
Each February, the Centers for Disease Control and Prevention, along with multiple professional organizations, releases an updated Recommended Child and Adolescent Immunization Schedule.
Recent years have seen fewer changes in the vaccine schedule, mostly with adjustments based on products coming on or off the market, and sometimes with slight changes in recommendations. This year is no different, with mostly minor changes in store. As most practitioners know, having quick access to the tables that accompany the recommendations is always handy. Table 1 contains the typical, recommended immunization schedule. Table 2 contains the catch-up provisions, and Table 3 provides guidance on vaccines for special circumstances and for children with specific medical conditions.
2021 childhood and adolescent immunization schedule
One update is a recommendation that patients with egg allergies who had symptoms more extensive than hives should receive the influenza vaccine in a medical setting where severe allergic reactions or anaphylaxis can be recognized and treated, with the exclusion of two specific preparations, Flublok and Flucelvax.
In regard to the live attenuated influenza vaccine (LAIV), there are several points of reinforcement. First, the nomenclature has generally been changed to “LAIV4” throughout the document because only quadrivalent preparations are available. There are specific recommendations that patients should not receive LAIV4 if they recently took antiviral medication for influenza, with “lockout” periods lasting from 2 days to 17 days, depending on the antiviral preparation used. In addition, there is an emphasis on not using LAIV4 for children younger than 2 years.
Two updates to the meningococcal group B vaccine are worth reviewing. The first is that children aged 10 years or older with complement deficiency, complement inhibitor use, or asplenia should receive a meningitis B booster dose beginning 1 year after completion of the primary series, with boosters thereafter every 2 or 3 years as long as that patient remains at greater risk. Another recommendation for patients 10 years or older is that, even if they have received a primary series of meningitis B vaccines, they should receive a booster dose in the setting of an outbreak if it has been 1 year or more since completion of their primary series.
Recommendations have generally been relaxed for tetanus prophylaxis in older children, indicating that individuals requiring tetanus prophylaxis or their 10-year tetanus booster after receipt of at least one Tdap vaccine can receive either tetanus-diphtheria toxoid or Tdap.
COVID-19 vaccines
Although childhood vaccination against COVID-19 is still currently limited to adolescents involved in clinical trials, pediatricians surely are getting peppered with questions from parents about whether they should be vaccinated and what to make of the recent reports about allergic reactions. Fortunately, there are several resources for pediatricians. First, two reports point out that true anaphylactic reactions to COVID-19 vaccines appear quite rare. The reported data on Pfizer-developed mRNA vaccine demonstrated an anaphylaxis rate of approximately 2 cases per 1 million doses administered. Among the 21 recipients who experienced anaphylaxis (out of over 11 million total doses administered), fully one third had a history of anaphylaxis episodes. The report also reviews vaccine reactions that were reported but were not classified as anaphylaxis, pointing out that when reporting vaccine reactions, we should be very careful in the nomenclature we use.
Reporting on the Moderna mRNA vaccine showed anaphylaxis rates of about 2.5 per 1 million doses, with 50% of the recipients who experienced true anaphylaxis having a history of anaphylaxis. Most of those who experienced anaphylaxis (90% in the Moderna group and 86% in the Pfizer group) exhibited symptoms of anaphylaxis within 30 minutes of receiving the vaccine. The take-home point, and the current CDC recommendation, is that many individuals, even those with a history of anaphylaxis, can still receive COVID-19 vaccines. The rates of observed anaphylaxis after COVID vaccination are far below population rates of a history of allergy or severe allergic reactions. When coupled with an estimated mortality rate of 0.5%-1% for SARS-CoV-2 disease, that CDC recommends that we encourage people, even those with severe allergies, to get vaccinated.
One clear caveat is that individuals with a history of severe anaphylaxis, and even those concerned about allergies, should be observed for a longer period after vaccination (at least 30 minutes) than the 15 minutes recommended for the general population. In addition, individuals with a specific anaphylactic reaction or severe allergic reaction to any injectable vaccine should confer with an immunologist before considering vaccination.
Another useful resource is a column published by the American Medical Association that walks through some talking points for providers when discussing whether a patient should receive COVID-19 vaccination. Advice is offered on answering patient questions about which preparation to get, what side effects to watch for, and how to report an adverse reaction. Providers are reminded to urge patients to complete whichever series they begin (get that second dose!), and that they currently should not have to pay for a vaccine. FAQ resource pages are available for patients and health care providers.
More vaccine news: HPV and influenza
Meanwhile, published vaccine reports provide evidence from the field to demonstrate the benefits of vaccination. A study published in the New England Journal of Medicine reported on the effectiveness of human papillomavirus (HPV) vaccine in a Swedish cohort. The report evaluated females aged between 10 and 30 years beginning in 2006 and followed them through 2017, comparing rates of invasive cervical cancer among the group who received one or more HPV vaccine doses with the group who receive none. Even without adjustment, the raw rate of invasive cervical cancer in the vaccinated group was half of that in the unvaccinated group. After full adjustment, some populations experienced incident rate ratios that were greater than 80% reduced. The largest reduction, and therefore the biggest benefit, was among those who received the HPV vaccine before age 17.
A report from the United States looking at the 2018-2019 influenza season demonstrated a vaccine effectiveness rate against hospitalization of 41% and 51% against any ED visit related to influenza. The authors note that there was considerable drift in the influenza A type that appeared late in the influenza season, reducing the overall effectiveness, but that the vaccine was still largely effective.
William T. Basco Jr, MD, MS, is a professor of pediatrics at the Medical University of South Carolina, Charleston, and director of the division of general pediatrics. He is an active health services researcher and has published more than 60 manuscripts in the peer-reviewed literature.
A version of this article first appeared on Medscape.com.

New cases of child COVID-19 drop for fifth straight week
The fifth consecutive week with a decline has the number of new COVID-19 cases in children at its lowest level since late October, according to a report from the American Academy of Pediatrics and the Children’s Hospital Association.
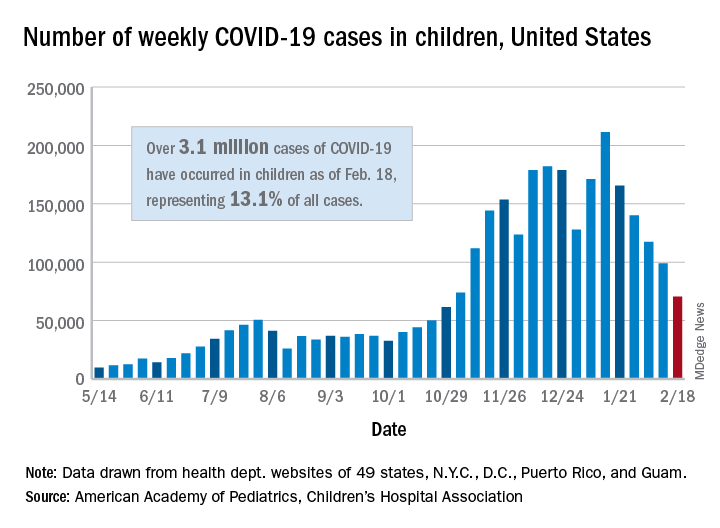
, when 61,000 cases were reported, the AAP and CHA said in their weekly COVID-19 report.
The cumulative number of COVID-19 cases in children is now just over 3.1 million, which represents 13.1% of cases among all ages in the United States, based on data gathered from the health departments of 49 states (excluding New York), the District of Columbia, New York City, Puerto Rico, and Guam.
More children in California (439,000) have been infected than in any other state, while Illinois (176,000), Florida (145,000), Tennessee (137,000), Arizona (127,000), Ohio (121,000), and Pennsylvania (111,000) are the only other states with more than 100,000 cases, the AAP/CHA report shows.
Proportionally, the children of Wyoming have been hardest hit: Pediatric cases represent 19.4% of all cases in the state. The other four states with proportions of 18% or more are Alaska, Vermont, South Carolina, and Tennessee. Cumulative rates, however, tell a somewhat different story, as North Dakota leads with just over 8,500 cases per 100,000 children, followed by Tennessee (7,700 per 100,000) and Rhode Island (7,000 per 100,000), the AAP and CHA said.
Deaths in children, which had not been following the trend of fewer new cases over the last few weeks, dropped below double digits for the first time in a month. The six deaths that occurred during the week of Feb. 12-18 bring the total to 247 since the start of the pandemic in the 43 states, along with New York City and Guam, that are reporting such data, according to the report.
The fifth consecutive week with a decline has the number of new COVID-19 cases in children at its lowest level since late October, according to a report from the American Academy of Pediatrics and the Children’s Hospital Association.
, when 61,000 cases were reported, the AAP and CHA said in their weekly COVID-19 report.
The cumulative number of COVID-19 cases in children is now just over 3.1 million, which represents 13.1% of cases among all ages in the United States, based on data gathered from the health departments of 49 states (excluding New York), the District of Columbia, New York City, Puerto Rico, and Guam.
More children in California (439,000) have been infected than in any other state, while Illinois (176,000), Florida (145,000), Tennessee (137,000), Arizona (127,000), Ohio (121,000), and Pennsylvania (111,000) are the only other states with more than 100,000 cases, the AAP/CHA report shows.
Proportionally, the children of Wyoming have been hardest hit: Pediatric cases represent 19.4% of all cases in the state. The other four states with proportions of 18% or more are Alaska, Vermont, South Carolina, and Tennessee. Cumulative rates, however, tell a somewhat different story, as North Dakota leads with just over 8,500 cases per 100,000 children, followed by Tennessee (7,700 per 100,000) and Rhode Island (7,000 per 100,000), the AAP and CHA said.
Deaths in children, which had not been following the trend of fewer new cases over the last few weeks, dropped below double digits for the first time in a month. The six deaths that occurred during the week of Feb. 12-18 bring the total to 247 since the start of the pandemic in the 43 states, along with New York City and Guam, that are reporting such data, according to the report.
Variants spur new FDA guidance on COVID vaccines, tests, drugs
The United States is currently facing three main variant threats, according to the Centers for Disease Control and Prevention: B.1.1.7, which originated in the United Kingdom; B.1.351 from South Africa; and the P.1 variant, which originated in Brazil.
Acting FDA Commissioner Janet Woodcock, MD, said on a telephone press briefing call Feb. 22 that the FDA has already been communicating with individual manufacturers as they assess the variants’ effect on their products, but these guidelines are issued for the sake of transparency and to welcome scientific input.
Tailoring may be necessary
Dr. Woodcock emphasized that, “at this time, available data suggest the FDA-authorized vaccines are effective in protecting circulating strains of SARS-CoV-2.” However, in the event the strains start to show resistance, it may be necessary to tailor the vaccine to the variant.
In that case, effectiveness of a modified vaccine should be determined by data from clinical immunogenicity studies, which would compare a recipient’s immune response with virus variants induced by the modified vaccine against the immune response to the authorized vaccine, the guidance states.
Manufacturers should also study the vaccine in both nonvaccinated people and people fully vaccinated with the authorized vaccine, according to the guidance.
Peter Marks, MD, PhD, director of the FDA’s Center for Biologics Evaluation and Research, said on the call that the clinical immunogenicity data is needed to understand, for instance, whether a new vaccine strain is able to cover the new and old strain or whether it just covers the new strain. Information is also needed to understand whether the modified vaccine, when given to someone fully vaccinated, will still promote a positive response without introducing safety concerns.
Further discussions will be necessary to decide whether future modified vaccines may be authorized without the need for clinical studies.
Variants and testing
The FDA’s updated guidance for test developers, Policy for Evaluating Impact of Viral Mutations on COVID-19 Tests, includes information that test performance can be influenced by the sequence of the variant, prevalence of the variant in the population, or design of the test. For example, molecular tests designed to detect multiple SARS-CoV-2 genetic targets are less susceptible to genetic variants than tests designed to detect a single genetic target.
The FDA already issued a safety alert on Jan. 8 to caution that genetic mutations to the virus in a patient sample can potentially change the performance of a diagnostic test. The FDA identified three tests that had been granted emergency-use authorization (EUA) that are known to be affected.
However, Dr. Woodcock said on the call, “at this time the impact does not appear to be significant.”
Updated guidance for therapeutics
The FDA has issued new guidance on the effect of variants on monoclonal antibody treatments.
“The FDA is aware that some of the monoclonal antibodies that have been authorized are less active against some of the SARS-CoV-2 variants that have emerged,” the FDA noted in its press release. “This guidance provides recommendations on efficient approaches to the generation of ... manufacturing and controls data that could potentially support an EUA for monoclonal antibody products that may be effective against emerging variants.”
While the FDA is monitoring the effects of variants, manufacturers bear a lot of the responsibility as well.
The FDA added: “With these guidances, the FDA is encouraging developers of drugs or biological products targeting SARS-CoV-2 to continuously monitor genomic databases for emerging SARS-CoV-2 variants and evaluate phenotypically any specific variants in the product target that are becoming prevalent or could potentially impact its activity.”
Dr.Woodcock added that “we urge all Americans to continue to get tested, get their vaccines when available, and follow important heath measures such as handwashing, masking, and social distancing.”
A version of this article first appeared on Medscape.com.
Oxford launches COVID-19 vaccine study in children
Oxford University is starting a COVID-19 vaccine study with children and young adults aged between 6 and 17 years.
At Oxford and three partner sites in London, Southampton, and Bristol, the phase 2 clinical trial will test whether kids and teens have a good immune response to the AstraZeneca vaccine. Previous trials have shown that the shot is safe in children.
“While most children are relatively unaffected by coronavirus and are unlikely to become unwell with the infection, it is important to establish the safety and immune response to the vaccine in children and young people as some children may benefit from vaccination,” Andrew Pollard, PhD, the chief investigator for the trial and a professor of pediatric infection and immunity at Oxford, said in a statement.
The new trial will enroll 300 volunteers, with up to 240 receiving the vaccine. The control group will receive a meningitis vaccine, which is safe in children and produces similar side effects to the COVID-19 vaccine, such as a sore arm.
COVID-19 vaccine trials have included children over age 12, so this marks the youngest group to be tested so far. Pfizer, Moderna, and Janssen have announced plans to start trials in younger children this spring, according to the Washington Post. Widespread vaccination in children likely won’t occur until 2022, the newspaper reported.
The trial launched on Feb. 12, and the first vaccinations are expected by the end of the month. Parents can visit Oxford’s COVID-19 Vaccine Trial website to sign their children up for the study.
“This study will play an important role in helping to protect children in the future,” Grace Li, a pediatric clinical research fellow for the Oxford Vaccine Group, said in the statement.
“We’ve already seen that the vaccine is safe and effective in adults, and our understanding of how children are affected by the coronavirus continues to evolve,” she said.
A version of this article first appeared on WebMD.com.
Influenza-related maternal morbidity has more than doubled over 15 years
Despite slightly decreasing numbers of pregnant women hospitalized with influenza, the rate of morbidity among those who do have influenza has substantially increased from 2000 to 2015, likely due in part to an increase in comorbidities.
, according to findings from a new study presented at the Pregnancy Meeting, sponsored by the Society for Maternal-Fetal Medicine.
Pregnant women were also at substantially greater risk of sepsis or shock, needing mechanical ventilation, and acute respiratory distress syndrome. In fact, rates of overall severe maternal morbidity and of influenza-related complications have increased in maternal patients with influenza by more than 200% from 2000 to 2015.
“It was striking to see how the rate of delivery hospitalizations complicated by influenza has remained relatively stable with a small decline, but the rates of severe maternal morbidity were increasing and so markedly among those with influenza,” Timothy Wen, MD, MPH, a maternal-fetal medicine clinical fellow at the University of California, San Francisco, said in an interview. “The findings suggest that influenza may either be a contributor to rising rates of severe maternal morbidity or synergistically amplifying existing comorbidities to worsen outcomes,” he said during his presentation.
The increased risk of influenza complications in pregnant women became particularly apparent during the 2009-2010 H1N1 influenza pandemic. “Physiologic and immunologic changes predispose pregnant patients to higher risk for complications such as pneumonia, intensive care unit admission, and inpatient mortality,” Dr. Wen told attendees. But data have been scarce since H1N1.
The researchers conducted a cross-sectional analysis of delivery hospitalizations from 2000 to 2015 using the Nationwide Inpatient Sample, which includes about 20% of all U.S. inpatient hospitalizations from all payers. They looked at all maternal patients aged 15-54 who had a diagnosis of influenza. In looking at potential associations between influenza and morbidity, they adjusted their calculations for maternal age, payer status, median income, and race/ethnicity as well as the hospital factors of location, teaching status, and region. They also adjusted for a dozen clinical factors.
Of 62.7 million hospitalizations, 0.67% involved severe maternal mortality, including the following influenza complications:
- 0.02% with shock/sepsis.
- 0.01% needing mechanical ventilation.
- 0.04% with acute respiratory distress syndrome.
The 182,228 patients with influenza represented a rate of 29 cases per 10,000 deliveries, and 2.09% of them involved severe maternal morbidity, compared to severe maternal morbidity in just 0.66% of deliveries without influenza.
When looking specifically at rates of shock/sepsis, mechanical ventilation, and acute respiratory distress syndrome, the data revealed similar trends, with substantially higher proportions of patients with influenza experiencing these complications compared to maternal patients without influenza. For example, 0.3% of patients with influenza developed shock/sepsis whereas only 0.04% of patients without influenza did. Acute respiratory distress syndrome was similarly more common in patients with flu (0.45% vs. 0.04%), as was the need for mechanical ventilation (0.09% vs. 0.01%).
During the 15-year study period, the rate of maternal hospitalizations with influenza infections declined about 1.5%, from 30 to 24 per 10,000 deliveries. But trends with severe maternal morbidity in patients with influenza went in the other direction, increasing more than 200% over 15 years, from 100 to 342 cases of severe maternal morbidity per 10,000 patients with influenza. An increase also occurred in patients without influenza, but it was more modest, a nearly 50% increase, from 53 to 79 cases per 10,000 hospitalizations.
From year to year, severe maternal morbidity increased 5.3% annually among hospitalizations with influenza – more than twice the rate of a 2.4% annual increase among hospitalizations without influenza.
The researchers found that influenza is linked to twice the risk of severe maternal morbidity (adjusted risk ratio [aRR] = 2.08, P < .01). There were similarly higher risks with influenza of sepsis/shock (aRR = 3.23), mechanical ventilation (aRR = 6.04), and acute respiratory distress syndrome (aRR = 5.76; all P < .01).
Among the possible reasons for the increase in influenza morbidity – despite a decrease in influenza infections in this population – is the increase in the medical complexity of the patient population, Dr. Wen said.
“Patients who are getting pregnant today likely have more comorbid conditions (chronic hypertension, obesity, pregestational diabetes mellitus, etc.) than they did decades prior,” Dr. Wen said. “Clinically, it means that we have a baseline patient population at a higher risk of susceptibility for influenza and its complications.”
Maternal influenza immunization rates have meanwhile stagnated, Dr. Wen added. Influenza “is something that we know is preventable, or at least mitigated, by a vaccine,” he said. “Our results serve as a reminder for clinicians to continue counseling on the importance of influenza vaccination among pregnant patients, and even in those who are planning to become pregnant.”
He said these findings suggest the need for a low threshold for treating pregnant patients who have influenza symptoms with over-the-counter therapies or closely monitoring them.
Adetola Louis-Jacques, MD, of the University of South Florida, Tampa, found the increase in morbidity in those with flu particularly unexpected and concerning.

“What surprised me was the big difference in how severe maternal morbidity rates increased over time in the influenza group compared to the group without influenza,” Dr. Louis-Jacques, who moderated the session, said in an interview. She agreed with Dr. Wen that the findings underscore the benefits of immunization.
“The study means we should reinforce to mothers how important the vaccine is. It’s critical,” Dr. Louis-Jacques said. “We should encourage mothers to get it and focus on educating women, trying to understand and allay [any concerns about the vaccine] and reinforce the importance of flu vaccination to decrease the likelihood of these mothers getting pretty sick during pregnancy.”
Dr. Wen and Dr. Louis-Jacques had no disclosures.
Despite slightly decreasing numbers of pregnant women hospitalized with influenza, the rate of morbidity among those who do have influenza has substantially increased from 2000 to 2015, likely due in part to an increase in comorbidities.
, according to findings from a new study presented at the Pregnancy Meeting, sponsored by the Society for Maternal-Fetal Medicine.
Pregnant women were also at substantially greater risk of sepsis or shock, needing mechanical ventilation, and acute respiratory distress syndrome. In fact, rates of overall severe maternal morbidity and of influenza-related complications have increased in maternal patients with influenza by more than 200% from 2000 to 2015.
“It was striking to see how the rate of delivery hospitalizations complicated by influenza has remained relatively stable with a small decline, but the rates of severe maternal morbidity were increasing and so markedly among those with influenza,” Timothy Wen, MD, MPH, a maternal-fetal medicine clinical fellow at the University of California, San Francisco, said in an interview. “The findings suggest that influenza may either be a contributor to rising rates of severe maternal morbidity or synergistically amplifying existing comorbidities to worsen outcomes,” he said during his presentation.
The increased risk of influenza complications in pregnant women became particularly apparent during the 2009-2010 H1N1 influenza pandemic. “Physiologic and immunologic changes predispose pregnant patients to higher risk for complications such as pneumonia, intensive care unit admission, and inpatient mortality,” Dr. Wen told attendees. But data have been scarce since H1N1.
The researchers conducted a cross-sectional analysis of delivery hospitalizations from 2000 to 2015 using the Nationwide Inpatient Sample, which includes about 20% of all U.S. inpatient hospitalizations from all payers. They looked at all maternal patients aged 15-54 who had a diagnosis of influenza. In looking at potential associations between influenza and morbidity, they adjusted their calculations for maternal age, payer status, median income, and race/ethnicity as well as the hospital factors of location, teaching status, and region. They also adjusted for a dozen clinical factors.
Of 62.7 million hospitalizations, 0.67% involved severe maternal mortality, including the following influenza complications:
- 0.02% with shock/sepsis.
- 0.01% needing mechanical ventilation.
- 0.04% with acute respiratory distress syndrome.
The 182,228 patients with influenza represented a rate of 29 cases per 10,000 deliveries, and 2.09% of them involved severe maternal morbidity, compared to severe maternal morbidity in just 0.66% of deliveries without influenza.
When looking specifically at rates of shock/sepsis, mechanical ventilation, and acute respiratory distress syndrome, the data revealed similar trends, with substantially higher proportions of patients with influenza experiencing these complications compared to maternal patients without influenza. For example, 0.3% of patients with influenza developed shock/sepsis whereas only 0.04% of patients without influenza did. Acute respiratory distress syndrome was similarly more common in patients with flu (0.45% vs. 0.04%), as was the need for mechanical ventilation (0.09% vs. 0.01%).
During the 15-year study period, the rate of maternal hospitalizations with influenza infections declined about 1.5%, from 30 to 24 per 10,000 deliveries. But trends with severe maternal morbidity in patients with influenza went in the other direction, increasing more than 200% over 15 years, from 100 to 342 cases of severe maternal morbidity per 10,000 patients with influenza. An increase also occurred in patients without influenza, but it was more modest, a nearly 50% increase, from 53 to 79 cases per 10,000 hospitalizations.
From year to year, severe maternal morbidity increased 5.3% annually among hospitalizations with influenza – more than twice the rate of a 2.4% annual increase among hospitalizations without influenza.
The researchers found that influenza is linked to twice the risk of severe maternal morbidity (adjusted risk ratio [aRR] = 2.08, P < .01). There were similarly higher risks with influenza of sepsis/shock (aRR = 3.23), mechanical ventilation (aRR = 6.04), and acute respiratory distress syndrome (aRR = 5.76; all P < .01).
Among the possible reasons for the increase in influenza morbidity – despite a decrease in influenza infections in this population – is the increase in the medical complexity of the patient population, Dr. Wen said.
“Patients who are getting pregnant today likely have more comorbid conditions (chronic hypertension, obesity, pregestational diabetes mellitus, etc.) than they did decades prior,” Dr. Wen said. “Clinically, it means that we have a baseline patient population at a higher risk of susceptibility for influenza and its complications.”
Maternal influenza immunization rates have meanwhile stagnated, Dr. Wen added. Influenza “is something that we know is preventable, or at least mitigated, by a vaccine,” he said. “Our results serve as a reminder for clinicians to continue counseling on the importance of influenza vaccination among pregnant patients, and even in those who are planning to become pregnant.”
He said these findings suggest the need for a low threshold for treating pregnant patients who have influenza symptoms with over-the-counter therapies or closely monitoring them.
Adetola Louis-Jacques, MD, of the University of South Florida, Tampa, found the increase in morbidity in those with flu particularly unexpected and concerning.
“What surprised me was the big difference in how severe maternal morbidity rates increased over time in the influenza group compared to the group without influenza,” Dr. Louis-Jacques, who moderated the session, said in an interview. She agreed with Dr. Wen that the findings underscore the benefits of immunization.
“The study means we should reinforce to mothers how important the vaccine is. It’s critical,” Dr. Louis-Jacques said. “We should encourage mothers to get it and focus on educating women, trying to understand and allay [any concerns about the vaccine] and reinforce the importance of flu vaccination to decrease the likelihood of these mothers getting pretty sick during pregnancy.”
Dr. Wen and Dr. Louis-Jacques had no disclosures.
FROM THE PREGNANCY MEETING

Roots of physician burnout: It’s the work load
Work load, not personal vulnerability, may be at the root of the current physician burnout crisis, a recent study has concluded.

The cutting-edge research utilized cognitive theory and work load analysis to get at the source of burnout among practitioners. The findings indicate that, although some institutions continue to emphasize personal responsibility of physicians to address the issue, it may be the amount and structure of the work itself that triggers burnout in doctors.
“We evaluated the cognitive load of a clinical workday in a national sample of U.S. physicians and its relationship with burnout and professional satisfaction,” wrote Elizabeth Harry, MD, SFHM, a hospitalist at the University of Colorado at Denver, Aurora and coauthors. The results were reported in the Joint Commission Journal on Quality and Patient Safety.
The researchers investigated whether task load correlated with burnout scores in a large national study of U.S. physicians from October 2017 to March 2018.
As the delivery of health care becomes more complex, physicians are charged with ever-increasing amount of administrative and cognitive tasks. Recent evidence indicates that this growing complexity of work is tied to a greater risk of burnout in physicians, compared with workers in other fields. Cognitive load theory, pioneered by psychologist Jonathan Sweller, identified limitations in working memory that humans depend on to carry out cognitive tasks. Cognitive load refers to the amount of working memory used, which can be reduced in the presence of external emotional or physiological stressors. While a potential link between cognitive load and burnout may seem self-evident, the correlation between the cognitive load of physicians and burnout has not been evaluated in a large-scale study until recently.
Physician task load (PTL) was measured using the National Aeronautics and Space Administration Task Load Index (NASA-TLX), a validated questionnaire frequently used to evaluate the cognitive load of work environments, including health care environments. Four domains (perception of effort and mental, physical, and temporal demands) were used to calculate the total PTL score.
Burnout was evaluated using the Emotional Exhaustion and Depersonalization scales of the Maslach Burnout Inventory, a validated tool considered the gold standard for measurement.
The survey sample consisted of physicians of all specialties and was assembled using the American Medical Association Physician Masterfile, an almost complete record of all U.S. physicians independent of AMA membership. All responses were anonymous and participation was voluntary.
Results
Among 30,456 physicians who received the survey, 5,197 (17.1%) responded. In total, 5,276 physicians were included in the analysis.
The median age of respondents was 53 years, and 61.8% self-identified as male. Twenty-four specialties were identified: 23.8% were from a primary care discipline and internal medicine represented the largest respondent group (12.1%).
Almost half of respondents (49.7%) worked in private practice, and 44.8% had been in practice for 21 years or longer.
Overall, 44.0% had at least one symptom of burnout, 38.8% of participants scored in the high range for emotional exhaustion, and 27.4% scored in the high range for depersonalization. The mean score in task load dimension varied by specialty.
The mean PTL score was 260.9 (standard deviation, 71.4). The specialties with the highest PTL score were emergency medicine (369.8), urology (353.7), general surgery subspecialties (343.9), internal medicine subspecialties (342.2), and radiology (341.6).
Aside from specialty, PTL scores also varied by practice setting, gender, age, number of hours worked per week, number of nights on call per week, and years in practice.
The researchers observed a dose response relationship between PTL and risk of burnout. For every 40-point (10%) reduction in PTL, there was 33% lower odds of experiencing burnout (odds ratio, 0.67; 95% confidence interval, 0.65-0.70; P < .0001). Multivariable analyses also indicated that PTL was a significant predictor of burnout, independent of practice setting, specialty, age, gender, and hours worked.
Organizational strategies to reduce physician burnout
Coauthors of the study, Tait D. Shanafelt, MD, professor of medicine at Stanford (Calif.) University and Colin P. West, MD, PhD, of the Mayo Clinic in Rochester, Minn., are both experts on physician well-being and are passionate about finding new ways to reduce physician distress and improving health care delivery.

“Authentic efforts to address this problem must move beyond personal resilience,” Dr. Shanafelt said in an interview. “Organizations that fail to get serious about this issue are going to be left behind and struggle in the war for talent.
“Much like our efforts to improve quality, advancing clinician well-being requires organizations to make it a priority and establish the structure, process, and leadership to promote the desired outcomes,” said Dr. Shanafelt.
One potential strategy for improvement is appointing a chief wellness officer, a dedicated individual within the health care system that leads the organizational effort, explained Dr. Shanafelt. “Over 30 vanguard institutions across the United States have already taken this step.”
Dr. West, a coauthor of the study, explained that conducting an analysis of PTL is fairly straightforward for hospitals and individual institutions. “The NASA-TLX tool is widely available, free to use, and not overly complex, and it could be used to provide insight into physician effort and mental, physical, and temporal demand levels,” he said in an interview.

“Deeper evaluations could follow to identify specific potential solutions, particularly system-level approaches to alleviate PTL,” Dr. West explained. “In the short term, such analyses and solutions would have costs, but helping physicians work more optimally and with less chronic strain from excessive task load would save far more than these costs overall.”
Dr. West also noted that physician burnout is very expensive to a health care system, and strategies to promote physician well-being would be a prudent financial decision long term for health care organizations.
Dr. Harry, lead author of the study, agreed with Dr. West, noting that “quality improvement literature has demonstrated that improvements in inefficiencies that lead to increased demand in the workplace often has the benefit of reduced cost.
“Many studies have demonstrated the risk of turnover due to burnout and the significant cost of physician turn over,” she said in an interview. “This cost avoidance is well worth the investment in improved operations to minimize unnecessary task load.”
Dr. Harry also recommended the NASA-TLX tool as a free resource for health systems and organizations. She noted that future studies will further validate the reliability of the tool.
“At the core, we need to focus on system redesign at both the micro and the macro level,” Dr. Harry said. “Each health system will need to assess inefficiencies in their work flow, while regulatory bodies need to consider the downstream task load of mandates and reporting requirements, all of which contribute to more cognitive load.”
The study was supported by funding from the Stanford Medicine WellMD Center, the American Medical Association, and the Mayo Clinic department of medicine program on physician well-being. Coauthors Lotte N. Dyrbye, MD, and Dr. Shanafelt are coinventors of the Physician Well-being Index, Medical Student Well-Being Index, Nurse Well-Being, and Well-Being Index. Mayo Clinic holds the copyright to these instruments and has licensed them for external use. Dr. Dyrbye and Dr. Shanafelt receive a portion of any royalties paid to Mayo Clinic. All other authors reported no conflicts of interest.
Work load, not personal vulnerability, may be at the root of the current physician burnout crisis, a recent study has concluded.
The cutting-edge research utilized cognitive theory and work load analysis to get at the source of burnout among practitioners. The findings indicate that, although some institutions continue to emphasize personal responsibility of physicians to address the issue, it may be the amount and structure of the work itself that triggers burnout in doctors.
“We evaluated the cognitive load of a clinical workday in a national sample of U.S. physicians and its relationship with burnout and professional satisfaction,” wrote Elizabeth Harry, MD, SFHM, a hospitalist at the University of Colorado at Denver, Aurora and coauthors. The results were reported in the Joint Commission Journal on Quality and Patient Safety.
The researchers investigated whether task load correlated with burnout scores in a large national study of U.S. physicians from October 2017 to March 2018.
As the delivery of health care becomes more complex, physicians are charged with ever-increasing amount of administrative and cognitive tasks. Recent evidence indicates that this growing complexity of work is tied to a greater risk of burnout in physicians, compared with workers in other fields. Cognitive load theory, pioneered by psychologist Jonathan Sweller, identified limitations in working memory that humans depend on to carry out cognitive tasks. Cognitive load refers to the amount of working memory used, which can be reduced in the presence of external emotional or physiological stressors. While a potential link between cognitive load and burnout may seem self-evident, the correlation between the cognitive load of physicians and burnout has not been evaluated in a large-scale study until recently.
Physician task load (PTL) was measured using the National Aeronautics and Space Administration Task Load Index (NASA-TLX), a validated questionnaire frequently used to evaluate the cognitive load of work environments, including health care environments. Four domains (perception of effort and mental, physical, and temporal demands) were used to calculate the total PTL score.
Burnout was evaluated using the Emotional Exhaustion and Depersonalization scales of the Maslach Burnout Inventory, a validated tool considered the gold standard for measurement.
The survey sample consisted of physicians of all specialties and was assembled using the American Medical Association Physician Masterfile, an almost complete record of all U.S. physicians independent of AMA membership. All responses were anonymous and participation was voluntary.
Results
Among 30,456 physicians who received the survey, 5,197 (17.1%) responded. In total, 5,276 physicians were included in the analysis.
The median age of respondents was 53 years, and 61.8% self-identified as male. Twenty-four specialties were identified: 23.8% were from a primary care discipline and internal medicine represented the largest respondent group (12.1%).
Almost half of respondents (49.7%) worked in private practice, and 44.8% had been in practice for 21 years or longer.
Overall, 44.0% had at least one symptom of burnout, 38.8% of participants scored in the high range for emotional exhaustion, and 27.4% scored in the high range for depersonalization. The mean score in task load dimension varied by specialty.
The mean PTL score was 260.9 (standard deviation, 71.4). The specialties with the highest PTL score were emergency medicine (369.8), urology (353.7), general surgery subspecialties (343.9), internal medicine subspecialties (342.2), and radiology (341.6).
Aside from specialty, PTL scores also varied by practice setting, gender, age, number of hours worked per week, number of nights on call per week, and years in practice.
The researchers observed a dose response relationship between PTL and risk of burnout. For every 40-point (10%) reduction in PTL, there was 33% lower odds of experiencing burnout (odds ratio, 0.67; 95% confidence interval, 0.65-0.70; P < .0001). Multivariable analyses also indicated that PTL was a significant predictor of burnout, independent of practice setting, specialty, age, gender, and hours worked.
Organizational strategies to reduce physician burnout
Coauthors of the study, Tait D. Shanafelt, MD, professor of medicine at Stanford (Calif.) University and Colin P. West, MD, PhD, of the Mayo Clinic in Rochester, Minn., are both experts on physician well-being and are passionate about finding new ways to reduce physician distress and improving health care delivery.
“Authentic efforts to address this problem must move beyond personal resilience,” Dr. Shanafelt said in an interview. “Organizations that fail to get serious about this issue are going to be left behind and struggle in the war for talent.
“Much like our efforts to improve quality, advancing clinician well-being requires organizations to make it a priority and establish the structure, process, and leadership to promote the desired outcomes,” said Dr. Shanafelt.
One potential strategy for improvement is appointing a chief wellness officer, a dedicated individual within the health care system that leads the organizational effort, explained Dr. Shanafelt. “Over 30 vanguard institutions across the United States have already taken this step.”
Dr. West, a coauthor of the study, explained that conducting an analysis of PTL is fairly straightforward for hospitals and individual institutions. “The NASA-TLX tool is widely available, free to use, and not overly complex, and it could be used to provide insight into physician effort and mental, physical, and temporal demand levels,” he said in an interview.
“Deeper evaluations could follow to identify specific potential solutions, particularly system-level approaches to alleviate PTL,” Dr. West explained. “In the short term, such analyses and solutions would have costs, but helping physicians work more optimally and with less chronic strain from excessive task load would save far more than these costs overall.”
Dr. West also noted that physician burnout is very expensive to a health care system, and strategies to promote physician well-being would be a prudent financial decision long term for health care organizations.
Dr. Harry, lead author of the study, agreed with Dr. West, noting that “quality improvement literature has demonstrated that improvements in inefficiencies that lead to increased demand in the workplace often has the benefit of reduced cost.
“Many studies have demonstrated the risk of turnover due to burnout and the significant cost of physician turn over,” she said in an interview. “This cost avoidance is well worth the investment in improved operations to minimize unnecessary task load.”
Dr. Harry also recommended the NASA-TLX tool as a free resource for health systems and organizations. She noted that future studies will further validate the reliability of the tool.
“At the core, we need to focus on system redesign at both the micro and the macro level,” Dr. Harry said. “Each health system will need to assess inefficiencies in their work flow, while regulatory bodies need to consider the downstream task load of mandates and reporting requirements, all of which contribute to more cognitive load.”
The study was supported by funding from the Stanford Medicine WellMD Center, the American Medical Association, and the Mayo Clinic department of medicine program on physician well-being. Coauthors Lotte N. Dyrbye, MD, and Dr. Shanafelt are coinventors of the Physician Well-being Index, Medical Student Well-Being Index, Nurse Well-Being, and Well-Being Index. Mayo Clinic holds the copyright to these instruments and has licensed them for external use. Dr. Dyrbye and Dr. Shanafelt receive a portion of any royalties paid to Mayo Clinic. All other authors reported no conflicts of interest.
FROM THE JOINT COMMISSION JOURNAL ON QUALITY AND PATIENT SAFETY
CDC chief lays out attack plan for COVID variants
earlier this week.
As part of JAMA’s Q&A series with JAMA editor in chief Howard Bauchner, MD, Dr. Walensky referenced the blueprint she coathored with Anthony Fauci, MD, the nation’s top infectious disease expert, and Henry T. Walke, MD, MPH, of the CDC, which was published on Feb. 17 in JAMA.
In the viewpoint article, they explain that the Department of Health & Human Services has established the SARS-CoV-2 Interagency Group to improve coordination among the CDC, the National Institutes of Health, the Food and Drug Administration, the Biomedical Advanced Research and Development Authority, the Department of Agriculture, and the Department of Defense.
Dr. Walensky said the first objective is to reinforce vigilance regarding public health mitigation strategies to decrease the amount of virus that’s circulating.
As part of that strategy, she said, the CDC strongly urges against nonessential travel.
In addition, public health leaders are working on a surveillance system to better understand the SARS-CoV-2 variants. That will take ramping up genome sequencing of the SARS-CoV-2 virus and ensuring that sampling is geographically representative.
She said the CDC is partnering with state health labs to obtain about 750 samples every week and is teaming up with commercial labs and academic centers to obtain an interim target of 6,000 samples per week.
She acknowledged the United States “is not where we need to be” with sequencing but has come a long way since January. At that time, they were sequencing 250 samples every week; they are currently sequencing thousands each week.
Data analysis is another concern: “We need to be able to understand at the basic science level what the information means,” Dr. Walensky said.
Researchers aren’t sure how the variants might affect use of convalescent plasma or monoclonal antibody treatments. It is expected that 5% of persons who are vaccinated against COVID-19 will nevertheless contract the disease. Sequencing will help answer whether such persons who have been vaccinated and who subsequently contract the virus are among those 5% or whether have been infected by a variant that evades the vaccine.
Accelerating vaccine administration globally and in the United States is essential, Dr. Walensky said.
As of Feb. 17, 56 million doses had been administered in the United States.
Top three threats
She updated the numbers on the three biggest variant threats.
Regarding B.1.1.7, which originated in the United Kingdom, she said: “So far, we’ve had over 1,200 cases in 41 states.” She noted that the variant is likely to be about 50% more transmissible and 30% to 50% more virulent.
“So far, it looks like that strain doesn’t have any real decrease in susceptibility to our vaccines,” she said.
The strain from South Africa (B.1.351) has been found in 19 cases in the United States.
The P.1. variant, which originated in Brazil, has been identified in two cases in two states.
Outlook for March and April
Dr. Bauchner asked Dr. Walensky what she envisions for March and April. He noted that public optimism is high in light of the continued reductions in COVID-19 case numbers, hospitalizations, and deaths, as well as the fact that warmer weather is coming and that more vaccinations are on the horizon.
“While I really am hopeful for what could happen in March and April,” Dr. Walensky said, “I really do know that this could go bad so fast. We saw it in November. We saw it in December.”
CDC models have projected that, by March, the more transmissible B.1.1.7 strain is likely to be the dominant strain, she reiterated.
“I worry that it will be spring, and we will all have had enough,” Dr. Walensky said. She noted that some states are already relaxing mask mandates.
“Around that time, life will look and feel a little better, and the motivation for those who might be vaccine hesitant may be diminished,” she said.
Dr. Bauchner also asked her to weigh in on whether a third vaccine, from Johnson & Johnson (J&J), may soon gain FDA emergency-use authorization – and whether its lower expected efficacy rate may result in a tiered system of vaccinations, with higher-risk populations receiving the more efficacious vaccines.
Dr. Walensky said more data are needed before that question can be answered.
“It may very well be that the data point us to the best populations in which to use this vaccine,” she said.
In phase 3 data, the J&J vaccine was shown to be 72% effective in the United States for moderate to severe disease.
Dr. Walensky said it’s important to remember that the projected efficacy for that vaccine is higher than that for the flu shot as well as many other vaccines currently in use for other diseases.
She said it also has several advantages. The vaccine has less-stringent storage requirements, requires just one dose, and protects against hospitalization and death, although it’s less efficacious in protecting against contracting the disease.
“I think many people would opt to get that one if they could get it sooner,” she said.
A version of this article first appeared on Medscape.com.
Alien cells may explain COVID-19 brain fog
, a new report suggests.
The authors report five separate post-mortem cases from patients who died with COVID-19 in which large cells resembling megakaryocytes were identified in cortical capillaries. Immunohistochemistry subsequently confirmed their megakaryocyte identity.
They point out that the finding is of interest as – to their knowledge – megakaryocytes have not been found in the brain before.
The observations are described in a research letter published online Feb. 12 in JAMA Neurology.
Bone marrow cells in the brain
Lead author David Nauen, MD, PhD, a neuropathologist from Johns Hopkins University, Baltimore, reported that he identified these cells in the first analysis of post-mortem brain tissue from a patient who had COVID-19.
“Some other viruses cause changes in the brain such as encephalopathy, and as neurologic symptoms are often reported in COVID-19, I was curious to see if similar effects were seen in brain post-mortem samples from patients who had died with the infection,” Dr. Nauen said.
On his first analysis of the brain tissue of a patient who had COVID-19, Dr. Nauen saw no evidence of viral encephalitis, but he observed some “unusually large” cells in the brain capillaries.
“I was taken aback; I couldn’t figure out what they were. Then I realized these cells were megakaryocytes from the bone marrow. I have never seen these cells in the brain before. I asked several colleagues and none of them had either. After extensive literature searches, I could find no evidence of megakaryocytes being in the brain,” Dr. Nauen noted.
Megakaryocytes, he explained, are “very large cells, and the brain capillaries are very small – just large enough to let red blood cells and lymphocytes pass through. To see these very large cells in such vessels is extremely unusual. It looks like they are causing occlusions.”
By occluding flow through individual capillaries, these large cells could cause ischemic alteration in a distinct pattern, potentially resulting in an atypical form of neurologic impairment, the authors suggest.
“This might alter the hemodynamics and put pressure on other vessels, possibly contributing to the increased risk of stroke that has been reported in COVID-19,” Dr. Nauen said. None of the samples he examined came from patients with COVID-19 who had had a stroke, he reported.
Other than the presence of megakaryocytes in the capillaries, the brain looked normal, he said. He has now examined samples from 15 brains of patients who had COVID-19 and megakaryocytes have been found in the brain capillaries in five cases.
New neurologic complication
Classic encephalitis found with other viruses has not been reported in brain post-mortem examinations from patients who had COVID-19, Dr. Nauen noted. “The cognitive issues such as grogginess associated with COVID-19 would indicate problems with the cortex but that hasn’t been documented. This occlusion of a multitude of tiny vessels by megalokaryocytes may offer some explanation of the cognitive issues. This is a new kind of vascular insult seen on pathology, and suggests a new kind of neurologic complication,” he added.
The big question is what these megakaryocytes are doing in the brain.
“Megakaryocytes are bone marrow cells. They are not immune cells. Their job is to produce platelets to help the blood clot. They are not normally found outside the bone marrow, but they have been reported in other organs in COVID-19 patients.
“But the big puzzle associated with finding them in the brain is how they get through the very fine network of blood vessels in the lungs. The geometry just doesn’t work. We don’t know which part of the COVID inflammatory response makes this happen,” said Dr. Nauen.
The authors suggest one possibility is that altered endothelial or other signaling is recruiting megakaryocytes into the circulation and somehow permitting them to pass through the lungs.
“We need to try and understand if there is anything distinctive about these megakaryocytes – which proteins are they expressing that may explain why they are behaving in such an unusual way,” said Dr. Nauen.
Noting that many patients with severe COVID-19 have problems with clotting, and megakaryocytes are part of the clotting system, he speculated that some sort of aberrant message is being sent to these cells.
“It is notable that we found megakaryocytes in cortical capillaries in 33% of cases examined. Because the standard brain autopsy sections taken sampled at random [are] only a minute portion of the cortical volume, finding these cells suggests the total burden could be considerable,” the authors wrote.
Dr. Nauen added that to his knowledge, this is the first report of such observations, and the next step is to look for similar findings in larger sample sizes.
A version of this article first appeared on Medscape.com.
FROM JAMA NEUROLOGY
Dried blood spot tests show sensitivity as cCMV screen
Dried blood spot testing showed sensitivity comparable to saliva as a screening method for congenital cytomegalovirus infection in newborns, based on data from more than 12,000 newborns.
Congenital cytomegalovirus (cCMV) is a common congenital virus in the United States, but remains underrecognized, wrote Sheila C. Dollard, PhD, of the Centers for Disease Control and Prevention in Atlanta, and colleagues.
“Given the burden associated with cCMV and the proven benefits of treatment and early intervention for some affected infants, there has been growing interest in universal newborn screening,” but an ideal screening strategy has yet to be determined, they said.
In a population-based cohort study published in JAMA Pediatrics, the researchers screened 12,554 newborns in Minnesota, including 56 with confirmed CMV infection. The newborns were screened for cCMV via dried blood spots (DBS) and saliva collected 1-2 days after birth. The DBS were tested for CMV DNA via polymerase chain reaction (PCR) at the University of Minnesota (UMN) and the CDC.
The overall sensitivity rate was 85.7% for a combination of laboratory results from the UMN and the CDC, which had separate sensitivities of 73.2% and 76.8%, respectively.
The specificity of the combined results was 100.0% (100% from both UMN and CDC), the combined positive predictive value was 98.0% (100.0% from UMN, 97.7% from CDC), and the combined negative predictive value was 99.9% (99.9% from both UMN and CDC).
By comparison, saliva swab test results showed sensitivity of 92.9%, specificity of 99.9%, positive predictive value of 86.7%, and negative predictive value of 100.0%.
The study findings were limited by several factors including the false-positive and false-negative results from saliva screening. Overall, the false-positive rate was 0.06%, which is comparable to rates from other screening techniques, the researchers said. “The recent Food and Drug Administration approval of a point-of-care neonatal saliva CMV test (Meridian Bioscience), underscores the importance of further clarifying the role of false-positive saliva CMV test results and underscores the requirement for urine confirmation for diagnosis of cCMV,” they added.
However, the study findings support the acceptability and feasibility of cCMV screening, as parents reported generally positive attitudes about the process, the researchers said.
The study is ongoing, and designed to follow infants with confirmed cCMV for up to age 4 years to assess clinical outcomes, they added. “Diagnostic methods are always improving, and therefore, our results show the potential of DBS to provide low-cost CMV screening with smooth integration of sample collection, laboratory testing, and follow-up,” they concluded.
Findings lay foundation for widespread use
“By using enhanced PCR methods, Dollard et al. have rekindled the hope that NBDBS [newborn dried blood spots] testing may be a viable method for large-scale, universal newborn screening for congenital CMV,” Gail J. Demmler-Harrison, MD, of Texas Children’s Hospital, Houston, wrote in an accompanying editorial. Congenital CMV is a common infection, but accurate prevalence remains uncertain because not all newborns are tested, she noted. Detection of CMV currently may involve urine, saliva, and blood, but challenges to the use of these methods include “a variety of constantly evolving DNA detection methods,” she said.
Although urine and saliva samples have been proposed for universal screening, they would require the creation of new sample collection and testing programs. “The routine of collecting the NBDBS samples on all newborns and the logistics of routing them to central laboratories and then reporting results to caregivers is already in place and are strengths of NBDBS samples for universal newborn screening,” but had been limited by a less sensitive platform than urine or saliva, said Dr. Demmler-Harrison.
“The results in the study by Dollard et al. may be a total game changer for the NBDBS proponents,” she emphasized. “Furthermore, scientists who have adapted even more sensitive DNA detection assays, such as the loop-mediated isothermal assay for detection of DNA in clinical samples from newborns, may be able to adapt loop-mediated isothermal assay methodology to detect CMV DNA in NBDBS,” she added.
“By adapting the collection methods, by using optimal filter paper to enhance DNA adherence, by improving DNA elution procedures, and by developing novel amplification and detection methods, NBDBS may soon meet the challenge and reach the sensitivity and specificity necessary for universal screening for congenital CMV,” she concluded.
The study was supported by the CDC, the Minnesota Department of Health, the National Vaccine Program Office (U.S. federal government), and the University of South Carolina Disability Research and Dissemination Center.
Dr. Dollard and Dr. Demmler-Harrison had no financial conflicts to disclose.
FROM JAMA PEDIATRICS