User login
Bringing you the latest news, research and reviews, exclusive interviews, podcasts, quizzes, and more.
div[contains(@class, 'header__large-screen')]
div[contains(@class, 'read-next-article')]
div[contains(@class, 'nav-primary')]
nav[contains(@class, 'nav-primary')]
section[contains(@class, 'footer-nav-section-wrapper')]
footer[@id='footer']
div[contains(@class, 'main-prefix')]
section[contains(@class, 'nav-hidden')]
div[contains(@class, 'ce-card-content')]
nav[contains(@class, 'nav-ce-stack')]
The next likely COVID-19 vaccine has its advantages
Among the multiple vaccine candidates around the globe, next up in the arsenal against COVID-19 is likely the single-dose Ad26.COV2.S vaccine in development from Johnson & Johnson/Janssen, infectious disease experts predict.
And it got closer with promising interim phase 1/2a trial results, published online Jan. 13 in The New England Journal of Medicine.
A single Ad26.COV2.S dose was associated with S-binding and neutralizing antibodies in more than 90% of the participants. The finding was observed in both adults aged 18-55 years and participants 65 and older, as well as for participants given low-dose or high-dose vaccinations.
The results also suggest a durable vaccine response. “The take-home message [includes] a high neutralizing antibody responder rate to a single dose of our Ad26.COV2.S COVID-19 vaccine candidate. In addition, we see that these responses and antibody titers are stable for at least 71 days,” senior study author Hanneke Schuitemaker, PhD, global head of viral vaccine discovery and translational medicine at Johnson & Johnson in Leiden, the Netherlands, said in an interview.
If the single-dose Johnson & Johnson product gains Food and Drug Administration emergency use authorization (EUA), it could significantly boost the number of overall immunizations available. Less stringent storage requirements – only regular refrigeration vs. a need to freeze the Pfizer/BioNTech and Moderna COVID-19 vaccines – is another potential advantage. The Ad26.COV2.S vaccine can be refrigerated for up to 3 months at 36°-46 °F (2°-8 °C).
“Phase 1-2 trial data on the J&J vaccine: If it works as well as the mRNA options, it will have substantial advantages,” Jeremy Faust, MD, an emergency room physician affiliated with Brigham & Women’s Hospital and Harvard Medical School, Boston, tweeted on Jan. 13.
Unlike the Pfizer/BioNTech and Moderna messenger RNA vaccines, the Johnson & Johnson product is a recombinant, replication-incompetent adenovirus serotype 26 (Ad26) vector encoding a full-length and stabilized SARS-CoV-2 spike (S) protein.
Phase 3 efficacy/safety results pending
Under normal circumstances, phase 3 trial results would not be anticipated within weeks of phase 1/2a trial findings. However, the urgency of the COVID-19 pandemic accelerated the vaccine development process, so preclinical trials were conducted simultaneously and not sequentially. For this reason, phase 3 interim results for the Johnson & Johnson vaccine are expected within weeks, and a company executive told Reuters that the rollout is on track for March.
“We hope to report data from our first phase 3 study, ENSEMBLE, in which we are testing the protective efficacy of a single dose of Ad26.COV2.S, by the end of this month or early February,” Dr. Schuitemaker said.
In the meantime, the phase 1/2a ongoing, multicenter, randomized, double-blind, and placebo-controlled trial interim results have drawn positive reactions.
“Data is highly encouraging and supports the single inoculation approach that makes this vaccine unique,” Carlos del Rio, executive associate dean for Emory University at Grady in Atlanta, wrote in a tweet on Jan. 13.
“Encouraging COVID vaccine data from J&J published [Jan. 13]. Solid antibody, CD4 T cell, and CD8 T cell responses – a nice trifecta of vaccine immune responses to see! And safe!” tweeted Shane Crotty, PhD, vaccine scientist and professor at the La Jolla (Calif.) Institute for Immunology.
First results in 800+ participants
At baseline for the phase 1/2a trial, 2% of the younger group and 1% of the 65+ group were seropositive for SARS-CoV-2 S-specific antibodies.
A total of 402 people in the younger age cohort and 403 in the 65 and older group received a first dose of the Johnson & Johnson vaccine. Many participants also received a second dose 56 days later for a separate trial, ENSEMBLE2, designed to compare safety and efficacy between single- and double-dose regimens. Results of that trial are still pending.
Safety profile
A single dose was associated with a higher incidence of solicited systemic adverse events in the higher vaccine dose group. They also found that grade 3 adverse events decreased with increasing age.
Injection site pain on the day of immunization or the next day was the most common local reaction. The pain generally resolved within 24 hours. Fever was reported by 15% of the low-dose vaccine group and 39% of the high-dose cohort. Fatigue, headache, and myalgia were the most common grade 1 or 2 solicited systemic adverse events reported.
Five serious adverse events were reported, including four that investigators deemed unrelated to vaccination: hypotension, bilateral nephrolithiasis, legionella pneumonia, and one case of worsening of multiple sclerosis. The vaccine-related serious adverse event was a fever that resulted in hospitalization because of suspicion of COVID-19. The patient recovered within 12 hours.
“These data confirm our previous experience with vaccine candidates based on our Ad26 viral vector platform in the younger age group. The almost similar performance in older adults is promising,” Dr. Schuitemaker said.
A potential limitation of the phase 1/2a trial is “the lack of representation of minority groups,” the researchers noted. Johnson & Johnson is working on improving the diversity of study participants “with respect to groups that seem to be affected most by the COVID-19 pandemic.”
AstraZeneca/Oxford vaccine status
The AstraZeneca/Oxford AZD1222 vaccine in development received approval for use in the United Kingdom on Dec. 30. The approval came after Public Health England said the country was facing “unprecedented” levels of infections, the BBC reported. AstraZeneca applied for European Medical Agency approval earlier in the week of Jan. 10, which could lead to more widespread use across Europe.
The status of the vaccine remains uncertain in the United States. A phase 3 trial that started in August was paused for about 6 weeks in September and October after an adverse event in a British volunteer halted studies worldwide. On Oct. 23, the FDA permitted researchers to continue the trial with approximately 40,000 participants.
There was some suggestion in the clinical trials that a half dose of the AstraZeneca vaccine was more effective than a full dose, 90% vs. 62%, but some irregularities in the research require further investigation.
Although the AstraZeneca vaccine is delivered to cells by an adenovirus – as with the Johnson & Johnson product – it is designed to be delivered in two doses 28 days apart, like the administration schedule of the Moderna mRNA vaccine.
A need for speed, and more doses
Regardless of which vaccine product is next to gain an EUA in the United States, many experts agree the COVID-19 vaccine rollouts so far have been problematic, at a time when cases are climbing to record-breaking levels, and likely more related to logistics over administration of the vaccine than production of the doses.
“Lots of doses being manufactured. In December 20 million, January 40 million, February 80 million and J&J hopefully soon to add to the count. The shortage is the number arms not getting vaccinated. Freezers do not get COVID. They do not need all those vaccines,” Daniel Griffin, MD, PhD, an infectious disease expert in Port Washington, N.Y., tweeted on Jan. 12.
“Unfortunately, the rollout has not gone smoothly, partly due to a lack of resources for this distribution phase we’re in,” Andrew T. Pavia, MD, chief of the division of pediatric infectious diseases at the University of Utah, Salt Lake City, said during a media briefing Jan. 14 sponsored by the Infectious Diseases Society of America (IDSA).
“We’re concerned about the mismatch between the number of people who are being told they are eligible and the amount of vaccine that is being distributed,” he said.
Complicating the rollout is a directive from U.S. Health and Human Services Secretary Alex Azar that states should start vaccinating everyone 65 and older as well as those with underlying conditions.
Expanding distribution to the 15% of Americans in just this age group is a big challenge, Dr. Pavia said. “We have enough vaccine maybe to vaccinate 40 million by the end of this month. There is a huge disconnect, and that creates a lot of problems.”
“One of the biggest problems is we are trying to do this mass vaccination program in the middle of the biggest surge we’ve ever seen,” Julie Vaishampayan, MD, MPH, chair of the IDSA Public Health Committee, said during the briefing. Without sufficient time for public health officials to plan for vaccinating a larger population, “people will come and stand in extremely long lines.”
Trying to expand immunization access without a proportionate increase in available doses prompted Dr. Vaishampayan to share an analogy from a colleague: “We are trying to fill a lake with a garden hose. Rather than making the lake bigger, what we really need is more water.”
Dr. Pavia emphasized that infectious disease experts “know the measures that work.” Not using masks, physical distancing, and hand hygiene, he said, “is a bit like knowing that really good shark repellents will be available in summer, so I’m going to jump into the ocean covered in blood while the great whites are swimming around.”
An official at the World Health Organization agreed. “Vaccines are coming online and I do believe vaccines will make a huge difference. But they are not here yet in enough quantities and in enough people to make that difference,” Michael Ryan, MB, WHO executive director of health emergencies, said during an online media briefing Jan. 13, held in conjunction with Emory University.
Dr. Ryan predicted that “we’ve got weeks if not months ahead of us in which our weapon is our knowledge ... what we know about this virus, its transmission, and stopping that transmission.
“And as the vaccines roll in, we can hopefully end this horrific pandemic.”
Dr. Schuitemaker reports grants from BARDA during the conduct of the study; personal fees and other from Janssen Vaccines and Prevention, a J&J company, outside the submitted work. Johnson & Johnson and the Biomedical Advanced Research and Development Authority of the Department of Health and Human Services funded the phase 1/2a study.
A version of this article first appeared on Medscape.com.
Pressure builds on CDC to prioritize both diabetes types for vaccine
The American Diabetes Association, along with 18 other organizations, has sent a letter to the U.S. Centers for Disease Control and Prevention urging them to rank people with type 1 diabetes as equally high risk for COVID-19 severity, and therefore vaccination, as those with type 2 diabetes.
On Jan. 12, the CDC recommended states vaccinate all Americans over age 65 and those with underlying health conditions that make them more vulnerable to COVID-19.
Currently, type 2 diabetes is listed among 12 conditions that place adults “at increased risk of severe illness from the virus that causes COVID-19,” with the latter defined as “hospitalization, admission to the intensive care unit, intubation or mechanical ventilation, or death.”
On the other hand, the autoimmune condition type 1 diabetes is among 11 conditions the CDC says “might be at increased risk” for COVID-19, but limited data were available at the time of the last update on Dec. 23, 2020.
“States are utilizing the CDC risk classification when designing their vaccine distribution plans. This raises an obvious concern as it could result in the approximately 1.6 million with type 1 diabetes receiving the vaccination later than others with the same risk,” states the ADA letter, sent to the CDC on Jan. 13.
Representatives from the Endocrine Society, American Association of Clinical Endocrinology, Pediatric Endocrine Society, Association of Diabetes Care & Education Specialists, and JDRF, among others, cosigned the letter.
Newer data show those with type 1 diabetes at equally high risk
While acknowledging that “early data did not provide as much clarity about the extent to which those with type 1 diabetes are at high risk,” the ADA says newer evidence has emerged, as previously reported by this news organization, that “convincingly demonstrates that COVID-19 severity is more than tripled in individuals with type 1 diabetes.”
The letter also cites another study showing that people with type 1 diabetes “have a 3.3-fold greater risk of severe illness, are 3.9 times more likely to be hospitalized with COVID-19, and have a 3-fold increase in mortality compared to those without type 1 diabetes.”
Those risks, they note, are comparable to the increased risk established for those with type 2 diabetes, as shown in a third study from Scotland, published last month.
Asked for comment, CDC representative Kirsten Nordlund said in an interview, “This list is a living document that will be periodically updated by CDC, and it could rapidly change as the science evolves.”
In addition, Ms. Nordlund said, “Decisions about transitioning to subsequent phases should depend on supply; demand; equitable vaccine distribution; and local, state, or territorial context.”
“Phased vaccine recommendations are meant to be fluid and not restrictive for jurisdictions. It is not necessary to vaccinate all individuals in one phase before initiating the next phase; phases may overlap,” she noted. More information is available here.
Tennessee gives type 1 and type 2 diabetes equal priority for vaccination
Meanwhile, at least one state, Tennessee, has updated its guidance to include both types of diabetes as being priority for COVID-19 vaccination.
Vanderbilt University pediatric endocrinologist Justin M. Gregory, MD, said in an interview: “I was thrilled when our state modified its guidance on December 30th to include both type 1 and type 2 diabetes in the ‘high-risk category.’ Other states have not modified that guidance though.”
It’s unclear how this might play out on the ground, noted Dr. Gregory, who led one of the three studies demonstrating increased COVID-19 risk for people with type 1 diabetes.
“To tell you the truth, I don’t really know how individual organizations dispensing the vaccination [will handle] people who come to their facility saying they have ‘diabetes.’ Individual states set the vaccine-dispensing guidance and individual county health departments and health care systems mirror that guidance,” he said.
Thus, he added, “Although it’s possible an individual nurse may take the ‘I’ll ask you no questions, and you’ll tell me no lies’ approach if someone with type 1 diabetes says they have ‘diabetes’, websites and health department–recorded telephone messages are going to tell people with type 1 diabetes they have to wait further back in line if that is what their state’s guidance directs.”
A version of this article first appeared on Medscape.com.
Find and manage a kidney in crisis
“Kidney disease is the most common chronic disease in the United States and the world, and the incidence is on the rise,” said Kim Zuber, PA-C, executive director of the American Academy of Nephrology PAs and outreach chair for the National Kidney Foundation in St. Petersburg, Fla.

Kidney disease also is an expensive problem that accounts for approximately 20% of the Medicare budget in the United States, she said in a virtual presentation at the Metabolic & Endocrine Disease Summit by Global Academy for Medical Education.
“It’s important that we know how to identify it and how to slow the progression if possible, and what to do when we can no longer control the disease,” she said.
Notably, the rate of growth for kidney disease is highest among adults aged 20-45 years, said Ms. Zuber. “That is the group who will live for many years with kidney disease,” but should be in their peak years of working and earning. “That is the group we do not want to develop chronic diseases.”
“Look for kidney disease. It’s not always on the chart; it is often missed because people don’t think of it,” Ms. Zuber said. Anyone over 60 years has likely lost some kidney function. Other risk factors include minority/ethnicity, hypertension or cardiovascular disease, diabetes, and a family history of kidney disease.
Women are more likely to develop chronic kidney disease (CKD), but less likely to go on dialysis, said Ms. Zuber. “What I find fascinating is that a history of oophorectomy” increases risk. Other less obvious risk factors in a medical history that should prompt a kidney disease screening include mothers who drank during pregnancy, individuals with a history of acute kidney disease, lupus, sarcoid, amyloid, gout, or other autoimmune conditions, as well as a history of kidney stones of cancer. Kidney donors or transplant recipients are at increased risk, as are smokers, soda drinkers, and heavy salt users.
CKD is missed by many health care providers, Ms. Zuber said. For example, she cited data from more than 270,000 veterans treated at a Veterans Affairs hospital in Texas, which suggested that the likelihood of adding CKD to a patient’s diagnosis was 43.7% even if lab results confirmed CKD.
Find the patients
There are many formulas for defining kidney function, Ms. Zuber said. The estimation of creatinine clearance (eCrCl) and estimated glomerular filtration rate (eGFR) are among them. The most common definition is to calculate eGFR using the CKD-EPI formula. Cystatin C is more exact, but it is not standardized, so a lab in one state does not use the same formula as one in another state.
Overall, all these formulas are plus or minus 30%. “It is an estimate,” she said. Within the stages of CKD, “what we know is that, if you have a high GFR, that’s good, but patients who are losing albumin are at increased risk for CKD.” The albumin is more of a risk factor for CKD than GFR, so the GFR test used doesn’t make much difference, whereas, “if you have a lot of albumin in your urine, you are going downhill,” she said.
Normally, everyone loses kidney function with age, Ms. Zuber said. Starting at age 30, individuals lose about 1 mL/min per year in measures of GFR, however, this progression is more rapid among those with CKD, so “we need to find those people who are progressing more quickly than normal.”
The way to identify the high-risk patients is albumin, Ms. Zuber said. Health care providers need to test the urine and check albumin for high levels of albumin loss through urine, and many providers simply don’t routinely conduct urine tests for patients with other CKD risk factors such as diabetes or hypertension.
Albuminuria levels of 2,000 mg/g are the most concerning, and a urine-albumin-to-creatinine ratio (UACR) test is the most effective tool to monitor kidney function, Ms. Zuber said.
She recommends ordering a UACR test at least once a year to monitor kidney loss in all patients with hypertension, diabetes, lupus, and other risk factors including race and a history of acute kidney injury.
Keep them healthy
Managing patients with chronic kidney disease includes attention to several categories: hypertension, diabetes, obesity, and cardiovascular disease, and mental health, Ms. Zuber said.
“If hypertension doesn’t cause your CKD, your CKD will cause hypertension,” she said. The goal for patients with CKD is a target systolic blood pressure less than 120 mm Hg. “As kidney disease progresses, hypertension becomes harder to control,” she added. Lifestyle changes including exercise, low-fat diet, limited use of salt, weight loss if needed, and stress reduction strategies can help.
For patients with diabetes and CKD, work towards a target hemoglobin A1c of 7.0 for early CKD, and of 8% for stage 4/5 or for older patients with multiple comorbidities, Ms. Zuber said. All types of insulin are safe for CKD patients. “Kidney function declines at twice the normal rate for diabetes patients; however, SGLT2 inhibitors are very renoprotective. You may not see a drop in A1c, but you are protecting the kidney.”
For patients with obesity and CKD, data show that bariatric surgery (gastric bypass) lowers mortality in diabetes and also protects the heart and kidneys, said Ms. Zuber. Overall, central obesity increases CKD risk independent of any other risk factors, but losing weight, either by surgery or diet/lifestyle, helps save the kidneys.
Cardiovascular disease is the cause of death for more than 70% of kidney disease patients, Ms. Zuber said. CKD patients “are two to three times more likely to have atrial fibrillation, so take the time to listen with that stethoscope,” she added, also emphasizing the importance of statins for all CKD and diabetes patients, and decreasing smoking. In addition, “managing metabolic acidosis slows the loss of kidney function and protects the heart.”
Additional pearls for managing chronic kidney disease include paying attention to a patient’s mental health; depression occurs in roughly 25%-47% of CKD patients, and anxiety in approximately 27%, said Ms. Zuber. Depression “is believed to be the most common psychiatric disorder in patients with end stage renal disease,” and data suggest that managing depression can help improve survival in CKD patients.
Global Academy and this news organization are owned by the same parent company. Ms. Zuber had no financial conflicts to disclose.
“Kidney disease is the most common chronic disease in the United States and the world, and the incidence is on the rise,” said Kim Zuber, PA-C, executive director of the American Academy of Nephrology PAs and outreach chair for the National Kidney Foundation in St. Petersburg, Fla.
Kidney disease also is an expensive problem that accounts for approximately 20% of the Medicare budget in the United States, she said in a virtual presentation at the Metabolic & Endocrine Disease Summit by Global Academy for Medical Education.
“It’s important that we know how to identify it and how to slow the progression if possible, and what to do when we can no longer control the disease,” she said.
Notably, the rate of growth for kidney disease is highest among adults aged 20-45 years, said Ms. Zuber. “That is the group who will live for many years with kidney disease,” but should be in their peak years of working and earning. “That is the group we do not want to develop chronic diseases.”
“Look for kidney disease. It’s not always on the chart; it is often missed because people don’t think of it,” Ms. Zuber said. Anyone over 60 years has likely lost some kidney function. Other risk factors include minority/ethnicity, hypertension or cardiovascular disease, diabetes, and a family history of kidney disease.
Women are more likely to develop chronic kidney disease (CKD), but less likely to go on dialysis, said Ms. Zuber. “What I find fascinating is that a history of oophorectomy” increases risk. Other less obvious risk factors in a medical history that should prompt a kidney disease screening include mothers who drank during pregnancy, individuals with a history of acute kidney disease, lupus, sarcoid, amyloid, gout, or other autoimmune conditions, as well as a history of kidney stones of cancer. Kidney donors or transplant recipients are at increased risk, as are smokers, soda drinkers, and heavy salt users.
CKD is missed by many health care providers, Ms. Zuber said. For example, she cited data from more than 270,000 veterans treated at a Veterans Affairs hospital in Texas, which suggested that the likelihood of adding CKD to a patient’s diagnosis was 43.7% even if lab results confirmed CKD.
Find the patients
There are many formulas for defining kidney function, Ms. Zuber said. The estimation of creatinine clearance (eCrCl) and estimated glomerular filtration rate (eGFR) are among them. The most common definition is to calculate eGFR using the CKD-EPI formula. Cystatin C is more exact, but it is not standardized, so a lab in one state does not use the same formula as one in another state.
Overall, all these formulas are plus or minus 30%. “It is an estimate,” she said. Within the stages of CKD, “what we know is that, if you have a high GFR, that’s good, but patients who are losing albumin are at increased risk for CKD.” The albumin is more of a risk factor for CKD than GFR, so the GFR test used doesn’t make much difference, whereas, “if you have a lot of albumin in your urine, you are going downhill,” she said.
Normally, everyone loses kidney function with age, Ms. Zuber said. Starting at age 30, individuals lose about 1 mL/min per year in measures of GFR, however, this progression is more rapid among those with CKD, so “we need to find those people who are progressing more quickly than normal.”
The way to identify the high-risk patients is albumin, Ms. Zuber said. Health care providers need to test the urine and check albumin for high levels of albumin loss through urine, and many providers simply don’t routinely conduct urine tests for patients with other CKD risk factors such as diabetes or hypertension.
Albuminuria levels of 2,000 mg/g are the most concerning, and a urine-albumin-to-creatinine ratio (UACR) test is the most effective tool to monitor kidney function, Ms. Zuber said.
She recommends ordering a UACR test at least once a year to monitor kidney loss in all patients with hypertension, diabetes, lupus, and other risk factors including race and a history of acute kidney injury.
Keep them healthy
Managing patients with chronic kidney disease includes attention to several categories: hypertension, diabetes, obesity, and cardiovascular disease, and mental health, Ms. Zuber said.
“If hypertension doesn’t cause your CKD, your CKD will cause hypertension,” she said. The goal for patients with CKD is a target systolic blood pressure less than 120 mm Hg. “As kidney disease progresses, hypertension becomes harder to control,” she added. Lifestyle changes including exercise, low-fat diet, limited use of salt, weight loss if needed, and stress reduction strategies can help.
For patients with diabetes and CKD, work towards a target hemoglobin A1c of 7.0 for early CKD, and of 8% for stage 4/5 or for older patients with multiple comorbidities, Ms. Zuber said. All types of insulin are safe for CKD patients. “Kidney function declines at twice the normal rate for diabetes patients; however, SGLT2 inhibitors are very renoprotective. You may not see a drop in A1c, but you are protecting the kidney.”
For patients with obesity and CKD, data show that bariatric surgery (gastric bypass) lowers mortality in diabetes and also protects the heart and kidneys, said Ms. Zuber. Overall, central obesity increases CKD risk independent of any other risk factors, but losing weight, either by surgery or diet/lifestyle, helps save the kidneys.
Cardiovascular disease is the cause of death for more than 70% of kidney disease patients, Ms. Zuber said. CKD patients “are two to three times more likely to have atrial fibrillation, so take the time to listen with that stethoscope,” she added, also emphasizing the importance of statins for all CKD and diabetes patients, and decreasing smoking. In addition, “managing metabolic acidosis slows the loss of kidney function and protects the heart.”
Additional pearls for managing chronic kidney disease include paying attention to a patient’s mental health; depression occurs in roughly 25%-47% of CKD patients, and anxiety in approximately 27%, said Ms. Zuber. Depression “is believed to be the most common psychiatric disorder in patients with end stage renal disease,” and data suggest that managing depression can help improve survival in CKD patients.
Global Academy and this news organization are owned by the same parent company. Ms. Zuber had no financial conflicts to disclose.
FROM MEDS 2020
COVID-19 symptoms persist months after acute infection
, according to a follow-up study involving 1,733 patients.
“Patients with COVID-19 had symptoms of fatigue or muscle weakness, sleep difficulties, and anxiety or depression,” and those with “more severe illness during their hospital stay had increasingly impaired pulmonary diffusion capacities and abnormal chest imaging manifestations,” Chaolin Huang, MD, of Jin Yin-tan Hospital in Wuhan, China, and associates wrote in the Lancet.
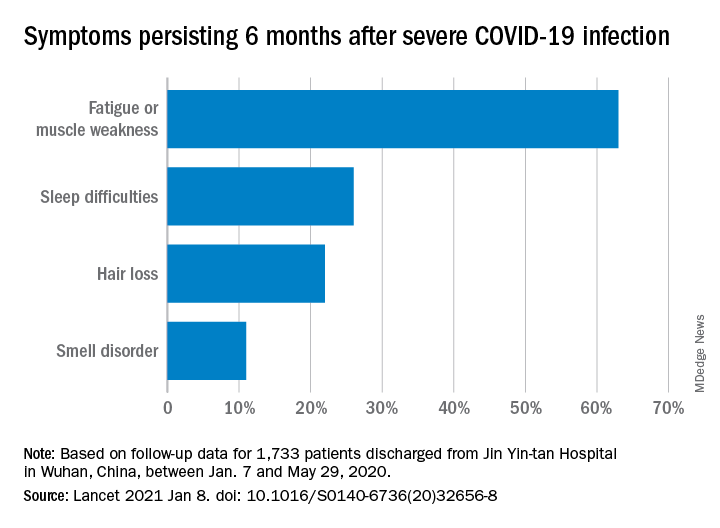
Fatigue or muscle weakness, reported by 63% of patients, was the most common symptom, followed by sleep difficulties, hair loss, and smell disorder. Altogether, 76% of those examined 6 months after discharge from Jin Yin-tan hospital – the first designated for patients with COVID-19 in Wuhan – reported at least one symptom, they said.
Symptoms were more common in women than men: 81% vs. 73% had at least one symptom, and 66% vs. 59% had fatigue or muscle weakness. Women were also more likely than men to report anxiety or depression at follow-up: 28% vs. 18% (23% overall), the investigators said.
Patients with the most severe COVID-19 were 2.4 times as likely to report any symptom later, compared with those who had the least severe levels of infection. Among the 349 participants who completed a lung function test at follow-up, lung diffusion impairment was seen in 56% of those with the most severe illness and 22% of those with the lowest level, Dr. Huang and associates reported.
In a different subset of 94 patients from whom plasma samples were collected, the “seropositivity and median titres of the neutralising antibodies were significantly lower than at the acute phase,” raising concern for reinfection, they said.
The results of the study, the investigators noted, “support that those with severe disease need post-discharge care. Longer follow-up studies in a larger population are necessary to understand the full spectrum of health consequences from COVID-19.”
, according to a follow-up study involving 1,733 patients.
“Patients with COVID-19 had symptoms of fatigue or muscle weakness, sleep difficulties, and anxiety or depression,” and those with “more severe illness during their hospital stay had increasingly impaired pulmonary diffusion capacities and abnormal chest imaging manifestations,” Chaolin Huang, MD, of Jin Yin-tan Hospital in Wuhan, China, and associates wrote in the Lancet.
Fatigue or muscle weakness, reported by 63% of patients, was the most common symptom, followed by sleep difficulties, hair loss, and smell disorder. Altogether, 76% of those examined 6 months after discharge from Jin Yin-tan hospital – the first designated for patients with COVID-19 in Wuhan – reported at least one symptom, they said.
Symptoms were more common in women than men: 81% vs. 73% had at least one symptom, and 66% vs. 59% had fatigue or muscle weakness. Women were also more likely than men to report anxiety or depression at follow-up: 28% vs. 18% (23% overall), the investigators said.
Patients with the most severe COVID-19 were 2.4 times as likely to report any symptom later, compared with those who had the least severe levels of infection. Among the 349 participants who completed a lung function test at follow-up, lung diffusion impairment was seen in 56% of those with the most severe illness and 22% of those with the lowest level, Dr. Huang and associates reported.
In a different subset of 94 patients from whom plasma samples were collected, the “seropositivity and median titres of the neutralising antibodies were significantly lower than at the acute phase,” raising concern for reinfection, they said.
The results of the study, the investigators noted, “support that those with severe disease need post-discharge care. Longer follow-up studies in a larger population are necessary to understand the full spectrum of health consequences from COVID-19.”
FROM THE LANCET
Sotagliflozin’s trial data receives FDA welcome for NDA filing
The Food and Drug Administration has determined that data collected on the dual SGLT1/2 inhibitor sotagliflozin (Zynquista) for treating patients with type 2 diabetes in the SOLOIST and SCORED pivotal trials can help support a New Drug Application (NDA) submission, according to a statement released on Jan. 14 by Lexicon Pharmaceuticals, the company developing this drug. Lexicon concurrently said that it hopes to potentially file this NDA later in 2021.
The statement said the FDA’s decision related to an NDA for “an indication to reduce the risk of cardiovascular death, hospitalization for heart failure, and urgent visits for heart failure in adult patients with type 2 diabetes with either worsening heart failure or additional risk factors for heart failure.”
Results from SOLOIST and SCORED, first reported in November 2020 at the American Heart Association scientific sessions, showed statistically significant benefits for their respective primary endpoints.
The findings also demonstrated several novel benefits from the first advanced clinical trials of an SGLT inhibitor that blocks both the SGLT2 protein in kidneys as well as the SGLT1 protein, which resides primarily in the gastrointestinal system and is the main route for glucose out of the gut.
In both SOLOIST and SCORED, patient outcomes on sotagliflozin tracked the benefits and adverse effects previously seen with several SGLT2 inhibitors (canagliflozin, dapagliflozin, empagliflozin, and ertugliflozin), but in addition showed several unprecedented benefits: An ability to lower hemoglobin A1c in patients with severely depressed renal function, safe initiation in patients recently hospitalized for heart failure, the first prospective data to show improvements in patients with heart failure with preserved ejection fraction, and a higher level of protection against MIs and strokes than the SGLT2 inhibitors.
The FDA’s willingness to consider data from both trials in an NDA was not a given, as the primary endpoints for both trials underwent tweaking while they were underway to compensate for an unexpectedly early end to patient enrollment and follow-up caused by changes in drug company sponsorship and challenges introduced by the COVID-19 pandemic.
In 2019, the FDA denied the NDA for sotagliflozin as a treatment for patients with type 1 diabetes, but this indication received approval in Europe.
SOLOIST and SCORED were sponsored initially by Sanofi, and more recently by Lexicon.
CVD deaths rose, imaging declined during pandemic
While the direct toll of the COVID-19 pandemic is being tallied and shared on the nightly news, the indirect effects will undoubtedly take years to fully measure.

In two papers published online Jan. 11 in the Journal of the American College of Cardiology, researchers have started the process of quantifying the impact of the pandemic on the care of patients with cardiovascular disease (CVD).
In the first study, Rishi Wadhera, MD, MPP, MPhil, and colleagues from the Beth Israel Deaconess Medical Center and Harvard Medical School in Boston examined population-level data to determine how deaths from cardiovascular causes changed in the United States in the early months of the pandemic relative to the same periods in 2019.
In a second paper, Andrew J. Einstein, MD, PhD, from Columbia University Irving Medical Center/New York–Presbyterian Hospital and colleagues looked at the pandemic’s international impact on the diagnosis of heart disease.
Using data from the National Center for Health Statistics, Dr. Wadhera and colleagues compared death rates from cardiovascular causes in the United States from March 18, 2020, to June 2, 2020, (the first wave of the pandemic) and from Jan. 1, 2020, to March 17, 2020, (the period just before the pandemic started) and compared them to the same periods in 2019. ICD codes were used to identify underlying causes of death.
Relative to 2019, they found a significant increase in deaths from ischemic heart disease nationally (1.11; 95% confidence interval, 1.04-1.18), as well as an increase in deaths caused by hypertensive disease (1.17; 95% CI, 1.09-1.26). There was no apparent increase in deaths from heart failure, cerebrovascular disease, or other diseases of the circulatory system.
When they looked just at New York City, the area hit hardest during the early part of the pandemic, the relative increases in deaths from ischemic heart disease were more pronounced.
Deaths from ischemic heart disease or hypertensive diseases jumped 139% and 164%, respectively, between March 18, 2020, and June 2, 2020.
More modest increases in deaths were seen in the remainder of New York state, New Jersey, Michigan and Illinois, while Massachusetts and Louisiana did not see a change in cardiovascular deaths.
Several studies from different parts of the world have indicated a 40%-50% drop in hospitalization for myocardial infarction in the initial months of the pandemic, said Dr. Wadhera in an interview.
“We wanted to understand where did all the heart attacks go? And we worried that patients with urgent heart conditions were not seeking the medical care they needed. I think our data suggest that this may have been the case,” reported Dr. Wadhera.
“This very much reflects the reality of what we’re seeing on the ground,” he told this news organization. “After the initial surge ended, when hospital volumes began to return to normal, we saw patients come into the hospital who clearly had a heart attack during the surge months – and were now experiencing complications of that event – because they had initially not come into the hospital due to concerns about exposure to the virus.”
A limitation of their data, he stressed, is whether some deaths coded as CVD deaths were really deaths from undiagnosed COVID-19. “It’s possible that some portion of the increased deaths we observed really reflect the cardiovascular complications of undiagnosed COVID-19, because we know that testing was quite limited during the early first surge of cases.”
“I think that basically three factors – patients avoiding the health care system because of fear of getting COVID, health care systems being strained and overwhelmed leading to the deferral of cardiovascular care and semi-elective procedures, and the cardiovascular complications of COVID-19 itself – all probably collectively contributed to the rise in cardiovascular deaths that we observed,” said Dr. Wadhera.
In an accompanying editorial, Michael N. Young, MD, Geisel School of Medicine at Dartmouth, Lebanon, N.H., and colleagues write that these data, taken together with an earlier study showing an increase in out-of-hospital cardiac arrests at the pandemic peak in New York City, “support the notion of excess fatalities due to unattended comorbid illnesses.” That said, attribution of death in the COVID era “remains problematic.”
In the second article, Andrew Einstein, MD, PhD, and the INCAPS COVID Investigators Group took a broader approach and looked at the impact of COVID-19 on cardiac diagnostic procedures in over 100 countries.
The INCAPS (International Atomic Energy Agency Noninvasive Cardiology Protocols Study) group has for the past decade conducted numerous studies addressing the use of best practices and worldwide practice variation in CVD diagnosis.
For this effort, they sent a survey link to INCAPS participants worldwide, ultimately including 909 survey responses from 108 countries in the final analysis.
Compared with March 2019, overall procedure volume decreased 42% in March 2020 and 64% in April 2020.
The greatest decreases were seen in stress testing (78%) and transesophageal echocardiography (76%), both procedures, noted Dr. Einstein, associated with a greater risk of aerosolization.
“Whether as we reset after COVID we return to the same place in terms of the use of cardiovascular diagnostic testing remains to be seen, but it certainly poses an opportunity to improve our utilization of various modes of testing,” said Dr. Einstein.
Using regression analysis, Dr. Einstein and colleagues were able to see that sites located in low-income and lower-middle-income countries saw an additional 22% reduction in cardiac procedures and less availability of personal protective equipment (PPE) and telehealth.
Fifty-two percent of survey respondents reported significant shortages of N95 masks early in the pandemic, with fewer issues in supplies of gloves, gowns, and face shields. Lower-income countries were more likely to face significant PPE shortages and less likely to be able to implement telehealth strategies to make up for reduced in-person care. PPE shortage itself, however, was not related to lower procedural volume on multivariable regression.
“It all really begs the question of whether there is more that the world can do to help out the developing world in terms of managing the pandemic in all its facets,” said Dr. Einstein in an interview, adding he was “shocked” to learn how difficult it was for some lower-income countries to get sufficient PPE.
Did shutdowns go too far?
Calling this a “remarkable study,” an editorial written by Darryl P. Leong, MBBS, PhD, John W. Eikelboom, MBBS, and Salim Yusuf, MBBS, DPhil, all from McMaster University, Hamilton, Ont., suggests that perhaps health systems in some places went too far in closing down during the first wave of the pandemic, naming specifically Canada, Eastern Europe, and Saudi Arabia as examples.
“Although these measures were taken to prepare for the worst, overwhelming numbers of patients with COVID-19 did not materialize during the first wave of the pandemic in these countries. It is possible that delaying so-called nonessential services may have been unnecessary and potentially harmful, because it likely led to delays in providing care for the treatment of serious non–COVID-19 illnesses.”
Since then, more experience and more data have largely allowed hospital systems to “tackle the ebb and flow” of COVID-19 cases in ways that limit shutdowns of important health services, they said.
Given the more pronounced effect in low- and middle-income countries, they stressed the need to focus resources on ways to promote prevention and treatment that do not rely on diagnostic procedures.
“This calls for more emphasis on developing efficient systems of telehealth, especially in poorer countries or in remote settings in all countries,” Dr. Leong and colleagues conclude.
Dr. Wadhera has reported research support from the National Heart, Lung, and Blood Institute, along with fellow senior author Robert W. Yeh, MD, MBA, who has also received personal fees and grants from several companies not related to the submitted work. Dr. Einstein, Dr. Leong, Dr. Eikelboom, and Dr. Yusuf have reported no relevant financial relationships.
A version of this article first appeared on Medscape.com.
While the direct toll of the COVID-19 pandemic is being tallied and shared on the nightly news, the indirect effects will undoubtedly take years to fully measure.
In two papers published online Jan. 11 in the Journal of the American College of Cardiology, researchers have started the process of quantifying the impact of the pandemic on the care of patients with cardiovascular disease (CVD).
In the first study, Rishi Wadhera, MD, MPP, MPhil, and colleagues from the Beth Israel Deaconess Medical Center and Harvard Medical School in Boston examined population-level data to determine how deaths from cardiovascular causes changed in the United States in the early months of the pandemic relative to the same periods in 2019.
In a second paper, Andrew J. Einstein, MD, PhD, from Columbia University Irving Medical Center/New York–Presbyterian Hospital and colleagues looked at the pandemic’s international impact on the diagnosis of heart disease.
Using data from the National Center for Health Statistics, Dr. Wadhera and colleagues compared death rates from cardiovascular causes in the United States from March 18, 2020, to June 2, 2020, (the first wave of the pandemic) and from Jan. 1, 2020, to March 17, 2020, (the period just before the pandemic started) and compared them to the same periods in 2019. ICD codes were used to identify underlying causes of death.
Relative to 2019, they found a significant increase in deaths from ischemic heart disease nationally (1.11; 95% confidence interval, 1.04-1.18), as well as an increase in deaths caused by hypertensive disease (1.17; 95% CI, 1.09-1.26). There was no apparent increase in deaths from heart failure, cerebrovascular disease, or other diseases of the circulatory system.
When they looked just at New York City, the area hit hardest during the early part of the pandemic, the relative increases in deaths from ischemic heart disease were more pronounced.
Deaths from ischemic heart disease or hypertensive diseases jumped 139% and 164%, respectively, between March 18, 2020, and June 2, 2020.
More modest increases in deaths were seen in the remainder of New York state, New Jersey, Michigan and Illinois, while Massachusetts and Louisiana did not see a change in cardiovascular deaths.
Several studies from different parts of the world have indicated a 40%-50% drop in hospitalization for myocardial infarction in the initial months of the pandemic, said Dr. Wadhera in an interview.
“We wanted to understand where did all the heart attacks go? And we worried that patients with urgent heart conditions were not seeking the medical care they needed. I think our data suggest that this may have been the case,” reported Dr. Wadhera.
“This very much reflects the reality of what we’re seeing on the ground,” he told this news organization. “After the initial surge ended, when hospital volumes began to return to normal, we saw patients come into the hospital who clearly had a heart attack during the surge months – and were now experiencing complications of that event – because they had initially not come into the hospital due to concerns about exposure to the virus.”
A limitation of their data, he stressed, is whether some deaths coded as CVD deaths were really deaths from undiagnosed COVID-19. “It’s possible that some portion of the increased deaths we observed really reflect the cardiovascular complications of undiagnosed COVID-19, because we know that testing was quite limited during the early first surge of cases.”
“I think that basically three factors – patients avoiding the health care system because of fear of getting COVID, health care systems being strained and overwhelmed leading to the deferral of cardiovascular care and semi-elective procedures, and the cardiovascular complications of COVID-19 itself – all probably collectively contributed to the rise in cardiovascular deaths that we observed,” said Dr. Wadhera.
In an accompanying editorial, Michael N. Young, MD, Geisel School of Medicine at Dartmouth, Lebanon, N.H., and colleagues write that these data, taken together with an earlier study showing an increase in out-of-hospital cardiac arrests at the pandemic peak in New York City, “support the notion of excess fatalities due to unattended comorbid illnesses.” That said, attribution of death in the COVID era “remains problematic.”
In the second article, Andrew Einstein, MD, PhD, and the INCAPS COVID Investigators Group took a broader approach and looked at the impact of COVID-19 on cardiac diagnostic procedures in over 100 countries.
The INCAPS (International Atomic Energy Agency Noninvasive Cardiology Protocols Study) group has for the past decade conducted numerous studies addressing the use of best practices and worldwide practice variation in CVD diagnosis.
For this effort, they sent a survey link to INCAPS participants worldwide, ultimately including 909 survey responses from 108 countries in the final analysis.
Compared with March 2019, overall procedure volume decreased 42% in March 2020 and 64% in April 2020.
The greatest decreases were seen in stress testing (78%) and transesophageal echocardiography (76%), both procedures, noted Dr. Einstein, associated with a greater risk of aerosolization.
“Whether as we reset after COVID we return to the same place in terms of the use of cardiovascular diagnostic testing remains to be seen, but it certainly poses an opportunity to improve our utilization of various modes of testing,” said Dr. Einstein.
Using regression analysis, Dr. Einstein and colleagues were able to see that sites located in low-income and lower-middle-income countries saw an additional 22% reduction in cardiac procedures and less availability of personal protective equipment (PPE) and telehealth.
Fifty-two percent of survey respondents reported significant shortages of N95 masks early in the pandemic, with fewer issues in supplies of gloves, gowns, and face shields. Lower-income countries were more likely to face significant PPE shortages and less likely to be able to implement telehealth strategies to make up for reduced in-person care. PPE shortage itself, however, was not related to lower procedural volume on multivariable regression.
“It all really begs the question of whether there is more that the world can do to help out the developing world in terms of managing the pandemic in all its facets,” said Dr. Einstein in an interview, adding he was “shocked” to learn how difficult it was for some lower-income countries to get sufficient PPE.
Did shutdowns go too far?
Calling this a “remarkable study,” an editorial written by Darryl P. Leong, MBBS, PhD, John W. Eikelboom, MBBS, and Salim Yusuf, MBBS, DPhil, all from McMaster University, Hamilton, Ont., suggests that perhaps health systems in some places went too far in closing down during the first wave of the pandemic, naming specifically Canada, Eastern Europe, and Saudi Arabia as examples.
“Although these measures were taken to prepare for the worst, overwhelming numbers of patients with COVID-19 did not materialize during the first wave of the pandemic in these countries. It is possible that delaying so-called nonessential services may have been unnecessary and potentially harmful, because it likely led to delays in providing care for the treatment of serious non–COVID-19 illnesses.”
Since then, more experience and more data have largely allowed hospital systems to “tackle the ebb and flow” of COVID-19 cases in ways that limit shutdowns of important health services, they said.
Given the more pronounced effect in low- and middle-income countries, they stressed the need to focus resources on ways to promote prevention and treatment that do not rely on diagnostic procedures.
“This calls for more emphasis on developing efficient systems of telehealth, especially in poorer countries or in remote settings in all countries,” Dr. Leong and colleagues conclude.
Dr. Wadhera has reported research support from the National Heart, Lung, and Blood Institute, along with fellow senior author Robert W. Yeh, MD, MBA, who has also received personal fees and grants from several companies not related to the submitted work. Dr. Einstein, Dr. Leong, Dr. Eikelboom, and Dr. Yusuf have reported no relevant financial relationships.
A version of this article first appeared on Medscape.com.
To fast or not? The new dieting dilemma
Cardiologist Ethan J. Weiss, MD, followed an intermittent-fasting diet for 7 years. He lost about 3.6 kg (8 lb) and began recommending the approach to friends and patients who wanted to lose weight.
“I liked the way the diet was so simple,” said Dr. Weiss, an associate professor at the Cardiovascular Research Institute, University of California, San Francisco. But he also felt “it was too good to be true because you can eat what you want as long as it’s within a narrow window.”
So when, last year, he conducted a randomized, controlled trial, TREAT, testing such an approach – eating during just 8 hours a day, fasting for the remaining 16 hours – versus an eating plan of three meals a day without restrictions, he was somewhat dismayed to find the group of people who fasted didn’t lose any more weight than the other group.
The approach used in this study is known as time-restricted eating. It involves designating periods of time within the day when people can consume whatever they want; they then “fast” at times outside those eating windows. Other methods include alternate-day fasting, or the well-known 5:2 diet. In the latter, people eat a “normal” amount of around 2,000 calories per day on 5 days of the week, but for the other 2 days, they restrict caloric intake to 500 calories per day.
Intermittent fasting is an umbrella term encompassing all of these different approaches.
Dr. Weiss’s work builds on more than a decade of research into this type of eating plan by scientists, including Krista Varady, PhD, professor of nutrition at the University of Illinois at Chicago, who presented an overview of her own studies last fall at the virtual annual meeting of the European Association for the Study of Diabetes.
Although much of the work has suggested that the shorter duration of eating period in this type of diet leads to lower calorie intake and weight loss while avoiding the need for the tedious calorie-counting of conventional diets, Dr. Weiss’s data – published last year – throws a spanner in the works and now complicates the evidence base.
A promise of simplicity: ‘All you have to do is watch the clock’
Dr. Varady said she, too, is intrigued by the simplicity of intermittent-fasting diets.
In 2018, Dr. Varady and colleagues tested the weight-loss efficacy of 12 weeks of time-restricted feeding in a pilot study of 23 people with obesity.
Participants were permitted an 8-hour eating window (10 a.m. to 6 p.m.) followed by water-only fasting of 16 hours (6 p.m. to 10 a.m.) the next day (sometimes referred to as the 16:8 diet). Researchers measured weight loss and fat mass, as well as metabolic parameters, and compared the active group with 23 matched-control participants who ate freely.
There were no restrictions on type or quantity of food consumed by the control group during the 8-hour period, but individuals in the time-restricted feeding group consumed around 350 calories less than the comparator group.
Dr. Varady thinks this is most likely because of the fact that people normally eat during a 14-hour window and time-restricted feeding cuts that down by 6 hours.
“One of the most beautiful things about time-restricted feeding is that it doesn’t require calorie monitoring,” she explained. “People get burnt out with having to constantly monitor calories. All you have to do is watch the clock.”
Adherence was quite high, she reported, although most people skipped 1 day, often a Saturday, likely because of social engagements.
Weight loss in the time-restricted feeding group was mild to moderate. After 3 months, mean body weight decreased by 2.6%, or approximately 3 kg (7-8 lb), relative to those who ate freely, but this was a significant difference (P < .05).
But the researchers observed little change in metabolic disease risk factors between the groups.
In the time-restricted feeding group, systolic blood pressure dropped from 128 mm Hg to 121 mm Hg over the 12-week period, which was significant relative to the control group (P < .05) but there were no significant changes in fasting glucose, fasting lipids, fasting insulin, or insulin resistance relative to the comparator group.
In contrast to Dr. Varady’s findings, Dr. Weiss’s randomized TREAT trial, which used a similar 16:8 period of time-restricted versus unrestricted eating in 116 individuals with overweight or obesity, did not find greater weight loss in the group restricted to eating within the 8-hour window.
As previously reported by this news organization, those who fasted for 16 hours of each day (n = 59) did lose some weight, compared with the control group (n = 57) over 12 weeks, but the difference in weight loss between the groups was not significant (−0.26 kg; P = .63).
And there were no significant differences in any of the secondary outcomes of fat mass, fasting insulin, fasting glucose, hemoglobin A1c levels, estimated energy intake, total energy expenditure, and resting energy expenditure between the time-restricted eating and regular feeding groups.
“I don’t claim time-restricted eating is dead,” Dr. Weiss said, “but the hope that you can eat for a limited time each day and solve metabolic disease is not there.”
Does the length of the eating window matter?
Following her pilot study of an 8-hour eating window, Dr. Varady conducted further research with 4- or 6-hour eating windows to see if even shorter periods would precipitate greater weight loss, ideally a clinically significant loss of 5% of body weight.
She ran a 2-month randomized, controlled study in people with obesity, published in 2020, which was the first to examine both a 4-hour (3 p.m. to 7 p.m.; n = 19) or 6-hour (1 p.m to 7 p.m.; n = 20) eating window versus a diet without any food restrictions as a control (n = 19) (Cell Metab. 2020;32:366-78.e3).
Dr. Varady explained that they decided to shift the eating window to later in the day for this trial (in contrast to the earlier 8-hour study) to allow people to eat dinner at a sociable time, and thereby hopefully reduce dropouts from the study.
“Unlike with alternate-day fasting, most people find time-restricted feeding easy to incorporate into their lifestyles,” she remarked.
Both the 4- and 6-hour eating window groups experienced a mean 3.2% body weight loss, compared with controls, and this correlated with a 550-calorie reduction in their daily consumption, compared with their baseline calorie intake.
In terms of other outcomes – and in contrast to the 8-hour window study which showed very little changed other than a minor decrease in blood pressure – researchers saw some changes in metabolic risk factors with the 4- and 6-hour eating windows, Dr. Varady reported.
Compared with the control group, fasting insulin decreased in both time-restricted feeding groups by a mean of 15% (P < .05). Insulin resistance also decreased by 25% in the 4-hour group and by 15% in the 6-hour group, compared with the control group. Fasting glucose did not change in either group, however.
The researchers did not observe any effect on blood pressure or plasma lipids in the 4- or 6-hour eating window groups, compared with controls. However, measures of oxidative stress and inflammation decreased in both groups versus controls by approximately 35% (P < .05).
“These findings suggest that this form of severe time-restricted feeding is achievable and can help adults with obesity lose weight, without having to count calories,” Dr. Varady and colleagues conclude.
Is intermittent fasting better for weight loss than calorie restriction?
Ultimately, if weight loss is the primary goal, many want to know how time-restricted feeding compares with conventional daily calorie restriction.
Back in 2017, Dr. Varady published a year-long randomized, controlled study that compared alternate-day fasting with a calorie-restriction diet and a conventional/usual diet among 100 participants with obesity who were otherwise healthy.
Participants on the alternate-day fasting plan (n = 34) consumed 500 calories on fasting days for the first 6 months for weight loss (approximately 25% of energy needs) followed by 125% of energy needs on alternating “feast days”. For an additional 6 months, they ate 1,000 calories on fasting days – aimed at weight maintenance.
Those following the calorie-restriction diet (n = 35) reduced energy intake by 25% (approximately 500 kcal) for the first 6 months for weight loss, followed by enough calories sufficient for weight maintenance (so no further loss nor gain).
However, the study showed alternate-day fasting did not produce better weight loss than conventional calorie counting.
“Over the first 6 months [during the weight-loss period] both groups lost an average of 6% body weight. After 12 months it crept back to 5% weight loss,” reported Dr. Varady.
“Realistically, if the study continued for 2 or 3 years, they probably would have regained much of their weight,” she admitted.
Dr. Varady suspects it might be better for the alternate-day fasting participants to continue eating only 500 calories on their fast day during the weight-loss maintenance period rather than increasing calorie intake during this phase.
Heart rate and blood pressure did not change in either group, while triglycerides decreased in the alternate-day fasting group, and LDL cholesterol decreased in the calorie-restriction group.
Glucose level decreased in the calorie-restriction group but not the alternate-day fasting group, and insulin and HOMA-IR were unaffected in both groups, reported Dr. Varady, noting that these findings were in healthy people with obesity.
In people with obesity and insulin resistance – evaluated as a subgroup in a separate study by Dr. Varady of alternate-day fasting versus daily calorie restriction published in 2019 – she noted that when insulin levels and HOMA-IR were measured, there was a greater reduction in both variables in the fasting group, compared with the calorie-restriction group.
“For people at risk of diabetes, maybe fasting produces more potent effects on glycemic control?” she ventured.
Who fares best with which fasting diets?
Summing up, Dr. Varady provided some practical pointers regarding who she feels is best suited to intermittent fasting and who should avoid it.
Those who binge eat, shift-workers, and frequent snackers do not do well with fasting, she said.
The first 10 days of intermittent fasting are rough, she pointed out, with the most common complaint being headaches.
“Eventually, people do feel an energy boost on fast days, and they say they concentrate better and have lots of energy. People won’t feel lethargic. Also, eating protein on fast days has been shown to keep hunger at bay.”
She cautiously concluded that weight loss with “alternate-day fasting” is quicker than some other methods, at 4.5-7 kg (10-15 lb) in 3 months, but is harder to follow and requires some calorie counting.
“In comparison, with time-restricted feeding, for which there have been very few ... studies to date, weight loss is slower at 2-4.5 kg (5-10 lb) in 3 months, but it is easier to follow and tolerable because you don’t need to count calories.”
Dr. Weiss has reported no relevant financial relationships. Dr. Varady has reported receiving author fees from Hachette for her book, “Every Other Day Diet.” (New York: Hachette, 2013)
A version of this article first appeared on Medscape.com.
Natural immunity from COVID-19 ‘may last months’
Infection with the SARS-CoV-2 virus may provide some immunity for at least 5 months, interim results from a study has found.
The first report from the Sarscov2 Immunity & Reinfection Evaluation (SIREN) study suggested that antibodies from people who had recovered from COVID-19 gave at least 83% protection against reinfection compared with people who had not had the disease before.
However, Public Health England (PHE) researchers said some people with antibodies may still be able to carry and transmit the SARS-CoV-2 virus.
‘Strongly encouraged’
Susan Hopkins, PhD, senior medical advisor at PHE, who is leading the study, said the overall findings were good news. She told a briefing hosted by the Science Media Centre: “I am strongly encouraged that people have immunity that is lasting much more than the few months that was speculated before the summer.”
She added: “It allows people to feel that their prior infection will protect them from future infections but at the same time it is not complete protection, and therefore they still need to be careful when they are out and about.”
PHE scientists said they would continue to assess whether protection might last longer than 5 months.
Eleanor Riley, PhD, professor of immunology and infectious disease at the University of Edinburgh, said the report suggested that “natural infection provides short-term protection against COVID-19 that is very similar to that conferred by vaccination.”
Simon Clarke, PhD, associate professor in cellular microbiology at the University of Reading, said: “The concerning finding is that some people who have COVID antibodies appear to still be able to carry the coronavirus and could spread it to others. This means that the vast majority of the population will either need to have natural immunity or have been immunised for us to fully lift restrictions on our lives.”
The analysis took place before the new variant of SARS-CoV-2 became widespread in the UK. The PHE scientists said that further work was underway to establish whether and to what extent antibodies also provide protection from the VOC202012/01 variant.
Healthcare Workers
The SIREN preprint analysed data from 20,787 health care workers from 102 NHS trusts who had undergone antibody and PCR testing from June 18 to November 9, 2020.
Of those, 6614 tested positive for COVID-19 antibodies.
Of the 44 potential reinfections identified, two were designated ‘probable’ and 42 ‘possible’, based on available evidence.
Both of the two individuals classified as probable reinfections reported having experienced COVID-19 symptoms during the first wave of the pandemic but were not tested at the time. Both reported that their symptoms were less severe the second time.
None of the 44 potential reinfection cases were PCR tested during the first wave, but all tested positive for COVID-19 antibodies at the time they were recruited to the study.
Tom Wingfield, PhD, senior clinical lecturer at the Liverpool School of Tropical Medicine, said that given the high risk of SARS-CoV-2 infection for frontline NHS staff, it was “vital that we do all that we can to understand, predict, and prevent risk of SARS-CoV-2 amongst healthcare workers”.
The study will continue to follow participants for 12 months to explore how long any immunity may last, the effectiveness of vaccines, and to what extent people with immunity are able to carry and transmit the virus.
A version of this article first appeared on Medscape.com.
COVID protections suppressed flu season in U.S.
Last fall, health experts said it was possible the United States could experience an easy 2020-21 flu season because health measures to fight COVID-19 would also thwart the spread of influenza.
It looks like that happened – and then some. Numbers are strikingly low for cases of the flu and other common respiratory and gastrointestinal viruses, health experts told the Washington Post.
“It’s crazy,” Lynnette Brammer, MPH, who leads the domestic influenza surveillance team at the Centers for Disease Control and Prevention, told the Washington Post. “This is my 30th flu season. I never would have expected to see flu activity this low.”
Influenza A, influenza B, parainfluenza, norovirus, respiratory syncytial virus, human metapneumovirus, and the bacteria that cause whooping cough and pneumonia are circulating at near-record-low levels.
As an example, the Washington Post said in the third week of December 2019, the CDC’s network of clinical labs reported 16.2% of almost 30,000 samples tested positive for influenza A. During the same period in 2020, only 0.3% tested positive.
But there’s a possible downside to this suppression of viruses, because flu and other viruses may rebound once the coronavirus is brought under control.
“The best analogy is to a forest fire,” Bryan Grenfell, PhD, an epidemiologist and population biologist at Princeton (N.J.) University, told the Washington Post. “For the fire to spread, it needs to have unburned wood. For epidemics to spread, they require people who haven’t previously been infected. So if people don’t get infected this year by these viruses, they likely will at some point later on.”
American health experts like Anthony Fauci, MD, director of the National Institute of Allergy and Infectious Disease, said last fall that they noticed Australia and other nations in the southern hemisphere had easy flu seasons, apparently because of COVID protection measures. The flu season there runs March through August.
COVID-19 now has a very low presence in Australia, but in recent months the flu has been making a comeback. Flu cases among children aged 5 and younger rose sixfold by December, when such cases are usually at their lowest, the Washington Post said.
“That’s an important cautionary tale for us,” said Kevin Messacar, MD, an infectious disease doctor at Children’s Hospital Colorado, Aurora. “Just because we get through the winter and don’t see much RSV or influenza doesn’t mean we’ll be out of the woods.”
A version of this article first appeared on WebMD.com.
Endocrine Society calls for action to reduce insulin costs
The Endocrine Society has issued a new position statement calling on all stakeholders, including clinicians, to play a role in reducing the cost of insulin for patients with diabetes in the United States.
“Addressing Insulin Access and Affordability: An Endocrine Society Position Statement,” was published online Jan. 12 in the Journal of Clinical Endocrinology and Metabolism.
“The society believes all stakeholders across the supply chain have a role to play in addressing the high price of insulin,” said the 11 authors, who are all members of the society’s advocacy and public outreach core committee.
This is the first such statement from a major professional organization in 2021, which is the 100th anniversary of the discovery of insulin.
And the call for action was issued just a week prior to the inauguration of incoming U.S. President Joe Biden, who has pledged to “build on the Affordable Care Act by giving Americans more choice, reducing health care costs, and making our health care system less complex to navigate.”
The cost of insulin has nearly tripled in the past 15 years in the United States, and a lack of transparency in the drug supply chain has made it challenging to identify and address the causes of soaring costs.
The high cost of insulin has made access particularly difficult for people with diabetes with a low income, who have high-deductible health plans, are Medicare beneficiaries using Part B to cover insulin delivered via pump, or are in the Medicare Part D “donut hole,” as well as young adults once they reach their 26th birthday and can no longer be covered under their parents’ insurance.

“Inventors Frederick Banting and Charles Best sold the insulin patent for a mere $1 in the 1920s because they wanted their discovery to save lives and for insulin to be affordable and accessible to everyone who needed it,” said Endocrine Society President-elect Carol Wysham, MD, of the Rockwood/MultiCare Health Systems, Spokane, Wash.
“People with diabetes without full insurance are often paying increasing out-of-pocket costs for insulin resulting in many rationing their medication or skipping lifesaving doses altogether,” she said.
The society’s statement called for allowing government negotiation of drug prices and greater transparency across the supply chain to elucidate the reasons for rising insulin costs.
For physicians in particular, they advised training in use of lower-cost human NPH and regular insulin for appropriate patients with type 2 diabetes, and considering patients’ individual financial and coverage status when prescribing insulin.
Pharmacists are advised to learn about and share information with patients about lower-cost options offered by manufacturers.
Other policy recommendations for relevant stakeholders include:
- Limit future insulin list price increases to the rate of inflation.
- Limit out-of-pocket costs without increasing premiums or deductibles by limiting cost sharing to copays of no more than $35, providing first-dollar coverage, or capping costs at no more than $100 per month.
- Eliminate rebates or pass savings from rebates along to consumers without increasing premiums or deductibles.
- Expedite approval of insulin biosimilars to create market competition.
- Include real-time benefit information in electronic medical records.
- Develop a payment model for Medicare Part B beneficiaries, as well as Part D, to lower out-of-pocket copays.
For manufacturers, the society also recommended improving patient assistance programs to be less restrictive and more accountable. And employers, they said, should limit copays without increasing premiums or deductibles, and seek plan options that benefit people with diabetes and provide education about these options during open enrollment.
Of the 11 writing panel members, 4 have pharmaceutical industry disclosures.
A version of this article first appeared on Medscape.com.
The Endocrine Society has issued a new position statement calling on all stakeholders, including clinicians, to play a role in reducing the cost of insulin for patients with diabetes in the United States.
“Addressing Insulin Access and Affordability: An Endocrine Society Position Statement,” was published online Jan. 12 in the Journal of Clinical Endocrinology and Metabolism.
“The society believes all stakeholders across the supply chain have a role to play in addressing the high price of insulin,” said the 11 authors, who are all members of the society’s advocacy and public outreach core committee.
This is the first such statement from a major professional organization in 2021, which is the 100th anniversary of the discovery of insulin.
And the call for action was issued just a week prior to the inauguration of incoming U.S. President Joe Biden, who has pledged to “build on the Affordable Care Act by giving Americans more choice, reducing health care costs, and making our health care system less complex to navigate.”
The cost of insulin has nearly tripled in the past 15 years in the United States, and a lack of transparency in the drug supply chain has made it challenging to identify and address the causes of soaring costs.
The high cost of insulin has made access particularly difficult for people with diabetes with a low income, who have high-deductible health plans, are Medicare beneficiaries using Part B to cover insulin delivered via pump, or are in the Medicare Part D “donut hole,” as well as young adults once they reach their 26th birthday and can no longer be covered under their parents’ insurance.
“Inventors Frederick Banting and Charles Best sold the insulin patent for a mere $1 in the 1920s because they wanted their discovery to save lives and for insulin to be affordable and accessible to everyone who needed it,” said Endocrine Society President-elect Carol Wysham, MD, of the Rockwood/MultiCare Health Systems, Spokane, Wash.
“People with diabetes without full insurance are often paying increasing out-of-pocket costs for insulin resulting in many rationing their medication or skipping lifesaving doses altogether,” she said.
The society’s statement called for allowing government negotiation of drug prices and greater transparency across the supply chain to elucidate the reasons for rising insulin costs.
For physicians in particular, they advised training in use of lower-cost human NPH and regular insulin for appropriate patients with type 2 diabetes, and considering patients’ individual financial and coverage status when prescribing insulin.
Pharmacists are advised to learn about and share information with patients about lower-cost options offered by manufacturers.
Other policy recommendations for relevant stakeholders include:
- Limit future insulin list price increases to the rate of inflation.
- Limit out-of-pocket costs without increasing premiums or deductibles by limiting cost sharing to copays of no more than $35, providing first-dollar coverage, or capping costs at no more than $100 per month.
- Eliminate rebates or pass savings from rebates along to consumers without increasing premiums or deductibles.
- Expedite approval of insulin biosimilars to create market competition.
- Include real-time benefit information in electronic medical records.
- Develop a payment model for Medicare Part B beneficiaries, as well as Part D, to lower out-of-pocket copays.
For manufacturers, the society also recommended improving patient assistance programs to be less restrictive and more accountable. And employers, they said, should limit copays without increasing premiums or deductibles, and seek plan options that benefit people with diabetes and provide education about these options during open enrollment.
Of the 11 writing panel members, 4 have pharmaceutical industry disclosures.
A version of this article first appeared on Medscape.com.