User login
Clinical Utility of Methicillin-Resistant Staphylococcus aureus Polymerase Chain Reaction Nasal Swab Testing in Lower Respiratory Tract Infections
From the Hospital of Central Connecticut, New Britain, CT (Dr. Caulfield and Dr. Shepard); Hartford Hospital, Hartford, CT (Dr. Linder and Dr. Dempsey); and the Hartford HealthCare Research Program, Hartford, CT (Dr. O’Sullivan).
Abstract
- Objective: To assess the utility of methicillin-resistant Staphylococcus aureus (MRSA) polymerase chain reaction (PCR) nasal swab testing in patients with lower respiratory tract infections (LRTI).
- Design and setting: Multicenter, retrospective, electronic chart review conducted within the Hartford HealthCare system.
- Participants: Patients who were treated for LRTIs at the Hospital of Central Connecticut or Hartford Hospital between July 1, 2018, and June 30, 2019.
- Measurements: The primary outcome was anti-MRSA days of therapy (DOT) in patients who underwent MRSA PCR testing versus those who did not. In a subgroup analysis, we compared anti-MRSA DOT among patients with appropriate versus inappropriate utilization of the MRSA PCR test.
- Results: Of the 319 patients treated for LRTIs, 155 (48.6%) had a MRSA PCR ordered, and appropriate utilization occurred in 94 (60.6%) of these patients. Anti-MRSA DOT in the MRSA PCR group (n = 155) was shorter than in the group that did not undergo MRSA PCR testing (n = 164), but this difference did not reach statistical significance (1.68 days [interquartile range {IQR}, 0.80-2.74] vs 1.86 days [IQR, 0.56-3.33], P = 0.458). In the subgroup analysis, anti-MRSA DOT was significantly shorter in the MRSA PCR group with appropriate utilization compared to the inappropriate utilization group (1.16 [IQR, 0.44-1.88] vs 2.68 [IQR, 1.75-3.76], P < 0.001)
- Conclusion: Appropriate utilization of MRSA PCR nasal swab testing can reduce DOT in patients with LRTI. Further education is necessary to expand the appropriate use of the MRSA PCR test across our health system.
Keywords: MRSA; LRTI; pneumonia; antimicrobial stewardship; antibiotic resistance.
More than 300,000 patients were hospitalized with methicillin-resistant Staphylococcus aureus (MRSA) infections in the United States in 2017, and at least 10,000 of these cases resulted in mortality.1 While MRSA infections overall are decreasing, it is crucial to continue to employ antimicrobial stewardship tactics to keep these infections at bay. Recently, strains of S. aureus have become resistant to vancomycin, making this bacterium even more difficult to treat.2
A novel tactic in antimicrobial stewardship involves the use of MRSA polymerase chain reaction (PCR) nasal swab testing to rule out the presence of MRSA in patients with lower respiratory tract infections (LRTI). If used appropriately, this approach may decrease the number of days patients are treated with anti-MRSA antimicrobials. Waiting for cultures to speciate can take up to 72 hours,3 meaning that patients may be exposed to 3 days of unnecessary broad-spectrum antibiotics. Results of MRSA PCR assay of nasal swab specimens can be available in 1 to 2 hours,4 allowing for more rapid de-escalation of therapy. Numerous studies have shown that this test has a negative predictive value (NPV) greater than 95%, indicating that a negative nasal swab result may be useful to guide de-escalation of antibiotic therapy.5-8 The purpose of this study was to assess the utility of MRSA PCR nasal swab testing in patients with LRTI throughout the Hartford HealthCare system.
Methods
Design
This study was a multicenter, retrospective, electronic chart review. It was approved by the Hartford HealthCare Institutional Review Board (HHC-2019-0169).
Selection of Participants
Patients were identified through electronic medical record reports based on ICD-10 codes. Records were categorized into 2 groups: patients who received a MRSA PCR nasal swab testing and patients who did not. Patients who received the MRSA PCR were further categorized by appropriate or inappropriate utilization. Appropriate utilization of the MRSA PCR was defined as MRSA PCR ordered within 48 hours of a new vancomycin or linezolid order, and anti-MRSA therapy discontinued within 24 hours of a negative result. Inappropriate utilization of the MRSA PCR was defined as MRSA PCR ordered more than 48 hours after a new vancomycin or linezolid order, or continuation of anti-MRSA therapy despite a negative MRSA PCR and no other evidence of a MRSA infection.
Patients were included if they met all of the following criteria: age 18 years or older, with no upper age limit; treated for a LRTI, identified by ICD-10 codes (J13-22, J44, J85); treated with empiric antibiotics active against MRSA, specifically vancomycin or linezolid; and treated at the Hospital of Central Connecticut (HOCC) or Hartford Hospital (HH) between July 1, 2018, and June 30, 2019, inclusive. Patients were excluded if they met 1 or more of the following criteria: age less than 18 years old; admitted for 48 hours or fewer or discharged from the emergency department; not treated at either facility; treated before July 1, 2018, or after June 30, 2019; treated for ventilator-associated pneumonia; received anti-MRSA therapy within 30 days prior to admission; or treated for a concurrent bacterial infection requiring anti-MRSA therapy.
Outcome Measures
The primary outcome was anti-MRSA days of therapy (DOT) in patients who underwent MRSA PCR testing compared to patients who did not undergo MRSA PCR testing. A subgroup analysis was completed to compare anti-MRSA DOT within patients in the MRSA PCR group. Patients in the subgroup were categorized by appropriate or inappropriate utilization, and anti-MRSA DOT were compared between these groups. Secondary outcomes that were evaluated included length of stay (LOS), 30-day readmission rate, and incidence of acute kidney injury (AKI). Thirty-day readmission was defined as admission to HOCC, HH, or any institution within Hartford HealthCare within 30 days of discharge. AKI was defined as an increase in serum creatinine by ≥ 0.3 mg/dL in 48 hours, increase ≥ 1.5 times baseline, or a urine volume < 0.5 mL/kg/hr for 6 hours.
Statistical Analyses
The study was powered for the primary outcome, anti-MRSA DOT, with a clinically meaningful difference of 1 day. Group sample sizes of 240 in the MRSA PCR group and 160 in the no MRSA PCR group would have afforded 92% power to detect that difference, if the null hypothesis was that both group means were 4 days and the alternative hypothesis was that the mean of the MRSA PCR group was 3 days, with estimated group standard deviations of 80% of each mean. This estimate used an alpha level of 0.05 with a 2-sided t-test. Among those who received a MRSA PCR test, a clinically meaningful difference between appropriate and inappropriate utilization was 5%.
Descriptive statistics were provided for all variables as a function of the individual hospital and for the combined data set. Continuous data were summarized with means and standard deviations (SD), or with median and interquartile ranges (IQR), depending on distribution. Categorical variables were reported as frequencies, using percentages. All data were evaluated for normality of distribution. Inferential statistics comprised a Student’s t-test to compare normally distributed, continuous data between groups. Nonparametric distributions were compared using a Mann-Whitney U test. Categorical comparisons were made using a Fisher’s exact test for 2×2 tables and a Pearson chi-square test for comparisons involving more than 2 groups.
Since anti-MRSA DOT (primary outcome) and LOS (secondary outcome) are often non-normally distributed, they have been transformed (eg, log or square root, again depending on distribution). Whichever native variable or transformation variable was appropriate was used as the outcome measure in a linear regression model to account for the influence of factors (covariates) that show significant univariate differences. Given the relatively small sample size, a maximum of 10 variables were included in the model. All factors were iterated in a forward regression model (most influential first) until no significant changes were observed.
All calculations were performed with SPSS v. 21 (IBM; Armonk, NY) using an a priori alpha level of 0.05, such that all results yielding P < 0.05 were deemed statistically significant.
Results
Of the 561 patient records reviewed, 319 patients were included and 242 patients were excluded. Reasons for exclusion included 65 patients admitted for a duration of 48 hours or less or discharged from the emergency department; 61 patients having another infection requiring anti-MRSA therapy; 60 patients not having a diagnosis of a LRTI or not receiving anti-MRSA therapy; 52 patients having received anti-MRSA therapy within 30 days prior to admission; and 4 patients treated outside of the specified date range.
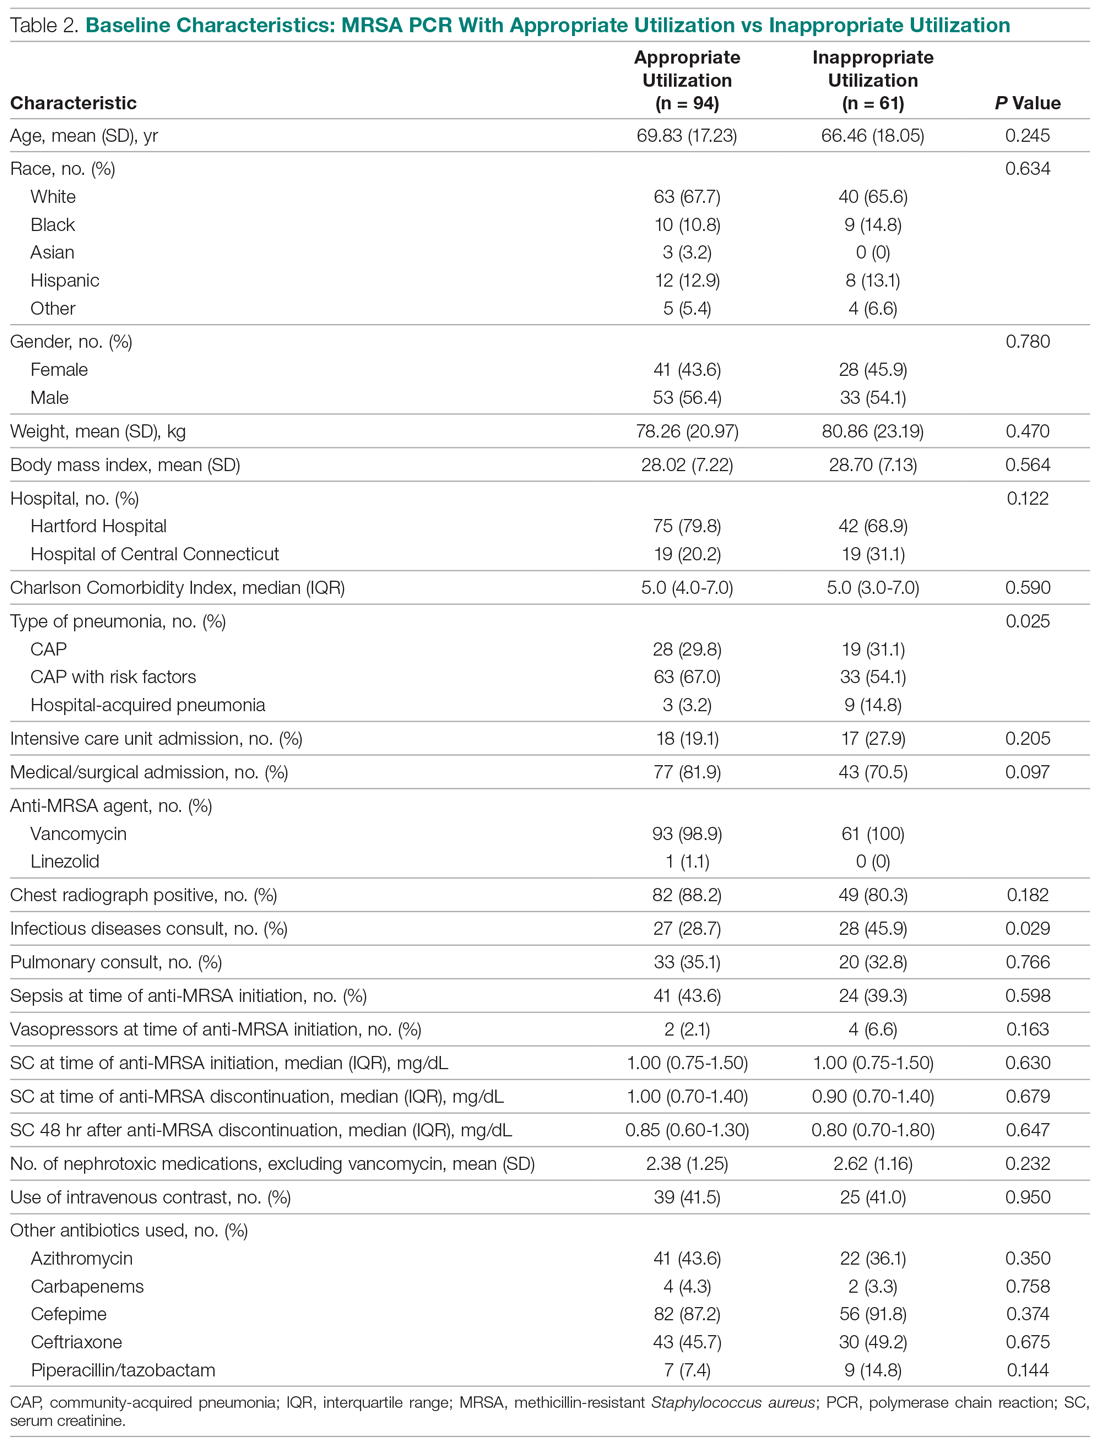
Of the 319 patients included, 155 (48.6%) were in the MRSA PCR group and 164 (51.4%) were in the group that did not undergo MRSA PCR (Table 1). Of the 155 patients with a MRSA PCR ordered, the test was utilized appropriately in 94 (60.6%) patients and inappropriately in 61 (39.4%) patients (Table 2). In the MRSA PCR group, 135 patients had a negative result on PCR assay, with 133 of those patients having negative respiratory cultures, resulting in a NPV of 98.5%. Differences in baseline characteristics between the MRSA PCR and no MRSA PCR groups were observed. The patients in the MRSA PCR group appeared to be significantly more ill than those in the no MRSA PCR group, as indicated by statistically significant differences in intensive care unit (ICU) admissions (P = 0.001), positive chest radiographs (P = 0.034), sepsis at time of anti-MRSA initiation (P = 0.013), pulmonary consults placed (P = 0.003), and carbapenem usage (P = 0.047).
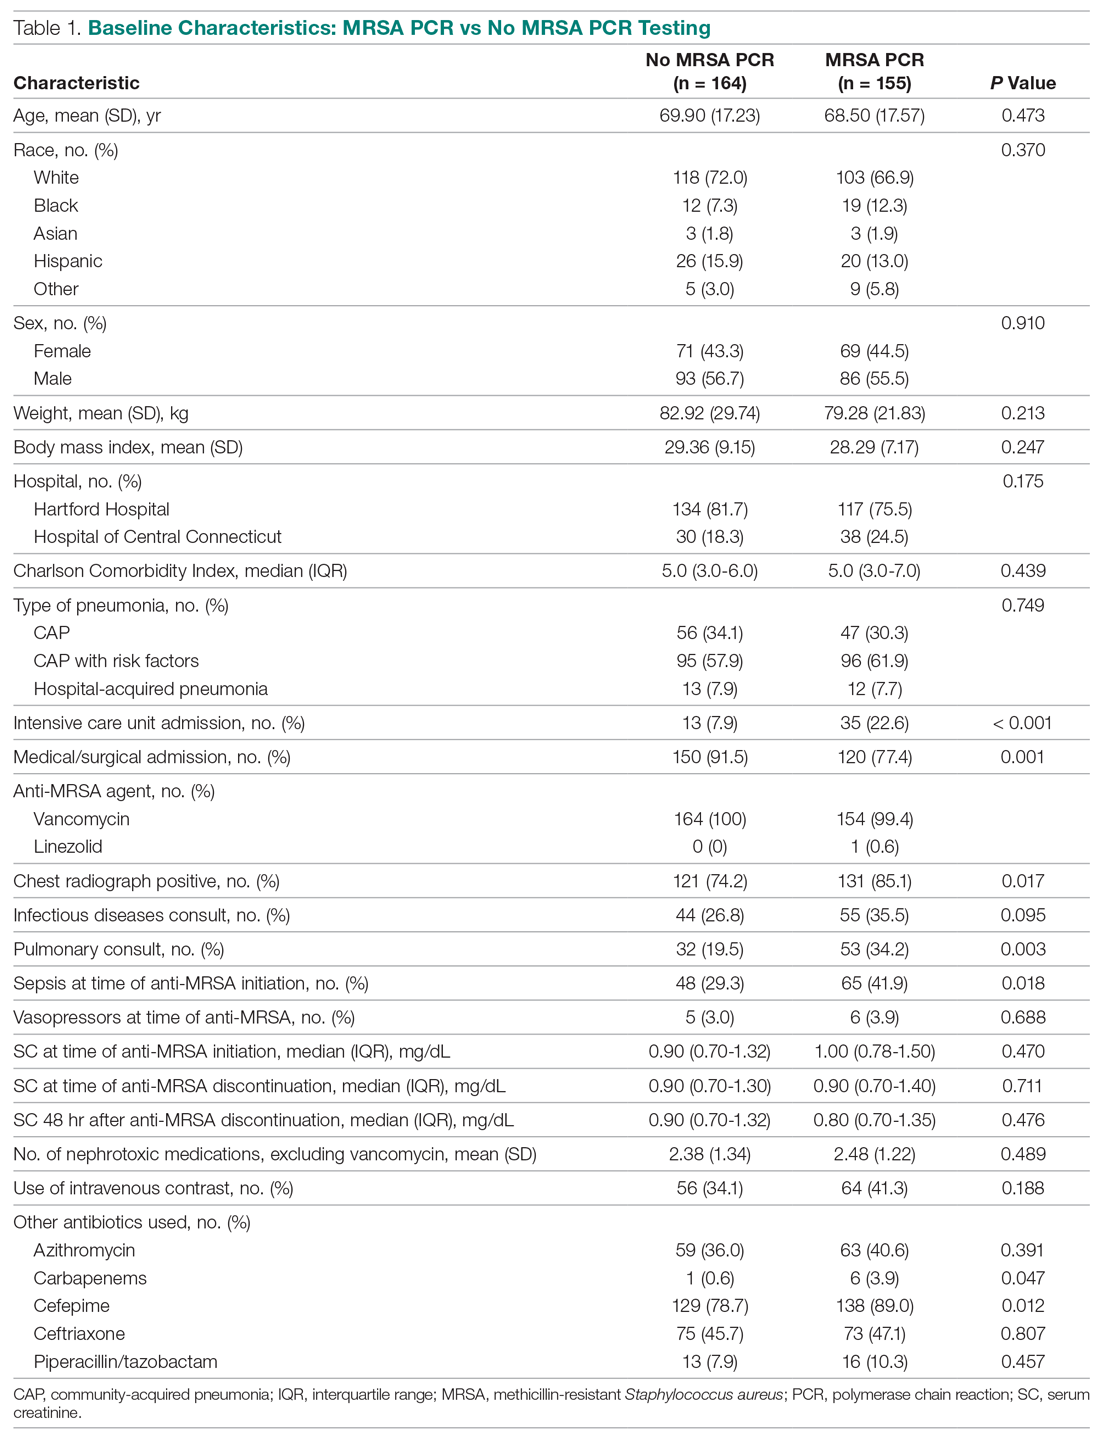
In the subgroup analysis comparing appropriate and inappropriate utilization within the MRSA PCR group, the inappropriate utilization group had significantly higher numbers of infectious diseases consults placed, patients with hospital-acquired pneumonia, and patients with community-acquired pneumonia with risk factors.
Outcomes
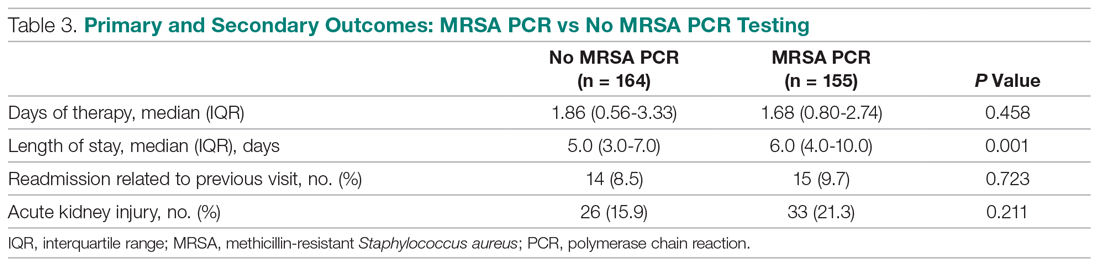
Median anti-MRSA DOT in the MRSA PCR group was shorter than DOT in the no MRSA PCR group, but this difference did not reach statistical significance (1.68 [IQR, 0.80-2.74] vs 1.86 days [IQR, 0.56-3.33], P = 0.458; Table 3). LOS in the MRSA PCR group was longer than in the no MRSA PCR group (6.0 [IQR, 4.0-10.0] vs 5.0 [IQR, 3.0-7.0] days, P = 0.001). There was no difference in 30-day readmissions that were related to the previous visit or incidence of AKI between groups.
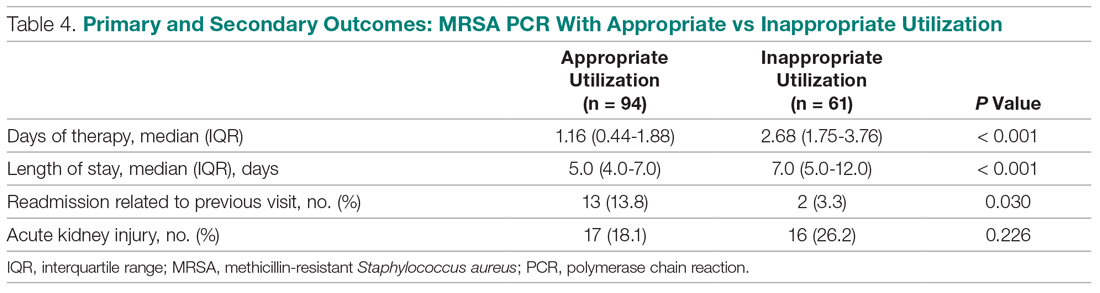
In the subgroup analysis, anti-MRSA DOT in the MRSA PCR group with appropriate utilization was shorter than DOT in the MRSA PCR group with inappropriate utilization (1.16 [IQR, 0.44-1.88] vs 2.68 [IQR, 1.75-3.76] days, P < 0.001; Table 4). LOS in the MRSA PCR group with appropriate utilization was shorter than LOS in the inappropriate utilization group (5.0 [IQR, 4.0-7.0] vs 7.0 [IQR, 5.0-12.0] days, P < 0.001). Thirty-day readmissions that were related to the previous visit were significantly higher in patients in the MRSA PCR group with appropriate utilization (13 vs 2, P = 0.030). There was no difference in incidence of AKI between the groups.
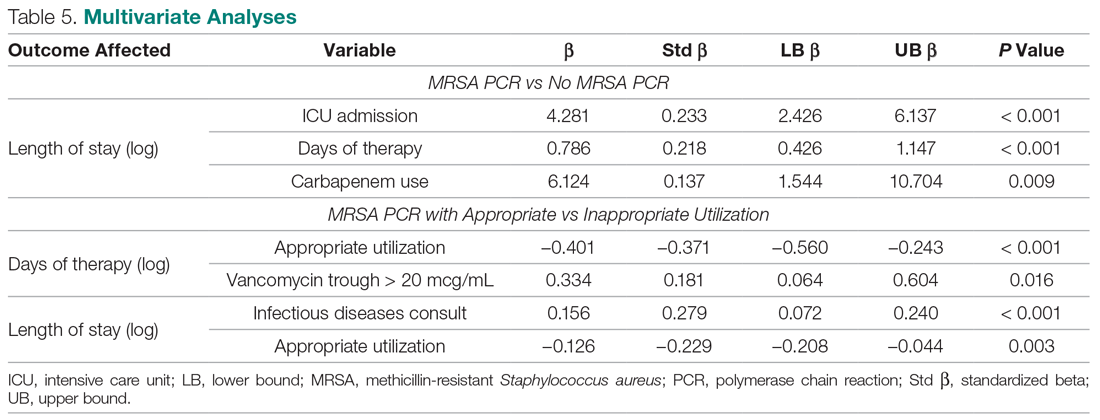
A multivariate analysis was completed to determine whether the sicker MRSA PCR population was confounding outcomes, particularly the secondary outcome of LOS, which was noted to be longer in the MRSA PCR group (Table 5). When comparing LOS in the MRSA PCR and the no MRSA PCR patients, the multivariate analysis showed that admission to the ICU and carbapenem use were associated with a longer LOS (P < 0.001 and P = 0.009, respectively). The incidence of admission to the ICU and carbapenem use were higher in the MRSA PCR group (P = 0.001 and P = 0.047). Therefore, longer LOS in the MRSA PCR patients could be a result of the higher prevalence of ICU admissions and infections requiring carbapenem therapy rather than the result of the MRSA PCR itself.
Discussion
A MRSA PCR nasal swab protocol can be used to minimize a patient’s exposure to unnecessary broad-spectrum antibiotics, thereby preventing antimicrobial resistance. Thus, it is important to assess how our health system is utilizing this antimicrobial stewardship tactic. With the MRSA PCR’s high NPV, providers can be confident that MRSA pneumonia is unlikely in the absence of MRSA colonization. Our study established a NPV of 98.5%, which is similar to other studies, all of which have shown NPVs greater than 95%.5-8 Despite the high NPV, this study demonstrated that only 51.4% of patients with LRTI had orders for a MRSA PCR. Of the 155 patients with a MRSA PCR, the test was utilized appropriately only 60.6% of the time. A majority of the inappropriately utilized tests were due to MRSA PCR orders placed more than 48 hours after anti-MRSA therapy initiation. To our knowledge, no other studies have assessed the clinical utility of MRSA PCR nasal swabs as an antimicrobial stewardship tool in a diverse health system; therefore, these results are useful to guide future practices at our institution. There is a clear need for provider and pharmacist education to increase the use of MRSA PCR nasal swab testing for patients with LRTI being treated with anti-MRSA therapy. Additionally, clinician education regarding the initial timing of the MRSA PCR order and the proper utilization of the results of the MRSA PCR likely will benefit patient outcomes at our institution.
When evaluating anti-MRSA DOT, this study demonstrated a reduction of only 0.18 days (about 4 hours) of anti-MRSA therapy in the patients who received MRSA PCR testing compared to the patients without a MRSA PCR ordered. Our anti-MRSA DOT reduction was lower than what has been reported in similar studies. For example, Baby et al found that the use of the MRSA PCR was associated with 46.6 fewer hours of unnecessary antimicrobial treatment. Willis et al evaluated a pharmacist-driven protocol that resulted in a reduction of 1.8 days of anti-MRSA therapy, despite a protocol compliance rate of only 55%.9,10 In our study, the patients in the MRSA PCR group appeared to be significantly more ill than those in the no MRSA PCR group, which may be the reason for the incongruences in our results compared to the current literature. Characteristics such as ICU admissions, positive chest radiographs, sepsis cases, pulmonary consults, and carbapenem usage—all of which are indicative of a sicker population—were more prevalent in the MRSA PCR group. This sicker population could have underestimated the reduction of DOT in the MRSA PCR group compared to the no MRSA PCR group.
After isolating the MRSA PCR patients in the subgroup analysis, anti-MRSA DOT was 1.5 days shorter when the test was appropriately utilized, which is more comparable to what has been reported in the literature.9,10 Only 60.6% of the MRSA PCR patients had their anti-MRSA therapy appropriately managed based on the MRSA PCR. Interestingly, a majority of patients in the inappropriate utilization group had MRSA PCR tests ordered more than 48 hours after beginning anti-MRSA therapy. More prompt and efficient ordering of the MRSA PCR may have resulted in more opportunities for earlier de-escalation of therapy. Due to these factors, the patients in the inappropriate utilization group could have further contributed to the underestimated difference in anti-MRSA DOT between the MRSA PCR and no MRSA PCR patients in the primary outcome. Additionally, there were no notable differences between the appropriate and inappropriate utilization groups, unlike in the MRSA PCR and no MRSA PCR groups, which is why we were able to draw more robust conclusions in the subgroup analysis. Therefore, the subgroup analysis confirmed that if the results of the MRSA PCR are used appropriately to guide anti-MRSA therapy, patients can potentially avoid 36 hours of broad-spectrum antibiotics.
Data on how the utilization of the MRSA PCR nasal swab can affect LOS are limited; however, one study did report a 2.8-day reduction in LOS after implementation of a pharmacist-driven MRSA PCR nasal swab protocol.11 Our study demonstrated that LOS was significantly longer in the MRSA PCR group than in the no MRSA PCR group. This result was likely affected by the aforementioned sicker MRSA PCR population. Our multivariate analysis further confirmed that ICU admissions were associated with a longer LOS, and, given that the MRSA PCR group had a significantly higher ICU population, this likely confounded these results. If our 2 groups had had more evenly distributed characteristics, it is possible that we could have found a shorter LOS in the MRSA PCR group, similar to what is reported in the literature. In the subgroup analysis, LOS was 2 days shorter in the appropriate utilization group compared to the inappropriate utilization group. This further affirms that the results of the MRSA PCR must be used appropriately in order for patient outcomes, like LOS, to benefit.
The effects of the MRSA PCR nasal swab on 30-day readmission rates and incidence of AKI are not well-documented in the literature. One study did report 30-day readmission rates as an outcome, but did not cite any difference after the implementation of a protocol that utilized MRSA PCR nasal swab testing.12 The outcome of AKI is slightly better represented in the literature, but the results are conflicting. Some studies report no difference after the implementation of a MRSA PCR-based protocol,11 and others report a significant decrease in AKI with the use of the MRSA PCR.9 Our study detected no difference in 30-day readmission rates related to the previous admission or in AKI between the MRSA PCR and no MRSA PCR populations. In the subgroup analysis, 30-day readmission rates were significantly higher in the MRSA PCR group with appropriate utilization than in the group with inappropriate utilization; however, our study was not powered to detect a difference in this secondary outcome.
This study had some limitations that may have affected our results. First, this study was a retrospective chart review. Additionally, the baseline characteristics were not well balanced across the different groups. There were sicker patients in the MRSA PCR group, which may have led to an underestimate of the reduction in DOT and LOS in these patients. Finally, we did not include enough patient records to reach power in the MRSA PCR group due to a higher than expected number of patients meeting exclusion criteria. Had we attained sufficient power, there may have been more profound reductions in DOT and LOS.
Conclusion
MRSA infections are a common cause for hospitalization, and there is a growing need for antimicrobial stewardship efforts to limit unnecessary antibiotic usage in order to prevent resistance. As illustrated in our study, appropriate utilization of the MRSA PCR can reduce DOT up to 1.5 days. However, our results suggest that there is room for provider and pharmacist education to increase the use of MRSA PCR nasal swab testing in patients with LRTI receiving anti-MRSA therapy. Further emphasis on the appropriate utilization of the MRSA PCR within our health care system is essential.
Corresponding author: Casey Dempsey, PharmD, BCIDP, 80 Seymour St., Hartford, CT 06106; casey.dempsey@hhchealth.org.
Financial disclosures: None.
1. Antimicrobial resistance threats. Centers for Disease Control and Prevention web site. www.cdc.gov/drugresistance/biggest-threats.html. Accessed September 9, 2020.
2. Biggest threats and data. Centers for Disease Control and Prevention web site. www.cdc.gov/drugresistance/biggest_threats.html#mrsa. Accessed September 9, 2020.
3. Smith MN, Erdman MJ, Ferreira JA, et al. Clinical utility of methicillin-resistant Staphylococcus aureus nasal polymerase chain reaction assay in critically ill patients with nosocomial pneumonia. J Crit Care. 2017;38:168-171.
4. Giancola SE, Nguyen AT, Le B, et al. Clinical utility of a nasal swab methicillin-resistant Staphylococcus aureus polymerase chain reaction test in intensive and intermediate care unit patients with pneumonia. Diagn Microbiol Infect Dis. 2016;86:307-310.
5. Dangerfield B, Chung A, Webb B, Seville MT. Predictive value of methicillin-resistant Staphylococcus aureus (MRSA) nasal swab PCR assay for MRSA pneumonia. Antimicrob Agents Chemother. 2014;58:859-864.
6. Johnson JA, Wright ME, Sheperd LA, et al. Nasal methicillin-resistant Staphylococcus aureus polymerase chain reaction: a potential use in guiding antibiotic therapy for pneumonia. Perm J. 2015;19: 34-36.
7. Dureau AF, Duclos G, Antonini F, et al. Rapid diagnostic test and use of antibiotic against methicillin-resistant Staphylococcus aureus in adult intensive care unit. Eur J Clin Microbiol Infect Dis. 2017;36:267-272.
8. Tilahun B, Faust AC, McCorstin P, Ortegon A. Nasal colonization and lower respiratory tract infections with methicillin-resistant Staphylococcus aureus. Am J Crit Care. 2015;24:8-12.
9. Baby N, Faust AC, Smith T, et al. Nasal methicillin-resistant Staphylococcus aureus (MRSA) PCR testing reduces the duration of MRSA-targeted therapy in patients with suspected MRSA pneumonia. Antimicrob Agents Chemother. 2017;61:e02432-16.
10. Willis C, Allen B, Tucker C, et al. Impact of a pharmacist-driven methicillin-resistant Staphylococcus aureus surveillance protocol. Am J Health-Syst Pharm. 2017;74:1765-1773.
11. Dadzie P, Dietrich T, Ashurst J. Impact of a pharmacist-driven methicillin-resistant Staphylococcus aureus polymerase chain reaction nasal swab protocol on the de-escalation of empiric vancomycin in patients with pneumonia in a rural healthcare setting. Cureus. 2019;11:e6378
12. Dunaway S, Orwig KW, Arbogast ZQ, et al. Evaluation of a pharmacy-driven methicillin-resistant Staphylococcus aureus surveillance protocol in pneumonia. Int J Clin Pharm. 2018;40;526-532.
From the Hospital of Central Connecticut, New Britain, CT (Dr. Caulfield and Dr. Shepard); Hartford Hospital, Hartford, CT (Dr. Linder and Dr. Dempsey); and the Hartford HealthCare Research Program, Hartford, CT (Dr. O’Sullivan).
Abstract
- Objective: To assess the utility of methicillin-resistant Staphylococcus aureus (MRSA) polymerase chain reaction (PCR) nasal swab testing in patients with lower respiratory tract infections (LRTI).
- Design and setting: Multicenter, retrospective, electronic chart review conducted within the Hartford HealthCare system.
- Participants: Patients who were treated for LRTIs at the Hospital of Central Connecticut or Hartford Hospital between July 1, 2018, and June 30, 2019.
- Measurements: The primary outcome was anti-MRSA days of therapy (DOT) in patients who underwent MRSA PCR testing versus those who did not. In a subgroup analysis, we compared anti-MRSA DOT among patients with appropriate versus inappropriate utilization of the MRSA PCR test.
- Results: Of the 319 patients treated for LRTIs, 155 (48.6%) had a MRSA PCR ordered, and appropriate utilization occurred in 94 (60.6%) of these patients. Anti-MRSA DOT in the MRSA PCR group (n = 155) was shorter than in the group that did not undergo MRSA PCR testing (n = 164), but this difference did not reach statistical significance (1.68 days [interquartile range {IQR}, 0.80-2.74] vs 1.86 days [IQR, 0.56-3.33], P = 0.458). In the subgroup analysis, anti-MRSA DOT was significantly shorter in the MRSA PCR group with appropriate utilization compared to the inappropriate utilization group (1.16 [IQR, 0.44-1.88] vs 2.68 [IQR, 1.75-3.76], P < 0.001)
- Conclusion: Appropriate utilization of MRSA PCR nasal swab testing can reduce DOT in patients with LRTI. Further education is necessary to expand the appropriate use of the MRSA PCR test across our health system.
Keywords: MRSA; LRTI; pneumonia; antimicrobial stewardship; antibiotic resistance.
More than 300,000 patients were hospitalized with methicillin-resistant Staphylococcus aureus (MRSA) infections in the United States in 2017, and at least 10,000 of these cases resulted in mortality.1 While MRSA infections overall are decreasing, it is crucial to continue to employ antimicrobial stewardship tactics to keep these infections at bay. Recently, strains of S. aureus have become resistant to vancomycin, making this bacterium even more difficult to treat.2
A novel tactic in antimicrobial stewardship involves the use of MRSA polymerase chain reaction (PCR) nasal swab testing to rule out the presence of MRSA in patients with lower respiratory tract infections (LRTI). If used appropriately, this approach may decrease the number of days patients are treated with anti-MRSA antimicrobials. Waiting for cultures to speciate can take up to 72 hours,3 meaning that patients may be exposed to 3 days of unnecessary broad-spectrum antibiotics. Results of MRSA PCR assay of nasal swab specimens can be available in 1 to 2 hours,4 allowing for more rapid de-escalation of therapy. Numerous studies have shown that this test has a negative predictive value (NPV) greater than 95%, indicating that a negative nasal swab result may be useful to guide de-escalation of antibiotic therapy.5-8 The purpose of this study was to assess the utility of MRSA PCR nasal swab testing in patients with LRTI throughout the Hartford HealthCare system.
Methods
Design
This study was a multicenter, retrospective, electronic chart review. It was approved by the Hartford HealthCare Institutional Review Board (HHC-2019-0169).
Selection of Participants
Patients were identified through electronic medical record reports based on ICD-10 codes. Records were categorized into 2 groups: patients who received a MRSA PCR nasal swab testing and patients who did not. Patients who received the MRSA PCR were further categorized by appropriate or inappropriate utilization. Appropriate utilization of the MRSA PCR was defined as MRSA PCR ordered within 48 hours of a new vancomycin or linezolid order, and anti-MRSA therapy discontinued within 24 hours of a negative result. Inappropriate utilization of the MRSA PCR was defined as MRSA PCR ordered more than 48 hours after a new vancomycin or linezolid order, or continuation of anti-MRSA therapy despite a negative MRSA PCR and no other evidence of a MRSA infection.
Patients were included if they met all of the following criteria: age 18 years or older, with no upper age limit; treated for a LRTI, identified by ICD-10 codes (J13-22, J44, J85); treated with empiric antibiotics active against MRSA, specifically vancomycin or linezolid; and treated at the Hospital of Central Connecticut (HOCC) or Hartford Hospital (HH) between July 1, 2018, and June 30, 2019, inclusive. Patients were excluded if they met 1 or more of the following criteria: age less than 18 years old; admitted for 48 hours or fewer or discharged from the emergency department; not treated at either facility; treated before July 1, 2018, or after June 30, 2019; treated for ventilator-associated pneumonia; received anti-MRSA therapy within 30 days prior to admission; or treated for a concurrent bacterial infection requiring anti-MRSA therapy.
Outcome Measures
The primary outcome was anti-MRSA days of therapy (DOT) in patients who underwent MRSA PCR testing compared to patients who did not undergo MRSA PCR testing. A subgroup analysis was completed to compare anti-MRSA DOT within patients in the MRSA PCR group. Patients in the subgroup were categorized by appropriate or inappropriate utilization, and anti-MRSA DOT were compared between these groups. Secondary outcomes that were evaluated included length of stay (LOS), 30-day readmission rate, and incidence of acute kidney injury (AKI). Thirty-day readmission was defined as admission to HOCC, HH, or any institution within Hartford HealthCare within 30 days of discharge. AKI was defined as an increase in serum creatinine by ≥ 0.3 mg/dL in 48 hours, increase ≥ 1.5 times baseline, or a urine volume < 0.5 mL/kg/hr for 6 hours.
Statistical Analyses
The study was powered for the primary outcome, anti-MRSA DOT, with a clinically meaningful difference of 1 day. Group sample sizes of 240 in the MRSA PCR group and 160 in the no MRSA PCR group would have afforded 92% power to detect that difference, if the null hypothesis was that both group means were 4 days and the alternative hypothesis was that the mean of the MRSA PCR group was 3 days, with estimated group standard deviations of 80% of each mean. This estimate used an alpha level of 0.05 with a 2-sided t-test. Among those who received a MRSA PCR test, a clinically meaningful difference between appropriate and inappropriate utilization was 5%.
Descriptive statistics were provided for all variables as a function of the individual hospital and for the combined data set. Continuous data were summarized with means and standard deviations (SD), or with median and interquartile ranges (IQR), depending on distribution. Categorical variables were reported as frequencies, using percentages. All data were evaluated for normality of distribution. Inferential statistics comprised a Student’s t-test to compare normally distributed, continuous data between groups. Nonparametric distributions were compared using a Mann-Whitney U test. Categorical comparisons were made using a Fisher’s exact test for 2×2 tables and a Pearson chi-square test for comparisons involving more than 2 groups.
Since anti-MRSA DOT (primary outcome) and LOS (secondary outcome) are often non-normally distributed, they have been transformed (eg, log or square root, again depending on distribution). Whichever native variable or transformation variable was appropriate was used as the outcome measure in a linear regression model to account for the influence of factors (covariates) that show significant univariate differences. Given the relatively small sample size, a maximum of 10 variables were included in the model. All factors were iterated in a forward regression model (most influential first) until no significant changes were observed.
All calculations were performed with SPSS v. 21 (IBM; Armonk, NY) using an a priori alpha level of 0.05, such that all results yielding P < 0.05 were deemed statistically significant.
Results
Of the 561 patient records reviewed, 319 patients were included and 242 patients were excluded. Reasons for exclusion included 65 patients admitted for a duration of 48 hours or less or discharged from the emergency department; 61 patients having another infection requiring anti-MRSA therapy; 60 patients not having a diagnosis of a LRTI or not receiving anti-MRSA therapy; 52 patients having received anti-MRSA therapy within 30 days prior to admission; and 4 patients treated outside of the specified date range.
Of the 319 patients included, 155 (48.6%) were in the MRSA PCR group and 164 (51.4%) were in the group that did not undergo MRSA PCR (Table 1). Of the 155 patients with a MRSA PCR ordered, the test was utilized appropriately in 94 (60.6%) patients and inappropriately in 61 (39.4%) patients (Table 2). In the MRSA PCR group, 135 patients had a negative result on PCR assay, with 133 of those patients having negative respiratory cultures, resulting in a NPV of 98.5%. Differences in baseline characteristics between the MRSA PCR and no MRSA PCR groups were observed. The patients in the MRSA PCR group appeared to be significantly more ill than those in the no MRSA PCR group, as indicated by statistically significant differences in intensive care unit (ICU) admissions (P = 0.001), positive chest radiographs (P = 0.034), sepsis at time of anti-MRSA initiation (P = 0.013), pulmonary consults placed (P = 0.003), and carbapenem usage (P = 0.047).
In the subgroup analysis comparing appropriate and inappropriate utilization within the MRSA PCR group, the inappropriate utilization group had significantly higher numbers of infectious diseases consults placed, patients with hospital-acquired pneumonia, and patients with community-acquired pneumonia with risk factors.
Outcomes
Median anti-MRSA DOT in the MRSA PCR group was shorter than DOT in the no MRSA PCR group, but this difference did not reach statistical significance (1.68 [IQR, 0.80-2.74] vs 1.86 days [IQR, 0.56-3.33], P = 0.458; Table 3). LOS in the MRSA PCR group was longer than in the no MRSA PCR group (6.0 [IQR, 4.0-10.0] vs 5.0 [IQR, 3.0-7.0] days, P = 0.001). There was no difference in 30-day readmissions that were related to the previous visit or incidence of AKI between groups.
In the subgroup analysis, anti-MRSA DOT in the MRSA PCR group with appropriate utilization was shorter than DOT in the MRSA PCR group with inappropriate utilization (1.16 [IQR, 0.44-1.88] vs 2.68 [IQR, 1.75-3.76] days, P < 0.001; Table 4). LOS in the MRSA PCR group with appropriate utilization was shorter than LOS in the inappropriate utilization group (5.0 [IQR, 4.0-7.0] vs 7.0 [IQR, 5.0-12.0] days, P < 0.001). Thirty-day readmissions that were related to the previous visit were significantly higher in patients in the MRSA PCR group with appropriate utilization (13 vs 2, P = 0.030). There was no difference in incidence of AKI between the groups.
A multivariate analysis was completed to determine whether the sicker MRSA PCR population was confounding outcomes, particularly the secondary outcome of LOS, which was noted to be longer in the MRSA PCR group (Table 5). When comparing LOS in the MRSA PCR and the no MRSA PCR patients, the multivariate analysis showed that admission to the ICU and carbapenem use were associated with a longer LOS (P < 0.001 and P = 0.009, respectively). The incidence of admission to the ICU and carbapenem use were higher in the MRSA PCR group (P = 0.001 and P = 0.047). Therefore, longer LOS in the MRSA PCR patients could be a result of the higher prevalence of ICU admissions and infections requiring carbapenem therapy rather than the result of the MRSA PCR itself.
Discussion
A MRSA PCR nasal swab protocol can be used to minimize a patient’s exposure to unnecessary broad-spectrum antibiotics, thereby preventing antimicrobial resistance. Thus, it is important to assess how our health system is utilizing this antimicrobial stewardship tactic. With the MRSA PCR’s high NPV, providers can be confident that MRSA pneumonia is unlikely in the absence of MRSA colonization. Our study established a NPV of 98.5%, which is similar to other studies, all of which have shown NPVs greater than 95%.5-8 Despite the high NPV, this study demonstrated that only 51.4% of patients with LRTI had orders for a MRSA PCR. Of the 155 patients with a MRSA PCR, the test was utilized appropriately only 60.6% of the time. A majority of the inappropriately utilized tests were due to MRSA PCR orders placed more than 48 hours after anti-MRSA therapy initiation. To our knowledge, no other studies have assessed the clinical utility of MRSA PCR nasal swabs as an antimicrobial stewardship tool in a diverse health system; therefore, these results are useful to guide future practices at our institution. There is a clear need for provider and pharmacist education to increase the use of MRSA PCR nasal swab testing for patients with LRTI being treated with anti-MRSA therapy. Additionally, clinician education regarding the initial timing of the MRSA PCR order and the proper utilization of the results of the MRSA PCR likely will benefit patient outcomes at our institution.
When evaluating anti-MRSA DOT, this study demonstrated a reduction of only 0.18 days (about 4 hours) of anti-MRSA therapy in the patients who received MRSA PCR testing compared to the patients without a MRSA PCR ordered. Our anti-MRSA DOT reduction was lower than what has been reported in similar studies. For example, Baby et al found that the use of the MRSA PCR was associated with 46.6 fewer hours of unnecessary antimicrobial treatment. Willis et al evaluated a pharmacist-driven protocol that resulted in a reduction of 1.8 days of anti-MRSA therapy, despite a protocol compliance rate of only 55%.9,10 In our study, the patients in the MRSA PCR group appeared to be significantly more ill than those in the no MRSA PCR group, which may be the reason for the incongruences in our results compared to the current literature. Characteristics such as ICU admissions, positive chest radiographs, sepsis cases, pulmonary consults, and carbapenem usage—all of which are indicative of a sicker population—were more prevalent in the MRSA PCR group. This sicker population could have underestimated the reduction of DOT in the MRSA PCR group compared to the no MRSA PCR group.
After isolating the MRSA PCR patients in the subgroup analysis, anti-MRSA DOT was 1.5 days shorter when the test was appropriately utilized, which is more comparable to what has been reported in the literature.9,10 Only 60.6% of the MRSA PCR patients had their anti-MRSA therapy appropriately managed based on the MRSA PCR. Interestingly, a majority of patients in the inappropriate utilization group had MRSA PCR tests ordered more than 48 hours after beginning anti-MRSA therapy. More prompt and efficient ordering of the MRSA PCR may have resulted in more opportunities for earlier de-escalation of therapy. Due to these factors, the patients in the inappropriate utilization group could have further contributed to the underestimated difference in anti-MRSA DOT between the MRSA PCR and no MRSA PCR patients in the primary outcome. Additionally, there were no notable differences between the appropriate and inappropriate utilization groups, unlike in the MRSA PCR and no MRSA PCR groups, which is why we were able to draw more robust conclusions in the subgroup analysis. Therefore, the subgroup analysis confirmed that if the results of the MRSA PCR are used appropriately to guide anti-MRSA therapy, patients can potentially avoid 36 hours of broad-spectrum antibiotics.
Data on how the utilization of the MRSA PCR nasal swab can affect LOS are limited; however, one study did report a 2.8-day reduction in LOS after implementation of a pharmacist-driven MRSA PCR nasal swab protocol.11 Our study demonstrated that LOS was significantly longer in the MRSA PCR group than in the no MRSA PCR group. This result was likely affected by the aforementioned sicker MRSA PCR population. Our multivariate analysis further confirmed that ICU admissions were associated with a longer LOS, and, given that the MRSA PCR group had a significantly higher ICU population, this likely confounded these results. If our 2 groups had had more evenly distributed characteristics, it is possible that we could have found a shorter LOS in the MRSA PCR group, similar to what is reported in the literature. In the subgroup analysis, LOS was 2 days shorter in the appropriate utilization group compared to the inappropriate utilization group. This further affirms that the results of the MRSA PCR must be used appropriately in order for patient outcomes, like LOS, to benefit.
The effects of the MRSA PCR nasal swab on 30-day readmission rates and incidence of AKI are not well-documented in the literature. One study did report 30-day readmission rates as an outcome, but did not cite any difference after the implementation of a protocol that utilized MRSA PCR nasal swab testing.12 The outcome of AKI is slightly better represented in the literature, but the results are conflicting. Some studies report no difference after the implementation of a MRSA PCR-based protocol,11 and others report a significant decrease in AKI with the use of the MRSA PCR.9 Our study detected no difference in 30-day readmission rates related to the previous admission or in AKI between the MRSA PCR and no MRSA PCR populations. In the subgroup analysis, 30-day readmission rates were significantly higher in the MRSA PCR group with appropriate utilization than in the group with inappropriate utilization; however, our study was not powered to detect a difference in this secondary outcome.
This study had some limitations that may have affected our results. First, this study was a retrospective chart review. Additionally, the baseline characteristics were not well balanced across the different groups. There were sicker patients in the MRSA PCR group, which may have led to an underestimate of the reduction in DOT and LOS in these patients. Finally, we did not include enough patient records to reach power in the MRSA PCR group due to a higher than expected number of patients meeting exclusion criteria. Had we attained sufficient power, there may have been more profound reductions in DOT and LOS.
Conclusion
MRSA infections are a common cause for hospitalization, and there is a growing need for antimicrobial stewardship efforts to limit unnecessary antibiotic usage in order to prevent resistance. As illustrated in our study, appropriate utilization of the MRSA PCR can reduce DOT up to 1.5 days. However, our results suggest that there is room for provider and pharmacist education to increase the use of MRSA PCR nasal swab testing in patients with LRTI receiving anti-MRSA therapy. Further emphasis on the appropriate utilization of the MRSA PCR within our health care system is essential.
Corresponding author: Casey Dempsey, PharmD, BCIDP, 80 Seymour St., Hartford, CT 06106; casey.dempsey@hhchealth.org.
Financial disclosures: None.
From the Hospital of Central Connecticut, New Britain, CT (Dr. Caulfield and Dr. Shepard); Hartford Hospital, Hartford, CT (Dr. Linder and Dr. Dempsey); and the Hartford HealthCare Research Program, Hartford, CT (Dr. O’Sullivan).
Abstract
- Objective: To assess the utility of methicillin-resistant Staphylococcus aureus (MRSA) polymerase chain reaction (PCR) nasal swab testing in patients with lower respiratory tract infections (LRTI).
- Design and setting: Multicenter, retrospective, electronic chart review conducted within the Hartford HealthCare system.
- Participants: Patients who were treated for LRTIs at the Hospital of Central Connecticut or Hartford Hospital between July 1, 2018, and June 30, 2019.
- Measurements: The primary outcome was anti-MRSA days of therapy (DOT) in patients who underwent MRSA PCR testing versus those who did not. In a subgroup analysis, we compared anti-MRSA DOT among patients with appropriate versus inappropriate utilization of the MRSA PCR test.
- Results: Of the 319 patients treated for LRTIs, 155 (48.6%) had a MRSA PCR ordered, and appropriate utilization occurred in 94 (60.6%) of these patients. Anti-MRSA DOT in the MRSA PCR group (n = 155) was shorter than in the group that did not undergo MRSA PCR testing (n = 164), but this difference did not reach statistical significance (1.68 days [interquartile range {IQR}, 0.80-2.74] vs 1.86 days [IQR, 0.56-3.33], P = 0.458). In the subgroup analysis, anti-MRSA DOT was significantly shorter in the MRSA PCR group with appropriate utilization compared to the inappropriate utilization group (1.16 [IQR, 0.44-1.88] vs 2.68 [IQR, 1.75-3.76], P < 0.001)
- Conclusion: Appropriate utilization of MRSA PCR nasal swab testing can reduce DOT in patients with LRTI. Further education is necessary to expand the appropriate use of the MRSA PCR test across our health system.
Keywords: MRSA; LRTI; pneumonia; antimicrobial stewardship; antibiotic resistance.
More than 300,000 patients were hospitalized with methicillin-resistant Staphylococcus aureus (MRSA) infections in the United States in 2017, and at least 10,000 of these cases resulted in mortality.1 While MRSA infections overall are decreasing, it is crucial to continue to employ antimicrobial stewardship tactics to keep these infections at bay. Recently, strains of S. aureus have become resistant to vancomycin, making this bacterium even more difficult to treat.2
A novel tactic in antimicrobial stewardship involves the use of MRSA polymerase chain reaction (PCR) nasal swab testing to rule out the presence of MRSA in patients with lower respiratory tract infections (LRTI). If used appropriately, this approach may decrease the number of days patients are treated with anti-MRSA antimicrobials. Waiting for cultures to speciate can take up to 72 hours,3 meaning that patients may be exposed to 3 days of unnecessary broad-spectrum antibiotics. Results of MRSA PCR assay of nasal swab specimens can be available in 1 to 2 hours,4 allowing for more rapid de-escalation of therapy. Numerous studies have shown that this test has a negative predictive value (NPV) greater than 95%, indicating that a negative nasal swab result may be useful to guide de-escalation of antibiotic therapy.5-8 The purpose of this study was to assess the utility of MRSA PCR nasal swab testing in patients with LRTI throughout the Hartford HealthCare system.
Methods
Design
This study was a multicenter, retrospective, electronic chart review. It was approved by the Hartford HealthCare Institutional Review Board (HHC-2019-0169).
Selection of Participants
Patients were identified through electronic medical record reports based on ICD-10 codes. Records were categorized into 2 groups: patients who received a MRSA PCR nasal swab testing and patients who did not. Patients who received the MRSA PCR were further categorized by appropriate or inappropriate utilization. Appropriate utilization of the MRSA PCR was defined as MRSA PCR ordered within 48 hours of a new vancomycin or linezolid order, and anti-MRSA therapy discontinued within 24 hours of a negative result. Inappropriate utilization of the MRSA PCR was defined as MRSA PCR ordered more than 48 hours after a new vancomycin or linezolid order, or continuation of anti-MRSA therapy despite a negative MRSA PCR and no other evidence of a MRSA infection.
Patients were included if they met all of the following criteria: age 18 years or older, with no upper age limit; treated for a LRTI, identified by ICD-10 codes (J13-22, J44, J85); treated with empiric antibiotics active against MRSA, specifically vancomycin or linezolid; and treated at the Hospital of Central Connecticut (HOCC) or Hartford Hospital (HH) between July 1, 2018, and June 30, 2019, inclusive. Patients were excluded if they met 1 or more of the following criteria: age less than 18 years old; admitted for 48 hours or fewer or discharged from the emergency department; not treated at either facility; treated before July 1, 2018, or after June 30, 2019; treated for ventilator-associated pneumonia; received anti-MRSA therapy within 30 days prior to admission; or treated for a concurrent bacterial infection requiring anti-MRSA therapy.
Outcome Measures
The primary outcome was anti-MRSA days of therapy (DOT) in patients who underwent MRSA PCR testing compared to patients who did not undergo MRSA PCR testing. A subgroup analysis was completed to compare anti-MRSA DOT within patients in the MRSA PCR group. Patients in the subgroup were categorized by appropriate or inappropriate utilization, and anti-MRSA DOT were compared between these groups. Secondary outcomes that were evaluated included length of stay (LOS), 30-day readmission rate, and incidence of acute kidney injury (AKI). Thirty-day readmission was defined as admission to HOCC, HH, or any institution within Hartford HealthCare within 30 days of discharge. AKI was defined as an increase in serum creatinine by ≥ 0.3 mg/dL in 48 hours, increase ≥ 1.5 times baseline, or a urine volume < 0.5 mL/kg/hr for 6 hours.
Statistical Analyses
The study was powered for the primary outcome, anti-MRSA DOT, with a clinically meaningful difference of 1 day. Group sample sizes of 240 in the MRSA PCR group and 160 in the no MRSA PCR group would have afforded 92% power to detect that difference, if the null hypothesis was that both group means were 4 days and the alternative hypothesis was that the mean of the MRSA PCR group was 3 days, with estimated group standard deviations of 80% of each mean. This estimate used an alpha level of 0.05 with a 2-sided t-test. Among those who received a MRSA PCR test, a clinically meaningful difference between appropriate and inappropriate utilization was 5%.
Descriptive statistics were provided for all variables as a function of the individual hospital and for the combined data set. Continuous data were summarized with means and standard deviations (SD), or with median and interquartile ranges (IQR), depending on distribution. Categorical variables were reported as frequencies, using percentages. All data were evaluated for normality of distribution. Inferential statistics comprised a Student’s t-test to compare normally distributed, continuous data between groups. Nonparametric distributions were compared using a Mann-Whitney U test. Categorical comparisons were made using a Fisher’s exact test for 2×2 tables and a Pearson chi-square test for comparisons involving more than 2 groups.
Since anti-MRSA DOT (primary outcome) and LOS (secondary outcome) are often non-normally distributed, they have been transformed (eg, log or square root, again depending on distribution). Whichever native variable or transformation variable was appropriate was used as the outcome measure in a linear regression model to account for the influence of factors (covariates) that show significant univariate differences. Given the relatively small sample size, a maximum of 10 variables were included in the model. All factors were iterated in a forward regression model (most influential first) until no significant changes were observed.
All calculations were performed with SPSS v. 21 (IBM; Armonk, NY) using an a priori alpha level of 0.05, such that all results yielding P < 0.05 were deemed statistically significant.
Results
Of the 561 patient records reviewed, 319 patients were included and 242 patients were excluded. Reasons for exclusion included 65 patients admitted for a duration of 48 hours or less or discharged from the emergency department; 61 patients having another infection requiring anti-MRSA therapy; 60 patients not having a diagnosis of a LRTI or not receiving anti-MRSA therapy; 52 patients having received anti-MRSA therapy within 30 days prior to admission; and 4 patients treated outside of the specified date range.
Of the 319 patients included, 155 (48.6%) were in the MRSA PCR group and 164 (51.4%) were in the group that did not undergo MRSA PCR (Table 1). Of the 155 patients with a MRSA PCR ordered, the test was utilized appropriately in 94 (60.6%) patients and inappropriately in 61 (39.4%) patients (Table 2). In the MRSA PCR group, 135 patients had a negative result on PCR assay, with 133 of those patients having negative respiratory cultures, resulting in a NPV of 98.5%. Differences in baseline characteristics between the MRSA PCR and no MRSA PCR groups were observed. The patients in the MRSA PCR group appeared to be significantly more ill than those in the no MRSA PCR group, as indicated by statistically significant differences in intensive care unit (ICU) admissions (P = 0.001), positive chest radiographs (P = 0.034), sepsis at time of anti-MRSA initiation (P = 0.013), pulmonary consults placed (P = 0.003), and carbapenem usage (P = 0.047).
In the subgroup analysis comparing appropriate and inappropriate utilization within the MRSA PCR group, the inappropriate utilization group had significantly higher numbers of infectious diseases consults placed, patients with hospital-acquired pneumonia, and patients with community-acquired pneumonia with risk factors.
Outcomes
Median anti-MRSA DOT in the MRSA PCR group was shorter than DOT in the no MRSA PCR group, but this difference did not reach statistical significance (1.68 [IQR, 0.80-2.74] vs 1.86 days [IQR, 0.56-3.33], P = 0.458; Table 3). LOS in the MRSA PCR group was longer than in the no MRSA PCR group (6.0 [IQR, 4.0-10.0] vs 5.0 [IQR, 3.0-7.0] days, P = 0.001). There was no difference in 30-day readmissions that were related to the previous visit or incidence of AKI between groups.
In the subgroup analysis, anti-MRSA DOT in the MRSA PCR group with appropriate utilization was shorter than DOT in the MRSA PCR group with inappropriate utilization (1.16 [IQR, 0.44-1.88] vs 2.68 [IQR, 1.75-3.76] days, P < 0.001; Table 4). LOS in the MRSA PCR group with appropriate utilization was shorter than LOS in the inappropriate utilization group (5.0 [IQR, 4.0-7.0] vs 7.0 [IQR, 5.0-12.0] days, P < 0.001). Thirty-day readmissions that were related to the previous visit were significantly higher in patients in the MRSA PCR group with appropriate utilization (13 vs 2, P = 0.030). There was no difference in incidence of AKI between the groups.
A multivariate analysis was completed to determine whether the sicker MRSA PCR population was confounding outcomes, particularly the secondary outcome of LOS, which was noted to be longer in the MRSA PCR group (Table 5). When comparing LOS in the MRSA PCR and the no MRSA PCR patients, the multivariate analysis showed that admission to the ICU and carbapenem use were associated with a longer LOS (P < 0.001 and P = 0.009, respectively). The incidence of admission to the ICU and carbapenem use were higher in the MRSA PCR group (P = 0.001 and P = 0.047). Therefore, longer LOS in the MRSA PCR patients could be a result of the higher prevalence of ICU admissions and infections requiring carbapenem therapy rather than the result of the MRSA PCR itself.
Discussion
A MRSA PCR nasal swab protocol can be used to minimize a patient’s exposure to unnecessary broad-spectrum antibiotics, thereby preventing antimicrobial resistance. Thus, it is important to assess how our health system is utilizing this antimicrobial stewardship tactic. With the MRSA PCR’s high NPV, providers can be confident that MRSA pneumonia is unlikely in the absence of MRSA colonization. Our study established a NPV of 98.5%, which is similar to other studies, all of which have shown NPVs greater than 95%.5-8 Despite the high NPV, this study demonstrated that only 51.4% of patients with LRTI had orders for a MRSA PCR. Of the 155 patients with a MRSA PCR, the test was utilized appropriately only 60.6% of the time. A majority of the inappropriately utilized tests were due to MRSA PCR orders placed more than 48 hours after anti-MRSA therapy initiation. To our knowledge, no other studies have assessed the clinical utility of MRSA PCR nasal swabs as an antimicrobial stewardship tool in a diverse health system; therefore, these results are useful to guide future practices at our institution. There is a clear need for provider and pharmacist education to increase the use of MRSA PCR nasal swab testing for patients with LRTI being treated with anti-MRSA therapy. Additionally, clinician education regarding the initial timing of the MRSA PCR order and the proper utilization of the results of the MRSA PCR likely will benefit patient outcomes at our institution.
When evaluating anti-MRSA DOT, this study demonstrated a reduction of only 0.18 days (about 4 hours) of anti-MRSA therapy in the patients who received MRSA PCR testing compared to the patients without a MRSA PCR ordered. Our anti-MRSA DOT reduction was lower than what has been reported in similar studies. For example, Baby et al found that the use of the MRSA PCR was associated with 46.6 fewer hours of unnecessary antimicrobial treatment. Willis et al evaluated a pharmacist-driven protocol that resulted in a reduction of 1.8 days of anti-MRSA therapy, despite a protocol compliance rate of only 55%.9,10 In our study, the patients in the MRSA PCR group appeared to be significantly more ill than those in the no MRSA PCR group, which may be the reason for the incongruences in our results compared to the current literature. Characteristics such as ICU admissions, positive chest radiographs, sepsis cases, pulmonary consults, and carbapenem usage—all of which are indicative of a sicker population—were more prevalent in the MRSA PCR group. This sicker population could have underestimated the reduction of DOT in the MRSA PCR group compared to the no MRSA PCR group.
After isolating the MRSA PCR patients in the subgroup analysis, anti-MRSA DOT was 1.5 days shorter when the test was appropriately utilized, which is more comparable to what has been reported in the literature.9,10 Only 60.6% of the MRSA PCR patients had their anti-MRSA therapy appropriately managed based on the MRSA PCR. Interestingly, a majority of patients in the inappropriate utilization group had MRSA PCR tests ordered more than 48 hours after beginning anti-MRSA therapy. More prompt and efficient ordering of the MRSA PCR may have resulted in more opportunities for earlier de-escalation of therapy. Due to these factors, the patients in the inappropriate utilization group could have further contributed to the underestimated difference in anti-MRSA DOT between the MRSA PCR and no MRSA PCR patients in the primary outcome. Additionally, there were no notable differences between the appropriate and inappropriate utilization groups, unlike in the MRSA PCR and no MRSA PCR groups, which is why we were able to draw more robust conclusions in the subgroup analysis. Therefore, the subgroup analysis confirmed that if the results of the MRSA PCR are used appropriately to guide anti-MRSA therapy, patients can potentially avoid 36 hours of broad-spectrum antibiotics.
Data on how the utilization of the MRSA PCR nasal swab can affect LOS are limited; however, one study did report a 2.8-day reduction in LOS after implementation of a pharmacist-driven MRSA PCR nasal swab protocol.11 Our study demonstrated that LOS was significantly longer in the MRSA PCR group than in the no MRSA PCR group. This result was likely affected by the aforementioned sicker MRSA PCR population. Our multivariate analysis further confirmed that ICU admissions were associated with a longer LOS, and, given that the MRSA PCR group had a significantly higher ICU population, this likely confounded these results. If our 2 groups had had more evenly distributed characteristics, it is possible that we could have found a shorter LOS in the MRSA PCR group, similar to what is reported in the literature. In the subgroup analysis, LOS was 2 days shorter in the appropriate utilization group compared to the inappropriate utilization group. This further affirms that the results of the MRSA PCR must be used appropriately in order for patient outcomes, like LOS, to benefit.
The effects of the MRSA PCR nasal swab on 30-day readmission rates and incidence of AKI are not well-documented in the literature. One study did report 30-day readmission rates as an outcome, but did not cite any difference after the implementation of a protocol that utilized MRSA PCR nasal swab testing.12 The outcome of AKI is slightly better represented in the literature, but the results are conflicting. Some studies report no difference after the implementation of a MRSA PCR-based protocol,11 and others report a significant decrease in AKI with the use of the MRSA PCR.9 Our study detected no difference in 30-day readmission rates related to the previous admission or in AKI between the MRSA PCR and no MRSA PCR populations. In the subgroup analysis, 30-day readmission rates were significantly higher in the MRSA PCR group with appropriate utilization than in the group with inappropriate utilization; however, our study was not powered to detect a difference in this secondary outcome.
This study had some limitations that may have affected our results. First, this study was a retrospective chart review. Additionally, the baseline characteristics were not well balanced across the different groups. There were sicker patients in the MRSA PCR group, which may have led to an underestimate of the reduction in DOT and LOS in these patients. Finally, we did not include enough patient records to reach power in the MRSA PCR group due to a higher than expected number of patients meeting exclusion criteria. Had we attained sufficient power, there may have been more profound reductions in DOT and LOS.
Conclusion
MRSA infections are a common cause for hospitalization, and there is a growing need for antimicrobial stewardship efforts to limit unnecessary antibiotic usage in order to prevent resistance. As illustrated in our study, appropriate utilization of the MRSA PCR can reduce DOT up to 1.5 days. However, our results suggest that there is room for provider and pharmacist education to increase the use of MRSA PCR nasal swab testing in patients with LRTI receiving anti-MRSA therapy. Further emphasis on the appropriate utilization of the MRSA PCR within our health care system is essential.
Corresponding author: Casey Dempsey, PharmD, BCIDP, 80 Seymour St., Hartford, CT 06106; casey.dempsey@hhchealth.org.
Financial disclosures: None.
1. Antimicrobial resistance threats. Centers for Disease Control and Prevention web site. www.cdc.gov/drugresistance/biggest-threats.html. Accessed September 9, 2020.
2. Biggest threats and data. Centers for Disease Control and Prevention web site. www.cdc.gov/drugresistance/biggest_threats.html#mrsa. Accessed September 9, 2020.
3. Smith MN, Erdman MJ, Ferreira JA, et al. Clinical utility of methicillin-resistant Staphylococcus aureus nasal polymerase chain reaction assay in critically ill patients with nosocomial pneumonia. J Crit Care. 2017;38:168-171.
4. Giancola SE, Nguyen AT, Le B, et al. Clinical utility of a nasal swab methicillin-resistant Staphylococcus aureus polymerase chain reaction test in intensive and intermediate care unit patients with pneumonia. Diagn Microbiol Infect Dis. 2016;86:307-310.
5. Dangerfield B, Chung A, Webb B, Seville MT. Predictive value of methicillin-resistant Staphylococcus aureus (MRSA) nasal swab PCR assay for MRSA pneumonia. Antimicrob Agents Chemother. 2014;58:859-864.
6. Johnson JA, Wright ME, Sheperd LA, et al. Nasal methicillin-resistant Staphylococcus aureus polymerase chain reaction: a potential use in guiding antibiotic therapy for pneumonia. Perm J. 2015;19: 34-36.
7. Dureau AF, Duclos G, Antonini F, et al. Rapid diagnostic test and use of antibiotic against methicillin-resistant Staphylococcus aureus in adult intensive care unit. Eur J Clin Microbiol Infect Dis. 2017;36:267-272.
8. Tilahun B, Faust AC, McCorstin P, Ortegon A. Nasal colonization and lower respiratory tract infections with methicillin-resistant Staphylococcus aureus. Am J Crit Care. 2015;24:8-12.
9. Baby N, Faust AC, Smith T, et al. Nasal methicillin-resistant Staphylococcus aureus (MRSA) PCR testing reduces the duration of MRSA-targeted therapy in patients with suspected MRSA pneumonia. Antimicrob Agents Chemother. 2017;61:e02432-16.
10. Willis C, Allen B, Tucker C, et al. Impact of a pharmacist-driven methicillin-resistant Staphylococcus aureus surveillance protocol. Am J Health-Syst Pharm. 2017;74:1765-1773.
11. Dadzie P, Dietrich T, Ashurst J. Impact of a pharmacist-driven methicillin-resistant Staphylococcus aureus polymerase chain reaction nasal swab protocol on the de-escalation of empiric vancomycin in patients with pneumonia in a rural healthcare setting. Cureus. 2019;11:e6378
12. Dunaway S, Orwig KW, Arbogast ZQ, et al. Evaluation of a pharmacy-driven methicillin-resistant Staphylococcus aureus surveillance protocol in pneumonia. Int J Clin Pharm. 2018;40;526-532.
1. Antimicrobial resistance threats. Centers for Disease Control and Prevention web site. www.cdc.gov/drugresistance/biggest-threats.html. Accessed September 9, 2020.
2. Biggest threats and data. Centers for Disease Control and Prevention web site. www.cdc.gov/drugresistance/biggest_threats.html#mrsa. Accessed September 9, 2020.
3. Smith MN, Erdman MJ, Ferreira JA, et al. Clinical utility of methicillin-resistant Staphylococcus aureus nasal polymerase chain reaction assay in critically ill patients with nosocomial pneumonia. J Crit Care. 2017;38:168-171.
4. Giancola SE, Nguyen AT, Le B, et al. Clinical utility of a nasal swab methicillin-resistant Staphylococcus aureus polymerase chain reaction test in intensive and intermediate care unit patients with pneumonia. Diagn Microbiol Infect Dis. 2016;86:307-310.
5. Dangerfield B, Chung A, Webb B, Seville MT. Predictive value of methicillin-resistant Staphylococcus aureus (MRSA) nasal swab PCR assay for MRSA pneumonia. Antimicrob Agents Chemother. 2014;58:859-864.
6. Johnson JA, Wright ME, Sheperd LA, et al. Nasal methicillin-resistant Staphylococcus aureus polymerase chain reaction: a potential use in guiding antibiotic therapy for pneumonia. Perm J. 2015;19: 34-36.
7. Dureau AF, Duclos G, Antonini F, et al. Rapid diagnostic test and use of antibiotic against methicillin-resistant Staphylococcus aureus in adult intensive care unit. Eur J Clin Microbiol Infect Dis. 2017;36:267-272.
8. Tilahun B, Faust AC, McCorstin P, Ortegon A. Nasal colonization and lower respiratory tract infections with methicillin-resistant Staphylococcus aureus. Am J Crit Care. 2015;24:8-12.
9. Baby N, Faust AC, Smith T, et al. Nasal methicillin-resistant Staphylococcus aureus (MRSA) PCR testing reduces the duration of MRSA-targeted therapy in patients with suspected MRSA pneumonia. Antimicrob Agents Chemother. 2017;61:e02432-16.
10. Willis C, Allen B, Tucker C, et al. Impact of a pharmacist-driven methicillin-resistant Staphylococcus aureus surveillance protocol. Am J Health-Syst Pharm. 2017;74:1765-1773.
11. Dadzie P, Dietrich T, Ashurst J. Impact of a pharmacist-driven methicillin-resistant Staphylococcus aureus polymerase chain reaction nasal swab protocol on the de-escalation of empiric vancomycin in patients with pneumonia in a rural healthcare setting. Cureus. 2019;11:e6378
12. Dunaway S, Orwig KW, Arbogast ZQ, et al. Evaluation of a pharmacy-driven methicillin-resistant Staphylococcus aureus surveillance protocol in pneumonia. Int J Clin Pharm. 2018;40;526-532.
Wildfires’ toxic air leaves damage long after the smoke clears
When researchers arrived in Seeley Lake, Mont., a town tucked in the northern Rockies, 3 years ago, they could still smell the smoke a day after it cleared from devastating wildfires. Their plan was to chart how long it took for people to recover from living for 7 weeks surrounded by relentless smoke.
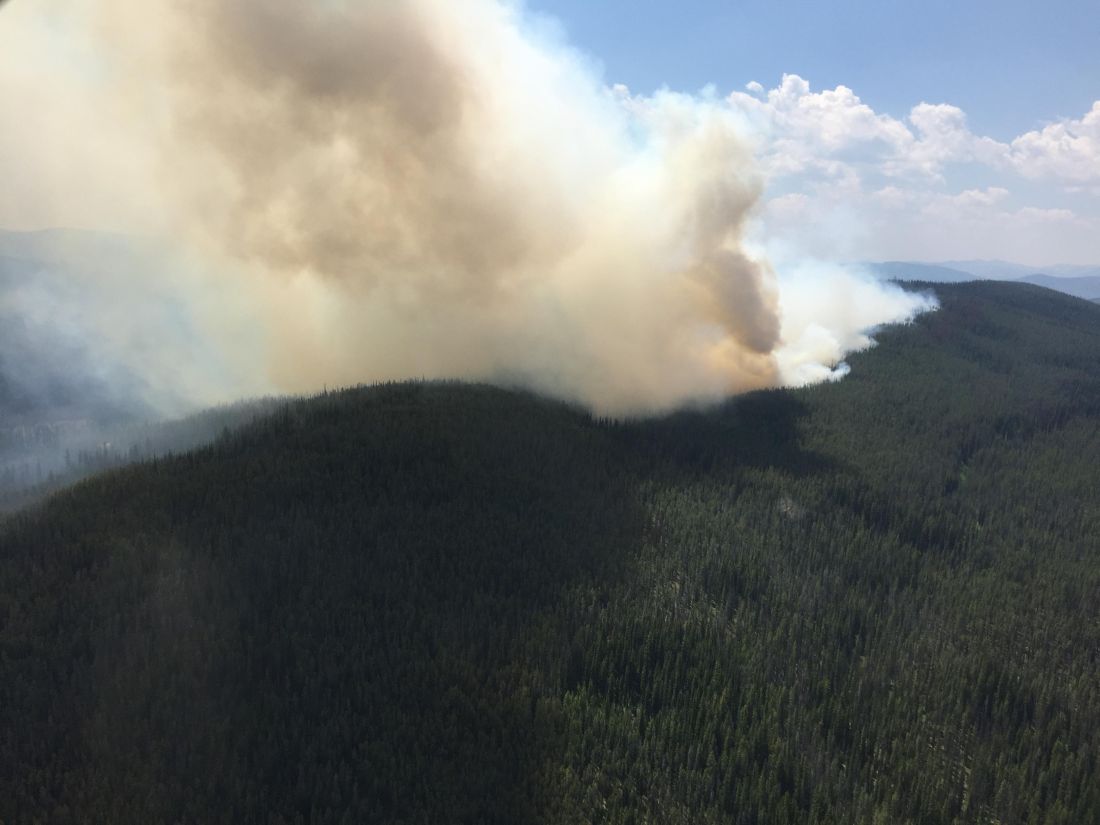
They still don’t know, because most residents haven’t recovered. In fact, they’ve gotten worse.
Forest fires had funneled hazardous air into Seeley Lake, a town of fewer than 2,000 people, for 49 days. The air quality was so bad that on some days the monitoring stations couldn’t measure the extent of the pollution. The intensity of the smoke and the length of time residents had been trapped in it were unprecedented, prompting county officials to issue their first evacuation orders because of smoke, not fire risk.
Many people stayed. That made Seeley Lake an ideal place to track the long-term health of people inundated by wildfire pollution.
So far, researchers have found that people’s lung capacity declined in the first 2 years after the smoke cleared. Chris Migliaccio, PhD, an immunologist with the University of Montana, Missoula, and associates found the percentage of residents whose lung function sank below normal thresholds more than doubled in the first year after the fire and remained low a year after that.
“There’s something wrong there,” Dr. Migliaccio said.
While it’s long been known that smoke can be dangerous when in the thick of it – triggering asthma attacks, cardiac arrests, hospitalizations and more – the Seeley Lake research confirmed what public health experts feared: Wildfire haze can have consequences long after it’s gone.
That doesn’t bode well for the 78 million people in the western United States now confronting historic wildfires.
Toxic air from fires has blanketed California and the Pacific Northwest for weeks now, causing some of the world’s worst air quality. California fires have burned roughly 2.3 million acres so far this year, and the wildfire season isn’t over yet. Oregon estimates 500,000 people in the state have been under a notice to either prepare to evacuate or leave. Smoke from the West Coast blazes has drifted as far away as Europe.
Extreme wildfires are predicted to become a regular occurrence because of climate change. And, as more people increasingly settle in fire-prone places, the risks increase. That’s shifted wildfires from being a perennial reality for rural mountain towns to becoming an annual threat for areas across the West.
Perry Hystad, PhD, an associate professor at Oregon State University, Corvallis, said the Seeley Lake research offers unique insights into wildfire smoke’s impact, which until recently had largely been unexplored. He said similar studies are likely to follow because of this fire season.
“This is the question that everybody is asking,” Dr. Hystad said. “‘I’ve been sitting in smoke for 2 weeks, how concerned should I be?’”
Dr. Migliaccio wants to know whether the lung damage he saw in Seeley Lake is reversible – or even treatable. (Think of an inhaler for asthma or other medication that prevents swollen airways.)
But those discoveries will have to wait. The team hasn’t been able to return to Seeley Lake this year because of the coronavirus pandemic.
Dr. Migliaccio said more research is needed on whether wildfire smoke damages organs besides the lungs, and whether routine exposure makes people more susceptible to diseases.
The combination of the fire season and the pandemic has spurred other questions as well, like whether heavy smoke exposure could lead to more COVID-19 deaths. A recent study showed a spike in influenza cases following major fire seasons.
“Now you have the combination of flu season and COVID and the wildfires,” Dr. Migliaccio said. “How are all these things going to interact come late fall or winter?”
A case study
Seeley Lake has long known smoke. It sits in a narrow valley between vast stretches of thick forests.
On a recent September day, Boyd Gossard stood on his back porch and pointed toward the mountains that were ablaze in 2017.
Mr. Gossard, 80, expects to have some summer days veiled in haze. But that year, he said, he could hardly see his neighbor’s house a few hundred feet away.
“I’ve seen a lot of smoke in my career,” said Mr. Gossard, who worked in timber management and served as a wildland firefighter. “But having to just live in it like this was very different. It got to you after a while.”
When Missoula County health officials urged people to leave town and flee the hazardous smoke, many residents stayed close to home. Some said their jobs wouldn’t let them leave. Others didn’t have a place to go – or the money to get there.
Health officials warned those who stayed to avoid exercising and breathing too hard, to remain inside, and to follow steps to make their homes as smoke free as possible. The health department also worked to get air filters to those who needed them most.
But when flames got too close, some people had to sleep outside in campsites on the other side of town.
Understanding the science of smoke
One of the known dangers of smoke is particulate matter. Smaller than the width of a human hair, it can bypass a body’s defenses, lodging deep into lungs. Lu Hu, PhD, an atmospheric chemist with the University of Montana, said air quality reports are based on how much of that pollution is in the air.
“It’s like lead; there’s no safe level, but still we have a safety measure for what’s allowable,” Dr. Hu said. “Some things kill you fast and some things kill you slowly.”
While air quality measurements can gauge the overall amount of pollution, they can’t assess which specific toxins people are inhaling. Dr. Hu is collaborating with other scientists to better predict how smoke travels and what pollutants people actually breathe.
He said smoke’s chemistry changes based on how far it travels and what’s burning, among other factors.
Over the past few years, teams of researchers drove trucks along fire lines to collect smoke samples. Other scientists boarded cargo planes and flew into smoke plumes to take samples right from a fire’s source. Still others stationed at a mountain lookout captured smoke drifting in from nearby fires. And ground-level machines at a Missoula site logged data over 2 summers.
Bob Yokelson, PhD, a longtime smoke researcher with the University of Montana, said scientists are getting closer to understanding its contents. And, he said, “it’s not all bad news.”
Temperature and sunlight can change some pollutants over time. Some dangerous particles seem to disappear. But others, such as ozone, can increase as smoke ages.
Dr. Yokelson said scientists are still a long way from determining a safe level of exposure to the hundred-odd pollutants in smoke.
“We can complete the circle by measuring not only what’s in smoke, but measuring what’s happening to the people who breathe it,” Dr. Yokelson said. “That’s where the future of health research on smoke is going to go.”
Coping with nowhere to flee
In the meantime, those studying wildland smoke hope what they’ve learned so far can better prepare people to live in the haze when evacuation isn’t an option.
Joan Wollan, 82, was one of the Seeley Lake study participants. She stayed put during the 2017 fire because her house at the time sat on a border of the evacuation zone. The air made her eyes burn and her husband cough. She ordered air filters to create cleaner air inside her home, which helped.
On a recent day, the air in Mrs. Wollan’s new neighborhood in Missoula turned that familiar gray-orange as traces of fires from elsewhere appeared. Local health officials warned that western Montana could get hit by some of the worst air quality the state had seen since those 2017 fires.
If it got bad enough, Mrs. Wollan said, she’d get the filters out of storage or look for a way to get to cleaner air – “if there is someplace in Montana that isn’t smoky.”
KHN (Kaiser Health News) is a nonprofit news service covering health issues. It is an editorially independent program of KFF (Kaiser Family Foundation), which is not affiliated with Kaiser Permanente.
When researchers arrived in Seeley Lake, Mont., a town tucked in the northern Rockies, 3 years ago, they could still smell the smoke a day after it cleared from devastating wildfires. Their plan was to chart how long it took for people to recover from living for 7 weeks surrounded by relentless smoke.
They still don’t know, because most residents haven’t recovered. In fact, they’ve gotten worse.
Forest fires had funneled hazardous air into Seeley Lake, a town of fewer than 2,000 people, for 49 days. The air quality was so bad that on some days the monitoring stations couldn’t measure the extent of the pollution. The intensity of the smoke and the length of time residents had been trapped in it were unprecedented, prompting county officials to issue their first evacuation orders because of smoke, not fire risk.
Many people stayed. That made Seeley Lake an ideal place to track the long-term health of people inundated by wildfire pollution.
So far, researchers have found that people’s lung capacity declined in the first 2 years after the smoke cleared. Chris Migliaccio, PhD, an immunologist with the University of Montana, Missoula, and associates found the percentage of residents whose lung function sank below normal thresholds more than doubled in the first year after the fire and remained low a year after that.
“There’s something wrong there,” Dr. Migliaccio said.
While it’s long been known that smoke can be dangerous when in the thick of it – triggering asthma attacks, cardiac arrests, hospitalizations and more – the Seeley Lake research confirmed what public health experts feared: Wildfire haze can have consequences long after it’s gone.
That doesn’t bode well for the 78 million people in the western United States now confronting historic wildfires.
Toxic air from fires has blanketed California and the Pacific Northwest for weeks now, causing some of the world’s worst air quality. California fires have burned roughly 2.3 million acres so far this year, and the wildfire season isn’t over yet. Oregon estimates 500,000 people in the state have been under a notice to either prepare to evacuate or leave. Smoke from the West Coast blazes has drifted as far away as Europe.
Extreme wildfires are predicted to become a regular occurrence because of climate change. And, as more people increasingly settle in fire-prone places, the risks increase. That’s shifted wildfires from being a perennial reality for rural mountain towns to becoming an annual threat for areas across the West.
Perry Hystad, PhD, an associate professor at Oregon State University, Corvallis, said the Seeley Lake research offers unique insights into wildfire smoke’s impact, which until recently had largely been unexplored. He said similar studies are likely to follow because of this fire season.
“This is the question that everybody is asking,” Dr. Hystad said. “‘I’ve been sitting in smoke for 2 weeks, how concerned should I be?’”
Dr. Migliaccio wants to know whether the lung damage he saw in Seeley Lake is reversible – or even treatable. (Think of an inhaler for asthma or other medication that prevents swollen airways.)
But those discoveries will have to wait. The team hasn’t been able to return to Seeley Lake this year because of the coronavirus pandemic.
Dr. Migliaccio said more research is needed on whether wildfire smoke damages organs besides the lungs, and whether routine exposure makes people more susceptible to diseases.
The combination of the fire season and the pandemic has spurred other questions as well, like whether heavy smoke exposure could lead to more COVID-19 deaths. A recent study showed a spike in influenza cases following major fire seasons.
“Now you have the combination of flu season and COVID and the wildfires,” Dr. Migliaccio said. “How are all these things going to interact come late fall or winter?”
A case study
Seeley Lake has long known smoke. It sits in a narrow valley between vast stretches of thick forests.
On a recent September day, Boyd Gossard stood on his back porch and pointed toward the mountains that were ablaze in 2017.
Mr. Gossard, 80, expects to have some summer days veiled in haze. But that year, he said, he could hardly see his neighbor’s house a few hundred feet away.
“I’ve seen a lot of smoke in my career,” said Mr. Gossard, who worked in timber management and served as a wildland firefighter. “But having to just live in it like this was very different. It got to you after a while.”
When Missoula County health officials urged people to leave town and flee the hazardous smoke, many residents stayed close to home. Some said their jobs wouldn’t let them leave. Others didn’t have a place to go – or the money to get there.
Health officials warned those who stayed to avoid exercising and breathing too hard, to remain inside, and to follow steps to make their homes as smoke free as possible. The health department also worked to get air filters to those who needed them most.
But when flames got too close, some people had to sleep outside in campsites on the other side of town.
Understanding the science of smoke
One of the known dangers of smoke is particulate matter. Smaller than the width of a human hair, it can bypass a body’s defenses, lodging deep into lungs. Lu Hu, PhD, an atmospheric chemist with the University of Montana, said air quality reports are based on how much of that pollution is in the air.
“It’s like lead; there’s no safe level, but still we have a safety measure for what’s allowable,” Dr. Hu said. “Some things kill you fast and some things kill you slowly.”
While air quality measurements can gauge the overall amount of pollution, they can’t assess which specific toxins people are inhaling. Dr. Hu is collaborating with other scientists to better predict how smoke travels and what pollutants people actually breathe.
He said smoke’s chemistry changes based on how far it travels and what’s burning, among other factors.
Over the past few years, teams of researchers drove trucks along fire lines to collect smoke samples. Other scientists boarded cargo planes and flew into smoke plumes to take samples right from a fire’s source. Still others stationed at a mountain lookout captured smoke drifting in from nearby fires. And ground-level machines at a Missoula site logged data over 2 summers.
Bob Yokelson, PhD, a longtime smoke researcher with the University of Montana, said scientists are getting closer to understanding its contents. And, he said, “it’s not all bad news.”
Temperature and sunlight can change some pollutants over time. Some dangerous particles seem to disappear. But others, such as ozone, can increase as smoke ages.
Dr. Yokelson said scientists are still a long way from determining a safe level of exposure to the hundred-odd pollutants in smoke.
“We can complete the circle by measuring not only what’s in smoke, but measuring what’s happening to the people who breathe it,” Dr. Yokelson said. “That’s where the future of health research on smoke is going to go.”
Coping with nowhere to flee
In the meantime, those studying wildland smoke hope what they’ve learned so far can better prepare people to live in the haze when evacuation isn’t an option.
Joan Wollan, 82, was one of the Seeley Lake study participants. She stayed put during the 2017 fire because her house at the time sat on a border of the evacuation zone. The air made her eyes burn and her husband cough. She ordered air filters to create cleaner air inside her home, which helped.
On a recent day, the air in Mrs. Wollan’s new neighborhood in Missoula turned that familiar gray-orange as traces of fires from elsewhere appeared. Local health officials warned that western Montana could get hit by some of the worst air quality the state had seen since those 2017 fires.
If it got bad enough, Mrs. Wollan said, she’d get the filters out of storage or look for a way to get to cleaner air – “if there is someplace in Montana that isn’t smoky.”
KHN (Kaiser Health News) is a nonprofit news service covering health issues. It is an editorially independent program of KFF (Kaiser Family Foundation), which is not affiliated with Kaiser Permanente.
When researchers arrived in Seeley Lake, Mont., a town tucked in the northern Rockies, 3 years ago, they could still smell the smoke a day after it cleared from devastating wildfires. Their plan was to chart how long it took for people to recover from living for 7 weeks surrounded by relentless smoke.
They still don’t know, because most residents haven’t recovered. In fact, they’ve gotten worse.
Forest fires had funneled hazardous air into Seeley Lake, a town of fewer than 2,000 people, for 49 days. The air quality was so bad that on some days the monitoring stations couldn’t measure the extent of the pollution. The intensity of the smoke and the length of time residents had been trapped in it were unprecedented, prompting county officials to issue their first evacuation orders because of smoke, not fire risk.
Many people stayed. That made Seeley Lake an ideal place to track the long-term health of people inundated by wildfire pollution.
So far, researchers have found that people’s lung capacity declined in the first 2 years after the smoke cleared. Chris Migliaccio, PhD, an immunologist with the University of Montana, Missoula, and associates found the percentage of residents whose lung function sank below normal thresholds more than doubled in the first year after the fire and remained low a year after that.
“There’s something wrong there,” Dr. Migliaccio said.
While it’s long been known that smoke can be dangerous when in the thick of it – triggering asthma attacks, cardiac arrests, hospitalizations and more – the Seeley Lake research confirmed what public health experts feared: Wildfire haze can have consequences long after it’s gone.
That doesn’t bode well for the 78 million people in the western United States now confronting historic wildfires.
Toxic air from fires has blanketed California and the Pacific Northwest for weeks now, causing some of the world’s worst air quality. California fires have burned roughly 2.3 million acres so far this year, and the wildfire season isn’t over yet. Oregon estimates 500,000 people in the state have been under a notice to either prepare to evacuate or leave. Smoke from the West Coast blazes has drifted as far away as Europe.
Extreme wildfires are predicted to become a regular occurrence because of climate change. And, as more people increasingly settle in fire-prone places, the risks increase. That’s shifted wildfires from being a perennial reality for rural mountain towns to becoming an annual threat for areas across the West.
Perry Hystad, PhD, an associate professor at Oregon State University, Corvallis, said the Seeley Lake research offers unique insights into wildfire smoke’s impact, which until recently had largely been unexplored. He said similar studies are likely to follow because of this fire season.
“This is the question that everybody is asking,” Dr. Hystad said. “‘I’ve been sitting in smoke for 2 weeks, how concerned should I be?’”
Dr. Migliaccio wants to know whether the lung damage he saw in Seeley Lake is reversible – or even treatable. (Think of an inhaler for asthma or other medication that prevents swollen airways.)
But those discoveries will have to wait. The team hasn’t been able to return to Seeley Lake this year because of the coronavirus pandemic.
Dr. Migliaccio said more research is needed on whether wildfire smoke damages organs besides the lungs, and whether routine exposure makes people more susceptible to diseases.
The combination of the fire season and the pandemic has spurred other questions as well, like whether heavy smoke exposure could lead to more COVID-19 deaths. A recent study showed a spike in influenza cases following major fire seasons.
“Now you have the combination of flu season and COVID and the wildfires,” Dr. Migliaccio said. “How are all these things going to interact come late fall or winter?”
A case study
Seeley Lake has long known smoke. It sits in a narrow valley between vast stretches of thick forests.
On a recent September day, Boyd Gossard stood on his back porch and pointed toward the mountains that were ablaze in 2017.
Mr. Gossard, 80, expects to have some summer days veiled in haze. But that year, he said, he could hardly see his neighbor’s house a few hundred feet away.
“I’ve seen a lot of smoke in my career,” said Mr. Gossard, who worked in timber management and served as a wildland firefighter. “But having to just live in it like this was very different. It got to you after a while.”
When Missoula County health officials urged people to leave town and flee the hazardous smoke, many residents stayed close to home. Some said their jobs wouldn’t let them leave. Others didn’t have a place to go – or the money to get there.
Health officials warned those who stayed to avoid exercising and breathing too hard, to remain inside, and to follow steps to make their homes as smoke free as possible. The health department also worked to get air filters to those who needed them most.
But when flames got too close, some people had to sleep outside in campsites on the other side of town.
Understanding the science of smoke
One of the known dangers of smoke is particulate matter. Smaller than the width of a human hair, it can bypass a body’s defenses, lodging deep into lungs. Lu Hu, PhD, an atmospheric chemist with the University of Montana, said air quality reports are based on how much of that pollution is in the air.
“It’s like lead; there’s no safe level, but still we have a safety measure for what’s allowable,” Dr. Hu said. “Some things kill you fast and some things kill you slowly.”
While air quality measurements can gauge the overall amount of pollution, they can’t assess which specific toxins people are inhaling. Dr. Hu is collaborating with other scientists to better predict how smoke travels and what pollutants people actually breathe.
He said smoke’s chemistry changes based on how far it travels and what’s burning, among other factors.
Over the past few years, teams of researchers drove trucks along fire lines to collect smoke samples. Other scientists boarded cargo planes and flew into smoke plumes to take samples right from a fire’s source. Still others stationed at a mountain lookout captured smoke drifting in from nearby fires. And ground-level machines at a Missoula site logged data over 2 summers.
Bob Yokelson, PhD, a longtime smoke researcher with the University of Montana, said scientists are getting closer to understanding its contents. And, he said, “it’s not all bad news.”
Temperature and sunlight can change some pollutants over time. Some dangerous particles seem to disappear. But others, such as ozone, can increase as smoke ages.
Dr. Yokelson said scientists are still a long way from determining a safe level of exposure to the hundred-odd pollutants in smoke.
“We can complete the circle by measuring not only what’s in smoke, but measuring what’s happening to the people who breathe it,” Dr. Yokelson said. “That’s where the future of health research on smoke is going to go.”
Coping with nowhere to flee
In the meantime, those studying wildland smoke hope what they’ve learned so far can better prepare people to live in the haze when evacuation isn’t an option.
Joan Wollan, 82, was one of the Seeley Lake study participants. She stayed put during the 2017 fire because her house at the time sat on a border of the evacuation zone. The air made her eyes burn and her husband cough. She ordered air filters to create cleaner air inside her home, which helped.
On a recent day, the air in Mrs. Wollan’s new neighborhood in Missoula turned that familiar gray-orange as traces of fires from elsewhere appeared. Local health officials warned that western Montana could get hit by some of the worst air quality the state had seen since those 2017 fires.
If it got bad enough, Mrs. Wollan said, she’d get the filters out of storage or look for a way to get to cleaner air – “if there is someplace in Montana that isn’t smoky.”
KHN (Kaiser Health News) is a nonprofit news service covering health issues. It is an editorially independent program of KFF (Kaiser Family Foundation), which is not affiliated with Kaiser Permanente.
Nocturnal oxygen no help for isolated desaturation in COPD
Nocturnal oxygen therapy for patients with COPD and isolated nocturnal oxygen desaturation does not improve survival or delay disease progression, according to findings published Sept. 17 in The New England Journal of Medicine. The new report adds to evidence that the widely implemented and costly practice may be unnecessary.
Patients with COPD who do not qualify for long-term oxygen therapy (LTOT) are commonly prescribed nocturnal oxygen in the belief that it can delay disease progression, possibly by decreasing alveolar hypoventilation and ventilation-perfusion mismatch.
But investigations so far and the new study from the International Nocturnal Oxygen (INOX) Trial have not borne this out.
“There is no indication that nocturnal oxygen has a positive or negative effect on survival or progression to long-term oxygen therapy in patients with nocturnal hypoxemia in COPD. Consequently, there is no reason for physicians to screen for nocturnal hypoxemia in COPD,” study leader Yves Lacasse, MD, told Medscape Medical News.
Lacasse is from the Institut Universitaire de Cardiologie et de Pneumologie de Québec–Université Laval, Quebec, Canada.
The idea that the therapy helps is firmly entrenched.
In the early 1980s, two trials indicated that patients who had COPD and severe chronic daytime hypoxemia benefit from LTOT (15-18 hours a day or longer).
A decade later, two landmark trials (the Nocturnal Oxygen Therapy Trial and the British Medical Research Council Trial) added to evidence that LTOT may prolong life for patients with COPD and severe daytime hypoxemia.
“The good news from both trials was that oxygen saves lives. From this moment, oxygen therapy became a standard of care, and confirmatory trials would be considered unethical,” Lacasse explained.
“Oxygen therapy gained widespread acceptance by official organizations for treatment of most chronic cardiorespiratory conditions complicated by severe hypoxemia, even if proof of efficacy is lacking. New indications emerged, such as isolated nocturnal oxygen desaturation. Even in COPD, inappropriate prescriptions of home oxygen therapy are not unusual. Oxygen is everywhere,” Lacasse continued.
A meta-analysis from 2005 identified two trials that evaluated home oxygen therapy specifically for isolated nocturnal desaturation. Both found no survival benefit from nocturnal oxygen.
The study by Lacasse and colleagues assessed effects on mortality or worsening of disease (progression to LTOT) with 3-4 years of nocturnal oxygen supplementation.
Participants, whose oxygen saturation was less than 90% for at least 30% of the recording time on nocturnal oximetry, received oxygen or ambient air from a sham device as a placebo for at least 4 hours per session. The goal of treatment was nocturnal oxygen saturation exceeding 90% for at least 90% of the recorded time.
The trial protocol excluded patients with severe obesity, apnea, lung cancer, left heart failure, interstitial lung disease, or bronchiectasis.
The study was initially powered in 2010 to include 600 participants, with half to receive placebo. The study assumed mortality of 20% among control patients over 3 years; 20% of patients progressed to LTOT.
When recruiting lagged, the data safety monitoring board and steering committee extended follow-up to 4 years. In 2014, they requested an interim analysis, and recruitment ceased. Overall, 243 patients participated.
Lacasse cited several reasons for the difficulty with recruitment as well as retention: unwillingness to take the risk of receiving placebo instead of a readily available treatment, fading interest over time, and frailty that affects compliance.
Patients in the study came from 28 community or university-affiliated hospitals in Canada, Portugal, Spain, and France. At the 3-year mark, 39% of patients (48 of 123) who were assigned to nocturnal oxygen therapy and 42% (50 of 119) of those taking placebo had met criteria for LTOT or had died (difference, −3.0 percentage points; P = .64). The groups did not differ appreciably in rates of exacerbation and hospitalization.
The researchers could not analyze subgroups because the patients were very similar with regard to the severity of nocturnal oxygen desaturation, Lacasse said.
Economics enters into the picture – home oxygen therapy is second only to hospitalization as the most expensive healthcare expenditure associated with clinical care for COPD in developed countries. “The math is simple. There is enormous potential for saving money if the results of our clinical trial are applied appropriately,” said Lacasse.
William Bailey, MD, professor emeritus of pulmonary, allergy, and critical care medicine at the University of Alabama at Birmingham, agrees that the practice is overused.
“There is a built-in bias in the medical community. Most believe that anyone with lung disease benefits from oxygen. Even some of our investigators had a hard time believing the results. The study was well designed, carefully carried out, and I feel confident that the results are reliable,” he said.
Shawn P. E. Nishi, MD, director of bronchoscopy and advanced pulmonary procedures, division of pulmonary and critical care medicine, the University of Texas Medical Branch, Galveston, Texas, mentioned the study’s main limitation, which the authors readily acknowledge.
“Unfortunately, the trial had difficulty recruiting subjects, with less than half of expected enrollment achieved, and was underpowered to make any conclusions. Other studies have examined nocturnal oxygen use and have not shown a mortality benefit,” Nishi explained.
She added that the study did not evaluate use of LTOT for improving outcomes other than mortality, including quality of life, cardiovascular morbidity, depression, cognitive function, exercise capacity, and frequency of COPD exacerbations or hospitalization.
Other limitations of the study include suboptimal adherence to the therapy and interpretation of the clinical significance on the basis of a survey of Canadian pulmonologists.
This article first appeared on Medscape.com.
Nocturnal oxygen therapy for patients with COPD and isolated nocturnal oxygen desaturation does not improve survival or delay disease progression, according to findings published Sept. 17 in The New England Journal of Medicine. The new report adds to evidence that the widely implemented and costly practice may be unnecessary.
Patients with COPD who do not qualify for long-term oxygen therapy (LTOT) are commonly prescribed nocturnal oxygen in the belief that it can delay disease progression, possibly by decreasing alveolar hypoventilation and ventilation-perfusion mismatch.
But investigations so far and the new study from the International Nocturnal Oxygen (INOX) Trial have not borne this out.
“There is no indication that nocturnal oxygen has a positive or negative effect on survival or progression to long-term oxygen therapy in patients with nocturnal hypoxemia in COPD. Consequently, there is no reason for physicians to screen for nocturnal hypoxemia in COPD,” study leader Yves Lacasse, MD, told Medscape Medical News.
Lacasse is from the Institut Universitaire de Cardiologie et de Pneumologie de Québec–Université Laval, Quebec, Canada.
The idea that the therapy helps is firmly entrenched.
In the early 1980s, two trials indicated that patients who had COPD and severe chronic daytime hypoxemia benefit from LTOT (15-18 hours a day or longer).
A decade later, two landmark trials (the Nocturnal Oxygen Therapy Trial and the British Medical Research Council Trial) added to evidence that LTOT may prolong life for patients with COPD and severe daytime hypoxemia.
“The good news from both trials was that oxygen saves lives. From this moment, oxygen therapy became a standard of care, and confirmatory trials would be considered unethical,” Lacasse explained.
“Oxygen therapy gained widespread acceptance by official organizations for treatment of most chronic cardiorespiratory conditions complicated by severe hypoxemia, even if proof of efficacy is lacking. New indications emerged, such as isolated nocturnal oxygen desaturation. Even in COPD, inappropriate prescriptions of home oxygen therapy are not unusual. Oxygen is everywhere,” Lacasse continued.
A meta-analysis from 2005 identified two trials that evaluated home oxygen therapy specifically for isolated nocturnal desaturation. Both found no survival benefit from nocturnal oxygen.
The study by Lacasse and colleagues assessed effects on mortality or worsening of disease (progression to LTOT) with 3-4 years of nocturnal oxygen supplementation.
Participants, whose oxygen saturation was less than 90% for at least 30% of the recording time on nocturnal oximetry, received oxygen or ambient air from a sham device as a placebo for at least 4 hours per session. The goal of treatment was nocturnal oxygen saturation exceeding 90% for at least 90% of the recorded time.
The trial protocol excluded patients with severe obesity, apnea, lung cancer, left heart failure, interstitial lung disease, or bronchiectasis.
The study was initially powered in 2010 to include 600 participants, with half to receive placebo. The study assumed mortality of 20% among control patients over 3 years; 20% of patients progressed to LTOT.
When recruiting lagged, the data safety monitoring board and steering committee extended follow-up to 4 years. In 2014, they requested an interim analysis, and recruitment ceased. Overall, 243 patients participated.
Lacasse cited several reasons for the difficulty with recruitment as well as retention: unwillingness to take the risk of receiving placebo instead of a readily available treatment, fading interest over time, and frailty that affects compliance.
Patients in the study came from 28 community or university-affiliated hospitals in Canada, Portugal, Spain, and France. At the 3-year mark, 39% of patients (48 of 123) who were assigned to nocturnal oxygen therapy and 42% (50 of 119) of those taking placebo had met criteria for LTOT or had died (difference, −3.0 percentage points; P = .64). The groups did not differ appreciably in rates of exacerbation and hospitalization.
The researchers could not analyze subgroups because the patients were very similar with regard to the severity of nocturnal oxygen desaturation, Lacasse said.
Economics enters into the picture – home oxygen therapy is second only to hospitalization as the most expensive healthcare expenditure associated with clinical care for COPD in developed countries. “The math is simple. There is enormous potential for saving money if the results of our clinical trial are applied appropriately,” said Lacasse.
William Bailey, MD, professor emeritus of pulmonary, allergy, and critical care medicine at the University of Alabama at Birmingham, agrees that the practice is overused.
“There is a built-in bias in the medical community. Most believe that anyone with lung disease benefits from oxygen. Even some of our investigators had a hard time believing the results. The study was well designed, carefully carried out, and I feel confident that the results are reliable,” he said.
Shawn P. E. Nishi, MD, director of bronchoscopy and advanced pulmonary procedures, division of pulmonary and critical care medicine, the University of Texas Medical Branch, Galveston, Texas, mentioned the study’s main limitation, which the authors readily acknowledge.
“Unfortunately, the trial had difficulty recruiting subjects, with less than half of expected enrollment achieved, and was underpowered to make any conclusions. Other studies have examined nocturnal oxygen use and have not shown a mortality benefit,” Nishi explained.
She added that the study did not evaluate use of LTOT for improving outcomes other than mortality, including quality of life, cardiovascular morbidity, depression, cognitive function, exercise capacity, and frequency of COPD exacerbations or hospitalization.
Other limitations of the study include suboptimal adherence to the therapy and interpretation of the clinical significance on the basis of a survey of Canadian pulmonologists.
This article first appeared on Medscape.com.
Nocturnal oxygen therapy for patients with COPD and isolated nocturnal oxygen desaturation does not improve survival or delay disease progression, according to findings published Sept. 17 in The New England Journal of Medicine. The new report adds to evidence that the widely implemented and costly practice may be unnecessary.
Patients with COPD who do not qualify for long-term oxygen therapy (LTOT) are commonly prescribed nocturnal oxygen in the belief that it can delay disease progression, possibly by decreasing alveolar hypoventilation and ventilation-perfusion mismatch.
But investigations so far and the new study from the International Nocturnal Oxygen (INOX) Trial have not borne this out.
“There is no indication that nocturnal oxygen has a positive or negative effect on survival or progression to long-term oxygen therapy in patients with nocturnal hypoxemia in COPD. Consequently, there is no reason for physicians to screen for nocturnal hypoxemia in COPD,” study leader Yves Lacasse, MD, told Medscape Medical News.
Lacasse is from the Institut Universitaire de Cardiologie et de Pneumologie de Québec–Université Laval, Quebec, Canada.
The idea that the therapy helps is firmly entrenched.
In the early 1980s, two trials indicated that patients who had COPD and severe chronic daytime hypoxemia benefit from LTOT (15-18 hours a day or longer).
A decade later, two landmark trials (the Nocturnal Oxygen Therapy Trial and the British Medical Research Council Trial) added to evidence that LTOT may prolong life for patients with COPD and severe daytime hypoxemia.
“The good news from both trials was that oxygen saves lives. From this moment, oxygen therapy became a standard of care, and confirmatory trials would be considered unethical,” Lacasse explained.
“Oxygen therapy gained widespread acceptance by official organizations for treatment of most chronic cardiorespiratory conditions complicated by severe hypoxemia, even if proof of efficacy is lacking. New indications emerged, such as isolated nocturnal oxygen desaturation. Even in COPD, inappropriate prescriptions of home oxygen therapy are not unusual. Oxygen is everywhere,” Lacasse continued.
A meta-analysis from 2005 identified two trials that evaluated home oxygen therapy specifically for isolated nocturnal desaturation. Both found no survival benefit from nocturnal oxygen.
The study by Lacasse and colleagues assessed effects on mortality or worsening of disease (progression to LTOT) with 3-4 years of nocturnal oxygen supplementation.
Participants, whose oxygen saturation was less than 90% for at least 30% of the recording time on nocturnal oximetry, received oxygen or ambient air from a sham device as a placebo for at least 4 hours per session. The goal of treatment was nocturnal oxygen saturation exceeding 90% for at least 90% of the recorded time.
The trial protocol excluded patients with severe obesity, apnea, lung cancer, left heart failure, interstitial lung disease, or bronchiectasis.
The study was initially powered in 2010 to include 600 participants, with half to receive placebo. The study assumed mortality of 20% among control patients over 3 years; 20% of patients progressed to LTOT.
When recruiting lagged, the data safety monitoring board and steering committee extended follow-up to 4 years. In 2014, they requested an interim analysis, and recruitment ceased. Overall, 243 patients participated.
Lacasse cited several reasons for the difficulty with recruitment as well as retention: unwillingness to take the risk of receiving placebo instead of a readily available treatment, fading interest over time, and frailty that affects compliance.
Patients in the study came from 28 community or university-affiliated hospitals in Canada, Portugal, Spain, and France. At the 3-year mark, 39% of patients (48 of 123) who were assigned to nocturnal oxygen therapy and 42% (50 of 119) of those taking placebo had met criteria for LTOT or had died (difference, −3.0 percentage points; P = .64). The groups did not differ appreciably in rates of exacerbation and hospitalization.
The researchers could not analyze subgroups because the patients were very similar with regard to the severity of nocturnal oxygen desaturation, Lacasse said.
Economics enters into the picture – home oxygen therapy is second only to hospitalization as the most expensive healthcare expenditure associated with clinical care for COPD in developed countries. “The math is simple. There is enormous potential for saving money if the results of our clinical trial are applied appropriately,” said Lacasse.
William Bailey, MD, professor emeritus of pulmonary, allergy, and critical care medicine at the University of Alabama at Birmingham, agrees that the practice is overused.
“There is a built-in bias in the medical community. Most believe that anyone with lung disease benefits from oxygen. Even some of our investigators had a hard time believing the results. The study was well designed, carefully carried out, and I feel confident that the results are reliable,” he said.
Shawn P. E. Nishi, MD, director of bronchoscopy and advanced pulmonary procedures, division of pulmonary and critical care medicine, the University of Texas Medical Branch, Galveston, Texas, mentioned the study’s main limitation, which the authors readily acknowledge.
“Unfortunately, the trial had difficulty recruiting subjects, with less than half of expected enrollment achieved, and was underpowered to make any conclusions. Other studies have examined nocturnal oxygen use and have not shown a mortality benefit,” Nishi explained.
She added that the study did not evaluate use of LTOT for improving outcomes other than mortality, including quality of life, cardiovascular morbidity, depression, cognitive function, exercise capacity, and frequency of COPD exacerbations or hospitalization.
Other limitations of the study include suboptimal adherence to the therapy and interpretation of the clinical significance on the basis of a survey of Canadian pulmonologists.
This article first appeared on Medscape.com.
Pharmacologic Management of COPD
A Discussion of the new American Thoracic Society Clinical Practice Guideline
Chronic obstructive pulmonary disease (COPD) is caused by airway and alveolar abnormalities and is the third most common cause of death worldwide. COPD results in airflow obstruction that is not fully reversible. The diagnosis of COPD should be considered in patients over 40 years who have chronic cough and/or dyspnea, particularly if they have a history of tobacco use. The diagnosis is confirmed by a diminished forced expiratory volume in 1 second (FEV1) that is not fully reversible with the use of a bronchodilator and an FEV1/forced vital capacity ratio of less than or equal to 0.7.1
Recommendation 1

Patients with COPD who report dyspnea or exercise intolerance should be treated with both a long-acting muscarinic antagonist (LAMA) and a long-acting beta agonist (LABA) (dual LAMA/LABA therapy) instead of monotherapy, the guideline says.
This recommendation represents a critical change in care and is based on strong evidence. For years practitioners have been using single bronchodilator therapy, often a LAMA as the entrance to treatment for patients with symptomatic COPD. The recommendation to begin treatment with dual bronchodilator therapy is an important one. This is the only recommendation that received a “strong” grade.
The evidence comes from the compilation of 24 randomized controlled trials that altogether included 45,441 patients. Dual therapy versus monotherapy was evaluated by examining differences in dyspnea, health-related quality of life, exacerbations (which were defined as requiring antibiotics, oral steroids, or hospitalizations), and hospitalizations independently. Marked improvements were observed for exacerbations and hospitalizations in the dual LAMA/LABA group, compared with treatment with use of a single bronchodilator. In 22,733 patients across 15 RCTs, there were 88 fewer exacerbations per 1,000 patients with a rate ratio (RR) of 0.80 (P < .002), the guideline states.
The decrease in exacerbations is a critical factor in treating patients with COPD because each exacerbation can lead to a sustained decrease in airflow and increases the risk of future exacerbations.
Recommendation 2

In COPD patients who report dyspnea or exercise intolerance, with an exacerbation in the last year, the guideline recommends triple therapy with an inhaled corticosteroid (ICS) instead of just dual LAMA/LABA therapy.
In the past many clinicians have relegated triple therapy to a “last ditch resort.” This recommendation makes it clear that triple therapy is appropriate for a broad range of patients with moderate to severe COPD.
Recommendation 3
In patients with COPD who are on triple therapy, the inhaled corticosteroid component can be withdrawn if patients have not had an exacerbation within the last year, according to the guideline.
It should be noted that the committee said that the ICS can be withdrawn, not that it necessarily needs to be withdrawn. The data showed that it would be safe to withdraw the ICS, but the data is limited in time to 1 year’s follow-up.
Recommendation 4
ATS was not able to make a recommendation for or against ICS as an additive therapy to LAMA/LABA in those without an exacerbation and elevated blood eosinophilia (defined as ≥2% blood eosinophils or >149 cell/mcL). In those with at least one exacerbation and increased blood eosinophilia, the society does recommend addition of ICS to dual LAMA/LABA therapy.
An area of ongoing discussion is at what point in disease severity, before exacerbations occur, might ICS be useful in preventing a first exacerbation. This awaits further studies and evidence.
Recommendation 5
In COPD patients with frequent and severe exacerbations who are otherwise medically optimized, the ATS advises against the use of maintenance oral corticosteroid therapy.
It has been known and accepted for years that oral steroids should be avoided if at all possible because they have little benefit and can cause significant harm. The guideline reinforces this.
The Bottom Line
Dual LAMA/LABA therapy in symptomatic patients is the standard of care. If a patient has had an exacerbation within the last year, add an ICS to the LAMA/LABA, most conveniently given in the form of triple therapy in one inhaler. Finally, even in refractory COPD, maintenance oral corticosteroids bring more harm than benefit.
Dr. Skolnik is professor of family and community medicine at the Thomas Jefferson University, Philadelphia, and associate director of the Family Medicine Residency Program at Abington (Pa.) Jefferson Health. Dr. Matthews is a second-year resident in the family medicine residency program at Abington Jefferson Health.
References
1. Wells C, Joo MJ. COPD and asthma: Diagnostic accuracy requires spirometry. J Fam Pract. 2019;68(2):76-81.
2. Nici L, Mammen MJ, Charbek E, et al. Pharmacologic management of chronic obstructive pulmonary disease. An official American Thoracic Society clinical practice guideline. Am J Respir Crit Care Med. 2020;201(9):e56-69.
A Discussion of the new American Thoracic Society Clinical Practice Guideline
A Discussion of the new American Thoracic Society Clinical Practice Guideline
Chronic obstructive pulmonary disease (COPD) is caused by airway and alveolar abnormalities and is the third most common cause of death worldwide. COPD results in airflow obstruction that is not fully reversible. The diagnosis of COPD should be considered in patients over 40 years who have chronic cough and/or dyspnea, particularly if they have a history of tobacco use. The diagnosis is confirmed by a diminished forced expiratory volume in 1 second (FEV1) that is not fully reversible with the use of a bronchodilator and an FEV1/forced vital capacity ratio of less than or equal to 0.7.1
Recommendation 1
Patients with COPD who report dyspnea or exercise intolerance should be treated with both a long-acting muscarinic antagonist (LAMA) and a long-acting beta agonist (LABA) (dual LAMA/LABA therapy) instead of monotherapy, the guideline says.
This recommendation represents a critical change in care and is based on strong evidence. For years practitioners have been using single bronchodilator therapy, often a LAMA as the entrance to treatment for patients with symptomatic COPD. The recommendation to begin treatment with dual bronchodilator therapy is an important one. This is the only recommendation that received a “strong” grade.
The evidence comes from the compilation of 24 randomized controlled trials that altogether included 45,441 patients. Dual therapy versus monotherapy was evaluated by examining differences in dyspnea, health-related quality of life, exacerbations (which were defined as requiring antibiotics, oral steroids, or hospitalizations), and hospitalizations independently. Marked improvements were observed for exacerbations and hospitalizations in the dual LAMA/LABA group, compared with treatment with use of a single bronchodilator. In 22,733 patients across 15 RCTs, there were 88 fewer exacerbations per 1,000 patients with a rate ratio (RR) of 0.80 (P < .002), the guideline states.
The decrease in exacerbations is a critical factor in treating patients with COPD because each exacerbation can lead to a sustained decrease in airflow and increases the risk of future exacerbations.
Recommendation 2
In COPD patients who report dyspnea or exercise intolerance, with an exacerbation in the last year, the guideline recommends triple therapy with an inhaled corticosteroid (ICS) instead of just dual LAMA/LABA therapy.
In the past many clinicians have relegated triple therapy to a “last ditch resort.” This recommendation makes it clear that triple therapy is appropriate for a broad range of patients with moderate to severe COPD.
Recommendation 3
In patients with COPD who are on triple therapy, the inhaled corticosteroid component can be withdrawn if patients have not had an exacerbation within the last year, according to the guideline.
It should be noted that the committee said that the ICS can be withdrawn, not that it necessarily needs to be withdrawn. The data showed that it would be safe to withdraw the ICS, but the data is limited in time to 1 year’s follow-up.
Recommendation 4
ATS was not able to make a recommendation for or against ICS as an additive therapy to LAMA/LABA in those without an exacerbation and elevated blood eosinophilia (defined as ≥2% blood eosinophils or >149 cell/mcL). In those with at least one exacerbation and increased blood eosinophilia, the society does recommend addition of ICS to dual LAMA/LABA therapy.
An area of ongoing discussion is at what point in disease severity, before exacerbations occur, might ICS be useful in preventing a first exacerbation. This awaits further studies and evidence.
Recommendation 5
In COPD patients with frequent and severe exacerbations who are otherwise medically optimized, the ATS advises against the use of maintenance oral corticosteroid therapy.
It has been known and accepted for years that oral steroids should be avoided if at all possible because they have little benefit and can cause significant harm. The guideline reinforces this.
The Bottom Line
Dual LAMA/LABA therapy in symptomatic patients is the standard of care. If a patient has had an exacerbation within the last year, add an ICS to the LAMA/LABA, most conveniently given in the form of triple therapy in one inhaler. Finally, even in refractory COPD, maintenance oral corticosteroids bring more harm than benefit.
Dr. Skolnik is professor of family and community medicine at the Thomas Jefferson University, Philadelphia, and associate director of the Family Medicine Residency Program at Abington (Pa.) Jefferson Health. Dr. Matthews is a second-year resident in the family medicine residency program at Abington Jefferson Health.
References
1. Wells C, Joo MJ. COPD and asthma: Diagnostic accuracy requires spirometry. J Fam Pract. 2019;68(2):76-81.
2. Nici L, Mammen MJ, Charbek E, et al. Pharmacologic management of chronic obstructive pulmonary disease. An official American Thoracic Society clinical practice guideline. Am J Respir Crit Care Med. 2020;201(9):e56-69.
Chronic obstructive pulmonary disease (COPD) is caused by airway and alveolar abnormalities and is the third most common cause of death worldwide. COPD results in airflow obstruction that is not fully reversible. The diagnosis of COPD should be considered in patients over 40 years who have chronic cough and/or dyspnea, particularly if they have a history of tobacco use. The diagnosis is confirmed by a diminished forced expiratory volume in 1 second (FEV1) that is not fully reversible with the use of a bronchodilator and an FEV1/forced vital capacity ratio of less than or equal to 0.7.1
Recommendation 1
Patients with COPD who report dyspnea or exercise intolerance should be treated with both a long-acting muscarinic antagonist (LAMA) and a long-acting beta agonist (LABA) (dual LAMA/LABA therapy) instead of monotherapy, the guideline says.
This recommendation represents a critical change in care and is based on strong evidence. For years practitioners have been using single bronchodilator therapy, often a LAMA as the entrance to treatment for patients with symptomatic COPD. The recommendation to begin treatment with dual bronchodilator therapy is an important one. This is the only recommendation that received a “strong” grade.
The evidence comes from the compilation of 24 randomized controlled trials that altogether included 45,441 patients. Dual therapy versus monotherapy was evaluated by examining differences in dyspnea, health-related quality of life, exacerbations (which were defined as requiring antibiotics, oral steroids, or hospitalizations), and hospitalizations independently. Marked improvements were observed for exacerbations and hospitalizations in the dual LAMA/LABA group, compared with treatment with use of a single bronchodilator. In 22,733 patients across 15 RCTs, there were 88 fewer exacerbations per 1,000 patients with a rate ratio (RR) of 0.80 (P < .002), the guideline states.
The decrease in exacerbations is a critical factor in treating patients with COPD because each exacerbation can lead to a sustained decrease in airflow and increases the risk of future exacerbations.
Recommendation 2
In COPD patients who report dyspnea or exercise intolerance, with an exacerbation in the last year, the guideline recommends triple therapy with an inhaled corticosteroid (ICS) instead of just dual LAMA/LABA therapy.
In the past many clinicians have relegated triple therapy to a “last ditch resort.” This recommendation makes it clear that triple therapy is appropriate for a broad range of patients with moderate to severe COPD.
Recommendation 3
In patients with COPD who are on triple therapy, the inhaled corticosteroid component can be withdrawn if patients have not had an exacerbation within the last year, according to the guideline.
It should be noted that the committee said that the ICS can be withdrawn, not that it necessarily needs to be withdrawn. The data showed that it would be safe to withdraw the ICS, but the data is limited in time to 1 year’s follow-up.
Recommendation 4
ATS was not able to make a recommendation for or against ICS as an additive therapy to LAMA/LABA in those without an exacerbation and elevated blood eosinophilia (defined as ≥2% blood eosinophils or >149 cell/mcL). In those with at least one exacerbation and increased blood eosinophilia, the society does recommend addition of ICS to dual LAMA/LABA therapy.
An area of ongoing discussion is at what point in disease severity, before exacerbations occur, might ICS be useful in preventing a first exacerbation. This awaits further studies and evidence.
Recommendation 5
In COPD patients with frequent and severe exacerbations who are otherwise medically optimized, the ATS advises against the use of maintenance oral corticosteroid therapy.
It has been known and accepted for years that oral steroids should be avoided if at all possible because they have little benefit and can cause significant harm. The guideline reinforces this.
The Bottom Line
Dual LAMA/LABA therapy in symptomatic patients is the standard of care. If a patient has had an exacerbation within the last year, add an ICS to the LAMA/LABA, most conveniently given in the form of triple therapy in one inhaler. Finally, even in refractory COPD, maintenance oral corticosteroids bring more harm than benefit.
Dr. Skolnik is professor of family and community medicine at the Thomas Jefferson University, Philadelphia, and associate director of the Family Medicine Residency Program at Abington (Pa.) Jefferson Health. Dr. Matthews is a second-year resident in the family medicine residency program at Abington Jefferson Health.
References
1. Wells C, Joo MJ. COPD and asthma: Diagnostic accuracy requires spirometry. J Fam Pract. 2019;68(2):76-81.
2. Nici L, Mammen MJ, Charbek E, et al. Pharmacologic management of chronic obstructive pulmonary disease. An official American Thoracic Society clinical practice guideline. Am J Respir Crit Care Med. 2020;201(9):e56-69.
Many Americans still concerned about access to health care
according to the results of a survey conducted Aug. 7-26.
Nationally, 23.8% of respondents said that they were very concerned about being able to receive care during the pandemic, and another 27.4% said that they were somewhat concerned. Just under a quarter, 24.3%, said they were not very concerned, while 20.4% were not at all concerned, the COVID-19 Consortium for Understanding the Public’s Policy Preferences Across States reported after surveying 21,196 adults.
At the state level, Mississippi had the most adults (35.5%) who were very concerned about their access to care, followed by Texas (32.7%) and Nevada (32.4%). The residents of Montana were least likely (10.5%) to be very concerned, with Vermont next at 11.6% and Wyoming slightly higher at 13.8%. Montana also had the highest proportion of adults, 30.2%, who were not at all concerned, the consortium’s data show.
When asked about getting the coronavirus themselves, 67.8% of U.S. adults came down on the concerned side (33.3% somewhat and 34.5% very concerned) versus 30.8% who were not concerned (18.6% were not very concerned; 12.2% were not concerned at all.). Respondents’ concern was higher for their family members’ risk of getting coronavirus: 30.2% were somewhat concerned and 47.6% were very concerned, the consortium said.
Among many other topics, respondents were asked how closely they had followed recommended health guidelines in the last week, with the two extremes shown here:
- Avoiding contact with other people: 49.3% very closely, 4.8% not at all closely.
- Frequently washing hands: 74.7% very, 1.6% not at all.
- Disinfecting often-touched surfaces: 54.4% very, 4.3% not at all.
- Wearing a face mask in public: 75.7% very, 3.5% not at all.
The consortium is a joint project of the Network Science Institute of Northeastern University; the Shorenstein Center on Media, Politics, and Public Policy of Harvard University; Harvard Medical School; the School of Communication and Information at Rutgers University; and the department of political science at Northwestern University. The project is supported by grants from the National Science Foundation.
according to the results of a survey conducted Aug. 7-26.
Nationally, 23.8% of respondents said that they were very concerned about being able to receive care during the pandemic, and another 27.4% said that they were somewhat concerned. Just under a quarter, 24.3%, said they were not very concerned, while 20.4% were not at all concerned, the COVID-19 Consortium for Understanding the Public’s Policy Preferences Across States reported after surveying 21,196 adults.
At the state level, Mississippi had the most adults (35.5%) who were very concerned about their access to care, followed by Texas (32.7%) and Nevada (32.4%). The residents of Montana were least likely (10.5%) to be very concerned, with Vermont next at 11.6% and Wyoming slightly higher at 13.8%. Montana also had the highest proportion of adults, 30.2%, who were not at all concerned, the consortium’s data show.
When asked about getting the coronavirus themselves, 67.8% of U.S. adults came down on the concerned side (33.3% somewhat and 34.5% very concerned) versus 30.8% who were not concerned (18.6% were not very concerned; 12.2% were not concerned at all.). Respondents’ concern was higher for their family members’ risk of getting coronavirus: 30.2% were somewhat concerned and 47.6% were very concerned, the consortium said.
Among many other topics, respondents were asked how closely they had followed recommended health guidelines in the last week, with the two extremes shown here:
- Avoiding contact with other people: 49.3% very closely, 4.8% not at all closely.
- Frequently washing hands: 74.7% very, 1.6% not at all.
- Disinfecting often-touched surfaces: 54.4% very, 4.3% not at all.
- Wearing a face mask in public: 75.7% very, 3.5% not at all.
The consortium is a joint project of the Network Science Institute of Northeastern University; the Shorenstein Center on Media, Politics, and Public Policy of Harvard University; Harvard Medical School; the School of Communication and Information at Rutgers University; and the department of political science at Northwestern University. The project is supported by grants from the National Science Foundation.
according to the results of a survey conducted Aug. 7-26.
Nationally, 23.8% of respondents said that they were very concerned about being able to receive care during the pandemic, and another 27.4% said that they were somewhat concerned. Just under a quarter, 24.3%, said they were not very concerned, while 20.4% were not at all concerned, the COVID-19 Consortium for Understanding the Public’s Policy Preferences Across States reported after surveying 21,196 adults.
At the state level, Mississippi had the most adults (35.5%) who were very concerned about their access to care, followed by Texas (32.7%) and Nevada (32.4%). The residents of Montana were least likely (10.5%) to be very concerned, with Vermont next at 11.6% and Wyoming slightly higher at 13.8%. Montana also had the highest proportion of adults, 30.2%, who were not at all concerned, the consortium’s data show.
When asked about getting the coronavirus themselves, 67.8% of U.S. adults came down on the concerned side (33.3% somewhat and 34.5% very concerned) versus 30.8% who were not concerned (18.6% were not very concerned; 12.2% were not concerned at all.). Respondents’ concern was higher for their family members’ risk of getting coronavirus: 30.2% were somewhat concerned and 47.6% were very concerned, the consortium said.
Among many other topics, respondents were asked how closely they had followed recommended health guidelines in the last week, with the two extremes shown here:
- Avoiding contact with other people: 49.3% very closely, 4.8% not at all closely.
- Frequently washing hands: 74.7% very, 1.6% not at all.
- Disinfecting often-touched surfaces: 54.4% very, 4.3% not at all.
- Wearing a face mask in public: 75.7% very, 3.5% not at all.
The consortium is a joint project of the Network Science Institute of Northeastern University; the Shorenstein Center on Media, Politics, and Public Policy of Harvard University; Harvard Medical School; the School of Communication and Information at Rutgers University; and the department of political science at Northwestern University. The project is supported by grants from the National Science Foundation.
Study validates OSA phenotypes in Latinos
Three previously described clinical phenotypes of obstructive sleep apnea (OSA) have been validated in a large and diverse Hispanic/Latino community-based population for the first time, according to findings presented at the virtual annual meeting of the Associated Professional Sleep Societies.
The three OSA symptom profiles present in this population – labeled “minimally symptomatic,” “disturbed sleep,” and “daytime sleepiness” – are consistent with recent findings from the Sleep Apnea Global Interdisciplinary Consortium, which were published in Sleep, but there are notable differences in the prevalence of these clusters, with the minimally symptomatic cluster much more prevalent than in prior research, reported Kevin Gonzalez, of the University of California, San Diego.
“Other biopsychosocial factors may be contributing to OSA phenotypes among Hispanics and Latinos,” Mr. Gonzalez said in his presentation. Prior research to characterize the heterogeneity of sleep apnea has not included a diverse Latino population, he emphasized.
The adults studied were aged 18-74 years and participants in the multisite Hispanic Community Health Study/Study of Latinos (HCHS/SOL), a comprehensive study of Hispanic/Latino health and disease in the United States. Their respiratory events were measured overnight in HCHS/SOL sleep reading centers with an ARES Unicorder 5.2, B-Alert. Sleep patterns and risk factors were assessed using the Sleep Heart Health Study Sleep Habits Questionnaire and the Epworth Sleepiness Scale.
Participants meeting the criteria for moderate to severe OSA (with an Apnea Hypopnea Index of 15 or above) were included in the analysis (n = 1,623). Their average age was 52.4 ± 13.9 years, and 34.1% were female.
To identify phenotype clusters, investigators performed a latent class analysis using 15 common OSA symptoms and a survey weighted to adjust for selection bias. The three clusters offering the “best” fit for the data aligned with the previously reported phenotypes and identified daytime sleepiness in 15.3%, disturbed sleep (insomnia-like symptoms) in 37.7%, and minimally symptomatic (a low symptom profile) in 46.9%.
These phenotypes were reported in the European Respiratory Journal in 2014 in a cluster analysis of data from a sleep apnea cohort in Iceland and later replicated in the analysis of data from the Sleep Apnea Global Interdisciplinary Consortium published in Sleep in 2018. The consortium study also added two additional phenotypes, labeled “upper airway symptoms dominant” and “sleepiness dominant.”
The prevalence of a “minimally symptomatic group” in the new analysis of the Hispanics/Latinos in the United States is much higher than reported in these prior studies, at least partly, the investigators believed, because the “prior studies were clinical samples, and the people who were minimally symptomatic didn’t get to the sleep centers,” Mr. Gonzalez said in an interview after the meeting.
Patients with a phenotype of daytime sleepiness – the most common phenotype in prior research – constituted only a minority in the Hispanic/Latino population, he said.
Alberto Ramos, MD, of the University of Miami and the principal investigator, said in an interview that the research team is currently analyzing “if and how these different [phenotypic] clusters could affect the incidence of comorbidities” recorded in the HCHS/SOL study, such as hypertension, diabetes, cardiovascular disease, and cognitive decline.
For now, he said, the findings suggest that OSA may be especially underrecognized in Hispanics and Latinos and that there is more research to be done to better identify and stratify patients with varying symptomatology for more personalized treatment and for clinical trial selection. “Maybe we should expand our criteria ... broaden our [recognition] of the presentation of sleep apnea and the symptoms associated with it, not only in Hispanics but maybe in the general population,” Dr. Ramos said.

In commenting on the study, Krishna M. Sundar, MD, FCCP, director of the Sleep-Wake Center at the University of Utah, Salt Lake City, said that insomnia and daytime sleepiness are “key associations with obstructive sleep apnea and may predict different outcomes with untreated OSA.” Such heterogeneity is “only beginning to be appreciated,” he said. “The expression of OSA with these symptoms points to how OSA impacts quality of life” and how symptomatology in addition to Apnea Hypopnea Index “may be an important determinant of treatment benefit and compliance.”
The investigators reported no relevant disclosures. Dr. Sundar said that he is cofounder of Hypnoscure, software for population management of sleep apnea, but with no monies received.
Three previously described clinical phenotypes of obstructive sleep apnea (OSA) have been validated in a large and diverse Hispanic/Latino community-based population for the first time, according to findings presented at the virtual annual meeting of the Associated Professional Sleep Societies.
The three OSA symptom profiles present in this population – labeled “minimally symptomatic,” “disturbed sleep,” and “daytime sleepiness” – are consistent with recent findings from the Sleep Apnea Global Interdisciplinary Consortium, which were published in Sleep, but there are notable differences in the prevalence of these clusters, with the minimally symptomatic cluster much more prevalent than in prior research, reported Kevin Gonzalez, of the University of California, San Diego.
“Other biopsychosocial factors may be contributing to OSA phenotypes among Hispanics and Latinos,” Mr. Gonzalez said in his presentation. Prior research to characterize the heterogeneity of sleep apnea has not included a diverse Latino population, he emphasized.
The adults studied were aged 18-74 years and participants in the multisite Hispanic Community Health Study/Study of Latinos (HCHS/SOL), a comprehensive study of Hispanic/Latino health and disease in the United States. Their respiratory events were measured overnight in HCHS/SOL sleep reading centers with an ARES Unicorder 5.2, B-Alert. Sleep patterns and risk factors were assessed using the Sleep Heart Health Study Sleep Habits Questionnaire and the Epworth Sleepiness Scale.
Participants meeting the criteria for moderate to severe OSA (with an Apnea Hypopnea Index of 15 or above) were included in the analysis (n = 1,623). Their average age was 52.4 ± 13.9 years, and 34.1% were female.
To identify phenotype clusters, investigators performed a latent class analysis using 15 common OSA symptoms and a survey weighted to adjust for selection bias. The three clusters offering the “best” fit for the data aligned with the previously reported phenotypes and identified daytime sleepiness in 15.3%, disturbed sleep (insomnia-like symptoms) in 37.7%, and minimally symptomatic (a low symptom profile) in 46.9%.
These phenotypes were reported in the European Respiratory Journal in 2014 in a cluster analysis of data from a sleep apnea cohort in Iceland and later replicated in the analysis of data from the Sleep Apnea Global Interdisciplinary Consortium published in Sleep in 2018. The consortium study also added two additional phenotypes, labeled “upper airway symptoms dominant” and “sleepiness dominant.”
The prevalence of a “minimally symptomatic group” in the new analysis of the Hispanics/Latinos in the United States is much higher than reported in these prior studies, at least partly, the investigators believed, because the “prior studies were clinical samples, and the people who were minimally symptomatic didn’t get to the sleep centers,” Mr. Gonzalez said in an interview after the meeting.
Patients with a phenotype of daytime sleepiness – the most common phenotype in prior research – constituted only a minority in the Hispanic/Latino population, he said.
Alberto Ramos, MD, of the University of Miami and the principal investigator, said in an interview that the research team is currently analyzing “if and how these different [phenotypic] clusters could affect the incidence of comorbidities” recorded in the HCHS/SOL study, such as hypertension, diabetes, cardiovascular disease, and cognitive decline.
For now, he said, the findings suggest that OSA may be especially underrecognized in Hispanics and Latinos and that there is more research to be done to better identify and stratify patients with varying symptomatology for more personalized treatment and for clinical trial selection. “Maybe we should expand our criteria ... broaden our [recognition] of the presentation of sleep apnea and the symptoms associated with it, not only in Hispanics but maybe in the general population,” Dr. Ramos said.
In commenting on the study, Krishna M. Sundar, MD, FCCP, director of the Sleep-Wake Center at the University of Utah, Salt Lake City, said that insomnia and daytime sleepiness are “key associations with obstructive sleep apnea and may predict different outcomes with untreated OSA.” Such heterogeneity is “only beginning to be appreciated,” he said. “The expression of OSA with these symptoms points to how OSA impacts quality of life” and how symptomatology in addition to Apnea Hypopnea Index “may be an important determinant of treatment benefit and compliance.”
The investigators reported no relevant disclosures. Dr. Sundar said that he is cofounder of Hypnoscure, software for population management of sleep apnea, but with no monies received.
Three previously described clinical phenotypes of obstructive sleep apnea (OSA) have been validated in a large and diverse Hispanic/Latino community-based population for the first time, according to findings presented at the virtual annual meeting of the Associated Professional Sleep Societies.
The three OSA symptom profiles present in this population – labeled “minimally symptomatic,” “disturbed sleep,” and “daytime sleepiness” – are consistent with recent findings from the Sleep Apnea Global Interdisciplinary Consortium, which were published in Sleep, but there are notable differences in the prevalence of these clusters, with the minimally symptomatic cluster much more prevalent than in prior research, reported Kevin Gonzalez, of the University of California, San Diego.
“Other biopsychosocial factors may be contributing to OSA phenotypes among Hispanics and Latinos,” Mr. Gonzalez said in his presentation. Prior research to characterize the heterogeneity of sleep apnea has not included a diverse Latino population, he emphasized.
The adults studied were aged 18-74 years and participants in the multisite Hispanic Community Health Study/Study of Latinos (HCHS/SOL), a comprehensive study of Hispanic/Latino health and disease in the United States. Their respiratory events were measured overnight in HCHS/SOL sleep reading centers with an ARES Unicorder 5.2, B-Alert. Sleep patterns and risk factors were assessed using the Sleep Heart Health Study Sleep Habits Questionnaire and the Epworth Sleepiness Scale.
Participants meeting the criteria for moderate to severe OSA (with an Apnea Hypopnea Index of 15 or above) were included in the analysis (n = 1,623). Their average age was 52.4 ± 13.9 years, and 34.1% were female.
To identify phenotype clusters, investigators performed a latent class analysis using 15 common OSA symptoms and a survey weighted to adjust for selection bias. The three clusters offering the “best” fit for the data aligned with the previously reported phenotypes and identified daytime sleepiness in 15.3%, disturbed sleep (insomnia-like symptoms) in 37.7%, and minimally symptomatic (a low symptom profile) in 46.9%.
These phenotypes were reported in the European Respiratory Journal in 2014 in a cluster analysis of data from a sleep apnea cohort in Iceland and later replicated in the analysis of data from the Sleep Apnea Global Interdisciplinary Consortium published in Sleep in 2018. The consortium study also added two additional phenotypes, labeled “upper airway symptoms dominant” and “sleepiness dominant.”
The prevalence of a “minimally symptomatic group” in the new analysis of the Hispanics/Latinos in the United States is much higher than reported in these prior studies, at least partly, the investigators believed, because the “prior studies were clinical samples, and the people who were minimally symptomatic didn’t get to the sleep centers,” Mr. Gonzalez said in an interview after the meeting.
Patients with a phenotype of daytime sleepiness – the most common phenotype in prior research – constituted only a minority in the Hispanic/Latino population, he said.
Alberto Ramos, MD, of the University of Miami and the principal investigator, said in an interview that the research team is currently analyzing “if and how these different [phenotypic] clusters could affect the incidence of comorbidities” recorded in the HCHS/SOL study, such as hypertension, diabetes, cardiovascular disease, and cognitive decline.
For now, he said, the findings suggest that OSA may be especially underrecognized in Hispanics and Latinos and that there is more research to be done to better identify and stratify patients with varying symptomatology for more personalized treatment and for clinical trial selection. “Maybe we should expand our criteria ... broaden our [recognition] of the presentation of sleep apnea and the symptoms associated with it, not only in Hispanics but maybe in the general population,” Dr. Ramos said.
In commenting on the study, Krishna M. Sundar, MD, FCCP, director of the Sleep-Wake Center at the University of Utah, Salt Lake City, said that insomnia and daytime sleepiness are “key associations with obstructive sleep apnea and may predict different outcomes with untreated OSA.” Such heterogeneity is “only beginning to be appreciated,” he said. “The expression of OSA with these symptoms points to how OSA impacts quality of life” and how symptomatology in addition to Apnea Hypopnea Index “may be an important determinant of treatment benefit and compliance.”
The investigators reported no relevant disclosures. Dr. Sundar said that he is cofounder of Hypnoscure, software for population management of sleep apnea, but with no monies received.
REPORTING FROM SLEEP 2020
2020-2021 respiratory viral season: Onset, presentations, and testing likely to differ in pandemic
Respiratory virus seasons usually follow a fairly well-known pattern. Enterovirus 68 (EV-D68) is a summer-to-early fall virus with biennial peak years. Rhinovirus (HRv) and adenovirus (Adv) occur nearly year-round but may have small upticks in the first month or so that children return to school. Early in the school year, upper respiratory infections from both HRv and Adv and viral sore throats from Adv are common, with conjunctivitis from Adv outbreaks in some years. October to November is human parainfluenza (HPiV) 1 and 2 season, often presenting as croup. Human metapneumovirus infections span October through April. In late November to December, influenza begins, usually with an A type, later transitioning to a B type in February through April. Also in December, respiratory syncytial virus (RSV) starts, characteristically with bronchiolitis presentations, peaking in February to March and tapering off in May. In late March to April, HPiV 3 also appears for 4-6 weeks.

Will 2020-2021 be different?
Summer was remarkably free of expected enterovirus activity, suggesting that the seasonal parade may differ this year. Remember that the 2019-2020 respiratory season suddenly and nearly completely stopped in March because of social distancing and lockdowns needed to address the SARS-CoV-2 pandemic.
The mild influenza season in the southern hemisphere suggests that our influenza season also could be mild. But perhaps not – most southern hemisphere countries that are surveyed for influenza activities had the most intense SARS-CoV-2 mitigations, making the observed mildness potentially related more to social mitigation than less virulent influenza strains. If so, southern hemisphere influenza data may not apply to the United States, where social distancing and masks are ignored or used inconsistently by almost half the population.

Further, the stop-and-go pattern of in-person school/college attendance adds to uncertainties for the usual orderly virus-specific seasonality. The result may be multiple stop-and-go “pop-up” or “mini” outbreaks for any given virus potentially reflected as exaggerated local or regional differences in circulation of various viruses. The erratic seasonality also would increase coinfections, which could present with more severe or different symptoms.
SARS-CoV-2’s potential interaction
Will the relatively mild presentations for most children with SARS-CoV-2 hold up in the setting of coinfections or sequential respiratory viral infections? Could SARS-CoV-2 cause worse/more prolonged symptoms or more sequelae if paired simultaneously or in tandem with a traditional respiratory virus? To date, data on the frequency and severity of SARS-CoV-2 coinfections are conflicting and sparse, but it appears that non-SARS-CoV-2 viruses can be involved in 15%-50% pediatric acute respiratory infections.1,2
However, it may not be important to know about coinfecting viruses other than influenza (can be treated) or SARS-CoV-2 (needs quarantine and contact tracing), unless symptoms are atypical or more severe than usual. For example, a young child with bronchiolitis is most likely infected with RSV, but HPiV, influenza, metapneumovirus, HRv, and even SARS-CoV-2 can cause bronchiolitis. Even so, testing outpatients for RSV or non-influenza is not routine or even clinically helpful. Supportive treatment and restriction from daycare attendance are sufficient management for outpatient ARIs whether presenting as bronchiolitis or not.
Considerations for SARS-CoV-2 testing: Outpatient bronchiolitis
If a child presents with classic bronchiolitis but has above moderate to severe symptoms, is SARS-CoV-2 a consideration? Perhaps, if SARS-CoV-2 acts similarly to non-SARS-CoV-2s.
A recent report from the 30th Multicenter Airway Research Collaboration (MARC-30) surveillance study (2007-2014) of children hospitalized with clinical bronchiolitis evaluated respiratory viruses, including RSV and the four common non-SARS coronaviruses using molecular testing.3 Among 1,880 subjects, a CoV (alpha CoV: NL63 or 229E, or beta CoV: KKU1 or OC43) was detected in 12%. Yet most had only RSV (n = 1,661); 32 had only CoV (n = 32). But note that 219 had both.
Bronchiolitis subjects with CoV were older – median 3.7 (1.4-5.8) vs. 2.8 (1.9-7.2) years – and more likely male than were RSV subjects (68% vs. 58%). OC43 was most frequent followed by equal numbers of HKU1 and NL63, while 229E was the least frequent. Medical utilization and severity did not differ among the CoVs, or between RSV+CoV vs. RSV alone, unless one considered CoV viral load as a variable. ICU use increased when the polymerase chain reaction cycle threshold result indicated a high CoV viral load.
These data suggest CoVs are not infrequent coinfectors with RSV in bronchiolitis – and that SARS-CoV-2 is the same. Therefore, a bronchiolitis presentation doesn’t necessarily take us off the hook for the need to consider SARS-CoV-2 testing, particularly in the somewhat older bronchiolitis patient with more than mild symptoms.
Considerations for SARS-CoV-2 testing: Outpatient influenza-like illness
In 2020-2021, the Centers for Disease Control and Prevention recommends considering empiric antiviral treatment for ILIs (fever plus either cough or sore throat) based upon our clinical judgement, even in non-high-risk children.4
While pediatric COVID-19 illnesses are predominantly asymptomatic or mild, a febrile ARI is also a SARS-CoV-2 compatible presentation. So, if all we use is our clinical judgment, how do we know if the febrile ARI is due to influenza or SARS-CoV-2 or both? At least one study used a highly sensitive and specific molecular influenza test to show that the accuracy of clinically diagnosing influenza in children is not much better than flipping a coin and would lead to potential antiviral overuse.5
So, it seems ideal to test for influenza when possible. Point-of-care (POC) tests are frequently used for outpatients. Eight POC Clinical Laboratory Improvement Amendments (CLIA)–waived kits, some also detecting RSV, are available but most have modest sensitivity (60%-80%) compared with lab-based molecular tests.6 That said, if supplies and kits for one of the POC tests are available to us during these SARS-CoV-2 stressed times (back orders seem more common this year), a positive influenza test in the first 48 hours of symptoms confirms the option to prescribe an antiviral. Yet how will we have confidence that the febrile ARI is not also partly due to SARS-CoV-2? Currently febrile ARIs usually are considered SARS-CoV-2 and the children are sent for SARS-CoV-2 testing. During influenza season, it seems we will need to continue to send febrile outpatients for SARS-CoV-2 testing, even if POC influenza positive, via whatever mechanisms are available as time goes on.
We expect more rapid pediatric testing modalities for SARS-CoV-2 (maybe even saliva tests) to become available over the next months. Indeed, rapid antigen tests and rapid molecular tests are being evaluated in adults and seem destined for CLIA waivers as POC tests, and even home testing kits. Pediatric approvals hopefully also will occur. So, the pathways for SARS-CoV-2 testing available now will likely change over this winter. But be aware that supplies/kits will be prioritized to locations within high need areas and bulk purchase contracts. So POC kits may remain scarce for practices, meaning a reference laboratory still could be the way to go for SARS-CoV-2 for at least the rest of 2020. Reference labs are becoming creative as well; one combined detection of influenza A, influenza B, RSV, and SARS-CoV-2 into one test, and hopes to get approval for swab collection that can be done by families at home and mailed in.
Summary
Expect variations on the traditional parade of seasonal respiratory viruses, with increased numbers of coinfections. Choosing the outpatient who needs influenza testing is the same as in past years, although we have CDC permissive recommendations to prescribe antivirals for any outpatient ILI within the first 48 hours of symptoms. Still, POC testing for influenza remains potentially valuable in the ILI patient. The choice of whether and how to test for SARS-CoV-2 given its potential to be a primary or coinfecting agent in presentations linked more closely to a traditional virus (e.g. RSV bronchiolitis) will be a test of our clinical judgement until more data and easier testing are available. Further complicating coinfection recognition is the fact that many sick visits occur by telehealth and much testing is done at drive-through SARS-CoV-2 testing facilities with no clinician exam. Unless we are liberal in SARS-CoV-2 testing, detecting SARS-CoV-2 coinfections is easier said than done given its usually mild presentation being overshadowed by any coinfecting virus.
But understanding who has SARS-CoV-2, even as a coinfection, still is essential in controlling the pandemic. We will need to be vigilant for evolving approaches to SARS-CoV-2 testing in the context of symptomatic ARI presentations, knowing this will likely remain a moving target for the foreseeable future.
Dr. Harrison is professor of pediatrics and pediatric infectious diseases at Children’s Mercy Hospital-Kansas City, Mo. Children’s Mercy Hospital receives grant funding to study two candidate RSV vaccines. The hospital also receives CDC funding under the New Vaccine Surveillance Network for multicenter surveillance of acute respiratory infections, including influenza, RSV, and parainfluenza virus. Email Dr. Harrison at pdnews@mdedge.com.
References
1. Pediatrics. 2020;146(1):e20200961.
2. JAMA. 2020 May 26;323(20):2085-6.
3. Pediatrics. 2020. doi: 10.1542/peds.2020-1267.
4. www.cdc.gov/flu/professionals/antivirals/summary-clinicians.htm.
5. J. Pediatr. 2020. doi: 10.1016/j.jpeds.2020.08.007.
6. www.cdc.gov/flu/professionals/diagnosis/table-nucleic-acid-detection.html.
Respiratory virus seasons usually follow a fairly well-known pattern. Enterovirus 68 (EV-D68) is a summer-to-early fall virus with biennial peak years. Rhinovirus (HRv) and adenovirus (Adv) occur nearly year-round but may have small upticks in the first month or so that children return to school. Early in the school year, upper respiratory infections from both HRv and Adv and viral sore throats from Adv are common, with conjunctivitis from Adv outbreaks in some years. October to November is human parainfluenza (HPiV) 1 and 2 season, often presenting as croup. Human metapneumovirus infections span October through April. In late November to December, influenza begins, usually with an A type, later transitioning to a B type in February through April. Also in December, respiratory syncytial virus (RSV) starts, characteristically with bronchiolitis presentations, peaking in February to March and tapering off in May. In late March to April, HPiV 3 also appears for 4-6 weeks.
Will 2020-2021 be different?
Summer was remarkably free of expected enterovirus activity, suggesting that the seasonal parade may differ this year. Remember that the 2019-2020 respiratory season suddenly and nearly completely stopped in March because of social distancing and lockdowns needed to address the SARS-CoV-2 pandemic.
The mild influenza season in the southern hemisphere suggests that our influenza season also could be mild. But perhaps not – most southern hemisphere countries that are surveyed for influenza activities had the most intense SARS-CoV-2 mitigations, making the observed mildness potentially related more to social mitigation than less virulent influenza strains. If so, southern hemisphere influenza data may not apply to the United States, where social distancing and masks are ignored or used inconsistently by almost half the population.
Further, the stop-and-go pattern of in-person school/college attendance adds to uncertainties for the usual orderly virus-specific seasonality. The result may be multiple stop-and-go “pop-up” or “mini” outbreaks for any given virus potentially reflected as exaggerated local or regional differences in circulation of various viruses. The erratic seasonality also would increase coinfections, which could present with more severe or different symptoms.
SARS-CoV-2’s potential interaction
Will the relatively mild presentations for most children with SARS-CoV-2 hold up in the setting of coinfections or sequential respiratory viral infections? Could SARS-CoV-2 cause worse/more prolonged symptoms or more sequelae if paired simultaneously or in tandem with a traditional respiratory virus? To date, data on the frequency and severity of SARS-CoV-2 coinfections are conflicting and sparse, but it appears that non-SARS-CoV-2 viruses can be involved in 15%-50% pediatric acute respiratory infections.1,2
However, it may not be important to know about coinfecting viruses other than influenza (can be treated) or SARS-CoV-2 (needs quarantine and contact tracing), unless symptoms are atypical or more severe than usual. For example, a young child with bronchiolitis is most likely infected with RSV, but HPiV, influenza, metapneumovirus, HRv, and even SARS-CoV-2 can cause bronchiolitis. Even so, testing outpatients for RSV or non-influenza is not routine or even clinically helpful. Supportive treatment and restriction from daycare attendance are sufficient management for outpatient ARIs whether presenting as bronchiolitis or not.
Considerations for SARS-CoV-2 testing: Outpatient bronchiolitis
If a child presents with classic bronchiolitis but has above moderate to severe symptoms, is SARS-CoV-2 a consideration? Perhaps, if SARS-CoV-2 acts similarly to non-SARS-CoV-2s.
A recent report from the 30th Multicenter Airway Research Collaboration (MARC-30) surveillance study (2007-2014) of children hospitalized with clinical bronchiolitis evaluated respiratory viruses, including RSV and the four common non-SARS coronaviruses using molecular testing.3 Among 1,880 subjects, a CoV (alpha CoV: NL63 or 229E, or beta CoV: KKU1 or OC43) was detected in 12%. Yet most had only RSV (n = 1,661); 32 had only CoV (n = 32). But note that 219 had both.
Bronchiolitis subjects with CoV were older – median 3.7 (1.4-5.8) vs. 2.8 (1.9-7.2) years – and more likely male than were RSV subjects (68% vs. 58%). OC43 was most frequent followed by equal numbers of HKU1 and NL63, while 229E was the least frequent. Medical utilization and severity did not differ among the CoVs, or between RSV+CoV vs. RSV alone, unless one considered CoV viral load as a variable. ICU use increased when the polymerase chain reaction cycle threshold result indicated a high CoV viral load.
These data suggest CoVs are not infrequent coinfectors with RSV in bronchiolitis – and that SARS-CoV-2 is the same. Therefore, a bronchiolitis presentation doesn’t necessarily take us off the hook for the need to consider SARS-CoV-2 testing, particularly in the somewhat older bronchiolitis patient with more than mild symptoms.
Considerations for SARS-CoV-2 testing: Outpatient influenza-like illness
In 2020-2021, the Centers for Disease Control and Prevention recommends considering empiric antiviral treatment for ILIs (fever plus either cough or sore throat) based upon our clinical judgement, even in non-high-risk children.4
While pediatric COVID-19 illnesses are predominantly asymptomatic or mild, a febrile ARI is also a SARS-CoV-2 compatible presentation. So, if all we use is our clinical judgment, how do we know if the febrile ARI is due to influenza or SARS-CoV-2 or both? At least one study used a highly sensitive and specific molecular influenza test to show that the accuracy of clinically diagnosing influenza in children is not much better than flipping a coin and would lead to potential antiviral overuse.5
So, it seems ideal to test for influenza when possible. Point-of-care (POC) tests are frequently used for outpatients. Eight POC Clinical Laboratory Improvement Amendments (CLIA)–waived kits, some also detecting RSV, are available but most have modest sensitivity (60%-80%) compared with lab-based molecular tests.6 That said, if supplies and kits for one of the POC tests are available to us during these SARS-CoV-2 stressed times (back orders seem more common this year), a positive influenza test in the first 48 hours of symptoms confirms the option to prescribe an antiviral. Yet how will we have confidence that the febrile ARI is not also partly due to SARS-CoV-2? Currently febrile ARIs usually are considered SARS-CoV-2 and the children are sent for SARS-CoV-2 testing. During influenza season, it seems we will need to continue to send febrile outpatients for SARS-CoV-2 testing, even if POC influenza positive, via whatever mechanisms are available as time goes on.
We expect more rapid pediatric testing modalities for SARS-CoV-2 (maybe even saliva tests) to become available over the next months. Indeed, rapid antigen tests and rapid molecular tests are being evaluated in adults and seem destined for CLIA waivers as POC tests, and even home testing kits. Pediatric approvals hopefully also will occur. So, the pathways for SARS-CoV-2 testing available now will likely change over this winter. But be aware that supplies/kits will be prioritized to locations within high need areas and bulk purchase contracts. So POC kits may remain scarce for practices, meaning a reference laboratory still could be the way to go for SARS-CoV-2 for at least the rest of 2020. Reference labs are becoming creative as well; one combined detection of influenza A, influenza B, RSV, and SARS-CoV-2 into one test, and hopes to get approval for swab collection that can be done by families at home and mailed in.
Summary
Expect variations on the traditional parade of seasonal respiratory viruses, with increased numbers of coinfections. Choosing the outpatient who needs influenza testing is the same as in past years, although we have CDC permissive recommendations to prescribe antivirals for any outpatient ILI within the first 48 hours of symptoms. Still, POC testing for influenza remains potentially valuable in the ILI patient. The choice of whether and how to test for SARS-CoV-2 given its potential to be a primary or coinfecting agent in presentations linked more closely to a traditional virus (e.g. RSV bronchiolitis) will be a test of our clinical judgement until more data and easier testing are available. Further complicating coinfection recognition is the fact that many sick visits occur by telehealth and much testing is done at drive-through SARS-CoV-2 testing facilities with no clinician exam. Unless we are liberal in SARS-CoV-2 testing, detecting SARS-CoV-2 coinfections is easier said than done given its usually mild presentation being overshadowed by any coinfecting virus.
But understanding who has SARS-CoV-2, even as a coinfection, still is essential in controlling the pandemic. We will need to be vigilant for evolving approaches to SARS-CoV-2 testing in the context of symptomatic ARI presentations, knowing this will likely remain a moving target for the foreseeable future.
Dr. Harrison is professor of pediatrics and pediatric infectious diseases at Children’s Mercy Hospital-Kansas City, Mo. Children’s Mercy Hospital receives grant funding to study two candidate RSV vaccines. The hospital also receives CDC funding under the New Vaccine Surveillance Network for multicenter surveillance of acute respiratory infections, including influenza, RSV, and parainfluenza virus. Email Dr. Harrison at pdnews@mdedge.com.
References
1. Pediatrics. 2020;146(1):e20200961.
2. JAMA. 2020 May 26;323(20):2085-6.
3. Pediatrics. 2020. doi: 10.1542/peds.2020-1267.
4. www.cdc.gov/flu/professionals/antivirals/summary-clinicians.htm.
5. J. Pediatr. 2020. doi: 10.1016/j.jpeds.2020.08.007.
6. www.cdc.gov/flu/professionals/diagnosis/table-nucleic-acid-detection.html.
Respiratory virus seasons usually follow a fairly well-known pattern. Enterovirus 68 (EV-D68) is a summer-to-early fall virus with biennial peak years. Rhinovirus (HRv) and adenovirus (Adv) occur nearly year-round but may have small upticks in the first month or so that children return to school. Early in the school year, upper respiratory infections from both HRv and Adv and viral sore throats from Adv are common, with conjunctivitis from Adv outbreaks in some years. October to November is human parainfluenza (HPiV) 1 and 2 season, often presenting as croup. Human metapneumovirus infections span October through April. In late November to December, influenza begins, usually with an A type, later transitioning to a B type in February through April. Also in December, respiratory syncytial virus (RSV) starts, characteristically with bronchiolitis presentations, peaking in February to March and tapering off in May. In late March to April, HPiV 3 also appears for 4-6 weeks.
Will 2020-2021 be different?
Summer was remarkably free of expected enterovirus activity, suggesting that the seasonal parade may differ this year. Remember that the 2019-2020 respiratory season suddenly and nearly completely stopped in March because of social distancing and lockdowns needed to address the SARS-CoV-2 pandemic.
The mild influenza season in the southern hemisphere suggests that our influenza season also could be mild. But perhaps not – most southern hemisphere countries that are surveyed for influenza activities had the most intense SARS-CoV-2 mitigations, making the observed mildness potentially related more to social mitigation than less virulent influenza strains. If so, southern hemisphere influenza data may not apply to the United States, where social distancing and masks are ignored or used inconsistently by almost half the population.
Further, the stop-and-go pattern of in-person school/college attendance adds to uncertainties for the usual orderly virus-specific seasonality. The result may be multiple stop-and-go “pop-up” or “mini” outbreaks for any given virus potentially reflected as exaggerated local or regional differences in circulation of various viruses. The erratic seasonality also would increase coinfections, which could present with more severe or different symptoms.
SARS-CoV-2’s potential interaction
Will the relatively mild presentations for most children with SARS-CoV-2 hold up in the setting of coinfections or sequential respiratory viral infections? Could SARS-CoV-2 cause worse/more prolonged symptoms or more sequelae if paired simultaneously or in tandem with a traditional respiratory virus? To date, data on the frequency and severity of SARS-CoV-2 coinfections are conflicting and sparse, but it appears that non-SARS-CoV-2 viruses can be involved in 15%-50% pediatric acute respiratory infections.1,2
However, it may not be important to know about coinfecting viruses other than influenza (can be treated) or SARS-CoV-2 (needs quarantine and contact tracing), unless symptoms are atypical or more severe than usual. For example, a young child with bronchiolitis is most likely infected with RSV, but HPiV, influenza, metapneumovirus, HRv, and even SARS-CoV-2 can cause bronchiolitis. Even so, testing outpatients for RSV or non-influenza is not routine or even clinically helpful. Supportive treatment and restriction from daycare attendance are sufficient management for outpatient ARIs whether presenting as bronchiolitis or not.
Considerations for SARS-CoV-2 testing: Outpatient bronchiolitis
If a child presents with classic bronchiolitis but has above moderate to severe symptoms, is SARS-CoV-2 a consideration? Perhaps, if SARS-CoV-2 acts similarly to non-SARS-CoV-2s.
A recent report from the 30th Multicenter Airway Research Collaboration (MARC-30) surveillance study (2007-2014) of children hospitalized with clinical bronchiolitis evaluated respiratory viruses, including RSV and the four common non-SARS coronaviruses using molecular testing.3 Among 1,880 subjects, a CoV (alpha CoV: NL63 or 229E, or beta CoV: KKU1 or OC43) was detected in 12%. Yet most had only RSV (n = 1,661); 32 had only CoV (n = 32). But note that 219 had both.
Bronchiolitis subjects with CoV were older – median 3.7 (1.4-5.8) vs. 2.8 (1.9-7.2) years – and more likely male than were RSV subjects (68% vs. 58%). OC43 was most frequent followed by equal numbers of HKU1 and NL63, while 229E was the least frequent. Medical utilization and severity did not differ among the CoVs, or between RSV+CoV vs. RSV alone, unless one considered CoV viral load as a variable. ICU use increased when the polymerase chain reaction cycle threshold result indicated a high CoV viral load.
These data suggest CoVs are not infrequent coinfectors with RSV in bronchiolitis – and that SARS-CoV-2 is the same. Therefore, a bronchiolitis presentation doesn’t necessarily take us off the hook for the need to consider SARS-CoV-2 testing, particularly in the somewhat older bronchiolitis patient with more than mild symptoms.
Considerations for SARS-CoV-2 testing: Outpatient influenza-like illness
In 2020-2021, the Centers for Disease Control and Prevention recommends considering empiric antiviral treatment for ILIs (fever plus either cough or sore throat) based upon our clinical judgement, even in non-high-risk children.4
While pediatric COVID-19 illnesses are predominantly asymptomatic or mild, a febrile ARI is also a SARS-CoV-2 compatible presentation. So, if all we use is our clinical judgment, how do we know if the febrile ARI is due to influenza or SARS-CoV-2 or both? At least one study used a highly sensitive and specific molecular influenza test to show that the accuracy of clinically diagnosing influenza in children is not much better than flipping a coin and would lead to potential antiviral overuse.5
So, it seems ideal to test for influenza when possible. Point-of-care (POC) tests are frequently used for outpatients. Eight POC Clinical Laboratory Improvement Amendments (CLIA)–waived kits, some also detecting RSV, are available but most have modest sensitivity (60%-80%) compared with lab-based molecular tests.6 That said, if supplies and kits for one of the POC tests are available to us during these SARS-CoV-2 stressed times (back orders seem more common this year), a positive influenza test in the first 48 hours of symptoms confirms the option to prescribe an antiviral. Yet how will we have confidence that the febrile ARI is not also partly due to SARS-CoV-2? Currently febrile ARIs usually are considered SARS-CoV-2 and the children are sent for SARS-CoV-2 testing. During influenza season, it seems we will need to continue to send febrile outpatients for SARS-CoV-2 testing, even if POC influenza positive, via whatever mechanisms are available as time goes on.
We expect more rapid pediatric testing modalities for SARS-CoV-2 (maybe even saliva tests) to become available over the next months. Indeed, rapid antigen tests and rapid molecular tests are being evaluated in adults and seem destined for CLIA waivers as POC tests, and even home testing kits. Pediatric approvals hopefully also will occur. So, the pathways for SARS-CoV-2 testing available now will likely change over this winter. But be aware that supplies/kits will be prioritized to locations within high need areas and bulk purchase contracts. So POC kits may remain scarce for practices, meaning a reference laboratory still could be the way to go for SARS-CoV-2 for at least the rest of 2020. Reference labs are becoming creative as well; one combined detection of influenza A, influenza B, RSV, and SARS-CoV-2 into one test, and hopes to get approval for swab collection that can be done by families at home and mailed in.
Summary
Expect variations on the traditional parade of seasonal respiratory viruses, with increased numbers of coinfections. Choosing the outpatient who needs influenza testing is the same as in past years, although we have CDC permissive recommendations to prescribe antivirals for any outpatient ILI within the first 48 hours of symptoms. Still, POC testing for influenza remains potentially valuable in the ILI patient. The choice of whether and how to test for SARS-CoV-2 given its potential to be a primary or coinfecting agent in presentations linked more closely to a traditional virus (e.g. RSV bronchiolitis) will be a test of our clinical judgement until more data and easier testing are available. Further complicating coinfection recognition is the fact that many sick visits occur by telehealth and much testing is done at drive-through SARS-CoV-2 testing facilities with no clinician exam. Unless we are liberal in SARS-CoV-2 testing, detecting SARS-CoV-2 coinfections is easier said than done given its usually mild presentation being overshadowed by any coinfecting virus.
But understanding who has SARS-CoV-2, even as a coinfection, still is essential in controlling the pandemic. We will need to be vigilant for evolving approaches to SARS-CoV-2 testing in the context of symptomatic ARI presentations, knowing this will likely remain a moving target for the foreseeable future.
Dr. Harrison is professor of pediatrics and pediatric infectious diseases at Children’s Mercy Hospital-Kansas City, Mo. Children’s Mercy Hospital receives grant funding to study two candidate RSV vaccines. The hospital also receives CDC funding under the New Vaccine Surveillance Network for multicenter surveillance of acute respiratory infections, including influenza, RSV, and parainfluenza virus. Email Dr. Harrison at pdnews@mdedge.com.
References
1. Pediatrics. 2020;146(1):e20200961.
2. JAMA. 2020 May 26;323(20):2085-6.
3. Pediatrics. 2020. doi: 10.1542/peds.2020-1267.
4. www.cdc.gov/flu/professionals/antivirals/summary-clinicians.htm.
5. J. Pediatr. 2020. doi: 10.1016/j.jpeds.2020.08.007.
6. www.cdc.gov/flu/professionals/diagnosis/table-nucleic-acid-detection.html.
AI can pinpoint COVID-19 from chest x-rays
Conventional chest x-rays combined with artificial intelligence (AI) can identify lung damage from COVID-19 and differentiate coronavirus patients from other patients, improving triage efforts, new research suggests.
The AI tool – developed by Jason Fleischer, PhD, and graduate student Mohammad Tariqul Islam, both from Princeton (N.J.) University – can distinguish COVID-19 patients from those with pneumonia or normal lung tissue with an accuracy of more than 95%.
“We were able to separate the COVID-19 patients with very high fidelity,” Dr. Fleischer said in an interview. “If you give me an x-ray now, I can say with very high confidence whether a patient has COVID-19.”
The diagnostic tool pinpoints patterns on x-ray images that are too subtle for even trained experts to notice. The precision of CT scanning is similar to that of the AI tool, but CT costs much more and has other disadvantages, said Dr. Fleischer, who presented his findings at the virtual European Respiratory Society International Congress 2020.
“CT is more expensive and uses higher doses of radiation,” he said. “Another big thing is that not everyone has tomography facilities – including a lot of rural places and developing countries – so you need something that’s on the spot.”
With machine learning, Dr. Fleischer analyzed 2,300 x-ray images: 1,018 “normal” images from patients who had neither pneumonia nor COVID-19, 1,011 from patients with pneumonia, and 271 from patients with COVID-19.
The AI tool uses a neural network to refine the number and type of lung features being tracked. A UMAP (Uniform Manifold Approximation and Projection) clustering algorithm then looks for similarities and differences in those images, he explained.
“We, as users, knew which type each x-ray was – normal, pneumonia positive, or COVID-19 positive – but the network did not,” he added.
Clinicians have observed two basic types of lung problems in COVID-19 patients: pneumonia that fills lung air sacs with fluid and dangerously low blood-oxygen levels despite nearly normal breathing patterns. Because treatment can vary according to type, it would be beneficial to quickly distinguish between them, Dr. Fleischer said.
The AI tool showed that there is a distinct difference in chest x-rays from pneumonia-positive patients and healthy people, he said. It also demonstrated two distinct clusters of COVID-19–positive chest x-rays: those that looked like pneumonia and those with a more normal presentation.
The fact that “the AI system recognizes something unique in chest x-rays from COVID-19–positive patients” indicates that the computer is able to identify visual markers for coronavirus, he explained. “We currently do not know what these markers are.”
Dr. Fleischer said his goal is not to replace physician decision-making, but to supplement it.
“I’m uncomfortable with having computers make the final decision,” he said. “They often have a narrow focus, whereas doctors have the big picture in mind.”
This AI tool is “very interesting,” especially in the context of expanding AI applications in various specialties, said Thierry Fumeaux, MD, from Nyon (Switzerland) Hospital. Some physicians currently disagree on whether a chest x-ray or CT scan is the better tool to help diagnose COVID-19.
“It seems better than the human eye and brain” to pinpoint COVID-19 lung damage, “so it’s very attractive as a technology,” Dr. Fumeaux said in an interview.
And AI can be used to supplement the efforts of busy and fatigued clinicians who might be stretched thin by large caseloads. “I cannot read 200 chest x-rays in a day, but a computer can do that in 2 minutes,” he said.
But Dr. Fumeaux offered a caveat: “Pattern recognition is promising, but at the moment I’m not aware of papers showing that, by using AI, you’re changing anything in the outcome of a patient.”
Ideally, Dr. Fleischer said he hopes that AI will soon be able to accurately indicate which treatments are most effective for individual COVID-19 patients. And the technology might eventually be used to help with treatment decisions for patients with asthma or chronic obstructive pulmonary disease, he noted.
But he needs more data before results indicate whether a COVID-19 patient would benefit from ventilator support, for example, and the tool can be used more widely. To contribute data or collaborate with Dr. Fleischer’s efforts, contact him.
“Machine learning is all about data, so you can find these correlations,” he said. “It would be nice to be able to use it to reassure a worried patient that their prognosis is good; to say that most of the people with symptoms like yours will be just fine.”
Dr. Fleischer and Dr. Fumeaux have declared no relevant financial relationships.
A version of this article originally appeared on Medscape.com.
Conventional chest x-rays combined with artificial intelligence (AI) can identify lung damage from COVID-19 and differentiate coronavirus patients from other patients, improving triage efforts, new research suggests.
The AI tool – developed by Jason Fleischer, PhD, and graduate student Mohammad Tariqul Islam, both from Princeton (N.J.) University – can distinguish COVID-19 patients from those with pneumonia or normal lung tissue with an accuracy of more than 95%.
“We were able to separate the COVID-19 patients with very high fidelity,” Dr. Fleischer said in an interview. “If you give me an x-ray now, I can say with very high confidence whether a patient has COVID-19.”
The diagnostic tool pinpoints patterns on x-ray images that are too subtle for even trained experts to notice. The precision of CT scanning is similar to that of the AI tool, but CT costs much more and has other disadvantages, said Dr. Fleischer, who presented his findings at the virtual European Respiratory Society International Congress 2020.
“CT is more expensive and uses higher doses of radiation,” he said. “Another big thing is that not everyone has tomography facilities – including a lot of rural places and developing countries – so you need something that’s on the spot.”
With machine learning, Dr. Fleischer analyzed 2,300 x-ray images: 1,018 “normal” images from patients who had neither pneumonia nor COVID-19, 1,011 from patients with pneumonia, and 271 from patients with COVID-19.
The AI tool uses a neural network to refine the number and type of lung features being tracked. A UMAP (Uniform Manifold Approximation and Projection) clustering algorithm then looks for similarities and differences in those images, he explained.
“We, as users, knew which type each x-ray was – normal, pneumonia positive, or COVID-19 positive – but the network did not,” he added.
Clinicians have observed two basic types of lung problems in COVID-19 patients: pneumonia that fills lung air sacs with fluid and dangerously low blood-oxygen levels despite nearly normal breathing patterns. Because treatment can vary according to type, it would be beneficial to quickly distinguish between them, Dr. Fleischer said.
The AI tool showed that there is a distinct difference in chest x-rays from pneumonia-positive patients and healthy people, he said. It also demonstrated two distinct clusters of COVID-19–positive chest x-rays: those that looked like pneumonia and those with a more normal presentation.
The fact that “the AI system recognizes something unique in chest x-rays from COVID-19–positive patients” indicates that the computer is able to identify visual markers for coronavirus, he explained. “We currently do not know what these markers are.”
Dr. Fleischer said his goal is not to replace physician decision-making, but to supplement it.
“I’m uncomfortable with having computers make the final decision,” he said. “They often have a narrow focus, whereas doctors have the big picture in mind.”
This AI tool is “very interesting,” especially in the context of expanding AI applications in various specialties, said Thierry Fumeaux, MD, from Nyon (Switzerland) Hospital. Some physicians currently disagree on whether a chest x-ray or CT scan is the better tool to help diagnose COVID-19.
“It seems better than the human eye and brain” to pinpoint COVID-19 lung damage, “so it’s very attractive as a technology,” Dr. Fumeaux said in an interview.
And AI can be used to supplement the efforts of busy and fatigued clinicians who might be stretched thin by large caseloads. “I cannot read 200 chest x-rays in a day, but a computer can do that in 2 minutes,” he said.
But Dr. Fumeaux offered a caveat: “Pattern recognition is promising, but at the moment I’m not aware of papers showing that, by using AI, you’re changing anything in the outcome of a patient.”
Ideally, Dr. Fleischer said he hopes that AI will soon be able to accurately indicate which treatments are most effective for individual COVID-19 patients. And the technology might eventually be used to help with treatment decisions for patients with asthma or chronic obstructive pulmonary disease, he noted.
But he needs more data before results indicate whether a COVID-19 patient would benefit from ventilator support, for example, and the tool can be used more widely. To contribute data or collaborate with Dr. Fleischer’s efforts, contact him.
“Machine learning is all about data, so you can find these correlations,” he said. “It would be nice to be able to use it to reassure a worried patient that their prognosis is good; to say that most of the people with symptoms like yours will be just fine.”
Dr. Fleischer and Dr. Fumeaux have declared no relevant financial relationships.
A version of this article originally appeared on Medscape.com.
Conventional chest x-rays combined with artificial intelligence (AI) can identify lung damage from COVID-19 and differentiate coronavirus patients from other patients, improving triage efforts, new research suggests.
The AI tool – developed by Jason Fleischer, PhD, and graduate student Mohammad Tariqul Islam, both from Princeton (N.J.) University – can distinguish COVID-19 patients from those with pneumonia or normal lung tissue with an accuracy of more than 95%.
“We were able to separate the COVID-19 patients with very high fidelity,” Dr. Fleischer said in an interview. “If you give me an x-ray now, I can say with very high confidence whether a patient has COVID-19.”
The diagnostic tool pinpoints patterns on x-ray images that are too subtle for even trained experts to notice. The precision of CT scanning is similar to that of the AI tool, but CT costs much more and has other disadvantages, said Dr. Fleischer, who presented his findings at the virtual European Respiratory Society International Congress 2020.
“CT is more expensive and uses higher doses of radiation,” he said. “Another big thing is that not everyone has tomography facilities – including a lot of rural places and developing countries – so you need something that’s on the spot.”
With machine learning, Dr. Fleischer analyzed 2,300 x-ray images: 1,018 “normal” images from patients who had neither pneumonia nor COVID-19, 1,011 from patients with pneumonia, and 271 from patients with COVID-19.
The AI tool uses a neural network to refine the number and type of lung features being tracked. A UMAP (Uniform Manifold Approximation and Projection) clustering algorithm then looks for similarities and differences in those images, he explained.
“We, as users, knew which type each x-ray was – normal, pneumonia positive, or COVID-19 positive – but the network did not,” he added.
Clinicians have observed two basic types of lung problems in COVID-19 patients: pneumonia that fills lung air sacs with fluid and dangerously low blood-oxygen levels despite nearly normal breathing patterns. Because treatment can vary according to type, it would be beneficial to quickly distinguish between them, Dr. Fleischer said.
The AI tool showed that there is a distinct difference in chest x-rays from pneumonia-positive patients and healthy people, he said. It also demonstrated two distinct clusters of COVID-19–positive chest x-rays: those that looked like pneumonia and those with a more normal presentation.
The fact that “the AI system recognizes something unique in chest x-rays from COVID-19–positive patients” indicates that the computer is able to identify visual markers for coronavirus, he explained. “We currently do not know what these markers are.”
Dr. Fleischer said his goal is not to replace physician decision-making, but to supplement it.
“I’m uncomfortable with having computers make the final decision,” he said. “They often have a narrow focus, whereas doctors have the big picture in mind.”
This AI tool is “very interesting,” especially in the context of expanding AI applications in various specialties, said Thierry Fumeaux, MD, from Nyon (Switzerland) Hospital. Some physicians currently disagree on whether a chest x-ray or CT scan is the better tool to help diagnose COVID-19.
“It seems better than the human eye and brain” to pinpoint COVID-19 lung damage, “so it’s very attractive as a technology,” Dr. Fumeaux said in an interview.
And AI can be used to supplement the efforts of busy and fatigued clinicians who might be stretched thin by large caseloads. “I cannot read 200 chest x-rays in a day, but a computer can do that in 2 minutes,” he said.
But Dr. Fumeaux offered a caveat: “Pattern recognition is promising, but at the moment I’m not aware of papers showing that, by using AI, you’re changing anything in the outcome of a patient.”
Ideally, Dr. Fleischer said he hopes that AI will soon be able to accurately indicate which treatments are most effective for individual COVID-19 patients. And the technology might eventually be used to help with treatment decisions for patients with asthma or chronic obstructive pulmonary disease, he noted.
But he needs more data before results indicate whether a COVID-19 patient would benefit from ventilator support, for example, and the tool can be used more widely. To contribute data or collaborate with Dr. Fleischer’s efforts, contact him.
“Machine learning is all about data, so you can find these correlations,” he said. “It would be nice to be able to use it to reassure a worried patient that their prognosis is good; to say that most of the people with symptoms like yours will be just fine.”
Dr. Fleischer and Dr. Fumeaux have declared no relevant financial relationships.
A version of this article originally appeared on Medscape.com.
Social distancing impacts other infectious diseases
Diagnoses of 12 common pediatric infectious diseases in a large pediatric primary care network declined significantly in the weeks after COVID-19 social distancing (SD) was enacted in Massachusetts, compared with the same time period in 2019, an analysis of EHR data has shown.

While declines in infectious disease transmission with SD are not surprising, “these data demonstrate the extent to which transmission of common pediatric infections can be altered when close contact with other children is eliminated,” Jonathan Hatoun, MD, MPH of the Pediatric Physicians’ Organization at Children’s in Brookline, Mass., and coauthors wrote in Pediatrics . “Notably, three of the studied diseases, namely, influenza, croup, and bronchiolitis, essentially disappeared with [social distancing].”
The researchers analyzed the weekly incidence of each diagnosis for similar calendar periods in 2019 and 2020. A pre-SD period was defined as week 1-9, starting on Jan. 1, and a post-SD period was defined as week 13-18. (The several-week gap represented an implementation period as social distancing was enacted in the state earlier in 2020, from a declared statewide state of emergency through school closures and stay-at-home advisories.)
To isolate the effect of widespread SD, they performed a “difference-in-differences regression analysis, with diagnosis count as a function of calendar year, time period (pre-SD versus post-SD) and the interaction between the two.” The Massachusetts pediatric network provides care for approximately 375,000 children in 100 locations around the state.
In their research brief, Dr. Hatoun and coauthors presented weekly rates expressed as diagnoses per 100,000 patients per day. The rate of bronchiolitis, for instance, was 18 and 8 in the pre- and post-SD–equivalent weeks of 2019, respectively, and 20 and 0.6 in the pre- and post-SD weeks of 2020. Their analysis showed the rate in the 2020 post-SD period to be 10 diagnoses per 100,000 patients per day lower than they would have expected based on the 2019 trend.
Rates of pneumonia, acute otitis media, and streptococcal pharyngitis were similarly 14, 85, and 31 diagnoses per 100,000 patients per day lower, respectively. The prevalence of each of the other conditions analyzed – the common cold, croup, gastroenteritis, nonstreptococcal pharyngitis, sinusitis, skin and soft tissue infections, and urinary tract infection (UTI) – also was significantly lower in the 2020 post-SD period than would be expected based on 2019 data (P < .001 for all diagnoses).
Putting things in perspective
“This study puts numbers to the sense that we have all had in pediatrics – that social distancing appears to have had a dramatic impact on the transmission of common childhood infectious diseases, especially other respiratory viral pathogens,” Audrey R. John, MD, PhD, chief of the division of pediatric infectious disease at Children’s Hospital of Philadelphia, said in an interview.
The authors acknowledged the possible role of families not seeking care, but said that a smaller decrease in diagnoses of UTI – generally not a contagious disease – “suggests that changes in care-seeking behavior had a relatively modest effect on the other observed declines.” (The rate of UTI for the pre- and post-SD periods was 3.3 and 3.7 per 100,000 patients per day in 2019, and 3.4 and 2.4 in 2020, for a difference in differences of –1.5).
In an accompanying editorial, David W. Kimberlin, MD and Erica C. Bjornstad, MD, PhD, MPH, of the University of Alabama at Birmingham, called the report “provocative” and wrote that similar observations of infections dropping during periods of isolation – namely, dramatic declines in influenza and other respiratory viruses in Seattle after a record snowstorm in 2019 – combined with findings from other modeling studies “suggest that the decline [reported in Boston] is indeed real” (Pediatrics 2020. doi: 10.1542/peds.2020-019232).
However, “we also now know that immunization rates for American children have plummeted since the onset of the SARS-CoV-2 pandemic [because of a] ... dramatic decrease in the use of health care during the first months of the pandemic,” they wrote. “Viewed through this lens,” the declines reported in Boston may reflect inflections going “undiagnosed and untreated.”
Ultimately, Dr. Kimberlin and Dr. Bjornstad said, “the verdict remains out.”
Dr. John said that she and others are “concerned about children not seeking care in a timely manner, and [concerned] that reductions in reported infections might be due to a lack of recognition rather than a lack of transmission.”
In Philadelphia, however, declines in admissions for asthma exacerbations, “which are often caused by respiratory viral infections, suggests that this may not be the case,” said Dr. John, who was asked to comment on the study.
In addition, she said, the Massachusetts data showing that UTI diagnoses “are nearly as common this year as in 2019” are “reassuring.”
Are there lessons for the future?
Coauthor Louis Vernacchio, MD, MSc, chief medical officer of the Pediatric Physicians’ Organization at Children’s network, said in an interview that beyond the pandemic, it’s likely that “more careful attention to proven infection control practices in daycares and schools could reduce the burden of common infectious diseases in children.”
Dr. John similarly sees a long-term value of quantifying the impact of social distancing. “We’ve always known [for instance] that bronchiolitis is the result of viral infection.” Findings like the Massachusetts data “will help us advise families who might be trying to protect their premature infants (at risk for severe bronchiolitis) through social distancing.”
The analysis covered both in-person and telemedicine encounters occurring on weekdays.
The authors of the research brief indicated they have no relevant financial disclosures and there was no external funding. The authors of the commentary also reported they have no relevant financial disclosures, and Dr. John said she had no relevant financial disclosures.
SOURCE: Hatoun J et al. Pediatrics. 2020. doi: 10.1542/peds.2020-006460.
Diagnoses of 12 common pediatric infectious diseases in a large pediatric primary care network declined significantly in the weeks after COVID-19 social distancing (SD) was enacted in Massachusetts, compared with the same time period in 2019, an analysis of EHR data has shown.
While declines in infectious disease transmission with SD are not surprising, “these data demonstrate the extent to which transmission of common pediatric infections can be altered when close contact with other children is eliminated,” Jonathan Hatoun, MD, MPH of the Pediatric Physicians’ Organization at Children’s in Brookline, Mass., and coauthors wrote in Pediatrics . “Notably, three of the studied diseases, namely, influenza, croup, and bronchiolitis, essentially disappeared with [social distancing].”
The researchers analyzed the weekly incidence of each diagnosis for similar calendar periods in 2019 and 2020. A pre-SD period was defined as week 1-9, starting on Jan. 1, and a post-SD period was defined as week 13-18. (The several-week gap represented an implementation period as social distancing was enacted in the state earlier in 2020, from a declared statewide state of emergency through school closures and stay-at-home advisories.)
To isolate the effect of widespread SD, they performed a “difference-in-differences regression analysis, with diagnosis count as a function of calendar year, time period (pre-SD versus post-SD) and the interaction between the two.” The Massachusetts pediatric network provides care for approximately 375,000 children in 100 locations around the state.
In their research brief, Dr. Hatoun and coauthors presented weekly rates expressed as diagnoses per 100,000 patients per day. The rate of bronchiolitis, for instance, was 18 and 8 in the pre- and post-SD–equivalent weeks of 2019, respectively, and 20 and 0.6 in the pre- and post-SD weeks of 2020. Their analysis showed the rate in the 2020 post-SD period to be 10 diagnoses per 100,000 patients per day lower than they would have expected based on the 2019 trend.
Rates of pneumonia, acute otitis media, and streptococcal pharyngitis were similarly 14, 85, and 31 diagnoses per 100,000 patients per day lower, respectively. The prevalence of each of the other conditions analyzed – the common cold, croup, gastroenteritis, nonstreptococcal pharyngitis, sinusitis, skin and soft tissue infections, and urinary tract infection (UTI) – also was significantly lower in the 2020 post-SD period than would be expected based on 2019 data (P < .001 for all diagnoses).
Putting things in perspective
“This study puts numbers to the sense that we have all had in pediatrics – that social distancing appears to have had a dramatic impact on the transmission of common childhood infectious diseases, especially other respiratory viral pathogens,” Audrey R. John, MD, PhD, chief of the division of pediatric infectious disease at Children’s Hospital of Philadelphia, said in an interview.
The authors acknowledged the possible role of families not seeking care, but said that a smaller decrease in diagnoses of UTI – generally not a contagious disease – “suggests that changes in care-seeking behavior had a relatively modest effect on the other observed declines.” (The rate of UTI for the pre- and post-SD periods was 3.3 and 3.7 per 100,000 patients per day in 2019, and 3.4 and 2.4 in 2020, for a difference in differences of –1.5).
In an accompanying editorial, David W. Kimberlin, MD and Erica C. Bjornstad, MD, PhD, MPH, of the University of Alabama at Birmingham, called the report “provocative” and wrote that similar observations of infections dropping during periods of isolation – namely, dramatic declines in influenza and other respiratory viruses in Seattle after a record snowstorm in 2019 – combined with findings from other modeling studies “suggest that the decline [reported in Boston] is indeed real” (Pediatrics 2020. doi: 10.1542/peds.2020-019232).
However, “we also now know that immunization rates for American children have plummeted since the onset of the SARS-CoV-2 pandemic [because of a] ... dramatic decrease in the use of health care during the first months of the pandemic,” they wrote. “Viewed through this lens,” the declines reported in Boston may reflect inflections going “undiagnosed and untreated.”
Ultimately, Dr. Kimberlin and Dr. Bjornstad said, “the verdict remains out.”
Dr. John said that she and others are “concerned about children not seeking care in a timely manner, and [concerned] that reductions in reported infections might be due to a lack of recognition rather than a lack of transmission.”
In Philadelphia, however, declines in admissions for asthma exacerbations, “which are often caused by respiratory viral infections, suggests that this may not be the case,” said Dr. John, who was asked to comment on the study.
In addition, she said, the Massachusetts data showing that UTI diagnoses “are nearly as common this year as in 2019” are “reassuring.”
Are there lessons for the future?
Coauthor Louis Vernacchio, MD, MSc, chief medical officer of the Pediatric Physicians’ Organization at Children’s network, said in an interview that beyond the pandemic, it’s likely that “more careful attention to proven infection control practices in daycares and schools could reduce the burden of common infectious diseases in children.”
Dr. John similarly sees a long-term value of quantifying the impact of social distancing. “We’ve always known [for instance] that bronchiolitis is the result of viral infection.” Findings like the Massachusetts data “will help us advise families who might be trying to protect their premature infants (at risk for severe bronchiolitis) through social distancing.”
The analysis covered both in-person and telemedicine encounters occurring on weekdays.
The authors of the research brief indicated they have no relevant financial disclosures and there was no external funding. The authors of the commentary also reported they have no relevant financial disclosures, and Dr. John said she had no relevant financial disclosures.
SOURCE: Hatoun J et al. Pediatrics. 2020. doi: 10.1542/peds.2020-006460.
Diagnoses of 12 common pediatric infectious diseases in a large pediatric primary care network declined significantly in the weeks after COVID-19 social distancing (SD) was enacted in Massachusetts, compared with the same time period in 2019, an analysis of EHR data has shown.
While declines in infectious disease transmission with SD are not surprising, “these data demonstrate the extent to which transmission of common pediatric infections can be altered when close contact with other children is eliminated,” Jonathan Hatoun, MD, MPH of the Pediatric Physicians’ Organization at Children’s in Brookline, Mass., and coauthors wrote in Pediatrics . “Notably, three of the studied diseases, namely, influenza, croup, and bronchiolitis, essentially disappeared with [social distancing].”
The researchers analyzed the weekly incidence of each diagnosis for similar calendar periods in 2019 and 2020. A pre-SD period was defined as week 1-9, starting on Jan. 1, and a post-SD period was defined as week 13-18. (The several-week gap represented an implementation period as social distancing was enacted in the state earlier in 2020, from a declared statewide state of emergency through school closures and stay-at-home advisories.)
To isolate the effect of widespread SD, they performed a “difference-in-differences regression analysis, with diagnosis count as a function of calendar year, time period (pre-SD versus post-SD) and the interaction between the two.” The Massachusetts pediatric network provides care for approximately 375,000 children in 100 locations around the state.
In their research brief, Dr. Hatoun and coauthors presented weekly rates expressed as diagnoses per 100,000 patients per day. The rate of bronchiolitis, for instance, was 18 and 8 in the pre- and post-SD–equivalent weeks of 2019, respectively, and 20 and 0.6 in the pre- and post-SD weeks of 2020. Their analysis showed the rate in the 2020 post-SD period to be 10 diagnoses per 100,000 patients per day lower than they would have expected based on the 2019 trend.
Rates of pneumonia, acute otitis media, and streptococcal pharyngitis were similarly 14, 85, and 31 diagnoses per 100,000 patients per day lower, respectively. The prevalence of each of the other conditions analyzed – the common cold, croup, gastroenteritis, nonstreptococcal pharyngitis, sinusitis, skin and soft tissue infections, and urinary tract infection (UTI) – also was significantly lower in the 2020 post-SD period than would be expected based on 2019 data (P < .001 for all diagnoses).
Putting things in perspective
“This study puts numbers to the sense that we have all had in pediatrics – that social distancing appears to have had a dramatic impact on the transmission of common childhood infectious diseases, especially other respiratory viral pathogens,” Audrey R. John, MD, PhD, chief of the division of pediatric infectious disease at Children’s Hospital of Philadelphia, said in an interview.
The authors acknowledged the possible role of families not seeking care, but said that a smaller decrease in diagnoses of UTI – generally not a contagious disease – “suggests that changes in care-seeking behavior had a relatively modest effect on the other observed declines.” (The rate of UTI for the pre- and post-SD periods was 3.3 and 3.7 per 100,000 patients per day in 2019, and 3.4 and 2.4 in 2020, for a difference in differences of –1.5).
In an accompanying editorial, David W. Kimberlin, MD and Erica C. Bjornstad, MD, PhD, MPH, of the University of Alabama at Birmingham, called the report “provocative” and wrote that similar observations of infections dropping during periods of isolation – namely, dramatic declines in influenza and other respiratory viruses in Seattle after a record snowstorm in 2019 – combined with findings from other modeling studies “suggest that the decline [reported in Boston] is indeed real” (Pediatrics 2020. doi: 10.1542/peds.2020-019232).
However, “we also now know that immunization rates for American children have plummeted since the onset of the SARS-CoV-2 pandemic [because of a] ... dramatic decrease in the use of health care during the first months of the pandemic,” they wrote. “Viewed through this lens,” the declines reported in Boston may reflect inflections going “undiagnosed and untreated.”
Ultimately, Dr. Kimberlin and Dr. Bjornstad said, “the verdict remains out.”
Dr. John said that she and others are “concerned about children not seeking care in a timely manner, and [concerned] that reductions in reported infections might be due to a lack of recognition rather than a lack of transmission.”
In Philadelphia, however, declines in admissions for asthma exacerbations, “which are often caused by respiratory viral infections, suggests that this may not be the case,” said Dr. John, who was asked to comment on the study.
In addition, she said, the Massachusetts data showing that UTI diagnoses “are nearly as common this year as in 2019” are “reassuring.”
Are there lessons for the future?
Coauthor Louis Vernacchio, MD, MSc, chief medical officer of the Pediatric Physicians’ Organization at Children’s network, said in an interview that beyond the pandemic, it’s likely that “more careful attention to proven infection control practices in daycares and schools could reduce the burden of common infectious diseases in children.”
Dr. John similarly sees a long-term value of quantifying the impact of social distancing. “We’ve always known [for instance] that bronchiolitis is the result of viral infection.” Findings like the Massachusetts data “will help us advise families who might be trying to protect their premature infants (at risk for severe bronchiolitis) through social distancing.”
The analysis covered both in-person and telemedicine encounters occurring on weekdays.
The authors of the research brief indicated they have no relevant financial disclosures and there was no external funding. The authors of the commentary also reported they have no relevant financial disclosures, and Dr. John said she had no relevant financial disclosures.
SOURCE: Hatoun J et al. Pediatrics. 2020. doi: 10.1542/peds.2020-006460.
FROM PEDIATRICS
Insomnia + COPD linked to more outpatient, ED visits
Insomnia is “highly prevalent” in veterans with chronic pulmonary obstructive disease and is significantly associated with greater COPD-related health care utilization, according to an analysis of national Veterans Health Administration data.
“The study highlights the importance of exploring potential sleep disturbances and disorders in this population and suggests that a targeted treatment for insomnia may help to improve COPD outcomes in veterans with COPD and insomnia,” said Faith Luyster, PhD, assistant professor at the University of Pittsburgh, in an interview after the virtual annual meeting of the Associated Professional Sleep Societies, where she presented the findings.
Dr. Luyster and coinvestigators used an administrative database from the Veterans Affairs Corporate Data Warehouse to identify more than 1.5 million patients with COPD who used VHA services over a 6-year period (fiscal years 2011-2017). Insomnia was defined by ICD-9/10 diagnostic codes and/or a sedative-hypnotic prescription for at least 30 doses during any of these years.
Insomnia with COPD was prevalent in this sample of veterans at 37.3%. Compared with veterans without comorbid insomnia, those who had both COPD and insomnia (575,539 of the total 1,542,642) were older (69 vs. 64 years), more likely to be female (6.3% vs. 3.7%), more likely to be Black (14% vs. 11%) and more likely to be a current smoker (46.1% vs. 35.5%).
Those with both COPD and insomnia were also more likely to have a service-connected disability rating of 50% of greater; use supplemental oxygen; be divorced, widowed, or separated; have a higher body mass index; or have other medical or psychiatric conditions – in particular obstructive sleep apnea (39% vs. 7%), depression (21% vs. 5%), and PTSD (33% vs. 3%).
P values were < .001 for all of these demographic and clinical variables, Dr. Luyster reported at the meeting.
Comorbid insomnia clearly impacted health care utilization, she said. Veterans with insomnia in addition to COPD had more outpatient and ED visits (10.5 vs 6.9, and 1.6 vs. 1.4, respectively) and more hospitalizations (2.2 vs. 1.8) with a primary diagnostic code for COPD or COPD exacerbation (P < .001).
A negative binomial regression analysis (P < .001) showed that “even after controlling for demographic and other medical conditions, COPD patients with insomnia had greater rates of health care utilization relative to COPD patients without insomnia,” Dr. Luyster said in the interview.
Prior studies have suggested that disturbed sleep is a predictor of poorer longitudinal outcomes in COPD, even after controlling for COPD severity, but have not looked specifically at insomnia, she said.
Commenting on the study Octavian C. Ioachimescu, MD, PhD, of Emory University, Atlanta, and the Atlanta VA Medical Center in Decatur, said the criteria used to define insomnia – unadjudicated ICD diagnoses as well as sedative-hypnotic prescriptions – may explain part of the reported prevalence of insomnia. Even so, the findings add to existing literature demonstrating that COPD and insomnia are both common disorders among VHA patients, and that their frequent coexistence “could have adverse consequences on the overall health, functional status, long-term outcomes, and quality of life of these patients.”
Questions of causation are yet to be answered, he said. “Is it that uncontrolled or severe airflow obstruction causing frequent nocturnal arousals, dyspnea, orthopnea, overuse of inhaled sympathomimetics and heightened anxiety leads to insomnia? Or is it that insomnia – possibly in a cluster with other affective disorders such as depression, anxiety disorders, or PTSD – elicits more frequent or more severe symptoms of shortness of breath in those with smoking-induced airway and parenchymal lung disease, making the latter diagnosis more overt than in others?
“My bet is on a bidirectional causal relationship,” said Dr. Ioachimescu, an editorial board advisor of CHEST Physician.
“Regardless of the etiology [of insomnia in veterans with COPD],” Dr. Luyster said, “it’s important that [insomnia] be addressed and treated appropriately, whether that be through pharmacological treatment, or probably more ideally through [cognitive behavioral therapy] for insomnia.”
The study did not control for COPD severity, she said, because of the difficulty of extracting this data from the VA Corporate Data Warehouse. The study was funded by the VA Competitive Career Development Fund.Dr. Luyster reported that she had no disclosures. Dr. Ioachimescu also said he had no relevant disclosures.
Insomnia is “highly prevalent” in veterans with chronic pulmonary obstructive disease and is significantly associated with greater COPD-related health care utilization, according to an analysis of national Veterans Health Administration data.
“The study highlights the importance of exploring potential sleep disturbances and disorders in this population and suggests that a targeted treatment for insomnia may help to improve COPD outcomes in veterans with COPD and insomnia,” said Faith Luyster, PhD, assistant professor at the University of Pittsburgh, in an interview after the virtual annual meeting of the Associated Professional Sleep Societies, where she presented the findings.
Dr. Luyster and coinvestigators used an administrative database from the Veterans Affairs Corporate Data Warehouse to identify more than 1.5 million patients with COPD who used VHA services over a 6-year period (fiscal years 2011-2017). Insomnia was defined by ICD-9/10 diagnostic codes and/or a sedative-hypnotic prescription for at least 30 doses during any of these years.
Insomnia with COPD was prevalent in this sample of veterans at 37.3%. Compared with veterans without comorbid insomnia, those who had both COPD and insomnia (575,539 of the total 1,542,642) were older (69 vs. 64 years), more likely to be female (6.3% vs. 3.7%), more likely to be Black (14% vs. 11%) and more likely to be a current smoker (46.1% vs. 35.5%).
Those with both COPD and insomnia were also more likely to have a service-connected disability rating of 50% of greater; use supplemental oxygen; be divorced, widowed, or separated; have a higher body mass index; or have other medical or psychiatric conditions – in particular obstructive sleep apnea (39% vs. 7%), depression (21% vs. 5%), and PTSD (33% vs. 3%).
P values were < .001 for all of these demographic and clinical variables, Dr. Luyster reported at the meeting.
Comorbid insomnia clearly impacted health care utilization, she said. Veterans with insomnia in addition to COPD had more outpatient and ED visits (10.5 vs 6.9, and 1.6 vs. 1.4, respectively) and more hospitalizations (2.2 vs. 1.8) with a primary diagnostic code for COPD or COPD exacerbation (P < .001).
A negative binomial regression analysis (P < .001) showed that “even after controlling for demographic and other medical conditions, COPD patients with insomnia had greater rates of health care utilization relative to COPD patients without insomnia,” Dr. Luyster said in the interview.
Prior studies have suggested that disturbed sleep is a predictor of poorer longitudinal outcomes in COPD, even after controlling for COPD severity, but have not looked specifically at insomnia, she said.
Commenting on the study Octavian C. Ioachimescu, MD, PhD, of Emory University, Atlanta, and the Atlanta VA Medical Center in Decatur, said the criteria used to define insomnia – unadjudicated ICD diagnoses as well as sedative-hypnotic prescriptions – may explain part of the reported prevalence of insomnia. Even so, the findings add to existing literature demonstrating that COPD and insomnia are both common disorders among VHA patients, and that their frequent coexistence “could have adverse consequences on the overall health, functional status, long-term outcomes, and quality of life of these patients.”
Questions of causation are yet to be answered, he said. “Is it that uncontrolled or severe airflow obstruction causing frequent nocturnal arousals, dyspnea, orthopnea, overuse of inhaled sympathomimetics and heightened anxiety leads to insomnia? Or is it that insomnia – possibly in a cluster with other affective disorders such as depression, anxiety disorders, or PTSD – elicits more frequent or more severe symptoms of shortness of breath in those with smoking-induced airway and parenchymal lung disease, making the latter diagnosis more overt than in others?
“My bet is on a bidirectional causal relationship,” said Dr. Ioachimescu, an editorial board advisor of CHEST Physician.
“Regardless of the etiology [of insomnia in veterans with COPD],” Dr. Luyster said, “it’s important that [insomnia] be addressed and treated appropriately, whether that be through pharmacological treatment, or probably more ideally through [cognitive behavioral therapy] for insomnia.”
The study did not control for COPD severity, she said, because of the difficulty of extracting this data from the VA Corporate Data Warehouse. The study was funded by the VA Competitive Career Development Fund.Dr. Luyster reported that she had no disclosures. Dr. Ioachimescu also said he had no relevant disclosures.
Insomnia is “highly prevalent” in veterans with chronic pulmonary obstructive disease and is significantly associated with greater COPD-related health care utilization, according to an analysis of national Veterans Health Administration data.
“The study highlights the importance of exploring potential sleep disturbances and disorders in this population and suggests that a targeted treatment for insomnia may help to improve COPD outcomes in veterans with COPD and insomnia,” said Faith Luyster, PhD, assistant professor at the University of Pittsburgh, in an interview after the virtual annual meeting of the Associated Professional Sleep Societies, where she presented the findings.
Dr. Luyster and coinvestigators used an administrative database from the Veterans Affairs Corporate Data Warehouse to identify more than 1.5 million patients with COPD who used VHA services over a 6-year period (fiscal years 2011-2017). Insomnia was defined by ICD-9/10 diagnostic codes and/or a sedative-hypnotic prescription for at least 30 doses during any of these years.
Insomnia with COPD was prevalent in this sample of veterans at 37.3%. Compared with veterans without comorbid insomnia, those who had both COPD and insomnia (575,539 of the total 1,542,642) were older (69 vs. 64 years), more likely to be female (6.3% vs. 3.7%), more likely to be Black (14% vs. 11%) and more likely to be a current smoker (46.1% vs. 35.5%).
Those with both COPD and insomnia were also more likely to have a service-connected disability rating of 50% of greater; use supplemental oxygen; be divorced, widowed, or separated; have a higher body mass index; or have other medical or psychiatric conditions – in particular obstructive sleep apnea (39% vs. 7%), depression (21% vs. 5%), and PTSD (33% vs. 3%).
P values were < .001 for all of these demographic and clinical variables, Dr. Luyster reported at the meeting.
Comorbid insomnia clearly impacted health care utilization, she said. Veterans with insomnia in addition to COPD had more outpatient and ED visits (10.5 vs 6.9, and 1.6 vs. 1.4, respectively) and more hospitalizations (2.2 vs. 1.8) with a primary diagnostic code for COPD or COPD exacerbation (P < .001).
A negative binomial regression analysis (P < .001) showed that “even after controlling for demographic and other medical conditions, COPD patients with insomnia had greater rates of health care utilization relative to COPD patients without insomnia,” Dr. Luyster said in the interview.
Prior studies have suggested that disturbed sleep is a predictor of poorer longitudinal outcomes in COPD, even after controlling for COPD severity, but have not looked specifically at insomnia, she said.
Commenting on the study Octavian C. Ioachimescu, MD, PhD, of Emory University, Atlanta, and the Atlanta VA Medical Center in Decatur, said the criteria used to define insomnia – unadjudicated ICD diagnoses as well as sedative-hypnotic prescriptions – may explain part of the reported prevalence of insomnia. Even so, the findings add to existing literature demonstrating that COPD and insomnia are both common disorders among VHA patients, and that their frequent coexistence “could have adverse consequences on the overall health, functional status, long-term outcomes, and quality of life of these patients.”
Questions of causation are yet to be answered, he said. “Is it that uncontrolled or severe airflow obstruction causing frequent nocturnal arousals, dyspnea, orthopnea, overuse of inhaled sympathomimetics and heightened anxiety leads to insomnia? Or is it that insomnia – possibly in a cluster with other affective disorders such as depression, anxiety disorders, or PTSD – elicits more frequent or more severe symptoms of shortness of breath in those with smoking-induced airway and parenchymal lung disease, making the latter diagnosis more overt than in others?
“My bet is on a bidirectional causal relationship,” said Dr. Ioachimescu, an editorial board advisor of CHEST Physician.
“Regardless of the etiology [of insomnia in veterans with COPD],” Dr. Luyster said, “it’s important that [insomnia] be addressed and treated appropriately, whether that be through pharmacological treatment, or probably more ideally through [cognitive behavioral therapy] for insomnia.”
The study did not control for COPD severity, she said, because of the difficulty of extracting this data from the VA Corporate Data Warehouse. The study was funded by the VA Competitive Career Development Fund.Dr. Luyster reported that she had no disclosures. Dr. Ioachimescu also said he had no relevant disclosures.
FROM SLEEP 2020