User login
Cigarette smoking at lowest level ever
“This new all-time low in cigarette smoking among U.S. adults is a tremendous public health accomplishment, and it demonstrates the importance of continued proven strategies to reduce smoking,” CDC Director Robert Redfield said in a written statement.
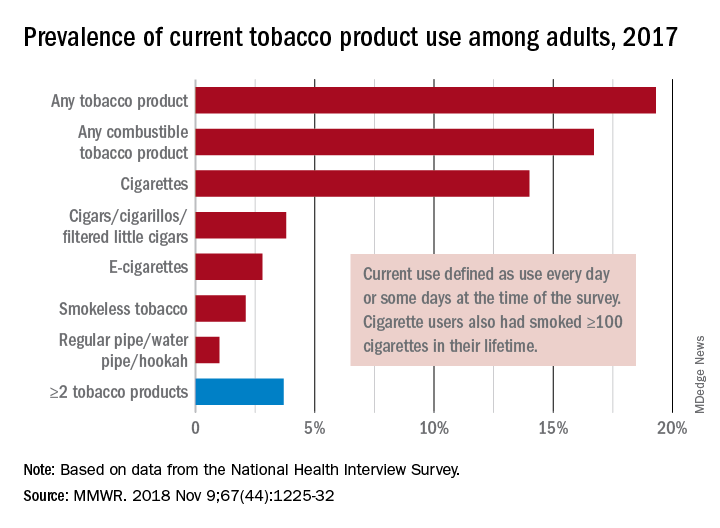
In 2017, 19.3% of adults aged 18 years and older – approximately 47.4 million Americans – reported current use of some type of tobacco product, and current use of combustible tobacco was 16.7%, Teresa W. Wang, PhD, of the CDC’s National Center for Chronic Disease Prevention and Health Promotion, Atlanta, and her associates reported in the Morbidity and Mortality Weekly Report. Current use was defined as use every day or some days, with an added requirement of at least 100 cigarettes in a lifetime added for cigarette smokers.
Data from the National Health Interview Survey showed that from 2016 to 2017, current use declined for any tobacco product, any combustible tobacco product, cigarettes, smokeless tobacco, and the combination of two or more tobacco products. The most common combination in 2017 was cigarettes and e-cigarettes, which was reported by 30.1% of the 9 million adults who used more than one product, Dr. Wang and her associates said.
Prevalence of current tobacco use was higher among men than women (24.8% vs. 14.2%), and adults aged 25-44 years (22.5%) had the highest level by age, followed by those aged 45-64 years (21.3%), 18-24 years (18.3%), and 65 years or older (11%). Use by race/ethnicity was highest among American Indian/Alaska Natives (29.8%), with the Midwest putting up the highest prevalence by region at 23.5%, they said.
“Although cigarette smoking among U.S. adults has declined considerably, tobacco products have evolved in recent years to include various combustible, noncombustible, and electronic products,” Dr. Wang and her associates wrote. “Implementation of evidence-based tobacco control interventions that address the diversity of tobacco products used by U.S. adults, in coordination with regulation of tobacco product manufacturing, marketing, and sales, can reduce tobacco-related disease and death in the United States.”
SOURCE: Wang TW et al. MMWR. 2018 Nov 9;67[44]:1225-32.
“This new all-time low in cigarette smoking among U.S. adults is a tremendous public health accomplishment, and it demonstrates the importance of continued proven strategies to reduce smoking,” CDC Director Robert Redfield said in a written statement.
In 2017, 19.3% of adults aged 18 years and older – approximately 47.4 million Americans – reported current use of some type of tobacco product, and current use of combustible tobacco was 16.7%, Teresa W. Wang, PhD, of the CDC’s National Center for Chronic Disease Prevention and Health Promotion, Atlanta, and her associates reported in the Morbidity and Mortality Weekly Report. Current use was defined as use every day or some days, with an added requirement of at least 100 cigarettes in a lifetime added for cigarette smokers.
Data from the National Health Interview Survey showed that from 2016 to 2017, current use declined for any tobacco product, any combustible tobacco product, cigarettes, smokeless tobacco, and the combination of two or more tobacco products. The most common combination in 2017 was cigarettes and e-cigarettes, which was reported by 30.1% of the 9 million adults who used more than one product, Dr. Wang and her associates said.
Prevalence of current tobacco use was higher among men than women (24.8% vs. 14.2%), and adults aged 25-44 years (22.5%) had the highest level by age, followed by those aged 45-64 years (21.3%), 18-24 years (18.3%), and 65 years or older (11%). Use by race/ethnicity was highest among American Indian/Alaska Natives (29.8%), with the Midwest putting up the highest prevalence by region at 23.5%, they said.
“Although cigarette smoking among U.S. adults has declined considerably, tobacco products have evolved in recent years to include various combustible, noncombustible, and electronic products,” Dr. Wang and her associates wrote. “Implementation of evidence-based tobacco control interventions that address the diversity of tobacco products used by U.S. adults, in coordination with regulation of tobacco product manufacturing, marketing, and sales, can reduce tobacco-related disease and death in the United States.”
SOURCE: Wang TW et al. MMWR. 2018 Nov 9;67[44]:1225-32.
FROM MMWR
Many teens don’t know e-cigarettes contain nicotine
ORLANDO – Flavoring and lack of Food and Drug Administration regulation of e-cigarettes has led to more children and adolescents using these devices, according to American Academy of Pediatrics President Colleen A. Kraft, MD.
In an interview, Dr. Kraft said the FDA should regulate these products and limit their purchase to adults who are at least 21 years old. E-cigarettes were initially intended as an aid for adults to reduce their cigarette use, but the addition of flavoring has attracted children and adolescents to the devices, Dr. Kraft noted.
“When you have these devices that have flavors like gummy bear and cotton candy and bubblegum, you are marketing to children, and we are calling out the FDA because they could actually stop this today,” she said. In fact, Dr. Kraft added, many children and adolescents don’t even realize that e-cigarettes contain nicotine.
Dr. Kraft reported no relevant conflicts of interest.
REPORTING FROM AAP 2018

Pneumonia, COPD most common emergency care–sensitive conditions
SAN DIEGO – Emergency care–sensitive conditions – those for which timely access to high-quality emergency care impact morbidity and mortality—account for 14% of all ED visits, results from a large analysis of national data showed.

In previously published work, an eight-member expert panel identified 51 condition groups as emergency care–sensitive conditions (ECSCs), including asthma, cardiac arrest, cerebral infarction, and pneumonia. The purpose of the current study, published in Annals of Emergency Medicine and presented by Anita Vashi, MD, MPH, at the annual meeting of the American College of Emergency Physicians, was to provide the first national estimates of acute care utilization and the demographic characteristics of adults experiencing ECSCs, compare ECSC and non-ECSC ED visits, and assess patient- and hospital-level characteristics predictive of an ECSC-related ED visit.
Using the Nationwide Emergency Department Sample data set, Dr. Vashi, a physician investigator at the Center for Innovation to Implementation at the VA Palo Alto Health Care System, and her colleagues retrospectively evaluated all ED visits for patients aged 18 years and older from 2009 to 2014. The researchers used summary statistics to compare population characteristics across groups and multivariable logistic regression models to assess the odds of an ECSC-related ED visit with patient- and hospital-level characteristics.
Of the 622,725,542 estimated ED visits evaluated during the study period, 86,577,041 (14%) were ECSCs. Among these ECSC visits, 58% of patients were admitted for an average length of 3.2 days and an average charge of $2,240. The most frequent ECSC-related visits were for pneumonia (9%), chronic obstructive pulmonary disease (9%), asthma (7%), heart failure (7%), and sepsis (5%), but varied by age group.
Dr. Vashi and her colleagues found that ECSCs were more common among older adults, males, those who reside in low-income areas, those who reside in the South, and among metropolitan-based hospitals and nontrauma center hospitals. ECSCs also accounted for about 45% of all inpatient admissions.
Multivariate logistic regression analysis revealed that the odds of having an ECSC-related visit was highest among patients aged 65 years and older (odds ratio, 3.84), those on Medicare (OR, 1.37), those who resided in rural counties (OR, 1.21), and those who reside in the Western portion of the United States (OR, 1.11). Significant hospital-related factors related to ECSC visits included trauma centers (OR, 1.09), nonteaching hospitals (OR, 1.04), and EDs located in the wealthiest counties (OR, 1.02).
The researchers also found that 40% of patients who made ECSC-related ED visits were treated and discharged back to the community. “There is evidence of regional variability, suggesting the need for future research,” said Dr. Vashi, who also holds a faculty position in the department of emergency medicine at Stanford (Calif.) University. “We found no consistent relationship between insurance, income, and ED use for ECSC-related conditions. This suggests that ECSCs are not significantly influenced by socioeconomic factor and can serve as a reliable marker for acuity.”
The next steps in this research area, she added, are to create condition-specific measures related to morbidity, mortality, and posthospital events, as well as to analyze regional and hospital variations including correlation across conditions, and to compare performance across conditions and hospitals.
Dr. Vashi reported having no financial disclosures.
Source: Vashi A et al. Ann Emerg Med. 2018 Oct;72;4:S38. doi. 10.1016/j.annemergmed.2018.08.091.
SAN DIEGO – Emergency care–sensitive conditions – those for which timely access to high-quality emergency care impact morbidity and mortality—account for 14% of all ED visits, results from a large analysis of national data showed.
In previously published work, an eight-member expert panel identified 51 condition groups as emergency care–sensitive conditions (ECSCs), including asthma, cardiac arrest, cerebral infarction, and pneumonia. The purpose of the current study, published in Annals of Emergency Medicine and presented by Anita Vashi, MD, MPH, at the annual meeting of the American College of Emergency Physicians, was to provide the first national estimates of acute care utilization and the demographic characteristics of adults experiencing ECSCs, compare ECSC and non-ECSC ED visits, and assess patient- and hospital-level characteristics predictive of an ECSC-related ED visit.
Using the Nationwide Emergency Department Sample data set, Dr. Vashi, a physician investigator at the Center for Innovation to Implementation at the VA Palo Alto Health Care System, and her colleagues retrospectively evaluated all ED visits for patients aged 18 years and older from 2009 to 2014. The researchers used summary statistics to compare population characteristics across groups and multivariable logistic regression models to assess the odds of an ECSC-related ED visit with patient- and hospital-level characteristics.
Of the 622,725,542 estimated ED visits evaluated during the study period, 86,577,041 (14%) were ECSCs. Among these ECSC visits, 58% of patients were admitted for an average length of 3.2 days and an average charge of $2,240. The most frequent ECSC-related visits were for pneumonia (9%), chronic obstructive pulmonary disease (9%), asthma (7%), heart failure (7%), and sepsis (5%), but varied by age group.
Dr. Vashi and her colleagues found that ECSCs were more common among older adults, males, those who reside in low-income areas, those who reside in the South, and among metropolitan-based hospitals and nontrauma center hospitals. ECSCs also accounted for about 45% of all inpatient admissions.
Multivariate logistic regression analysis revealed that the odds of having an ECSC-related visit was highest among patients aged 65 years and older (odds ratio, 3.84), those on Medicare (OR, 1.37), those who resided in rural counties (OR, 1.21), and those who reside in the Western portion of the United States (OR, 1.11). Significant hospital-related factors related to ECSC visits included trauma centers (OR, 1.09), nonteaching hospitals (OR, 1.04), and EDs located in the wealthiest counties (OR, 1.02).
The researchers also found that 40% of patients who made ECSC-related ED visits were treated and discharged back to the community. “There is evidence of regional variability, suggesting the need for future research,” said Dr. Vashi, who also holds a faculty position in the department of emergency medicine at Stanford (Calif.) University. “We found no consistent relationship between insurance, income, and ED use for ECSC-related conditions. This suggests that ECSCs are not significantly influenced by socioeconomic factor and can serve as a reliable marker for acuity.”
The next steps in this research area, she added, are to create condition-specific measures related to morbidity, mortality, and posthospital events, as well as to analyze regional and hospital variations including correlation across conditions, and to compare performance across conditions and hospitals.
Dr. Vashi reported having no financial disclosures.
Source: Vashi A et al. Ann Emerg Med. 2018 Oct;72;4:S38. doi. 10.1016/j.annemergmed.2018.08.091.
REPORTING FROM ACEP18
Key clinical point: Emergency care–sensitive conditions (ECSCs) make up a significant proportion of ED visits.
Major finding: The most common ECSC-related visits were for pneumonia (9%), chronic obstructive pulmonary disease (9%), and asthma (7%).
Study details: A retrospective cohort study of more than 86.5 million ECSC-related ED visits.
Disclosures: Dr. Vashi reported having no financial disclosures.
Source: Vashi A et al. Ann Emerg Med. 2018 Oct;72;4:S38. doi. 10.1016/j.annemergmed.2018.08.091.
Playing harmonica improves COPD
SAN ANTONIO – Playing while also boosting their quality of life, suggest the findings from a small pilot study.

Three months of playing the harmonica about a half hour a day most days of the week led to several improved pulmonary outcome measures in participants, Mary Hart, RRT, MS, of Baylor Scott & White Health in Dallas, reported at the annual meeting of the American College of Chest Physicians.
Ms. Hart played a bit of harmonica during her presentation to demonstrate how playing can help with breathing.
“The harder I push with my diaphragm, the louder I was blowing,” she told attendees. “There’s actually a different amount of effort that you have to use to create sounds with using the harmonica notes.”
Hart said her team found a news article from 1999 about the benefits of playing harmonica, and they became interested in exploring whether it might be a helpful adjunct to respiratory therapy.
Though some previous research has explored potential benefits of harmonica playing in patients with lung disease, one study was too short to demonstrate significant improvement and the other looked at multiple different pulmonary conditions, Ms. Hart said.
The cohort study began with 14 former smokers, average age 72 years, who had completed pulmonary rehabilitation at least 6 months prior to joining the “Harmaniacs,” as the group eventually called themselves.
All participants received a harmonica, an instruction booklet with audio and video supplements, and sheet music for a harmonica in the key of C.
They attended a 2-hour group session once a week with a respiratory therapist and music therapist. The classes focused initially on breathing and relaxation techniques, pacing, and basic harmonica instruction, but the amount of actual playing time increased as the 12-week course went on. Participants were expected to practice their playing for at least a half hour 5 days a week at home.
The group began with the songs “Taps” and “Happy Birthday” because these songs were easy to play. Then they added a song each week, such as “America the Beautiful” and “You Are My Sunshine,” then seasonal favorites such as “We Wish You a Merry Christmas” and “Silent Night,” and easy pop tunes.
The researchers measured both respiratory and quality of life outcomes. Assessments included spirometry, the Six Minute Walk Test, maximal inspiratory pressure (MIP) and maximal expiratory pressure (MEP), the COPD Assessment Test, the modified Medical Research Council Dyspnea Scale, the Patient Health Questionnaire for depression, the St. George’s Respiratory Questionnaire for quality of life, perceived exertion using the Borg scale and assessments by the respiratory therapist and music therapist.
The music therapist listened to and documented participants’ “stories about how they felt about life living with COPD,” and Ms. Hart and her colleagues conducted a respiratory assessment that included data on medication management, adherence to medication, previous hospitalizations and length of stay, perceived shortness of breath, and daily living activities.
In addition to those assessments, the researchers collected data on the length of practice sessions, Borg scores before and after playing, the percentage of time taken for participation in class, the participants’ ability to make a sound, their challenges and triumphs, their tiredness and/or soreness after playing, and the number of people who continued playing after training.
Among the 11 participants who completed the training and all evaluations, the MIP increased by an average 15.36 cmH20 (P = .0017), and their MEP increased by an average 14.36 cmH20 (P = .0061).
Participants increased their distance in the Six Minute Walk Test by an average 60.55 meters (P = .0280), and Ms. Hart reported an improvement in quality of life scores.
In addition to home practice, participants were expected to keep a daily log of how it felt to play and what their biggest challenges and rewards were. The comments they wrote revealed benefits that sometimes surprised even the researchers:
“I can do laundry now.”
“I am more confident.”
“It is relaxing.”
“I want to keep playing forever.”
“It helps me cough up phlegm.”
“I lose track of time and enjoy my playing.”
“I played Happy Birthday at a party for my friend.”
Others express their difficulties as well, such as one person who wrote of being “really frustrated” and another who claimed to “have a hard time playing just one note.”
But the players learned to play as a group as well, even ordering T-shirts for themselves to give concerts. The group now has about 30 songs in its repertoire, Ms. Hart said, and they recently gave a 2-hour concert during which they played all 30 songs twice.
One consistent theme that emerged, Ms. Hart said, was improved control of breathing since playing the harmonica required participants to purse their lips (similar to the way needed for expiratory maneuvers), breathe from their diaphragms, and pace themselves. Playing exercised “the muscles that help pull air in and push air out of the lungs,” Ms. Hart said, and strengthened participants’ abdominal muscles, allowing more effective coughing.
Playing harmonica also increased self-confidence. It provided stress relief for some, and others simply found it fun or enjoyed the socializing opportunities.
The study’s small size and lack of a control group limit the generalizability of its findings.
Baylor Scott & White Central Texas Foundation funded the research. Ms. Hart reported no conflicts of interest.
SOURCE: Hart M et al. CHEST 2018. doi: 10.1016/j.chest.2018.08.669.
SAN ANTONIO – Playing while also boosting their quality of life, suggest the findings from a small pilot study.
Three months of playing the harmonica about a half hour a day most days of the week led to several improved pulmonary outcome measures in participants, Mary Hart, RRT, MS, of Baylor Scott & White Health in Dallas, reported at the annual meeting of the American College of Chest Physicians.
Ms. Hart played a bit of harmonica during her presentation to demonstrate how playing can help with breathing.
“The harder I push with my diaphragm, the louder I was blowing,” she told attendees. “There’s actually a different amount of effort that you have to use to create sounds with using the harmonica notes.”
Hart said her team found a news article from 1999 about the benefits of playing harmonica, and they became interested in exploring whether it might be a helpful adjunct to respiratory therapy.
Though some previous research has explored potential benefits of harmonica playing in patients with lung disease, one study was too short to demonstrate significant improvement and the other looked at multiple different pulmonary conditions, Ms. Hart said.
The cohort study began with 14 former smokers, average age 72 years, who had completed pulmonary rehabilitation at least 6 months prior to joining the “Harmaniacs,” as the group eventually called themselves.
All participants received a harmonica, an instruction booklet with audio and video supplements, and sheet music for a harmonica in the key of C.
They attended a 2-hour group session once a week with a respiratory therapist and music therapist. The classes focused initially on breathing and relaxation techniques, pacing, and basic harmonica instruction, but the amount of actual playing time increased as the 12-week course went on. Participants were expected to practice their playing for at least a half hour 5 days a week at home.
The group began with the songs “Taps” and “Happy Birthday” because these songs were easy to play. Then they added a song each week, such as “America the Beautiful” and “You Are My Sunshine,” then seasonal favorites such as “We Wish You a Merry Christmas” and “Silent Night,” and easy pop tunes.
The researchers measured both respiratory and quality of life outcomes. Assessments included spirometry, the Six Minute Walk Test, maximal inspiratory pressure (MIP) and maximal expiratory pressure (MEP), the COPD Assessment Test, the modified Medical Research Council Dyspnea Scale, the Patient Health Questionnaire for depression, the St. George’s Respiratory Questionnaire for quality of life, perceived exertion using the Borg scale and assessments by the respiratory therapist and music therapist.
The music therapist listened to and documented participants’ “stories about how they felt about life living with COPD,” and Ms. Hart and her colleagues conducted a respiratory assessment that included data on medication management, adherence to medication, previous hospitalizations and length of stay, perceived shortness of breath, and daily living activities.
In addition to those assessments, the researchers collected data on the length of practice sessions, Borg scores before and after playing, the percentage of time taken for participation in class, the participants’ ability to make a sound, their challenges and triumphs, their tiredness and/or soreness after playing, and the number of people who continued playing after training.
Among the 11 participants who completed the training and all evaluations, the MIP increased by an average 15.36 cmH20 (P = .0017), and their MEP increased by an average 14.36 cmH20 (P = .0061).
Participants increased their distance in the Six Minute Walk Test by an average 60.55 meters (P = .0280), and Ms. Hart reported an improvement in quality of life scores.
In addition to home practice, participants were expected to keep a daily log of how it felt to play and what their biggest challenges and rewards were. The comments they wrote revealed benefits that sometimes surprised even the researchers:
“I can do laundry now.”
“I am more confident.”
“It is relaxing.”
“I want to keep playing forever.”
“It helps me cough up phlegm.”
“I lose track of time and enjoy my playing.”
“I played Happy Birthday at a party for my friend.”
Others express their difficulties as well, such as one person who wrote of being “really frustrated” and another who claimed to “have a hard time playing just one note.”
But the players learned to play as a group as well, even ordering T-shirts for themselves to give concerts. The group now has about 30 songs in its repertoire, Ms. Hart said, and they recently gave a 2-hour concert during which they played all 30 songs twice.
One consistent theme that emerged, Ms. Hart said, was improved control of breathing since playing the harmonica required participants to purse their lips (similar to the way needed for expiratory maneuvers), breathe from their diaphragms, and pace themselves. Playing exercised “the muscles that help pull air in and push air out of the lungs,” Ms. Hart said, and strengthened participants’ abdominal muscles, allowing more effective coughing.
Playing harmonica also increased self-confidence. It provided stress relief for some, and others simply found it fun or enjoyed the socializing opportunities.
The study’s small size and lack of a control group limit the generalizability of its findings.
Baylor Scott & White Central Texas Foundation funded the research. Ms. Hart reported no conflicts of interest.
SOURCE: Hart M et al. CHEST 2018. doi: 10.1016/j.chest.2018.08.669.
REPORTING FROM CHEST 2018
Key clinical point: Playing harmonica improved pulmonary and quality of life outcomes in patients with COPD.
Major finding: Maximal inspiratory pressure increased by an average 15.36 cmH20, maximal expiratory pressure increased by an average 14.36 cmH20, and Six Minute Walk Test distance increased by an average 60.55 meters.
Data source: Cohort study completed by 11 participants with COPD, at least 45 years old, who completed a 12-week harmonica training course.
Disclosures: Baylor Scott & White Central Texas Foundation funded the research. Ms. Hart reported no conflicts of interest.
Source: Hart M et al. CHEST 2018. 10.1016/j.chest.2018.08.669.
Reducing COPD Readmission Rates: Using a COPD Care Service During Care Transitions
A chronic obstructive pulmonary disease care service improves timely access to follow-up care and patient education at the time of transition from hospital to home.
Chronic obstructive pulmonary disease (COPD) is the third leading cause of death worldwide and has an associated treatment cost of $9,800 per patient per year in the US.1-3 Within 5 years of hospital discharge for a COPD exacerbation, the rehospitalization risk is 44%, and the mortality rate is 55%.4 COPD affects more than 11 million Americans, and the disease prevalence among US veterans is 3-fold higher.5,6
Patients hospitalized for COPD have a 30-day readmission rate of 22.6%.7 Given the high patient burden, COPD was added to the Medicare Hospital Readmission Reductions Program in 2015, resulting in financial penalties for COPD readmissions within 30 days of hospital discharge.8 Ensuring timely access to follow-up care has been shown to significantly reduce risk for hospital readmissions.9 However, in a national review of Medicare claims, only 50% of patients readmitted to the hospital had a primary care provider (PCP) follow-up visit within 30 days of their hospital discharge.10 Despite the need to provide prompt patient follow-up during the transition from hospital to home, gaps within the health care system create barriers to providing timely postdischarge care.10-12 These gaps include breakdowns in practitioner and patient communication, lengthy time to follow-up, and incomplete medication reconciliation.13 To address this unmet need, clinics and hospitals require solutions that can be implemented quickly, using the resources of their current clinical models.
Pharmacists and registered nurses (RNs) within the US federal health care system are well positioned for involvement in the postdischarge care of high-risk patients with COPD. Ambulatory care practitioners within the US Department of Veterans Affairs (VA) health care system are integrated into patient aligned care teams (PACT). Each team consists of a PCP, pharmacist, RN, social worker, dietitian, licensed practical nurse, and medical scheduling support assistant.14 Each PACT team works together to provide patient education, chronic disease management, and medication optimization, and each team member contributes their unique training and expertise.
Interprofessional care is considered an integral method to improve health outcomes through effective teamwork and communication.15 Although interprofessional interventions are cited extensively in the literature highlighting medicine and nursing, a gap exists in the exploration of pharmacist contributions within interprofessional teams.16 The incorporation of clinical pharmacists in the literature is especially limited when considering transitions of care and the patient medical home.17 Given the critical and collaborative role pharmacists play within the PACT medical home, the COPD CARE (Chronic Obstructive Pulmonary Disease Coordinated Access to Reduce Exacerbations) service provides an opportunity to leverage pharmacists as prescribers with a scope of practice who coordinate transitions of care for patients with COPD.18 The service was designed to be collaborative within the PACT model and with the intent of reducing 30-day readmissions to the hospital or emergency department (ED) due to a COPD exacerbation.
This evaluation involved the identifying patients recently hospitalized for COPD; clinic follow-up, coordinated by a clinical pharmacist and nurse, within 30 days of hospital or ED discharge; the use of a COPD action plan; and timely triage of patients at high risk for COPD reexacerbation or with comorbid symptoms to PCPs. The COPD CARE service, leveraged the patient-centered medical home (PCMH) model for transitions of care after COPD exacerbations. The PCMH is a primary care model focused on the following functions: (1) comprehensive care; (2) patient-centered care; (3) coordinated care; (4) accessible service; and (5) quality and safety.19 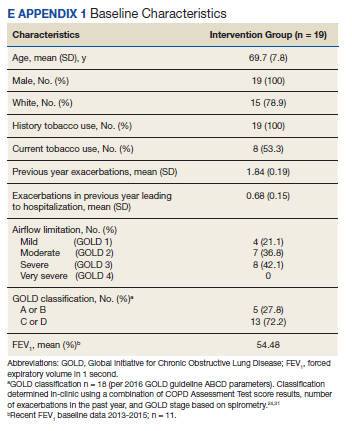
Methods
The COPD CARE service was implemented on October 1, 2015, and evaluated through March 1, 2016 (Figure 1). All veterans receiving primary care through the pilot clinic site with a hospital admission or ED visit for COPD exacerbation were offered this intervention. 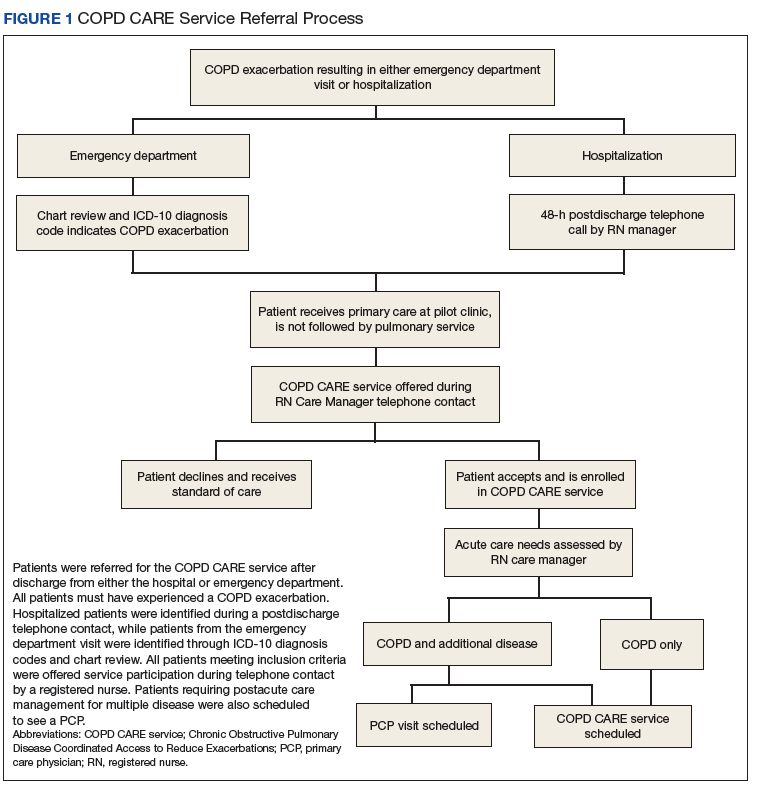
Patient Eligibility and Recruitment
Patients were excluded from the service if COPD or COPD-related diagnoses were not listed in their electronic health record (EHR) problem list. Patients who had previously received components of the intervention through consultation with specialty services were excluded. If a patient declined the service, they received the standard of care. This project was undertaken for programmatic evaluation and qualified for quality improvement (QI) exemption; as such an internal review board approval was not required.
Intervention
Participants enrolled in the COPD CARE service were scheduled for an interprofessional postdischarge follow-up visit with a pharmacist and nurse at the pilot outpatient clinic site, and this visit was termed the COPD CARE health visit. Participants ideally were seen within 30 days of discharge. The goal was to improve access to care while preventing a 30-day readmission. Within this 30-day window, the target follow-up period was 2 to 3 weeks postdischarge for the face-to-face visit. Patients who required postdischarge care for additional medical conditions received a clinic appointment with their PCP on the same day as their COPD CARE health visit. The COPD CARE health visit focused on 3 objectives: (1) COPD disease management and referrals; (2) COPD plan development; and (3) inhaler technique review and teaching.20,21
COPD Monitoring
During the 45-minute COPD CARE health visit, the pharmacist provided extensive disease management based on the GOLD guideline recommendation.22 In addition, the pharmacist administered the COPD Assessment Test (CAT) and reviewed patient COPD exacerbation history to guide prescribing.22 The patient and pharmacist also reviewed previous spirometry results if obtained within the past 2 years. COPD triggers and symptoms were assessed along with opportunities for therapeutic and lifestyle modifications.
Plan Development
Patients in the COPD CARE service also were given a COPD plan to improve health outcomes. (Figure 2). The plan included patient instructions to initiate steroid and antibiotic therapy if the patient experienced symptoms of increased cough, mucus production, and purulence, thereby reaching the high-yellow zone. 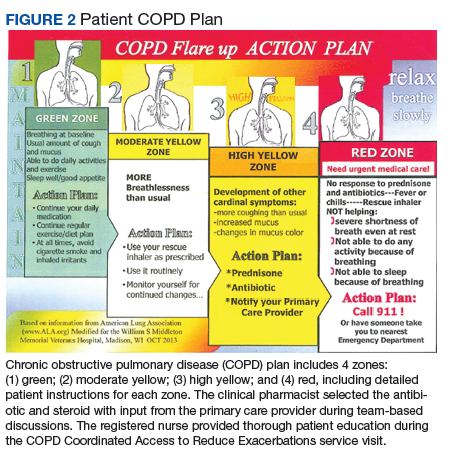
Patient Referrals
Patient referrals also were a critical component of the COPD CARE service. Pharmacists placed referrals for tobacco treatment services, pulmonary rehabilitation, a COPD group education class, and referral to specialty care if needed.
Inhaler Technique Review
Either the pharmacist or RN review the inhaler technique, and corrections and teachback methods used to ensure patient understanding.23 Patients were encouraged to bring home inhalers into clinic for technique assessment. Demonstration inhalers also were available and used by pharmacists and nurses for inhaler teaching as needed. The pharmacist indicated through chart documentation whether the patient’s inhaler technique was correct or whether modifications were made to improve medication delivery. Medication reconciliation also was performed for inhaled devices to insure patients were using medications as prescribed.
Outcomes
The primary outcome of this evaluation was an assessment of interventions made by the interprofessional care team during the COPD CARE health visit. Secondary outcomes included assessment of 30-day readmission rates as well as patient access to the primary care team using this interprofessional care model.
Data were collected after study completion through review of the EHR at baseline and at the end of the evaluation period. Baseline demographic information was collected through a retrospective chart review. Readmission rates were calculated as a composite of ED visits and rehospitalization within 30 days of discharge due to a COPD exacerbation.
Patients’ spirometry results were used in composite with clinical symptoms and risk of exacerbations to calculate GOLD staging.24
Results
A total of 19 patients admitted to the hospital or ED received follow-up through the COPD CARE service. Patients included in this analysis were primarily older adult white males.
Referrals were placed for 53% of patients in the COPD CARE service, with 21% of patients accepting referral to tobacco treatment clinic, and 32% of patients accepting referral to pulmonary rehabilitation. COPD plans were issued to all of patients in this service. Pharmacists modified therapy 58% of the time, with a review of medications prescribed by the clinical pharmacist (eApendixes 1 and 2, available at mdedge.com/fedprac).
Patients had a 0% composite readmission rate to the ED or hospital for a COPD exacerbation within 30-days of discharge. Access to care, defined as a visit with the primary care PACT team within 30 days of discharge, was achieved in 14 of the 19 patients (73.7%). Additionally, 12 of 19 patients (63.2%) in the COPD CARE service no longer needed to see their PCP following discharge, saving their provider a visit.
The pharmacist corrected patient inhaler technique in 52.6% of the patients participating in the service.
Discussion
The intent of this QI initiative was to assess a novel clinic intervention for a high-risk patient population during COPD care transitions. The strengths of this intervention involved a rapid cycle implementation using the existing medical home model and its multiprong approach to coordinating care. This approach involved coordinating self-direction COPD plans, timely hospital follow-up, and the innovative use of the interprofessional primary care team.
The COPD CARE service improved patient access to follow-up with no COPD readmissions in the intervention group. The COPD CARE service also validated the use of a coordinated medical home consisting of clinical pharmacists and nurses who provided the initial COPD disease monitoring and plan development. This intervention also resulted in patients receiving greater access to their PACT teams within 30 days of discharge and a higher rate of referrals to tobacco cessation clinics within the COPD CARE group. In addition, use of tools that enabled patients to self-manage their care, such as the COPD plan, was greater in the COPD CARE group.
The interventions made in-clinic likely contributed to service results (eAppendix 3). 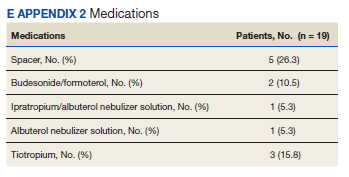
In addition, the COPD CARE service provided necessary referrals to pulmonary rehabilitation, nutrition, and tobacco treatment clinics at a higher rate than those patients in the standard of care group. The high percentage of referrals placed to tobacco treatment clinic and pulmonary rehabilitation contributes to improvements in COPD disease control long-term.25 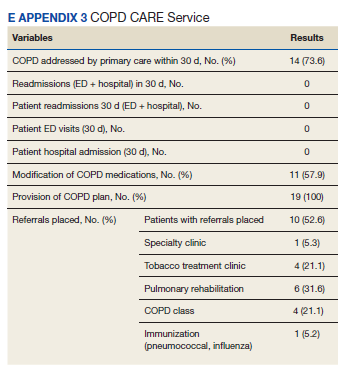
The COPD CARE service may best be described as a model for application of the interprofessional team in clinical practice, with the clinical pharmacist uniquely positioned for chronic disease management in the postacute care setting.26 Previously, literature has documented pharmacists as integral members of the team during patient care transitions. Pharmacist completion of medication reconciliation compared with usual care has shown a 28% relative risk (RR) reduction in ED visits and a 67% RR reduction in adverse drug event-related hospital revisits.27 Findings of the COPD CARE service are consistent with the literature and advance the role of pharmacists within the medical home model as prescribers for disease management.27
The interprofessional, team-based design of the COPD CARE service also is supported by recent recommendations from the COPD Foundation, as detailed in the 2nd National COPD Readmission Summit.28 Use of a proactive, team-based care model is emphasized as a central element to coordinating care transitions, with an expectation of 360 degree accountability by all team members for the patients care both during and after hospitalization. The clearly defined roles of each team member within the COPD CARE service, coupled with the expectation that each team member practices with autonomy and accountability, exemplifies the COPD Foundation vision for enhancing COPD care. In addition, the COPD CARE service uses many of the best practices detailed by the COPD Foundation, including the use of spirometry, referrals to pulmonary rehabilitation, and use of motivational interviewing for tobacco treatment clinic referral.
Limitations
This QI initiative has several limitations. By virtue of the study being designed as a practice improvement intervention with rapid implementation, the existing clinic referral structures were used to offer the service to eligible patients. This standard of care included routine telephone contact by a nurse case manager following hospital discharge. Although all patients in the COPD CARE service received the intervention, 5 patients were not seen within the 30-day window, resulting in an implementation rate of 73%. Of the 5 patients that were not seen, 4 were discharged from the ED. Timely follow-up in primary care clinic from the ED required the use of a time-intensive chart review for referral and subsequent delay in intervention delivery.A streamlined clinic referral process from the ED likely would further improve patient scheduling and result in a greater number of patients who would receive the intervention within 30 days of discharge. Despite this limitation, the COPD CARE service was able to see a large percentage of patients within the 30-day time frame postdischarge.
Future Directions
Although a major objective of this service was to reduce readmissions 30 days postdischarge, it is possible interventions made in clinic may have long-term beneficial effects.25,29 Future research should evaluate the impact of this interprofessional service on long-term disease outcomes, thereby determining whether the promising readmission results are sustained beyond 30 days postdischarge.30 In addition, incorporation of respiratory therapy and inpatient pharmacists during hospital discharge could provide a more effective and sustainable transition from hospital to home before the COPD CARE clinic visit.
Future implementations and evaluations of this COPD CARE service will in turn benefit from a key component of our intervention, which includes the collection of timely CAT scores, spirometry data, and adherence rates for COPD patients.31 Furthermore, the intervention was successfully delivered to a population recently hospitalized or seen in the ED, and therefore, at high risk for future COPD exacerbations. This initiative provides positive proof of a concept QI project using the existing PACT team model to reduce 30-day readmission rates in patients with COPD at high risk for exacerbation. Future efforts will focus on delivering this intervention to patients with mild, moderate, and severe COPD within a wide range of primary clinics.
Conslusion
The COPD CARE service involved the coordinated postdischarge care facilitated by an interprofessional team of clinical pharmacists, nurses and PCPs. The COPD CARE service leveraged an interprofessional team, centered on the PACT medical home, to make clinic interventions resulting in a 0% readmission rate and 63.2% increase in PCP access. The COPD CARE service further demonstrated the impact of coordinated efforts by interprofessional teams to optimize care for COPD management.
Acknowledgments
The authors thank Stephanie Gruber, PharmD; Lieneke Hafeman, RN; Molly Obermark, PharmD; Julia Peek, RT; Mark Regan, MD; Chris Roelke, RN; Steve Shoyer, PharmD; John Thielemann, RN; Sandy Tompkins, BS; and Wendi Wenger, RN, for their integral roles in the COPD CARE service.
1. World Health Organization. The top 10 causes of death. http://www.who.int/mediacentre/factsheets/fs310/en. Updated May 24, 2018. Accessed May 30, 2018.
2. Ford ES, Murphy LB, Khavjou O, Giles WH, Holt JB, Croft JB. Total and state-specific medical and absenteeism costs of COPD among adults aged > 18 years in the United States for 2010 and projections through 2020. Chest. 2015;147(1):31-45.
3. American Lung Association. Trends in COPD (chronic bronchitis and emphysema): morbidity and mortality. http://www.lung.org/assets/documents/research/copd-trend-report.pdf. Published March 2013. Accessed May 30, 2018.
4. McGhan R, Radcliff T, Fish R, Sutherland ER, Welsh C, Make B. Predictors of rehospitalization and death after a severe exacerbation of COPD. Chest. 2007;132(6):1748-1755.
5. COPD Foundation. Patient groups back bill supporting US veterans with COPD. https://www.copdfoundation.org/About-Us/Press-Room/Press-Releases/Article/722/Patient-Groups-Back-Bill-Supporting-US-Veterans-with-COPD.aspx. Published November 9, 2010. Accessed May 30, 2018.
6. American Lung Association. Lung health and disease: how serious is COPD. http://www.lung.org/lung-health-and-diseases/lung-disease-lookup/copd/learn-about-copd/how-serious-is-copd.html. Published 2016. Accessed May 30, 2018.
7. Shah T, Press V, Huisingh-Scheetz M, White SR. COPD readmissions: addressing COPD in the era of value-based health care. Chest. 2016;150(4):916-926.
8. Mcllvennan CK, Eapen ZJ, Allen LA. Hospital readmissions reduction program. Circulation. 2015;13(20):1796-1803.
9. Jackson C, Shahsahebi M, Wedlake T, DuBard CA. Timeliness of outpatient follow-up: an evidence-based approach for planning after hospital discharge. Ann Fam Med. 2015;13(2):115-122.
10. Jencks SF, Williams MV, Coleman EA. Rehospitalizations among patients in the Medicare fee-for-service program. N Engl J Med. 2009;360(14):1418-1428.
11. Hitch B, Parlier AB, Reed L, Galvin SL, Fagan EB, Wilson CG. Evaluation of a team-based, transition-of-care management service on 30-day readmission rates. N C Med J. 2016;77(2):87-92.
12. Stone J, Hoffman G. Medicare hospital readmissions: issues, policy options. In: Turner PM ed. Medicare: Background, Benefits and Issues. Nova Science Pub Inc; 2011:123-150.
13. Kripalani S, Jackson AT, Schnipper JL, Coleman EA. Promoting effective transitions of care at hospital discharge: a review of key issues for hospitalists. J Hosp Med. 2007;2(5):314-323.
14. Rosland A-M, Nelson K, Sun H, et al. The patient-centered medical home in the Veterans Health Administration. Am J Manag Care. 2013;19(7):e263-e272.
15. World Health Organization. Nursing and midwifery. http://www.who.int/hrh/nursing_midwifery/en. Accessed September 18, 2018.
16. Supper I, Catala O, Lustman M, Chemla C, Bourgueil Y, Letrilliart L. Interprofessional collaboration in primary health care: a review of facilitators and barriers perceived by involved actors. J Public Health (Oxf). 2015;37(4):716-727.
17. Melody KT, McCartney E, Sen S, Duenas G. Optimizing care transitions: the role of the community pharmacist. Integr Pharm Res Pract. 2016;5:43-51.
18. Ourth H, Groppi J, Morreale AP, Quicci-Roberts K. Clinical pharmacist prescribing activities in the Veterans Health Administration. Am J Health Syst Pharm. 2016;73(18):1406-1415.
19. US Department of Health and Human Services. Agency for Healthcare Research and Quality. Defining the PCMH. https://pcmh.ahrq.gov/page/defining-pcmh. Accessed May 29, 2018.
20. Kaplan A. The COPD action plan. Can Fam Physician. 2009;55(1):58-59.
21. Turnock AC, Walters EH, Walters JA, Wood-Baker R. Action plans for chronic obstructive pulmonary disease. Cochrane Database Syst Rev. 2005;(4):CD005074.
22. Global Initiative for Chronic Obstructive Lung Disease. Global strategy for the diagnosis, management, and prevention of chronic obstructive pulmonary disease (2017 report). http://goldcopd.org/gold-2017-global-strategy-diagnosis-management-prevention-copd. Accessed May 29, 2018.
23. Bonini M, Usmani OS. The importance of inhaler devices in the treatment of COPD. COPD Res Pract. 2015;1:9.
24. Buist AS, Anzueto A, Calverley P, DeGuia TS, Fukuch Y. Global strategy for the diagnosis, management, and prevention of chronic obstructive pulmonary disease. 2006.
25. McCarthy B, Casey D, Devane D, Murphy K, Murphy E, Lacasse Y. Pulmonary rehabilitation for chronic obstructive pulmonary disease. Cochrane Database Syst Rev. 2015;(2):CD003793.
26. ASHP Research and Education Foundation. Pharmacy forecast 2016-2020: strategic planning advice. http://www.ashpfoundation.org/PharmacyForecast2016. Published December 2015. Accessed May 29, 2018.
27. Mekonnen AB, McLachlan AJ, Brien JE. Effectiveness of pharmacist-led medication reconciliation programmes on clinical outcomes at hospital transitions: a systematic review and meta-analysis. BMJ Open. 2016;6(2):e010003.
28. Willard KS, Sullivan JB, Thomashow BM, et al. The 2nd national COPD readmissions summit and beyond: from theory to implementation. Chronic Obstr Pulm Dis. 2016;3(4):778-790.
29. Scanlon PD, Connett JE, Waller LA, et al; Lung Health Study Research Group. Smoking cessation and lung function in mild-to-moderate chronic obstructive pulmonary disease. The lung health study. Am J Respir Crit Care Med. 2000;161(2, pt 1):381-390.
30. Shah T, Press VG, Huisingh-Scheetz M, White SR. COPD readmissions: addressing COPD in the era of value-based health care. Chest. 2016;150(4):916-926.
31. GlaxoSmithKline. COPD Assessment Test (CAT). Castest Online. http://www.catestonline.org/images/UserGuides/CATHCPUser%20guideEn.pdf. Updated October 2016.
A chronic obstructive pulmonary disease care service improves timely access to follow-up care and patient education at the time of transition from hospital to home.
A chronic obstructive pulmonary disease care service improves timely access to follow-up care and patient education at the time of transition from hospital to home.
Chronic obstructive pulmonary disease (COPD) is the third leading cause of death worldwide and has an associated treatment cost of $9,800 per patient per year in the US.1-3 Within 5 years of hospital discharge for a COPD exacerbation, the rehospitalization risk is 44%, and the mortality rate is 55%.4 COPD affects more than 11 million Americans, and the disease prevalence among US veterans is 3-fold higher.5,6
Patients hospitalized for COPD have a 30-day readmission rate of 22.6%.7 Given the high patient burden, COPD was added to the Medicare Hospital Readmission Reductions Program in 2015, resulting in financial penalties for COPD readmissions within 30 days of hospital discharge.8 Ensuring timely access to follow-up care has been shown to significantly reduce risk for hospital readmissions.9 However, in a national review of Medicare claims, only 50% of patients readmitted to the hospital had a primary care provider (PCP) follow-up visit within 30 days of their hospital discharge.10 Despite the need to provide prompt patient follow-up during the transition from hospital to home, gaps within the health care system create barriers to providing timely postdischarge care.10-12 These gaps include breakdowns in practitioner and patient communication, lengthy time to follow-up, and incomplete medication reconciliation.13 To address this unmet need, clinics and hospitals require solutions that can be implemented quickly, using the resources of their current clinical models.
Pharmacists and registered nurses (RNs) within the US federal health care system are well positioned for involvement in the postdischarge care of high-risk patients with COPD. Ambulatory care practitioners within the US Department of Veterans Affairs (VA) health care system are integrated into patient aligned care teams (PACT). Each team consists of a PCP, pharmacist, RN, social worker, dietitian, licensed practical nurse, and medical scheduling support assistant.14 Each PACT team works together to provide patient education, chronic disease management, and medication optimization, and each team member contributes their unique training and expertise.
Interprofessional care is considered an integral method to improve health outcomes through effective teamwork and communication.15 Although interprofessional interventions are cited extensively in the literature highlighting medicine and nursing, a gap exists in the exploration of pharmacist contributions within interprofessional teams.16 The incorporation of clinical pharmacists in the literature is especially limited when considering transitions of care and the patient medical home.17 Given the critical and collaborative role pharmacists play within the PACT medical home, the COPD CARE (Chronic Obstructive Pulmonary Disease Coordinated Access to Reduce Exacerbations) service provides an opportunity to leverage pharmacists as prescribers with a scope of practice who coordinate transitions of care for patients with COPD.18 The service was designed to be collaborative within the PACT model and with the intent of reducing 30-day readmissions to the hospital or emergency department (ED) due to a COPD exacerbation.
This evaluation involved the identifying patients recently hospitalized for COPD; clinic follow-up, coordinated by a clinical pharmacist and nurse, within 30 days of hospital or ED discharge; the use of a COPD action plan; and timely triage of patients at high risk for COPD reexacerbation or with comorbid symptoms to PCPs. The COPD CARE service, leveraged the patient-centered medical home (PCMH) model for transitions of care after COPD exacerbations. The PCMH is a primary care model focused on the following functions: (1) comprehensive care; (2) patient-centered care; (3) coordinated care; (4) accessible service; and (5) quality and safety.19
Methods
The COPD CARE service was implemented on October 1, 2015, and evaluated through March 1, 2016 (Figure 1). All veterans receiving primary care through the pilot clinic site with a hospital admission or ED visit for COPD exacerbation were offered this intervention.
Patient Eligibility and Recruitment
Patients were excluded from the service if COPD or COPD-related diagnoses were not listed in their electronic health record (EHR) problem list. Patients who had previously received components of the intervention through consultation with specialty services were excluded. If a patient declined the service, they received the standard of care. This project was undertaken for programmatic evaluation and qualified for quality improvement (QI) exemption; as such an internal review board approval was not required.
Intervention
Participants enrolled in the COPD CARE service were scheduled for an interprofessional postdischarge follow-up visit with a pharmacist and nurse at the pilot outpatient clinic site, and this visit was termed the COPD CARE health visit. Participants ideally were seen within 30 days of discharge. The goal was to improve access to care while preventing a 30-day readmission. Within this 30-day window, the target follow-up period was 2 to 3 weeks postdischarge for the face-to-face visit. Patients who required postdischarge care for additional medical conditions received a clinic appointment with their PCP on the same day as their COPD CARE health visit. The COPD CARE health visit focused on 3 objectives: (1) COPD disease management and referrals; (2) COPD plan development; and (3) inhaler technique review and teaching.20,21
COPD Monitoring
During the 45-minute COPD CARE health visit, the pharmacist provided extensive disease management based on the GOLD guideline recommendation.22 In addition, the pharmacist administered the COPD Assessment Test (CAT) and reviewed patient COPD exacerbation history to guide prescribing.22 The patient and pharmacist also reviewed previous spirometry results if obtained within the past 2 years. COPD triggers and symptoms were assessed along with opportunities for therapeutic and lifestyle modifications.
Plan Development
Patients in the COPD CARE service also were given a COPD plan to improve health outcomes. (Figure 2). The plan included patient instructions to initiate steroid and antibiotic therapy if the patient experienced symptoms of increased cough, mucus production, and purulence, thereby reaching the high-yellow zone.
Patient Referrals
Patient referrals also were a critical component of the COPD CARE service. Pharmacists placed referrals for tobacco treatment services, pulmonary rehabilitation, a COPD group education class, and referral to specialty care if needed.
Inhaler Technique Review
Either the pharmacist or RN review the inhaler technique, and corrections and teachback methods used to ensure patient understanding.23 Patients were encouraged to bring home inhalers into clinic for technique assessment. Demonstration inhalers also were available and used by pharmacists and nurses for inhaler teaching as needed. The pharmacist indicated through chart documentation whether the patient’s inhaler technique was correct or whether modifications were made to improve medication delivery. Medication reconciliation also was performed for inhaled devices to insure patients were using medications as prescribed.
Outcomes
The primary outcome of this evaluation was an assessment of interventions made by the interprofessional care team during the COPD CARE health visit. Secondary outcomes included assessment of 30-day readmission rates as well as patient access to the primary care team using this interprofessional care model.
Data were collected after study completion through review of the EHR at baseline and at the end of the evaluation period. Baseline demographic information was collected through a retrospective chart review. Readmission rates were calculated as a composite of ED visits and rehospitalization within 30 days of discharge due to a COPD exacerbation.
Patients’ spirometry results were used in composite with clinical symptoms and risk of exacerbations to calculate GOLD staging.24
Results
A total of 19 patients admitted to the hospital or ED received follow-up through the COPD CARE service. Patients included in this analysis were primarily older adult white males.
Referrals were placed for 53% of patients in the COPD CARE service, with 21% of patients accepting referral to tobacco treatment clinic, and 32% of patients accepting referral to pulmonary rehabilitation. COPD plans were issued to all of patients in this service. Pharmacists modified therapy 58% of the time, with a review of medications prescribed by the clinical pharmacist (eApendixes 1 and 2, available at mdedge.com/fedprac).
Patients had a 0% composite readmission rate to the ED or hospital for a COPD exacerbation within 30-days of discharge. Access to care, defined as a visit with the primary care PACT team within 30 days of discharge, was achieved in 14 of the 19 patients (73.7%). Additionally, 12 of 19 patients (63.2%) in the COPD CARE service no longer needed to see their PCP following discharge, saving their provider a visit.
The pharmacist corrected patient inhaler technique in 52.6% of the patients participating in the service.
Discussion
The intent of this QI initiative was to assess a novel clinic intervention for a high-risk patient population during COPD care transitions. The strengths of this intervention involved a rapid cycle implementation using the existing medical home model and its multiprong approach to coordinating care. This approach involved coordinating self-direction COPD plans, timely hospital follow-up, and the innovative use of the interprofessional primary care team.
The COPD CARE service improved patient access to follow-up with no COPD readmissions in the intervention group. The COPD CARE service also validated the use of a coordinated medical home consisting of clinical pharmacists and nurses who provided the initial COPD disease monitoring and plan development. This intervention also resulted in patients receiving greater access to their PACT teams within 30 days of discharge and a higher rate of referrals to tobacco cessation clinics within the COPD CARE group. In addition, use of tools that enabled patients to self-manage their care, such as the COPD plan, was greater in the COPD CARE group.
The interventions made in-clinic likely contributed to service results (eAppendix 3).
In addition, the COPD CARE service provided necessary referrals to pulmonary rehabilitation, nutrition, and tobacco treatment clinics at a higher rate than those patients in the standard of care group. The high percentage of referrals placed to tobacco treatment clinic and pulmonary rehabilitation contributes to improvements in COPD disease control long-term.25
The COPD CARE service may best be described as a model for application of the interprofessional team in clinical practice, with the clinical pharmacist uniquely positioned for chronic disease management in the postacute care setting.26 Previously, literature has documented pharmacists as integral members of the team during patient care transitions. Pharmacist completion of medication reconciliation compared with usual care has shown a 28% relative risk (RR) reduction in ED visits and a 67% RR reduction in adverse drug event-related hospital revisits.27 Findings of the COPD CARE service are consistent with the literature and advance the role of pharmacists within the medical home model as prescribers for disease management.27
The interprofessional, team-based design of the COPD CARE service also is supported by recent recommendations from the COPD Foundation, as detailed in the 2nd National COPD Readmission Summit.28 Use of a proactive, team-based care model is emphasized as a central element to coordinating care transitions, with an expectation of 360 degree accountability by all team members for the patients care both during and after hospitalization. The clearly defined roles of each team member within the COPD CARE service, coupled with the expectation that each team member practices with autonomy and accountability, exemplifies the COPD Foundation vision for enhancing COPD care. In addition, the COPD CARE service uses many of the best practices detailed by the COPD Foundation, including the use of spirometry, referrals to pulmonary rehabilitation, and use of motivational interviewing for tobacco treatment clinic referral.
Limitations
This QI initiative has several limitations. By virtue of the study being designed as a practice improvement intervention with rapid implementation, the existing clinic referral structures were used to offer the service to eligible patients. This standard of care included routine telephone contact by a nurse case manager following hospital discharge. Although all patients in the COPD CARE service received the intervention, 5 patients were not seen within the 30-day window, resulting in an implementation rate of 73%. Of the 5 patients that were not seen, 4 were discharged from the ED. Timely follow-up in primary care clinic from the ED required the use of a time-intensive chart review for referral and subsequent delay in intervention delivery.A streamlined clinic referral process from the ED likely would further improve patient scheduling and result in a greater number of patients who would receive the intervention within 30 days of discharge. Despite this limitation, the COPD CARE service was able to see a large percentage of patients within the 30-day time frame postdischarge.
Future Directions
Although a major objective of this service was to reduce readmissions 30 days postdischarge, it is possible interventions made in clinic may have long-term beneficial effects.25,29 Future research should evaluate the impact of this interprofessional service on long-term disease outcomes, thereby determining whether the promising readmission results are sustained beyond 30 days postdischarge.30 In addition, incorporation of respiratory therapy and inpatient pharmacists during hospital discharge could provide a more effective and sustainable transition from hospital to home before the COPD CARE clinic visit.
Future implementations and evaluations of this COPD CARE service will in turn benefit from a key component of our intervention, which includes the collection of timely CAT scores, spirometry data, and adherence rates for COPD patients.31 Furthermore, the intervention was successfully delivered to a population recently hospitalized or seen in the ED, and therefore, at high risk for future COPD exacerbations. This initiative provides positive proof of a concept QI project using the existing PACT team model to reduce 30-day readmission rates in patients with COPD at high risk for exacerbation. Future efforts will focus on delivering this intervention to patients with mild, moderate, and severe COPD within a wide range of primary clinics.
Conslusion
The COPD CARE service involved the coordinated postdischarge care facilitated by an interprofessional team of clinical pharmacists, nurses and PCPs. The COPD CARE service leveraged an interprofessional team, centered on the PACT medical home, to make clinic interventions resulting in a 0% readmission rate and 63.2% increase in PCP access. The COPD CARE service further demonstrated the impact of coordinated efforts by interprofessional teams to optimize care for COPD management.
Acknowledgments
The authors thank Stephanie Gruber, PharmD; Lieneke Hafeman, RN; Molly Obermark, PharmD; Julia Peek, RT; Mark Regan, MD; Chris Roelke, RN; Steve Shoyer, PharmD; John Thielemann, RN; Sandy Tompkins, BS; and Wendi Wenger, RN, for their integral roles in the COPD CARE service.
1. World Health Organization. The top 10 causes of death. http://www.who.int/mediacentre/factsheets/fs310/en. Updated May 24, 2018. Accessed May 30, 2018.
2. Ford ES, Murphy LB, Khavjou O, Giles WH, Holt JB, Croft JB. Total and state-specific medical and absenteeism costs of COPD among adults aged > 18 years in the United States for 2010 and projections through 2020. Chest. 2015;147(1):31-45.
3. American Lung Association. Trends in COPD (chronic bronchitis and emphysema): morbidity and mortality. http://www.lung.org/assets/documents/research/copd-trend-report.pdf. Published March 2013. Accessed May 30, 2018.
4. McGhan R, Radcliff T, Fish R, Sutherland ER, Welsh C, Make B. Predictors of rehospitalization and death after a severe exacerbation of COPD. Chest. 2007;132(6):1748-1755.
5. COPD Foundation. Patient groups back bill supporting US veterans with COPD. https://www.copdfoundation.org/About-Us/Press-Room/Press-Releases/Article/722/Patient-Groups-Back-Bill-Supporting-US-Veterans-with-COPD.aspx. Published November 9, 2010. Accessed May 30, 2018.
6. American Lung Association. Lung health and disease: how serious is COPD. http://www.lung.org/lung-health-and-diseases/lung-disease-lookup/copd/learn-about-copd/how-serious-is-copd.html. Published 2016. Accessed May 30, 2018.
7. Shah T, Press V, Huisingh-Scheetz M, White SR. COPD readmissions: addressing COPD in the era of value-based health care. Chest. 2016;150(4):916-926.
8. Mcllvennan CK, Eapen ZJ, Allen LA. Hospital readmissions reduction program. Circulation. 2015;13(20):1796-1803.
9. Jackson C, Shahsahebi M, Wedlake T, DuBard CA. Timeliness of outpatient follow-up: an evidence-based approach for planning after hospital discharge. Ann Fam Med. 2015;13(2):115-122.
10. Jencks SF, Williams MV, Coleman EA. Rehospitalizations among patients in the Medicare fee-for-service program. N Engl J Med. 2009;360(14):1418-1428.
11. Hitch B, Parlier AB, Reed L, Galvin SL, Fagan EB, Wilson CG. Evaluation of a team-based, transition-of-care management service on 30-day readmission rates. N C Med J. 2016;77(2):87-92.
12. Stone J, Hoffman G. Medicare hospital readmissions: issues, policy options. In: Turner PM ed. Medicare: Background, Benefits and Issues. Nova Science Pub Inc; 2011:123-150.
13. Kripalani S, Jackson AT, Schnipper JL, Coleman EA. Promoting effective transitions of care at hospital discharge: a review of key issues for hospitalists. J Hosp Med. 2007;2(5):314-323.
14. Rosland A-M, Nelson K, Sun H, et al. The patient-centered medical home in the Veterans Health Administration. Am J Manag Care. 2013;19(7):e263-e272.
15. World Health Organization. Nursing and midwifery. http://www.who.int/hrh/nursing_midwifery/en. Accessed September 18, 2018.
16. Supper I, Catala O, Lustman M, Chemla C, Bourgueil Y, Letrilliart L. Interprofessional collaboration in primary health care: a review of facilitators and barriers perceived by involved actors. J Public Health (Oxf). 2015;37(4):716-727.
17. Melody KT, McCartney E, Sen S, Duenas G. Optimizing care transitions: the role of the community pharmacist. Integr Pharm Res Pract. 2016;5:43-51.
18. Ourth H, Groppi J, Morreale AP, Quicci-Roberts K. Clinical pharmacist prescribing activities in the Veterans Health Administration. Am J Health Syst Pharm. 2016;73(18):1406-1415.
19. US Department of Health and Human Services. Agency for Healthcare Research and Quality. Defining the PCMH. https://pcmh.ahrq.gov/page/defining-pcmh. Accessed May 29, 2018.
20. Kaplan A. The COPD action plan. Can Fam Physician. 2009;55(1):58-59.
21. Turnock AC, Walters EH, Walters JA, Wood-Baker R. Action plans for chronic obstructive pulmonary disease. Cochrane Database Syst Rev. 2005;(4):CD005074.
22. Global Initiative for Chronic Obstructive Lung Disease. Global strategy for the diagnosis, management, and prevention of chronic obstructive pulmonary disease (2017 report). http://goldcopd.org/gold-2017-global-strategy-diagnosis-management-prevention-copd. Accessed May 29, 2018.
23. Bonini M, Usmani OS. The importance of inhaler devices in the treatment of COPD. COPD Res Pract. 2015;1:9.
24. Buist AS, Anzueto A, Calverley P, DeGuia TS, Fukuch Y. Global strategy for the diagnosis, management, and prevention of chronic obstructive pulmonary disease. 2006.
25. McCarthy B, Casey D, Devane D, Murphy K, Murphy E, Lacasse Y. Pulmonary rehabilitation for chronic obstructive pulmonary disease. Cochrane Database Syst Rev. 2015;(2):CD003793.
26. ASHP Research and Education Foundation. Pharmacy forecast 2016-2020: strategic planning advice. http://www.ashpfoundation.org/PharmacyForecast2016. Published December 2015. Accessed May 29, 2018.
27. Mekonnen AB, McLachlan AJ, Brien JE. Effectiveness of pharmacist-led medication reconciliation programmes on clinical outcomes at hospital transitions: a systematic review and meta-analysis. BMJ Open. 2016;6(2):e010003.
28. Willard KS, Sullivan JB, Thomashow BM, et al. The 2nd national COPD readmissions summit and beyond: from theory to implementation. Chronic Obstr Pulm Dis. 2016;3(4):778-790.
29. Scanlon PD, Connett JE, Waller LA, et al; Lung Health Study Research Group. Smoking cessation and lung function in mild-to-moderate chronic obstructive pulmonary disease. The lung health study. Am J Respir Crit Care Med. 2000;161(2, pt 1):381-390.
30. Shah T, Press VG, Huisingh-Scheetz M, White SR. COPD readmissions: addressing COPD in the era of value-based health care. Chest. 2016;150(4):916-926.
31. GlaxoSmithKline. COPD Assessment Test (CAT). Castest Online. http://www.catestonline.org/images/UserGuides/CATHCPUser%20guideEn.pdf. Updated October 2016.
Sleep: The new frontier in cardiovascular prevention
MUNICH – Getting less than 6 hours of sleep nightly on a regular basis or waking up multiple times was independently associated with increased risk of subclinical atherosclerosis in the Spanish PESA study, Fernando Dominguez, MD, reported at the annual congress of the European Society of Cardiology.

Moreover, a graded response was evident in PESA (Progression of Early Subclinical Atherosclerosis): The more times an individual typically awoke per night, the greater the number of atherosclerotic carotid or femoral artery territories documented on three-dimensional vascular ultrasound, added Dr. Dominguez of the Spanish National Center for Cardiovascular Research in Madrid.
the cardiologist said.
The cross-sectional PESA study, whose principal investigator was Valentin Fuster, MD, PhD, included 3,974 middle-aged Madrid bank employees free of known heart disease or history of stroke who wore a waistband activity monitor for a week to record sleep quantity and quality. They also underwent three-dimensional vascular ultrasound and measurement of coronary artery calcium.
PESA was one of several large studies presented at the meeting that focused on deviations from normal sleep as a marker for increased risk of cardiovascular disease and/or mortality. Of note, however, PESA was the only one to use activity monitoring technology to track sleep.
“It was essential to use objectively measured sleep variables, because they showed huge disparity with patients’ self-reports on sleep questionnaires,” Dr. Dominguez explained.
Indeed, while 10.7% of PESA participants self-reported sleeping less than 6 hours per night on the Sleep Habits Questionnaire, actigraphy showed the true rate was 27.1%.
Based on actigraphic findings, subjects were divided into tertiles based upon average hours of sleep per night, ranging from less than 6 to more than 8. They were also grouped in quintiles based upon their extent of fragmented sleep.
Subjects with short sleep were significantly older and more likely to have high blood pressure, a higher body mass index, and metabolic syndrome than those who averaged 7-8 hours of sleep. Individuals in the top quintile for sleep awakening were older and had higher prevalences of smoking and hypertension than those in the lowest quintile.
In multivariate analyses adjusted for these differences as well as for physical activity, depression, obstructive sleep apnea, daily calorie consumption, alcohol intake, and other potential confounders, subjects who slept less than 6 hours per night had a 27% greater volume of noncoronary plaque than those who slept 7-8 hours. They also had 21% more vascular territories laden with subclinical atherosclerosis. The risk of subclinical noncoronary atherosclerosis was greater among women who averaged less than 6 hours of sleep per night, representing a 48% relative risk increase in plaque volume, versus 21% in men.
At the other extreme, women who slept more than 8 hours per night had an 83% increased plaque volume, while men who slept that much had no increase in risk, compared with men who slept for 7-8 hours.
Subjects in the top quintile for sleep fragmentation had 34% more vascular territories affected by atherosclerosis than those in the lowest quintile. Their noncoronary plaque burden was 23% greater as well.
An 11-study meta-analysis
Epameinondas Fountas, MD, of the Onassis Cardiac Surgery Center in Athens, presented a meta-analysis of 11 prospective studies of the relationship between daily sleep duration and cardiovascular disease morbidity and mortality published within the past 5 years, reflecting burgeoning interest in this hot-button topic. Collectively, the meta-analysis totaled 1,000,541 adults without baseline cardiovascular disease who were followed for an average of 9.3 years.

In an analysis adjusted for numerous known cardiovascular risk factors, the Greek investigators found that short sleep duration as defined by a self-reported average of less than 6 hours per night was independently associated with a statistically significant and clinically meaningful 11% increase in the risk of diagnosis of fatal or nonfatal cardiovascular disease, compared with individuals who averaged 6-8 hours nightly. Moreover, those who averaged more than 8 hours of sleep per night were also at risk: they averaged a 32% increased risk in fatal or nonfatal cardiovascular events compared to normal 6- to 8-hour sleepers. Thus, 6-8 hours of sleep per night appears to be the sweet spot in terms of cardioprotection.
“Our message to patients is simple: Sleep well, not too long, nor too short, and be active,” Dr. Fountas said.
Numerous investigators have highlighted the pathophysiologic changes related to sleep deprivation that likely boost cardiovascular risk. These include activation of the sympathetic nervous system, increased inflammation, and disrupted glucose metabolism, he noted.
Swedes weigh in
Moa Bengtsson, a combined medical/PhD student at the University of Gothenburg (Sweden), presented a prospective study of 798 men who were 50 years old in 1993, when they underwent a physical examination and completed extensive lifestyle questionnaires that included average self-reported sleep duration. Among the 759 men still available for evaluation after 21 years, or nearly 15,000 person-years of followup, those who reported sleeping an average of 5 hours or less per night back at age 50 were 93% more likely to have experienced a major cardiovascular event by age 71 -- acute MI, stroke, coronary revascularization, heart failure hospitalization, or cardiovascular death -- compared with those who averaged 7-8 hours of shut eye.

The short sleepers had a higher prevalence of obesity, diabetes, hypertension, smoking, and physical inactivity than the men who slept 7-8 hours per night. However, these and other confounders were adjusted for in the multivariate analysis.
To place sleep abnormalities in context, Ms. Bengtssen observed that short sleep in the Gothenburg men was numerically a stronger independent risk factor for future cardiovascular events than obesity, which was associated with an 82% increase in risk, or even smoking, with a 70% increase in risk.
Men who averaged either 6 hours of sleep per night or more than 8 hours were not at increased cardiovascular risk over 21 years of followup, compared with those who slept 7-8 hours.
Like the other investigators, she noted that the studies presented at the meeting, despite their extensive adjustments for potential confounders, don’t prove a direct causal relationship between short sleep and increased cardiovascular risk. An informative next step in research, albeit a challenging one, would be to show whether improved long-term sleep habits favorably alter cardiovascular risk.
All three study investigators reported having no financial conflicts regarding their research, which was conducted free of commercial support.
MUNICH – Getting less than 6 hours of sleep nightly on a regular basis or waking up multiple times was independently associated with increased risk of subclinical atherosclerosis in the Spanish PESA study, Fernando Dominguez, MD, reported at the annual congress of the European Society of Cardiology.
Moreover, a graded response was evident in PESA (Progression of Early Subclinical Atherosclerosis): The more times an individual typically awoke per night, the greater the number of atherosclerotic carotid or femoral artery territories documented on three-dimensional vascular ultrasound, added Dr. Dominguez of the Spanish National Center for Cardiovascular Research in Madrid.
the cardiologist said.
The cross-sectional PESA study, whose principal investigator was Valentin Fuster, MD, PhD, included 3,974 middle-aged Madrid bank employees free of known heart disease or history of stroke who wore a waistband activity monitor for a week to record sleep quantity and quality. They also underwent three-dimensional vascular ultrasound and measurement of coronary artery calcium.
PESA was one of several large studies presented at the meeting that focused on deviations from normal sleep as a marker for increased risk of cardiovascular disease and/or mortality. Of note, however, PESA was the only one to use activity monitoring technology to track sleep.
“It was essential to use objectively measured sleep variables, because they showed huge disparity with patients’ self-reports on sleep questionnaires,” Dr. Dominguez explained.
Indeed, while 10.7% of PESA participants self-reported sleeping less than 6 hours per night on the Sleep Habits Questionnaire, actigraphy showed the true rate was 27.1%.
Based on actigraphic findings, subjects were divided into tertiles based upon average hours of sleep per night, ranging from less than 6 to more than 8. They were also grouped in quintiles based upon their extent of fragmented sleep.
Subjects with short sleep were significantly older and more likely to have high blood pressure, a higher body mass index, and metabolic syndrome than those who averaged 7-8 hours of sleep. Individuals in the top quintile for sleep awakening were older and had higher prevalences of smoking and hypertension than those in the lowest quintile.
In multivariate analyses adjusted for these differences as well as for physical activity, depression, obstructive sleep apnea, daily calorie consumption, alcohol intake, and other potential confounders, subjects who slept less than 6 hours per night had a 27% greater volume of noncoronary plaque than those who slept 7-8 hours. They also had 21% more vascular territories laden with subclinical atherosclerosis. The risk of subclinical noncoronary atherosclerosis was greater among women who averaged less than 6 hours of sleep per night, representing a 48% relative risk increase in plaque volume, versus 21% in men.
At the other extreme, women who slept more than 8 hours per night had an 83% increased plaque volume, while men who slept that much had no increase in risk, compared with men who slept for 7-8 hours.
Subjects in the top quintile for sleep fragmentation had 34% more vascular territories affected by atherosclerosis than those in the lowest quintile. Their noncoronary plaque burden was 23% greater as well.
An 11-study meta-analysis
Epameinondas Fountas, MD, of the Onassis Cardiac Surgery Center in Athens, presented a meta-analysis of 11 prospective studies of the relationship between daily sleep duration and cardiovascular disease morbidity and mortality published within the past 5 years, reflecting burgeoning interest in this hot-button topic. Collectively, the meta-analysis totaled 1,000,541 adults without baseline cardiovascular disease who were followed for an average of 9.3 years.
In an analysis adjusted for numerous known cardiovascular risk factors, the Greek investigators found that short sleep duration as defined by a self-reported average of less than 6 hours per night was independently associated with a statistically significant and clinically meaningful 11% increase in the risk of diagnosis of fatal or nonfatal cardiovascular disease, compared with individuals who averaged 6-8 hours nightly. Moreover, those who averaged more than 8 hours of sleep per night were also at risk: they averaged a 32% increased risk in fatal or nonfatal cardiovascular events compared to normal 6- to 8-hour sleepers. Thus, 6-8 hours of sleep per night appears to be the sweet spot in terms of cardioprotection.
“Our message to patients is simple: Sleep well, not too long, nor too short, and be active,” Dr. Fountas said.
Numerous investigators have highlighted the pathophysiologic changes related to sleep deprivation that likely boost cardiovascular risk. These include activation of the sympathetic nervous system, increased inflammation, and disrupted glucose metabolism, he noted.
Swedes weigh in
Moa Bengtsson, a combined medical/PhD student at the University of Gothenburg (Sweden), presented a prospective study of 798 men who were 50 years old in 1993, when they underwent a physical examination and completed extensive lifestyle questionnaires that included average self-reported sleep duration. Among the 759 men still available for evaluation after 21 years, or nearly 15,000 person-years of followup, those who reported sleeping an average of 5 hours or less per night back at age 50 were 93% more likely to have experienced a major cardiovascular event by age 71 -- acute MI, stroke, coronary revascularization, heart failure hospitalization, or cardiovascular death -- compared with those who averaged 7-8 hours of shut eye.
The short sleepers had a higher prevalence of obesity, diabetes, hypertension, smoking, and physical inactivity than the men who slept 7-8 hours per night. However, these and other confounders were adjusted for in the multivariate analysis.
To place sleep abnormalities in context, Ms. Bengtssen observed that short sleep in the Gothenburg men was numerically a stronger independent risk factor for future cardiovascular events than obesity, which was associated with an 82% increase in risk, or even smoking, with a 70% increase in risk.
Men who averaged either 6 hours of sleep per night or more than 8 hours were not at increased cardiovascular risk over 21 years of followup, compared with those who slept 7-8 hours.
Like the other investigators, she noted that the studies presented at the meeting, despite their extensive adjustments for potential confounders, don’t prove a direct causal relationship between short sleep and increased cardiovascular risk. An informative next step in research, albeit a challenging one, would be to show whether improved long-term sleep habits favorably alter cardiovascular risk.
All three study investigators reported having no financial conflicts regarding their research, which was conducted free of commercial support.
REPORTING FROM THE ESC CONGRESS 2018
Opioids negatively affect breathing during sleep
SAN ANTONIO – Opioids do not mix well with sleep, interfering with breathing and increasing the risk of central sleep apnea, explained Anita Rajagopal, MD, a pulmonologist in private practice in Indianapolis.
“The chronic respiratory suppressant effects of opioids are well described,” Dr. Rajagopal told attendees at the annual meeting of the American College of Chest Physicians. “The most characteristic signs of chronic opioid effects are irregular central apneas, ataxic breathing, Biot’s respiration and hypoxemia, mainly during NREM sleep.”
Dr. Rajagopal reviewed the research on the effects of opioid use, primarily for therapeutic use, during sleep, especially highlighting the adverse respiratory effects.
In one small study of 24 patients, ages 18-75, who were taking long-term opioids for chronic pain, 46% had severe sleep-disordered breathing, defined as an apnea-hypopnea index greater than 30/hour (J Clin Sleep Med. 2014 Aug 15;10[8]:847-52).
When compared to sleep clinic patients referred for sleep disordered breathing, the participants taking opioids had a higher frequency of central apneas and a lower arousal index. Further, the researchers found that “morphine equivalent doses correlated with the severity of sleep-disordered breathing.”
In another study, a systematic review from 2015, researchers sought to characterize the clinical features of sleep-disordered breathing associated with chronic opioid therapy (Anesth Analg. 2015 Jun;120[6]:1273-85). They identified eight studies with 560 patients, about a quarter of whom (24%) had central sleep apnea.
Once again, “The morphine equivalent daily dose was strongly associated with the severity of the sleep disordered breathing, predominantly central sleep apnea, with a morphine equivalent daily dose of more than 200 mg being a threshold of particular concern,” the researchers reported.
Patients receiving methadone therapy for heroin addiction are not spared the respiratory risks of opioids during sleep. Dr. Rajagopal shared research revealing that patients receiving methadone treatment for at least two months had a blunted hypercapnic respiratory response and increased hypoxemic ventilatory response, changes related to respiratory rate but not tidal volume.
“All mu-opioid receptor agonists can cause complex and potentially lethal effects on respiration during sleep,” Dr. Rajagopal said as she shared evidence from a 2007 study that compared breathing patterns during sleep between 60 patients taking chronic opioids and 60 matched patients not taking opioids (J Clin Sleep Med. 2007 Aug 15;3[5]:455-61).
That study found chronic opioid use to be associated with increased central apneas and reduced arterial oxygen saturation during wakefulness and NREM sleep. Again, a dose-response relationship emerged between morphine dose equivalent and the apnea-hypopnea, obstructive apnea, hypopnea and central apnea indices (P less than .001).
Patients who took opioids long-term were also more likely to have ataxic or irregular breathing during NREM sleep, compared with patients not taking opioids.
In yet another meta-analysis and systematic review she related, researchers found across 803 patients in seven studies that long-term opioids users had a modestly increased risk for central sleep apnea but no similar increased risk for obstructive sleep apnea (J Clin Sleep Med. 2016 Apr 15;12[4]:617-25).
“REM and slow-wave sleep are decreased across all categories of opioid use — intravenous morphine, oral morphine, or methadone and heroin,” she said.
Since some patients are still going to need opioids, such as methadone therapy for those recovering from opioid use disorder, it’s important to understand appropriate effective treatments for central sleep apnea.
“CPAP [continuous positive airway pressure] is generally ineffective for opioid-induced sleep apnea and may augment central events,” Dr. Rajagopal explained, but adaptive servo ventilation (ASV) is effective for opioid-induced central apneas.
In one study of 20 patients receiving opioid therapy and referred for obstructive apnea, for example, the participants were diagnosed instead with central sleep apnea (J Clin Sleep Med. 2014 Jun 15;10[6]:637-43). The 16 patients who received CPAP continued to show central sleep apnea, with an AHI of 34 events/hour and central-apnea index (CAI) of 20 events/hour. Even after a four-week break before restarting CPAP, patients’ apnea did not resolve.
After receiving ASV, however, the average AHI dropped to 11 events/hour and CAI dropped to 0 events/hour. Those changes were accompanied by improvements in oxygen saturation, with the oxyhemoglobin saturation nadir increasing from 83% to 90%.
Similarly, a prospective multi-center observational trial assessed 27 patients with central apnea after they used ASV at home for three months (Chest. 2015 Dec;148[6]:1454-1461). The participants began with an average AHI of 55 and CAI of 23 at baseline. CPAP dropped these values only to an AHI of 33 and CAI of 10, but treatment with ASV dropped them to an AHI of 4 and CAI of 0 (P less than .001).
REPORTING FROM CHEST 2018

Influenza update 2018–2019: 100 years after the great pandemic

This centennial year update focuses primarily on immunization, but also reviews epidemiology, transmission, and treatment.
EPIDEMIOLOGY
2017–2018 was a bad season
The 2017–2018 influenza epidemic was memorable, dominated by influenza A(H3N2) viruses with morbidity and mortality rates approaching pandemic numbers. It lasted 19 weeks, killed more people than any other epidemic since 2010, particularly children, and was associated with 30,453 hospitalizations—almost twice the previous season high in some parts of the United States.2
Regrettably, 171 unvaccinated children died during 2017–2018, accounting for almost 80% of deaths.2 The mean age of the children who died was 7.1 years; 51% had at least 1 underlying medical condition placing them at risk for influenza-related complications, and 57% died after hospitalization.2
Recent estimates of the incidence of symptomatic influenza among all ages ranged from 3% to 11%, which is slightly lower than historical estimates. The rates were higher for children under age 18 than for adults.3 Interestingly, influenza A(H3N2) accounted for 50% of cases of non-mumps viral parotitis during the 2014–2015 influenza season in the United States.4
Influenza C exists but is rare
Influenza A and B account for almost all influenza-related outpatient visits and hospitalizations. Surveillance data from May 2013 through December 2016 showed that influenza C accounts for 0.5% of influenza-related outpatient visits and hospitalizations, particularly affecting children ages 6 to 24 months. Medical comorbidities and copathogens were seen in all patients requiring intensive care and in most hospitalizations.5 Diagnostic tests for influenza C are not widely available.
Dogs and cats: Factories for new flu strains?
While pigs and birds are the major reservoirs of influenza viral genetic diversity from which infection is transmitted to humans, dogs and cats have recently emerged as possible sources of novel reassortant influenza A.6 With their frequent close contact with humans, our pets may prove to pose a significant threat.
Obesity a risk factor for influenza
Obesity emerged as a risk factor for severe influenza in the 2009 pandemic. Recent data also showed that obesity increases the duration of influenza A virus shedding, thus increasing duration of contagiousness.7
Influenza a cardiovascular risk factor
Previous data showed that influenza was a risk factor for cardiovascular events. Two recent epidemiologic studies from the United Kingdom showed that laboratory-confirmed influenza was associated with higher rates of myocardial infarction and stroke for up to 4 weeks.8,9
Which strain is the biggest threat?
Predicting which emerging influenza serotype may cause the next pandemic is difficult, but influenza A(H7N9), which had not infected humans until 2013 but has since infected about 1,600 people in China and killed 37% of them, appears to have the greatest potential.10
National influenza surveillance programs and influenza-related social media applications have been developed and may get a boost from technology. A smartphone equipped with a temperature sensor can instantly detect one’s temperature with great precision. A 2018 study suggested that a smartphone-driven thermometry application correlated well with national influenza-like illness activity and improved its forecast in real time and up to 3 weeks in advance.11
TRANSMISSION
Humidity may not block transmission
Animal studies have suggested that humidity in the air interferes with transmission of airborne influenza virus, partially from biologic inactivation. But when a recent study used humidity-controlled chambers to investigate the stability of the 2009 influenza A(H1N1) virus in suspended aerosols and stationary droplets, the virus remained infectious in aerosols across a wide range of relative humidities, challenging the common belief that humidity destabilizes respiratory viruses in aerosols.12
One sick passenger may not infect the whole plane
Transmission of respiratory viruses on airplane flights has long been considered a potential avenue for spreading influenza. However, a recent study that monitored movements of individuals on 10 transcontinental US flights and simulated inflight transmission based on these data showed a low probability of direct transmission, except for passengers seated in close proximity to an infectious passenger.13
WHAT’S IN THE NEW FLU SHOT?
The 2018–2019 quadrivalent vaccine for the Northern Hemisphere14 contains the following strains:
- A/Michigan/45/2015 A(H1N1)pdm09-like virus
- A/Singapore/INFIMH-16-0019/2016 (H3N2)-like virus
- B/Colorado/06/2017-like virus (Victoria lineage)
- B/Phuket/3073/2013-like virus (Yamagata lineage).
The A(H3N2) (Singapore) and B/Victoria lineage components are new this year. The A(H3N2) strain was the main cause of the 2018 influenza epidemic in the Southern Hemisphere.
The quadrivalent live-attenuated vaccine, which was not recommended during the 2016–2017 and 2017–2018 influenza seasons, has made a comeback and is recommended for the 2018–2019 season in people for whom it is appropriate based on age and comorbidities.15 Although it was effective against influenza B and A(H3N2) viruses, it was less effective against the influenza A(H1N1)pdm09-like viruses during the 2013–2014 and 2015–2016 seasons.
A/Slovenia/2903/2015, the new A(H1N1)pdm09-like virus included in the 2018–2019 quadrivalent live-attenuated vaccine, is significantly more immunogenic than its predecessor, A/Bolivia/559/2013, but its clinical effectiveness remains to be seen.
PROMOTING VACCINATION
How effective is it?
Influenza vaccine effectiveness in the 2017–2018 influenza season was 36% overall, 67% against A(H1N1), 42% against influenza B, and 25% against A(H3N2).16 It is estimated that influenza vaccine prevents 300 to 4,000 deaths annually in the United States alone.17
A 2018 Cochrane review17 concluded that vaccination reduced the incidence of influenza by about half, with 2.3% of the population contracting the flu without vaccination compared with 0.9% with vaccination (risk ratio 0.41, 95% confidence interval 0.36–0.47). The same review found that 71 healthy adults need to be vaccinated to prevent 1 from experiencing influenza, and 29 to prevent 1 influenza-like illness.
Several recent studies showed that influenza vaccine effectiveness varied based on age and influenza serotype, with higher effectiveness in people ages 5 to 17 and ages 18 to 64 than in those age 65 and older.18–20 A mathematical model of influenza transmission and vaccination in the United States determined that even relatively low-efficacy influenza vaccines can be very useful if optimally distributed across age groups.21
Vaccination rates are low, and ‘antivaxxers’ are on the rise
Although the influenza vaccine is recommended in the United States for all people age 6 months and older regardless of the state of their health, vaccination rates remain low. In 2016, only 37% of employed adults were vaccinated. The highest rate was for government employees (45%), followed by private employees (36%), followed by the self-employed (30%).22
A national goal is to immunize 80% of all Americans and 90% of at-risk populations (which include children and the elderly).23 The number of US hospitals that require their employees to be vaccinated increased from 37.1% in 2013 to 61.4% in 2017.24 Regrettably, as of March 2018, 14 lawsuits addressing religious objections to hospital influenza vaccination mandates have been filed.25
Despite hundreds of studies demonstrating the efficacy, safety, and cost savings of influenza vaccination, the antivaccine movement has been growing in the United States and worldwide.26 All US states except West Virginia, Mississippi, and California allow nonmedical exemptions from vaccination based on religious or personal belief.27 Several US metropolitan areas represent “hot spots” for these exemptions.28 This may render such areas vulnerable to vaccine-preventable diseases, including influenza.
Herd immunity: We’re all in this together
Some argue that the potential adverse effects and the cost of vaccination outweigh the benefits, but the protective benefits of herd immunity are significant for those with comorbidities or compromised immunity.
Educating the public about herd immunity and local influenza vaccination uptake increases people’s willingness to be vaccinated.29 A key educational point is that at least 70% of a community needs to be vaccinated to prevent community outbreaks; this protects everyone, including those who do not mount a protective antibody response to influenza vaccination and those who are not vaccinated.
DOES ANNUAL VACCINATION BLUNT ITS EFFECTIVENESS?
Some studies from the 1970s and 1980s raised concern over a possible negative effect of annual influenza vaccination on vaccine effectiveness. The “antigenic distance hypothesis” holds that vaccine effectiveness is influenced by antigenic similarity between the previous season’s vaccine serotypes and the epidemic serotypes, as well as the antigenic similarity between the serotypes of the current and previous seasons.
A meta-analysis of studies from 2010 through 2015 showed significant inconsistencies in repeat vaccination effects within and between seasons and serotypes. It also showed that vaccine effectiveness may be influenced by more than 1 previous season, particularly for influenza A(H3N2), in which repeated vaccination can blunt the hemagglutinin antibody response.30
A study from Japan showed that people who needed medical attention for influenza in the previous season were at lower risk of a similar event in the current season.31 Prior-season influenza vaccination reduced current-season vaccine effectiveness only in those who did not have medically attended influenza in the prior season. This suggests that infection is more immunogenic than vaccination, but only against the serotype causing the infection and not the other serotypes included in the vaccine.
An Australian study showed that annual influenza vaccination did not decrease vaccine effectiveness against influenza-associated hospitalization. Rather, effectiveness increased by about 15% in those vaccinated in both current and previous seasons compared with those vaccinated in either season alone.32
European investigators showed that repeated seasonal influenza vaccination in the elderly prevented the need for hospitalization due to influenza A(H3N2) and B, but not A(H1N1)pdm09.33
VACCINATION IN SPECIAL POPULATIONS
High-dose vaccine for older adults
The high-dose influenza vaccine has been licensed since 2009 for use in the United States for people ages 65 and older.
Recent studies confirmed that high-dose vaccine is more effective than standard-dose vaccine in veterans34 and US Medicare beneficiaries.35
The high-dose vaccine is rapidly becoming the primary vaccine given to people ages 65 and older in retail pharmacies, where vaccination begins earlier in the season than in providers’ offices.36 Some studies have shown that the standard-dose vaccine wanes in effectiveness toward the end of the influenza season (particularly if the season is long) if it is given very early. It remains to be seen whether the same applies to the high-dose influenza vaccine.
Some advocate twice-annual influenza vaccination, particularly for older adults living in tropical and subtropical areas, where influenza seasons are more prolonged. However, a recently published study observed reductions in influenza-specific hemagglutination inhibition and cell-mediated immunity after twice-annual vaccination.37
Vaccination is beneficial during pregnancy
Many studies have shown the value of influenza vaccination during pregnancy for both mothers and their infants.
One recently published study showed that 18% of infants who developed influenza required hospitalization.38 In that study, prenatal and postpartum maternal influenza vaccination decreased the odds of influenza in infants by 61% and 53%, respectively.
Another study showed that vaccine effectiveness did not vary by gestational age at vaccination.39
Some studies have shown that influenza virus infection can increase susceptibility to certain bacterial infections. A post hoc analysis of an influenza vaccination study in pregnant women suggested that the vaccine was also associated with decreased rates of pertussis in these women.40
Factors that make vaccination less effective
Several factors including age-related frailty and iatrogenic and disease-related immunosuppression can affect vaccine effectiveness.
Frailty. A recent study showed that vaccine effectiveness was 77.6% in nonfrail older adults but only 58.7% in frail older adults.41
Immunosuppression. Temporary discontinuation of methotrexate for 2 weeks after influenza vaccination in patients with rheumatoid arthritis improves vaccine immunogenicity without precipitating disease flare.42 Solid-organ and hematopoietic stem cell transplant recipients who received influenza vaccine were less likely to develop pneumonia and require intensive care unit admission.43
The high-dose influenza vaccine is more immunogenic than the standard-dose vaccine in solid-organ transplant recipients.44
Statins are widely prescribed and have recently been associated with reduced influenza vaccine effectiveness against medically attended acute respiratory illness, but their benefits in preventing cardiovascular events outweigh this risk.45
FUTURE VACCINE CONSIDERATIONS
Moving away from eggs
During the annual egg-based production process, which takes several months, the influenza vaccine acquires antigenic changes that allow replication in eggs, particularly in the hemagglutinin protein, which mediates receptor binding. This process of egg adaptation may cause antigenic changes that decrease vaccine effectiveness against circulating viruses.
The cell-based baculovirus influenza vaccine grown in dog kidney cells has higher antigenic content and is not subject to the limitations of egg-based vaccine, although it still requires annual updates. A recombinant influenza vaccine reduces the probability of influenza-like illness by 30% compared with the egg-based influenza vaccine, but also still requires annual updates.46 The market share of these non-egg-based vaccines is small, and thus their effectiveness has yet to be demonstrated.
The US Department of Defense administered the cell-based influenza vaccine to about one-third of Armed Forces personnel, their families, and retirees in the 2017–2018 influenza seasons, and data on its effectiveness are expected in the near future.47
A universal vaccine would be ideal
The quest continues for a universal influenza vaccine, one that remains protective for several years and does not require annual updates.48 Such a vaccine would protect against seasonal epidemic influenza drift variants and pandemic strains. More people could likely be persuaded to be vaccinated once rather than every year.

An ideal universal vaccine would be suitable for all age groups, at least 75% effective against symptomatic influenza virus infection, protective against all influenza A viruses (influenza A, not B, causes pandemics and seasonal epidemics), and durable through multiple influenza seasons.51
Research and production of such a vaccine are expected to require funding of about $1 billion over the next 5 years.
Boosting effectiveness
Estimates of influenza vaccine effectiveness range from 40% to 60% in years when the vaccine viruses closely match the circulating viruses, and variably lower when they do not match. The efficacy of most other vaccines given to prevent other infections is much higher.
New technologies to improve influenza vaccine effectiveness are needed, particularly for influenza A(H3N2) viruses, which are rapidly evolving and are highly susceptible to egg-adaptive mutations in the manufacturing process.
In one study, a nanoparticle vaccine formulated with a saponin-based adjuvant induced hemagglutination inhibition responses that were even greater than those induced by the high-dose vaccine.52
Immunoglobulin A (IgA) may be a more effective vaccine target than traditional influenza vaccines that target IgG, since different parts of IgA may engage the influenza virus simultaneously.53
Vaccines can be developed more quickly than in the past. The timeline from viral sequencing to human studies with deoxyribonucleic acid plasmid vaccines decreased from 20 months in 2003 for the severe acquired respiratory syndrome coronavirus to 11 months in 2006 for influenza A/Indonesia/2006 (H5), to 4 months in 2009 for influenza A/California/2009 (H1), to 3.5 months in 2016 for Zika virus.54 This is because it is possible today to sequence a virus and insert the genetic material into a vaccine platform without ever having to grow the virus.
TREATMENT
Numerous studies have found anti-influenza medications to be effective. Nevertheless, in an analysis of the 2011–2016 influenza seasons, only 15% of high-risk patients were prescribed anti-influenza medications within 2 days of symptom onset, including 37% in those with laboratory-confirmed influenza.55 Fever was associated with an increased rate of antiviral treatment, but 25% of high-risk outpatients were afebrile. Empiric treatment of 4 high-risk outpatients with acute respiratory illness was needed to treat 1 patient with influenza.55
Treatment with a neuraminidase inhibitor within 2 days of illness has recently been shown to improve survival and shorten duration of viral shedding in patients with avian influenza A(H7N9) infection.56 Antiviral treatment within 2 days of illness is associated with improved outcomes in transplant recipients57 and with a lower risk of otitis media in children.58
Appropriate anti-influenza treatment is as important as avoiding unnecessary antibiotics. Regrettably, as many as one-third of patients with laboratory-confirmed influenza are prescribed antibiotics.59
The US Food and Drug Administration warns against fraudulent unapproved over-the-counter influenza products.60
Baloxavir marboxil
Baloxavir marboxil is a new anti-influenza medication approved in Japan in February 2018 and anticipated to be available in the United States sometime in 2019.
This prodrug is hydrolyzed in vivo to the active metabolite, which selectively inhibits cap-dependent endonuclease enzyme, a key enzyme in initiation of messenger ribonucleic acid synthesis required for influenza viral replication.61
In a double-blind phase 3 trial, the median time to alleviation of influenza symptoms is 26.5 hours shorter with baloxavir marboxil than with placebo. One tablet was as effective as 5 days of the neuraminidase inhibitor oseltamivir and was associated with greater reduction in viral load 1 day after initiation, and similar side effects.62 Of concern is the emergence of nucleic acid substitutions conferring resistance to baloxavir; this occurred in 2.2% and 9.7% of baloxavir recipients in the phase 2 and 3 trials, respectively.
CLOSING THE GAPS
Several gaps in the management of influenza persist since the 1918 pandemic.1 These include gaps in epidemiology, prevention, diagnosis, treatment, and prognosis.
- Global networks wider than current ones are needed to address this global disease and to prioritize coordination efforts.
- Establishing and strengthening clinical capacity is needed in limited resource settings. New technologies are needed to expedite vaccine development and to achieve progress toward a universal vaccine.
- Current diagnostic tests do not distinguish between seasonal and novel influenza A viruses of zoonotic origin, which are expected to cause the next pandemic.
- Current antivirals have been shown to shorten duration of illness in outpatients with uncomplicated influenza, but the benefit in hospitalized patients has been less well established.
- In 2007, resistance of seasonal influenza A(H1N1) to oseltamivir became widespread. In 2009, pandemic influenza A(H1N1), which is highly susceptible to oseltamivir, replaced the seasonal virus and remains the predominantly circulating A(H1N1) strain.
- A small-molecule fragment, N-cyclohexyaltaurine, binds to the conserved hemagglutinin receptor-binding site in a manner that mimics the binding mode of the natural receptor sialic acid. This can serve as a template to guide the development of novel broad-spectrum small-molecule anti-influenza drugs.63
- Biomarkers that can accurately predict development of severe disease in patients with influenza are needed.
- Uyeki TM, Fowler RA, Fischer WA. Gaps in the clinical management of influenza: a century since the 1918 pandemic. JAMA 2018; 320(8):755–756. doi:10.1001/jama.2018.8113
- Garten R, Blanton L, Elal AI, et al. Update: influenza activity in the United States during the 2017–18 season and composition of the 2018–19 influenza vaccine. MMWR Morb Mortal Wkly Rep 2018; 67(22):634–642. doi:10.15585/mmwr.mm6722a4
- Tokars JI, Olsen SJ, Reed C. Seasonal incidence of symptomatic influenza in the United States. Clin Infect Dis 2018; 66(10):1511–1518. doi:10.1093/cid/cix1060
- Elbadawi LI, Talley P, Rolfes MA, et al. Non-mumps viral parotitis during the 2014–2015 influenza season in the United States. Clin Infect Dis 2018. Epub ahead of print. doi:10.1093/cid/ciy137
- Thielen BK, Friedlander H, Bistodeau S, et al. Detection of influenza C viruses among outpatients and patients hospitalized for severe acute respiratory infection, Minnesota, 2013–2016. Clin Infect Dis 2018; 66(7):1092–1098. doi:10.1093/cid/cix931
- Chena Y, Trovãob NS, Wang G, et al. Emergence and evolution of novel reassortant influenza A viruses in canines in southern China. MBio 2018; 9(3):e00909–e00918. doi:10.1128/mBio.00909-18
- Maier HE, Lopez R, Sanchez N, et al. Obesity increases the duration of influenza A virus shedding in adults. J Infect Dis 2018. Epub ahead of print. doi:10.1093/infdis/jiy370
- Warren-Gash C, Blackburn R, Whitaker H, McMenamin J, Hayward AC. Laboratory-confirmed respiratory infections as triggers for acute myocardial infarction and stroke: a self-controlled case series analysis of national linked datasets from Scotland. Eur Respir J 2018; 51(3):1701794. doi:10.1183/13993003.01794-2017
- Blackburn R, Zhao H, Pebody R, Hayward A, Warren-Gash C. Laboratory-confirmed respiratory infections as predictors of hospital admission for myocardial infarction and stroke: time-series analysis of English data for 2004–2015. Clin Infect Dis 2018; 67(1):8–17. doi:10.1093/cid/cix1144
- Newsweek; Andrew S. What is disease X? Deadly bird flu virus could be next pandemic. www.newsweek.com/disease-x-bird-flu-deaths-pandemic-what-h7n9-979723. Accessed October 3, 2018.
- Miller AC, Singh I, Koehler E, Polgreen PM. A smartphone-driven thermometer application for real-time population- and individual-level influenza surveillance. Clin Infect Dis 2018; 67(3):388–397. doi:10.1093/cid/ciy073
- Kormuth KA, Lin K, Prussin AJ 2nd, et al. Influenza virus infectivity is retained in aerosols and droplets independent of relative humidity, J Infect Dis 2018; 218(5):739–747. doi:10.1093/infdis/jiy221
- Hertzberg VS, Weiss H, Elon L, et. al. Behaviors, movements, and transmission of droplet-mediated respiratory diseases during transcontinental airline flights. Proc Natl Acad Sci U S A 2018; 115(14):3623–3627. doi:10.1073/pnas.1711611115
- Grohskopf LA, Sokolow LZ, Broder KR, Walter EB, Fry AM, Jernigan DB. Prevention and control of seasonal influenza with vaccines: recommendations of the Advisory Committee on Immunization Practices—United States, 2018–19 influenza season. MMWR Recomm Rep 2018; 67(3):1–20. doi:10.15585/mmwr.rr6703a1
- Grohskopf LA, Sokolow LZ, Fry AM, Walter EB, Jernigan DB. Update: ACIP recommendations for the use of quadrivalent live attenuated influenza vaccine (LAIV4)—United States, 2018–19 influenza season. MMWR Morb Mortal Wkly Rep 2018; 67(22):643–645. doi:10.15585/mmwr.mm6722a5
- Flannery B, Chung JR, Belongia EA, et al. Interim estimates of 2017–18 seasonal influenza vaccine effectiveness—United States, February 2018. MMWR Morb Mortal Wkly Rep 2018; 67(6):180–185. doi:10.15585/mmwr.mm6706a2
- Demicheli V, Jefferson T, Ferroni E, Rivetti A, Di Pietrantonj C. Vaccines for preventing influenza in healthy adults. Cochrane Database Syst Rev 2018; 2:CD001269. doi:10.1002/14651858.CD001269.pub6
- Flannery B, Smith C, Garten RJ, et al. Influence of birth cohort on effectiveness of 2015–2016 influenza vaccine against medically attended illness due to 2009 pandemic influenza A(H1N1) virus in the United States. J Infect Dis 2018; 218(2):189–196. doi:10.1093/infdis/jix634
- Rondy M, El Omeiri N, Thompson MG, Leveque A, Moren A, Sullivan SG. Effectiveness of influenza vaccines in preventing severe influenza illness among adults: a systematic review and meta-analysis of test-negative design case-control studies. J Infect 2017; 75(5):381–394. doi:10.1016/j.jinf.2017.09.010
- Stein Y, Mandelboim M, Sefty H, et al; Israeli Influenza Surveillance Network (IISN). Seasonal influenza vaccine effectiveness in preventing laboratory-confirmed influenza in primary care in Israel, 2016–2017 season: insights into novel age-specific analysis. Clin Infect Dis 2018; 66(9):1383–1391. doi:10.1093/cid/cix1013
- Sah P, Medlock J, Fitzpatrick MC, Singer BH, Galvani AP. Optimizing the impact of low-efficacy influenza vaccines. Proc Natl Acad Sci U S A 2018; 115(20):5151–5156. doi:10.1073/pnas.1802479115
- QuickStats: percentage of currently employed adults aged ≥ 18 years who received influenza vaccine in the past 12 months, by employment category—national health interview survey, United States, 2012 and 2016. MMWR Morb Mortal Wkly Rep 2018; 67(16):480. doi:10.15585/mmwr.mm6716a8
- Healthy People.gov. Immunization and infectious diseases. IID-12. Increase the percentage of children and adults who are vaccinated annually against seasonal influenza. www.healthypeople.gov/2020/topics-objectives/topic/immunization-and-infectious-diseases/objectives. Accessed October 3, 2018.
- Greene MT, Fowler KE, Ratz D, Krein SL, Bradley SF, Saint S. Changes in influenza vaccination requirements for health care personnel in US hospitals. JAMA Network Open 2018; 1(2):e180143. doi:10.1001/jamanetworkopen.2018.0143
- Opel DJ, Sonne JA, Mello MM. Vaccination without litigation—addressing religious objections to hospital influenza-vaccination mandates. N Engl J Med 2018; 378(9):785–788. doi:10.1056/NEJMp1716147
- Horowitz J. Italy loosens vaccine law just as children return to school. New York Times Sept. 20, 2018. www.nytimes.com/2018/09/20/world/europe/italy-vaccines-five-star-movement.html.
- National Conference of State Legislature. States with religious and philosophical exemptions from school immunization requirements. www.ncsl.org/research/health/school-immunization-exemption-state-laws.aspx. Accessed October 3, 2018.
- Olive JK, Hotez PJ, Damania A, Nolan MS. The state of the antivaccine movement in the United States: a focused examination of nonmedical exemptions in states and counties. PLoS Med 2018; 15(6):e1002578. doi:10.1371/journal.pmed.1002578
- Logan J, Nederhoff D, Koch B, et al. ‘What have you HEARD about the HERD?’ Does education about local influenza vaccination coverage and herd immunity affect willingness to vaccinate? Vaccine 2018; 36(28):4118–4125. doi:10.1016/j.vaccine.2018.05.037
- Belongia EA, Skowronski DM, McLean HQ, Chambers C, Sundaram ME, De Serres G. Repeated annual influenza vaccination and vaccine effectiveness: review of evidence. Expert Rev Vaccines 2017; 16(7):1–14. doi:10.1080/14760584.2017.1334554
- Saito N, Komori K, Suzuki M, et al. Negative impact of prior influenza vaccination on current influenza vaccination among people infected and not infected in prior season: a test-negative case-control study in Japan. Vaccine 2017; 35(4):687–693. doi:10.1016/j.vaccine.2016.11.024
- Cheng AC, Macartney KK, Waterer GW, Kotsimbos T, Kelly PM, Blyth CC; Influenza Complications Alert Network (FluCAN) Investigators. Repeated vaccination does not appear to impact upon influenza vaccine effectiveness against hospitalization with confirmed influenza. Clin Infect Dis 2017; 64(11):1564–1572. doi:10.1093/cid/cix209
- Rondy M, Launay O, Castilla J, et al; InNHOVE/I-MOVE+working group. Repeated seasonal influenza vaccination among elderly in Europe: effects on laboratory confirmed hospitalised influenza. Vaccine 2017; 35(34):4298–4306. doi:10.1016/j.vaccine.2017.06.088
- Young-Xu Y, van Aalst R, Mahmud SM, et al. Relative vaccine effectiveness of high-dose versus standard-dose influenza vaccines among Veterans Health Administration patients. J Infect Dis 2018; 217(11):1718–1727. doi:10.1093/infdis/jiy088
- Shay DK, Chillarige Y, Kelman J, et al. Comparative effectiveness of high-dose versus standard-dose influenza vaccines among US Medicare beneficiaries in preventing postinfluenza deaths during 2012–2013 and 2013–2014. J Infect Dis 2017; 215(4):510–517. doi:10.1093/infdis/jiw641
- Madaras-Kelly K, Remington R, Hruza H, Xu D. Comparative effectiveness of high-dose versus standard-dose influenza vaccines in preventing postinfluenza deaths. J Infect Dis 2018; 218(2):336–337. doi:10.1093/infdis/jix645
- Tam YH, Valkenburg SA, Perera RAPM, et al. Immune responses to twice-annual influenza vaccination in older adults in Hong Kong. Clin Infect Dis 2018; 66(6):904–912. doi:10.1093/cid/cix900
- Ohfuji S, Deguchi M, Tachibana D, et al; Osaka Pregnant Women Influenza Study Group. Protective effect of maternal influenza vaccination on influenza in their infants: a prospective cohort study. J Infect Dis 2018; 217(6):878–886. doi:10.1093/infdis/jix629
- Katz J, Englund JA, Steinhoff MC, et al. Impact of timing of influenza vaccination in pregnancy on transplacental antibody transfer, influenza incidence, and birth outcomes: a randomized trial in rural Nepal. Clin Infect Dis 2018; 67(3):334–340. doi:10.1093/cid/ciy090
- Nunes MC, Cutland CL, Madhi SA. Influenza vaccination during pregnancy and protection against pertussis. N Engl J Med 2018; 378(13):1257–1258. doi:10.1056/NEJMc1705208
- Andrew MK, Shinde V, Ye L, et al; Serious Outcomes Surveillance Network of the Public Health Agency of Canada/Canadian Institutes of Health Research Influenza Research Network (PCIRN) and the Toronto Invasive Bacterial Diseases Network (TIBDN). The importance of frailty in the assessment of influenza vaccine effectiveness against influenza-related hospitalization in elderly people. J Infect Dis 2017; 216(4):405–414. doi:10.1093/infdis/jix282
- Park JK, Lee YJ, Shin K, et al. Impact of temporary methotrexate discontinuation for 2 weeks on immunogenicity of seasonal influenza vaccination in patients with rheumatoid arthritis: a randomised clinical trial. Ann Rheum Dis 2018; 77(6):898–904. doi:10.1136/annrheumdis-2018-213222
- Kumar D, Ferreira VH, Blumberg E, et al. A five-year prospective multi-center evaluation of influenza infection in transplant recipients. Clin Infect Dis 2018. Epub ahead of print. doi:10.1093/cid/ciy294
- Natori Y, Shiotsuka M, Slomovic J, et al. A double-blind, randomized trial of high-dose vs standard-dose influenza vaccine in adult solid-organ transplant recipients. Clin Infect Dis 2018; 66(11):1698–1704. doi:10.1093/cid/cix1082
- Omer SB, Phadke VK, Bednarczyk BA, Chamberlain AT, Brosseau JL, Orenstein WA. Impact of statins on influenza vaccine effectiveness against medically attended acute respiratory illness. J Infect Dis 2016; 213(8):1216–1223. doi:10.1093/infdis/jiv457
- Dunkle LM, Izikson R, Patriarca P, et al. Efficacy of recombinant influenza vaccine in adults 50 years of age or older. N Engl J Med 2017; 376(25):2427–2436. doi:10.1056/NEJMoa1608862
- STAT; Branswell H. How the US military might help answer a critical question about the flu vaccine. www.statnews.com/2018/03/02/flu-vaccine-egg-production-data. Accessed October 3, 2018.
- Paules CI, Sullivan SG, Subbarao K, Fauci AS. Chasing seasonal influenza—the need for a universal influenza vaccine. N Engl J Med 2018; 378(1):7–9. doi:10.1056/NEJMp1714916
- Jin XW, Mossad SB. Avian influenza: an emerging pandemic threat. Cleve Clin J Med 2005; 72:1129-1134. pmid:16392727
- Wei WI, Brunger AT, Skehel JJ, Wiley DC. Refinement of the influenza virus hemagglutinin by simulated annealing. J Mol Biol 1990; 212(4):737–761. doi:10.1016/0022-2836(90)90234-D
- Erbelding EJ, Post DJ, Stemmy EJ, et al. A universal influenza vaccine: the strategic plan for the National Institute of Allergy and Infectious Diseases, J Infect Dis 2018; 218(3):347–354. doi:10.1093/infdis/jiy103
- Shinde V, Fries L, Wu Y, et al. Improved titers against influenza drift variants with a nanoparticle vaccine. N Engl J Med 2018; 378(24):2346–2348. doi:10.1056/NEJMc1803554
- Maurer MA, Meyer L, Bianchi M, et al. Glycosylation of human IgA directly inhibits influenza A and other sialic-acid-binding viruses. Cell Rep 2018; 23(1):90–99. doi:10.1016/j.celrep.2018.03.027
- Graham BS, Mascola JR, Fauci AS. Novel vaccine technologies: essential components of an adequate response to emerging viral diseases. JAMA 2018; 319(14):1431–1432. doi:10.1001/jama.2018.0345
- Stewart RJ, Flannery B, Chung JR, et al. Influenza antiviral prescribing for outpatients with an acute respiratory illness and at high risk for influenza-associated complications during 5 influenza seasons—United States, 2011–2016. Clin Infect Dis 2018; 66(7):1035–1041. doi:10.1093/cid/cix922
- Zheng S, Tang L, Gao H, et al. Benefit of early initiation of neuraminidase inhibitor treatment to hospitalized patients with avian influenza A(H7N9) virus. Clin Infect Dis 2018; 66(7):1054–1060. doi:10.1093/cid/cix930
- Kumar D, Ferreira VH, Blumberg E, et al. A five-year prospective multi-center evaluation of influenza infection in transplant recipients. Clin Infect Dis 2018. Epub ahead of print. doi:10.1093/cid/ciy294
- Malosh RE, Martin ET, Heikkinen T, Brooks WA, Whitley RJ, Monto AS. Efficacy and safety of oseltamivir in children: systematic review and individual patient data meta-analysis of randomized controlled trials. Clin Infect Dis 2018; 66(10):1492–1500. doi:10.1093/cid/cix1040
- Havers FP, Hicks LA, Chung JR, et al. Outpatient antibiotic prescribing for acute respiratory infections during influenza seasons. JAMA Network Open 2018; 1(2):e180243. doi:10.1001/jamanetworkopen.2018.0243
- US Food and Drug Administration. FDA warns of fraudulent and unapproved flu products. www.fda.gov/newsevents/newsroom/pressannouncements/ucm599223.htm. Accessed October 3, 2018.
- Portsmouth S, Kawaguchi K, Arai M, Tsuchiya K, Uehara T. Cap-dependent endonuclease inhibitor S-033188 for the treatment of influenza: results from a phase 3, randomized, double-blind, placebo- and active-controlled study in otherwise healthy adolescents and adults with seasonal influenza. Open Forum Infect Dis 2017; 4(suppl 1):S734. doi:10.1093/ofid/ofx180.001
- Hayden FG, Sugaya N, Hirotsu N, et al; Baloxavir Marboxil Investigators Group. Baloxavir Marboxil for uncomplicated influenza in adults and adolescents. N Engl J Med 2018; 379(10):913–923. doi:10.1056/NEJMoa1716197
- Kadam RU, Wilson IA. A small-molecule fragment that emulates binding of receptor and broadly neutralizing antibodies to influenza A hemagglutinin. Proc Natl Acad Sci U S A 2018; 115(16):4240–4245. doi:10.1073/pnas.1801999115
This centennial year update focuses primarily on immunization, but also reviews epidemiology, transmission, and treatment.
EPIDEMIOLOGY
2017–2018 was a bad season
The 2017–2018 influenza epidemic was memorable, dominated by influenza A(H3N2) viruses with morbidity and mortality rates approaching pandemic numbers. It lasted 19 weeks, killed more people than any other epidemic since 2010, particularly children, and was associated with 30,453 hospitalizations—almost twice the previous season high in some parts of the United States.2
Regrettably, 171 unvaccinated children died during 2017–2018, accounting for almost 80% of deaths.2 The mean age of the children who died was 7.1 years; 51% had at least 1 underlying medical condition placing them at risk for influenza-related complications, and 57% died after hospitalization.2
Recent estimates of the incidence of symptomatic influenza among all ages ranged from 3% to 11%, which is slightly lower than historical estimates. The rates were higher for children under age 18 than for adults.3 Interestingly, influenza A(H3N2) accounted for 50% of cases of non-mumps viral parotitis during the 2014–2015 influenza season in the United States.4
Influenza C exists but is rare
Influenza A and B account for almost all influenza-related outpatient visits and hospitalizations. Surveillance data from May 2013 through December 2016 showed that influenza C accounts for 0.5% of influenza-related outpatient visits and hospitalizations, particularly affecting children ages 6 to 24 months. Medical comorbidities and copathogens were seen in all patients requiring intensive care and in most hospitalizations.5 Diagnostic tests for influenza C are not widely available.
Dogs and cats: Factories for new flu strains?
While pigs and birds are the major reservoirs of influenza viral genetic diversity from which infection is transmitted to humans, dogs and cats have recently emerged as possible sources of novel reassortant influenza A.6 With their frequent close contact with humans, our pets may prove to pose a significant threat.
Obesity a risk factor for influenza
Obesity emerged as a risk factor for severe influenza in the 2009 pandemic. Recent data also showed that obesity increases the duration of influenza A virus shedding, thus increasing duration of contagiousness.7
Influenza a cardiovascular risk factor
Previous data showed that influenza was a risk factor for cardiovascular events. Two recent epidemiologic studies from the United Kingdom showed that laboratory-confirmed influenza was associated with higher rates of myocardial infarction and stroke for up to 4 weeks.8,9
Which strain is the biggest threat?
Predicting which emerging influenza serotype may cause the next pandemic is difficult, but influenza A(H7N9), which had not infected humans until 2013 but has since infected about 1,600 people in China and killed 37% of them, appears to have the greatest potential.10
National influenza surveillance programs and influenza-related social media applications have been developed and may get a boost from technology. A smartphone equipped with a temperature sensor can instantly detect one’s temperature with great precision. A 2018 study suggested that a smartphone-driven thermometry application correlated well with national influenza-like illness activity and improved its forecast in real time and up to 3 weeks in advance.11
TRANSMISSION
Humidity may not block transmission
Animal studies have suggested that humidity in the air interferes with transmission of airborne influenza virus, partially from biologic inactivation. But when a recent study used humidity-controlled chambers to investigate the stability of the 2009 influenza A(H1N1) virus in suspended aerosols and stationary droplets, the virus remained infectious in aerosols across a wide range of relative humidities, challenging the common belief that humidity destabilizes respiratory viruses in aerosols.12
One sick passenger may not infect the whole plane
Transmission of respiratory viruses on airplane flights has long been considered a potential avenue for spreading influenza. However, a recent study that monitored movements of individuals on 10 transcontinental US flights and simulated inflight transmission based on these data showed a low probability of direct transmission, except for passengers seated in close proximity to an infectious passenger.13
WHAT’S IN THE NEW FLU SHOT?
The 2018–2019 quadrivalent vaccine for the Northern Hemisphere14 contains the following strains:
- A/Michigan/45/2015 A(H1N1)pdm09-like virus
- A/Singapore/INFIMH-16-0019/2016 (H3N2)-like virus
- B/Colorado/06/2017-like virus (Victoria lineage)
- B/Phuket/3073/2013-like virus (Yamagata lineage).
The A(H3N2) (Singapore) and B/Victoria lineage components are new this year. The A(H3N2) strain was the main cause of the 2018 influenza epidemic in the Southern Hemisphere.
The quadrivalent live-attenuated vaccine, which was not recommended during the 2016–2017 and 2017–2018 influenza seasons, has made a comeback and is recommended for the 2018–2019 season in people for whom it is appropriate based on age and comorbidities.15 Although it was effective against influenza B and A(H3N2) viruses, it was less effective against the influenza A(H1N1)pdm09-like viruses during the 2013–2014 and 2015–2016 seasons.
A/Slovenia/2903/2015, the new A(H1N1)pdm09-like virus included in the 2018–2019 quadrivalent live-attenuated vaccine, is significantly more immunogenic than its predecessor, A/Bolivia/559/2013, but its clinical effectiveness remains to be seen.
PROMOTING VACCINATION
How effective is it?
Influenza vaccine effectiveness in the 2017–2018 influenza season was 36% overall, 67% against A(H1N1), 42% against influenza B, and 25% against A(H3N2).16 It is estimated that influenza vaccine prevents 300 to 4,000 deaths annually in the United States alone.17
A 2018 Cochrane review17 concluded that vaccination reduced the incidence of influenza by about half, with 2.3% of the population contracting the flu without vaccination compared with 0.9% with vaccination (risk ratio 0.41, 95% confidence interval 0.36–0.47). The same review found that 71 healthy adults need to be vaccinated to prevent 1 from experiencing influenza, and 29 to prevent 1 influenza-like illness.
Several recent studies showed that influenza vaccine effectiveness varied based on age and influenza serotype, with higher effectiveness in people ages 5 to 17 and ages 18 to 64 than in those age 65 and older.18–20 A mathematical model of influenza transmission and vaccination in the United States determined that even relatively low-efficacy influenza vaccines can be very useful if optimally distributed across age groups.21
Vaccination rates are low, and ‘antivaxxers’ are on the rise
Although the influenza vaccine is recommended in the United States for all people age 6 months and older regardless of the state of their health, vaccination rates remain low. In 2016, only 37% of employed adults were vaccinated. The highest rate was for government employees (45%), followed by private employees (36%), followed by the self-employed (30%).22
A national goal is to immunize 80% of all Americans and 90% of at-risk populations (which include children and the elderly).23 The number of US hospitals that require their employees to be vaccinated increased from 37.1% in 2013 to 61.4% in 2017.24 Regrettably, as of March 2018, 14 lawsuits addressing religious objections to hospital influenza vaccination mandates have been filed.25
Despite hundreds of studies demonstrating the efficacy, safety, and cost savings of influenza vaccination, the antivaccine movement has been growing in the United States and worldwide.26 All US states except West Virginia, Mississippi, and California allow nonmedical exemptions from vaccination based on religious or personal belief.27 Several US metropolitan areas represent “hot spots” for these exemptions.28 This may render such areas vulnerable to vaccine-preventable diseases, including influenza.
Herd immunity: We’re all in this together
Some argue that the potential adverse effects and the cost of vaccination outweigh the benefits, but the protective benefits of herd immunity are significant for those with comorbidities or compromised immunity.
Educating the public about herd immunity and local influenza vaccination uptake increases people’s willingness to be vaccinated.29 A key educational point is that at least 70% of a community needs to be vaccinated to prevent community outbreaks; this protects everyone, including those who do not mount a protective antibody response to influenza vaccination and those who are not vaccinated.
DOES ANNUAL VACCINATION BLUNT ITS EFFECTIVENESS?
Some studies from the 1970s and 1980s raised concern over a possible negative effect of annual influenza vaccination on vaccine effectiveness. The “antigenic distance hypothesis” holds that vaccine effectiveness is influenced by antigenic similarity between the previous season’s vaccine serotypes and the epidemic serotypes, as well as the antigenic similarity between the serotypes of the current and previous seasons.
A meta-analysis of studies from 2010 through 2015 showed significant inconsistencies in repeat vaccination effects within and between seasons and serotypes. It also showed that vaccine effectiveness may be influenced by more than 1 previous season, particularly for influenza A(H3N2), in which repeated vaccination can blunt the hemagglutinin antibody response.30
A study from Japan showed that people who needed medical attention for influenza in the previous season were at lower risk of a similar event in the current season.31 Prior-season influenza vaccination reduced current-season vaccine effectiveness only in those who did not have medically attended influenza in the prior season. This suggests that infection is more immunogenic than vaccination, but only against the serotype causing the infection and not the other serotypes included in the vaccine.
An Australian study showed that annual influenza vaccination did not decrease vaccine effectiveness against influenza-associated hospitalization. Rather, effectiveness increased by about 15% in those vaccinated in both current and previous seasons compared with those vaccinated in either season alone.32
European investigators showed that repeated seasonal influenza vaccination in the elderly prevented the need for hospitalization due to influenza A(H3N2) and B, but not A(H1N1)pdm09.33
VACCINATION IN SPECIAL POPULATIONS
High-dose vaccine for older adults
The high-dose influenza vaccine has been licensed since 2009 for use in the United States for people ages 65 and older.
Recent studies confirmed that high-dose vaccine is more effective than standard-dose vaccine in veterans34 and US Medicare beneficiaries.35
The high-dose vaccine is rapidly becoming the primary vaccine given to people ages 65 and older in retail pharmacies, where vaccination begins earlier in the season than in providers’ offices.36 Some studies have shown that the standard-dose vaccine wanes in effectiveness toward the end of the influenza season (particularly if the season is long) if it is given very early. It remains to be seen whether the same applies to the high-dose influenza vaccine.
Some advocate twice-annual influenza vaccination, particularly for older adults living in tropical and subtropical areas, where influenza seasons are more prolonged. However, a recently published study observed reductions in influenza-specific hemagglutination inhibition and cell-mediated immunity after twice-annual vaccination.37
Vaccination is beneficial during pregnancy
Many studies have shown the value of influenza vaccination during pregnancy for both mothers and their infants.
One recently published study showed that 18% of infants who developed influenza required hospitalization.38 In that study, prenatal and postpartum maternal influenza vaccination decreased the odds of influenza in infants by 61% and 53%, respectively.
Another study showed that vaccine effectiveness did not vary by gestational age at vaccination.39
Some studies have shown that influenza virus infection can increase susceptibility to certain bacterial infections. A post hoc analysis of an influenza vaccination study in pregnant women suggested that the vaccine was also associated with decreased rates of pertussis in these women.40
Factors that make vaccination less effective
Several factors including age-related frailty and iatrogenic and disease-related immunosuppression can affect vaccine effectiveness.
Frailty. A recent study showed that vaccine effectiveness was 77.6% in nonfrail older adults but only 58.7% in frail older adults.41
Immunosuppression. Temporary discontinuation of methotrexate for 2 weeks after influenza vaccination in patients with rheumatoid arthritis improves vaccine immunogenicity without precipitating disease flare.42 Solid-organ and hematopoietic stem cell transplant recipients who received influenza vaccine were less likely to develop pneumonia and require intensive care unit admission.43
The high-dose influenza vaccine is more immunogenic than the standard-dose vaccine in solid-organ transplant recipients.44
Statins are widely prescribed and have recently been associated with reduced influenza vaccine effectiveness against medically attended acute respiratory illness, but their benefits in preventing cardiovascular events outweigh this risk.45
FUTURE VACCINE CONSIDERATIONS
Moving away from eggs
During the annual egg-based production process, which takes several months, the influenza vaccine acquires antigenic changes that allow replication in eggs, particularly in the hemagglutinin protein, which mediates receptor binding. This process of egg adaptation may cause antigenic changes that decrease vaccine effectiveness against circulating viruses.
The cell-based baculovirus influenza vaccine grown in dog kidney cells has higher antigenic content and is not subject to the limitations of egg-based vaccine, although it still requires annual updates. A recombinant influenza vaccine reduces the probability of influenza-like illness by 30% compared with the egg-based influenza vaccine, but also still requires annual updates.46 The market share of these non-egg-based vaccines is small, and thus their effectiveness has yet to be demonstrated.
The US Department of Defense administered the cell-based influenza vaccine to about one-third of Armed Forces personnel, their families, and retirees in the 2017–2018 influenza seasons, and data on its effectiveness are expected in the near future.47
A universal vaccine would be ideal
The quest continues for a universal influenza vaccine, one that remains protective for several years and does not require annual updates.48 Such a vaccine would protect against seasonal epidemic influenza drift variants and pandemic strains. More people could likely be persuaded to be vaccinated once rather than every year.
An ideal universal vaccine would be suitable for all age groups, at least 75% effective against symptomatic influenza virus infection, protective against all influenza A viruses (influenza A, not B, causes pandemics and seasonal epidemics), and durable through multiple influenza seasons.51
Research and production of such a vaccine are expected to require funding of about $1 billion over the next 5 years.
Boosting effectiveness
Estimates of influenza vaccine effectiveness range from 40% to 60% in years when the vaccine viruses closely match the circulating viruses, and variably lower when they do not match. The efficacy of most other vaccines given to prevent other infections is much higher.
New technologies to improve influenza vaccine effectiveness are needed, particularly for influenza A(H3N2) viruses, which are rapidly evolving and are highly susceptible to egg-adaptive mutations in the manufacturing process.
In one study, a nanoparticle vaccine formulated with a saponin-based adjuvant induced hemagglutination inhibition responses that were even greater than those induced by the high-dose vaccine.52
Immunoglobulin A (IgA) may be a more effective vaccine target than traditional influenza vaccines that target IgG, since different parts of IgA may engage the influenza virus simultaneously.53
Vaccines can be developed more quickly than in the past. The timeline from viral sequencing to human studies with deoxyribonucleic acid plasmid vaccines decreased from 20 months in 2003 for the severe acquired respiratory syndrome coronavirus to 11 months in 2006 for influenza A/Indonesia/2006 (H5), to 4 months in 2009 for influenza A/California/2009 (H1), to 3.5 months in 2016 for Zika virus.54 This is because it is possible today to sequence a virus and insert the genetic material into a vaccine platform without ever having to grow the virus.
TREATMENT
Numerous studies have found anti-influenza medications to be effective. Nevertheless, in an analysis of the 2011–2016 influenza seasons, only 15% of high-risk patients were prescribed anti-influenza medications within 2 days of symptom onset, including 37% in those with laboratory-confirmed influenza.55 Fever was associated with an increased rate of antiviral treatment, but 25% of high-risk outpatients were afebrile. Empiric treatment of 4 high-risk outpatients with acute respiratory illness was needed to treat 1 patient with influenza.55
Treatment with a neuraminidase inhibitor within 2 days of illness has recently been shown to improve survival and shorten duration of viral shedding in patients with avian influenza A(H7N9) infection.56 Antiviral treatment within 2 days of illness is associated with improved outcomes in transplant recipients57 and with a lower risk of otitis media in children.58
Appropriate anti-influenza treatment is as important as avoiding unnecessary antibiotics. Regrettably, as many as one-third of patients with laboratory-confirmed influenza are prescribed antibiotics.59
The US Food and Drug Administration warns against fraudulent unapproved over-the-counter influenza products.60
Baloxavir marboxil
Baloxavir marboxil is a new anti-influenza medication approved in Japan in February 2018 and anticipated to be available in the United States sometime in 2019.
This prodrug is hydrolyzed in vivo to the active metabolite, which selectively inhibits cap-dependent endonuclease enzyme, a key enzyme in initiation of messenger ribonucleic acid synthesis required for influenza viral replication.61
In a double-blind phase 3 trial, the median time to alleviation of influenza symptoms is 26.5 hours shorter with baloxavir marboxil than with placebo. One tablet was as effective as 5 days of the neuraminidase inhibitor oseltamivir and was associated with greater reduction in viral load 1 day after initiation, and similar side effects.62 Of concern is the emergence of nucleic acid substitutions conferring resistance to baloxavir; this occurred in 2.2% and 9.7% of baloxavir recipients in the phase 2 and 3 trials, respectively.
CLOSING THE GAPS
Several gaps in the management of influenza persist since the 1918 pandemic.1 These include gaps in epidemiology, prevention, diagnosis, treatment, and prognosis.
- Global networks wider than current ones are needed to address this global disease and to prioritize coordination efforts.
- Establishing and strengthening clinical capacity is needed in limited resource settings. New technologies are needed to expedite vaccine development and to achieve progress toward a universal vaccine.
- Current diagnostic tests do not distinguish between seasonal and novel influenza A viruses of zoonotic origin, which are expected to cause the next pandemic.
- Current antivirals have been shown to shorten duration of illness in outpatients with uncomplicated influenza, but the benefit in hospitalized patients has been less well established.
- In 2007, resistance of seasonal influenza A(H1N1) to oseltamivir became widespread. In 2009, pandemic influenza A(H1N1), which is highly susceptible to oseltamivir, replaced the seasonal virus and remains the predominantly circulating A(H1N1) strain.
- A small-molecule fragment, N-cyclohexyaltaurine, binds to the conserved hemagglutinin receptor-binding site in a manner that mimics the binding mode of the natural receptor sialic acid. This can serve as a template to guide the development of novel broad-spectrum small-molecule anti-influenza drugs.63
- Biomarkers that can accurately predict development of severe disease in patients with influenza are needed.
- Uyeki TM, Fowler RA, Fischer WA. Gaps in the clinical management of influenza: a century since the 1918 pandemic. JAMA 2018; 320(8):755–756. doi:10.1001/jama.2018.8113
- Garten R, Blanton L, Elal AI, et al. Update: influenza activity in the United States during the 2017–18 season and composition of the 2018–19 influenza vaccine. MMWR Morb Mortal Wkly Rep 2018; 67(22):634–642. doi:10.15585/mmwr.mm6722a4
- Tokars JI, Olsen SJ, Reed C. Seasonal incidence of symptomatic influenza in the United States. Clin Infect Dis 2018; 66(10):1511–1518. doi:10.1093/cid/cix1060
- Elbadawi LI, Talley P, Rolfes MA, et al. Non-mumps viral parotitis during the 2014–2015 influenza season in the United States. Clin Infect Dis 2018. Epub ahead of print. doi:10.1093/cid/ciy137
- Thielen BK, Friedlander H, Bistodeau S, et al. Detection of influenza C viruses among outpatients and patients hospitalized for severe acute respiratory infection, Minnesota, 2013–2016. Clin Infect Dis 2018; 66(7):1092–1098. doi:10.1093/cid/cix931
- Chena Y, Trovãob NS, Wang G, et al. Emergence and evolution of novel reassortant influenza A viruses in canines in southern China. MBio 2018; 9(3):e00909–e00918. doi:10.1128/mBio.00909-18
- Maier HE, Lopez R, Sanchez N, et al. Obesity increases the duration of influenza A virus shedding in adults. J Infect Dis 2018. Epub ahead of print. doi:10.1093/infdis/jiy370
- Warren-Gash C, Blackburn R, Whitaker H, McMenamin J, Hayward AC. Laboratory-confirmed respiratory infections as triggers for acute myocardial infarction and stroke: a self-controlled case series analysis of national linked datasets from Scotland. Eur Respir J 2018; 51(3):1701794. doi:10.1183/13993003.01794-2017
- Blackburn R, Zhao H, Pebody R, Hayward A, Warren-Gash C. Laboratory-confirmed respiratory infections as predictors of hospital admission for myocardial infarction and stroke: time-series analysis of English data for 2004–2015. Clin Infect Dis 2018; 67(1):8–17. doi:10.1093/cid/cix1144
- Newsweek; Andrew S. What is disease X? Deadly bird flu virus could be next pandemic. www.newsweek.com/disease-x-bird-flu-deaths-pandemic-what-h7n9-979723. Accessed October 3, 2018.
- Miller AC, Singh I, Koehler E, Polgreen PM. A smartphone-driven thermometer application for real-time population- and individual-level influenza surveillance. Clin Infect Dis 2018; 67(3):388–397. doi:10.1093/cid/ciy073
- Kormuth KA, Lin K, Prussin AJ 2nd, et al. Influenza virus infectivity is retained in aerosols and droplets independent of relative humidity, J Infect Dis 2018; 218(5):739–747. doi:10.1093/infdis/jiy221
- Hertzberg VS, Weiss H, Elon L, et. al. Behaviors, movements, and transmission of droplet-mediated respiratory diseases during transcontinental airline flights. Proc Natl Acad Sci U S A 2018; 115(14):3623–3627. doi:10.1073/pnas.1711611115
- Grohskopf LA, Sokolow LZ, Broder KR, Walter EB, Fry AM, Jernigan DB. Prevention and control of seasonal influenza with vaccines: recommendations of the Advisory Committee on Immunization Practices—United States, 2018–19 influenza season. MMWR Recomm Rep 2018; 67(3):1–20. doi:10.15585/mmwr.rr6703a1
- Grohskopf LA, Sokolow LZ, Fry AM, Walter EB, Jernigan DB. Update: ACIP recommendations for the use of quadrivalent live attenuated influenza vaccine (LAIV4)—United States, 2018–19 influenza season. MMWR Morb Mortal Wkly Rep 2018; 67(22):643–645. doi:10.15585/mmwr.mm6722a5
- Flannery B, Chung JR, Belongia EA, et al. Interim estimates of 2017–18 seasonal influenza vaccine effectiveness—United States, February 2018. MMWR Morb Mortal Wkly Rep 2018; 67(6):180–185. doi:10.15585/mmwr.mm6706a2
- Demicheli V, Jefferson T, Ferroni E, Rivetti A, Di Pietrantonj C. Vaccines for preventing influenza in healthy adults. Cochrane Database Syst Rev 2018; 2:CD001269. doi:10.1002/14651858.CD001269.pub6
- Flannery B, Smith C, Garten RJ, et al. Influence of birth cohort on effectiveness of 2015–2016 influenza vaccine against medically attended illness due to 2009 pandemic influenza A(H1N1) virus in the United States. J Infect Dis 2018; 218(2):189–196. doi:10.1093/infdis/jix634
- Rondy M, El Omeiri N, Thompson MG, Leveque A, Moren A, Sullivan SG. Effectiveness of influenza vaccines in preventing severe influenza illness among adults: a systematic review and meta-analysis of test-negative design case-control studies. J Infect 2017; 75(5):381–394. doi:10.1016/j.jinf.2017.09.010
- Stein Y, Mandelboim M, Sefty H, et al; Israeli Influenza Surveillance Network (IISN). Seasonal influenza vaccine effectiveness in preventing laboratory-confirmed influenza in primary care in Israel, 2016–2017 season: insights into novel age-specific analysis. Clin Infect Dis 2018; 66(9):1383–1391. doi:10.1093/cid/cix1013
- Sah P, Medlock J, Fitzpatrick MC, Singer BH, Galvani AP. Optimizing the impact of low-efficacy influenza vaccines. Proc Natl Acad Sci U S A 2018; 115(20):5151–5156. doi:10.1073/pnas.1802479115
- QuickStats: percentage of currently employed adults aged ≥ 18 years who received influenza vaccine in the past 12 months, by employment category—national health interview survey, United States, 2012 and 2016. MMWR Morb Mortal Wkly Rep 2018; 67(16):480. doi:10.15585/mmwr.mm6716a8
- Healthy People.gov. Immunization and infectious diseases. IID-12. Increase the percentage of children and adults who are vaccinated annually against seasonal influenza. www.healthypeople.gov/2020/topics-objectives/topic/immunization-and-infectious-diseases/objectives. Accessed October 3, 2018.
- Greene MT, Fowler KE, Ratz D, Krein SL, Bradley SF, Saint S. Changes in influenza vaccination requirements for health care personnel in US hospitals. JAMA Network Open 2018; 1(2):e180143. doi:10.1001/jamanetworkopen.2018.0143
- Opel DJ, Sonne JA, Mello MM. Vaccination without litigation—addressing religious objections to hospital influenza-vaccination mandates. N Engl J Med 2018; 378(9):785–788. doi:10.1056/NEJMp1716147
- Horowitz J. Italy loosens vaccine law just as children return to school. New York Times Sept. 20, 2018. www.nytimes.com/2018/09/20/world/europe/italy-vaccines-five-star-movement.html.
- National Conference of State Legislature. States with religious and philosophical exemptions from school immunization requirements. www.ncsl.org/research/health/school-immunization-exemption-state-laws.aspx. Accessed October 3, 2018.
- Olive JK, Hotez PJ, Damania A, Nolan MS. The state of the antivaccine movement in the United States: a focused examination of nonmedical exemptions in states and counties. PLoS Med 2018; 15(6):e1002578. doi:10.1371/journal.pmed.1002578
- Logan J, Nederhoff D, Koch B, et al. ‘What have you HEARD about the HERD?’ Does education about local influenza vaccination coverage and herd immunity affect willingness to vaccinate? Vaccine 2018; 36(28):4118–4125. doi:10.1016/j.vaccine.2018.05.037
- Belongia EA, Skowronski DM, McLean HQ, Chambers C, Sundaram ME, De Serres G. Repeated annual influenza vaccination and vaccine effectiveness: review of evidence. Expert Rev Vaccines 2017; 16(7):1–14. doi:10.1080/14760584.2017.1334554
- Saito N, Komori K, Suzuki M, et al. Negative impact of prior influenza vaccination on current influenza vaccination among people infected and not infected in prior season: a test-negative case-control study in Japan. Vaccine 2017; 35(4):687–693. doi:10.1016/j.vaccine.2016.11.024
- Cheng AC, Macartney KK, Waterer GW, Kotsimbos T, Kelly PM, Blyth CC; Influenza Complications Alert Network (FluCAN) Investigators. Repeated vaccination does not appear to impact upon influenza vaccine effectiveness against hospitalization with confirmed influenza. Clin Infect Dis 2017; 64(11):1564–1572. doi:10.1093/cid/cix209
- Rondy M, Launay O, Castilla J, et al; InNHOVE/I-MOVE+working group. Repeated seasonal influenza vaccination among elderly in Europe: effects on laboratory confirmed hospitalised influenza. Vaccine 2017; 35(34):4298–4306. doi:10.1016/j.vaccine.2017.06.088
- Young-Xu Y, van Aalst R, Mahmud SM, et al. Relative vaccine effectiveness of high-dose versus standard-dose influenza vaccines among Veterans Health Administration patients. J Infect Dis 2018; 217(11):1718–1727. doi:10.1093/infdis/jiy088
- Shay DK, Chillarige Y, Kelman J, et al. Comparative effectiveness of high-dose versus standard-dose influenza vaccines among US Medicare beneficiaries in preventing postinfluenza deaths during 2012–2013 and 2013–2014. J Infect Dis 2017; 215(4):510–517. doi:10.1093/infdis/jiw641
- Madaras-Kelly K, Remington R, Hruza H, Xu D. Comparative effectiveness of high-dose versus standard-dose influenza vaccines in preventing postinfluenza deaths. J Infect Dis 2018; 218(2):336–337. doi:10.1093/infdis/jix645
- Tam YH, Valkenburg SA, Perera RAPM, et al. Immune responses to twice-annual influenza vaccination in older adults in Hong Kong. Clin Infect Dis 2018; 66(6):904–912. doi:10.1093/cid/cix900
- Ohfuji S, Deguchi M, Tachibana D, et al; Osaka Pregnant Women Influenza Study Group. Protective effect of maternal influenza vaccination on influenza in their infants: a prospective cohort study. J Infect Dis 2018; 217(6):878–886. doi:10.1093/infdis/jix629
- Katz J, Englund JA, Steinhoff MC, et al. Impact of timing of influenza vaccination in pregnancy on transplacental antibody transfer, influenza incidence, and birth outcomes: a randomized trial in rural Nepal. Clin Infect Dis 2018; 67(3):334–340. doi:10.1093/cid/ciy090
- Nunes MC, Cutland CL, Madhi SA. Influenza vaccination during pregnancy and protection against pertussis. N Engl J Med 2018; 378(13):1257–1258. doi:10.1056/NEJMc1705208
- Andrew MK, Shinde V, Ye L, et al; Serious Outcomes Surveillance Network of the Public Health Agency of Canada/Canadian Institutes of Health Research Influenza Research Network (PCIRN) and the Toronto Invasive Bacterial Diseases Network (TIBDN). The importance of frailty in the assessment of influenza vaccine effectiveness against influenza-related hospitalization in elderly people. J Infect Dis 2017; 216(4):405–414. doi:10.1093/infdis/jix282
- Park JK, Lee YJ, Shin K, et al. Impact of temporary methotrexate discontinuation for 2 weeks on immunogenicity of seasonal influenza vaccination in patients with rheumatoid arthritis: a randomised clinical trial. Ann Rheum Dis 2018; 77(6):898–904. doi:10.1136/annrheumdis-2018-213222
- Kumar D, Ferreira VH, Blumberg E, et al. A five-year prospective multi-center evaluation of influenza infection in transplant recipients. Clin Infect Dis 2018. Epub ahead of print. doi:10.1093/cid/ciy294
- Natori Y, Shiotsuka M, Slomovic J, et al. A double-blind, randomized trial of high-dose vs standard-dose influenza vaccine in adult solid-organ transplant recipients. Clin Infect Dis 2018; 66(11):1698–1704. doi:10.1093/cid/cix1082
- Omer SB, Phadke VK, Bednarczyk BA, Chamberlain AT, Brosseau JL, Orenstein WA. Impact of statins on influenza vaccine effectiveness against medically attended acute respiratory illness. J Infect Dis 2016; 213(8):1216–1223. doi:10.1093/infdis/jiv457
- Dunkle LM, Izikson R, Patriarca P, et al. Efficacy of recombinant influenza vaccine in adults 50 years of age or older. N Engl J Med 2017; 376(25):2427–2436. doi:10.1056/NEJMoa1608862
- STAT; Branswell H. How the US military might help answer a critical question about the flu vaccine. www.statnews.com/2018/03/02/flu-vaccine-egg-production-data. Accessed October 3, 2018.
- Paules CI, Sullivan SG, Subbarao K, Fauci AS. Chasing seasonal influenza—the need for a universal influenza vaccine. N Engl J Med 2018; 378(1):7–9. doi:10.1056/NEJMp1714916
- Jin XW, Mossad SB. Avian influenza: an emerging pandemic threat. Cleve Clin J Med 2005; 72:1129-1134. pmid:16392727
- Wei WI, Brunger AT, Skehel JJ, Wiley DC. Refinement of the influenza virus hemagglutinin by simulated annealing. J Mol Biol 1990; 212(4):737–761. doi:10.1016/0022-2836(90)90234-D
- Erbelding EJ, Post DJ, Stemmy EJ, et al. A universal influenza vaccine: the strategic plan for the National Institute of Allergy and Infectious Diseases, J Infect Dis 2018; 218(3):347–354. doi:10.1093/infdis/jiy103
- Shinde V, Fries L, Wu Y, et al. Improved titers against influenza drift variants with a nanoparticle vaccine. N Engl J Med 2018; 378(24):2346–2348. doi:10.1056/NEJMc1803554
- Maurer MA, Meyer L, Bianchi M, et al. Glycosylation of human IgA directly inhibits influenza A and other sialic-acid-binding viruses. Cell Rep 2018; 23(1):90–99. doi:10.1016/j.celrep.2018.03.027
- Graham BS, Mascola JR, Fauci AS. Novel vaccine technologies: essential components of an adequate response to emerging viral diseases. JAMA 2018; 319(14):1431–1432. doi:10.1001/jama.2018.0345
- Stewart RJ, Flannery B, Chung JR, et al. Influenza antiviral prescribing for outpatients with an acute respiratory illness and at high risk for influenza-associated complications during 5 influenza seasons—United States, 2011–2016. Clin Infect Dis 2018; 66(7):1035–1041. doi:10.1093/cid/cix922
- Zheng S, Tang L, Gao H, et al. Benefit of early initiation of neuraminidase inhibitor treatment to hospitalized patients with avian influenza A(H7N9) virus. Clin Infect Dis 2018; 66(7):1054–1060. doi:10.1093/cid/cix930
- Kumar D, Ferreira VH, Blumberg E, et al. A five-year prospective multi-center evaluation of influenza infection in transplant recipients. Clin Infect Dis 2018. Epub ahead of print. doi:10.1093/cid/ciy294
- Malosh RE, Martin ET, Heikkinen T, Brooks WA, Whitley RJ, Monto AS. Efficacy and safety of oseltamivir in children: systematic review and individual patient data meta-analysis of randomized controlled trials. Clin Infect Dis 2018; 66(10):1492–1500. doi:10.1093/cid/cix1040
- Havers FP, Hicks LA, Chung JR, et al. Outpatient antibiotic prescribing for acute respiratory infections during influenza seasons. JAMA Network Open 2018; 1(2):e180243. doi:10.1001/jamanetworkopen.2018.0243
- US Food and Drug Administration. FDA warns of fraudulent and unapproved flu products. www.fda.gov/newsevents/newsroom/pressannouncements/ucm599223.htm. Accessed October 3, 2018.
- Portsmouth S, Kawaguchi K, Arai M, Tsuchiya K, Uehara T. Cap-dependent endonuclease inhibitor S-033188 for the treatment of influenza: results from a phase 3, randomized, double-blind, placebo- and active-controlled study in otherwise healthy adolescents and adults with seasonal influenza. Open Forum Infect Dis 2017; 4(suppl 1):S734. doi:10.1093/ofid/ofx180.001
- Hayden FG, Sugaya N, Hirotsu N, et al; Baloxavir Marboxil Investigators Group. Baloxavir Marboxil for uncomplicated influenza in adults and adolescents. N Engl J Med 2018; 379(10):913–923. doi:10.1056/NEJMoa1716197
- Kadam RU, Wilson IA. A small-molecule fragment that emulates binding of receptor and broadly neutralizing antibodies to influenza A hemagglutinin. Proc Natl Acad Sci U S A 2018; 115(16):4240–4245. doi:10.1073/pnas.1801999115
KEY POINTS
- Influenza A(H7N9) is a prime candidate to cause the next influenza pandemic.
- Influenza vaccine prevents 300 to 4,000 deaths in the United States every year.
- The 2018–2019 quadrivalent influenza vaccine contains updated A(H3N2) and B/Victoria lineage components different from those in the 2017–2018 Northern Hemisphere vaccine.
- The live-attenuated influenza vaccine, which was not recommended during the 2016–2017 and 2017–2018 influenza seasons, is recommended for the 2018–2019 influenza season.
- Influenza vaccine is recommended any time during pregnancy and is associated with lower infant mortality rates.
- Overall influenza vaccination rates remain below the 80% target for all Americans and 90% for at-risk populations.
Renal vein thrombosis and pulmonary embolism
A 49-year-old man developed nephrotic-range proteinuria (urine protein–creatinine ratio 4.1 g/g), and primary membranous nephropathy was diagnosed by kidney biopsy. He declined therapy apart from angiotensin receptor blockade.
Five months after undergoing the biopsy, he presented to the emergency room with marked dyspnea, cough, and epigastric discomfort. His blood pressure was 160/100 mm Hg, heart rate 95 beats/minute, and oxygen saturation by pulse oximetry 97% at rest on ambient air, decreasing to 92% with ambulation.
Initial laboratory testing results were as follows:
- Sodium 135 mmol/L (reference range 136–144)
- Potassium 3.9 mmol/L (3.7–5.1)
- Chloride 104 mmol/L (97–105)
- Bicarbonate 21 mmol/L (22–30)
- Blood urea nitrogen 14 mg/dL (9–24)
- Serum creatinine 1.1 mg/dL (0.73–1.22)
- Albumin 2.1 g/dL (3.4–4.9).
Urinalysis revealed the following:
- 5 red blood cells per high-power field, compared with 1 to 2 previously
- 3+ proteinuria
- Urine protein–creatinine ratio 11 g/g
- No glucosuria.
Electrocardiography revealed normal sinus rhythm without ischemic changes. Chest radiography did not show consolidation.
.")
.")
At 7 months after the thrombotic event, there was no evidence of residual renal vein thrombosis on magnetic resonance venography, and at 14 months his serum creatinine level was 0.9 mg/dL, albumin 4.0 g/dL, and urine protein–creatinine ratio 0.8 g/g.
RENAL VEIN THROMBOSIS: RISK FACTORS AND CLINICAL FEATURES
Severe hypoalbuminemia in the setting of nephrotic syndrome due to membranous nephropathy is associated with the highest risk of venous thromboembolic events, with renal vein thrombus being the classic complication.1 Venous thromboembolic events also occur in other nephrotic syndromes, albeit at a lower frequency.2
Venous thromboembolic events are estimated to occur in 7% to 33% of patients with membranous glomerulopathy, with albumin levels less than 2.8 g/dL considered a notable risk factor.1,2
While often a chronic complication, acute renal vein thrombosis may present with flank pain and hematuria.3 In our patient, the dramatic increase in proteinuria and possibly the increase in hematuria suggested renal vein thrombosis. Proximal tubular dysfunction, such as glucosuria, can be seen on occasion.
DIAGNOSIS AND TREATMENT
Screening asymptomatic patients for renal vein thrombosis is not recommended, and the decision to start prophylactic anticoagulation must be individualized.4
Although renal venography historically was the gold standard test to diagnose renal vein thrombosis, it has been replaced by noninvasive imaging such as computed tomography and magnetic resonance venography.
While anticoagulation remains the treatment of choice, catheter-directed thrombectomy or surgical thrombectomy can be considered for some patients with acute renal vein thrombosis.5
- Couser WG. Primary membranous nephropathy. Clin J Am Soc Nephrol 2017; 12(6):983–997. doi:10.2215/CJN.11761116
- Barbour SJ, Greenwald A, Djurdjev O, et al. Disease-specific risk of venous thromboembolic events is increased in idiopathic glomerulonephritis. Kidney Int 2012; 81(2):190–195. doi:10.1038/ki.2011.312
- Lionaki S, Derebail VK, Hogan SL, et al. Venous thromboembolism in patients with membranous nephropathy. Clin J Am Soc Nephrol 2012; 7(1):43–51. doi:10.2215/CJN.04250511
- Lee T, Biddle AK, Lionaki S, et al. Personalized prophylactic anticoagulation decision analysis in patients with membranous nephropathy. Kidney Int 2014; 85(6):1412–1420. doi:10.1038/ki.2013.476
- Jaar BG, Kim HS, Samaniego MD, Lund GB, Atta MG. Percutaneous mechanical thrombectomy: a new approach in the treatment of acute renal-vein thrombosis. Nephrol Dial Transplant 2002; 17(6):1122–1125. pmid:12032209
A 49-year-old man developed nephrotic-range proteinuria (urine protein–creatinine ratio 4.1 g/g), and primary membranous nephropathy was diagnosed by kidney biopsy. He declined therapy apart from angiotensin receptor blockade.
Five months after undergoing the biopsy, he presented to the emergency room with marked dyspnea, cough, and epigastric discomfort. His blood pressure was 160/100 mm Hg, heart rate 95 beats/minute, and oxygen saturation by pulse oximetry 97% at rest on ambient air, decreasing to 92% with ambulation.
Initial laboratory testing results were as follows:
- Sodium 135 mmol/L (reference range 136–144)
- Potassium 3.9 mmol/L (3.7–5.1)
- Chloride 104 mmol/L (97–105)
- Bicarbonate 21 mmol/L (22–30)
- Blood urea nitrogen 14 mg/dL (9–24)
- Serum creatinine 1.1 mg/dL (0.73–1.22)
- Albumin 2.1 g/dL (3.4–4.9).
Urinalysis revealed the following:
- 5 red blood cells per high-power field, compared with 1 to 2 previously
- 3+ proteinuria
- Urine protein–creatinine ratio 11 g/g
- No glucosuria.
Electrocardiography revealed normal sinus rhythm without ischemic changes. Chest radiography did not show consolidation.
At 7 months after the thrombotic event, there was no evidence of residual renal vein thrombosis on magnetic resonance venography, and at 14 months his serum creatinine level was 0.9 mg/dL, albumin 4.0 g/dL, and urine protein–creatinine ratio 0.8 g/g.
RENAL VEIN THROMBOSIS: RISK FACTORS AND CLINICAL FEATURES
Severe hypoalbuminemia in the setting of nephrotic syndrome due to membranous nephropathy is associated with the highest risk of venous thromboembolic events, with renal vein thrombus being the classic complication.1 Venous thromboembolic events also occur in other nephrotic syndromes, albeit at a lower frequency.2
Venous thromboembolic events are estimated to occur in 7% to 33% of patients with membranous glomerulopathy, with albumin levels less than 2.8 g/dL considered a notable risk factor.1,2
While often a chronic complication, acute renal vein thrombosis may present with flank pain and hematuria.3 In our patient, the dramatic increase in proteinuria and possibly the increase in hematuria suggested renal vein thrombosis. Proximal tubular dysfunction, such as glucosuria, can be seen on occasion.
DIAGNOSIS AND TREATMENT
Screening asymptomatic patients for renal vein thrombosis is not recommended, and the decision to start prophylactic anticoagulation must be individualized.4
Although renal venography historically was the gold standard test to diagnose renal vein thrombosis, it has been replaced by noninvasive imaging such as computed tomography and magnetic resonance venography.
While anticoagulation remains the treatment of choice, catheter-directed thrombectomy or surgical thrombectomy can be considered for some patients with acute renal vein thrombosis.5
- Couser WG. Primary membranous nephropathy. Clin J Am Soc Nephrol 2017; 12(6):983–997. doi:10.2215/CJN.11761116
- Barbour SJ, Greenwald A, Djurdjev O, et al. Disease-specific risk of venous thromboembolic events is increased in idiopathic glomerulonephritis. Kidney Int 2012; 81(2):190–195. doi:10.1038/ki.2011.312
- Lionaki S, Derebail VK, Hogan SL, et al. Venous thromboembolism in patients with membranous nephropathy. Clin J Am Soc Nephrol 2012; 7(1):43–51. doi:10.2215/CJN.04250511
- Lee T, Biddle AK, Lionaki S, et al. Personalized prophylactic anticoagulation decision analysis in patients with membranous nephropathy. Kidney Int 2014; 85(6):1412–1420. doi:10.1038/ki.2013.476
- Jaar BG, Kim HS, Samaniego MD, Lund GB, Atta MG. Percutaneous mechanical thrombectomy: a new approach in the treatment of acute renal-vein thrombosis. Nephrol Dial Transplant 2002; 17(6):1122–1125. pmid:12032209
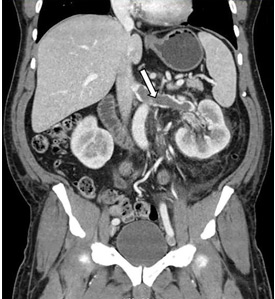
Back pain as a sign of inferior vena cava filter complications
A 63-year-old woman presented with an acute exacerbation of chronic back pain after a fall. She was taking warfarin because of a history of factor V Leiden, deep vein thrombosis, and pulmonary embolism, for which a temporary inferior vena cava (IVC) filter had been placed 8 years ago. Her physicians had subsequently tried to remove the filter, without success. Some time after that, 1 of the filter struts had been removed after it migrated through her abdominal wall.
Laboratory testing revealed a supratherapeutic international normalized ratio of 8.5.


The patient underwent endovascular aneurysm repair with adequate placement of a vascular graft. She was discharged on therapeutic anticoagulation, and her back pain had notably improved.
COMPLICATIONS OF IVC FILTERS
In the United States, the use of IVC filters has increased significantly over the last decade, with placement rates ranging from 12% to 17% in patients with venous thromboembolism.1
The American Heart Association recommends filter placement for patients with venous thromboembolism for whom anticoagulation has failed or is contraindicated, patients unable to withstand pulmonary embolism, and patients who are hemodynamically unstable.2 While indications vary in the guidelines released by different societies, filters are most often placed in patients who have an acute bleed, significant surgery after admission for venous thromboembolism, metastatic cancer, and severe illness.3
Complications can occur during and after insertion and during removal. They are more frequent with temporary than with permanent filters, and include filter movement and fracture as well as occlusion and penetration.4,5
In our patient, we believe that the 3 remaining filter struts likely penetrated the wall of the IVC to the extent that they encountered adjacent structures (aorta, duodenum, kidney).
Of cases of IVC filter penetration reported to a US Food and Drug Administration database, 13.1% involved small bowel perforation, 6.5% involved aortic perforation, and 4.2% involved retroperitoneal bleeding. Symptoms such as abdominal and back pain were present in 38.3% of cases involving IVC penetration.5
Therefore, the differential diagnosis for patients with a history of IVC filter placement presenting with these symptoms should address filter complications, including occlusion, incorrect placement, fracture, migration, and penetration of the filter.4 If complications occur, treatment options include anticoagulation, endovascular repair, and surgical intervention.
- Alkhouli M, Bashir R. Inferior vena cava filters in the United States: less is more. Int J Cardiol 2014; 177(3):742–743. doi:10.1016/j.ijcard.2014.08.010
- Jaff MR, McMurtry MS, Archer SL, et al; American Heart Association Council on Cardiopulmonary, Critical Care, Perioperative and Resuscitation; American Heart Association Council on Peripheral Vascular Disease; American Heart Association Council on Arteriosclerosis, Thrombosis and Vascular Biology. Management of massive and submassive pulmonary embolism, iliofemoral deep vein thrombosis, and chronic thromboembolic pulmonary hypertension: a scientific statement from the American Heart Association. Circulation 2011; 123(16):1788–1830. doi:10.1161/CIR.0b013e318214914f
- White RH, Geraghty EM, Brunson A, et al. High variation between hospitals in vena cava filter use for venous thromboembolism. JAMA Intern Med 2013; 173(7):506–512. doi:10.1001/jamainternmed.2013.2352
- Sella DM, Oldenburg WA. Complications of inferior vena cava filters. Semin Vasc Surg 2013; 26(1):23–28. doi:10.1053/j.semvascsurg.2013.04.005
- Andreoli JM, Lewandowski RJ, Vogelzang RL, Ryu RK. Comparison of complication rates associated with permanent and retrievable inferior vena cava filters: a review of the MAUDE database. J Vasc Interv Radiol 2014; 25(8):1181–1185. doi:10.1016/j.jvir.2014.04.016
A 63-year-old woman presented with an acute exacerbation of chronic back pain after a fall. She was taking warfarin because of a history of factor V Leiden, deep vein thrombosis, and pulmonary embolism, for which a temporary inferior vena cava (IVC) filter had been placed 8 years ago. Her physicians had subsequently tried to remove the filter, without success. Some time after that, 1 of the filter struts had been removed after it migrated through her abdominal wall.
Laboratory testing revealed a supratherapeutic international normalized ratio of 8.5.
The patient underwent endovascular aneurysm repair with adequate placement of a vascular graft. She was discharged on therapeutic anticoagulation, and her back pain had notably improved.
COMPLICATIONS OF IVC FILTERS
In the United States, the use of IVC filters has increased significantly over the last decade, with placement rates ranging from 12% to 17% in patients with venous thromboembolism.1
The American Heart Association recommends filter placement for patients with venous thromboembolism for whom anticoagulation has failed or is contraindicated, patients unable to withstand pulmonary embolism, and patients who are hemodynamically unstable.2 While indications vary in the guidelines released by different societies, filters are most often placed in patients who have an acute bleed, significant surgery after admission for venous thromboembolism, metastatic cancer, and severe illness.3
Complications can occur during and after insertion and during removal. They are more frequent with temporary than with permanent filters, and include filter movement and fracture as well as occlusion and penetration.4,5
In our patient, we believe that the 3 remaining filter struts likely penetrated the wall of the IVC to the extent that they encountered adjacent structures (aorta, duodenum, kidney).
Of cases of IVC filter penetration reported to a US Food and Drug Administration database, 13.1% involved small bowel perforation, 6.5% involved aortic perforation, and 4.2% involved retroperitoneal bleeding. Symptoms such as abdominal and back pain were present in 38.3% of cases involving IVC penetration.5
Therefore, the differential diagnosis for patients with a history of IVC filter placement presenting with these symptoms should address filter complications, including occlusion, incorrect placement, fracture, migration, and penetration of the filter.4 If complications occur, treatment options include anticoagulation, endovascular repair, and surgical intervention.
- Alkhouli M, Bashir R. Inferior vena cava filters in the United States: less is more. Int J Cardiol 2014; 177(3):742–743. doi:10.1016/j.ijcard.2014.08.010
- Jaff MR, McMurtry MS, Archer SL, et al; American Heart Association Council on Cardiopulmonary, Critical Care, Perioperative and Resuscitation; American Heart Association Council on Peripheral Vascular Disease; American Heart Association Council on Arteriosclerosis, Thrombosis and Vascular Biology. Management of massive and submassive pulmonary embolism, iliofemoral deep vein thrombosis, and chronic thromboembolic pulmonary hypertension: a scientific statement from the American Heart Association. Circulation 2011; 123(16):1788–1830. doi:10.1161/CIR.0b013e318214914f
- White RH, Geraghty EM, Brunson A, et al. High variation between hospitals in vena cava filter use for venous thromboembolism. JAMA Intern Med 2013; 173(7):506–512. doi:10.1001/jamainternmed.2013.2352
- Sella DM, Oldenburg WA. Complications of inferior vena cava filters. Semin Vasc Surg 2013; 26(1):23–28. doi:10.1053/j.semvascsurg.2013.04.005
- Andreoli JM, Lewandowski RJ, Vogelzang RL, Ryu RK. Comparison of complication rates associated with permanent and retrievable inferior vena cava filters: a review of the MAUDE database. J Vasc Interv Radiol 2014; 25(8):1181–1185. doi:10.1016/j.jvir.2014.04.016