User login
Maternal obesity promotes risk of perinatal death
The infants of obese pregnant women had a 55% higher adjusted perinatal death rate, compared with those of normal-weight pregnant women, but lower gestational age had a mediating effect, based on data from nearly 400,000 women-infant pairs.
“While some obesity-related causes of fetal death are known, the exact pathophysiology behind the effects of obesity on perinatal death are not completely understood,” Jeffrey N. Bone, MD, of the University of British Columbia, Vancouver, and colleagues wrote. Higher body mass index prior to pregnancy also is associated with preterm delivery, but the effect of gestational age on the association between BMI and infant mortality has not been well explored.
In a study published in PLOS ONE, the researchers reviewed data from nearly 400,000 women obtained through the British Columbia Perinatal Database Registry, which collects obstetric and neonatal data from hospital charts and from delivery records of home births. Births at less than 20 weeks’ gestation and late pregnancy terminations were excluded.
BMI was based on self-reported prepregnancy height and weight; of the 392,820 included women, 12.8% were classified as obese, 20.6% were overweight, 60.6% were normal weight, and 6.0% were underweight. Infants of women with higher BMI had a lower gestational age at delivery. Perinatal mortality occurred in 1,834 pregnancies (0.5%). In adjusted analysis, infant perinatal death was significantly more likely for obese women (adjusted odds ratio, 1.55) and overweight women (aOR, 1.22).
However, 63.1% of this association in obese women was mediated by gestational age of the infant at delivery, with aORs of 1.32 and 1.18 for natural indirect and natural direct effects, respectively, compared with that of normal-weight women. Similar, but lesser effects were noted for overweight women, with aORs of 1.11 and 1.10, respectively. “Direct effects were higher, and mediation was lower for stillbirth than for neonatal death, where the total effect was entirely indirect,” but the confidence intervals remained consistent with the primary analyses, the researchers noted.
The increased perinatal death rates of infants of obese and overweight women reflect data from previous studies, but the current study’s use of mediation analysis offers new insight on the mechanism by which perinatal death rates increase with higher maternal BMI, the researchers wrote.
The study findings were limited by several factors including the need to consider potential common risk factors for both perinatal death and early delivery that would be affected by maternal obesity, the researchers noted. Other limitations included the use of gestational age at stillbirth, which represents an approximation of fetal death in some cases, and the use of self-reports for prepregnancy maternal BMI.
However, the results were strengthened by the large, population-based design and information on potential confounding variables, and suggest that early gestational age at delivery may play a role in maternal obesity-related perinatal death risk.
“To better inform the pregnancy management in obese women, further studies should continue to disentangle the causal pathways under which obesity increases the risk of perinatal death, including, for example, gestational diabetes and other obesity-related pregnancy complications,” they concluded.
More testing and counseling are needed
The current study is important because obesity rates continue to increase in the reproductive-age population, Marissa Platner, MD, of Emory University, Atlanta, said in an interview. “Obesity has become a known risk factor for adverse pregnancy outcomes, specifically the risk of stillbirth and perinatal death. However, the authors correctly point out that the underlying cause of these perinatal deaths in women with obesity is unclear. Additionally, ACOG recently updated their clinical guidelines to recommend routine antenatal testing for women with obesity due to these increased rates of stillbirth.
“I was not surprised by these findings; similar to previous literature, the risks of perinatal death seem to have a dose-response relationship with increasing BMI. We know that women with prepregnancy obesity are also at higher risk of perinatal complications in the preterm period, which would increase the risk of perinatal death,” Dr. Platner said
“I think the take-home message for clinicians is twofold,” Dr. Platner said. First, “we need to take the updated antenatal testing guidelines from ACOG very seriously and implement these in our practices.” Second, “in the preconception or early antepartum period, these patients should be thoroughly counseled on the associated risks of pregnancy and discuss appropriate gestational weight gain guidelines and lifestyle modifications.”
However, “additional research is needed in a U.S. population with higher rates of obesity to determine the true effects of obesity on perinatal deaths and to further elucidate the underlying pathophysiology and disease processes that may lead to increased risk of both stillbirth and perinatal deaths,” Dr. Platner emphasized.
*This story was updated on March 23, 2022.
The study was supported by the Sick Kids Foundation and the Canadian Institute of Health Research. The researchers had no financial conflicts to disclose. Dr. Platner had no financial conflicts to disclose.
FROM PLOS ONE
Intermittent fasting good for weight loss, at least short term
The health benefits of intermittent fasting are slowly being clarified as more evidence continues to emerge, say the authors of a new review of 21 studies. Initial findings suggest that fasting might be effective for mild to moderate weight loss for certain groups of people, at least in the short term.
And data so far at least dispel the myth that “people are going to feel weak and not be able to concentrate during fasting,” lead researcher Krista A. Varady, PhD, professor of nutrition in the University of Illinois at Chicago, noted in a press release from her university.
“We’ve shown it is the opposite,” she said. “They actually have a better ability to concentrate.”
Yet much longer-term data are needed on issues such as safety, Dr. Varady and colleagues note in their review in Nature Reviews: Endocrinology .
The trials so far have only been conducted in adults – generally with overweight or obesity and sometimes hypertension, dyslipidemia, and/or diabetes – but some have been performed in those of normal weight.
Dr. Varady and colleague recommend that those with type 1 diabetes, type 2 diabetes, or other comorbidities, or patients who need to take medications with meals at certain times of the day, should seek clinical supervision when considering intermittent fasting.
And currently, based on existing evidence, intermittent fasting is contraindicated for children under age 12 and those who have a history of an eating disorder or a body mass index <18.5 kg/m2. Opinions vary about the safety of supervised fasting in adolescents with obesity. Also, safety has not been evaluated in those older than age 70, and in women who are pregnant or lactating.
‘A few studies’ show 3%-8% weight loss over 2-3 months
Despite the recent surge in the popularity of intermittent fasting, “only a few studies have examined the health benefits of these diets in humans,” Dr. Varady and coauthors emphasize.
They identified 21 clinical trials of three types of intermittent fasting strategies:
Alternate day fasting (alternating between consuming 0-500 kcal on “fasting” days, followed by unlimited food on “feasting” days), six trials.
5:2 diet (“feasting” on 5 days and “fasting” on 2 days), seven trials.
Time-restricted eating (eating during a 4- to 8- hour window), nine trials.
The trials were short (mostly 5-12 weeks long) and small (10-150 participants), and mostly conducted in the United States.
They found these strategies can all produce a mild to moderate 3%-8% weight loss during 8-12 weeks, similar to that attained with a calorie-restricted diet.
Some studies found that patients had improvements in blood pressure, LDL cholesterol, triglycerides, insulin resistance, and hemoglobin A1c.
These weight-loss strategies produced few gastrointestinal, neurological, hormonal, or metabolic adverse effects; “however, as adverse outcomes are not regularly assessed in human trials of fasting, definitive conclusions regarding the safety of these diets are difficult to draw at present,” the researchers caution.
Practical advice, great anecdotes
Typically, 1-2 weeks of adjustment is needed when individuals start intermittent fasting, the researchers say.
While following this eating pattern, patients should be encouraged to consume plenty of fruits, vegetables, and whole grains to boost their fiber and micronutrient intake.
On fasting days, they should consume at least 50 g of lean protein to help control hunger and prevent excessive loss of lean mass. On those days, alcohol is permitted but not recommended. Energy drinks and coffee or tea without sugar, milk, or cream are allowed, and diet soda should be limited to two servings a day because it can increase sugar cravings.
Ideally, clinicians should regularly assess patients for adverse effects during the first 3 months of intermittent fasting. They should also monitor patients for deficiencies in vitamin D, vitamin B12, and electrolytes, as well as for changes in medications for blood pressure, lipids, and glucose that may be needed if patients lose weight.
Patients who reach their weight-loss goals and wish to stop intermittent fasting need to transition to a weight-maintenance program, possibly by increasing energy intake on fasting days to 1,000-1,200 kcal/day or widening the eating window to 12 hours in time-restricted eating.
“I get lots of emails from people saying that they have been on the diet for 10-15 years, and it reversed their type 2 diabetes, and they lost 60 pounds, and it was the only diet they could stick to,” Dr. Varady noted.
“That is always nice to hear, but we really do need long-term data to see if people can do intermittent fasting for the long term,” she reiterated.
The review was funded by the National Institute of Diabetes and Digestive and Kidney Diseases. Dr. Varady received author fees from the Hachette Book Group for the book, “The Every Other Day Diet.” The other authors have declared no relevant financial relationships.
A version of this article first appeared on Medscape.com.
FROM NATURE REVIEWS: ENDOCRINOLOGY
Excess weight over lifetime hikes risk for colorectal cancer
Excess weight over a lifetime may play a greater role in a person’s risk for colorectal cancer (CRC) than previously thought, according to new research.
In their paper published online March 17 in JAMA Oncology, the authors liken the cumulative effects of a lifetime with overweight or obesity to the increased risk of cancer the more people smoke over time.
This population-based, case-control study was led by Xiangwei Li, MSc, of the division of clinical epidemiology and aging research at the German Cancer Research Center in Heidelberg.
It looked at height and self-reported weight documented in 10-year increments starting at age 20 years up to the current age for 5,635 people with CRC compared with 4,515 people in a control group.
Odds for colorectal cancer increased substantially over the decades when people carried the excess weight long term compared with participants who remained within the normal weight range during the period.

Coauthor Hermann Brenner, MD, MPH, a colleague in Li’s division at the German Cancer Research Center, said in an interview that a key message in the research is that “overweight and obesity are likely to increase the risk of colorectal cancer more strongly than suggested by previous studies that typically had considered body weight only at a single point of time.”
The researchers used a measure of weighted number of years lived with overweight or obesity (WYOs) determined by multiplying excess body mass index by number of years the person carried the excess weight.
They found a link between WYOs and CRC risk, with adjusted odds ratios (ORs) increasing from 1.25 (95% confidence interval [CI], 1.09-1.44) to 2.54 (95% CI, 2.24-2.89) from the first to the fourth quartile of WYOs, compared with people who stayed within normal weight parameters.
The odds went up substantially the longer the time carrying the excess weight.
“Each SD increment in WYOs was associated with an increase of CRC risk by 55% (adjusted OR, 1.55; 95% CI, 1.46-1.64),” the authors wrote. “This OR was higher than the OR per SD increase of excess body mass index at any single point of time, which ranged from 1.04 (95% CI, 0.93-1.16) to 1.27 (95% CI 1.16-1.39).”
Dr. Brenner said that although this study focused on colorectal cancer, “the same is likely to apply for other cancers and other chronic diseases.”
Prevention of overweight and obesity to reduce burden of cancer and other chronic diseases “should become a public health priority,” he said.
Preventing overweight in childhood is important
Overweight and obesity increasingly are starting in childhood, he noted, and may be a lifelong burden.
Therefore, “efforts to prevent their development in childhood, adolescence, and young adulthood are particularly important,” Dr. Brenner said.
The average age of the patients was 68 years in both the CRC and control groups. There were more men than women in both groups: 59.7% were men in the CRC group and 61.1% were men in the control group.
“Our proposed concept of WYOs is comparable to the concept of pack-years in that WYOs can be considered a weighted measure of years lived with the exposure, with weights reflecting the intensity of exposure,” the authors wrote.
Study helps confirm what is becoming more clear to researchers
Kimmie Ng, MD, MPH, a professor at Harvard Medical School and oncologist at Dana-Farber Cancer Institute, both in Boston, said in an interview that the study helps confirm what is becoming more clear to researchers.

“We do think that exposures over the life course are the ones that will be most strongly contributing to a risk of colorectal cancer as an adult,” she said. “With obesity, what we think is happening is that it’s setting up this milieu of chronic inflammation and insulin resistance and we know those two factors can lead to higher rates of colorectal cancer development and increased tumor growth.”
She said the ideal, but impractical, way to do the study would be to follow healthy people from childhood and document their weight over a lifetime. In this case-control study, people were asked to recall their weight at different time periods, which is a limitation and could lead to recall bias.
But the study is important, Dr. Ng said, and it adds convincing evidence that addressing the link between excess weight and CRC and chronic diseases should be a public health priority. “With the recent rise in young-onset colorectal cancer since the 1990s there has been a lot of interest in looking at whether obesity is a major contributor to that rising trend,” Dr. Ng noted. “If obesity is truly linked to colorectal cancer, these rising rates of obesity are very worrisome for potentially leading to more colorectal cancers in young adulthood and beyond.“
The study authors and Dr. Ng report no relevant financial relationships.
The new research was funded by the German Research Council, the Interdisciplinary Research Program of the National Center for Tumor Diseases, Germany, and the German Federal Ministry of Education and Research.
Excess weight over a lifetime may play a greater role in a person’s risk for colorectal cancer (CRC) than previously thought, according to new research.
In their paper published online March 17 in JAMA Oncology, the authors liken the cumulative effects of a lifetime with overweight or obesity to the increased risk of cancer the more people smoke over time.
This population-based, case-control study was led by Xiangwei Li, MSc, of the division of clinical epidemiology and aging research at the German Cancer Research Center in Heidelberg.
It looked at height and self-reported weight documented in 10-year increments starting at age 20 years up to the current age for 5,635 people with CRC compared with 4,515 people in a control group.
Odds for colorectal cancer increased substantially over the decades when people carried the excess weight long term compared with participants who remained within the normal weight range during the period.
Coauthor Hermann Brenner, MD, MPH, a colleague in Li’s division at the German Cancer Research Center, said in an interview that a key message in the research is that “overweight and obesity are likely to increase the risk of colorectal cancer more strongly than suggested by previous studies that typically had considered body weight only at a single point of time.”
The researchers used a measure of weighted number of years lived with overweight or obesity (WYOs) determined by multiplying excess body mass index by number of years the person carried the excess weight.
They found a link between WYOs and CRC risk, with adjusted odds ratios (ORs) increasing from 1.25 (95% confidence interval [CI], 1.09-1.44) to 2.54 (95% CI, 2.24-2.89) from the first to the fourth quartile of WYOs, compared with people who stayed within normal weight parameters.
The odds went up substantially the longer the time carrying the excess weight.
“Each SD increment in WYOs was associated with an increase of CRC risk by 55% (adjusted OR, 1.55; 95% CI, 1.46-1.64),” the authors wrote. “This OR was higher than the OR per SD increase of excess body mass index at any single point of time, which ranged from 1.04 (95% CI, 0.93-1.16) to 1.27 (95% CI 1.16-1.39).”
Dr. Brenner said that although this study focused on colorectal cancer, “the same is likely to apply for other cancers and other chronic diseases.”
Prevention of overweight and obesity to reduce burden of cancer and other chronic diseases “should become a public health priority,” he said.
Preventing overweight in childhood is important
Overweight and obesity increasingly are starting in childhood, he noted, and may be a lifelong burden.
Therefore, “efforts to prevent their development in childhood, adolescence, and young adulthood are particularly important,” Dr. Brenner said.
The average age of the patients was 68 years in both the CRC and control groups. There were more men than women in both groups: 59.7% were men in the CRC group and 61.1% were men in the control group.
“Our proposed concept of WYOs is comparable to the concept of pack-years in that WYOs can be considered a weighted measure of years lived with the exposure, with weights reflecting the intensity of exposure,” the authors wrote.
Study helps confirm what is becoming more clear to researchers
Kimmie Ng, MD, MPH, a professor at Harvard Medical School and oncologist at Dana-Farber Cancer Institute, both in Boston, said in an interview that the study helps confirm what is becoming more clear to researchers.
“We do think that exposures over the life course are the ones that will be most strongly contributing to a risk of colorectal cancer as an adult,” she said. “With obesity, what we think is happening is that it’s setting up this milieu of chronic inflammation and insulin resistance and we know those two factors can lead to higher rates of colorectal cancer development and increased tumor growth.”
She said the ideal, but impractical, way to do the study would be to follow healthy people from childhood and document their weight over a lifetime. In this case-control study, people were asked to recall their weight at different time periods, which is a limitation and could lead to recall bias.
But the study is important, Dr. Ng said, and it adds convincing evidence that addressing the link between excess weight and CRC and chronic diseases should be a public health priority. “With the recent rise in young-onset colorectal cancer since the 1990s there has been a lot of interest in looking at whether obesity is a major contributor to that rising trend,” Dr. Ng noted. “If obesity is truly linked to colorectal cancer, these rising rates of obesity are very worrisome for potentially leading to more colorectal cancers in young adulthood and beyond.“
The study authors and Dr. Ng report no relevant financial relationships.
The new research was funded by the German Research Council, the Interdisciplinary Research Program of the National Center for Tumor Diseases, Germany, and the German Federal Ministry of Education and Research.
FROM JAMA ONCOLOGY
Obesity linked to combined OSA syndrome and severe asthma
Almost all patients with both obstructive sleep apnea syndrome and severe asthma fell into the obesity phenotype, not the allergy phenotype, based on data from nearly 1,500 adults.
Both asthma and sleep-disordered breathing are common conditions worldwide, and previous research suggests that obstructive sleep apnea syndrome (OSAS) and severe asthma in particular could be associated, wrote Laurent Portel, MD, of Centre Hospitalier de Libourne, France, and colleagues.
“Even if the underlying mechanisms are not well established, it is clear that both OSAS and obesity act to aggravate existing asthma, making it more difficult to control,” they said. However, the pathology of this relationship is not well-understood, and data on severe asthma phenotypes and OSAS are limited, they said.
In a study published in Respiratory Medicine and Research, the investigators reviewed data from 1,465 patients older than 18 years with severe asthma who were part of a larger, prospective multicenter study of the management of asthma patients. The larger study, developed by the Collège des Pneumologues des Hôpitaux Généraux (CPHG) is known as the FASE-CPHG (France Asthme SEvère-CPHG) and includes 104 nonacademic hospitals in France.
Diagnosis of OSAS was reported by physicians; diagnosis of severe asthma was based on the Global Initiative for Asthma criteria. The average age of the patients was 54.4 years, 63% were women, and 60% were nonsmokers.
A total of 161 patients were diagnosed with OSAS. The researchers conducted a cluster analysis on 1,424 patients, including 156 of the OSAS patients. They identified five clusters: early-onset atopic asthma (690 patients), obese asthma (153 patients), late-onset asthma (299 patients), eosinophilic asthma (143 patients), and aspirin sensitivity asthma (139 patients).
All 153 patients in the obese asthma cluster had OSAS, by contrast, none of the patients in the early atopic asthma cluster had OSAS.
Overall, obesity, male sex, high blood pressure, depression, late-onset asthma, and early-onset atopic asthma were independently associated with OSAS, with odds ratios of 5.782, 3.047, 2.875, 2.552, 1.789, and 0.622, respectively.
Notably, OSAS patients were more frequently treated with long-term oral corticosteroids than those without OSAS (30% vs. 15%, P < .0001), the researchers said. “It is possible that this treatment may be responsible for obesity, and it represents a well-known risk factor for developing OSAS,” they wrote.
Uncontrolled asthma was significantly more common in OSAS patients than in those without OSAS (77.7% vs. 69%, P = .03), and significantly more OSAS patients reported no or occasional physical activity (79.8% vs. 68.2%, P ≤ .001).
The study findings were limited by several factors including the lack of patients from primary care or university hospitals, which may limit the generalizability of the results, the reliance on physician statements for diagnosis of OSAS, and the lack of data on OSAS severity or treatment, the researchers noted.
However, the results fill a needed gap in the literature because of the limited data on severe asthma patients in real life, and identifying severe asthma patients by phenotype may help identify those at greatest risk for OSAS, they said.
“Identified patients could more easily benefit from specific examinations such as poly(somno)graphy and, consequently, could benefit from a better management of both asthma and OSAS,” they emphasized.
The larger FASE-CPHG study was supported in part by ALK, AstraZeneca, Boehringer Ingelheim, GSK, and Le Nouveau Souffle. The researchers had no financial conflicts to disclose.
FROM RESPIRATORY MEDICINE AND RESEARCH
Don’t drink calories: Artificial sweeteners beat sugar in new analysis
This transcript of Impact Factor with F. Perry Wilson has been edited for clarity.
Welcome to Impact Factor, your weekly dose of commentary on a new medical study. I’m Dr. F. Perry Wilson of the Yale School of Medicine.
When I counsel patients who are trying to lose weight, there is something I always discuss: “Don’t drink calories.” The idea is that it is so easy to consume sweetened beverages (and alcoholic ones, for that matter) and we don’t really get a sense of how many calories we’re taking in.
Some patients balk at the idea, saying they can’t stand the taste of water or just can’t bring themselves to drink it. While, as a nephrologist, this pains me deeply to hear, I often suggest going for low- or zero-calorie flavored drinks instead of the sugary stuff.
And yet ... I need to admit that recently I’ve been more nervous about that advice. A very nice study in Nature, for example, found that artificial sweeteners induce glucose intolerance and weight gain – in mice.
Several observational studies have suggested that the use of nonnutritive sweeteners – sucralose, aspartame, and so on – are associated with higher body weight and type 2 diabetes. Of course,
Randomized trials, as ever, are the key to deeper understanding, but most trials in this space are relatively small. That makes a good case for this study, appearing in JAMA Network Open, which combines data from 17 randomized trials to determine what effects substituting sugary drinks with low- and zero-calorie drinks truly has.
So, what’s the bottom line? Should I ditch the Splenda in my morning coffee and drop in some sugar cubes?
It turns out that the effects of drinking low- or zero-calorie drinks instead of sugary ones is modest, but overall beneficial, depending on the outcome you’re trying to achieve.
Randomized trials show that switching to low-cal drinks reduces body weight by about a kilogram, and BMI by 0.3 points. It also reduces body fat by about half a percent.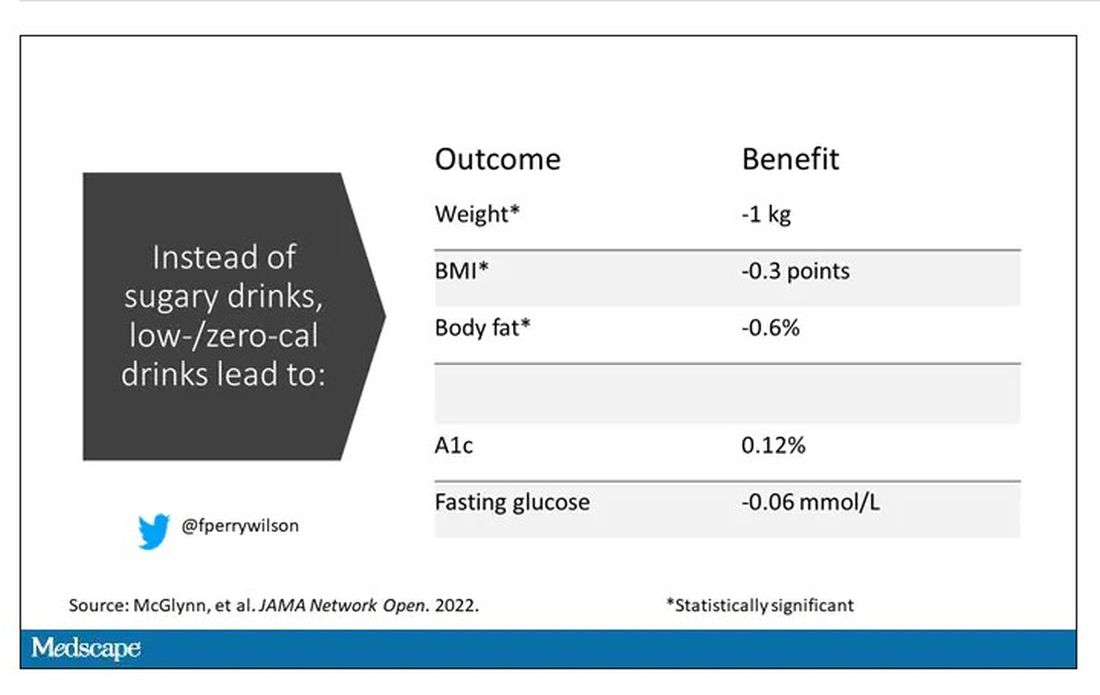
Effects on glucose homeostasis – hemoglobin A1c level and fasting glucose – were not that impressive, though.
The authors also compared sugar-sweetened beverages with plain old water. I expected this analysis to show more dramatic benefits. After all, we’re all just ugly, giant bags of mostly water. Interestingly, the effects of switching to water were not as dramatic and largely nonsignificant with respect to most outcomes evaluated.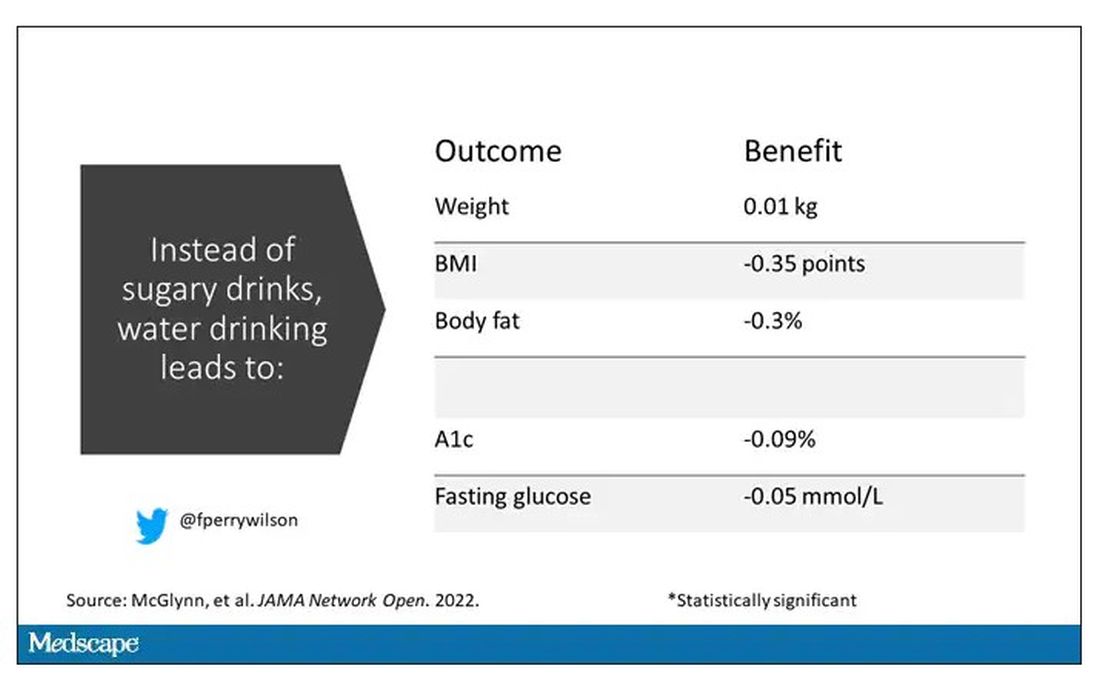
So, what do we make of this? If someone is a habitual drinker of sugar-sweetened beverages, is it preferable to switch to a zero-calorie flavored drink, compared with plain water?
One possibility is that in the trials where people are randomized to switch to water, they aren’t as adherent. Just because we ask someone to drink water doesn’t mean they do it, and so there may be a tendency to “cheat” with sugar-sweetened beverages. However, if told that low- or zero-calorie flavored drinks are okay, maybe it’s easier to stick to the plan? This is essentially the argument you get from people who say that vaping is a good way to quit smoking. It may or may not be true.
It could also be that we just don’t have enough rigorous data to make a firm conclusion. Of the 17 trials examined, only three of them used water substitution as an intervention.
All in all, these data provide some reassurance that the zero-calorie sweeteners aren’t secretly exacerbating the obesity epidemic. I’d certainly rather my patients drink Diet Coke than regular Coke. That said, these studies are necessarily short term; the longer-term effects of sugar substitutes, while perhaps not as bad as the long-term effects of sugar, must necessarily be worse than the long-term effects of drinking water. Maybe this is the nephrologist in me talking again, but I doubt that there could possibly be a fluid better for the human body than good old H2O. Except coffee, of course.
F. Perry Wilson, MD, MSCE, is an associate professor of medicine and director of Yale University’s Clinical and Translational Research Accelerator. He disclosed no relevant financial relationships.
A version of this article first appeared on Medscape.com.
Ways to lessen toxic effects of chemo in older adults
Age-related changes that potentiate adverse drug reactions include alterations in absorption, distribution, metabolism, and excretion. As such, older patients often require adjustments in medications to optimize safety and use. Medication adjustment is especially important for older patients on complex medication regimens for multiple conditions, such as those undergoing cancer treatment. Three recent high-quality randomized trials evaluated the use of geriatric assessment (GA) in older adults with cancer.1-3
Interdisciplinary GA can identify aging-related conditions associated with poor outcomes in older patients with cancer (e.g., toxic effects of chemotherapy) and provide recommendations aimed at improving health outcomes. The results of these trials suggest that interdisciplinary GA can improve care outcomes and oncologists’ communication for older adults with cancer, and should be considered an emerging standard of care.
Geriatric assessment and chemotherapy-related toxic effects
A cluster randomized trial1 at City of Hope National Medical Center conducted between August 2015 and February 2019 enrolled 613 participants and randomly assigned them to receive a GA-guided intervention or usual standard of care in a 2-to-1 ratio. Participants were eligible for the study if they were aged ≥65 years; had a diagnosis of solid malignant neoplasm of any stage; were starting a new chemotherapy regimen; and were fluent in English, Spanish, or Chinese.
The intervention included a GA at baseline followed by assessments focused on six common areas: sleep problems, problems with eating and feeding, incontinence, confusion, evidence of falls, and skin breakdown. An interdisciplinary team (oncologist, nurse practitioner, pharmacist, physical therapist, occupational therapist, social worker, and nutritionist) performed the assessment and developed a plan of care. Interventions were multifactorial and could include referral to specialists; recommendations for medication changes; symptom management; nutritional intervention with diet recommendations and supplementation; and interventions targeting social, spiritual, and functional well-being. Follow-up by a nurse practitioner continued until completion of chemotherapy or 6 months after starting chemotherapy, whichever was earlier.
The primary outcome was grade 3 or higher chemotherapy-related toxic effects using National Cancer Institute criteria, and secondary outcomes were advance directive completion, emergency room visits and unplanned hospitalizations, and survival up to 12 months. Results showed a 10% absolute reduction in the incidence of grade 3 or higher toxic effects (P = .02), with a number needed to treat of 10. Advance directive completion also increased by 15%, but no differences were observed for other outcomes. This study offers high-quality evidence that a GA-based intervention can reduce toxic effects of chemotherapy regimens for older adults with cancer.
Geriatric assessment in community oncology practices
A recent study by Supriya G. Mohile, MD, and colleagues2 is the first nationwide multicenter clinical trial to demonstrate the effects of GA and GA-guided management. This study was conducted in 40 oncology practices from the University of Rochester National Cancer Institute Community Oncology Research Program network. Centers were randomly assigned to intervention or usual care (362 patients treated by 68 oncologists in the intervention group and 371 patients treated by 91 oncologists in the usual-care group). Eligibility criteria were age ≥70 years; impairment in at least one GA domain other than polypharmacy; incurable advanced solid tumor or lymphoma with a plan to start new cancer treatment with a high risk for toxic effects within 4 weeks; and English language fluency. Both study groups underwent a baseline GA that assessed patients’ physical performance, functional status, comorbidity, cognition, nutrition, social support, polypharmacy, and psychological status. For the intervention group, a summary and management recommendations were provided to the treating oncologists.
The primary outcome was grade 3 or higher toxic effects within 3 months of starting a new regimen; secondary outcomes included treatment intensity and survival and GA outcomes within 3 months. A smaller proportion of patients in the intervention group experienced toxicity (51% vs. 71%), with an absolute risk reduction of 20%. Patients in the intervention group also had fewer falls and a greater reduction in medications used; there were no other differences in secondary outcomes. This study offers very strong and generalizable evidence that incorporating GA in the care of older adults with cancer at risk for toxicity can reduce toxicity as well as improve other outcomes, such as falls and polypharmacy.
Geriatric assessment and oncologist-patient communication
A secondary analysis3 of data from Dr. Mohile and colleagues2 evaluated the effect of GA-guided recommendations on oncologist-patient communication regarding comorbidities. Patients (n = 541) included in this analysis were 76.6 years of age on average and had 3.2 (standard deviation, 1.9) comorbid conditions. All patients underwent GA, but only oncologists in the intervention arm received GA-based recommendations. Clinical encounters between oncologist and patient immediately following the GA were audio recorded and analyzed to examine communication between oncologists and participants as it relates to chronic comorbid conditions.
In the intervention arm, more discussions regarding comorbidities took place, and more participants’ concerns about comorbidities were acknowledged. More importantly, participants in the intervention group were 2.4 times more likely to have their concerns about comorbidities addressed through referral or education, compared with the usual-care group (P = .004). Moreover, 41% of oncologists in the intervention arm modified dosage or cancer treatment schedule because of concern about tolerability or comorbidities. This study demonstrates beneficial effects of GA in increasing communication and perhaps consideration of comorbidities of older adults when planning cancer treatment.
Dr. Hung is professor of geriatrics and palliative care at Mount Sinai Hospital, New York. He disclosed no relevant conflicts of interest.
References
1. Li D et al. JAMA Oncol. 2021;7:e214158.
2. Mohile SG et al. Lancet. 2021;398:1894-1904.
3. Kleckner AS et al. JCO Oncol Pract. 2022;18:e9-19.
A version of this article first appeared on Medscape.com.
Food insecurity linked to metabolic syndrome in Hispanic/Latino youth
Severe food insecurity was associated with metabolic syndrome and unfavorable cardiometabolic markers in Hispanic/Latino youth, researchers report.
The findings, published March 16 in Pediatrics, highlight the need to investigate interventions that address food insecurity among Hispanic/Latino youth, a segment of the U.S. population at high risk of cardiometabolic complications.
“Among Hispanic/Latino youth, no study, to our knowledge has evaluated food insecurity’s role in metabolic syndrome and metabolic syndrome–relevant cardiometabolic markers in this population,” lead author Luis E. Maldonado, PhD, of the University of North Carolina at Chapel Hill, and colleagues explained.
The researchers conducted a cross-sectional study to evaluate the associations between lower household and child food security and metabolic syndrome, as well as clinically measured cardiometabolic markers, including fasting plasma glucose, waist circumference, triglycerides, systolic and diastolic blood pressure, and high-density lipoprotein cholesterol (HDL-C).
Household food security (high, marginal, low, very low) and child food security (high, marginal, low/very low) measures were evaluated separately, and were adjusted for participant age, sex, site, parental education, and poverty-income ratio.
Data were obtained from the Hispanic Community Children’s Health Study/Study of Latino Youth, a study of offspring of adults enrolled in the Hispanic Community Health Survey/Study of Latinos.
Results
The study cohort included 1,325 Hispanic/Latino youth aged 8-16 years. For both household food security and child food security, youth in the lowest food security category had significantly lower HDL-C compared with youth with high food security (household food security, –3.17; 95% confidence interval, –5.65 to –0.70; child food security, –1.81; 95% CI, –3.54 to –0.09).
In addition, low/very low compared with high child food security was associated with higher triglycerides (beta, 8.68; 95% CI, 1.75-15.61), higher fasting plasma glucose (beta, 1.37; 95% CI, 0.08-2.65), and metabolic syndrome composite variable expected log counts (beta, 2.12; 95% CI, 0.02-0.45).
Furthermore, the researchers found statistically significant interactions between each of the two food security measures and receipt of any food assistance in the previous year in models of triglycerides (P for interactions: household food security, .03 and child food security, .005) and HDL-C (P for interactions: household food security, .01 and child food security, .04).
After evaluating the effect of parental place of birth, they found a statistically significant association for triglycerides only (P for interactions: household food security, .05 and child food security, .008).
“Our study is among the first to document adverse associations between household and child food security measures with a metabolic syndrome score variable and several metabolic syndrome–relevant cardiometabolic markers among US Hispanic/Latino youth,” the researchers wrote.
The researchers acknowledged that the cross-sectional nature of the study was a key limitation; thus, causality could not be inferred.

“In the future, we plan to conduct more qualitative work to better understand how Hispanic/Latino families respond to food insecurity, which may identify the factors that shape their response,” study author Sandra S. Albrecht, PhD, of Columbia University, New York, NY, said in an interview.
Recommendations for pediatricians
Food insecurity researcher Yankun Wang, PhD candidate at Indiana University, Bloomington, commented: “I would recommend pediatricians pay more attention to children from low-income households since they are more likely to have mental and physical health issues due to food insecurity.

“It can be very helpful if pediatricians could help families obtain SNAP benefits, enroll youth in the school breakfast and lunch programs, and promote nutrition education in schools,” Mr. Wang added.
This study was supported by grant funding from the National Heart, Lung, and Blood Institute. The authors reported no relevant disclosures.
Severe food insecurity was associated with metabolic syndrome and unfavorable cardiometabolic markers in Hispanic/Latino youth, researchers report.
The findings, published March 16 in Pediatrics, highlight the need to investigate interventions that address food insecurity among Hispanic/Latino youth, a segment of the U.S. population at high risk of cardiometabolic complications.
“Among Hispanic/Latino youth, no study, to our knowledge has evaluated food insecurity’s role in metabolic syndrome and metabolic syndrome–relevant cardiometabolic markers in this population,” lead author Luis E. Maldonado, PhD, of the University of North Carolina at Chapel Hill, and colleagues explained.
The researchers conducted a cross-sectional study to evaluate the associations between lower household and child food security and metabolic syndrome, as well as clinically measured cardiometabolic markers, including fasting plasma glucose, waist circumference, triglycerides, systolic and diastolic blood pressure, and high-density lipoprotein cholesterol (HDL-C).
Household food security (high, marginal, low, very low) and child food security (high, marginal, low/very low) measures were evaluated separately, and were adjusted for participant age, sex, site, parental education, and poverty-income ratio.
Data were obtained from the Hispanic Community Children’s Health Study/Study of Latino Youth, a study of offspring of adults enrolled in the Hispanic Community Health Survey/Study of Latinos.
Results
The study cohort included 1,325 Hispanic/Latino youth aged 8-16 years. For both household food security and child food security, youth in the lowest food security category had significantly lower HDL-C compared with youth with high food security (household food security, –3.17; 95% confidence interval, –5.65 to –0.70; child food security, –1.81; 95% CI, –3.54 to –0.09).
In addition, low/very low compared with high child food security was associated with higher triglycerides (beta, 8.68; 95% CI, 1.75-15.61), higher fasting plasma glucose (beta, 1.37; 95% CI, 0.08-2.65), and metabolic syndrome composite variable expected log counts (beta, 2.12; 95% CI, 0.02-0.45).
Furthermore, the researchers found statistically significant interactions between each of the two food security measures and receipt of any food assistance in the previous year in models of triglycerides (P for interactions: household food security, .03 and child food security, .005) and HDL-C (P for interactions: household food security, .01 and child food security, .04).
After evaluating the effect of parental place of birth, they found a statistically significant association for triglycerides only (P for interactions: household food security, .05 and child food security, .008).
“Our study is among the first to document adverse associations between household and child food security measures with a metabolic syndrome score variable and several metabolic syndrome–relevant cardiometabolic markers among US Hispanic/Latino youth,” the researchers wrote.
The researchers acknowledged that the cross-sectional nature of the study was a key limitation; thus, causality could not be inferred.
“In the future, we plan to conduct more qualitative work to better understand how Hispanic/Latino families respond to food insecurity, which may identify the factors that shape their response,” study author Sandra S. Albrecht, PhD, of Columbia University, New York, NY, said in an interview.
Recommendations for pediatricians
Food insecurity researcher Yankun Wang, PhD candidate at Indiana University, Bloomington, commented: “I would recommend pediatricians pay more attention to children from low-income households since they are more likely to have mental and physical health issues due to food insecurity.
“It can be very helpful if pediatricians could help families obtain SNAP benefits, enroll youth in the school breakfast and lunch programs, and promote nutrition education in schools,” Mr. Wang added.
This study was supported by grant funding from the National Heart, Lung, and Blood Institute. The authors reported no relevant disclosures.
FROM PEDIATRICS
CPAP has only small effect on metabolic syndrome
Continuous positive airway pressure (CPAP) may be only modestly effective for ameliorating metabolic syndrome in patients with moderate to severe obstructive sleep apnea (OSA).
That conclusion comes from investigators in a randomized controlled, trial, who found that, among 100 patients with OSA and a recent diagnosis of metabolic syndrome (MS), 18% of those assigned to use CPAP at night had a reversal of MS at 6 months of follow-up, compared with 4% of controls who were assigned to use nasal strips at night (P = .04).
The majority of patients assigned to CPAP still retained their MS diagnoses at 6 months, and CPAP did not significantly reduce individual components of the syndrome. Use of CPAP was, however, associated with small reductions in visceral fat and improvement in endothelial function, reported Sara Q.C. Giampa, PhD, from the University of São Paulo, and colleagues.
“Despite a significant rate of MS reversibility after CPAP therapy, most of the patients maintained the MS diagnosis. The modest effects of CPAP on MS reversibility underscore the need for combined therapy with CPAP, aiming to maximize metabolic syndrome recovery in parallel with improvements in OSA severity and related symptoms,” according to their study, reported in the journal CHEST®.
Asked whether he still recommends CPAP to patients with OSA and the metabolic syndrome, given the findings, corresponding author Luciano F. Drager, MD, PhD, replied “yes, definitely.”
“Despite the modest rate in reversing metabolic syndrome after CPAP, the rate was 5-fold higher than non-effective treatment (18% vs. 4%),” he said in an interview.
Dr. Drager noted that studies of other single interventions such as physical exercise to reverse MS in patients with OSA also had modest results.
A researcher who studies the relationship between sleep, circadian rhythms, and metabolism commented that, although the patients in the CPAP group were compliant with the assigned equipment and had both reductions in apneic events and improvement in oxygen saturation, the effect of CPAP on the metabolic syndrome was rather small.
“The CPAP was doing what we thought it was supposed to do, but it didn’t have the magnitude of effect on the metabolic syndrome as I expected or I think as the authors expected,” said Deanna Arble, PhD, assistant professor of biological science at Marquette University, Milwaukee.
She noted that the study also failed to detect a significant improvement in the blood pressure component of metabolic syndrome.
“In my experience and my review of the literature, blood pressure tends to be the one that’s improved most dramatically with CPAP,” she said.
Dr. Arble was not involved in the study.
Study details
In the trial, titled TREATOSA-MS, the investigators enrolled 100 patients with a recent diagnosis of metabolic syndrome and moderate to severe OSA, defined as 15 or more apnea-hypopnea index events per hour. The patients were stratified by body mass index and then randomized to undergo therapeutic CPAP or to use nasal strips for 6 months.
At baseline and at the end of each intervention investigators measured anthropometric variables, blood pressure, glucose, and lipid profiles. They also leptin and adiponectin, body composition, food intake, physical activity, subcutaneous and abdominal fat (visceral and hepatic), and endothelial function to control for potential confounders.
As noted previously, they found that after 6 months “most patients with OSA randomized to CPAP retained the MS diagnosis, but the rate of MS reversibility was higher than observed in the placebo group.” The difference in metabolic syndrome reversal, 18% with CPAP versus 4% with nasal strips, translated into a hazard ratio favoring CPAP of 5.27 (P = .04).
Also as noted, in analyses adjusted for baseline values, CPAP did not significantly improve either weight, liver fat, lip profiles, or the adiposity biomarkers leptin and adiponectin, but did have “very modest” influence on reducing visceral fat and improving endothelial function.
Rigorous study
Dr. Arble said that most studies of the association between OSA and metabolic syndrome have focused on only one or two of the parameters that were included in the TREATOSA-MS study, giving the findings additional weight.
“This could potentially be a very good, carefully controlled first insight into how obstructive sleep apnea is related to the metabolic syndrome,” she said.
The study was funded by grants Fundação de Amparo Q22 à Pesquisa do Estado de São Paulo and Coordenação de Aperfeiçoamento de Pessoal de Nível Superior. The authors and Dr. Arble reported having no conflicts of interest to disclose.
FROM CHEST
Hair loss affects more than half of postmenopausal women
Female-pattern hair loss (FPHL) was identified in 52% of postmenopausal women, and 4% of these cases involved extensive baldness, based on data from 178 individuals.
FPHL can develop at any time from teenage years through and beyond menopause, wrote Sukanya Chaikittisilpa, MD, of Chulalongkorn University, Bangkok, and colleagues.
The cause of FPHL remains uncertain, but the presence of estrogen receptors in hair follicles suggests that the hormone changes of menopause may affect hair growth, the researchers said.
In a study published in Menopause, the researchers evaluated 178 postmenopausal women aged 50-65 years for FPHL. FPLH was determined based on photographs and on measures of hormone levels, hair density, and hair diameter.
The overall prevalence of FPHL was 52.2%. The hair loss was divided into three categories indicating mild, moderate, and severe (Ludwig grades I, II, and III) with prevalence of 73.2%, 22.6%, and 4.3%, respectively. The prevalence of FPHL also increased with age and time since menopause. In a simple logistic regression analysis, age 56 years and older and more than 6 years since menopause were significantly associated with FPHL (odds ratios, 3.41 and 1.98, respectively).
However, after adjustment for multiple variables, only a body mass index of 25 kg/m2 or higher also was associated with increased prevalence of FPHL (adjusted OR, 2.65).
A total of 60% of the study participants met criteria for low self-esteem, including all the women in the severe hair loss category.
“The postmenopausal women with FPHL in our cohort had lower total hair density, terminal hair density, hair thickness, hair unit density, and average hair per unit than those with normal hair patterns,” although vellus hair density was higher in women with FPHL, the researchers wrote in their discussion of the findings. This distinction may be caused in part by the shortened hair cycle and reduced anagen phase of velluslike follicles, they said.
The study findings were limited by several factors, including the cross-sectional design and the inclusion of only women from a single menopause clinic, which may not reflect FPHL in the general population, as well as the reliance on patients’ recall, the researchers noted. Another limitation was the inability to assess postmenopausal hormone levels, they added.
However, “This study may be the first FPHL study conducted in a menopause clinic that targeted only healthy postmenopausal women,” they wrote. More research is needed to determine the potential role of estrogen and testosterone on FPHL in postmenopausal women, and whether a history of polycystic ovarian syndrome has an effect, they said. Meanwhile, current study results may help clinicians and patients determine the most appropriate menopausal hormone therapies for postmenopausal women with FPHL, they concluded.
Consider lifestyle and self-esteem issues
The current study is important at this time because a larger proportion of women are either reaching menopause or are menopausal, said Constance Bohon, MD, a gynecologist in private practice in Washington, in an interview.
“Whatever we in the medical community can do to help women transition into the menopausal years with the least anxiety is important,” including helping women feel comfortable about their appearance, she said.
“For women in the peri- and postmenopausal years, hair loss is a relatively common concern,” Dr. Bohon said. However, in the current study, “I was surprised that it was associated with low self-esteem and obesity,” she noted. “For these women, it would be interesting to know whether they also had concerns about the appearance of their bodies, or just their hair loss,” she said. The question is whether the hair loss in and of itself caused low self-esteem in the study population, or whether it exacerbated their already poor self-assessment, Dr. Bohon said. “Another consideration is that perhaps these women were already feeling the effects of aging and were trying to change their appearance by using hair dyes, and now they find themselves losing hair as well,” she noted.
The takeaway message for clinicians is that discussions with perimenopausal and postmenopausal women should include the topic of hair loss along with hot flashes and night sweats, said Dr. Bohon.
Women who are experiencing hair loss or concerned about the possibility of hair loss should ask their doctors about possible interventions that may mitigate or prevent further hair loss, she said.
As for additional research, “the most important issue is to determine the factors that are associated with hair loss in the perimenopausal and postmenopausal years,” Dr. Bohon said. Research questions should include impact of dyeing or straightening hair on the likelihood of hair loss, and whether women with more severe hot flashes/night sweats and/or sleeplessness have more hair loss than women who do not experience any of the symptoms as they go through menopause, she emphasized.
Other considerations are whether certain diets or foods are more common among women who have more hair loss, and whether weight loss into a normal range or weight gain into a body mass index greater than 25 kg/m2 affects hair loss, said Dr. Bohon. Also, don’t discount the impact of stress, and whether women who have lost hair identify certain stressful times that preceded their hair loss, as well as what medications could be associated with hair loss, and whether hormone therapy might prevent hair loss, she said.
The study was supported by the Ratchadapiseksompotch Fund, Faculty of Medicine, Chulalongkorn University. The researchers had no financial conflicts to disclose. Dr. Bohon had no financial conflicts to disclose and serves on the Editorial Advisory Board of Ob.Gyn. News.
FROM MENOPAUSE
Brown fat, white fat. Is one better than the other?
“Adipose tissue is an underappreciated and misunderstood organ.” It’s with these words that Aaron M. Cypess, MD, PhD, begins his recent review published in the New England Journal of Medicine.
As obesity rates steadily rise, “the riskiest approach to human adipose tissue is to dismiss its importance,” he adds, especially because there has been “an explosive growth” in our understanding of white and brown adipose tissue over the past 5 to 10 years.
This news organization asked Dr. Cypess, a National Institutes of Health (NIH) scientist whose research focuses on brown fat, to discuss some of the main points in his review, titled, “Reassessing Human Adipose Tissue,” and clear up some misconceptions about fat.
You write that, for people who struggle to lose weight, “fat is often a source of misery, not marvel.” Why is fat a marvel?
When I started medical school in 1992, fat was just a thing that stored calories. You had to get it out of the way when you operated on the stomach or intestines. Now we know it’s not just one cell, it’s multiple types of cells, including immune cells and some blood cells. There’s cell turnover, and cells can get bigger or smaller, so it’s a dynamic tissue. It impacts the immune system and affects insulin sensitivity.
Why use the term “adipose tissue” and not just “fat”?
People think of fat cells and that’s it. However, adipose tissue (fat) has multiple cell types, and they each matter. There are adipocytes (fat cells) – which can be white, brown, beige, or pink – as well as immune cells, fibroblasts, blood vessels, and parts of nerve cells.
The main function of white adipose tissue is to store energy in the form of triglycerides. Brown adipose tissue consumes glucose and triglycerides, generating heat. Brown fat cells within depots of white fat are termed brite cells (a portmanteau of brown and white) or beige cells. Pink fat cells have been found in breast tissue in mice.
What do we now know about white fat and brown fat? Can brown fat change to white fat or vice versa?
White adipose tissue is commonly separated into visceral fat and subcutaneous fat, which have negative and neutral or positive metabolic effects, respectively. It is capable of more than doubling in mass and then returning to baseline.
White adipocyte-derived hormones include leptin, which is low in starvation, and adiponectin, which regulates glucose and lipid metabolism. White adipose tissue is essential for the proper function of the reproductive system, including secretion of hormones and lactation.
Brown adipose tissue protects newborns from cold as they develop the ability to shiver, and in adults it is found in depots in the neck, shoulders, posterior thorax, and abdomen. The amount of brown adipose tissue varies according to sex and lowers with increasing age and increasing body mass index.
There is much more white fat in the body than brown fat. It appears that activating brown fat leads to beneficial effects on metabolism, though we don’t know yet all the steps for how that happens.
In mice, you’ve got white fat depots and brown fat depots, and some brown fat can be found in the white fat.
With humans it’s much more complicated, and I’ve seen this in the operating room myself, and on slides. Where you find brown fat cells you also find a certain proportion of white fat cells, not an exclusive brown fat depot like you see in a mouse.
It is hotly debated right now whether brown fat can change to white fat and vice versa (transdifferentiation). The beige fat cells are supposed to be the kind that can shuttle between more white-like or brown-like. They can sometimes be white or sometimes brown. It can be very contentious in [scientific] papers and meetings.
Are humans born with all the fat cells they will ever have?
No. New fat cells are made throughout our lives. When the white adipocytes store too much triglyceride, they get really big and they get “sick” and die faster. It’s the rate at which the white cells take up the fat to store it and then get rid of it that can impact whether someone gains a lot of weight and whether they can successfully lose it after reasonable effort.
The average lifespan of a white fat cell is 15 years. We have no idea yet of the lifespan of a brown fat cell.
Is there a single “fat gene”? What role do fat genes play in the likelihood of developing metabolic diseases and type 2 diabetes?
Genes are very important for influencing the development of obesity and probably influence 50%-70% of obesity, based on studies in populations of predominantly European origin. But that high percentage reflects the impact of hundreds of genes. For most people, there is no one gene that exerts all of the effects. There are extremely rare diseases where one gene is responsible. Currently, only 20% of the entire phenotypic variation in obesity can be explained by the thousands of loci identified so far.
Why is it “correct but too simplistic” to attribute the increasing rates of obesity to excessive triglyceride storage in white adipose tissue?
Saying obesity is caused by too much triglyceride storage ignores the reasons how and why the triglycerides got there. There are likely to be multiple contributing factors to drive obesity, and those have billions of dollars of policy implications. Is obesity resulting from portion sizes? Then we should work on educating the public on how to estimate their caloric intake. Is it the types of foods, such as ultra-processed foods? Then we can discourage eating certain food groups while promoting others. Is it about physical activity? Then we should prioritize exercise programs.
Why is obesity “not simply a failure of will power”?
Genetic factors in adipose tissue impact how easy it is to store triglycerides, how easy it is to get fat out of the tissue and burn it up, and what kinds of hormones are released by the tissue to regulate appetite, insulin resistance, and inflammation. Ten different people can all overeat the same amount of the same foods, yet there will be differences in the amount of weight gain and metabolic complications experienced. And at the brain level, some people will feel “full” sooner than others.
How can excess adipose tissue lead to disease? Do some people have “metabolically healthy obesity”?
Excess adipose tissue leads to chronic inflammation that can then cause insulin resistance, hypertension, fatty liver disease, and other complications. It appears that there are metabolically healthy obese people, but it is not clear if that is only a temporary state.
Could long-term brown adipose tissue activation help treat obesity or related metabolic disease?
Our research group at the NIH and others have shown that long-term brown adipose tissue activation produces metabolic benefit such as improved insulin resistance, lower plasma glucose, and higher HDL [good] cholesterol. However, there is no evidence yet that it will lead to actual weight loss.
We are trying to use brown adipose tissue activation to treat obesity-related metabolic disease to see if it could lead to reduction in inflammation, improvement in the cholesterol profile, and decrease in blood pressure.
A large observational study published Jan. 4, 2021, in Nature Medicine by Paul Cohen’s group at Rockefeller University, in tens of thousands of people at Memorial Sloan Kettering Cancer Center, showed that people who had brown fat were generally healthier and had less high blood pressure and less cardiovascular disease. This study could not show causation, but at every BMI, people were healthier if they had more brown fat than if they had less. So, there’s something going on. We’re still trying to figure that out.
Dr. Cypess has no reported no relevant financial relationships.
A version of this article first appeared on Medscape.com.