User login
Company withdraws MAA for pegfilgrastim biosimilar

The European Medicines Agency’s Committee for Medicinal Products for Human Use (CHMP) has announced that Sandoz GmbH withdrew its marketing authorization application (MAA) for Zioxtenzo.
The active ingredient of Zioxtenzo is pegfilgrastim, and the product was intended to be biosimilar to Amgen’s Neulasta.
The intended use for Zioxtenzo was to reduce the duration of neutropenia and the occurrence of febrile neutropenia in cancer patients.
In its application for Zioxtenzo, Sandoz presented results of studies designed to show the product is highly similar to Neulasta in terms of chemical structure, purity, the way it works, and how the body handles the drug.
In addition, there were 2 studies comparing the safety and effectiveness of Zioxtenzo and Neulasta in patients receiving cancer drugs.
Sandoz withdrew the MAA for Zioxtenzo after the CHMP had evaluated the initial documentation provided by the company and formulated a list of questions. The company had not responded to the questions at the time of the withdrawal.
Based on a review of the data, at the time of the withdrawal, the CHMP had 2 main concerns and was of the provisional opinion that Zioxtenzo could not have been approved as a biosimilar of Neulasta.
One concern was that study results were not able to show that the concentrations of pegfilgrastim in blood were the same after taking Zioxtenzo and Neulasta.
The other concern was the lack of a certificate of Good Manufacturing Practice for Zioxtenzo’s manufacturing site. An inspection of the site would therefore be needed before the drug could be approved.
At the time of the MAA withdrawal, Sandoz had not demonstrated that Zioxtenzo is highly similar to Neulasta, and an inspection to confirm that Zioxtenzo was being manufactured according to Good Manufacturing Practice standards had not yet taken place.
In its letter notifying the CHMP of the MAA withdrawal, Sandoz said it would not be able to provide the additional data required by the CHMP within the timeframe allowed for the procedure.
The company also said the withdrawal of Zioxtenzo will not impact ongoing clinical trials, and there are no compassionate use programs for Zioxtenzo. ![]()
Group proposes new prognostic model for PTCL-NOS
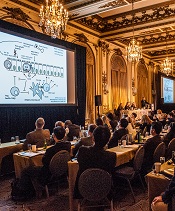
T-cell Lymphoma Forum
Photo by Larry Young
SAN FRANCISCO—Researchers have used data from the T-Cell Project (TCP) to create a prognostic model for peripheral T-cell lymphoma not otherwise specified (PTCL-NOS).
Analyses have suggested the TCP model is more accurate for PTCL-NOS than 4 other prognostic models—the International Prognostic Index (IPI), the Prognostic Index for T-cell Lymphoma (PIT), the International Peripheral T-cell Lymphoma Project score (IPTCLP), and the modified PIT (mPIT).
Massimo Federico, MD, of the University of Modena and Reggio Emilia in Italy, described the TCP model at the 9th Annual T-cell Lymphoma Forum.
Creating the model
TCP is a prospective registry that includes data from T-cell lymphoma patients in 15 countries located in 5 different regions of the world. As of December 31, 2016, 1523 cases of T-cell lymphoma have been registered with TCP.
Dr Federico and his colleagues used these data to create their prognostic model. There were 311 patients with PTCL-NOS who had adequate data for analysis. The 5-year overall survival (OS) for these patients was 36%.
The researchers chose 13 variables from the literature that have been reported to have a prognostic impact on survival in PTCL-NOS:
- Age > 60
- Lactate dehydrogenase > upper limit of normal
- Albumin < 3.5 g/dL
- Hemoglobin < 12 g/dL
- Platelets < 150/mm3
- Lymphocyte to monocyte ratio ≤ 2.1
- Neutrophil to lymphocyte ratio > 6.5
- Absolute neutrophil count (ANC) > 6.5/mm3
- ECOG performance status > 1
- Stage III-IV disease
- B symptoms
- Extra nodal sites > 1
- Male gender.
In univariate analysis, nearly all of these factors were significantly associated with OS in the cohort of TCP patients. (The 2 exceptions were age older than 60 and having more than 1 extranodal site.)
However, Dr Federico and his colleagues said the factors with the greatest prognostic impact were:
- ECOG performance status > 1, with a hazard ratio (HR) of 2.12 (P<0.001)
- Albumin < 3.5 g/dL, with an HR of 2.03 (P<0.001)
- ANC > 6.5/mm3, with an HR of 1.85 (P<0.001)
- Stage III-IV disease, with an HR of 1.74 (P=0.010).
So the researchers used these factors in their model, which has 3 risk categories.
Risk categories
Patients were considered low-risk if they had 0 of the 4 risk factors. These patients had a 3-year OS of 76% and a 5-year OS of 69%.
Patients were considered intermediate-risk if they had 1 to 2 risk factors. These patients had a 3-year OS of 43% and a 5-year OS of 31%. Compared to low-risk patients, the HR was 3.08 (P<0.001).
Patients were considered high-risk if they had 3 to 4 risk factors. The 3-year OS was 11% for these patients, and the 5-year OS was 8%.
The HR was 8.88 (P<0.001) for high-risk compared to low-risk patients and 2.88 (P<0.001) for high-risk compared to intermediate-risk patients.
Validation
The researchers tested the TCP model in a validation cohort of 98 patients from the COMPLETE registry. As with the training cohort of TCP patients, the model revealed 3 different risk groups (in terms of OS) in the validation cohort.
Dr Federico noted that there were no significant differences between the training and validation cohorts, except when it came to follow-up. The median follow-up was 46 months in the TCP group and 18 months in the COMPLETE group.
The researchers also found the TCP could classify patients into 3 different risk groups according to progression-free survival.
Comparison
Finally, Dr Federico and his colleagues compared the TCP model to the IPI, PIT, IPTCLP, and mPIT models using 208 patients.
“The discriminant power of the proposed model is superior to the others in terms of all of the statistical tests we adopted,” Dr Federico said.
| Model | c-Harrell*
(95% CI) |
D-Royston
(SE) |
R2 | AIC (95% CI) | AUC,
3-year OS |
| TCP | 0.666 (0.618-0.713) | 1.152 (0.191) | 0.31 (0.14-0.46) | 983 | 0.714 |
| PIT | 0.614 (0.563-0.664) | 0.750 (0.195) | 0.15 (0.06-0.31) | 1004 | 0.696 |
| IPI | 0.645 (0.594-0.696) | 0.883 (0.191) | 0.22 (0.08-0.38) | 987 | 0.704 |
| IPITCLP | 0.606 (0.549-0.663) | 0.631 (0.188) | 0.12 (0.03-0.28) | 1006 | 0.704 |
| mPIT | 0.640 (0.586-0.694) | 0.762 (0.170) | 0.16 (0.05-0.33) | 999 | 0.681 |
In closing, Dr Federico said the TCP model clearly defines risk groups in PTCL-NOS and identifies patients with relatively good prognosis.
However, there is a need for emerging biologic variables to be tested for prognostic value and included in prognostic tools to allow for better risk stratification. ![]()
*c-Harrel: Harrell’s concordance index, 95% CI: confidence interval, D-Royston: Royston/Sauerbrei’s D statistic (Stat Med 2004 Mar 15, 23[5]:723-48), SE: standard error, R2: explained randomness, AIC: Akaike information criterion, AUC: area under the curve (according to Heagerty et al, Biometrics, 2000 Jun, 56[2]:337-44).
Project provides insight into T-cell lymphoma
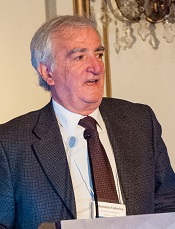
Photo by Larry Young
SAN FRANCISCO—The T-Cell Project has provided information that can enhance our understanding of T-cell lymphomas, according to a presentation at the 9th Annual T-cell Lymphoma Forum.
The project is a prospective registry that includes data from T-cell lymphoma patients in 15 countries located in 5 different regions of the world.
The data showed that peripheral T-cell lymphoma not otherwise specified (PTCL-NOS) is the most common subtype of T-cell lymphoma in all 5 regions, although the distribution of other subtypes varies.
A majority of patients in the registry received chemotherapy as induction, and anthracycline-containing regimens were the most popular treatment choice.
Although 60% of patients in the registry had low-risk or low/intermediate-risk disease, progression-free survival (PFS) and overall survival (OS) rates were low. The 5-year PFS was 32%, and the 5-year OS was 42%.
Massimo Federico, MD, of the University of Modena and Reggio Emilia in Italy, presented these data at the meeting.
About the project
Dr Federico said the goals of the T-Cell Project are to determine if prospective data collection provides more accurate information to better define prognosis of the most frequent subtypes of T-cell lymphoma and to improve our knowledge of clinical and biological characteristics, as well as outcomes, of the more uncommon subtypes.
“Why did we choose to propose a prospective registry for the collection of information in T-cell lymphoma?” Dr Federico asked. “Because it is, by far, less expensive than a clinical trial, but also because it can offer excellent data for generating new research programs and is a great opportunity for academic cooperation.”
As of December 31, 2016, the registry included 1523 patients. There were 75 sites (with at least 1 patient) active in the registry.
Fifteen countries in 5 geographic regions were represented. Europe was the greatest contributor (44%), followed by North America (US only, 25%), South America (20%), the Far East (9%), the Middle East (2%), and Oceania (<1%).
Subtypes
Overall, the distribution of the different T-cell lymphoma subtypes is as follows:
PTCL-NOS—36%
Angioimmunoblastic T-cell lymphoma (AITL)—17%
ALK- anaplastic large-cell lymphoma (ALCL)—16%
NK/T-cell lymphoma (NKTCL)—11%
ALK+ ALCL—8%
Enteropathy-associated T-cell lymphoma—4%
Unclassifiable T-cell lymphoma—3%
Hepatosplenic T-cell lymphoma—2%
Subcutaneous panniculitis-like T-cell lymphoma—2%
Peripheral gamma delta T-cell lymphoma—1%
Geographic distribution
The most common T-cell lymphoma subtypes in Europe were PTCL-NOS (37%), AITL (21%), and ALK- ALCL (14%). Likewise, the most common subtypes in the US were PTCL-NOS (35%), AITL (21%), and ALK- ALCL (13%).
In the Middle East, the most common subtypes were PTCL-NOS (40%), AITL (16%), and ALK+ ALCL (13%). In South America, they were PTCL-NOS (41%), ALK- ALCL (26%), and NKTCL (10%). And in Asia, they were PTCL-NOS (29%), NKTCL (29%), and AITL (17%).
Patient characteristics
Dr Federico presented data on patient characteristics for 1391 individuals, validated as of April 30, 2016.
The patients’ median age was 56 (range, 18-89). Forty-four percent were 60 or older, and 60% were male. Twenty-six percent had ECOG performance status > 1, 50% had B symptoms, and 72% had disease-related discomfort.
Sixty percent had low-risk or low/intermediate-risk disease according to the International Prognostic Index (IPI) and the Prognostic Index for T-cell Lymphoma (PIT).
Treatment
Treatment details are available for 1022 patients. Ninety-two percent received therapy with curative intent.
For induction, 76% of patients received chemotherapy alone, 14% received chemotherapy and radiotherapy, 8% received best supportive care, and 2% received radiotherapy alone.
Seventy-one percent of patients who received chemotherapy had an anthracycline-containing regimen, 13% received etoposide-containing chemotherapy, 9% received chemotherapy containing an anthracycline and etoposide, and 7% of patients received other therapy.
Thirteen percent of patients received a transplant as salvage treatment, and 7% received a transplant as consolidation.
Outcomes
Data on patient responses to initial treatment were available for 888 individuals. The 84 patients who received best supportive care were not included, and 50 patients were not evaluable for response.
The complete response/unconfirmed complete response rate was 53%, and the partial response rate was 19%. Twenty-eight percent of patients had no response or progressed.
The median PFS was 16 months. The 5-year PFS rate was 32% overall, 23% for PTCL-NOS, 28% for AITL, 39% for ALK- ALCL, and 57% for ALK+ ALCL.
The median OS was 36 months. The 5-year OS was 42% overall, 34% for PTCL-NOS, 42% for AITL, 46% for ALK- ALCL, and 76% for ALK+ ALCL.
Dr Federico and his colleagues have used these data to develop a prognostic model for PTCL-NOS that, they say, is more accurate than current models. ![]()
Recent price hikes for generic cancer meds exceed 100%

Photo by Steven Harbour
AMSTERDAM—The UK has seen substantial price increases for some generic cancer drugs over the last few years, according to a study presented at ECCO 2017: European Cancer Congress (abstract 966).
Of the 89 drugs analyzed in this study, 21 of them—including 17 generics—had price increases from 2011 to 2016.
Fourteen of the generic cancer drugs had price increases over 100%, and 2 of the drugs had increases exceeding 1000%.
“We were surprised to find several companies consistently raising the prices of cancer treatment,” said study investigator Andrew Hill, PhD, of the University of Liverpool in the UK.
“Twenty treatments have shown rises of over 100% in the last 5 years, and in 2—busulfan (used to treat leukemia) and tamoxifen (breast cancer)—prices have increased by over 1000%. We have found that some companies take over the supply of some generic cancer medicines and then raise the price progressively.”
Dr Hill and his co-investigator Melissa Barber, of the London School of Hygiene and Tropical Medicine in the UK, analyzed prices for 190 formulations of 89 cancer drugs.
Twenty-eight formulations of 21 drugs had price increases from 2011 to 2016. Seventeen of these 21 drugs were generic in 2016.
Twenty formulations of 14 generic cancer drugs had price increases exceeding 100%.
For example, the cost per tablet or injection increased for:
- Ifosfamide (2 g vial)—from £89 to £180, or 103%.
- Melphalan (50 mg vial)—from £33 to £137, or 315%.
- Chlorambucil (2 mg)—from £0.33 to £1.62, or 390%.
- Cyclophosphamide (50 mg)—from £0.20 to £1.39, or 695%.
- Busulfan (2 mg)—from £0.21 to £2.61, or 1227%.
Dr Hill said the UK’s Department of Health is aware of this issue and has introduced the Health Services Medical Supplies (Costs) Bill to enable price regulation in the future.
Companies found to be raising prices with no clear justification will be referred to the Competition and Markets Authority, and they could face fines.
However, Dr Hill and Barber said they found large price increases for generic cancer drugs in other European countries as well.
In Spain and Italy, failure to accept the high prices demanded for some generic drugs has led to warnings from companies that they could stop the supply of these drugs.
For instance, Italy fined the generic company Aspen €5 million after a 1500% increase in the price of cancer drugs, including melphalan and chlorambucil. Aspen then threatened Italy with drug shortages unless higher prices were accepted.
In Spain, Aspen demanded a 4000% increase in melphalan prices.
“We hope that, by explaining what we have found in the UK, other European countries will take note and protect themselves against these kinds of price rises,” Dr Hill said. “At a time when cancer patients are living longer and better lives due to effective treatments, this situation is particularly worrying.” ![]()
Brentuximab vedotin bests standard of care in CTCL
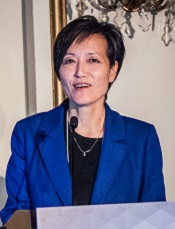
Photo by Larry Young
SAN FRANCISCO—The phase 3 ALCANZA trial is the first to convincingly demonstrate that a new systemic agent can be more effective than standard of care (SOC) options for cutaneous T-cell lymphoma (CTCL), according to a speaker at the 9th Annual T-cell Lymphoma Forum.
The trial showed significant improvements in response, symptom burden, and progression-free survival (PFS) in patients with CD30-expressing CTCL who received brentuximab vedotin (BV), as compared to patients who received either bexarotene or methotrexate.
“[These are] compelling results that potentially may have practice-changing implications for the use of brentuximab in managing CD30-expressing CTCL patients who require systemic therapy,” said Youn H. Kim, MD, of Stanford University School of Medicine in California.
Dr Kim presented these results at this year’s T-cell Lymphoma Forum. The data were also presented at the recent ASH Annual Meeting (abstract 182).
The ALCANZA trial was sponsored by Millennium Pharmaceuticals, Inc. (now a part of Takeda Pharmaceutical Company Limited) and Seattle Genetics, Inc.
The study was designed to compare BV to the SOC options of methotrexate or bexarotene in patients with CD30-positive CTCL, including mycosis fungoides (MF) and primary cutaneous anaplastic large-cell lymphoma (pcALCL).
There were 128 patients in the intent-to-treat and safety populations. Sixty-four patients (48 with MF and 16 with pcALCL) were randomized to receive BV at 1.8 mg/kg IV every 3 weeks for up to 48 weeks.
The other 64 patients (49 with MF and 15 with pcALCL) were randomized to receive methotrexate at 5 mg to 50 mg PO weekly or bexarotene at a target dose of 300 mg/m² PO daily for up to 48 weeks.
Patients received BV for a median of 36 weeks (12 cycles), bexarotene for a median of 17 weeks, and methotrexate for a median of 9 weeks. Three patients in the BV arm were still on treatment at the time of analysis.
Patient characteristics
The median age was 62 (range, 22-83) in the BV am and 59 (range, 22-83) in the SOC arm. More than half of patients in each arm were male—52% and 58%, respectively. And most patients in both arms had an ECOG performance status of 0-1—95% and 97%, respectively.
The median number of prior therapies was 4 (range, 0-13) in the BV arm and 3.5 (range, 1-15) in the SOC arm. The median number of systemic therapies was 2 in the BV arm (range, 0-11) and the SOC arm (range, 1-8).
“It was pretty well balanced in terms of baseline characteristics between the 2 arms,” Dr Kim said. “The brentuximab arm had more stage IV patients—in fact, 7 stage IVB in brentuximab and none in the standard of care. And more patients with ALCL [treated with BV] had extracutaneous disease.”
Among pcALCL patients, 44% in the BV arm had extracutaneous disease, compared to 27% in the SOC arm. Among MF patients, 67% in the BV arm had stage IIB-IVB disease, compared to 61% in the SOC arm.
Response
The study’s primary endpoint was the rate of objective response lasting at least 4 months (ORR4).
“[ORR4] was felt to be more meaningful than ORR because it includes not only the response rate but also a duration element in a single endpoint,” Dr Kim said.
ORR4 was significantly higher with BV than with SOC—56.3% and 12.5%, respectively (P<0.0001).
For patients with MF, the ORR4 was 50% with BV and 10% with SOC. For patients with pcALCL, the ORR4 was 75% with BV and 20% with SOC.
Overall, the complete response (CR) rates were 15.6% in the BV arm and 1.6% in the SOC arm (P=0.0046).
For patients with MF, the CR rate was 10% with BV and 0% with SOC. For patients with pcALCL, the CR rate was 31% with BV and 7% with SOC.
Symptoms
“In CTCL, there’s significant quality of life issues that are not captured adequately by objective response measures, and this patient outcome is very important,” Dr Kim said. “[Quality of life in this study] was captured by Skindex-29, which is an established quality of life measure in skin diseases.”
Patients in the BV arm had a significantly higher reduction in symptom burden according to Skindex-29 than patients receiving SOC. The mean maximum reduction in Skindex-29 symptom domain was -27.96 points in the BV arm and -8.62 points in the SOC arm (P<0.0001).
PFS
PFS was significantly longer in the BV arm than the SOC arm. The median PFS was 16.7 months and 3.5 months, respectively. The hazard ratio was 0.270 (P<0.0001).
For patients with MF, the median PFS was 15.9 months with BV and 3.5 months with SOC. For patients with pcALCL, the median PFS was 27.5 months with BV and 5.3 months with SOC.
Safety
The overall rate of adverse events (AEs) was 95% in the BV arm and 90% in the SOC arm. The rate of grade 3 or higher AEs was 41% and 47%, respectively. And the rate of serious AEs was 29% in both arms.
AEs resulting in discontinuation occurred in 24% of patients in the BV arm and 8% in the SOC arm. In the BV arm, this included peripheral neuropathy (n=9), skin-related hypersensitivity (n=3), E coli infection (n=1), impetigo (n=1), pulmonary embolism (n=1), urticaria (n=1), and vertigo (n=1).
In the SOC arm, AEs leading to discontinuation included maculo-papular rash (n=1), asthenia (n=1), hematuria (n=1), hypernatremia (n=1), neutropenia (n=1), periorbital infection (n=1), and somnolence (n=1). One patient in each arm experienced more than 1 AE resulting in discontinuation.
The most common AEs of any grade (occurring in 15% or more of patients in the BV and SOC arms, respectively) were peripheral neuropathy (67% and 6%), nausea (36% and 13%), diarrhea (29% and 6%), fatigue (29% and 27%), vomiting (17% and 5%), alopecia (15% and 3%), pruritus (17% and 13%), pyrexia (17% and 18%), decreased appetite (15% and 5%), and hypertriglyceridemia (2% and 18%).
The majority of the peripheral neuropathy events in the BV arm were grade 1 or 2—26% and 32%, respectively. The rate of grade 3 peripheral neuropathy events was 9%, and there were no grade 4 events.
Eighty-two percent of patients reported resolution or improvement in peripheral neuropathy events in the BV arm at a median of 22.9 months of follow-up.
There were no on-study deaths (occurring within 30 days of the last dose) in the SOC arm, but there were 4 in the BV arm. Three of the BV deaths were considered unrelated to the drug.
The 1 BV-related death was a result of multiple organ dysfunction syndrome attributed to tumor necrosis at visceral disease sites in a patient with T3bN0M1 pcALCL. The other 3 deaths were due to lymphoma progression, pulmonary embolism, and sepsis. ![]()
Substantial long-term increase seen in multiple myeloma survival
The 5-year survival rate for multiple myeloma increased eightfold over an approximately 60-year span starting in the early 1950s, said Ali H. Mokdad, PhD, and his associates.
Patients with multiple myeloma had a 5-year relative survival rate of 6% in 1950-1954, compared with 49.8% in 2008-2013, according to data from the Surveillance, Epidemiology, and End Results Program (JAMA 2017;317[4]:388-406).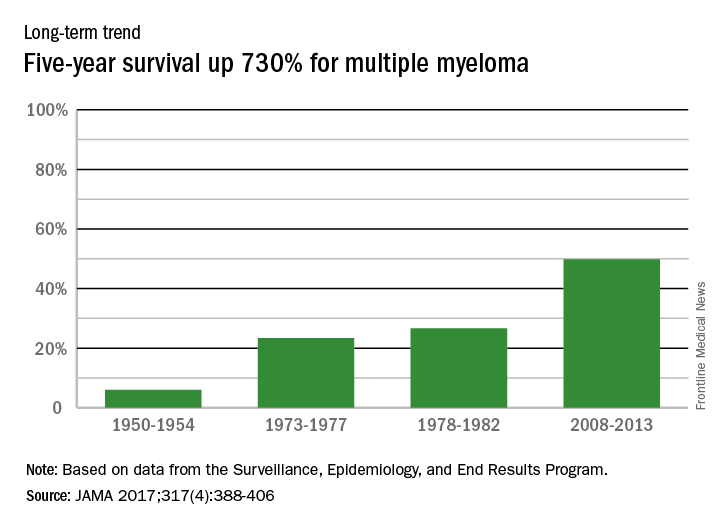
In 2014, there were about 13,000 deaths resulting from multiple myeloma, with 219,000 years of life lost, which ranked 17th among the 29 selected cancers, noted Dr. Mokdad and his associates at the Institute for Health Metrics and Evaluation at the University of Washington, Seattle.
FROM JAMA
Long view shows doubling of survival in non-Hodgkin lymphoma
Five-year survival for patients with non-Hodgkin lymphoma has more than doubled since the early 1950s, according to Ali H. Mokdad, PhD, and his associates.
Data from the Surveillance, Epidemiology, and End Results Program show that the 5-year relative survival rate for non-Hodgkin lymphoma in the United States went from 33% in 1950-1954 to 71.2% in 2008-2013, an increase of 116%, Dr. Mokdad and his associates reported (JAMA 2017;317[4]:388-406).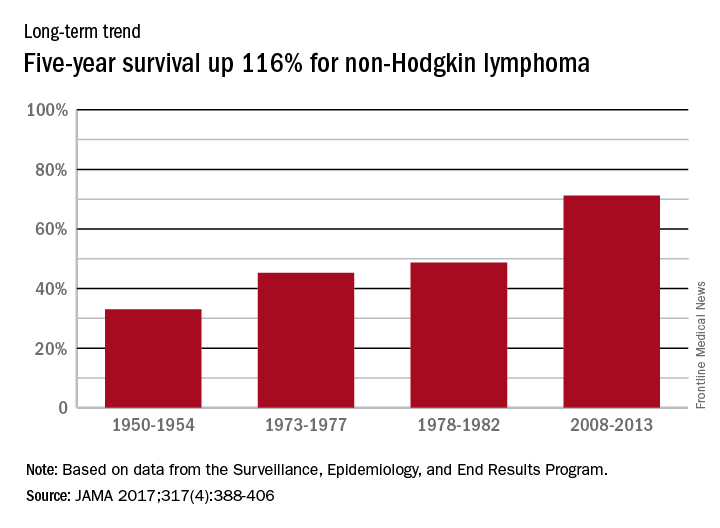
In 2014, mortality for non-Hodgkin lymphoma was the 7th highest among the 29 cancers included in the study, and more than 487,000 years of life were lost, which put it 6th among the 29 cancers, said Dr. Mokdad and his associates from the Institute for Health Metrics and Evaluation at the University of Washington, Seattle.
FROM JAMA
Hodgkin lymphoma survival has nearly tripled since the 1950s
Five-year relative survival for Hodgkin lymphoma increased 189% over the approximately 60 years from the early 1950s to 2013, according to investigators looking at data from the Surveillance, Epidemiology, and End Results Program.
During 1950-1954, the 5-year relative survival rate for Hodgkin lymphoma was 30%, compared with 86.6% in 2008-2013, said Ali H. Mokdad, PhD, and his associates at the Institute for Health Metrics and Evaluation at the University of Washington, Seattle.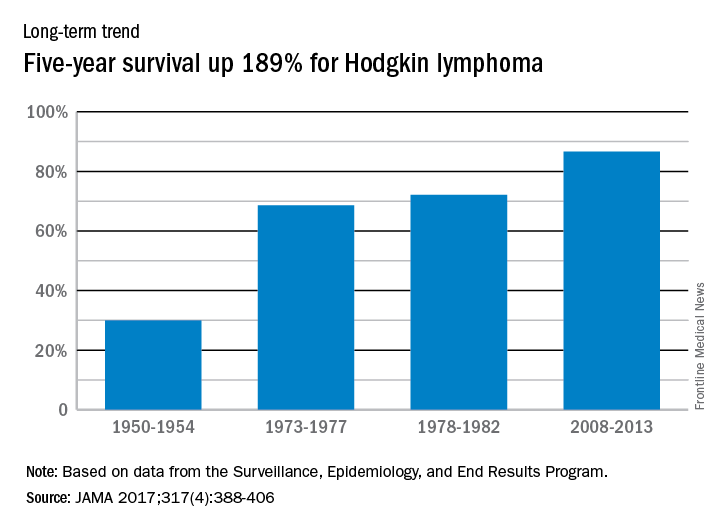
In 2014, mortality for Hodgkin lymphoma was 0.4 per 100,000 population, which put it 27th among the 29 included cancers, with about 36,000 years of life lost, which was 26th of the 29 cancers, Dr. Mokdad and his associates said. This part of their study used deidentified death records from the National Center for Health Statistics and population counts from the Census Bureau, the NCHS, and the Human Mortality Database.
FROM JAMA
Circulating DNA catches lymphoma relapse early
A newer technique aimed at detect circulating tumor DNA in the blood – cancer personalized profiling by deep sequencing (CAPP-Seq) – detected recurrence of diffuse large B cell lymphoma more than 6 months earlier than radiographic findings in a study at Stanford (Calif.) University, where the technique was invented.
The findings signal another win for “liquid biopsy,” the measurement of tumor DNA circulating in the blood, which is rapidly emerging as a quick and powerful tool for the diagnosis of a range of cancers and tumor subtypes, and prediction of tumor behavior and treatment response. Investigators at Stanford and elsewhere are studying liquid biopsy not only for lymphoma, but also for colorectal, thyroid, breast, prostate, and most other cancers. The Stanford team recently reported that its circulating DNA-detecting CAPP-Seq technique also helps in lung cancer.
In the new study, Stanford used CAPP-Seq (Cancer Personalized Profiling by deep Sequencing), which it called “an ultrasensitive capture-based targeted sequencing method” to analyze 166 plasma and 118 tissue samples from 92 patients with diffuse large B cell lymphoma (DLBCL) at diagnosis and various point afterward. The team compared the results to radiologic, and other standard diagnostic and monitoring techniques (Sci Transl Med. 2016 Nov 9;8[364]:364ra155).
At diagnosis, the amount of circulating DNA (ctDNA) correlated strongly with clinical indices and was independently predictive of patient outcomes; “whereas 100% of pretreatment samples had detectable ctDNA, only 37% of samples had abnormally high serum” lactate dehydrogenase, currently the most commonly used biomarker for DLBCL, said investigators, led by research fellow Florian Scherer, MD.
The group detected ctDNA in 73% of patients (8/11) who eventually relapsed a mean of 188 days before relapse was detected by standard-of-care radiologic techniques.
CAPP-Seq identified nine patients with a particular type of activated B cell-like tumor, for whom ibrutinib (Imbruvica) is particularly effective; ctDNA also predicted the transformation of indolent follicular lymphoma to DLBCL “with high sensitivity and specificity,” the group reported.
Stanford anticipates “ctDNA will have broad utility for dissecting tumor heterogeneity within and between patients with lymphomas and other cancer types, with applications for the identification of adverse risk groups, the discovery of resistance mechanisms to diverse therapies, and the development of risk-adapted therapeutics.”
The team said its approach “outperformed immunoglobulin sequencing and radiographic imaging for the detection of minimal residual disease and facilitated noninvasive identification of emergent resistance mutations to targeted therapies.” Meanwhile, while biomarkers hold “great promise for risk stratification and therapeutic targeting,” they are “currently difficult to measure in clinical settings,” the investigators said.
Roche bought the rights to CAPP-Seq from Stanford in 2015. Several authors are coinventors on patent applications for CAPP-Seq and also Roche consultants. Two are employees. Dr. Scherer had no disclosures. The work was funded by Stanford, the American Society of Hematology, the National Cancer Institute, and others.
FROM SCIENCE TRANSLATIONAL MEDICINE
Key clinical point: Major finding: Circulating tumor DNA was found in 73% of relapse patients a mean of 188 days before relapse was detected by standard-of-care radiologic techniques. Circulating tumor DNA was found in the plasma of 100% of patients at diagnosis, but only 37% had abnormally high serum lactate dehydrogenase, currently the most commonly used biomarker.
Data source: Analysis of 166 plasma and 118 tissue samples from 92 patients with diffuse large B cell lymphoma.
Disclosures: Roche bought the rights to CAPP-Seq from Stanford (Calif.) University in 2015. Several authors are coinventors on patent applications for CAPP-Seq and also Roche consults. Two are employees. The work was funded by Stanford, the American Society of Hematology, the National Cancer Institute, and others.
Study provides new insight into B-cell metabolism
the spleen of a mouse, showing
inactivated GSK3 (magenta)
in B cells (blue) near follicular
dendritic cells (green).
Image from the lab of
Robert Rickert, PhD
Research published in Nature Immunology helps explain how B-cell metabolism adapts to different environments.
The study suggests the protein GSK3 acts as a metabolic checkpoint regulator in B cells, promoting the survival of circulating B cells while limiting the growth and proliferation of B cells in germinal centers.
“Our research shows that the protein GSK3 plays a crucial role in helping B cells meet the energy needs of their distinct states,” said study author Robert Rickert, PhD, of Sanford Burnham Prebys Medical Discovery Institute in La Jolla, California.
“The findings are particularly relevant for certain B-cell pathologies, including lymphoma subtypes, where there is an increased demand for energy to support the hyperproliferation of cells in a microenvironment that may be limited in nutrients.”
Dr Rickert and his colleagues noted that B cells predominate in a quiescent state until they encounter an antigen, which prompts the cells to grow, proliferate, and differentiate.
The team’s new study showed that GSK3 adjusts B-cell metabolism to match the needs of these different cell states.
In circulating B cells, GSK3 limits overall metabolic activity. In proliferating B cells in germinal centers, GSK3 slows glycolysis and the production of mitochondria.
In fact, GSK3 function is essential for B-cell survival in germinal centers. To understand why, the researchers looked at how B cells in these regions generate energy.
The team found that because these B cells are so metabolically active, they consume nearly all available glucose. That switches on glycolysis.
High glycolytic activity leads to an accumulation of toxic reactive oxygen species, as does rapid manufacture of mitochondria, which tend to leak the same chemicals.
Thus, by restraining the metabolism in specific ways, GSK3 prevents cell death induced by reactive oxygen species.
“Our results were really surprising,” Dr Rickert said. “Until now, we would have thought that slowing metabolism would only be important for preventing B cells from becoming cancerous, which it indeed may be. These studies provide insight into the dynamic nature of B-cell metabolism that literally ‘fuels’ differentiation in the germinal center to produce an effective antibody response.”
“It’s not yet clear whether or how GSK3 might be a target for future therapies for B cell-related diseases, but this research opens a lot of doors for further studies. To start with, we plan to investigate how GSK3 is regulated in lymphoma and how that relates to changes in metabolism. That research could lead to new approaches to treating lymphoma.”
This research was performed in collaboration with scientists at Eli Lilly and the Lunenfeld-Tanenbaum Research Institute at the University of Toronto. Funding was provided by the National Institutes of Health, the Lilly Research Award Program, the Arthritis National Research Foundation, and the Canadian Institutes of Health Research. ![]()