User login
An A-Peeling Diagnosis
This icon represents the patient’s case. Each paragraph that follows represents the discussant’s thoughts.
A 39-year-old previously healthy man presented to the emergency department (ED) with abrupt-onset fever, headache, back pain, myalgias, chills, and photophobia. His past medical history included seasonal allergies and an episode of aseptic meningitis 8 years prior. He denied cough, dysuria, weakness, numbness, or visual changes. He denied using tobacco or injection drugs and rarely drank alcohol. His only medication was acetaminophen for fever.
The patient’s sudden fever indicates the rapid onset of an inflammatory state. While the headache and photophobia might be a result of an underlying systemic infection or an irritant like blood in the cerebral spinal fluid (CSF), one must consider meningitis. Potential sources for sudden meningitis include infectious, autoimmune (rheumatoid arthritis, systemic lupus erythematosus [SLE]), or drug-induced aseptic meningitis, and structural etiologies (ruptured cyst). Recrudescence of prior disease may also present acutely (Mollaret meningitis). Malignant etiologies, being more indolent, seem less likely. Back pain may indicate an epidural inflammatory process like epidural abscess; however, the patient denies risk factors such as injection drug use or recent procedures.
The patient’s temperature was 101.2 °F; blood pressure, 120/72 mm Hg; and heart rate, 112 bpm. He appeared comfortable, without meningismus or spinal tenderness. Pupils were reactive; eyes were without icterus, injection, or suffusion. Cardiac exam was normal. Lungs were clear to auscultation. He had no abdominal tenderness, hepatosplenomegaly, or lymphadenopathy. Cranial nerves II through XII, balance, coordination, strength, and sensation were intact. No rash was noted. Complete blood count (CBC), basic and hepatic chemistry panels, urinalysis, and serum lactate tests were within normal limits. Erythrocyte sedimentation rate (ESR) was elevated to 15 mm/h (normal range, 3-10 mm/h), C-reactive protein (CRP) to 2.4 mg/dL (normal range, <0.5 mg/dL), and procalcitonin to 0.07 ng/mL (normal range, <0.05 ng/mL). The patient was treated with intravenous (IV) fluids, ketorolac, dexamethasone, and acetaminophen, with resolution of symptoms. Given his rapid improvement, absence of meningismus, and lack of immunocompromise, lumbar puncture was deferred. A diagnosis of nonspecific viral syndrome was made. He was discharged home.
Certainly, a systemic infection (eg, influenza, adenovirus, arbovirus-related infection, HIV) could be a cause of this patient’s presentation. Notably, less than two-thirds of patients with meningitis present with the classic triad of fever, neck stiffness, and altered mental status. In this patient with fever, headache, and photophobia, aseptic meningitis should still be considered. While the negative procalcitonin and rapid clinical improvement without antibiotics make acute bacterial meningitis unlikely, nonbacterial causes of meningeal irritation can be severe and life-threatening. An assessment for jolt accentuation of the headache might have been helpful. Information about time of year, geographic exposures (vector-borne infections), and sick contacts (viral illness) can inform the clinical decision to pursue lumbar puncture. Additional history regarding his previous aseptic meningitis would be helpful, as it could suggest a recurrent inflammatory process. Causes of recurrent aseptic meningitis include infectious (herpes simplex virus [HSV], Epstein-Barr virus [EBV], syphilis), drug-related (nonsteroidal anti-inflammatory drugs [NSAIDs]), structural (epidermoid cyst with rupture), and autoimmune (lupus, Sjögren syndrome, Behçet disease) etiologies.
The mildly elevated inflammatory markers are nonspecific and reflect the patient’s known inflammatory state. The dexamethasone given for symptomatic management may have had some therapeutic effect in the setting of an autoimmune process, with additional contribution from ketorolac and acetaminophen.
He returned to the ED 3 days later with a pruritic, disseminated rash involving his palms and soles, accompanied by hand swelling and tingling. Although his headache and photophobia resolved, he reported a productive cough, nasal congestion, and sore throat. He also reported orange-pink urine without dysuria or urinary frequency. Additional questioning revealed a recent motorcycle trip to the Great Lakes region. During this trip, he did not camp, interact with animals or ticks, or swim in streams or lakes. He did not eat any raw, undercooked, or locally hunted meats. He denied new medications, soaps or detergents, or sexual contacts. He had started taking acetaminophen and ibuprofen around the clock since prior discharge.
The orange-pink urine and acute-onset palmoplantar rash with recent fever help narrow the differential. Orange-pink urine might suggest bilirubinuria from liver injury, hemolysis with hemoglobinuria, or myoglobinuria. Most concerning would be hematuria associated with glomerular injury and a systemic vasculopathy.
The rash on the palms and soles should be further characterized as blanching or nonblanching. Blanching, indicating vasodilation of intact blood vessels, is seen with many drug eruptions and viral exanthems. Nonblanching, suggesting broken capillaries (petechiae or purpura), would suggest vasculitis or vasculopathy from emboli, infection, or inflammation. A palmoplantar rash in febrile illness should first prompt evaluation for life-threatening conditions, followed by consideration of both infectious and noninfectious etiologies. Acutely fatal infections include Rocky Mountain spotted fever (RMSF), meningococcemia, toxic shock syndrome, infective endocarditis, and rat-bite fever. The rash, fever, headache, and outdoor exposure raise the possibility of a rickettsial infection, including RMSF, which can be contracted rarely around the Great Lakes. Other life-threatening infections seem unlikely, as the patient would have significantly deteriorated without proper medical care by now. Palmoplantar rash with fever can also be seen in other bacterial infections (eg, secondary syphilis, arbovirus infections, typhus) and in viral infections (eg, cytomegalovirus [CMV], EBV, human herpesvirus-6 [HHV-6], HIV, coxsackievirus, and papular-purpuric gloves and socks syndrome caused by parvovirus B19). Noninfectious considerations include drug hypersensitivity rashes, neoplasm (eg, cutaneous T-cell lymphoma), or inflammatory conditions (eg, SLE, vasculitis). Drug reaction with eosinophilia and systemic symptoms (may also present with severe illness.
The acetaminophen and ibuprofen may be masking ongoing fevers. The cough, nasal congestion, and sore throat might be part of a viral prodrome or, in tandem with fever, associated with a vasculitis such as granulomatosis with polyangiitis.

Vital signs were normal, and the patient appeared nontoxic. Physical examination demonstrated mildly cracked lips, oropharyngeal erythema with small petechiae on the soft palate, a morbilliform rash throughout his extremities and trunk (Figure 1), and confluent, brightly erythematous patches on his palms and soles with associated edema (Figure 2 and Appendix Figure). No lymphadenopathy, hepatosplenomegaly, or joint swelling was noted. CBC and basic chemistry panel remained normal; however, hepatic chemistries were notable for alanine aminotransferase (ALT) of 128 U/L, aspartate aminotransferase (AST) of 49 U/L, total bilirubin of 3.7 mg/dL, direct bilirubin of 2.4 mg/dL, total protein of 7.1 g/dL, albumin of 4.1 g/dL, and alkaline phosphatase of 197 U/L. Urinalysis detected bilirubin without blood, protein, bacteria, cells, or casts. The patient was admitted to the hospital.

The patient now has acute-onset upper respiratory symptoms with oral mucosal erythema, edema and erythema of the hands and feet with morbilliform rash of the extremities, and liver injury causing bilirubinuria. The patient’s initial symptoms may have had some response to therapy, but the current presentation suggests ongoing evolution of disease. Reactive infectious mucocutaneous eruptions include chlamydia, influenza, parainfluenza, and enteroviruses. Measles is possible given its recent resurgence; however, absence of coryza or Koplik spots and the peripheral distribution of the rash without initial truncal involvement make this less likely. Mycoplasma pneumonia–induced rash and mucositis might present with respiratory symptoms and this rash distribution, but typically involves two or more mucosal sites.
Iatrogenic causes are important to consider given the recent exposure to NSAIDs, specifically Stevens-Johnson syndrome/toxic epidermal necrolysis (SJS/TEN). In this patient, however, SJS/TEN is unlikely as it typically presents 1 to 3 weeks after exposure, with a truncal-predominant rash rarely involving the palms and soles.
Despite the absence of conjunctivitis and cervical lymphadenopathy, one additional consideration is Kawasaki disease (KD). Though more common in children, it may rarely present in adulthood. The time course of manifesting symptoms with potential steroid responsiveness raises suspicion for this diagnosis.
During a 4-day hospitalization, he developed mild bilateral conjunctivitis, peeling lips, and scleral icterus. CBC remained within normal limits. A peripheral smear demonstrated toxic neutrophilic granulation with normal erythrocytes and platelets. HIV and hepatitis A, B, and C serologies were negative. Blood cultures were negative. CRP and ESR increased to 4.3 mg/dL and 56 mm/h, respectively. Hepatic chemistries increased to ALT 155 U/L, AST 101 U/L, total bilirubin 5.1 mg/dL, direct bilirubin 3.3 mg/dL, and alkaline phosphatase 211 U/L. Right upper-quadrant ultrasound demonstrated gallbladder distention (11.3 cm × 5.0 cm; normal, 10.0 cm × 4.0 cm) without stones, wall thickening, or pericholecystic fluid; sonographic Murphy sign was negative. The liver was unremarkable with normal flow in the portal vein.
The patient’s persistent reactive neutrophilic granulation and rising CRP and ESR indicate ongoing inflammation. The largely direct hyperbilirubinemia with hepatitis, minimal findings on ultrasound imaging, and lack of Murphy sign suggest either direct infection of the liver or cholestasis. Viral serologies for EBV, HSV, and CMV should be sent, although these viruses are less commonly associated with oral rash and conjunctivitis. The marked degree of cholestasis makes adenovirus and mycoplasma less likely. Leptospirosis should be considered given the degree of liver injury with potential conjunctival suffusion. However, oral involvement would be atypical; renal injury is absent; and the patient denied pertinent exposures, vomiting, diarrhea, or persistent myalgias.
It is important to know whether the patient continued to receive
Low-grade fevers resolved without intervention. Tests were sent for tick-borne (ehrlichiosis, babesiosis, RMSF, anaplasmosis), viral (EBV, West Nile virus, parvovirus, CMV, coxsackievirus, adenovirus), other bacterial and protozoal (syphilis, Coxiella, leptospirosis, Lyme, Giardia), and autoimmune (antinuclear antibody, perinuclear antineutrophil cytoplasmic antibody, double-stranded DNA) diseases. Topical steroids and antihistamines were prescribed for a suspected viral exanthem. Empiric doxycycline was prescribed to treat possible tick-borne disease, and the patient was discharged home. At home, progressive darkening of the urine was noted. Outpatient testing demonstrated rising ALT to 377 U/L, AST to 183 U/L, total bilirubin to 5.9 mg/dL, direct bilirubin to 3.5 mg/dL, and alkaline phosphatase to 301 U/L. The patient was readmitted for further evaluation.
Despite concerns of the treating physicians, features of this case make tick-borne infections less likely. Lyme disease does not typically cause significant laboratory abnormalities and is classically associated with erythema migrans rather than a mucocutaneous rash. Relapsing fever, ehrlichioses, and rickettsial infections are associated with leukopenia and thrombocytopenia in addition to hepatocellular, rather than cholestatic, liver injury. The lack of response to doxycycline is helpful diagnostically: most tick-borne infections, in addition to leptospirosis, respond well to treatment. While babesiosis, tularemia, and Powassan or Heartland viruses transmitted by ticks are not treated with doxycycline, babesiosis often involves a hemolytic anemia (not seen in this case), and this patient’s laboratory abnormalities and rash are not characteristic of tularemia or viral tick-borne infections.
Either a new or reactivated viral infection with liver inflammation or an autoimmune etiology, specifically KD, remain the most likely etiology of the patient’s symptoms.
He remained asymptomatic during a 6-day hospitalization. His oral lesions resolved. The morbilliform rash coalesced into confluent macules with fine desquamation on the extremities and trunk. There was prominent periungual and palmar/plantar desquamation (Figure 3 and Figure 4). CBC demonstrated hemoglobin of 12.6 g/dL and platelets of 399,000/μL. CRP was undetectable at <0.5 mg/dL; however, ESR increased to 110 mm/h. Transaminases increased to ALT 551 U/L and AST 219 U/L. Serum alkaline phosphatase and bilirubin decreased without intervention. Albumin and total protein remained unchanged. All infectious and autoimmune testing sent from the prior admission returned negative.

An acute-onset viral-like prodrome with fevers potentially responsive to steroids, followed by conjunctivitis, oral erythema and cracked lips, morbilliform rash with hand and foot erythema and edema, cholestatic hepatitis, and subsequent periungual desquamation is highly suggestive of KD. It would be interesting to revisit the patient’s prior episode of aseptic meningitis to see whether any other symptoms were suggestive of KD. While intravenous immunoglobulin (IVIg) and aspirin are standard therapies for the acute febrile phase of KD, the patient is now nearly 2 weeks into his clinical course, rendering their utility uncertain. Nonetheless, screening for coronary aneurysms should be pursued, which may help confirm the diagnosis.

Upon reviewing the evolution of the findings, a diagnosis of adult-onset KD was made. IVIg 2g/kg and aspirin 325 mg were administered. Echocardiogram did not show any evidence of coronary artery aneurysm, myocarditis, pericarditis, wall motion abnormalities, or pericardial effusion. Computed tomography (CT) coronary angiogram confirmed normal coronary arteries without aneurysm. The patient was discharged home without fever on daily aspirin, and all hepatic chemistries and inflammatory markers normalized. Follow-up cardiac magnetic resonance imaging at 3 months and CT angiogram at 6 months remained normal. The patient remains well now 2 years after the original diagnosis and treatment.
DISCUSSION
KD, also known as mucocutaneous lymph node syndrome, is a vasculitis that typically affects children younger than 5 years.1 Having a sibling with KD confers a 10- to 15-fold higher risk, suggesting a genetic component to the disease.2 The highest incidence of KD is in persons of East Asian descent, but KD can affect patients of all races and ethnicities. In the United States, the majority of patients with KD are non-Hispanic White, followed by Black, Hispanic, and Asian.3 The etiology is still unknown, but it is posited that an unidentified, ubiquitous infectious agent may trigger KD in genetically susceptible individuals.4
KD can cause aneurysms and thromboses in medium-sized blood vessels throughout the body.5,6 The classic presentation involves 5 days of high fever plus four or more of the symptoms in the mnemonic CRASH: conjunctival injection, rash (polymorphous), adenopathy (cervical), strawberry tongue (or red, cracked lips and oropharyngeal edema), hand (erythema and induration of hands or feet, followed by periungual desquamation).7 Multiple organ systems may be affected, manifesting as abdominal pain, arthritis, pneumonitis, aseptic meningitis, and acalculous distention of the gallbladder (hydrops).7 The most feared consequence is coronary artery involvement, which leads to aneurysm, thrombosis, and sudden death.
Though no definitive diagnostic test exists, certain laboratory findings support the diagnosis, such as sterile pyuria, thrombocytosis, elevated CRP and ESR, transaminitis, and hypoalbuminemia.7 Diagnosis requires exclusion of illnesses with similar presentations, such as bacterial, viral, and tick-borne infections; drug hypersensitivity reactions; toxic shock syndrome; scarlet fever; juvenile rheumatoid arthritis; and other rheumatologic conditions. Some cases of KD present with fewer than four of the principal (CRASH) symptoms—these are termed “incomplete” KD. The combination of supportive laboratory findings and echocardiogram can facilitate diagnosis of incomplete KD, which carries a similar risk of coronary artery aneurysm.7
Though primarily a disease of childhood, KD can present in adults.8 Adults, compared with children, are less likely to have thrombocytosis and more likely to have cervical adenopathy, arthralgias, and hepatic test abnormalities.8 Although coronary artery aneurysms occur less frequently in adults compared with children, timely diagnosis and treatment is key to preventing this life-threatening complication.8
In children, treatment is IVIg 2 g/kg and aspirin 80 to 100 mg/kg daily until afebrile for several days.9 Some require a second dose of IVIg.9 Children are then maintained on 3 to 5 mg/kg of aspirin daily for 6 to 8 weeks.9 IVIg, given within 10 days of the onset of fever, is highly effective at preventing coronary artery aneurysms.10,11 When coronary aneurysms do occur, treatment is with aspirin or clopidogrel. Very large aneurysms require systemic anticoagulation. After the acute illness, children are monitored with serial cardiac imaging at 2 weeks and 6 to 8 weeks after diagnosis.7 In adults, the optimal imaging timing is unknown. Echocardiography often cannot visualize the coronary arteries, necessitating coronary CT angiography or cardiac MRI.
Despite the presence of classic features, this patient’s diagnosis was delayed because of the rarity of KD in adults and the need to exclude more common diseases. Furthermore, the administration of dexamethasone likely shortened his febrile period and ameliorated some symptoms,12 affecting the natural history of his illness. The diagnosis relied on three components: ruling out common diagnoses, noting two unusual findings (gallbladder hydrops, desquamating periungual rash), and broadening the differential to include adult presentations of childhood disease. Review of the literature suggests very few causes for gallbladder hydrops: impacted stones, cystic fibrosis, cystic duct narrowing due to tumor or lymph nodes, KD, and bacterial and parasitic disease (eg, salmonella, ascariasis). Gallbladder hydrops and periungual desquamation are seen together only in KD.13 Given the complexity of diagnosis in adults, the time to diagnosis is often delayed compared with that for children. While IVIg treatment is preferred within 10 days of the onset of fever, this patient received IVIg on day 14, given the relatively benign nature of IVIg and the considerable morbidity associated with coronary artery aneurysms. Dosing for aspirin is unclear in adults.8 This patient was started on 325 mg aspirin daily. He recovered fully and remains free of coronary changes at two years after initial diagnosis. This case is an excellent reminder that, after exclusion of common diagnoses, reflection on the most unusual aspects of the case and consideration of childhood diseases is particularly important in our younger patients.
TEACHING POINTS
- Extended fever should broaden the differential to include rheumatologic diagnoses.
- KD is rare in adults but can present with classic findings from childhood.
- Early treatment with IVIg and aspirin can be lifesaving in patients with KD, including adults.
1. Kawasaki T. Acute febrile mucocutaneous syndrome with lymphoid involvement with specific desquamation of the fingers and toes in children. Article in Japanese. Arerugi. 1967;16(3):178-222.
2. Burgner D, Harnden A. Kawasaki disease: what is the epidemiology telling us about the etiology? Int J Infect Dis. 2005;9(4):185-194. https://doi.org/10.1016/j.ijid.2005.03.002
3. Holman RC, Belay ED, Christensen KY, Folkema AM, Steiner CA, Schonberger LB. Hospitalizations for Kawasaki syndrome among children in the United States, 1997-2007. Pediatr Infect Dis J. 2010;29(6):483-488. https://doi.org/10.1097/INF.0b013e3181cf8705
4. Rowley A, Baker S, Arollo D, et al. A hepacivirus-like protein is targeted by the antibody response to Kawasaki disease (KD) [abstract]. Open Forum Infect Dis. 2019;6(suppl 2):S48.
5. Friedman KG, Gauvreau K, Hamaoka-Okamoto A, et al. Coronary artery aneurysms in Kawasaki disease: risk factors for progressive disease and adverse cardiac events in the US population. J Am Heart Assoc. 2016;5(9):e003289. https://doi.org/10.1161/JAHA.116.003289
6. Zhao QM, Chu C, Wu L, et al. Systemic artery aneurysms and Kawasaki disease. Pediatrics. 2019;144(6):e20192254. https://doi.org/10.1542/peds.2019-2254
7. Newburger JW, Takahashi M, Gerber MA, et al. Diagnosis, treatment, and long-term management of Kawasaki disease: a statement for health professionals from the Committee on Rheumatic Fever, Endocarditis, and Kawasaki Disease, Council on Cardiovascular Disease in the Young, American Heart Association. Pediatrics. 2004;114(6):1708-1733. https://doi.org/10.1542/peds.2004-2182
8. Sève P, Stankovic K, Smail A, Durand DV, Marchand G, Broussolle C. Adult Kawasaki disease: report of two cases and literature review. Semin Arthritis Rheum. 2005;34(6):785-792. https://doi.org/10.1016/j.semarthrit.2005.01.012
9. Shulman ST. Intravenous immunoglobulin for the treatment of Kawasaki disease. Pediatr Ann. 2017;46(1):e25-e28. https://doi.org/10.3928/19382359-20161212-01
10. Newburger JW, Takahashi M, Burns JC, et al. The treatment of Kawasaki syndrome with intravenous gamma globulin. N Engl J Med. 1986;315(6):341-347. https://doi.org/10.1056/NEJM198608073150601
11. Rowley AH, Duffy CE, Shulman ST. Prevention of giant coronary artery aneurysms in Kawasaki disease by intravenous gamma globulin therapy. J Pediatr. 1988;113(2):290-294. https://doi/org/10.1016/s0022-3476(88)80267-1
12. Lim YJ, Jung JW. Clinical outcomes of initial dexamethasone treatment combined with a single high dose of intravenous immunoglobulin for primary treatment of Kawasaki disease. Yonsei Med J. 2014;55(5):1260-1266. https://doi.org/10.3349/ymj.2014.55.5.1260
13. Sun Q, Zhang J, Yang Y. Gallbladder hydrops associated with Kawasaki disease: a case report and literature review. Clin Pediatr (Phila). 2018;57(3):341-343. https://doi.org/10.1177/0009922817696468
This icon represents the patient’s case. Each paragraph that follows represents the discussant’s thoughts.
A 39-year-old previously healthy man presented to the emergency department (ED) with abrupt-onset fever, headache, back pain, myalgias, chills, and photophobia. His past medical history included seasonal allergies and an episode of aseptic meningitis 8 years prior. He denied cough, dysuria, weakness, numbness, or visual changes. He denied using tobacco or injection drugs and rarely drank alcohol. His only medication was acetaminophen for fever.
The patient’s sudden fever indicates the rapid onset of an inflammatory state. While the headache and photophobia might be a result of an underlying systemic infection or an irritant like blood in the cerebral spinal fluid (CSF), one must consider meningitis. Potential sources for sudden meningitis include infectious, autoimmune (rheumatoid arthritis, systemic lupus erythematosus [SLE]), or drug-induced aseptic meningitis, and structural etiologies (ruptured cyst). Recrudescence of prior disease may also present acutely (Mollaret meningitis). Malignant etiologies, being more indolent, seem less likely. Back pain may indicate an epidural inflammatory process like epidural abscess; however, the patient denies risk factors such as injection drug use or recent procedures.
The patient’s temperature was 101.2 °F; blood pressure, 120/72 mm Hg; and heart rate, 112 bpm. He appeared comfortable, without meningismus or spinal tenderness. Pupils were reactive; eyes were without icterus, injection, or suffusion. Cardiac exam was normal. Lungs were clear to auscultation. He had no abdominal tenderness, hepatosplenomegaly, or lymphadenopathy. Cranial nerves II through XII, balance, coordination, strength, and sensation were intact. No rash was noted. Complete blood count (CBC), basic and hepatic chemistry panels, urinalysis, and serum lactate tests were within normal limits. Erythrocyte sedimentation rate (ESR) was elevated to 15 mm/h (normal range, 3-10 mm/h), C-reactive protein (CRP) to 2.4 mg/dL (normal range, <0.5 mg/dL), and procalcitonin to 0.07 ng/mL (normal range, <0.05 ng/mL). The patient was treated with intravenous (IV) fluids, ketorolac, dexamethasone, and acetaminophen, with resolution of symptoms. Given his rapid improvement, absence of meningismus, and lack of immunocompromise, lumbar puncture was deferred. A diagnosis of nonspecific viral syndrome was made. He was discharged home.
Certainly, a systemic infection (eg, influenza, adenovirus, arbovirus-related infection, HIV) could be a cause of this patient’s presentation. Notably, less than two-thirds of patients with meningitis present with the classic triad of fever, neck stiffness, and altered mental status. In this patient with fever, headache, and photophobia, aseptic meningitis should still be considered. While the negative procalcitonin and rapid clinical improvement without antibiotics make acute bacterial meningitis unlikely, nonbacterial causes of meningeal irritation can be severe and life-threatening. An assessment for jolt accentuation of the headache might have been helpful. Information about time of year, geographic exposures (vector-borne infections), and sick contacts (viral illness) can inform the clinical decision to pursue lumbar puncture. Additional history regarding his previous aseptic meningitis would be helpful, as it could suggest a recurrent inflammatory process. Causes of recurrent aseptic meningitis include infectious (herpes simplex virus [HSV], Epstein-Barr virus [EBV], syphilis), drug-related (nonsteroidal anti-inflammatory drugs [NSAIDs]), structural (epidermoid cyst with rupture), and autoimmune (lupus, Sjögren syndrome, Behçet disease) etiologies.
The mildly elevated inflammatory markers are nonspecific and reflect the patient’s known inflammatory state. The dexamethasone given for symptomatic management may have had some therapeutic effect in the setting of an autoimmune process, with additional contribution from ketorolac and acetaminophen.
He returned to the ED 3 days later with a pruritic, disseminated rash involving his palms and soles, accompanied by hand swelling and tingling. Although his headache and photophobia resolved, he reported a productive cough, nasal congestion, and sore throat. He also reported orange-pink urine without dysuria or urinary frequency. Additional questioning revealed a recent motorcycle trip to the Great Lakes region. During this trip, he did not camp, interact with animals or ticks, or swim in streams or lakes. He did not eat any raw, undercooked, or locally hunted meats. He denied new medications, soaps or detergents, or sexual contacts. He had started taking acetaminophen and ibuprofen around the clock since prior discharge.
The orange-pink urine and acute-onset palmoplantar rash with recent fever help narrow the differential. Orange-pink urine might suggest bilirubinuria from liver injury, hemolysis with hemoglobinuria, or myoglobinuria. Most concerning would be hematuria associated with glomerular injury and a systemic vasculopathy.
The rash on the palms and soles should be further characterized as blanching or nonblanching. Blanching, indicating vasodilation of intact blood vessels, is seen with many drug eruptions and viral exanthems. Nonblanching, suggesting broken capillaries (petechiae or purpura), would suggest vasculitis or vasculopathy from emboli, infection, or inflammation. A palmoplantar rash in febrile illness should first prompt evaluation for life-threatening conditions, followed by consideration of both infectious and noninfectious etiologies. Acutely fatal infections include Rocky Mountain spotted fever (RMSF), meningococcemia, toxic shock syndrome, infective endocarditis, and rat-bite fever. The rash, fever, headache, and outdoor exposure raise the possibility of a rickettsial infection, including RMSF, which can be contracted rarely around the Great Lakes. Other life-threatening infections seem unlikely, as the patient would have significantly deteriorated without proper medical care by now. Palmoplantar rash with fever can also be seen in other bacterial infections (eg, secondary syphilis, arbovirus infections, typhus) and in viral infections (eg, cytomegalovirus [CMV], EBV, human herpesvirus-6 [HHV-6], HIV, coxsackievirus, and papular-purpuric gloves and socks syndrome caused by parvovirus B19). Noninfectious considerations include drug hypersensitivity rashes, neoplasm (eg, cutaneous T-cell lymphoma), or inflammatory conditions (eg, SLE, vasculitis). Drug reaction with eosinophilia and systemic symptoms (may also present with severe illness.
The acetaminophen and ibuprofen may be masking ongoing fevers. The cough, nasal congestion, and sore throat might be part of a viral prodrome or, in tandem with fever, associated with a vasculitis such as granulomatosis with polyangiitis.
Vital signs were normal, and the patient appeared nontoxic. Physical examination demonstrated mildly cracked lips, oropharyngeal erythema with small petechiae on the soft palate, a morbilliform rash throughout his extremities and trunk (Figure 1), and confluent, brightly erythematous patches on his palms and soles with associated edema (Figure 2 and Appendix Figure). No lymphadenopathy, hepatosplenomegaly, or joint swelling was noted. CBC and basic chemistry panel remained normal; however, hepatic chemistries were notable for alanine aminotransferase (ALT) of 128 U/L, aspartate aminotransferase (AST) of 49 U/L, total bilirubin of 3.7 mg/dL, direct bilirubin of 2.4 mg/dL, total protein of 7.1 g/dL, albumin of 4.1 g/dL, and alkaline phosphatase of 197 U/L. Urinalysis detected bilirubin without blood, protein, bacteria, cells, or casts. The patient was admitted to the hospital.
The patient now has acute-onset upper respiratory symptoms with oral mucosal erythema, edema and erythema of the hands and feet with morbilliform rash of the extremities, and liver injury causing bilirubinuria. The patient’s initial symptoms may have had some response to therapy, but the current presentation suggests ongoing evolution of disease. Reactive infectious mucocutaneous eruptions include chlamydia, influenza, parainfluenza, and enteroviruses. Measles is possible given its recent resurgence; however, absence of coryza or Koplik spots and the peripheral distribution of the rash without initial truncal involvement make this less likely. Mycoplasma pneumonia–induced rash and mucositis might present with respiratory symptoms and this rash distribution, but typically involves two or more mucosal sites.
Iatrogenic causes are important to consider given the recent exposure to NSAIDs, specifically Stevens-Johnson syndrome/toxic epidermal necrolysis (SJS/TEN). In this patient, however, SJS/TEN is unlikely as it typically presents 1 to 3 weeks after exposure, with a truncal-predominant rash rarely involving the palms and soles.
Despite the absence of conjunctivitis and cervical lymphadenopathy, one additional consideration is Kawasaki disease (KD). Though more common in children, it may rarely present in adulthood. The time course of manifesting symptoms with potential steroid responsiveness raises suspicion for this diagnosis.
During a 4-day hospitalization, he developed mild bilateral conjunctivitis, peeling lips, and scleral icterus. CBC remained within normal limits. A peripheral smear demonstrated toxic neutrophilic granulation with normal erythrocytes and platelets. HIV and hepatitis A, B, and C serologies were negative. Blood cultures were negative. CRP and ESR increased to 4.3 mg/dL and 56 mm/h, respectively. Hepatic chemistries increased to ALT 155 U/L, AST 101 U/L, total bilirubin 5.1 mg/dL, direct bilirubin 3.3 mg/dL, and alkaline phosphatase 211 U/L. Right upper-quadrant ultrasound demonstrated gallbladder distention (11.3 cm × 5.0 cm; normal, 10.0 cm × 4.0 cm) without stones, wall thickening, or pericholecystic fluid; sonographic Murphy sign was negative. The liver was unremarkable with normal flow in the portal vein.
The patient’s persistent reactive neutrophilic granulation and rising CRP and ESR indicate ongoing inflammation. The largely direct hyperbilirubinemia with hepatitis, minimal findings on ultrasound imaging, and lack of Murphy sign suggest either direct infection of the liver or cholestasis. Viral serologies for EBV, HSV, and CMV should be sent, although these viruses are less commonly associated with oral rash and conjunctivitis. The marked degree of cholestasis makes adenovirus and mycoplasma less likely. Leptospirosis should be considered given the degree of liver injury with potential conjunctival suffusion. However, oral involvement would be atypical; renal injury is absent; and the patient denied pertinent exposures, vomiting, diarrhea, or persistent myalgias.
It is important to know whether the patient continued to receive
Low-grade fevers resolved without intervention. Tests were sent for tick-borne (ehrlichiosis, babesiosis, RMSF, anaplasmosis), viral (EBV, West Nile virus, parvovirus, CMV, coxsackievirus, adenovirus), other bacterial and protozoal (syphilis, Coxiella, leptospirosis, Lyme, Giardia), and autoimmune (antinuclear antibody, perinuclear antineutrophil cytoplasmic antibody, double-stranded DNA) diseases. Topical steroids and antihistamines were prescribed for a suspected viral exanthem. Empiric doxycycline was prescribed to treat possible tick-borne disease, and the patient was discharged home. At home, progressive darkening of the urine was noted. Outpatient testing demonstrated rising ALT to 377 U/L, AST to 183 U/L, total bilirubin to 5.9 mg/dL, direct bilirubin to 3.5 mg/dL, and alkaline phosphatase to 301 U/L. The patient was readmitted for further evaluation.
Despite concerns of the treating physicians, features of this case make tick-borne infections less likely. Lyme disease does not typically cause significant laboratory abnormalities and is classically associated with erythema migrans rather than a mucocutaneous rash. Relapsing fever, ehrlichioses, and rickettsial infections are associated with leukopenia and thrombocytopenia in addition to hepatocellular, rather than cholestatic, liver injury. The lack of response to doxycycline is helpful diagnostically: most tick-borne infections, in addition to leptospirosis, respond well to treatment. While babesiosis, tularemia, and Powassan or Heartland viruses transmitted by ticks are not treated with doxycycline, babesiosis often involves a hemolytic anemia (not seen in this case), and this patient’s laboratory abnormalities and rash are not characteristic of tularemia or viral tick-borne infections.
Either a new or reactivated viral infection with liver inflammation or an autoimmune etiology, specifically KD, remain the most likely etiology of the patient’s symptoms.
He remained asymptomatic during a 6-day hospitalization. His oral lesions resolved. The morbilliform rash coalesced into confluent macules with fine desquamation on the extremities and trunk. There was prominent periungual and palmar/plantar desquamation (Figure 3 and Figure 4). CBC demonstrated hemoglobin of 12.6 g/dL and platelets of 399,000/μL. CRP was undetectable at <0.5 mg/dL; however, ESR increased to 110 mm/h. Transaminases increased to ALT 551 U/L and AST 219 U/L. Serum alkaline phosphatase and bilirubin decreased without intervention. Albumin and total protein remained unchanged. All infectious and autoimmune testing sent from the prior admission returned negative.
An acute-onset viral-like prodrome with fevers potentially responsive to steroids, followed by conjunctivitis, oral erythema and cracked lips, morbilliform rash with hand and foot erythema and edema, cholestatic hepatitis, and subsequent periungual desquamation is highly suggestive of KD. It would be interesting to revisit the patient’s prior episode of aseptic meningitis to see whether any other symptoms were suggestive of KD. While intravenous immunoglobulin (IVIg) and aspirin are standard therapies for the acute febrile phase of KD, the patient is now nearly 2 weeks into his clinical course, rendering their utility uncertain. Nonetheless, screening for coronary aneurysms should be pursued, which may help confirm the diagnosis.
Upon reviewing the evolution of the findings, a diagnosis of adult-onset KD was made. IVIg 2g/kg and aspirin 325 mg were administered. Echocardiogram did not show any evidence of coronary artery aneurysm, myocarditis, pericarditis, wall motion abnormalities, or pericardial effusion. Computed tomography (CT) coronary angiogram confirmed normal coronary arteries without aneurysm. The patient was discharged home without fever on daily aspirin, and all hepatic chemistries and inflammatory markers normalized. Follow-up cardiac magnetic resonance imaging at 3 months and CT angiogram at 6 months remained normal. The patient remains well now 2 years after the original diagnosis and treatment.
DISCUSSION
KD, also known as mucocutaneous lymph node syndrome, is a vasculitis that typically affects children younger than 5 years.1 Having a sibling with KD confers a 10- to 15-fold higher risk, suggesting a genetic component to the disease.2 The highest incidence of KD is in persons of East Asian descent, but KD can affect patients of all races and ethnicities. In the United States, the majority of patients with KD are non-Hispanic White, followed by Black, Hispanic, and Asian.3 The etiology is still unknown, but it is posited that an unidentified, ubiquitous infectious agent may trigger KD in genetically susceptible individuals.4
KD can cause aneurysms and thromboses in medium-sized blood vessels throughout the body.5,6 The classic presentation involves 5 days of high fever plus four or more of the symptoms in the mnemonic CRASH: conjunctival injection, rash (polymorphous), adenopathy (cervical), strawberry tongue (or red, cracked lips and oropharyngeal edema), hand (erythema and induration of hands or feet, followed by periungual desquamation).7 Multiple organ systems may be affected, manifesting as abdominal pain, arthritis, pneumonitis, aseptic meningitis, and acalculous distention of the gallbladder (hydrops).7 The most feared consequence is coronary artery involvement, which leads to aneurysm, thrombosis, and sudden death.
Though no definitive diagnostic test exists, certain laboratory findings support the diagnosis, such as sterile pyuria, thrombocytosis, elevated CRP and ESR, transaminitis, and hypoalbuminemia.7 Diagnosis requires exclusion of illnesses with similar presentations, such as bacterial, viral, and tick-borne infections; drug hypersensitivity reactions; toxic shock syndrome; scarlet fever; juvenile rheumatoid arthritis; and other rheumatologic conditions. Some cases of KD present with fewer than four of the principal (CRASH) symptoms—these are termed “incomplete” KD. The combination of supportive laboratory findings and echocardiogram can facilitate diagnosis of incomplete KD, which carries a similar risk of coronary artery aneurysm.7
Though primarily a disease of childhood, KD can present in adults.8 Adults, compared with children, are less likely to have thrombocytosis and more likely to have cervical adenopathy, arthralgias, and hepatic test abnormalities.8 Although coronary artery aneurysms occur less frequently in adults compared with children, timely diagnosis and treatment is key to preventing this life-threatening complication.8
In children, treatment is IVIg 2 g/kg and aspirin 80 to 100 mg/kg daily until afebrile for several days.9 Some require a second dose of IVIg.9 Children are then maintained on 3 to 5 mg/kg of aspirin daily for 6 to 8 weeks.9 IVIg, given within 10 days of the onset of fever, is highly effective at preventing coronary artery aneurysms.10,11 When coronary aneurysms do occur, treatment is with aspirin or clopidogrel. Very large aneurysms require systemic anticoagulation. After the acute illness, children are monitored with serial cardiac imaging at 2 weeks and 6 to 8 weeks after diagnosis.7 In adults, the optimal imaging timing is unknown. Echocardiography often cannot visualize the coronary arteries, necessitating coronary CT angiography or cardiac MRI.
Despite the presence of classic features, this patient’s diagnosis was delayed because of the rarity of KD in adults and the need to exclude more common diseases. Furthermore, the administration of dexamethasone likely shortened his febrile period and ameliorated some symptoms,12 affecting the natural history of his illness. The diagnosis relied on three components: ruling out common diagnoses, noting two unusual findings (gallbladder hydrops, desquamating periungual rash), and broadening the differential to include adult presentations of childhood disease. Review of the literature suggests very few causes for gallbladder hydrops: impacted stones, cystic fibrosis, cystic duct narrowing due to tumor or lymph nodes, KD, and bacterial and parasitic disease (eg, salmonella, ascariasis). Gallbladder hydrops and periungual desquamation are seen together only in KD.13 Given the complexity of diagnosis in adults, the time to diagnosis is often delayed compared with that for children. While IVIg treatment is preferred within 10 days of the onset of fever, this patient received IVIg on day 14, given the relatively benign nature of IVIg and the considerable morbidity associated with coronary artery aneurysms. Dosing for aspirin is unclear in adults.8 This patient was started on 325 mg aspirin daily. He recovered fully and remains free of coronary changes at two years after initial diagnosis. This case is an excellent reminder that, after exclusion of common diagnoses, reflection on the most unusual aspects of the case and consideration of childhood diseases is particularly important in our younger patients.
TEACHING POINTS
- Extended fever should broaden the differential to include rheumatologic diagnoses.
- KD is rare in adults but can present with classic findings from childhood.
- Early treatment with IVIg and aspirin can be lifesaving in patients with KD, including adults.
1. Kawasaki T. Acute febrile mucocutaneous syndrome with lymphoid involvement with specific desquamation of the fingers and toes in children. Article in Japanese. Arerugi. 1967;16(3):178-222.
2. Burgner D, Harnden A. Kawasaki disease: what is the epidemiology telling us about the etiology? Int J Infect Dis. 2005;9(4):185-194. https://doi.org/10.1016/j.ijid.2005.03.002
3. Holman RC, Belay ED, Christensen KY, Folkema AM, Steiner CA, Schonberger LB. Hospitalizations for Kawasaki syndrome among children in the United States, 1997-2007. Pediatr Infect Dis J. 2010;29(6):483-488. https://doi.org/10.1097/INF.0b013e3181cf8705
4. Rowley A, Baker S, Arollo D, et al. A hepacivirus-like protein is targeted by the antibody response to Kawasaki disease (KD) [abstract]. Open Forum Infect Dis. 2019;6(suppl 2):S48.
5. Friedman KG, Gauvreau K, Hamaoka-Okamoto A, et al. Coronary artery aneurysms in Kawasaki disease: risk factors for progressive disease and adverse cardiac events in the US population. J Am Heart Assoc. 2016;5(9):e003289. https://doi.org/10.1161/JAHA.116.003289
6. Zhao QM, Chu C, Wu L, et al. Systemic artery aneurysms and Kawasaki disease. Pediatrics. 2019;144(6):e20192254. https://doi.org/10.1542/peds.2019-2254
7. Newburger JW, Takahashi M, Gerber MA, et al. Diagnosis, treatment, and long-term management of Kawasaki disease: a statement for health professionals from the Committee on Rheumatic Fever, Endocarditis, and Kawasaki Disease, Council on Cardiovascular Disease in the Young, American Heart Association. Pediatrics. 2004;114(6):1708-1733. https://doi.org/10.1542/peds.2004-2182
8. Sève P, Stankovic K, Smail A, Durand DV, Marchand G, Broussolle C. Adult Kawasaki disease: report of two cases and literature review. Semin Arthritis Rheum. 2005;34(6):785-792. https://doi.org/10.1016/j.semarthrit.2005.01.012
9. Shulman ST. Intravenous immunoglobulin for the treatment of Kawasaki disease. Pediatr Ann. 2017;46(1):e25-e28. https://doi.org/10.3928/19382359-20161212-01
10. Newburger JW, Takahashi M, Burns JC, et al. The treatment of Kawasaki syndrome with intravenous gamma globulin. N Engl J Med. 1986;315(6):341-347. https://doi.org/10.1056/NEJM198608073150601
11. Rowley AH, Duffy CE, Shulman ST. Prevention of giant coronary artery aneurysms in Kawasaki disease by intravenous gamma globulin therapy. J Pediatr. 1988;113(2):290-294. https://doi/org/10.1016/s0022-3476(88)80267-1
12. Lim YJ, Jung JW. Clinical outcomes of initial dexamethasone treatment combined with a single high dose of intravenous immunoglobulin for primary treatment of Kawasaki disease. Yonsei Med J. 2014;55(5):1260-1266. https://doi.org/10.3349/ymj.2014.55.5.1260
13. Sun Q, Zhang J, Yang Y. Gallbladder hydrops associated with Kawasaki disease: a case report and literature review. Clin Pediatr (Phila). 2018;57(3):341-343. https://doi.org/10.1177/0009922817696468
© 2021 Society of Hospital Medicine
Out of Sight, Not Out of Mind
A 73-year-old man presented to clinic with 6 weeks of headache. He occasionally experienced generalized headaches throughout his life that resolved with naproxen. His new headache was characterized by a progressively worsening sensation of left-eye pressure with radiation to the left temple. Over the previous week, he had intermittent diplopia, left ptosis, and left lacrimation. He denied head trauma, fever, vision loss, photophobia, dysphagia, dysarthria, nausea, vomiting, or jaw claudication.
Primary headaches include tension type, migraine, and trigeminal autonomic cephalalgias (eg, cluster headache). A new headache in an older patient, particularly if protracted and progressive, prioritizes consideration of a secondary headache, which may reflect pathology within the brain parenchyma (eg, intracranial mass), blood vessels (eg, giant cell arteritis), meninges (eg, meningitis), or ventricles (eg, intraventricular cyst). Eye pain may arise from ocular and extraocular disease. Corneal abrasions, infectious keratitis, scleritis, uveitis, or acute angle-closure glaucoma are painful, although the latter is less likely given the prolonged duration of symptoms. Thyroid eye disease or other infiltrative disorders of the orbit can also cause eye discomfort.
Ptosis commonly results from degeneration of the levator aponeurosis. Other causes include third cranial nerve palsy and myasthenia gravis. Interruption of sympathetic innervation of the eyelid by lesions in the brain stem, spinal cord, lung (eg, Pancoast tumor), or cavernous sinus also can result in ptosis.
Whether the patient has monocular or binocular diplopia is uncertain. Monocular diplopia persists with only one eye open and can arise from uncorrected refractive error, corneal irregularities, lenticular opacities, or unilateral macular disease. Binocular diplopia develops from ocular misalignment due to neuromuscular weakness, extraocular muscle entrapment, or an orbital mass displacing the globe. An orbital mass would also explain the unilateral headache and unilateral ptosis.
His medical history included coronary artery disease, seronegative rheumatoid arthritis, osteoporosis, benign prostatic hypertrophy, and ureteral strictures from chronic nephrolithiasis. Following a cholecystectomy for gallstone pancreatitis 13 years earlier, he was hospitalized five more times for pancreatitis. The last episode was 6 years prior to this presentation. At that time, magnetic resonance cholangiopancreatography (MRCP) did not reveal pancreatic divisum, annular pancreas, biliary strictures, or a pancreatic mass. Esophagogastroduodenoscopy peformed during the same hospitalization showed mild gastritis. His recurrent pancreatitis was deemed idiopathic.
His medications were folic acid, cholecalciferol, lisinopril, metoprolol, omeprazole, simvastatin, aspirin, and weekly methotrexate. His sister had breast and ovarian cancer, and his brother had gastric cancer. He had two subcentimeter tubular adenomas removed during a screening colonoscopy 3 years prior. He had a 30 pack-year smoking history and quit 28 years earlier. He did not use alcohol or drugs. He was a retired chemical plant worker.
Choledocholithiasis (as discrete stones or biliary sludge) can trigger pancreatitis despite a cholecystectomy, but the recurrent episodes and negative MRCP should prompt consideration of other causes, such as alcohol. Hypercalcemia, hypertriglyceridemia, and medications are infrequent causes of pancreatic inflammation. IgG4-related disease (IgG4-RD) causes autoimmune pancreatitis and can infiltrate the eyelids, lacrimal glands, extraocular muscles, or orbital connective tissue. Malignancy of the pancreas or ampulla can trigger pancreatitis by causing pancreatic duct obstruction but would not go undetected for 13 years.
The patient was evaluated by an ophthalmologist and a neurologist. His heart rate was 52 beats per minute and blood pressure, 174/70 mm Hg; other vital signs were normal. He had conjunctival chemosis, ptosis, and nonpulsatile proptosis of the left eye with tenderness and increased resistance to retropulsion compared to the right eye (Figure 1). Visual acuity was 20/25 for the right eye and hand motions only in the left eye. The pupils were reactive and symmetric without afferent pupillary defect. There was no optic nerve swelling or pallor. Abduction, adduction, and elevation of the left eye were restricted and associated with diplopia. Movement of the right eye was unrestricted. There was no other facial asymmetry. Facial sensation was normal. Corneal reflexes were intact. Shoulder shrug strength was equal and symmetric. Tongue protrusion was midline. Olfaction and hearing were not assessed. Strength, sensation, and deep tendon reflexes were normal in all extremities. The plantar response was flexor bilaterally.

Unilateral ptosis, chemosis, proptosis, ophthalmoplegia, eye tenderness, and visual loss collectively point to a space-occupying orbital disease. Orbital masses are caused by cancers, infections such as mucormycosis (usually in an immunocompromised host), and inflammatory disorders such as thyroid orbitopathy, sarcoidosis, IgG4-related orbitopathy, granulomatosis with polyangiitis, and orbital pseudotumor (idiopathic inflammation of the orbit). Chemosis reflects edema of the conjunctiva, which can arise from direct conjunctival injury (eg, allergy, infection, or trauma), interruption of the venous drainage of the conjunctiva by vascular disorders (eg, cavernous sinus thrombosis or carotid-cavernous fistula), or space-occupying diseases of the orbit. Monocular visual loss arises from a prechiasmal lesion, and acute monocular visual loss is more commonly caused by posterior ocular pathology (eg, retina or optic nerve) than anterior disease (eg, keratitis). Visual loss in the presence of an orbital process suggests a compressive or infiltrative disease of the optic nerve.
Complete blood count, comprehensive metabolic panel, erythrocyte sedimentation rate, C-reactive protein, and thyroid function tests were normal. Interferon-gamma release assay, HIV antibody, rapid plasma reagin, Lyme antibody, antinuclear antibody, and antineutrophil cytoplasmic antibody (ANCA) tests were negative. A noncontrast computed tomography (CT) scan of the head revealed thickening of the left inferior rectus muscle. Orbital magnetic resonance imaging (MRI) with gadolinium and fluid-attenuated inversion recovery imaging demonstrated a T2 hyperintense, heterogeneous 1.4-cm mass in the left inferior rectus muscle (Figure 2). There was no carotid-cavernous fistula, brain mass, or meningeal enhancement.
 with gadolinium and fluid-attenuated inversion recovery imaging showed a hyperintense, heterogeneous 1.4×1.2×1.2-cm mass in the left inferior rectus muscle")
An isolated mass in one ocular muscle raises the probability of a cancer. The most common malignant orbital tumor is B-cell lymphoma. Metastatic cancer to the eye is rare; breast, prostate, and lung cancer account for the majority of cases. The family history of breast and ovarian cancer raises the possibility of a BRCA mutation, which is also associated with gastric, pancreatic, and prostate malignancies. Granulomatosis with polyangiitis may be ANCA negative in localized sino-orbital disease. Biopsy of the orbital mass is the next step.
The patient underwent transconjunctival orbitotomy with excision of the left inferior rectus mass. Two days later, he presented to the emergency department with acute onset epigastric pain, nausea, and vomiting. A comprehensive review of systems, which had not been performed until this visit, revealed an unintentional 20-lb weight loss over the previous 3 months. He had a progressive ache in the left anterior groin that was dull, tender, nonradiating, and worse with weight bearing. He denied melena or hematochezia.
His temperature was 37 °C; heart rate, 98 beats per minute; and blood pressure, 128/63 mm Hg. He had midepigastric tenderness and point tenderness over the anterior iliac spine. White blood cell count was 12,600/μL; hemo globin, 14.5 g/dL; and platelet count, 158,000/μL. Serum lipase was 7,108 U/L. Serum creatinine, calcium, and triglyceride levels were normal. Alkaline phosphatase was 117 U/L (normal, 34-104 U/L); total bilirubin, 1.1 mg/dL; alanine aminotransferase (ALT), 119 U/L (normal, 7-52 U/L); and aspartate aminotransferase (AST), 236 U/L (normal, 13-39 U/L). Troponin I was undetectable, and an electrocardiogram demonstrated sinus tachycardia. Urinalysis was normal.
Concomitant pancreatitis and hepatitis with an elevated AST-to-ALT ratio should prompt evaluation of recurrent choledocholithiasis and a repeat inquiry about alcohol use. His medications should be reviewed for an association with pancreatitis. Anterior groin discomfort usually reflects osteoarthritis of the hip joint, inguinal hernia, or inguinal lymphadenopathy. Groin pain may be referred from spinal nerve root compression, aortoiliac occlusion, or nephrolithiasis. Weight loss in the presence of an inferior rectus mass suggests one of the aforementioned systemic diseases with orbital manifestations. Pancreatitis and groin discomfort may be important clues, but the chronicity of the recurrent pancreatitis and the high prevalence of hip osteoarthritis make it equally likely that they are unrelated to the eye disease.
CT scan of the abdomen and pelvis with contrast showed peripancreatic edema with fat stranding but no pancreatic or hepatobiliary mass. The common bile duct was normal. A 2.2×1.3-cm mass in the right posterior subphrenic space, a lytic lesion in the left anterior inferior iliac spine, and right nonobstructive nephrolithiasis were identified. CT scan of the chest with contrast showed multiple subpleural nodules and innumerable parenchymal nodules. Subcentimeter hilar, mediastinal, and prevascular lymphadenopathy were present, as well as multiple sclerotic lesions in the right fourth and sixth ribs. Prostate-specific antigen was 0.7 ng/mL (normal, ≤ 4.0 ng/mL). Cancer antigen 19-9 level was 5.5 U/mL (normal, < 37.0 U/mL), and carcinoembryonic antigen (CEA) was 100.1 ng/mL (normal, 0-3 U/mL).
Widespread pulmonary nodules, diffuse lymphadenopathy, and bony lesions raise concern for a metastatic malignancy. There is no evidence of a primary carcinoma. The lack of hepatic involvement reduces the likelihood of a gastrointestinal tumor, although a rectal cancer, which may drain directly into the inferior vena cava and bypass the portal circulation, could present as lung metastases on CT imaging. Lymphoma is plausible given the diffuse lymphadenopathy and orbital mass. Sarcoidosis and histiocytic disorders (eg, Langerhans cell histiocytosis) also cause orbital disease, pulmonary nodules, lymphadenopathy, and bone lesions, although a subphrenic mass would be atypical for both disorders; furthermore, the majority of patients with adult Langerhans cell histiocytosis smoke cigarettes. The elevated CEA makes a metastatic solid tumor more likely than lymphoma but does not specify the location of the primary tumor.
Pathology of the inferior rectus muscle mass showed well-differentiated adenocarcinoma (Figure 3A and 3B). A CT-guided biopsy of the left anterior inferior iliac spine revealed well-differentiated adenocarcinoma (Figure 3C). Adenocarcinoma of unknown primary wasdiagnosed.
Subsequent immunohistochemical (IHC) staining was positive for cytokeratin 7 (CK7) and mucicarmine (Figure 3D and 3E) and negative for cytokeratin 20 (CK20) and thyroid transcription factor 1 (TTF1). This IHC profile suggested pancreatic or upper gastrointestinal tract lineage. Positron emission tomography–CT (PET-CT) scan was aborted because of dyspnea and chest pressure following contrast administration. He declined further imaging or endoscopy. He received palliative radiation and three cycles of paclitaxel and gemcitabine for cancer of unknown primary (CUP). Two months later, he developed bilateral upper-arm weakness due to C7 and T2 cord compression from vertebral and epidural metastases; his symptoms progressed despite salvage chemotherapy. He was transitioned to comfort care and died at home 9 months after diagnosis.
 with gadolinium and fluid-attenuated inversion recovery imaging showed a hyperintense, heterogeneous 1.4×1.2×1.2-cm mass in the left inferior rectus muscle")
DISCUSSION
This patient’s new headache and ocular abnormalities led to the discovery of an inferior rectus muscle mass. Initially unrecognized unintentional weight loss and hip pain recast a localized orbital syndrome as a systemic disease with pancreatic, ocular, pulmonary, lymph node, and skeletal pathology. Biopsies of the orbital rectus muscle and iliac bone demonstrated metastatic adenocarcinoma. Imaging studies did not identify a primary cancer, but IHC analysis suggested carcinoma of upper gastrointestinal or pancreatic origin.
Acute and chronic pancreatitis are both associated with pancreatic cancer.1 Chronic pancreatitis is associated with an increasing cumulative risk of pancreatic cancer; a potential mechanism is chronic inflammation with malignant transformation.2,3 There is also a 20-fold increased risk of pancreatic cancer in the first 2 years following an episode of acute pancreatitis,4 which may develop from malignant pancreatic duct obstruction. Although the post–acute pancreatitis risk of pancreatic cancer attenuates over time, a two-fold increased risk of pancreatic cancer remains after 10 years,4 which suggests that acute pancreatitis (particularly when idiopathic) either contributes to or shares pathogenesis with pancreatic adenocarcinoma. In elderly patients without gallstones or alcohol use, an abdominal CT scan or MRI shortly after resolution of the acute pancreatitis may be considered to assess for an underlying pancreatic tumor.5
CUP is a histologically defined malignancy without a known primary anatomic site despite an extensive evaluation. CUP accounts for up to 10% of all cancer diagnoses.6 CUP is ascribed to a primary cancer that remains too small to be detected or spontaneous regression of the primary cancer.7 Approximately 70% of autopsies of patients with CUP identify the primary tumor, which most commonly originates in the lung, gastrointestinal tract, breast, or pancreas.8
When a metastatic focus of cancer is found but the initial diagnostic evaluation (including CT scan of the chest, abdomen, and pelvis) fails to locate a primary cancer, the next step in searching for the tissue of origin is an IHC analysis of the tumor specimen. IHC analysis is a multistep staining process that can identify major categories of cancer, including carcinoma (adenocarcinoma, squamous cell carcinoma, and neuroendocrine carcinoma) and poorly or undifferentiated neoplasms (including carcinoma, lymphoma, sarcoma, or melanoma). Eighty-five percent of CUP cases are adenocarcinoma, 10% are squamous cell carcinoma, and the remaining 5% are undifferentiated neoplasms.9
There are no consensus guidelines for imaging in patients with CUP who have already undergone a CT scan of the chest, abdomen, and pelvis. Mammography is indicated in women with metastatic adenocarcinoma or axillary lymphadenopathy.7 MRI of the breast is obtained when mammography is nondiagnostic and the suspicion for breast cancer is high. Small clinical studies and meta-analyses support the use of PET-CT scans,7 although one study found that a PET-CT scan was not superior to CT imaging in identifying the primary tumor site in CUP.10 Endoscopy of the upper airway or gastrointestinal tract is rarely diagnostic in the absence of referable symptoms or a suggestive IHC profile (eg, CK7−, CK20+ suggestive of colon cancer).6
Molecular cancer classification has emerged as a useful diagnostic technique in CUP. Cancer cells retain gene expression patterns based on cellular origin, and a tumor’s profile can be compared with a reference database of known cancers, aiding in the identification of the primary tumor type. Molecular cancer classifier assays that use gene expression profiling can accurately determine a primary site11 and have been shown to be concordant with IHC testing.12 Molecular cancer classification is distinct from genetic assays that identify mutations for which there are approved therapies. Serum tumor markers are generally not useful in establishing the primary tumor and should be considered based on the clinical presentation (eg, prostate-specific antigen testing in a man with adenocarcinoma of unknown primary and osteoblastic metastases).
CUP is classified as favorable or unfavorable based on the IHC, pattern of spread, and serum markers in certain cases.6 Approximately 20% of CUP patients can be categorized into favorable subsets, such as adenocarcinoma in a single axillary lymph node in a female patient suggestive of a breast primary cancer, or squamous cell carcinoma in a cervical lymph node suggestive of a head or neck primary cancer.7 The remaining 80% of cases are categorized as unfavorable CUP and often have multiple metastases. Our patient’s pattern of spread and limited response to chemotherapy is characteristic of the unfavorable subset of CUP. The median survival of this group is 9 months, and only 25% of patients survive longer than 1 year.13
Biomarker-driven treatment of specific molecular targets independent of the tissue of origin (tissue-agnostic therapy) has shown promising results in the treatment of skin, lung, thyroid, colorectal, and gastric cancers.14 Pembrolizumab was the first drug approved by the US Food and Drug Administration based on a tumor’s biomarker without regard to its primary location. Data to support this approach for treating CUP are evolving and offer hope for patients with specific molecular targets.
Following the focused neuro-ophthalmologic evaluations, with focused examination and imaging, the hospitalist’s review of systems at the time of the final admission for pancreatitis set in motion an evaluation that led to a diagnosis of metastatic cancer. The risk factor of recurrent pancreatitis and IHC results suggested that pancreatic adenocarcinoma was the most likely primary tumor. As the focus of cancer treatment shifts away from the tissue of origin and toward molecular and genetic profiles, the search for the primary site may decrease in importance. In the future, even when we do not know the cancer’s origin, we may still know precisely what to do. But for now, as in this patient, our treatments continue to be based on a tumor that is out of sight, but not out of mind.
KEY TEACHING POINTS
- Acute and chronic pancreatitis are associated with an increased risk of pancreatic adenocarcinoma.
- CUP is a cancer in which diagnostic testing does not identify a primary tumor site. Immunohistochemistry and molecular analysis, imaging, and endoscopy are utilized selectively to identify a primary tumor type.
- Treatment of CUP currently depends on the suspected tissue of origin and pattern of spread.
- Tissue-agnostic therapy could allow for treatment for CUP patients independent of the tissue of origin.
Acknowledgments
We thank Andrew Mick, OD, for his review of an earlier version of this manuscript and Peter Phillips, MD, for his interpretation of the pathologic images.
1. Sadr-Azodi O, Oskarsson V, Discacciati A, Videhult P, Askling J, Ekbom A. Pancreatic cancer following acute pancreatitis: a population-based matched cohort study. Am J Gastroenterol. 2018;113(111):1711-1719. https://doi.org/10.1038/s41395-018-0255-9
2. Duell EJ, Lucenteforte E, Olson SH, et al. Pancreatitis and pancreatic cancer risk: a pooled analysis in the International Pancreatic Cancer Case-Control Consortium (PanC4). Ann Oncol. 2012;23(11):2964-2970. https://doi.org/10.1093/annonc/mds140
3. Ekbom A, McLaughlin JK, Nyren O. Pancreatitis and the risk of pancreatic cancer. N Engl J Med. 1993;329(20):1502-1503. https://doi.org/10.1056/NEJM199311113292016
4. Kirkegard J, Cronin-Fenton D, Heide-Jorgensen U, Mortensen FV. Acute pancreatitis and pancreatic cancer risk: a nationwide matched-cohort study in Denmark. Gastroenterology. 2018;154(156):1729-1736. https://doi.org/10.1053/j.gastro.2018.02.011
5. Frampas E, Morla O, Regenet N, Eugene T, Dupas B, Meurette G. A solid pancreatic mass: tumour or inflammation? Diagn Interv Imaging. 2013;94(7-8):741-755. https://doi.org/10.1016/j.diii.2013.03.013
6. Varadhachary GR, Raber MN. Cancer of unknown primary site. N Engl J Med. 2014;371(8):757-765. https://doi.org/10.1056/NEJMra1303917
7. Bochtler T, Löffler H, Krämer A. Diagnosis and management of metastatic neoplasms with unknown primary. Semin Diagn Pathol. 2017. 2018;35(3):199-206. https://doi.org//10.1053/j.semdp.2017.11.013
8. Pentheroudakis G, Golfinopoulos V, Pavlidis N. Switching benchmarks in cancer of unknown primary: from autopsy to microarray. Eur J Cancer. 2007;43(14):2026-2036. https://doi.org/10.1016/j.ejca.2007.06.023
9. Pavlidis N, Fizazi K. Carcinoma of unknown primary (CUP). Crit Rev Oncol Hematol. 2009;69(3):271-278. https://doi.org/10.1016/j.critrevonc.2008.09.005
10. Moller AK, Loft A, Berthelsen AK, et al. A prospective comparison of 18F-FDG PET/CT and CT as diagnostic tools to identify the primary tumor site in patients with extracervical carcinoma of unknown primary site. Oncologist. 2012;17(9):1146-1154. https://doi.org/10.1634/theoncologist.2011-0449
11. Economopoulou P, Mountzios G, Pavlidis N, Pentheroudakis G. Cancer of unknown primary origin in the genomic era: elucidating the dark box of cancer. Cancer Treat Rev. 2015;41(7):598-604. https://doi.org/10.1016/j.ctrv.2015.05.010
12. Greco FA. Molecular diagnosis of the tissue of origin in cancer of unknown primary site: useful in patient management. Curr Treat Options Oncol. 2013;14(4):634-642. https://doi.org/10.1007/s11864-013-0257-1
13. Massard C, Loriot Y, Fizazi K. Carcinomas of an unknown primary origin—diagnosis and treatment. Nat Rev Clin Oncol. 2011;8(12):701-710. https://doi.org/10.1038/nrclinonc.2011.158
14. Luoh SW, Flaherty KT. When tissue is no longer the issue: tissue-agnostic cancer therapy comes of age. Ann Intern Med. 2018;169(4):233-239. https://doi.org/10.7326/M17-2832
A 73-year-old man presented to clinic with 6 weeks of headache. He occasionally experienced generalized headaches throughout his life that resolved with naproxen. His new headache was characterized by a progressively worsening sensation of left-eye pressure with radiation to the left temple. Over the previous week, he had intermittent diplopia, left ptosis, and left lacrimation. He denied head trauma, fever, vision loss, photophobia, dysphagia, dysarthria, nausea, vomiting, or jaw claudication.
Primary headaches include tension type, migraine, and trigeminal autonomic cephalalgias (eg, cluster headache). A new headache in an older patient, particularly if protracted and progressive, prioritizes consideration of a secondary headache, which may reflect pathology within the brain parenchyma (eg, intracranial mass), blood vessels (eg, giant cell arteritis), meninges (eg, meningitis), or ventricles (eg, intraventricular cyst). Eye pain may arise from ocular and extraocular disease. Corneal abrasions, infectious keratitis, scleritis, uveitis, or acute angle-closure glaucoma are painful, although the latter is less likely given the prolonged duration of symptoms. Thyroid eye disease or other infiltrative disorders of the orbit can also cause eye discomfort.
Ptosis commonly results from degeneration of the levator aponeurosis. Other causes include third cranial nerve palsy and myasthenia gravis. Interruption of sympathetic innervation of the eyelid by lesions in the brain stem, spinal cord, lung (eg, Pancoast tumor), or cavernous sinus also can result in ptosis.
Whether the patient has monocular or binocular diplopia is uncertain. Monocular diplopia persists with only one eye open and can arise from uncorrected refractive error, corneal irregularities, lenticular opacities, or unilateral macular disease. Binocular diplopia develops from ocular misalignment due to neuromuscular weakness, extraocular muscle entrapment, or an orbital mass displacing the globe. An orbital mass would also explain the unilateral headache and unilateral ptosis.
His medical history included coronary artery disease, seronegative rheumatoid arthritis, osteoporosis, benign prostatic hypertrophy, and ureteral strictures from chronic nephrolithiasis. Following a cholecystectomy for gallstone pancreatitis 13 years earlier, he was hospitalized five more times for pancreatitis. The last episode was 6 years prior to this presentation. At that time, magnetic resonance cholangiopancreatography (MRCP) did not reveal pancreatic divisum, annular pancreas, biliary strictures, or a pancreatic mass. Esophagogastroduodenoscopy peformed during the same hospitalization showed mild gastritis. His recurrent pancreatitis was deemed idiopathic.
His medications were folic acid, cholecalciferol, lisinopril, metoprolol, omeprazole, simvastatin, aspirin, and weekly methotrexate. His sister had breast and ovarian cancer, and his brother had gastric cancer. He had two subcentimeter tubular adenomas removed during a screening colonoscopy 3 years prior. He had a 30 pack-year smoking history and quit 28 years earlier. He did not use alcohol or drugs. He was a retired chemical plant worker.
Choledocholithiasis (as discrete stones or biliary sludge) can trigger pancreatitis despite a cholecystectomy, but the recurrent episodes and negative MRCP should prompt consideration of other causes, such as alcohol. Hypercalcemia, hypertriglyceridemia, and medications are infrequent causes of pancreatic inflammation. IgG4-related disease (IgG4-RD) causes autoimmune pancreatitis and can infiltrate the eyelids, lacrimal glands, extraocular muscles, or orbital connective tissue. Malignancy of the pancreas or ampulla can trigger pancreatitis by causing pancreatic duct obstruction but would not go undetected for 13 years.
The patient was evaluated by an ophthalmologist and a neurologist. His heart rate was 52 beats per minute and blood pressure, 174/70 mm Hg; other vital signs were normal. He had conjunctival chemosis, ptosis, and nonpulsatile proptosis of the left eye with tenderness and increased resistance to retropulsion compared to the right eye (Figure 1). Visual acuity was 20/25 for the right eye and hand motions only in the left eye. The pupils were reactive and symmetric without afferent pupillary defect. There was no optic nerve swelling or pallor. Abduction, adduction, and elevation of the left eye were restricted and associated with diplopia. Movement of the right eye was unrestricted. There was no other facial asymmetry. Facial sensation was normal. Corneal reflexes were intact. Shoulder shrug strength was equal and symmetric. Tongue protrusion was midline. Olfaction and hearing were not assessed. Strength, sensation, and deep tendon reflexes were normal in all extremities. The plantar response was flexor bilaterally.
Unilateral ptosis, chemosis, proptosis, ophthalmoplegia, eye tenderness, and visual loss collectively point to a space-occupying orbital disease. Orbital masses are caused by cancers, infections such as mucormycosis (usually in an immunocompromised host), and inflammatory disorders such as thyroid orbitopathy, sarcoidosis, IgG4-related orbitopathy, granulomatosis with polyangiitis, and orbital pseudotumor (idiopathic inflammation of the orbit). Chemosis reflects edema of the conjunctiva, which can arise from direct conjunctival injury (eg, allergy, infection, or trauma), interruption of the venous drainage of the conjunctiva by vascular disorders (eg, cavernous sinus thrombosis or carotid-cavernous fistula), or space-occupying diseases of the orbit. Monocular visual loss arises from a prechiasmal lesion, and acute monocular visual loss is more commonly caused by posterior ocular pathology (eg, retina or optic nerve) than anterior disease (eg, keratitis). Visual loss in the presence of an orbital process suggests a compressive or infiltrative disease of the optic nerve.
Complete blood count, comprehensive metabolic panel, erythrocyte sedimentation rate, C-reactive protein, and thyroid function tests were normal. Interferon-gamma release assay, HIV antibody, rapid plasma reagin, Lyme antibody, antinuclear antibody, and antineutrophil cytoplasmic antibody (ANCA) tests were negative. A noncontrast computed tomography (CT) scan of the head revealed thickening of the left inferior rectus muscle. Orbital magnetic resonance imaging (MRI) with gadolinium and fluid-attenuated inversion recovery imaging demonstrated a T2 hyperintense, heterogeneous 1.4-cm mass in the left inferior rectus muscle (Figure 2). There was no carotid-cavernous fistula, brain mass, or meningeal enhancement.
An isolated mass in one ocular muscle raises the probability of a cancer. The most common malignant orbital tumor is B-cell lymphoma. Metastatic cancer to the eye is rare; breast, prostate, and lung cancer account for the majority of cases. The family history of breast and ovarian cancer raises the possibility of a BRCA mutation, which is also associated with gastric, pancreatic, and prostate malignancies. Granulomatosis with polyangiitis may be ANCA negative in localized sino-orbital disease. Biopsy of the orbital mass is the next step.
The patient underwent transconjunctival orbitotomy with excision of the left inferior rectus mass. Two days later, he presented to the emergency department with acute onset epigastric pain, nausea, and vomiting. A comprehensive review of systems, which had not been performed until this visit, revealed an unintentional 20-lb weight loss over the previous 3 months. He had a progressive ache in the left anterior groin that was dull, tender, nonradiating, and worse with weight bearing. He denied melena or hematochezia.
His temperature was 37 °C; heart rate, 98 beats per minute; and blood pressure, 128/63 mm Hg. He had midepigastric tenderness and point tenderness over the anterior iliac spine. White blood cell count was 12,600/μL; hemo globin, 14.5 g/dL; and platelet count, 158,000/μL. Serum lipase was 7,108 U/L. Serum creatinine, calcium, and triglyceride levels were normal. Alkaline phosphatase was 117 U/L (normal, 34-104 U/L); total bilirubin, 1.1 mg/dL; alanine aminotransferase (ALT), 119 U/L (normal, 7-52 U/L); and aspartate aminotransferase (AST), 236 U/L (normal, 13-39 U/L). Troponin I was undetectable, and an electrocardiogram demonstrated sinus tachycardia. Urinalysis was normal.
Concomitant pancreatitis and hepatitis with an elevated AST-to-ALT ratio should prompt evaluation of recurrent choledocholithiasis and a repeat inquiry about alcohol use. His medications should be reviewed for an association with pancreatitis. Anterior groin discomfort usually reflects osteoarthritis of the hip joint, inguinal hernia, or inguinal lymphadenopathy. Groin pain may be referred from spinal nerve root compression, aortoiliac occlusion, or nephrolithiasis. Weight loss in the presence of an inferior rectus mass suggests one of the aforementioned systemic diseases with orbital manifestations. Pancreatitis and groin discomfort may be important clues, but the chronicity of the recurrent pancreatitis and the high prevalence of hip osteoarthritis make it equally likely that they are unrelated to the eye disease.
CT scan of the abdomen and pelvis with contrast showed peripancreatic edema with fat stranding but no pancreatic or hepatobiliary mass. The common bile duct was normal. A 2.2×1.3-cm mass in the right posterior subphrenic space, a lytic lesion in the left anterior inferior iliac spine, and right nonobstructive nephrolithiasis were identified. CT scan of the chest with contrast showed multiple subpleural nodules and innumerable parenchymal nodules. Subcentimeter hilar, mediastinal, and prevascular lymphadenopathy were present, as well as multiple sclerotic lesions in the right fourth and sixth ribs. Prostate-specific antigen was 0.7 ng/mL (normal, ≤ 4.0 ng/mL). Cancer antigen 19-9 level was 5.5 U/mL (normal, < 37.0 U/mL), and carcinoembryonic antigen (CEA) was 100.1 ng/mL (normal, 0-3 U/mL).
Widespread pulmonary nodules, diffuse lymphadenopathy, and bony lesions raise concern for a metastatic malignancy. There is no evidence of a primary carcinoma. The lack of hepatic involvement reduces the likelihood of a gastrointestinal tumor, although a rectal cancer, which may drain directly into the inferior vena cava and bypass the portal circulation, could present as lung metastases on CT imaging. Lymphoma is plausible given the diffuse lymphadenopathy and orbital mass. Sarcoidosis and histiocytic disorders (eg, Langerhans cell histiocytosis) also cause orbital disease, pulmonary nodules, lymphadenopathy, and bone lesions, although a subphrenic mass would be atypical for both disorders; furthermore, the majority of patients with adult Langerhans cell histiocytosis smoke cigarettes. The elevated CEA makes a metastatic solid tumor more likely than lymphoma but does not specify the location of the primary tumor.
Pathology of the inferior rectus muscle mass showed well-differentiated adenocarcinoma (Figure 3A and 3B). A CT-guided biopsy of the left anterior inferior iliac spine revealed well-differentiated adenocarcinoma (Figure 3C). Adenocarcinoma of unknown primary wasdiagnosed.
Subsequent immunohistochemical (IHC) staining was positive for cytokeratin 7 (CK7) and mucicarmine (Figure 3D and 3E) and negative for cytokeratin 20 (CK20) and thyroid transcription factor 1 (TTF1). This IHC profile suggested pancreatic or upper gastrointestinal tract lineage. Positron emission tomography–CT (PET-CT) scan was aborted because of dyspnea and chest pressure following contrast administration. He declined further imaging or endoscopy. He received palliative radiation and three cycles of paclitaxel and gemcitabine for cancer of unknown primary (CUP). Two months later, he developed bilateral upper-arm weakness due to C7 and T2 cord compression from vertebral and epidural metastases; his symptoms progressed despite salvage chemotherapy. He was transitioned to comfort care and died at home 9 months after diagnosis.
DISCUSSION
This patient’s new headache and ocular abnormalities led to the discovery of an inferior rectus muscle mass. Initially unrecognized unintentional weight loss and hip pain recast a localized orbital syndrome as a systemic disease with pancreatic, ocular, pulmonary, lymph node, and skeletal pathology. Biopsies of the orbital rectus muscle and iliac bone demonstrated metastatic adenocarcinoma. Imaging studies did not identify a primary cancer, but IHC analysis suggested carcinoma of upper gastrointestinal or pancreatic origin.
Acute and chronic pancreatitis are both associated with pancreatic cancer.1 Chronic pancreatitis is associated with an increasing cumulative risk of pancreatic cancer; a potential mechanism is chronic inflammation with malignant transformation.2,3 There is also a 20-fold increased risk of pancreatic cancer in the first 2 years following an episode of acute pancreatitis,4 which may develop from malignant pancreatic duct obstruction. Although the post–acute pancreatitis risk of pancreatic cancer attenuates over time, a two-fold increased risk of pancreatic cancer remains after 10 years,4 which suggests that acute pancreatitis (particularly when idiopathic) either contributes to or shares pathogenesis with pancreatic adenocarcinoma. In elderly patients without gallstones or alcohol use, an abdominal CT scan or MRI shortly after resolution of the acute pancreatitis may be considered to assess for an underlying pancreatic tumor.5
CUP is a histologically defined malignancy without a known primary anatomic site despite an extensive evaluation. CUP accounts for up to 10% of all cancer diagnoses.6 CUP is ascribed to a primary cancer that remains too small to be detected or spontaneous regression of the primary cancer.7 Approximately 70% of autopsies of patients with CUP identify the primary tumor, which most commonly originates in the lung, gastrointestinal tract, breast, or pancreas.8
When a metastatic focus of cancer is found but the initial diagnostic evaluation (including CT scan of the chest, abdomen, and pelvis) fails to locate a primary cancer, the next step in searching for the tissue of origin is an IHC analysis of the tumor specimen. IHC analysis is a multistep staining process that can identify major categories of cancer, including carcinoma (adenocarcinoma, squamous cell carcinoma, and neuroendocrine carcinoma) and poorly or undifferentiated neoplasms (including carcinoma, lymphoma, sarcoma, or melanoma). Eighty-five percent of CUP cases are adenocarcinoma, 10% are squamous cell carcinoma, and the remaining 5% are undifferentiated neoplasms.9
There are no consensus guidelines for imaging in patients with CUP who have already undergone a CT scan of the chest, abdomen, and pelvis. Mammography is indicated in women with metastatic adenocarcinoma or axillary lymphadenopathy.7 MRI of the breast is obtained when mammography is nondiagnostic and the suspicion for breast cancer is high. Small clinical studies and meta-analyses support the use of PET-CT scans,7 although one study found that a PET-CT scan was not superior to CT imaging in identifying the primary tumor site in CUP.10 Endoscopy of the upper airway or gastrointestinal tract is rarely diagnostic in the absence of referable symptoms or a suggestive IHC profile (eg, CK7−, CK20+ suggestive of colon cancer).6
Molecular cancer classification has emerged as a useful diagnostic technique in CUP. Cancer cells retain gene expression patterns based on cellular origin, and a tumor’s profile can be compared with a reference database of known cancers, aiding in the identification of the primary tumor type. Molecular cancer classifier assays that use gene expression profiling can accurately determine a primary site11 and have been shown to be concordant with IHC testing.12 Molecular cancer classification is distinct from genetic assays that identify mutations for which there are approved therapies. Serum tumor markers are generally not useful in establishing the primary tumor and should be considered based on the clinical presentation (eg, prostate-specific antigen testing in a man with adenocarcinoma of unknown primary and osteoblastic metastases).
CUP is classified as favorable or unfavorable based on the IHC, pattern of spread, and serum markers in certain cases.6 Approximately 20% of CUP patients can be categorized into favorable subsets, such as adenocarcinoma in a single axillary lymph node in a female patient suggestive of a breast primary cancer, or squamous cell carcinoma in a cervical lymph node suggestive of a head or neck primary cancer.7 The remaining 80% of cases are categorized as unfavorable CUP and often have multiple metastases. Our patient’s pattern of spread and limited response to chemotherapy is characteristic of the unfavorable subset of CUP. The median survival of this group is 9 months, and only 25% of patients survive longer than 1 year.13
Biomarker-driven treatment of specific molecular targets independent of the tissue of origin (tissue-agnostic therapy) has shown promising results in the treatment of skin, lung, thyroid, colorectal, and gastric cancers.14 Pembrolizumab was the first drug approved by the US Food and Drug Administration based on a tumor’s biomarker without regard to its primary location. Data to support this approach for treating CUP are evolving and offer hope for patients with specific molecular targets.
Following the focused neuro-ophthalmologic evaluations, with focused examination and imaging, the hospitalist’s review of systems at the time of the final admission for pancreatitis set in motion an evaluation that led to a diagnosis of metastatic cancer. The risk factor of recurrent pancreatitis and IHC results suggested that pancreatic adenocarcinoma was the most likely primary tumor. As the focus of cancer treatment shifts away from the tissue of origin and toward molecular and genetic profiles, the search for the primary site may decrease in importance. In the future, even when we do not know the cancer’s origin, we may still know precisely what to do. But for now, as in this patient, our treatments continue to be based on a tumor that is out of sight, but not out of mind.
KEY TEACHING POINTS
- Acute and chronic pancreatitis are associated with an increased risk of pancreatic adenocarcinoma.
- CUP is a cancer in which diagnostic testing does not identify a primary tumor site. Immunohistochemistry and molecular analysis, imaging, and endoscopy are utilized selectively to identify a primary tumor type.
- Treatment of CUP currently depends on the suspected tissue of origin and pattern of spread.
- Tissue-agnostic therapy could allow for treatment for CUP patients independent of the tissue of origin.
Acknowledgments
We thank Andrew Mick, OD, for his review of an earlier version of this manuscript and Peter Phillips, MD, for his interpretation of the pathologic images.
1. Sadr-Azodi O, Oskarsson V, Discacciati A, Videhult P, Askling J, Ekbom A. Pancreatic cancer following acute pancreatitis: a population-based matched cohort study. Am J Gastroenterol. 2018;113(111):1711-1719. https://doi.org/10.1038/s41395-018-0255-9
2. Duell EJ, Lucenteforte E, Olson SH, et al. Pancreatitis and pancreatic cancer risk: a pooled analysis in the International Pancreatic Cancer Case-Control Consortium (PanC4). Ann Oncol. 2012;23(11):2964-2970. https://doi.org/10.1093/annonc/mds140
3. Ekbom A, McLaughlin JK, Nyren O. Pancreatitis and the risk of pancreatic cancer. N Engl J Med. 1993;329(20):1502-1503. https://doi.org/10.1056/NEJM199311113292016
4. Kirkegard J, Cronin-Fenton D, Heide-Jorgensen U, Mortensen FV. Acute pancreatitis and pancreatic cancer risk: a nationwide matched-cohort study in Denmark. Gastroenterology. 2018;154(156):1729-1736. https://doi.org/10.1053/j.gastro.2018.02.011
5. Frampas E, Morla O, Regenet N, Eugene T, Dupas B, Meurette G. A solid pancreatic mass: tumour or inflammation? Diagn Interv Imaging. 2013;94(7-8):741-755. https://doi.org/10.1016/j.diii.2013.03.013
6. Varadhachary GR, Raber MN. Cancer of unknown primary site. N Engl J Med. 2014;371(8):757-765. https://doi.org/10.1056/NEJMra1303917
7. Bochtler T, Löffler H, Krämer A. Diagnosis and management of metastatic neoplasms with unknown primary. Semin Diagn Pathol. 2017. 2018;35(3):199-206. https://doi.org//10.1053/j.semdp.2017.11.013
8. Pentheroudakis G, Golfinopoulos V, Pavlidis N. Switching benchmarks in cancer of unknown primary: from autopsy to microarray. Eur J Cancer. 2007;43(14):2026-2036. https://doi.org/10.1016/j.ejca.2007.06.023
9. Pavlidis N, Fizazi K. Carcinoma of unknown primary (CUP). Crit Rev Oncol Hematol. 2009;69(3):271-278. https://doi.org/10.1016/j.critrevonc.2008.09.005
10. Moller AK, Loft A, Berthelsen AK, et al. A prospective comparison of 18F-FDG PET/CT and CT as diagnostic tools to identify the primary tumor site in patients with extracervical carcinoma of unknown primary site. Oncologist. 2012;17(9):1146-1154. https://doi.org/10.1634/theoncologist.2011-0449
11. Economopoulou P, Mountzios G, Pavlidis N, Pentheroudakis G. Cancer of unknown primary origin in the genomic era: elucidating the dark box of cancer. Cancer Treat Rev. 2015;41(7):598-604. https://doi.org/10.1016/j.ctrv.2015.05.010
12. Greco FA. Molecular diagnosis of the tissue of origin in cancer of unknown primary site: useful in patient management. Curr Treat Options Oncol. 2013;14(4):634-642. https://doi.org/10.1007/s11864-013-0257-1
13. Massard C, Loriot Y, Fizazi K. Carcinomas of an unknown primary origin—diagnosis and treatment. Nat Rev Clin Oncol. 2011;8(12):701-710. https://doi.org/10.1038/nrclinonc.2011.158
14. Luoh SW, Flaherty KT. When tissue is no longer the issue: tissue-agnostic cancer therapy comes of age. Ann Intern Med. 2018;169(4):233-239. https://doi.org/10.7326/M17-2832
© 2021 Society of Hospital Medicine
Things We Do For No Reason™: Serum Serologic Helicobacter pylori Testing
Inspired by the ABIM Foundation’s Choosing Wisely® campaign, the “Things We Do for No Reason™” (TWDFNR) series reviews practices that have become common parts of hospital care but may provide little value to our patients. Practices reviewed in the TWDFNR series do not represent clear-cut conclusions or clinical practice standards but are meant as a starting place for research and active discussions among hospitalists and patients. We invite you to be part of that discussion.
CLINICAL SCENARIO
A hospitalist admits a 25-year-old woman for evaluation of a 2-day history of intractable vomiting. The patient reports a 6-month history of intermittent dyspepsia. Vital signs include a normal temperature, tachycardia with a heart rate of 115 beats per minute, and a blood pressure of 100/60 mm Hg. Laboratory studies, including a complete blood count, electrolyte panel, and serum lipase, are normal; a pregnancy test is negative. Computed tomography (CT) of the patient’s abdomen and pelvis shows no abnormalities. The patient rapidly improves after 2 days with fluid resuscitation and supportive care. A serologic Helicobacter pylori test ordered on admission returns positive, prompting the hospitalist to discharge the patient on a course of bismuth quadruple anti-H pylori therapy.
BACKGROUND
H pylori infection causes upper gastrointestinal symptoms and progressive gastric damage, which can lead to peptic ulcer disease and gastric cancer. When H pylori infection is diagnosed, the current American College of Gastroenterology guidelines recommend eradication of the infection.1 Even with a waning prevalence in the United States, H pylori infects approximately 17% of persons aged 20 to 29 years and 57% of persons >70 years.2 Widely available noninvasive testing options for detecting H pylori include the enzyme-linked immunosorbent assay test for immunoglobulin G antibodies (ie, serology), the stool antigen test, and the urea breath test. Invasive options include upper endoscopy with biopsy. An analysis of diagnostic testing in the United States between 2010 and 2012 showed that approximately 70% of first-time testing was serologic.3
WHY YOU MIGHT THINK SEROLOGIC
H PYLORI TESTING IS HELPFUL
Providers often select serologic testing for H pylori because of the relative ease of obtaining a blood sample compared to obtaining samples for a stool antigen or urea breath test. Stool antigen and the urea breath tests identify active infections and require a large population of H pylori in the stomach. Concurrent treatment with therapies that suppress H pylori, such as antimicrobials, bismuth, or proton pump inhibitors (PPIs), reduces the sensitivity of those tests.4 One study showed that treatment with bismuth reduced the sensitivity of urea breath and stool antigen tests to 50% and 85%, respectively, and that PPIs reduced the sensitivity of the urea breath test and stool antigen test to 60% and 75%, respectively.4 The use of antibiotics, PPIs, or bismuth, however, does not affect the test characteristics of serology.
Invasive testing with endoscopy and biopsy may also yield false-negative results. For example, providers often appropriately start PPI therapy in hospitalized patients with suspected bleeding peptic ulcers. Without concurrent treatment with a PPI, the gastric histology should show the histologic hallmarks of H pylori (ie, acute-on-chronic inflammation), as well as the organisms. However, PPI suppression of the infection and active bleeding may reduce the sensitivity of endoscopic biopsy.5,6 In one study, PPI use decreased sensitivity of histology to approximately 67% compared to polymerase chain reaction testing of the biopsy.6 Bleeding peptic ulcers do not affect the accuracy of serologic testing.
WHY SEROLOGIC TESTING FOR
H PYLORI IS NOT HELPFUL
There are three main issues with H pylori serology testing: (1) decreased sensitivity of these tests compared to other noninvasive tests, (2) inability of serology tests to distinguish between past and active infection (ie, the test is not specific for active infection), and (3) wide availability and use by commercial laboratories of serologic tests that are not approved by the US Food and Drug Administration (FDA).
A multicenter trial in the United States comparing three different serologic tests for H pylori demonstrated sensitivities ranging from 76% to 84%.7 By comparison, the main stool antigen test for H pylori available in the United States has a sensitivity of 93%.8 A recent meta-analysis showed a pooled sensitivity of 96% for urea breath tests.9 These studies demonstrate that the stool antigen and urea breath tests generally eclipse the sensitivity of the available serologic tests.
To further illustrate the issues associated with serologic testing, one may consider a population of 1,000 people with an H pylori prevalence of 35%, the estimated overall prevalence of H pylori in the United States.10 In this population, a serologic test with an 80% sensitivity would result in 70 false-negative results, whereas a urea breath or stool antigen test with a 95% sensitivity would yield only 18 false-negative results. These numbers change drastically with changing prevalence or pretest probability. In some low-prevalence or low-pretest probability scenarios, serologic tests offer little more than a “coin-flip” chance of detecting active H pylori infection (Figure).

Serologic testing offers the benefit of an immediate result but at the cost of reduced sensitivity and specificity. The superior accuracy of biopsy and urea breath and stool antigen tests is dependent upon on cessation of antimicrobials, bismuth, and PPI therapy—something that may be difficult to achieve in hospitalized patients. In the majority of cases, however, there is little evidence equating immediate diagnosis of H pylori with improved patient outcomes. The preferred strategy to reduce false-negative results is to defer stool antigen or urea breath testing until patients have been off antimicrobials, bismuth, and PPIs for 4 weeks.
Serologic tests for H pylori may remain positive for years, which decreases the specificity of these tests in confirming active or eradicated infection.11 One study evaluated three different serology tests on 82 patients 6 months after confirmed eradication by urea breath test. In this study, only seven or eight patients tested negative by serology (depending on the serology test)—a specificity of 8% to 10% for active infection.12 Another study showed that even after 1 year of confirmed eradication, 65% of patients remained seropositive, which equates to a specificity of 35%.11 These studies illustrate that serologic testing for H pylori has a very poor ability to distinguish between active and past infection.
An additional common misconception is that a positive serologic test in the absence of prior treatment for, or diagnosis of, H pylori indicates an active infection. Children and adults can spontaneously clear and become reinfected with H pylori.13,14 Therefore, serologic testing for ascertaining active H pylori infection is unreliable.
As noted, the wide availability of non-FDA-approved serologic tests offered by commercial laboratories in the United States creates another problem for serologic testing. Most immunoglobulin A (IgA) and all immunoglobulin M (IgM) tests lack FDA approval and typically have low sensitivity and specificity. One study showed that compared to stool antigen, IgA and IgM serologic tests had a sensitivity of 63% and 7%, respectively.15
WHEN MIGHT SEROLOGIC H PYLORI TESTING BE HELPFUL?
Despite its limitations, serologic testing for H pylori may have a role in some situations. Clinical scenarios associated with a high pretest probability of H pylori infection (eg, chronic peptic ulcer disease without other risk factors) increase the positive predictive value of H pylori infection. In such a situation, a positive serologic test should prompt initiation of treatment, whereas a negative serologic test does not rule out H pylori infection (Figure). In contrast, in the presence of lower pretest probability symptoms (eg, dyspepsia), positive serologic testing has such a high false-positive rate that providers must first confirm the result with a stool antigen or urea breath test before initiating treatment.
WHAT YOU SHOULD DO INSTEAD
RECOMMENDATIONS
- Use stool antigen or urea breath tests to diagnose H pylori infection noninvasively in patients without an indication for endoscopy.
- Use endoscopic biopsy with histology to diagnose H pylori infection in patients with an indication for endoscopy.
- Delay stool antigen and urea breath testing until 4 weeks after patients have ceased using medications that interfere with test results (eg, antibiotics, bismuth, PPIs); H2RAs do not interfere with testing.
- In cases of a bleeding peptic ulcer with a negative biopsy for H pylori, retest with biopsy after the bleeding resolves or retest using stool antigen or urea breath test.
- Confirm a positive serologic test via stool antigen or urea breath test before initiating treatment except in very high pretest probability clinical scenarios.
- Test to confirm eradication with biopsy, urea breath, or stool antigen test in all cases of confirmed H pylori infection.
- Do not order or try to interpret H pylori IgA and IgM tests as they have no role in the diagnosis or management of H pylori infections.
CONCLUSION
In the clinical scenario, the patient clinically improved with fluid resuscitation and supportive care. The history of unexplained dyspepsia is an indication to assess for H pylori infection with either urea breath test or stool antigen test. Given the positive serologic test, the provider should have retested for active infection with a stool antigen or urea breath test prior to initiating treatment.
Do you think this is a low-value practice? Is this truly a “Thing We Do for No Reason™”? Share what you do in your practice and join in the conversation online by retweeting it on Twitter (#TWDFNR) and liking it on Facebook. We invite you to propose ideas for other “Things We Do for No Reason™” topics by emailing TWDFNR@hospitalmedicine.org
1. Chey WD, Wong BC; Practice Parameters Committee of the American College of Gastroenterology. American College of Gastroenterology guideline on the management of Helicobacter pylori infection. Am J Gastroenterol. 2007;102(8):1808-1825. https://doi.org/10.1111/j.1572-0241.2007.01393.x
2. Everhart JE, Kruszon-Moran D, Perez-Perez GI, Tralka TS, McQuillan G. Seroprevalence and ethnic differences in Helicobacter pylori infection among adults in the United States. J Infect Dis. 2000;181(4):1359-1363. https://doi.org/10.1086/315384
3. Theel ES, Johnson RD, Plumhoff E, Hanson CA. Use of the Optum Labs Data Warehouse to assess test ordering patterns for diagnosis of Helicobacter pylori infection in the United States. J Clin Microbiol. 2015;53(4):1358-1360. https://doi.org/10.1128/jcm.03464-14
4. Bravo LE, Realpe JL, Campo C, Correa P. Effects of acid suppression and bismuth medications on the performance of diagnostic tests for Helicobacter pylori infection. Am J Gastroentrol. 1999;94(9):2380-2383. https://doi.org/10.1111/j.1572-0241.1999.01361.x
5. Logan RP, Walker MM, Misiewicz JJ, Gummett PA, Karim QN, Baron JH. Changes in the intragastric distribution of Helicobacter pylori during treatment with omeprazole. Gut. 1995;36(1):12-16. https://doi.org/10.1136/gut.36.1.12
6. Yakoob J, Jafri W, Abbas Z, Abid S, Islam M, Ahmed Z. The diagnostic yield of various tests for Helicobacter pylori infection in patients on acid-reducing drugs. Dig Dis Sci. 2008;53(1):95-100. https://doi.org/10.1007/s10620-007-9828-y
7. Chey WD, Murthy U, Shaw S, et al. A comparison of three fingerstick, whole blood antibody tests for Helicobacter pylori infection: a United States, multicenter trial. Am J Gastroentrol. 1999;94(6):1512-1516. https://doi.org/10.1111/j.1572-0241.1999.1135_x.x
8. Li YH, Guo H, Zhang PB, Zhao XY, Da SP. Clinical value of Helicobacter pylori stool antigen test, ImmunoCard STAT HpSA, for detecting H pylori infection. World J Gastroenterol. 2004;10(6):913-914. https://doi.org/10.3748/wjg.v10.i6.913
9. Ferwana M, Abdulmajeed I, Alhajiahmed A, et al. Accuracy of urea breath test in Helicobacter pylori infection: meta-analysis. World J Gastroenterol. 2015;21(4):1305-1314. https://doi.org/10.3748/wjg.v21.i4.1305
10. Hooi JK, Lai WY, Ng WK, et al. Global prevalence of Helicobacter pylori infection: systematic review and meta-analysis. Gastroenterology. 2017;153(2):420-429. https://doi.org/10.1053/j.gastro.2017.04.022
11. Cutler AF, Prasad VM. Long-term follow-up of Helicobacter pylori serology after successful eradication. Am J Gastroenterol. 1996;91(1):85-88.
12. Bergey B, Marchildon P, Peacock J, Mégraud PF. What is the role of serology in assessing Helicobacter pylori eradication? Aliment Pharmacol Ther. 2003;18(6):635-639. https://doi.org/10.1046/j.1365-2036.2003.01716.x
13. Duque X, Vilchis J, Mera R, et al. Natural history of Helicobacter pylori infection in Mexican schoolchildren: incidence and spontaneous clearance. J Pediatr Gastroenterol Nutr. 2012;55(2):209. https://doi.org/10.1097/mpg.0b013e318248877f
14. Luzza F, Suraci E, Larussa T, Leone I, Imeneo M. High exposure, spontaneous clearance, and low incidence of active Helicobacter pylori infection: the Sorbo San Basile study. Helicobacter. 2014;19(4):296-305. https://doi.org/10.1111/hel.12133
15. She RC, Wilson AR, Litwin CM. Evaluation of Helicobacter pylori immunoglobulin G (IgG), IgA, and IgM serologic testing compared to stool antigen testing. Clin Vaccine Immunol. 2009;16(8):1253-1255. https://doi.org/10.1128/cvi.00149-09
16. El-Serag HB, Kao JY, Kanwal F, et al. Houston consensus conference on testing for Helicobacter pylori infection in the United States. Clin Gastroenterol Hepatol. 2018;16(7):992-1002. Published correction appears in Clin Gastroenterol Hepatol. 2019;17(4):801. https://doi.org/10.1016/j.cgh.2019.01.006
Inspired by the ABIM Foundation’s Choosing Wisely® campaign, the “Things We Do for No Reason™” (TWDFNR) series reviews practices that have become common parts of hospital care but may provide little value to our patients. Practices reviewed in the TWDFNR series do not represent clear-cut conclusions or clinical practice standards but are meant as a starting place for research and active discussions among hospitalists and patients. We invite you to be part of that discussion.
CLINICAL SCENARIO
A hospitalist admits a 25-year-old woman for evaluation of a 2-day history of intractable vomiting. The patient reports a 6-month history of intermittent dyspepsia. Vital signs include a normal temperature, tachycardia with a heart rate of 115 beats per minute, and a blood pressure of 100/60 mm Hg. Laboratory studies, including a complete blood count, electrolyte panel, and serum lipase, are normal; a pregnancy test is negative. Computed tomography (CT) of the patient’s abdomen and pelvis shows no abnormalities. The patient rapidly improves after 2 days with fluid resuscitation and supportive care. A serologic Helicobacter pylori test ordered on admission returns positive, prompting the hospitalist to discharge the patient on a course of bismuth quadruple anti-H pylori therapy.
BACKGROUND
H pylori infection causes upper gastrointestinal symptoms and progressive gastric damage, which can lead to peptic ulcer disease and gastric cancer. When H pylori infection is diagnosed, the current American College of Gastroenterology guidelines recommend eradication of the infection.1 Even with a waning prevalence in the United States, H pylori infects approximately 17% of persons aged 20 to 29 years and 57% of persons >70 years.2 Widely available noninvasive testing options for detecting H pylori include the enzyme-linked immunosorbent assay test for immunoglobulin G antibodies (ie, serology), the stool antigen test, and the urea breath test. Invasive options include upper endoscopy with biopsy. An analysis of diagnostic testing in the United States between 2010 and 2012 showed that approximately 70% of first-time testing was serologic.3
WHY YOU MIGHT THINK SEROLOGIC
H PYLORI TESTING IS HELPFUL
Providers often select serologic testing for H pylori because of the relative ease of obtaining a blood sample compared to obtaining samples for a stool antigen or urea breath test. Stool antigen and the urea breath tests identify active infections and require a large population of H pylori in the stomach. Concurrent treatment with therapies that suppress H pylori, such as antimicrobials, bismuth, or proton pump inhibitors (PPIs), reduces the sensitivity of those tests.4 One study showed that treatment with bismuth reduced the sensitivity of urea breath and stool antigen tests to 50% and 85%, respectively, and that PPIs reduced the sensitivity of the urea breath test and stool antigen test to 60% and 75%, respectively.4 The use of antibiotics, PPIs, or bismuth, however, does not affect the test characteristics of serology.
Invasive testing with endoscopy and biopsy may also yield false-negative results. For example, providers often appropriately start PPI therapy in hospitalized patients with suspected bleeding peptic ulcers. Without concurrent treatment with a PPI, the gastric histology should show the histologic hallmarks of H pylori (ie, acute-on-chronic inflammation), as well as the organisms. However, PPI suppression of the infection and active bleeding may reduce the sensitivity of endoscopic biopsy.5,6 In one study, PPI use decreased sensitivity of histology to approximately 67% compared to polymerase chain reaction testing of the biopsy.6 Bleeding peptic ulcers do not affect the accuracy of serologic testing.
WHY SEROLOGIC TESTING FOR
H PYLORI IS NOT HELPFUL
There are three main issues with H pylori serology testing: (1) decreased sensitivity of these tests compared to other noninvasive tests, (2) inability of serology tests to distinguish between past and active infection (ie, the test is not specific for active infection), and (3) wide availability and use by commercial laboratories of serologic tests that are not approved by the US Food and Drug Administration (FDA).
A multicenter trial in the United States comparing three different serologic tests for H pylori demonstrated sensitivities ranging from 76% to 84%.7 By comparison, the main stool antigen test for H pylori available in the United States has a sensitivity of 93%.8 A recent meta-analysis showed a pooled sensitivity of 96% for urea breath tests.9 These studies demonstrate that the stool antigen and urea breath tests generally eclipse the sensitivity of the available serologic tests.
To further illustrate the issues associated with serologic testing, one may consider a population of 1,000 people with an H pylori prevalence of 35%, the estimated overall prevalence of H pylori in the United States.10 In this population, a serologic test with an 80% sensitivity would result in 70 false-negative results, whereas a urea breath or stool antigen test with a 95% sensitivity would yield only 18 false-negative results. These numbers change drastically with changing prevalence or pretest probability. In some low-prevalence or low-pretest probability scenarios, serologic tests offer little more than a “coin-flip” chance of detecting active H pylori infection (Figure).
Serologic testing offers the benefit of an immediate result but at the cost of reduced sensitivity and specificity. The superior accuracy of biopsy and urea breath and stool antigen tests is dependent upon on cessation of antimicrobials, bismuth, and PPI therapy—something that may be difficult to achieve in hospitalized patients. In the majority of cases, however, there is little evidence equating immediate diagnosis of H pylori with improved patient outcomes. The preferred strategy to reduce false-negative results is to defer stool antigen or urea breath testing until patients have been off antimicrobials, bismuth, and PPIs for 4 weeks.
Serologic tests for H pylori may remain positive for years, which decreases the specificity of these tests in confirming active or eradicated infection.11 One study evaluated three different serology tests on 82 patients 6 months after confirmed eradication by urea breath test. In this study, only seven or eight patients tested negative by serology (depending on the serology test)—a specificity of 8% to 10% for active infection.12 Another study showed that even after 1 year of confirmed eradication, 65% of patients remained seropositive, which equates to a specificity of 35%.11 These studies illustrate that serologic testing for H pylori has a very poor ability to distinguish between active and past infection.
An additional common misconception is that a positive serologic test in the absence of prior treatment for, or diagnosis of, H pylori indicates an active infection. Children and adults can spontaneously clear and become reinfected with H pylori.13,14 Therefore, serologic testing for ascertaining active H pylori infection is unreliable.
As noted, the wide availability of non-FDA-approved serologic tests offered by commercial laboratories in the United States creates another problem for serologic testing. Most immunoglobulin A (IgA) and all immunoglobulin M (IgM) tests lack FDA approval and typically have low sensitivity and specificity. One study showed that compared to stool antigen, IgA and IgM serologic tests had a sensitivity of 63% and 7%, respectively.15
WHEN MIGHT SEROLOGIC H PYLORI TESTING BE HELPFUL?
Despite its limitations, serologic testing for H pylori may have a role in some situations. Clinical scenarios associated with a high pretest probability of H pylori infection (eg, chronic peptic ulcer disease without other risk factors) increase the positive predictive value of H pylori infection. In such a situation, a positive serologic test should prompt initiation of treatment, whereas a negative serologic test does not rule out H pylori infection (Figure). In contrast, in the presence of lower pretest probability symptoms (eg, dyspepsia), positive serologic testing has such a high false-positive rate that providers must first confirm the result with a stool antigen or urea breath test before initiating treatment.
WHAT YOU SHOULD DO INSTEAD
RECOMMENDATIONS
- Use stool antigen or urea breath tests to diagnose H pylori infection noninvasively in patients without an indication for endoscopy.
- Use endoscopic biopsy with histology to diagnose H pylori infection in patients with an indication for endoscopy.
- Delay stool antigen and urea breath testing until 4 weeks after patients have ceased using medications that interfere with test results (eg, antibiotics, bismuth, PPIs); H2RAs do not interfere with testing.
- In cases of a bleeding peptic ulcer with a negative biopsy for H pylori, retest with biopsy after the bleeding resolves or retest using stool antigen or urea breath test.
- Confirm a positive serologic test via stool antigen or urea breath test before initiating treatment except in very high pretest probability clinical scenarios.
- Test to confirm eradication with biopsy, urea breath, or stool antigen test in all cases of confirmed H pylori infection.
- Do not order or try to interpret H pylori IgA and IgM tests as they have no role in the diagnosis or management of H pylori infections.
CONCLUSION
In the clinical scenario, the patient clinically improved with fluid resuscitation and supportive care. The history of unexplained dyspepsia is an indication to assess for H pylori infection with either urea breath test or stool antigen test. Given the positive serologic test, the provider should have retested for active infection with a stool antigen or urea breath test prior to initiating treatment.
Do you think this is a low-value practice? Is this truly a “Thing We Do for No Reason™”? Share what you do in your practice and join in the conversation online by retweeting it on Twitter (#TWDFNR) and liking it on Facebook. We invite you to propose ideas for other “Things We Do for No Reason™” topics by emailing TWDFNR@hospitalmedicine.org
1. Chey WD, Wong BC; Practice Parameters Committee of the American College of Gastroenterology. American College of Gastroenterology guideline on the management of Helicobacter pylori infection. Am J Gastroenterol. 2007;102(8):1808-1825. https://doi.org/10.1111/j.1572-0241.2007.01393.x
2. Everhart JE, Kruszon-Moran D, Perez-Perez GI, Tralka TS, McQuillan G. Seroprevalence and ethnic differences in Helicobacter pylori infection among adults in the United States. J Infect Dis. 2000;181(4):1359-1363. https://doi.org/10.1086/315384
3. Theel ES, Johnson RD, Plumhoff E, Hanson CA. Use of the Optum Labs Data Warehouse to assess test ordering patterns for diagnosis of Helicobacter pylori infection in the United States. J Clin Microbiol. 2015;53(4):1358-1360. https://doi.org/10.1128/jcm.03464-14
4. Bravo LE, Realpe JL, Campo C, Correa P. Effects of acid suppression and bismuth medications on the performance of diagnostic tests for Helicobacter pylori infection. Am J Gastroentrol. 1999;94(9):2380-2383. https://doi.org/10.1111/j.1572-0241.1999.01361.x
5. Logan RP, Walker MM, Misiewicz JJ, Gummett PA, Karim QN, Baron JH. Changes in the intragastric distribution of Helicobacter pylori during treatment with omeprazole. Gut. 1995;36(1):12-16. https://doi.org/10.1136/gut.36.1.12
6. Yakoob J, Jafri W, Abbas Z, Abid S, Islam M, Ahmed Z. The diagnostic yield of various tests for Helicobacter pylori infection in patients on acid-reducing drugs. Dig Dis Sci. 2008;53(1):95-100. https://doi.org/10.1007/s10620-007-9828-y
7. Chey WD, Murthy U, Shaw S, et al. A comparison of three fingerstick, whole blood antibody tests for Helicobacter pylori infection: a United States, multicenter trial. Am J Gastroentrol. 1999;94(6):1512-1516. https://doi.org/10.1111/j.1572-0241.1999.1135_x.x
8. Li YH, Guo H, Zhang PB, Zhao XY, Da SP. Clinical value of Helicobacter pylori stool antigen test, ImmunoCard STAT HpSA, for detecting H pylori infection. World J Gastroenterol. 2004;10(6):913-914. https://doi.org/10.3748/wjg.v10.i6.913
9. Ferwana M, Abdulmajeed I, Alhajiahmed A, et al. Accuracy of urea breath test in Helicobacter pylori infection: meta-analysis. World J Gastroenterol. 2015;21(4):1305-1314. https://doi.org/10.3748/wjg.v21.i4.1305
10. Hooi JK, Lai WY, Ng WK, et al. Global prevalence of Helicobacter pylori infection: systematic review and meta-analysis. Gastroenterology. 2017;153(2):420-429. https://doi.org/10.1053/j.gastro.2017.04.022
11. Cutler AF, Prasad VM. Long-term follow-up of Helicobacter pylori serology after successful eradication. Am J Gastroenterol. 1996;91(1):85-88.
12. Bergey B, Marchildon P, Peacock J, Mégraud PF. What is the role of serology in assessing Helicobacter pylori eradication? Aliment Pharmacol Ther. 2003;18(6):635-639. https://doi.org/10.1046/j.1365-2036.2003.01716.x
13. Duque X, Vilchis J, Mera R, et al. Natural history of Helicobacter pylori infection in Mexican schoolchildren: incidence and spontaneous clearance. J Pediatr Gastroenterol Nutr. 2012;55(2):209. https://doi.org/10.1097/mpg.0b013e318248877f
14. Luzza F, Suraci E, Larussa T, Leone I, Imeneo M. High exposure, spontaneous clearance, and low incidence of active Helicobacter pylori infection: the Sorbo San Basile study. Helicobacter. 2014;19(4):296-305. https://doi.org/10.1111/hel.12133
15. She RC, Wilson AR, Litwin CM. Evaluation of Helicobacter pylori immunoglobulin G (IgG), IgA, and IgM serologic testing compared to stool antigen testing. Clin Vaccine Immunol. 2009;16(8):1253-1255. https://doi.org/10.1128/cvi.00149-09
16. El-Serag HB, Kao JY, Kanwal F, et al. Houston consensus conference on testing for Helicobacter pylori infection in the United States. Clin Gastroenterol Hepatol. 2018;16(7):992-1002. Published correction appears in Clin Gastroenterol Hepatol. 2019;17(4):801. https://doi.org/10.1016/j.cgh.2019.01.006
© 2021 Society of Hospital Medicine
Improving Healthcare Value: Effectiveness of a Program to Reduce Laboratory Testing for Non-Critically-Ill Patients With COVID-19
The COVID-19 pandemic posed an unprecedented challenge to our current healthcare system—how to efficiently develop and standardize care for a disease process yet to be fully characterized while continuing to deliver high-value care. In the United States, many local institutions developed their own practice patterns, resulting in wide variation.
The Society of Hospital Medicine’s Choosing Wisely® recommendations include avoiding repetitive routine laboratory testing.1
In April 2020, at Dell Seton Medical Center (DSMC) at the University of Texas at Austin, we created a Therapeutics and Informatics Committee to critically review evidence-based practices, reach consensus, and guide practice patterns, with the aim of delivering high-value care. This brief report aims
METHODS
Study Design and Setting
We followed SQUIRE guidelines for reporting this quality improvement intervention.3 Using retrospective chart review, we analyzed laboratory ordering patterns for COVID-positive patients at a single safety net academic medical center in Austin, Texas. Data were abstracted using a custom SQL query of our EHR and de-identified for this analysis. Our internal review board determined that this project is a quality improvement project and did not meet the criteria of human subjects research.
Study Population
All adult (age ≥18 years), non-intensive care unit (ICU), COVID-positive patients with an observation or inpatient status discharged between
Intervention
In April 2020, we created a Therapeutics and Informatics Committee, an interprofessional group including hospitalists, infectious disease, pulmonary and critical care, pharmacy, hospital leadership, and other subspecialists, to iteratively evaluate evidence and standardize inpatient care.
On April 30, 2020, the committee met to evaluate routine laboratory tests in patients with COVID-19.
The committee revisited laboratory ordering practices on June 25, 2020, making the recommendation to further discontinue trending troponin levels and reduce the amount of baseline labs, as they were contributing little to the clinical gestalt or changing management decisions. The customized EHR order sets were updated to reflect the new recommendations, and providers were encouraged to adopt them.
Although direct feedback on ordering practices can be an effective component of a multipronged intervention for decreasing lab usage,4 in this particular case we did not provide feedback to physicians related to their lab usage for COVID-19 care. We provided education to all physicians following each local COVID management consensus guideline change through email, handbook-style updates, and occasional conferences.
Measures and Analysis
The main process measure for this study was the mean hospitalization-level proportion of calendar hospital days with at least one laboratory result for each of four separate lab types: white blood cell count (WBC, as a marker for CBC), creatinine (as a marker for chemistry panels), troponin-I, and D-dimer. First, individual hospitalization-level proportions were calculated for each patient and each lab type. For example, if a patient with a length of stay of 5 calendar days had a WBC measured 2 of those days, their WBC proportion was 0.4. Then we calculated the mean of these proportions for all patients discharged in a given week during the study period for each lab type. Using this measure allowed us to understand the cadence of lab ordering and whether labs were checked daily.
Mean daily lab proportions were plotted separately for CBC, chemistry panel, troponin I, and D-dimer on statistical process control (SPC) charts.
RESULTS
A total of 1,402 non-ICU COVID-positive patients were discharged between March 30, 2020, and March 7, 2021, from our hospital, with a median length of stay of 3.00 days (weekly discharge data are shown in the Figure). The majority of patients were Hispanic men, with a mean age of 54 years (Appendix Table).

To assess intervention fidelity of the order sets, we performed two random spot checks (on May 15, 2020, and June 2, 2020) and found that 16/18 (89%) and 21/25 (84%) of COVID admissions had used the customized order set, supporting robust uptake of the order set intervention.
Mean daily lab proportions for each of the four lab types—chemistry panels, CBCs, D-dimer, and troponin—all demonstrated special cause variation starting mid June to early July 2020 (Figure). All four charts demonstrated periods of four points below 1-sigma and eight points below the center line, with troponin and D-dimer also demonstrating periods of two points below 2-sigma and one point below the lower control limit. These periods of special cause variation were sustained through February 2021.
We evaluated the proportion of all COVID-19 patients who spent time in the ICU over the entire study period, which remained consistent at approximately 25% of our hospitalized COVID-19 population. On a SPC chart, there was no evidence of change in ICU patients following our intervention.
DISCUSSION
Whereas Choosing Wisely® recommendations have been traditionally based on well-established common areas of overuse, this example is unique in showing how these same underlying principles can be applied even in unclear situations, such as with the COVID-19 pandemic. Through multidisciplinary review of real-time evidence and accumulating local experience, the Therapeutics and Informatics Committee at our hospital was able to reach consensus and rapidly deploy an electronic order set that was widely adopted. Eventually, the order set was formally adopted into our EHR; however, the customized COVID-19 order set allowed rapid improvement and implementation of changes that could be shared among providers. As confirmed by our spot checks, this order set was widely used.
There are several limitations to this brief analysis. First, we were unable to assess patient outcomes in response to these changes, mostly due to multiple confounding variables throughout this time period with rapidly shifting census numbers, and the adoption of therapeutic interventions, such as the introduction of dexamethasone, which has shown a mortality benefit for patients with COVID-19. However, we have no reason to believe that this decrease in routine laboratory ordering was associated with adverse outcomes for our patients, and, in aggregate, the outcomes (eg, mortality, length of stay, readmissions) for COVID-19 patients at our hospital have been better than average across Vizient peer groups.6 Prior studies have shown that reduced inpatient labs do not have an adverse impact on patient outcomes.7 Furthermore, non-ICU COVID-19 is generally a single-organ disease (unlike patients with critical illness from COVID-19), making it more likely that daily labs are unnecessary in this specific patient population.
In conclusion, the principles of Choosing Wisely® can be applied even within novel and quickly evolving situations, relying on rapid and critical review of evidence, clinician consensus-building, and leveraging available interventions to drive behavior change, such as shared order sets.
1. Bulger J, Nickel W, Messler J, et al. Choosing wisely in adult hospital medicine: five opportunities for improved healthcare value. J Hosp Med. 2013;8(9):486-492. https://doi.org/10.1002/jhm.2063
2. Emanuel EJ, Persad G, Upshur R, et al. Fair allocation of scarce medical resources in the time of Covid-19. N Engl J Med. 2020;382(21):2049-2055. https://doi.org/10.1056/NEJMsb2005114
3. Ogrinc G, Davies L, Goodman D, Batalden P, Davidoff F, Stevens D. SQUIRE 2.0 (Standards for QUality Improvement Reporting Excellence): revised publication guidelines from a detailed consensus process. BMJ Qual Saf. 2016;25(12):986-992. https://doi.org/10.1136/bmjqs-2015-004411
4. Wheeler D, Marcus P, Nguyen J, et al. Evaluation of a resident-led project to decrease phlebotomy rates in the hospital: think twice, stick once. JAMA Intern Med. 2016;176(5):708-710. https://doi.org/10.1001/jamainternmed.2016.0549
5. Montgomery DC. Introduction to Statistical Quality Control. 6th ed. Wiley; 2008.
6. Nieto K, Pierce RG, Moriates C, Schulwolf E. Lessons from the pandemic: building COVID-19 Centers of Excellence. The Hospital Leader - The Official Blog of the Society of Hospital Medicine. October 13, 2020. Accessed December 11, 2020. https://thehospitalleader.org/lessons-from-the-pandemic-building-covid-19-centers-of-excellence/
7. Corson AH, Fan VS, White T, et al. A multifaceted hospitalist quality improvement intervention: decreased frequency of common labs. J Hosp Med. 2015;10(6):390-395. https://doi.org/10.1002/jhm.2354
The COVID-19 pandemic posed an unprecedented challenge to our current healthcare system—how to efficiently develop and standardize care for a disease process yet to be fully characterized while continuing to deliver high-value care. In the United States, many local institutions developed their own practice patterns, resulting in wide variation.
The Society of Hospital Medicine’s Choosing Wisely® recommendations include avoiding repetitive routine laboratory testing.1
In April 2020, at Dell Seton Medical Center (DSMC) at the University of Texas at Austin, we created a Therapeutics and Informatics Committee to critically review evidence-based practices, reach consensus, and guide practice patterns, with the aim of delivering high-value care. This brief report aims
METHODS
Study Design and Setting
We followed SQUIRE guidelines for reporting this quality improvement intervention.3 Using retrospective chart review, we analyzed laboratory ordering patterns for COVID-positive patients at a single safety net academic medical center in Austin, Texas. Data were abstracted using a custom SQL query of our EHR and de-identified for this analysis. Our internal review board determined that this project is a quality improvement project and did not meet the criteria of human subjects research.
Study Population
All adult (age ≥18 years), non-intensive care unit (ICU), COVID-positive patients with an observation or inpatient status discharged between
Intervention
In April 2020, we created a Therapeutics and Informatics Committee, an interprofessional group including hospitalists, infectious disease, pulmonary and critical care, pharmacy, hospital leadership, and other subspecialists, to iteratively evaluate evidence and standardize inpatient care.
On April 30, 2020, the committee met to evaluate routine laboratory tests in patients with COVID-19.
The committee revisited laboratory ordering practices on June 25, 2020, making the recommendation to further discontinue trending troponin levels and reduce the amount of baseline labs, as they were contributing little to the clinical gestalt or changing management decisions. The customized EHR order sets were updated to reflect the new recommendations, and providers were encouraged to adopt them.
Although direct feedback on ordering practices can be an effective component of a multipronged intervention for decreasing lab usage,4 in this particular case we did not provide feedback to physicians related to their lab usage for COVID-19 care. We provided education to all physicians following each local COVID management consensus guideline change through email, handbook-style updates, and occasional conferences.
Measures and Analysis
The main process measure for this study was the mean hospitalization-level proportion of calendar hospital days with at least one laboratory result for each of four separate lab types: white blood cell count (WBC, as a marker for CBC), creatinine (as a marker for chemistry panels), troponin-I, and D-dimer. First, individual hospitalization-level proportions were calculated for each patient and each lab type. For example, if a patient with a length of stay of 5 calendar days had a WBC measured 2 of those days, their WBC proportion was 0.4. Then we calculated the mean of these proportions for all patients discharged in a given week during the study period for each lab type. Using this measure allowed us to understand the cadence of lab ordering and whether labs were checked daily.
Mean daily lab proportions were plotted separately for CBC, chemistry panel, troponin I, and D-dimer on statistical process control (SPC) charts.
RESULTS
A total of 1,402 non-ICU COVID-positive patients were discharged between March 30, 2020, and March 7, 2021, from our hospital, with a median length of stay of 3.00 days (weekly discharge data are shown in the Figure). The majority of patients were Hispanic men, with a mean age of 54 years (Appendix Table).
To assess intervention fidelity of the order sets, we performed two random spot checks (on May 15, 2020, and June 2, 2020) and found that 16/18 (89%) and 21/25 (84%) of COVID admissions had used the customized order set, supporting robust uptake of the order set intervention.
Mean daily lab proportions for each of the four lab types—chemistry panels, CBCs, D-dimer, and troponin—all demonstrated special cause variation starting mid June to early July 2020 (Figure). All four charts demonstrated periods of four points below 1-sigma and eight points below the center line, with troponin and D-dimer also demonstrating periods of two points below 2-sigma and one point below the lower control limit. These periods of special cause variation were sustained through February 2021.
We evaluated the proportion of all COVID-19 patients who spent time in the ICU over the entire study period, which remained consistent at approximately 25% of our hospitalized COVID-19 population. On a SPC chart, there was no evidence of change in ICU patients following our intervention.
DISCUSSION
Whereas Choosing Wisely® recommendations have been traditionally based on well-established common areas of overuse, this example is unique in showing how these same underlying principles can be applied even in unclear situations, such as with the COVID-19 pandemic. Through multidisciplinary review of real-time evidence and accumulating local experience, the Therapeutics and Informatics Committee at our hospital was able to reach consensus and rapidly deploy an electronic order set that was widely adopted. Eventually, the order set was formally adopted into our EHR; however, the customized COVID-19 order set allowed rapid improvement and implementation of changes that could be shared among providers. As confirmed by our spot checks, this order set was widely used.
There are several limitations to this brief analysis. First, we were unable to assess patient outcomes in response to these changes, mostly due to multiple confounding variables throughout this time period with rapidly shifting census numbers, and the adoption of therapeutic interventions, such as the introduction of dexamethasone, which has shown a mortality benefit for patients with COVID-19. However, we have no reason to believe that this decrease in routine laboratory ordering was associated with adverse outcomes for our patients, and, in aggregate, the outcomes (eg, mortality, length of stay, readmissions) for COVID-19 patients at our hospital have been better than average across Vizient peer groups.6 Prior studies have shown that reduced inpatient labs do not have an adverse impact on patient outcomes.7 Furthermore, non-ICU COVID-19 is generally a single-organ disease (unlike patients with critical illness from COVID-19), making it more likely that daily labs are unnecessary in this specific patient population.
In conclusion, the principles of Choosing Wisely® can be applied even within novel and quickly evolving situations, relying on rapid and critical review of evidence, clinician consensus-building, and leveraging available interventions to drive behavior change, such as shared order sets.
1. Bulger J, Nickel W, Messler J, et al. Choosing wisely in adult hospital medicine: five opportunities for improved healthcare value. J Hosp Med. 2013;8(9):486-492. https://doi.org/10.1002/jhm.2063
2. Emanuel EJ, Persad G, Upshur R, et al. Fair allocation of scarce medical resources in the time of Covid-19. N Engl J Med. 2020;382(21):2049-2055. https://doi.org/10.1056/NEJMsb2005114
3. Ogrinc G, Davies L, Goodman D, Batalden P, Davidoff F, Stevens D. SQUIRE 2.0 (Standards for QUality Improvement Reporting Excellence): revised publication guidelines from a detailed consensus process. BMJ Qual Saf. 2016;25(12):986-992. https://doi.org/10.1136/bmjqs-2015-004411
4. Wheeler D, Marcus P, Nguyen J, et al. Evaluation of a resident-led project to decrease phlebotomy rates in the hospital: think twice, stick once. JAMA Intern Med. 2016;176(5):708-710. https://doi.org/10.1001/jamainternmed.2016.0549
5. Montgomery DC. Introduction to Statistical Quality Control. 6th ed. Wiley; 2008.
6. Nieto K, Pierce RG, Moriates C, Schulwolf E. Lessons from the pandemic: building COVID-19 Centers of Excellence. The Hospital Leader - The Official Blog of the Society of Hospital Medicine. October 13, 2020. Accessed December 11, 2020. https://thehospitalleader.org/lessons-from-the-pandemic-building-covid-19-centers-of-excellence/
7. Corson AH, Fan VS, White T, et al. A multifaceted hospitalist quality improvement intervention: decreased frequency of common labs. J Hosp Med. 2015;10(6):390-395. https://doi.org/10.1002/jhm.2354
© 2021 Society of Hospital Medicine
Risk of Intestinal Necrosis With Sodium Polystyrene Sulfonate: A Systematic Review and Meta-analysis
Sodium polystyrene sulfonate (SPS) was first approved in the United States in 1958 and is a commonly prescribed medication for hyperkalemia.1 SPS works by exchanging potassium for sodium in the colonic lumen, thereby promoting potassium loss in the stool. However, reports of severe gastrointestinal side effects, particularly intestinal necrosis, have been persistent since the 1970s,2 leading some authors to recommend against the use of SPS.3,4 In 2009, the US Food and Drug Administration (FDA) warned against concomitant sorbitol administration, which was implicated in some studies.4,5 The concern about gastrointestinal side effects has also led to the development and FDA approval of two new cation-exchange resins for treatment of hyperkalemia.6 A prior systematic review of the literature found 30 separate case reports or case series including a total of 58 patients who were treated with SPS and developed severe gastrointestinal side effects.7 Because the included studies were all case reports or case series and therefore did not include comparison groups, it could not be determined whether SPS had a causal role in gastrointestinal side effects, and the authors could only conclude that there was a “possible” association. In contrast to case reports, several large cohort studies have been published more recently and report the risk of severe gastrointestinal adverse events associated with SPS compared with controls.8-10 While some studies found an increased risk, others have not. Given this uncertainty, we undertook a systematic review of studies that report the incidence of severe gastrointestinal side effects with SPS compared with controls.
METHODS
Data Sources and Search Strategy
A systematic search of the literature was conducted by a medical librarian using the Cochrane Library, Embase, Medline, Google Scholar, PubMed, Scopus, and Web of Science Core Collection databases to find relevant articles published from database inception to October 4, 2020. The search was peer reviewed by a second medical librarian using Peer Review of Electronic Search Strategies (PRESS).11 Databases were searched using a combination of controlled vocabulary and free-text terms for “SPS” and “bowel necrosis.” Details of the full search strategy are listed in Appendix A. References from all databases were imported into an EndNote X9 library, duplicates removed, and then uploaded into Coviden
Data Extraction and Quality Assessment
We used a standardized form to extract data, which included author, year, country, study design, setting, number of patients, SPS formulation, dosing, exposure, sorbitol content, outcomes of intestinal necrosis and the composite severe gastrointestinal adverse events, and the duration of time from SPS exposure to outcome occurrence. Two reviewers (JLH and AER) independently assessed the methodological quality of included studies using the Risk of Bias in Non-randomized Studies of Interventions (ROBINS-I) tool for observational studies13 and the Revised Cochrane risk of bias (RoB 2) tool for randomized controlled trials (RCTs).14 Additionally, two reviewers (JLH and CGG) graded overall strength of evidence based on the Grading of Recommendations Assessment, Development and Evaluation (GRADE) system.15 Disagreement was resolved by consensus.
Data Synthesis and Analysis
The proportion of patients with intestinal necrosis was compared using random effects meta-analysis using the restricted maximum likelihood method.16 For the two studies that reported hazard ratios (HRs), meta-analysis was performed after log transformation of the HRs and CIs. One study that performed survival analysis presented data for both the duration of the study (up to 11 years) and up to 1 year after exposure.9 We used the data up to 1 year after exposure because we believed later events were more likely to be due to chance than exposure to SPS. For studies with zero events, we used the treat ment-arm continuity correction, which has been reported to be preferable to the standard fixed-correction factor.17 We also performed two sensitivity analyses, including omitting the studies with zero events and performing meta-analysis using risk difference. The prevalence of intestinal ischemia was pooled using the DerSimonian and Laird18 random effects model with Freeman-Tukey19 double arcsine transformation. Heterogeneity was estimated using the I² statistic. I² values of 25%, 50%, and 75% were considered low, moderate, and high heterogeneity, respectively.20 Meta-regression and tests for small-study effects were not performed because of the small number of included studies.21 In addition to random effects meta-analysis, we calculated the 90% predicted interval for future studies for the pooled effect of intestinal ischemia.22 Statistical analysis was performed using meta and metaprop commands in Stata/IC, version 16.1 (StataCorp).
RESULTS
Selected Studies
The electronic search yielded 806 unique articles, of which 791 were excluded based on title and abstract, leaving 15 articles for full-text review (Appendix B). Appendix C describes the nine studies that were excluded, including the reason for exclusion. Table 1 describes the characteristics of the six studies that met study inclusion criteria. Studies were published between 1992 and 2020. Three studies were from Canada,10,24,25 two from the United States,8,23 and one from Sweden.9 Three studies occurred in an outpatient setting,9,10,25 and three were described as inpatient studies.8,23,24 SPS preparations included sorbitol in three studies,8,23,24 were not specified in one study,10 and were not included in two studies.9,25 SPS dosing varied widely, with median doses of 15 to 30 g in three studies,9,24,25 45 to 50 g in two studies,8,23 and unspecified in one study.10 Duration of exposure typically ranged from 1 to 7 days but was not consistently described. For example, two of the studies did not report duration of exposure,8,10 and a third study reported a single dispensation of 450 g in 41% of patients, with the remaining 59% averaging three dispensations within the first year.9 Sample size ranged from 33 to 123,391 patients. Most patients were male, and mean ages ranged from 44 to 78 years. Two studies limited participation to those with chronic kidney disease (CKD) with glomerular filtration rate (GFR) <4024 or CKD stage 4 or 5 or dialysis.9 Two studies specifically limited participation to patients with potassium levels of 5.0 to 5.9 mmol/L.24,25 All six studies reported outcomes for intestinal necrosis, and four reported composite outcomes for major adverse gastrointestinal events.9,10,24,25

Table 2 describes the assessment of risk of bias using the ROBINS-I tool for the five retrospective observational studies and the RoB 2 tool for the one RCT.13,14 Three studies were rated as having serious risk of bias, with the remainder having a moderate risk of bias or some concerns. Two studies were judged as having a serious risk of bias because of potential confounding.8,23 To be judged low or moderate risk, studies needed to measure and control for potential risk factors for intestinal ischemia, such as age, diabetes, vascular disease, and heart failure.26,27 One study also had serious risk of bias for selective reporting because the published abstract of the study used a different analysis and had contradictory results from the published study.9,28 An additional area of risk of bias that did not fit into the ROBINS-I tool is that the two studies that used survival analysis chose durations for the outcome that were longer than would be expected for adverse events from SPS to be evident. One study chose 30 days and the other up to a maximum of 11 years from the time of exposure.9,10

Quantitative Outcomes
Six studies including 26,716 patients treated with SPS and controls reported the proportion of patients who developed intestinal necrosis. The Figure shows the individual study and pooled results for intestinal necrosis. The prevalence of intestinal ischemia in patients treated with SPS was 0.1% (95% CI, 0.03%-0.17%). The pooled odds ratio (OR) of intestinal necrosis was 1.43 (95% CI, 0.39-5.20). The 90% predicted interval for future studies was 0.08 to 26.6. Two studies reported rates of intestinal necrosis using survival analysis. The pooled HR from these studies was 2.00 (95% CI, 0.45-8.78). Two studies performed survival analysis for a composite outcome of severe gastrointestinal adverse events. The pooled HR for these two studies was 1.46 (95% CI, 1.01-2.11).
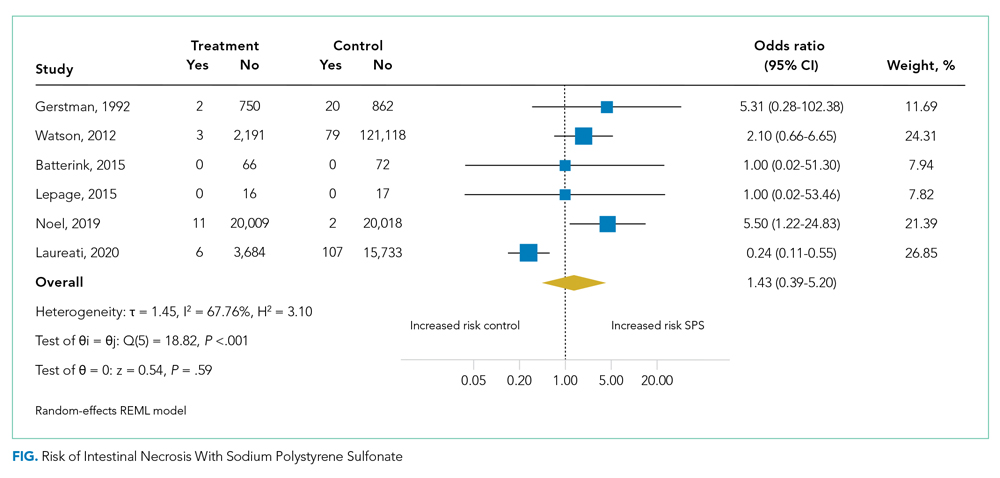
For the meta-analysis of intestinal necrosis, we found moderate-high statistical significance (Q = 18.82; P < .01; I² = 67.8%). Sensitivity analysis removing each study did not affect heterogeneity, with the exception of removing the study by Laureati et al,9 which resolved the heterogeneity (Q = 1.7, P = .8, I² = 0%). The pooled effect for intestinal necrosis also became statistically significant after removing Laureati et al (OR, 2.87; 95% CI, 1.24-6.63).9 We also performed two subgroup analyses, including studies that involved the concomitant use of sorbitol8,23,24 compared with studies that did not9,25 and subgroup analysis removing studies with zero events. Studies that included sorbitol found higher rates of intestinal necrosis (OR, 2.26; 95% CI, 0.80-6.38; I² = 0%) compared with studies that did not include sorbitol (OR, 0.25; 95% CI, 0.11-0.57; I² = 0%; test of group difference, P < .01). Removing the three studies with zero events resulted in a similar overall effect (OR, 1.30; 95% CI, 0.21-8.19). Finally, a meta-analysis using risk difference instead of ORs found a non–statistically significant difference in rate of intestinal necrosis favoring the control group (risk difference, −0.00033; 95% CI, −0.0022 to 0.0015; I² = 84.6%).
Table 3 summarizes our review findings and presents overall strength of evidence. Overall strength of evidence was found to be very low. Per GRADE criteria,15,29 strength of evidence for observational studies starts at low and may then be modified by the presence of bias, inconsistency, indirectness, imprecision, effect size, and direction of confounding. In the case of the three meta-analyses in the present study, risk of bias was serious for more than half of the study weights. Strength of evidence was also downrated for imprecision because of the low number of events and resultant wide CIs.

DISCUSSION
In total, we found six studies that reported rates of intestinal necrosis or severe gastrointestinal adverse events with SPS use compared with controls. The pooled rate of intestinal necrosis was not significantly higher for patients exposed to SPS when analyzed either as the proportion of patients with events or as HRs. The pooled rate for a composite outcome of severe gastrointestinal side effects was significantly higher (HR, 1.46; 95% CI, 1.01-2.11). The overall strength of evidence for the association of SPS with either intestinal necrosis or the composite outcome was found to be very low because of risk of bias and imprecision.
In some ways, our results emphasize the difficulty of showing a causal link between a medication and a possible rare adverse event. The first included study to assess the risk of intestinal necrosis after exposure to SPS compared with controls found only two events in the SPS group and no events in the control arm.23 Two additional studies that we found were small and did not report any events in either arm.24,25 The first large study to assess the risk of intestinal ischemia included more than 2,000 patients treated with SPS and more than 100,000 controls but found no difference in risk.8 The next large study did find increased risk of both intestinal necrosis (incidence rate, 6.82 per 1,000 person-years compared with 1.22 per 1,000 person-years for controls) and a composite outcome (incidence rate, 22.97 per 1,000 person-years compared with 11.01 per 1000 person-years for controls), but in the time to event analysis included events up to 30 days after treatment with SPS.10 A prior review of case reports of SPS and intestinal necrosis found a median of 2 days between SPS treatment and symptom onset.7 It is unlikely the authors would have had sufficient events to meaningfully compare rates if they limited the analysis to events within 7 days of SPS treatment, but events after a week of exposure are unlikely to be due to SPS. The final study to assess the association of SPS with intestinal necrosis actually found higher rates of intestinal necrosis in the control group when analyzed as proportions with events but reported a higher rate of a composite outcome of severe gastrointestinal adverse events that included nine separate International Classification of Diseases codes occurring up to 11 years after SPS exposure.9 This study was limited by evidence of selective reporting and was funded by the manufacturers of an alternative cation-exchange medication.
Based on our review of the literature, it is unclear if SPS does cause intestinal ischemia. The pooled results for intestinal ischemia analyzed as a proportion with events or with survival analysis did not find a statistically significantly increased risk. Because most o
A cost analysis of SPS vs potential alternatives such as patiromer for patients on chronic RAAS-I with a history of hyperkalemia or CKD published by Little et al26 concluded that SPS remained the cost-effective option when colonic necrosis incidence is 19.9% or less, and our systematic review reveals an incidence of 0.1% (95% CI, 0.03-0.17%). The incremental cost-effectiveness ratio was an astronomical $26,088,369 per quality-adjusted life-year gained, per Little’s analysis.
Limitations of our review are the heterogeneity of studies, which varied regarding inpatient or outpatient setting, formulations such as dosing, frequency, whether sorbitol was used, and interval from exposure to outcome measurement, which ranged from 7 days to 1 year. On sensitivity analysis, statistical heterogeneity was resolved by removing the study by Laureati et al.9 This study was notably different from the others because it included events occurring up to 1 year after exposure to SPS, which may have resulted in any true effect being diluted by later events unrelated to SPS. We did not exclude this study post hoc because this would result in bias; however, because the overall result becomes statistically significant without this study, our overall conclusion should be interpreted with caution.30 It is possible that future well-conducted studies may still find an effect of SPS on intestinal necrosis. Similarly, the finding that studies with SPS coformulated with sorbitol had statistically significantly increased risk of intestinal necrosis compared with studies without sorbitol should be interpreted with caution because the study by Laureati et al9 was included in the studies without sorbitol.
CONCLUSIONS
Based on our r
This work was presented at the Society of General Internal Medicine and Society of Hospital Medicine 2021 annual conferences.
1. Labriola L, Jadoul M. Sodium polystyrene sulfonate: still news after 60 years on the market. Nephrol Dial Transplant. 2020;35(9):1455-1458. https://doi.org/10.1093/ndt/gfaa004
2. Arvanitakis C, Malek G, Uehling D, Morrissey JF. Colonic complications after renal transplantation. Gastroenterology. 1973;64(4):533-538.
3. Parks M, Grady D. Sodium polystyrene sulfonate for hyperkalemia. JAMA Intern Med. 2019;179(8):1023-1024. https://doi.org/10.1001/jamainternmed.2019.1291
4. Sterns RH, Rojas M, Bernstein P, Chennupati S. Ion-exchange resins for the treatment of hyperkalemia: are they safe and effective? J Am Soc Nephrol. 2010;21(5):733-735. https://doi.org/10.1681/ASN.2010010079
5. Lillemoe KD, Romolo JL, Hamilton SR, Pennington LR, Burdick JF, Williams GM. Intestinal necrosis due to sodium polystyrene (Kayexalate) in sorbitol enemas: clinical and experimental support for the hypothesis. Surgery. 1987;101(3):267-272.
6. Sterns RH, Grieff M, Bernstein PL. Treatment of hyperkalemia: something old, something new. Kidney Int. 2016;89(3):546-554. https://doi.org/10.1016/j.kint.2015.11.018
7. Harel Z, Harel S, Shah PS, Wald R, Perl J, Bell CM. Gastrointestinal adverse events with sodium polystyrene sulfonate (Kayexalate) use: a systematic review. Am J Med. 2013;126(3):264.e269-24. https://doi.org/10.1016/j.amjmed.2012.08.016
8. Watson MA, Baker TP, Nguyen A, et al. Association of prescription of oral sodium polystyrene sulfonate with sorbitol in an inpatient setting with colonic necrosis: a retrospective cohort study. Am J Kidney Dis. 2012;60(3):409-416. https://doi.org/10.1053/j.ajkd.2012.04.023
9. Laureati P, Xu Y, Trevisan M, et al. Initiation of sodium polystyrene sulphonate and the risk of gastrointestinal adverse events in advanced chronic kidney disease: a nationwide study. Nephrol Dial Transplant. 2020;35(9):1518-1526. https://doi.org/10.1093/ndt/gfz150
10. Noel JA, Bota SE, Petrcich W, et al. Risk of hospitalization for serious adverse gastrointestinal events associated with sodium polystyrene sulfonate use in patients of advanced age. JAMA Intern Med. 2019;179(8):1025-1033. https://doi.org/10.1001/jamainternmed.2019.0631
11. McGowan J, Sampson M, Salzwedel DM, Cogo E, Foerster V, Lefebvre C. PRESS Peer Review of Electronic Search Strategies: 2015 guideline statement. J Clin Epidemiol. 2016;75:40-46. https://doi.org/10.1016/j.jclinepi.2016.01.021
12. Liberati A, Altman DG, Tetzlaff J, et al. The PRISMA statement for reporting systematic reviews and meta-analyses of studies that evaluate health care interventions: explanation and elaboration. Ann Intern Med. 2009;151(4):W65-94. https://doi.org/10.7326/0003-4819-151-4-200908180-00136
13. Sterne JA, Hernán MA, Reeves BC, et al. ROBINS-I: a tool for assessing risk of bias in non-randomised studies of interventions. BMJ. 2016;355:i4919. https://doi.org/10.1136/bmj.i4919
14. Sterne JAC, Savovic J, Page MJ, et al. RoB 2: a revised tool for assessing risk of bias in randomised trials. BMJ. 2019;366:l4898. https://doi.org/10.1136/bmj.l4898
15. Guyatt G, Oxman AD, Akl EA, et al. GRADE guidelines: 1. Introduction-GRADE evidence profiles and summary of findings tables. J Clin Epidemiol. 2011;64(4):383-394. https://doi.org/10.1016/j.jclinepi.2010.04.026
16. Raudenbush SW. Analyzing effect sizes: random-effects models. In: Cooper H, Hedges LV, Valentine JC, eds. The Handbook of Research Synthesis and Meta-Analysis. 2nd ed. Russel Sage Foundation; 2009:295-316.
17. Sweeting MJ, Sutton AJ, Lambert PC. What to add to nothing? Use and avoidance of continuity corrections in meta-analysis of sparse data. Stat Med. 2004;23(9):1351-1375. https://doi.org/10.1002/sim.1761
18. DerSimonian R, Laird N. Meta-analysis in clinical trials. Control Clin Trials. 1986;7(3):177-188. https://doi.org/10.1016/0197-2456(86)90046-2
19. Freeman MF, Tukey JW. Transformations related to the angular and the square root. Ann Math Statist. 1950;21(4):607-611. https://doi.org/10.1214/aoms/1177729756
20. Higgins JPT, Thompson SG, Deeks JJ, Altman DG. Measuring inconsistency in meta-analyses. BMJ. 2003;327(7414):557-560. https://doi.org/10.1136/bmj.327.7414.557
21. Higgins JPT, Chandler TJ, Cumptson M, Li T, Page MJ, Welch VA, eds. Cochrane Handbook for Systematic Reviews of Interventions version 6.1 (updated September 2020). Cochrane, 2020. www.training.cochrane.org/handbook
22. Higgins JPT, Thompson SG, Spiegelhalter DJ. A re-evaluation of random-effects meta-analysis. J R Stat Soc Ser A Stat Soc. Jan 2009;172(1):137-159. https://doi.org/10.1111/j.1467-985X.2008.00552.x
23. Gerstman BB, Kirkman R, Platt R. Intestinal necrosis associated with postoperative orally administered sodium polystyrene sulfonate in sorbitol. Am J Kidney Dis. 1992;20(2):159-161. https://doi.org/10.1016/s0272-6386(12)80544-0
24. Batterink J, Lin J, Au-Yeung SHM, Cessford T. Effectiveness of sodium polystyrene sulfonate for short-term treatment of hyperkalemia. Can J Hosp Pharm. 2015;68(4):296-303. https://doi.org/10.4212/cjhp.v68i4.1469
25. Lepage L, Dufour AC, Doiron J, et al. Randomized clinical trial of sodium polystyrene sulfonate for the treatment of mild hyperkalemia in CKD. Clin J Am Soc Nephrol. 2015;10(12):2136-2142. https://doi.org/10.2215/CJN.03640415
26. Little DJ, Nee R, Abbott KC, Watson MA, Yuan CM. Cost-utility analysis of sodium polystyrene sulfonate vs. potential alternatives for chronic hyperkalemia. Clin Nephrol. 2014;81(4):259-268. https://doi.org/10.5414/cn108103
27. Cubiella Fernández J, Núñez Calvo L, González Vázquez E, et al. Risk factors associated with the development of ischemic colitis. World J Gastroenterol. 2010;16(36):4564-4569. https://doi.org/10.3748/wjg.v16.i36.4564
28. Laureati P, Evans M, Trevisan M, et al. Sodium polystyrene sulfonate, practice patterns and associated adverse event risk; a nationwide analysis from the Swedish Renal Register [abstract]. Nephroly Dial Transplant. 2019;34(suppl 1):i94. https://doi.org/10.1093/ndt/gfz106.FP151
29. Santesso N, Carrasco-Labra A, Langendam M, et al. Improving GRADE evidence tables part 3: detailed guidance for explanatory footnotes supports creating and understanding GRADE certainty in the evidence judgments. J Clin Epidemiol. 2016;74:28-39. https://doi.org/10.1016/j.jclinepi.2015.12.006
30. Deeks JJ HJ, Altman DG. Analysing data and undertaking meta-analyses. In: Cochrane Handbook for Systematic Reviews of Interventions version 6.1 (updated September 2020). Higgins JPT, Thomas J, Chandler J, Cumpston M, Li T, Page MJ, Welch VA, eds. Cochrane, 2020. www.training.cochrane.org/handbook
Sodium polystyrene sulfonate (SPS) was first approved in the United States in 1958 and is a commonly prescribed medication for hyperkalemia.1 SPS works by exchanging potassium for sodium in the colonic lumen, thereby promoting potassium loss in the stool. However, reports of severe gastrointestinal side effects, particularly intestinal necrosis, have been persistent since the 1970s,2 leading some authors to recommend against the use of SPS.3,4 In 2009, the US Food and Drug Administration (FDA) warned against concomitant sorbitol administration, which was implicated in some studies.4,5 The concern about gastrointestinal side effects has also led to the development and FDA approval of two new cation-exchange resins for treatment of hyperkalemia.6 A prior systematic review of the literature found 30 separate case reports or case series including a total of 58 patients who were treated with SPS and developed severe gastrointestinal side effects.7 Because the included studies were all case reports or case series and therefore did not include comparison groups, it could not be determined whether SPS had a causal role in gastrointestinal side effects, and the authors could only conclude that there was a “possible” association. In contrast to case reports, several large cohort studies have been published more recently and report the risk of severe gastrointestinal adverse events associated with SPS compared with controls.8-10 While some studies found an increased risk, others have not. Given this uncertainty, we undertook a systematic review of studies that report the incidence of severe gastrointestinal side effects with SPS compared with controls.
METHODS
Data Sources and Search Strategy
A systematic search of the literature was conducted by a medical librarian using the Cochrane Library, Embase, Medline, Google Scholar, PubMed, Scopus, and Web of Science Core Collection databases to find relevant articles published from database inception to October 4, 2020. The search was peer reviewed by a second medical librarian using Peer Review of Electronic Search Strategies (PRESS).11 Databases were searched using a combination of controlled vocabulary and free-text terms for “SPS” and “bowel necrosis.” Details of the full search strategy are listed in Appendix A. References from all databases were imported into an EndNote X9 library, duplicates removed, and then uploaded into Coviden
Data Extraction and Quality Assessment
We used a standardized form to extract data, which included author, year, country, study design, setting, number of patients, SPS formulation, dosing, exposure, sorbitol content, outcomes of intestinal necrosis and the composite severe gastrointestinal adverse events, and the duration of time from SPS exposure to outcome occurrence. Two reviewers (JLH and AER) independently assessed the methodological quality of included studies using the Risk of Bias in Non-randomized Studies of Interventions (ROBINS-I) tool for observational studies13 and the Revised Cochrane risk of bias (RoB 2) tool for randomized controlled trials (RCTs).14 Additionally, two reviewers (JLH and CGG) graded overall strength of evidence based on the Grading of Recommendations Assessment, Development and Evaluation (GRADE) system.15 Disagreement was resolved by consensus.
Data Synthesis and Analysis
The proportion of patients with intestinal necrosis was compared using random effects meta-analysis using the restricted maximum likelihood method.16 For the two studies that reported hazard ratios (HRs), meta-analysis was performed after log transformation of the HRs and CIs. One study that performed survival analysis presented data for both the duration of the study (up to 11 years) and up to 1 year after exposure.9 We used the data up to 1 year after exposure because we believed later events were more likely to be due to chance than exposure to SPS. For studies with zero events, we used the treat ment-arm continuity correction, which has been reported to be preferable to the standard fixed-correction factor.17 We also performed two sensitivity analyses, including omitting the studies with zero events and performing meta-analysis using risk difference. The prevalence of intestinal ischemia was pooled using the DerSimonian and Laird18 random effects model with Freeman-Tukey19 double arcsine transformation. Heterogeneity was estimated using the I² statistic. I² values of 25%, 50%, and 75% were considered low, moderate, and high heterogeneity, respectively.20 Meta-regression and tests for small-study effects were not performed because of the small number of included studies.21 In addition to random effects meta-analysis, we calculated the 90% predicted interval for future studies for the pooled effect of intestinal ischemia.22 Statistical analysis was performed using meta and metaprop commands in Stata/IC, version 16.1 (StataCorp).
RESULTS
Selected Studies
The electronic search yielded 806 unique articles, of which 791 were excluded based on title and abstract, leaving 15 articles for full-text review (Appendix B). Appendix C describes the nine studies that were excluded, including the reason for exclusion. Table 1 describes the characteristics of the six studies that met study inclusion criteria. Studies were published between 1992 and 2020. Three studies were from Canada,10,24,25 two from the United States,8,23 and one from Sweden.9 Three studies occurred in an outpatient setting,9,10,25 and three were described as inpatient studies.8,23,24 SPS preparations included sorbitol in three studies,8,23,24 were not specified in one study,10 and were not included in two studies.9,25 SPS dosing varied widely, with median doses of 15 to 30 g in three studies,9,24,25 45 to 50 g in two studies,8,23 and unspecified in one study.10 Duration of exposure typically ranged from 1 to 7 days but was not consistently described. For example, two of the studies did not report duration of exposure,8,10 and a third study reported a single dispensation of 450 g in 41% of patients, with the remaining 59% averaging three dispensations within the first year.9 Sample size ranged from 33 to 123,391 patients. Most patients were male, and mean ages ranged from 44 to 78 years. Two studies limited participation to those with chronic kidney disease (CKD) with glomerular filtration rate (GFR) <4024 or CKD stage 4 or 5 or dialysis.9 Two studies specifically limited participation to patients with potassium levels of 5.0 to 5.9 mmol/L.24,25 All six studies reported outcomes for intestinal necrosis, and four reported composite outcomes for major adverse gastrointestinal events.9,10,24,25
Table 2 describes the assessment of risk of bias using the ROBINS-I tool for the five retrospective observational studies and the RoB 2 tool for the one RCT.13,14 Three studies were rated as having serious risk of bias, with the remainder having a moderate risk of bias or some concerns. Two studies were judged as having a serious risk of bias because of potential confounding.8,23 To be judged low or moderate risk, studies needed to measure and control for potential risk factors for intestinal ischemia, such as age, diabetes, vascular disease, and heart failure.26,27 One study also had serious risk of bias for selective reporting because the published abstract of the study used a different analysis and had contradictory results from the published study.9,28 An additional area of risk of bias that did not fit into the ROBINS-I tool is that the two studies that used survival analysis chose durations for the outcome that were longer than would be expected for adverse events from SPS to be evident. One study chose 30 days and the other up to a maximum of 11 years from the time of exposure.9,10
Quantitative Outcomes
Six studies including 26,716 patients treated with SPS and controls reported the proportion of patients who developed intestinal necrosis. The Figure shows the individual study and pooled results for intestinal necrosis. The prevalence of intestinal ischemia in patients treated with SPS was 0.1% (95% CI, 0.03%-0.17%). The pooled odds ratio (OR) of intestinal necrosis was 1.43 (95% CI, 0.39-5.20). The 90% predicted interval for future studies was 0.08 to 26.6. Two studies reported rates of intestinal necrosis using survival analysis. The pooled HR from these studies was 2.00 (95% CI, 0.45-8.78). Two studies performed survival analysis for a composite outcome of severe gastrointestinal adverse events. The pooled HR for these two studies was 1.46 (95% CI, 1.01-2.11).
For the meta-analysis of intestinal necrosis, we found moderate-high statistical significance (Q = 18.82; P < .01; I² = 67.8%). Sensitivity analysis removing each study did not affect heterogeneity, with the exception of removing the study by Laureati et al,9 which resolved the heterogeneity (Q = 1.7, P = .8, I² = 0%). The pooled effect for intestinal necrosis also became statistically significant after removing Laureati et al (OR, 2.87; 95% CI, 1.24-6.63).9 We also performed two subgroup analyses, including studies that involved the concomitant use of sorbitol8,23,24 compared with studies that did not9,25 and subgroup analysis removing studies with zero events. Studies that included sorbitol found higher rates of intestinal necrosis (OR, 2.26; 95% CI, 0.80-6.38; I² = 0%) compared with studies that did not include sorbitol (OR, 0.25; 95% CI, 0.11-0.57; I² = 0%; test of group difference, P < .01). Removing the three studies with zero events resulted in a similar overall effect (OR, 1.30; 95% CI, 0.21-8.19). Finally, a meta-analysis using risk difference instead of ORs found a non–statistically significant difference in rate of intestinal necrosis favoring the control group (risk difference, −0.00033; 95% CI, −0.0022 to 0.0015; I² = 84.6%).
Table 3 summarizes our review findings and presents overall strength of evidence. Overall strength of evidence was found to be very low. Per GRADE criteria,15,29 strength of evidence for observational studies starts at low and may then be modified by the presence of bias, inconsistency, indirectness, imprecision, effect size, and direction of confounding. In the case of the three meta-analyses in the present study, risk of bias was serious for more than half of the study weights. Strength of evidence was also downrated for imprecision because of the low number of events and resultant wide CIs.
DISCUSSION
In total, we found six studies that reported rates of intestinal necrosis or severe gastrointestinal adverse events with SPS use compared with controls. The pooled rate of intestinal necrosis was not significantly higher for patients exposed to SPS when analyzed either as the proportion of patients with events or as HRs. The pooled rate for a composite outcome of severe gastrointestinal side effects was significantly higher (HR, 1.46; 95% CI, 1.01-2.11). The overall strength of evidence for the association of SPS with either intestinal necrosis or the composite outcome was found to be very low because of risk of bias and imprecision.
In some ways, our results emphasize the difficulty of showing a causal link between a medication and a possible rare adverse event. The first included study to assess the risk of intestinal necrosis after exposure to SPS compared with controls found only two events in the SPS group and no events in the control arm.23 Two additional studies that we found were small and did not report any events in either arm.24,25 The first large study to assess the risk of intestinal ischemia included more than 2,000 patients treated with SPS and more than 100,000 controls but found no difference in risk.8 The next large study did find increased risk of both intestinal necrosis (incidence rate, 6.82 per 1,000 person-years compared with 1.22 per 1,000 person-years for controls) and a composite outcome (incidence rate, 22.97 per 1,000 person-years compared with 11.01 per 1000 person-years for controls), but in the time to event analysis included events up to 30 days after treatment with SPS.10 A prior review of case reports of SPS and intestinal necrosis found a median of 2 days between SPS treatment and symptom onset.7 It is unlikely the authors would have had sufficient events to meaningfully compare rates if they limited the analysis to events within 7 days of SPS treatment, but events after a week of exposure are unlikely to be due to SPS. The final study to assess the association of SPS with intestinal necrosis actually found higher rates of intestinal necrosis in the control group when analyzed as proportions with events but reported a higher rate of a composite outcome of severe gastrointestinal adverse events that included nine separate International Classification of Diseases codes occurring up to 11 years after SPS exposure.9 This study was limited by evidence of selective reporting and was funded by the manufacturers of an alternative cation-exchange medication.
Based on our review of the literature, it is unclear if SPS does cause intestinal ischemia. The pooled results for intestinal ischemia analyzed as a proportion with events or with survival analysis did not find a statistically significantly increased risk. Because most o
A cost analysis of SPS vs potential alternatives such as patiromer for patients on chronic RAAS-I with a history of hyperkalemia or CKD published by Little et al26 concluded that SPS remained the cost-effective option when colonic necrosis incidence is 19.9% or less, and our systematic review reveals an incidence of 0.1% (95% CI, 0.03-0.17%). The incremental cost-effectiveness ratio was an astronomical $26,088,369 per quality-adjusted life-year gained, per Little’s analysis.
Limitations of our review are the heterogeneity of studies, which varied regarding inpatient or outpatient setting, formulations such as dosing, frequency, whether sorbitol was used, and interval from exposure to outcome measurement, which ranged from 7 days to 1 year. On sensitivity analysis, statistical heterogeneity was resolved by removing the study by Laureati et al.9 This study was notably different from the others because it included events occurring up to 1 year after exposure to SPS, which may have resulted in any true effect being diluted by later events unrelated to SPS. We did not exclude this study post hoc because this would result in bias; however, because the overall result becomes statistically significant without this study, our overall conclusion should be interpreted with caution.30 It is possible that future well-conducted studies may still find an effect of SPS on intestinal necrosis. Similarly, the finding that studies with SPS coformulated with sorbitol had statistically significantly increased risk of intestinal necrosis compared with studies without sorbitol should be interpreted with caution because the study by Laureati et al9 was included in the studies without sorbitol.
CONCLUSIONS
Based on our r
This work was presented at the Society of General Internal Medicine and Society of Hospital Medicine 2021 annual conferences.
1. Labriola L, Jadoul M. Sodium polystyrene sulfonate: still news after 60 years on the market. Nephrol Dial Transplant. 2020;35(9):1455-1458. https://doi.org/10.1093/ndt/gfaa004
2. Arvanitakis C, Malek G, Uehling D, Morrissey JF. Colonic complications after renal transplantation. Gastroenterology. 1973;64(4):533-538.
3. Parks M, Grady D. Sodium polystyrene sulfonate for hyperkalemia. JAMA Intern Med. 2019;179(8):1023-1024. https://doi.org/10.1001/jamainternmed.2019.1291
4. Sterns RH, Rojas M, Bernstein P, Chennupati S. Ion-exchange resins for the treatment of hyperkalemia: are they safe and effective? J Am Soc Nephrol. 2010;21(5):733-735. https://doi.org/10.1681/ASN.2010010079
5. Lillemoe KD, Romolo JL, Hamilton SR, Pennington LR, Burdick JF, Williams GM. Intestinal necrosis due to sodium polystyrene (Kayexalate) in sorbitol enemas: clinical and experimental support for the hypothesis. Surgery. 1987;101(3):267-272.
6. Sterns RH, Grieff M, Bernstein PL. Treatment of hyperkalemia: something old, something new. Kidney Int. 2016;89(3):546-554. https://doi.org/10.1016/j.kint.2015.11.018
7. Harel Z, Harel S, Shah PS, Wald R, Perl J, Bell CM. Gastrointestinal adverse events with sodium polystyrene sulfonate (Kayexalate) use: a systematic review. Am J Med. 2013;126(3):264.e269-24. https://doi.org/10.1016/j.amjmed.2012.08.016
8. Watson MA, Baker TP, Nguyen A, et al. Association of prescription of oral sodium polystyrene sulfonate with sorbitol in an inpatient setting with colonic necrosis: a retrospective cohort study. Am J Kidney Dis. 2012;60(3):409-416. https://doi.org/10.1053/j.ajkd.2012.04.023
9. Laureati P, Xu Y, Trevisan M, et al. Initiation of sodium polystyrene sulphonate and the risk of gastrointestinal adverse events in advanced chronic kidney disease: a nationwide study. Nephrol Dial Transplant. 2020;35(9):1518-1526. https://doi.org/10.1093/ndt/gfz150
10. Noel JA, Bota SE, Petrcich W, et al. Risk of hospitalization for serious adverse gastrointestinal events associated with sodium polystyrene sulfonate use in patients of advanced age. JAMA Intern Med. 2019;179(8):1025-1033. https://doi.org/10.1001/jamainternmed.2019.0631
11. McGowan J, Sampson M, Salzwedel DM, Cogo E, Foerster V, Lefebvre C. PRESS Peer Review of Electronic Search Strategies: 2015 guideline statement. J Clin Epidemiol. 2016;75:40-46. https://doi.org/10.1016/j.jclinepi.2016.01.021
12. Liberati A, Altman DG, Tetzlaff J, et al. The PRISMA statement for reporting systematic reviews and meta-analyses of studies that evaluate health care interventions: explanation and elaboration. Ann Intern Med. 2009;151(4):W65-94. https://doi.org/10.7326/0003-4819-151-4-200908180-00136
13. Sterne JA, Hernán MA, Reeves BC, et al. ROBINS-I: a tool for assessing risk of bias in non-randomised studies of interventions. BMJ. 2016;355:i4919. https://doi.org/10.1136/bmj.i4919
14. Sterne JAC, Savovic J, Page MJ, et al. RoB 2: a revised tool for assessing risk of bias in randomised trials. BMJ. 2019;366:l4898. https://doi.org/10.1136/bmj.l4898
15. Guyatt G, Oxman AD, Akl EA, et al. GRADE guidelines: 1. Introduction-GRADE evidence profiles and summary of findings tables. J Clin Epidemiol. 2011;64(4):383-394. https://doi.org/10.1016/j.jclinepi.2010.04.026
16. Raudenbush SW. Analyzing effect sizes: random-effects models. In: Cooper H, Hedges LV, Valentine JC, eds. The Handbook of Research Synthesis and Meta-Analysis. 2nd ed. Russel Sage Foundation; 2009:295-316.
17. Sweeting MJ, Sutton AJ, Lambert PC. What to add to nothing? Use and avoidance of continuity corrections in meta-analysis of sparse data. Stat Med. 2004;23(9):1351-1375. https://doi.org/10.1002/sim.1761
18. DerSimonian R, Laird N. Meta-analysis in clinical trials. Control Clin Trials. 1986;7(3):177-188. https://doi.org/10.1016/0197-2456(86)90046-2
19. Freeman MF, Tukey JW. Transformations related to the angular and the square root. Ann Math Statist. 1950;21(4):607-611. https://doi.org/10.1214/aoms/1177729756
20. Higgins JPT, Thompson SG, Deeks JJ, Altman DG. Measuring inconsistency in meta-analyses. BMJ. 2003;327(7414):557-560. https://doi.org/10.1136/bmj.327.7414.557
21. Higgins JPT, Chandler TJ, Cumptson M, Li T, Page MJ, Welch VA, eds. Cochrane Handbook for Systematic Reviews of Interventions version 6.1 (updated September 2020). Cochrane, 2020. www.training.cochrane.org/handbook
22. Higgins JPT, Thompson SG, Spiegelhalter DJ. A re-evaluation of random-effects meta-analysis. J R Stat Soc Ser A Stat Soc. Jan 2009;172(1):137-159. https://doi.org/10.1111/j.1467-985X.2008.00552.x
23. Gerstman BB, Kirkman R, Platt R. Intestinal necrosis associated with postoperative orally administered sodium polystyrene sulfonate in sorbitol. Am J Kidney Dis. 1992;20(2):159-161. https://doi.org/10.1016/s0272-6386(12)80544-0
24. Batterink J, Lin J, Au-Yeung SHM, Cessford T. Effectiveness of sodium polystyrene sulfonate for short-term treatment of hyperkalemia. Can J Hosp Pharm. 2015;68(4):296-303. https://doi.org/10.4212/cjhp.v68i4.1469
25. Lepage L, Dufour AC, Doiron J, et al. Randomized clinical trial of sodium polystyrene sulfonate for the treatment of mild hyperkalemia in CKD. Clin J Am Soc Nephrol. 2015;10(12):2136-2142. https://doi.org/10.2215/CJN.03640415
26. Little DJ, Nee R, Abbott KC, Watson MA, Yuan CM. Cost-utility analysis of sodium polystyrene sulfonate vs. potential alternatives for chronic hyperkalemia. Clin Nephrol. 2014;81(4):259-268. https://doi.org/10.5414/cn108103
27. Cubiella Fernández J, Núñez Calvo L, González Vázquez E, et al. Risk factors associated with the development of ischemic colitis. World J Gastroenterol. 2010;16(36):4564-4569. https://doi.org/10.3748/wjg.v16.i36.4564
28. Laureati P, Evans M, Trevisan M, et al. Sodium polystyrene sulfonate, practice patterns and associated adverse event risk; a nationwide analysis from the Swedish Renal Register [abstract]. Nephroly Dial Transplant. 2019;34(suppl 1):i94. https://doi.org/10.1093/ndt/gfz106.FP151
29. Santesso N, Carrasco-Labra A, Langendam M, et al. Improving GRADE evidence tables part 3: detailed guidance for explanatory footnotes supports creating and understanding GRADE certainty in the evidence judgments. J Clin Epidemiol. 2016;74:28-39. https://doi.org/10.1016/j.jclinepi.2015.12.006
30. Deeks JJ HJ, Altman DG. Analysing data and undertaking meta-analyses. In: Cochrane Handbook for Systematic Reviews of Interventions version 6.1 (updated September 2020). Higgins JPT, Thomas J, Chandler J, Cumpston M, Li T, Page MJ, Welch VA, eds. Cochrane, 2020. www.training.cochrane.org/handbook
© 2021 Society of Hospital Medicine
Clinical Progress Note: E-cigarette, or Vaping, Product Use-Associated Lung Injury
E-cigarettes are handheld devices that are used to aerosolize a liquid that commonly contains nicotine, flavorings, and polyethylene glycol and/or vegetable glycerin. These products vary widely in design and style (Figure 1); from the disposable “cigalikes” to vape pens, mods, tanks, and pod systems such as JUUL, there has been a dramatic increase in the recognition, use, sale, and variety of products.1 In addition to the known risks of e-cigarette use, with youth nicotine addiction and progression to cigarette smoking, there is evidence of a wide range of health concerns, including pulmonary and cardiovascular effects, immune dysfunction, and carcinogenesis.1 The emergence of patients with severe lung injury in the summer of 2019 highlighted the harmful health effects specific to these tobacco products.2 Ultimately named EVALI (e-cigarette, or vaping, product use-associated lung injury), there have been 2,807 hospitalized patients with 68 deaths reported to the Centers for Disease Control and Prevention (CDC).2,3 This clinical progress note reviews the epidemiology and clinical course of EVALI and strategies to distinguish the disease from other illnesses. This is particularly timely with the emergence of and surges in COVID-19 cases.4

SEARCH STRATEGY
As the first reports of patients with e-cigarette–associated lung injury were made in the summer of 2019, and the CDC defined EVALI in the fall of 2019, a PubMed search was performed for studies published from June 2019 to June 2020, using the search terms “EVALI” or “e-cigarette–associated lung injury.” In addition, the authors reviewed the CDC and US Food and Drug Administration (FDA) website and presentations on EVALI available in the public domain. Articles discussing COVID-19 and EVALI that the authors became aware of were also included. This update is intended for hospitalists as well as researchers and public health advocates.
DEFINING EVALI
Standard diagnostic criteria do not yet exist, and EVALI remains a diagnosis of exclusion. For epidemiologic (and not diagnostic) purposes, however, the CDC developed the following definitions.3 A confirmed EVALI case must include all of the following criteria:
- Vaping or dabbing within 90 days prior to symptoms. Vaping refers to using e-cigarettes, while dabbing denotes inhaling concentrated tetrahydrocannabinol (THC) products, also known as wax, shatter, or oil
- Pulmonary infiltrates on chest X-ray (CXR) or ground-glass opacities on computed tomography (CT) scan
- Absence of pulmonary infection (including negative respiratory viral panel and influenza testing)
- Negative respiratory infectious disease testing, as clinically indicated
- No evidence in the medical record to suggest an alternative diagnosis
The criteria for a probable EVALI case are similar, except that an infection may be identified but thought not to be the sole cause of lung injury, or the minimum criteria to rule out infection may not be met.
EPIDEMIOLOGY AND DEMOGRAPHICS
Although cases have been reported in all 50 states, the District of Columbia, and two US territories, geographic heterogeneity has been observed.3 Hospital admissions for EVALI reported to the CDC peaked in mid-September 2019 and declined through February 2020.3,8 Although the CDC is no longer reporting weekly numbers, cases continue to be reported in the literature, and current numbers are unclear.4,9,10 The decrease in cases since the peak is thought to be due to increased public awareness of the dangers associated with vaping (particularly with THC-containing products), law enforcement actions, and removal of vitamin E acetate from products.3,8
Risk factors associated with EVALI include younger age, male sex, and use of THC products.5,6 The median age of hospitalized patients diagnosed with EVALI is 24 years, with patients ranging from 13 to 85 years old.3 Overall, 66% of all EVALI patients were male, 82% reported use of a THC-containing product, and 57% reported use of a nicotine-containing product. Approximately 14% of patients reported exclusive nicotine use.3
Nearly half (44%) of hospitalized EVALI patients reported to the CDC required intensive care.7 Of the 68 fatal cases reported to the CDC, the patients were older, with a median age of 51 years (range, 15-75 years), and had increased rates of preexisting conditions, including obesity, asthma, cardiac disease, chronic obstructive pulmonary disease, and mental health disorders.7
HISTORICAL FEATURES
Patients with EVALI may initially present with a variety of respiratory, gastrointestinal, and constitutional symptoms (including fever, muscle aches, and fatigue).11 For this reason, clinicians should universally ask about vaping or dabbing as part of an exposure history, taking care to ensure confidentiality, especially in the adolescent or youth population.12 If the patient reports use, details, including the types of devices, how they were obtained and used, the ingredients in the e-cigarette solution (e-liquid), and the presence of additives or flavorings, should all be noted.3,5,9,12 This history may not be volunteered by the patient, which could result in a delay in diagnosing EVALI.9,12 Although the CDC uses vaping within 90 days in the criteria for diagnosis,3 the likelihood of EVALI decreases with increased time from last use; longer than 1 month is unlikely to be related.11
PHYSICAL EXAM AND LABORATORY STUDIES
Physical assessment of a patient with EVALI may be notable for fever, tachypnea, hypoxemia, or tachycardia; rales may be present, but the exam is often otherwise unrevealing.5,11,12Lab studies may show a mild leukocytosis with neutrophilic predominance and elevated inflammatory markers, including erythrocyte sedimentation rate and C-reactive protein. Procalcitonin may be normal or mildly increased, and, rarely, impaired renal function, hyponatremia, and mild transaminitis may also be present.5,7 As EVALI remains a diagnosis of exclusion, an infectious workup must be completed, which should include evaluation of respiratory viruses and influenza, as well as SARS-CoV-2 testing.11,12
IMAGING AND ADVANCED DIAGNOSTICS
CXR may show bilateral consolidative opacities.11 If the CXR is normal but EVALI is suspected, a CT scan can be considered for diagnostic purposes. Ground-glass opacities are often present on CT imaging (Figure 2), occasionally with subpleural sparing, although this finding is also nonspecific. Less frequently, pneumomediastinum, pleural effusion, or pneumothorax may occur.6,11

Finally, bronchoscopy may be used to exclude other diagnoses if less invasive measures are not conclusive; pulmonary lipid-laden macrophages are associated with EVALI but are nonspecific.5 Cytology and/or biopsy can be used to eliminate other diagnoses but cannot confirm a diagnosis of EVALI.5
DIFFERENTIAL DIAGNOSIS
Hospitalists care for many patients with respiratory symptoms, particularly in the midst of the COVID-19 pandemic and influenza season. Common infectious etiologies that may present similarly include COVID-19, community-acquired pneumonia, influenza, and other viral respiratory illnesses. Hospitalists may rely on microbiologic testing to rule out these causes. If there is a history of vaping and dabbing and this testing is negative, EVALI must be considered more strongly. Recent case studies report that patients with EVALI have been presumed to have COVID-19, despite negative SARS-CoV-2 testing, resulting in delayed diagnosis.4,9 Two small case series suggest that leukocytosis, subpleural sparing on CT scan, vitamin E acetate or macrophages in bronchoalveolar lavage (BAL) fluid, and quick improvement with steroids may suggest a diagnosis of EVALI, as opposed to COVID-19.4,10
Consultation with pulmonary, infectious disease, and toxicology specialists may be of benefit when the diagnosis remains unclear, and specific patient characteristics should guide additional evaluation. Less common diagnoses may need to be considered depending on specific patient factors. For example, patients in certain geographical areas may need testing for endemic fungi, adolescents with recurrent respiratory illnesses may benefit from evaluation for structural lung disease or immunodeficiencies, and patients with impaired immune function need evaluation for Pneumocystis jiroveci infection.5 Diagnostic and treatment algorithms have been developed by the CDC; Kalininskiy et al11 have also proposed a clinical algorithm.12,13
TREATMENT AND CLINICAL COURSE
Empiric treatment for typical infectious pathogens is often provided until evaluation is complete.11,12 Although no randomized clinical trials exist, the CDC and other treatment algorithms recommend supportive care and abstinence from vaping.11-13 Although there are limited data regarding dose and duration, case reports have noted clinical improvement with corticosteroids.6,11-13 Use of steroids can be considered in consultation with a pulmonologist based on the clinical picture, including severity of illness, coexisting infections, and comorbidities.6,11-13 Overall, the clinical course for hospitalized patients with EVALI is variable, but the majority improve with supportive therapy.11,12
Substance use and mental health screening should be performed during hospitalization, as appropriate social support and tobacco use treatment are essential components of care.13 The FDA and CDC recommend universal abstention from all THC-containing products, particularly from informal sources. These agencies also recommend that all nonsmoking adults, including youth and women who are pregnant, abstain from the use of any e-cigarette products.3 Resources for patients who are tobacco users include the nationally available quit line, 1-800-QUIT-NOW, and Smokefree.gov. Similarly, follow-up with a primary care provider within 48 hours of discharge, as well as a visit with a pulmonologist within 4 weeks, is recommended by the CDC per the discharge readiness checklist, with the goal of improving management through earlier follow-up.13 Hospitalists should report confirmed or presumed cases to their local or state health department. Correct medical coding should also be used with diagnosis to better track and care for patients with EVALI; as of April 1, 2020, the World Health Organization established a new International Classification of Diseases, 10th Revision (ICD-10) code, U07.0, for vaping-related injury.14
FUTURE RESEARCH
As EVALI has only recently been described, further research on prevention, etiology, pathophysiology, treatment, and outcomes is needed Although the precise pathophysiology of EVALI remains unknown, vitamin E acetate, a diluent used in some THC-containing e-cigarette solutions, was detected in the BAL of 48 of 51 patients with EVALI (94%) in one study.15 However, available evidence is not sufficient to rule out other toxins found in e-cigarette solution.3 Longitudinal studies should be done to follow patients with EVALI with an emphasis on sustained tobacco use treatment, as the long-term effects of e-cigarette use remain unknown. Furthermore, although corticosteroids are often used, there have been no clinical trials on their efficacy, dose, or duration. Finally, since the CDC is no longer reporting cases, continued epidemiologic studies are necessary.
CONCLUSIONS AND IMPLICATIONS FOR CLINICAL CARE
EVALI, first reported in August 2019, is associated with vaping and e-cigarette use and may present with respiratory, gastrointestinal, and constitutional symptoms similar to COVID-19. Healthcare teams should universally screen patients for tobacco, vaping, and e-cigarette use. The majority of patients with EVALI improve with supportive care and abstinence from vaping and e-cigarettes. Tobacco cessation treatment, which includes access to pharmacotherapy and counseling, is critical for patients with EVALI. Additional treatment may include steroids in consultation with subspecialists. The pathophysiology and long-term effects of EVALI remain unclear. Hospitalists should continue to report cases to their local or state health department and use the ICD-10 code for EVALI.
1. Walley SC, Wilson KM, Winickoff JP, Groner J. A public health crisis: electronic cigarettes, vape, and JUUL. Pediatrics. 2019;143(6):e20182741. https://doi.org/10.1542/peds.2018-2741
2. Davidson K, Brancato A, Heetderks P, et al. Outbreak of electronic-cigarette-associated acute lipoid pneumonia—North Carolina, July-August 2019. MMWR Morb Mortal Wkly Rep. 2019;68(36):784-786. https://doi.org/10.15585/mmwr.mm6836e1
3. Centers for Disease Control and Prevention. Outbreak of lung injury associated with the use of e-cigarette, or vaping, products. Updated February 25, 2020. Accessed June 5, 2020.https://www.cdc.gov/tobacco/basic_information/e-cigarettes/severe-lung-disease.html
4. Callahan SJ, Harris D, Collingridge DS, et al. Diagnosing EVALI in the time of COVID-19. Chest. 2020;158(5):2034-2037. https://doi.org/10.1016/j.chest.2020.06.029
5. Aberegg SK, Maddock SD, Blagev DP, Callahan SJ. Diagnosis of EVALI: general approach and the role of bronchoscopy. Chest. 2020;158(2):820-827. https://doi.org/10.1016/j.chest.2020.02.018
6. Layden JE, Ghinai I, Pray I, et al. Pulmonary illness related to e-cigarette use in Illinois and Wisconsin —final report. N Engl J Med. 2020;382(10):903-916. https://doi.org/10.1056/NEJMoa1911614
7. Werner AK, Koumans EH, Chatham-Stephens K, et al. Hospitalizations and deaths associated with EVALI. N Engl J Med. 2020;382(17):1589-1598. https://doi.org/10.1056/NEJMoa1915314
8. Krishnasamy VP, Hallowell BD, Ko JY, et al. Update: characteristics of a nationwide outbreak of e-cigarette, or vaping, product use-associated lung injury—United States, August 2019-January 2020. MMWR Morb Mortal Wkly Rep. 2020;69(3):90-94. https://doi.org/10.15585/mmwr.mm6903e2
9. Armatas C, Heinzerling A, Wilken JA. Notes from the field: e-cigarette, or vaping, product use-associated lung injury cases during the COVID-19 response—California, 2020. MMWR Morb Mortal Wkly Rep. 2020;69(25):801-802. https://doi.org/10.15585/mmwr.mm6925a5
10. Kazachkov M, Pirzada M. Diagnosis of EVALI in the COVID-19 era. Lancet Respir Med. 2020;8(12):1169-1170. https://doi.org/10.1016/S2213-2600(20)30450-1
11. Kalininskiy A, Bach CT, Nacca NE, et al. E-cigarette, or vaping, product use associated lung injury (EVALI): case series and diagnostic approach. Lancet Respir Med. 2019;7(12):1017-1026. https://doi.org/10.1016/S2213-2600(19)30415-1
12. Jatlaoui TC, Wiltz JL, Kabbani S, et al. Update: interim guidance for health care providers for managing patients with suspected e-cigarette, or vaping, product use-associated lung injury—United States, November 2019. MMWR Morb Mortal Wkly Rep. 2019;68(46):1081-1086. https://doi.org/10.15585/mmwr.mm6846e2
13. Evans ME, Twentyman E, Click ES, et al. Update: interim guidance for health care professionals evaluating and caring for patients with suspected e-cigarette, or vaping, product use-associated lung injury and for reducing the risk for rehospitalization and death following hospital discharge—United States, December 2019. MMWR Morb Mortal Wkly Rep. 2020;68(5152):1189-1194. https://doi.org/10.15585/mmwr.mm685152e2
14. AAP Division of Health Care Finance. Start using new diagnosis code for vaping-related disorder on April 1. American Academy of Pediatrics website. Accessed June 17, 2020. https://www.aappublications.org/news/aapnewsmag/2020/03/03/coding030320.full.pdf
15. Blount BC, Karwowski MP, Shields PG, et al. Vitamin E acetate in bronchoalveolar-lavage fluid associated with EVALI. N Engl J Med. 2020;382(8):697-705. https://doi.org/10.1056/NEJMoa1916433
E-cigarettes are handheld devices that are used to aerosolize a liquid that commonly contains nicotine, flavorings, and polyethylene glycol and/or vegetable glycerin. These products vary widely in design and style (Figure 1); from the disposable “cigalikes” to vape pens, mods, tanks, and pod systems such as JUUL, there has been a dramatic increase in the recognition, use, sale, and variety of products.1 In addition to the known risks of e-cigarette use, with youth nicotine addiction and progression to cigarette smoking, there is evidence of a wide range of health concerns, including pulmonary and cardiovascular effects, immune dysfunction, and carcinogenesis.1 The emergence of patients with severe lung injury in the summer of 2019 highlighted the harmful health effects specific to these tobacco products.2 Ultimately named EVALI (e-cigarette, or vaping, product use-associated lung injury), there have been 2,807 hospitalized patients with 68 deaths reported to the Centers for Disease Control and Prevention (CDC).2,3 This clinical progress note reviews the epidemiology and clinical course of EVALI and strategies to distinguish the disease from other illnesses. This is particularly timely with the emergence of and surges in COVID-19 cases.4
SEARCH STRATEGY
As the first reports of patients with e-cigarette–associated lung injury were made in the summer of 2019, and the CDC defined EVALI in the fall of 2019, a PubMed search was performed for studies published from June 2019 to June 2020, using the search terms “EVALI” or “e-cigarette–associated lung injury.” In addition, the authors reviewed the CDC and US Food and Drug Administration (FDA) website and presentations on EVALI available in the public domain. Articles discussing COVID-19 and EVALI that the authors became aware of were also included. This update is intended for hospitalists as well as researchers and public health advocates.
DEFINING EVALI
Standard diagnostic criteria do not yet exist, and EVALI remains a diagnosis of exclusion. For epidemiologic (and not diagnostic) purposes, however, the CDC developed the following definitions.3 A confirmed EVALI case must include all of the following criteria:
- Vaping or dabbing within 90 days prior to symptoms. Vaping refers to using e-cigarettes, while dabbing denotes inhaling concentrated tetrahydrocannabinol (THC) products, also known as wax, shatter, or oil
- Pulmonary infiltrates on chest X-ray (CXR) or ground-glass opacities on computed tomography (CT) scan
- Absence of pulmonary infection (including negative respiratory viral panel and influenza testing)
- Negative respiratory infectious disease testing, as clinically indicated
- No evidence in the medical record to suggest an alternative diagnosis
The criteria for a probable EVALI case are similar, except that an infection may be identified but thought not to be the sole cause of lung injury, or the minimum criteria to rule out infection may not be met.
EPIDEMIOLOGY AND DEMOGRAPHICS
Although cases have been reported in all 50 states, the District of Columbia, and two US territories, geographic heterogeneity has been observed.3 Hospital admissions for EVALI reported to the CDC peaked in mid-September 2019 and declined through February 2020.3,8 Although the CDC is no longer reporting weekly numbers, cases continue to be reported in the literature, and current numbers are unclear.4,9,10 The decrease in cases since the peak is thought to be due to increased public awareness of the dangers associated with vaping (particularly with THC-containing products), law enforcement actions, and removal of vitamin E acetate from products.3,8
Risk factors associated with EVALI include younger age, male sex, and use of THC products.5,6 The median age of hospitalized patients diagnosed with EVALI is 24 years, with patients ranging from 13 to 85 years old.3 Overall, 66% of all EVALI patients were male, 82% reported use of a THC-containing product, and 57% reported use of a nicotine-containing product. Approximately 14% of patients reported exclusive nicotine use.3
Nearly half (44%) of hospitalized EVALI patients reported to the CDC required intensive care.7 Of the 68 fatal cases reported to the CDC, the patients were older, with a median age of 51 years (range, 15-75 years), and had increased rates of preexisting conditions, including obesity, asthma, cardiac disease, chronic obstructive pulmonary disease, and mental health disorders.7
HISTORICAL FEATURES
Patients with EVALI may initially present with a variety of respiratory, gastrointestinal, and constitutional symptoms (including fever, muscle aches, and fatigue).11 For this reason, clinicians should universally ask about vaping or dabbing as part of an exposure history, taking care to ensure confidentiality, especially in the adolescent or youth population.12 If the patient reports use, details, including the types of devices, how they were obtained and used, the ingredients in the e-cigarette solution (e-liquid), and the presence of additives or flavorings, should all be noted.3,5,9,12 This history may not be volunteered by the patient, which could result in a delay in diagnosing EVALI.9,12 Although the CDC uses vaping within 90 days in the criteria for diagnosis,3 the likelihood of EVALI decreases with increased time from last use; longer than 1 month is unlikely to be related.11
PHYSICAL EXAM AND LABORATORY STUDIES
Physical assessment of a patient with EVALI may be notable for fever, tachypnea, hypoxemia, or tachycardia; rales may be present, but the exam is often otherwise unrevealing.5,11,12Lab studies may show a mild leukocytosis with neutrophilic predominance and elevated inflammatory markers, including erythrocyte sedimentation rate and C-reactive protein. Procalcitonin may be normal or mildly increased, and, rarely, impaired renal function, hyponatremia, and mild transaminitis may also be present.5,7 As EVALI remains a diagnosis of exclusion, an infectious workup must be completed, which should include evaluation of respiratory viruses and influenza, as well as SARS-CoV-2 testing.11,12
IMAGING AND ADVANCED DIAGNOSTICS
CXR may show bilateral consolidative opacities.11 If the CXR is normal but EVALI is suspected, a CT scan can be considered for diagnostic purposes. Ground-glass opacities are often present on CT imaging (Figure 2), occasionally with subpleural sparing, although this finding is also nonspecific. Less frequently, pneumomediastinum, pleural effusion, or pneumothorax may occur.6,11
Finally, bronchoscopy may be used to exclude other diagnoses if less invasive measures are not conclusive; pulmonary lipid-laden macrophages are associated with EVALI but are nonspecific.5 Cytology and/or biopsy can be used to eliminate other diagnoses but cannot confirm a diagnosis of EVALI.5
DIFFERENTIAL DIAGNOSIS
Hospitalists care for many patients with respiratory symptoms, particularly in the midst of the COVID-19 pandemic and influenza season. Common infectious etiologies that may present similarly include COVID-19, community-acquired pneumonia, influenza, and other viral respiratory illnesses. Hospitalists may rely on microbiologic testing to rule out these causes. If there is a history of vaping and dabbing and this testing is negative, EVALI must be considered more strongly. Recent case studies report that patients with EVALI have been presumed to have COVID-19, despite negative SARS-CoV-2 testing, resulting in delayed diagnosis.4,9 Two small case series suggest that leukocytosis, subpleural sparing on CT scan, vitamin E acetate or macrophages in bronchoalveolar lavage (BAL) fluid, and quick improvement with steroids may suggest a diagnosis of EVALI, as opposed to COVID-19.4,10
Consultation with pulmonary, infectious disease, and toxicology specialists may be of benefit when the diagnosis remains unclear, and specific patient characteristics should guide additional evaluation. Less common diagnoses may need to be considered depending on specific patient factors. For example, patients in certain geographical areas may need testing for endemic fungi, adolescents with recurrent respiratory illnesses may benefit from evaluation for structural lung disease or immunodeficiencies, and patients with impaired immune function need evaluation for Pneumocystis jiroveci infection.5 Diagnostic and treatment algorithms have been developed by the CDC; Kalininskiy et al11 have also proposed a clinical algorithm.12,13
TREATMENT AND CLINICAL COURSE
Empiric treatment for typical infectious pathogens is often provided until evaluation is complete.11,12 Although no randomized clinical trials exist, the CDC and other treatment algorithms recommend supportive care and abstinence from vaping.11-13 Although there are limited data regarding dose and duration, case reports have noted clinical improvement with corticosteroids.6,11-13 Use of steroids can be considered in consultation with a pulmonologist based on the clinical picture, including severity of illness, coexisting infections, and comorbidities.6,11-13 Overall, the clinical course for hospitalized patients with EVALI is variable, but the majority improve with supportive therapy.11,12
Substance use and mental health screening should be performed during hospitalization, as appropriate social support and tobacco use treatment are essential components of care.13 The FDA and CDC recommend universal abstention from all THC-containing products, particularly from informal sources. These agencies also recommend that all nonsmoking adults, including youth and women who are pregnant, abstain from the use of any e-cigarette products.3 Resources for patients who are tobacco users include the nationally available quit line, 1-800-QUIT-NOW, and Smokefree.gov. Similarly, follow-up with a primary care provider within 48 hours of discharge, as well as a visit with a pulmonologist within 4 weeks, is recommended by the CDC per the discharge readiness checklist, with the goal of improving management through earlier follow-up.13 Hospitalists should report confirmed or presumed cases to their local or state health department. Correct medical coding should also be used with diagnosis to better track and care for patients with EVALI; as of April 1, 2020, the World Health Organization established a new International Classification of Diseases, 10th Revision (ICD-10) code, U07.0, for vaping-related injury.14
FUTURE RESEARCH
As EVALI has only recently been described, further research on prevention, etiology, pathophysiology, treatment, and outcomes is needed Although the precise pathophysiology of EVALI remains unknown, vitamin E acetate, a diluent used in some THC-containing e-cigarette solutions, was detected in the BAL of 48 of 51 patients with EVALI (94%) in one study.15 However, available evidence is not sufficient to rule out other toxins found in e-cigarette solution.3 Longitudinal studies should be done to follow patients with EVALI with an emphasis on sustained tobacco use treatment, as the long-term effects of e-cigarette use remain unknown. Furthermore, although corticosteroids are often used, there have been no clinical trials on their efficacy, dose, or duration. Finally, since the CDC is no longer reporting cases, continued epidemiologic studies are necessary.
CONCLUSIONS AND IMPLICATIONS FOR CLINICAL CARE
EVALI, first reported in August 2019, is associated with vaping and e-cigarette use and may present with respiratory, gastrointestinal, and constitutional symptoms similar to COVID-19. Healthcare teams should universally screen patients for tobacco, vaping, and e-cigarette use. The majority of patients with EVALI improve with supportive care and abstinence from vaping and e-cigarettes. Tobacco cessation treatment, which includes access to pharmacotherapy and counseling, is critical for patients with EVALI. Additional treatment may include steroids in consultation with subspecialists. The pathophysiology and long-term effects of EVALI remain unclear. Hospitalists should continue to report cases to their local or state health department and use the ICD-10 code for EVALI.
1. Walley SC, Wilson KM, Winickoff JP, Groner J. A public health crisis: electronic cigarettes, vape, and JUUL. Pediatrics. 2019;143(6):e20182741. https://doi.org/10.1542/peds.2018-2741
2. Davidson K, Brancato A, Heetderks P, et al. Outbreak of electronic-cigarette-associated acute lipoid pneumonia—North Carolina, July-August 2019. MMWR Morb Mortal Wkly Rep. 2019;68(36):784-786. https://doi.org/10.15585/mmwr.mm6836e1
3. Centers for Disease Control and Prevention. Outbreak of lung injury associated with the use of e-cigarette, or vaping, products. Updated February 25, 2020. Accessed June 5, 2020.https://www.cdc.gov/tobacco/basic_information/e-cigarettes/severe-lung-disease.html
4. Callahan SJ, Harris D, Collingridge DS, et al. Diagnosing EVALI in the time of COVID-19. Chest. 2020;158(5):2034-2037. https://doi.org/10.1016/j.chest.2020.06.029
5. Aberegg SK, Maddock SD, Blagev DP, Callahan SJ. Diagnosis of EVALI: general approach and the role of bronchoscopy. Chest. 2020;158(2):820-827. https://doi.org/10.1016/j.chest.2020.02.018
6. Layden JE, Ghinai I, Pray I, et al. Pulmonary illness related to e-cigarette use in Illinois and Wisconsin —final report. N Engl J Med. 2020;382(10):903-916. https://doi.org/10.1056/NEJMoa1911614
7. Werner AK, Koumans EH, Chatham-Stephens K, et al. Hospitalizations and deaths associated with EVALI. N Engl J Med. 2020;382(17):1589-1598. https://doi.org/10.1056/NEJMoa1915314
8. Krishnasamy VP, Hallowell BD, Ko JY, et al. Update: characteristics of a nationwide outbreak of e-cigarette, or vaping, product use-associated lung injury—United States, August 2019-January 2020. MMWR Morb Mortal Wkly Rep. 2020;69(3):90-94. https://doi.org/10.15585/mmwr.mm6903e2
9. Armatas C, Heinzerling A, Wilken JA. Notes from the field: e-cigarette, or vaping, product use-associated lung injury cases during the COVID-19 response—California, 2020. MMWR Morb Mortal Wkly Rep. 2020;69(25):801-802. https://doi.org/10.15585/mmwr.mm6925a5
10. Kazachkov M, Pirzada M. Diagnosis of EVALI in the COVID-19 era. Lancet Respir Med. 2020;8(12):1169-1170. https://doi.org/10.1016/S2213-2600(20)30450-1
11. Kalininskiy A, Bach CT, Nacca NE, et al. E-cigarette, or vaping, product use associated lung injury (EVALI): case series and diagnostic approach. Lancet Respir Med. 2019;7(12):1017-1026. https://doi.org/10.1016/S2213-2600(19)30415-1
12. Jatlaoui TC, Wiltz JL, Kabbani S, et al. Update: interim guidance for health care providers for managing patients with suspected e-cigarette, or vaping, product use-associated lung injury—United States, November 2019. MMWR Morb Mortal Wkly Rep. 2019;68(46):1081-1086. https://doi.org/10.15585/mmwr.mm6846e2
13. Evans ME, Twentyman E, Click ES, et al. Update: interim guidance for health care professionals evaluating and caring for patients with suspected e-cigarette, or vaping, product use-associated lung injury and for reducing the risk for rehospitalization and death following hospital discharge—United States, December 2019. MMWR Morb Mortal Wkly Rep. 2020;68(5152):1189-1194. https://doi.org/10.15585/mmwr.mm685152e2
14. AAP Division of Health Care Finance. Start using new diagnosis code for vaping-related disorder on April 1. American Academy of Pediatrics website. Accessed June 17, 2020. https://www.aappublications.org/news/aapnewsmag/2020/03/03/coding030320.full.pdf
15. Blount BC, Karwowski MP, Shields PG, et al. Vitamin E acetate in bronchoalveolar-lavage fluid associated with EVALI. N Engl J Med. 2020;382(8):697-705. https://doi.org/10.1056/NEJMoa1916433
© 2021 Society of Hospital Medicine
Incidentally Detected SARS-COV-2 Among Hospitalized Patients in Los Angeles County, August to October 2020
Many of the 85 hospitals in Los Angeles County (LAC) routinely test patients for SARS-CoV-2, the virus that causes COVID-19, upon admission to the hospital.1 However, not all SARS-CoV-2 detections represent acute COVID-19 for at least two reasons. First, the SARS-CoV-2 real-time polymerase chain reaction (RT-PCR) assay can report a false-positive result.2 Second, approximately 40% to 45% of persons with SARS-CoV-2 infection are asymptomatic, and RT-PCR tests can remain positive more than 2 months after an individual recovers from COVID-19; thus, SARS-CoV-2 detected on admission might represent shedding of nonviable virus from a prior unrecognized or undiagnosed infection.1,3
Public health policymakers closely monitor the rate of COVID-19 hospitalizations because it informs decisions to impose or relax COVID-19 control measures. However, the percentage of hospitalizations misclassified as COVID-19–associated because of incidentally detected SARS-CoV-2 (ie, COVID-19 was not a primary or contributing cause of hospitalization) is unknown. Therefore, we sought to determine the percentage of hospitalizations in LAC classified as having COVID-19 that might have had incidental SARS-CoV-2 detection.
METHODS
The state of California requires healthcare providers to report all COVID-19 cases and clinical laboratories to report all SARS-CoV-2 diagnostic test results. Hospitals in LAC are mandated to report daily lists of all persons hospitalized with suspected or confirmed COVID-19 to the LAC Department of Public Health (DPH) COVID-19 Hospital Electronic Surveillance System (CHESS).4 Hospitals provide daily data to CHESS containing information about patients in their facilities with COVID-19. We conducted a cross-sectional retrospective study by selecting a random set of medical records from CHESS for review.
We began regularly and systematically reviewing medical records of patients in CHESS discharged after August 1, 2020, as part of LAC DPH surveillance to characterize persons experiencing severe COVID-19, defined as illness requiring hospitalization. For severe COVID-19 surveillance, we randomly selected 45 discharged patients per week from CHESS in August 2020 and 50 discharged patients per week between September and October 2020. To ensure that the sample represented the overall age distribution of patients in CHESS, we ordered patients by birth date and selected every k record, where k represented the interval between patients needed to meet the target for the week. Before random sample selection, several free text fields from the CHESS dataset were queried to identify and remove patients who were not LAC residents, were seen in the emergency department but not admitted, were hospitalized for <1 day, were discharged from a non-acute care hospital, or if the hospital-reported patient did not have a positive SARS-CoV-2 test. We then requested full medical records for these patients from the respective hospitals. After we received the medical records, a team of four nurses independently reviewed the medical charts and excluded patients who did not meet the above listed exclusion criteria; patients were excluded at two points—during the automated query and again by manual review.
In addition, severe COVID-19 surveillance was intended to characterize primary admissions for COVID-19, defined as having a documented positive SARS-CoV-2 result within 10 days of symptom onset or hospital admission and no prior hospitalization for COVID-19. The date of the first positive result was validated by locating the positive SARS-COV-2 result in the patient’s medical record and/or the LAC COVID surveillance database; the patient was excluded from analysis if a positive SARS-CoV-2 result could not be found. Excluded discharges were not replaced by a new randomly selected patient. Instead, we oversampled the number of weekly charts to request with a goal of having 40 to 45 charts per week that met inclusion criteria for abstraction.
For this analysis, we examined medical records abstracted for discharges occurring between August 1 and October 31, 2020. We categorized hospitalizations into one of the following: (1) “likely COVID-19–associated” if the patient had
Descriptive statistics and all analyses were conducted using SAS version 9.4 (SAS Institute). Confidence limits (CL) were calculated using the proc freq CL option in SAS. Chi-square analysis was conducted to determine whether trends in hospitalization categories changed over time. Statistical significance was set at P < .05.
RESULTS
Of the 13,813 hospital discharges reported to CHESS from August to October 2020, 3,182 (23%) records were not eligible for inclusion in the random selection sample for the following reasons: 1,765 (13%) patients reported by hospitals did not have a positive COVID-19 test, 734 (5%) discharges were for non-LAC residents, 636 (5%) patients had a length of hospital stay <1 day, and 47 (<1%) discharges were from a non-acute care hospital. From the 10,631 discharges in CHESS meeting preliminary inclusion criteria from August 1 to October 31, 2020, we randomly selected 618 discharges for medical record review. Of the 618 discharges, 504 (85%) medical records were available for review as of November 30, 2020. After review of the 504 medical records, an additional 158 were excluded because 83 (13%) had a first documented positive SARS-CoV-2 test that was >10 days from hospital admission or symptom onset, 34 (6%) were previously hospitalized for COVID-19, 29 (5%) had an emergency department visit only, 6 (1%) were discharged from a non-acute care hospital, and 6 (1%) were non-LAC residents. We reviewed medical records for 346 (56%) of the 618 hospitalizations that met our inclusion criteria.
The demographic characteristics of patients included in our sample were similar to those of the overall patient population in CHESS (Table 1). Most patients in our final study population were male (54%), older than 50 years (66%), and Hispanic (60%); the median length of hospital stay for survivors was 5 days (first quartile–third quartile: 3 to 8 days).

Our analysis indicates that 71% (95% CL, 66%-75%) of hospital discharges were “likely COVID-19-associated”; 12% (CL, 9%-16%) were “not COVID-19–associated” and, therefore, had incidentally detected SARS-CoV-2; and 17% were “potentially COVID-19–associated” (CL, 13%-21%). The percentage of hospitalizations classified as “likely,” “potentially,” and “not COVID-19–associated” did not change from month-to-month during the study period (P = .81). Full-term delivery was the most common reason for hospitalization among patients with incidentally detected SARS-CoV-2 (Table 2).

DISCUSSION
The primary public health objective of the COVID-19 pandemic response has been to prevent overwhelming the healthcare system by slowing disease transmission. LAC DPH closely monitors the daily number of hospitalized COVID-19 patients, defined as hospitalization of a person with an associated positive SARS-CoV-2 result. However, increasing community transmission of SARS-CoV-2 can complicate interpretation of hospitalization data because it is likely that some patients with incidentally detected, nonviable virus will be misclassified as having COVID-19. Overestimating the burden of COVID-19–associated hospitalizations may lead public health policymakers to impose more restrictive control measures or remove restrictions more slowly. Results from this study can inform policymakers about the potential magnitude of overestimating COVID-19–associated hospitalizations.
Our results indicate that SARS-CoV-2 detection might be incidental (ie, “not COVID-19–associated”) in approximately one of eight persons hospitalized with COVID-19 in LAC. We likely underestimated the percentage of hospitalizations with incidental SARS-CoV-2 detection because our definition of “not COVID-19–associated” hospitalizations was intended to be specific for identifying patients who had no clear reason for SARS-CoV-2 testing except a presumed hospital policy of testing on admission or preoperatively. In addition, several patients classified as having a “potentially COVID-19–associated” hospitalization also had a primary reason for admission that currently does not have a clear link to COVID-19 (eg, Bell’s palsy and pelvic inflammatory disease). Although our sample size was relatively small, it was representative of all potential COVID-19 hospitalizations in LAC over a 3-month period.
CONCLUSION
Detection of SARS-CoV-2 in a person with a clinical presentation that is not compatible with COVID-19 can complicate initial clinical management because it is unclear if the result represents presymptomatic or asymptomatic infection, prolonged shedding of nonviable virus, or a false-positive result. Considering the consequences of missing a true infection, such as transmission to other staff or patients, healthcare providers are obligated to treat the test result as a real infection. Therefore, our results are not applicable to patient-level clinical management decisions, but highlight the need for policymakers and emergency preparedness personnel to consider that hospital-reported data might overestimate the burden of COVID-19 hospitalizations when making decisions that rely on hospitalization data as a metric. Additional research is needed to develop methods for correcting hospitalization data to account for patients in whom incidentally detected SARS-CoV-2 was not a direct or contributing cause of hospitalization. Adjusting COVID-19–associated hospitalization rates to account for incidental SARS-CoV-2 detection could allow for optimal resource planning by public health policymakers.
1. Liotti, FM, Menchinelli, G, Marchetti, S, et al. Assessment of SARS-CoV-2 RNA test results among patients who recovered from COVID-19 with prior negative results. JAMA Intern Med. 2021;181(5):702-704. https://doi.org/10.1001/jamainternmed.2020.7570
2. Centers for Disease Control and Prevention and Infectious Disease Society of America. RT-PCR Testing. Accessed April 19, 2021. https://www.idsociety.org/covid-19-real-time-learning-network/diagnostics/RT-pcr-testing
3. Oran DP, Topol EJ. Prevalence of asymptomatic SARS-CoV-2 infection: a narrative review. Ann Intern Med. 2020;173(5):362-367. https://doi.org/10.7326/M20-3012
4 Los Angeles County Department of Public Health. Daily reporting of hospitalized COVID-19 positive inpatients: updated data submission requirements and guide for acute care facilities in Los Angeles County. Accessed on December 10, 2020. http://publichealth.lacounty.gov/acd/docs/HospCOVIDReportingGuide.pdf
Many of the 85 hospitals in Los Angeles County (LAC) routinely test patients for SARS-CoV-2, the virus that causes COVID-19, upon admission to the hospital.1 However, not all SARS-CoV-2 detections represent acute COVID-19 for at least two reasons. First, the SARS-CoV-2 real-time polymerase chain reaction (RT-PCR) assay can report a false-positive result.2 Second, approximately 40% to 45% of persons with SARS-CoV-2 infection are asymptomatic, and RT-PCR tests can remain positive more than 2 months after an individual recovers from COVID-19; thus, SARS-CoV-2 detected on admission might represent shedding of nonviable virus from a prior unrecognized or undiagnosed infection.1,3
Public health policymakers closely monitor the rate of COVID-19 hospitalizations because it informs decisions to impose or relax COVID-19 control measures. However, the percentage of hospitalizations misclassified as COVID-19–associated because of incidentally detected SARS-CoV-2 (ie, COVID-19 was not a primary or contributing cause of hospitalization) is unknown. Therefore, we sought to determine the percentage of hospitalizations in LAC classified as having COVID-19 that might have had incidental SARS-CoV-2 detection.
METHODS
The state of California requires healthcare providers to report all COVID-19 cases and clinical laboratories to report all SARS-CoV-2 diagnostic test results. Hospitals in LAC are mandated to report daily lists of all persons hospitalized with suspected or confirmed COVID-19 to the LAC Department of Public Health (DPH) COVID-19 Hospital Electronic Surveillance System (CHESS).4 Hospitals provide daily data to CHESS containing information about patients in their facilities with COVID-19. We conducted a cross-sectional retrospective study by selecting a random set of medical records from CHESS for review.
We began regularly and systematically reviewing medical records of patients in CHESS discharged after August 1, 2020, as part of LAC DPH surveillance to characterize persons experiencing severe COVID-19, defined as illness requiring hospitalization. For severe COVID-19 surveillance, we randomly selected 45 discharged patients per week from CHESS in August 2020 and 50 discharged patients per week between September and October 2020. To ensure that the sample represented the overall age distribution of patients in CHESS, we ordered patients by birth date and selected every k record, where k represented the interval between patients needed to meet the target for the week. Before random sample selection, several free text fields from the CHESS dataset were queried to identify and remove patients who were not LAC residents, were seen in the emergency department but not admitted, were hospitalized for <1 day, were discharged from a non-acute care hospital, or if the hospital-reported patient did not have a positive SARS-CoV-2 test. We then requested full medical records for these patients from the respective hospitals. After we received the medical records, a team of four nurses independently reviewed the medical charts and excluded patients who did not meet the above listed exclusion criteria; patients were excluded at two points—during the automated query and again by manual review.
In addition, severe COVID-19 surveillance was intended to characterize primary admissions for COVID-19, defined as having a documented positive SARS-CoV-2 result within 10 days of symptom onset or hospital admission and no prior hospitalization for COVID-19. The date of the first positive result was validated by locating the positive SARS-COV-2 result in the patient’s medical record and/or the LAC COVID surveillance database; the patient was excluded from analysis if a positive SARS-CoV-2 result could not be found. Excluded discharges were not replaced by a new randomly selected patient. Instead, we oversampled the number of weekly charts to request with a goal of having 40 to 45 charts per week that met inclusion criteria for abstraction.
For this analysis, we examined medical records abstracted for discharges occurring between August 1 and October 31, 2020. We categorized hospitalizations into one of the following: (1) “likely COVID-19–associated” if the patient had
Descriptive statistics and all analyses were conducted using SAS version 9.4 (SAS Institute). Confidence limits (CL) were calculated using the proc freq CL option in SAS. Chi-square analysis was conducted to determine whether trends in hospitalization categories changed over time. Statistical significance was set at P < .05.
RESULTS
Of the 13,813 hospital discharges reported to CHESS from August to October 2020, 3,182 (23%) records were not eligible for inclusion in the random selection sample for the following reasons: 1,765 (13%) patients reported by hospitals did not have a positive COVID-19 test, 734 (5%) discharges were for non-LAC residents, 636 (5%) patients had a length of hospital stay <1 day, and 47 (<1%) discharges were from a non-acute care hospital. From the 10,631 discharges in CHESS meeting preliminary inclusion criteria from August 1 to October 31, 2020, we randomly selected 618 discharges for medical record review. Of the 618 discharges, 504 (85%) medical records were available for review as of November 30, 2020. After review of the 504 medical records, an additional 158 were excluded because 83 (13%) had a first documented positive SARS-CoV-2 test that was >10 days from hospital admission or symptom onset, 34 (6%) were previously hospitalized for COVID-19, 29 (5%) had an emergency department visit only, 6 (1%) were discharged from a non-acute care hospital, and 6 (1%) were non-LAC residents. We reviewed medical records for 346 (56%) of the 618 hospitalizations that met our inclusion criteria.
The demographic characteristics of patients included in our sample were similar to those of the overall patient population in CHESS (Table 1). Most patients in our final study population were male (54%), older than 50 years (66%), and Hispanic (60%); the median length of hospital stay for survivors was 5 days (first quartile–third quartile: 3 to 8 days).
Our analysis indicates that 71% (95% CL, 66%-75%) of hospital discharges were “likely COVID-19-associated”; 12% (CL, 9%-16%) were “not COVID-19–associated” and, therefore, had incidentally detected SARS-CoV-2; and 17% were “potentially COVID-19–associated” (CL, 13%-21%). The percentage of hospitalizations classified as “likely,” “potentially,” and “not COVID-19–associated” did not change from month-to-month during the study period (P = .81). Full-term delivery was the most common reason for hospitalization among patients with incidentally detected SARS-CoV-2 (Table 2).
DISCUSSION
The primary public health objective of the COVID-19 pandemic response has been to prevent overwhelming the healthcare system by slowing disease transmission. LAC DPH closely monitors the daily number of hospitalized COVID-19 patients, defined as hospitalization of a person with an associated positive SARS-CoV-2 result. However, increasing community transmission of SARS-CoV-2 can complicate interpretation of hospitalization data because it is likely that some patients with incidentally detected, nonviable virus will be misclassified as having COVID-19. Overestimating the burden of COVID-19–associated hospitalizations may lead public health policymakers to impose more restrictive control measures or remove restrictions more slowly. Results from this study can inform policymakers about the potential magnitude of overestimating COVID-19–associated hospitalizations.
Our results indicate that SARS-CoV-2 detection might be incidental (ie, “not COVID-19–associated”) in approximately one of eight persons hospitalized with COVID-19 in LAC. We likely underestimated the percentage of hospitalizations with incidental SARS-CoV-2 detection because our definition of “not COVID-19–associated” hospitalizations was intended to be specific for identifying patients who had no clear reason for SARS-CoV-2 testing except a presumed hospital policy of testing on admission or preoperatively. In addition, several patients classified as having a “potentially COVID-19–associated” hospitalization also had a primary reason for admission that currently does not have a clear link to COVID-19 (eg, Bell’s palsy and pelvic inflammatory disease). Although our sample size was relatively small, it was representative of all potential COVID-19 hospitalizations in LAC over a 3-month period.
CONCLUSION
Detection of SARS-CoV-2 in a person with a clinical presentation that is not compatible with COVID-19 can complicate initial clinical management because it is unclear if the result represents presymptomatic or asymptomatic infection, prolonged shedding of nonviable virus, or a false-positive result. Considering the consequences of missing a true infection, such as transmission to other staff or patients, healthcare providers are obligated to treat the test result as a real infection. Therefore, our results are not applicable to patient-level clinical management decisions, but highlight the need for policymakers and emergency preparedness personnel to consider that hospital-reported data might overestimate the burden of COVID-19 hospitalizations when making decisions that rely on hospitalization data as a metric. Additional research is needed to develop methods for correcting hospitalization data to account for patients in whom incidentally detected SARS-CoV-2 was not a direct or contributing cause of hospitalization. Adjusting COVID-19–associated hospitalization rates to account for incidental SARS-CoV-2 detection could allow for optimal resource planning by public health policymakers.
1. Liotti, FM, Menchinelli, G, Marchetti, S, et al. Assessment of SARS-CoV-2 RNA test results among patients who recovered from COVID-19 with prior negative results. JAMA Intern Med. 2021;181(5):702-704. https://doi.org/10.1001/jamainternmed.2020.7570
2. Centers for Disease Control and Prevention and Infectious Disease Society of America. RT-PCR Testing. Accessed April 19, 2021. https://www.idsociety.org/covid-19-real-time-learning-network/diagnostics/RT-pcr-testing
3. Oran DP, Topol EJ. Prevalence of asymptomatic SARS-CoV-2 infection: a narrative review. Ann Intern Med. 2020;173(5):362-367. https://doi.org/10.7326/M20-3012
4 Los Angeles County Department of Public Health. Daily reporting of hospitalized COVID-19 positive inpatients: updated data submission requirements and guide for acute care facilities in Los Angeles County. Accessed on December 10, 2020. http://publichealth.lacounty.gov/acd/docs/HospCOVIDReportingGuide.pdf
© 2021 Society of Hospital Medicine
Excess Mortality Among Patients Hospitalized During the COVID-19 Pandemic
One of the most striking features of the early COVID-19 pandemic was the sudden and sharp reductions in emergency department (ED) visits and hospitalizations throughout the United States.1-4 Several studies have documented lower rates of hospitalization for many emergent, time-sensitive conditions, such as acute myocardial infarction, stroke, and hyperglycemic crises, starting shortly after community transmission of COVID-19 was recognized and social distancing guidelines were implemented.5-8 In most cases, hospital volumes rebounded after an initial drop, stabilizing at somewhat lower levels than those expected from historic trends.9
The observed shifts in hospital use largely have been attributed to patients’ forgoing or delaying necessary care,10 which underscores the indirect effects of the pandemic on patients without COVID-19.11 To date, the extent to which outcomes for patients without COVID-19 have been adversely affected is less well understood. Evidence suggests patients with acute and chronic illnesses have experienced increased morbidity and mortality since the onset of the pandemic. For example, in northern California, abrupt declines in ED visits for cardiac symptoms were coupled with higher rates of out-of-hospital cardiac arrest.12 Moreover, states with higher rates of COVID-19 also reported increased deaths attributed to heart disease, diabetes, and other conditions.13
To better understand these potential indirect effects, this study used data from a large, multistate health care system to examine changes in hospital volume and its relationship to in-hospital mortality for patients without COVID-19 during the first 10 months of the pandemic.
METHODS
Setting and Participants
We examined unplanned hospitalizations from January 2019 to December 2020 at 51 community hospitals across 6 states (Alaska, Washington, Montana, Oregon, California, and Texas) in the Providence St. Joseph Health system. Hospitals within the Providence system share a common standard dataset for each encounter with a centralized cloud data warehouse from which we extracted clinical and demographic data. No hospitals entered or left the system during the study period. Hospitalizations were considered unplanned if they had an “urgent” or “emergency” service type in the record; most originated in the ED. Hospitalizations for children younger than 18 years and those with evidence of COVID-19 (International Classification of Disease, Tenth Revision, Clinical Modification U07.1, a positive COVID-19 polymerase chain reaction test during the encounter, or an infection control-assigned label of COVID-19) were excluded. The Providence St. Joseph Health Institutional Review Board approved this study.
Measures
Trends in daily hospitalizations and their relationship to adjusted in-hospital mortality (percentage of patients who died during their hospital admission) were examined over time. In preliminary models using segmented regression, we identified three distinct pandemic periods with different trends in daily hospitalizations: (1) a 10-week period corresponding to the spring COVID-19 surge (March 4 to May 13, 2020; Period 1), (2) an intervening period extending over the summer and early fall (May 14 to October 19, 2020; Period 2), and (3) a second 10-week period corresponding to the fall COVID-19 surge (October 20 to December 31, 2020; Period 3). In-hospital mortality for these periods was compared with a baseline period (pre-COVID-19) from January 1, 2019 to March 3, 2020. To further assess differences in mortality by clinical condition, hospitalizations were first grouped by primary diagnosis using Clinical Classifications Software Refined (CCSR) categories from the Agency for Healthcare Research and Quality14 and ranked by the number of observed deaths and the percentage of patients who died while hospitalized in 2020. We selected common conditions that had >35 total deaths and an in-hospital mortality rate ≥1% for condition-specific analyses, of which 30 met these criteria.
Analysis
Multivariate logistic regression was used to evaluate changes in mortality for each of the pandemic periods compared with baseline for the overall cohort and selected diagnosis groups. Our main model adjusted for age, sex, race/ethnicity (White, Black, Latinx, Asian or Pacific Islander, and other), primary payor (commercial, Medicaid, Medicare, other, and self-pay), the presence or absence of 31 chronic comorbidities in the medical record, primary admitting diagnosis grouped by CCSR category (456 total diagnostic groups), and hospital fixed-effects to account for clustering. Results are expressed as the average marginal effects of each pandemic period on in-hospital mortality (eg, adjusted percentage point change in mortality over baseline). The number of excess deaths in each period was calculated by multiplying the estimated percentage point change in mortality for each period by the total number of hospitalizations. These excess deaths were subtracted from the number of observed deaths to derive the number of deaths that would be expected if pre-pandemic mortality rates persisted.
To further assess whether changes in adjusted mortality could be attributed to a smaller, sicker population of patients presenting to the hospital during the pandemic (meaning that less acutely ill patients stayed home), we conducted two sensitivity analyses. First, we tested whether substituting indicators for Medicare Severity Diagnosis Groups (MS-DRG) in lieu of CCSR categories had any impact on our results. MS-DRGs are designed to account for a patient’s illness severity and expected costs, whereas CCSR categories do not.15 MS-DRGs also better distinguish between surgical versus medical conditions. We re-ran our main model using indicators for CCSR to control for diagnostic mix, but further adjusted for severity using the DRG weight for the primary diagnosis and Modified Early Warning Score (MEWS) as continuous covariates. MEWS is a physiologic scoring system that incorporates abnormal vital signs and data related to mental status during the first 24 hours of a patient’s hospitalization into a risk-based score that has been shown to predict hospital mortality and need for intensive care.16,17 These sensitivity analyses were performed on a subset of inpatient admissions because DRG data are not available for hospitalizations billed as an observation stay, and only approximately 70% of hospitals in the sample contributed vital sign data to the Providence data warehouse. All statistical analyses were conducted with R, version 3.6.3 (R Foundation for Statistical Computing) and SAS Enterprise Guide 7.1 (SAS Institute Inc).
RESULTS
The characteristics of our sample are described in Table 1. A total of 61,300, 159,430, and 65,923 hospitalizations occurred in each of the three pandemic periods, respectively, compared with 503,190 hospitalizations in the pre-pandemic period. The mean (SD) age of patients in the study was 63.2 (19.4) years; most were women (52.4%), White (70.6%), and had Medicare as their primary payor (53.7%). Less than half (42.7%) of hospitalizations occurred in California, and just under one-quarter were observation stays (23.2%). Patient characteristics were similar in the pre-COVID-19 and COVID-19 pandemic periods.

Figure 1 shows trends in hospital volume and mortality. Overall daily hospitalizations declined abruptly from a mean of 1176 per day in the pre-pandemic period to 617 per day (47.5% relative decrease) during the first 3 weeks of Period 1. Mean daily hospitalizations began to rise over the next 2 months (Period 1), reaching steady state at <1000 hospitalizations per day (15% relative decrease from baseline) during Period 2. During Period 3, we observed a decline in mean daily hospitalizations, with a low point of 882 per day on December 31, 2020 (25% relative decrease from baseline), corresponding to the end of our study period. Although hospital volumes declined during both COVID-19 surge periods, the percentage of patients who died during their hospitalization increased. There was an initial spike in in-hospital mortality that peaked approximately 1 month into the pandemic (middle of Period 1), a return to levels at or slightly below that before the pandemic by the beginning of Period 2, and then a rise throughout the autumn COVID-19 surge in Period 3, not yet peaking by the end of the study.

Adjusted in-hospital mortality for the three COVID-19 periods compared with the pre-pandemic period is presented in Table 2. The percentage of patients who died during their hospitalization rose from 2.9% in the pre-pandemic period to 3.4% during Period 1 (absolute difference, 0.6 percentage points; 95% CI, 0.5-0.7), corresponding to a 19.3% relative increase during the spring COVID-19 surge. Among the subset of patients hospitalized with 1 of the 30 conditions selected for individual analysis, mortality increased from 5.0% to 5.9% during the same time period (absolute difference, 0.9 percentage points; 95% CI, 0.8-1.1), corresponding to an 18.9% relative increase. In Period 2, in-hospital mortality was similar to that noted pre-pandemic for the overall cohort and the 30 selected conditions. During Period 3, in-hospital mortality increased by a magnitude similar to that observed in Period 1 for all hospitalizations combined (absolute difference, 0.5 percentage points; 95% CI, 0.0-0.6; corresponding to a 16.5% relative increase) as well as the subgroup with 1 of the 30 selected conditions (0.9 percentage points; 95% CI, 0.8-1.0; corresponding to an 18% relative increase). Further adjustment for severity by swapping CCSR categories with MS-DRG indicators or inclusion of DRG weight and MEWS score as covariates in our sensitivity analyses did not change our results.

Table 3 and the Appendix Figure describe changes in volume and adjusted in-hospital mortality for the 30 conditions selected for analysis. There was a decrease in the mean daily admissions for all conditions studied. Among the 30 conditions, 26 showed increased mortality during Period 1, although the increase was only statistically significant for 16 of these conditions. Among the 10 most commonly admitted conditions (by number of daily hospital admissions during the baseline period), there was a statistically significant relative increase in mortality for patients with sepsis (20.1%), heart failure (17.6%), ischemic stroke (12.5%), device/graft/surgical complications (14.0%), cardiac dysrhythmias (14.4%), pneumonia (24.5%), respiratory failure (16.1%), and gastrointestinal hemorrhage (23.3%). In general, mortality returned to baseline or improved during Period 2. Thereafter, all 30 conditions showed increased mortality in Period 3. This increase was significant for only 16 conditions, which were not the same ones noted during Period 1. Of note, although there was higher mortality for some cardiovascular conditions (heart failure cardiac dysrhythmias), mortality for myocardial infarction remained unchanged from baseline across all 3 periods. In contrast, several solid cancer–related conditions showed progressively worsening mortality throughout the study, with 7.7% higher mortality in Period 1, 10.3% higher mortality in Period 2, and 16.5% higher mortality in Period 3, respectively, compared with baseline. Although a similar pattern was observed for acute renal failure and some neurologic conditions (traumatic brain injury, seizure, other nervous system disorders), mortality for drug poisonings and gastrointestinal bleeds improved over time.

DISCUSSION
In this study of unplanned hospitalizations from 51 community hospitals across 6 states in the US West, we found a significant increase in mortality—at a rate of approximately 5 to 6 excess deaths per 1000 hospitalizations—among patients admitted during the pandemic with a variety of non-COVID-19 illnesses and injuries. Higher in-hospital mortality was observed in the spring (March to May) and fall (October to December) of 2020 when COVID-19 case counts surged and shelter-in-place mandates were implemented. With the initial surge, higher mortality rates were largely transient, and, for most conditions evaluated, returned to baseline approximately 3 months after the pandemic onset. For the fall surge, mortality rates had not peaked by the end of the study period. Changes in mortality were closely and inversely correlated with hospital volume for non-COVID-19 illnesses during both surge periods.
Higher morbidity and mortality for patients without COVID-19 appears to be an unfortunate spillover effect that has been reported in several studies. Recent work examining national surveillance data suggest that up to one-third of excess deaths (deaths higher than those expected for season) early in the pandemic have occurred among patients without known COVID-19.13,18-20 Specifically, these studies estimate that mortality rates in the United States increased by 15% to 19% in the spring of 2020; of the identified excess deaths, only 38% to 77% could be attributed to COVID-19, with the remainder attributed to cardiovascular disease, diabetes, and Alzheimer’s disease, among others. In addition, reports from several European countries and China examining population death data have found similar trends,21-25 as well as a recent study examining excess deaths in nursing homes.26 Our results are largely consistent with these earlier studies in that we describe higher mortality in a sample of patients hospitalized with a variety of common conditions that otherwise are routinely treated in US hospitals. Reporting these indirect casualties of COVID-19 is important to fully understand the pandemic’s toll on patients and healthcare systems.
Our work builds on the current body of literature, highlighting the consistent relationship between rising COVID-19 case counts, hospital volume, and excess mortality over more than one surge period. Although several studies have looked at trends in hospital admissions or population mortality rates, few have examined the two outcomes together. The close correlation between daily hospital admissions and in-hospital mortality in this study suggests that the pandemic changed how patients use healthcare resources in ways that were important for their health and outcomes. The higher mortality rate that we and others have observed likely is related to patients’ delaying care because of fear of contracting COVID-19. In one survey, more than 4 in 10 adults in the United States reported that they avoided medical care during the early pandemic.10 Importantly, even a few days delay for many conditions, such as heart failure or sepsis, can result in precipitous declines in clinical status and outcomes.
It also is possible that we found increased rates of in-hospital mortality simply because patients with more moderate illness chose to stay home, resulting in a patient population enriched with those more likely to die. We found mixed evidence in our data that the observed increases in mortality could be attributable to a smaller, sicker population. Some characteristics that might be protective, such as a slightly younger mean age and lower mean DRG weight, were more common among those hospitalized during the pandemic. However, other characteristics, such as a slightly higher MEWS score and a greater percentage of total hospitalizations in the higher mortality subgroup, also were noted during the pandemic (Table 1). We do note, however, that the differences in these severity-related characteristics were small across the study periods. Further adjusting for these characteristics in our sensitivity analyses did not appreciably change our main findings, suggesting that the mortality increase could not be explained by changes in case-mix alone.
Other factors not dependent on patient behavior, such as barriers to accessing timely ambulatory care and impacts in the quality of care delivered, might have contributed. Shelter-in-place orders, reduced in-person access to clinicians in the ambulatory setting, slow implementation of telehealth services (with uncertainty about their equivalence to in-person exams), as well as delays in diagnostic tests and outpatient procedures could have played a role, especially during early months of the pandemic.27 Significant changes to ambulatory health care delivery might have left many patients with chronic illnesses or complex medical needs with limited care options. Importantly, these care interruptions might have had greater implications for some patients, such as those with cancer who rely on intensive, largely outpatient-based treatment.28,29 This, in part, could explain why we found persistently increased mortality among patients hospitalized with cancer after the spring surge. Later into the pandemic, however, most health systems had developed processes that allowed clinicians to resume timely care of ambulatory patients. Because of this, increases in mortality observed during the fall surge likely stem from other factors, such as patient behavior.
It is possible that care delays or changes in the quality of care delivered during the index hospitalization or pre-hospital setting might have contributed to the observed increase in mortality. This is particularly true for acute, time-sensitive conditions such as sepsis and stroke. Extra time spent donning personal protective equipment and/or new protocols instituted during the pandemic likely impacted the speed of emergency medical services transport, timeliness of ED evaluation, and delivery of definitive therapy. Although most hospitals in this study were not overwhelmed by the pandemic, the complexities associated with caring for known and suspected COVID-19 patients alongside those without the disease might have altered ideal care practices and strained healthcare teams.30 In addition, nearly all hospitalized patients during this period were deprived of in-person advocacy by family members, who were not permitted to visit.
Important limitations with this study exist. First, the data come only from hospitals in the western United States. Second, some data elements such as triage scores or vital signs were not available for the entire population, potentially limiting some risk-adjustment. Third, we were unable to determine the root cause of excess mortality based on our study design and the coded variables available. It is unknown to what extent undiagnosed COVID-19 played a role. Early in the pandemic, many community hospitals did not have access to timely COVID-19 testing, and some cases might have not been diagnosed.31 However, we do not expect this to be a significant concern in the later months of the pandemic, as testing became more widespread and hospitals implemented surveillance screening for COVID-19 for inpatients.
CONCLUSIONS
Our study indicates that the COVID-19 pandemic was associated with increased mortality among patients hospitalized for a range of clinical conditions. Although higher observed mortality rates were limited to periods of high COVID-19 activity, future studies will need to tease out the extent to which these findings relate to patient factors (ie, delayed presentation and more severe disease) or systemic factors (reduction in access or changes in quality of care). This is of key importance, and appropriate solutions will need to be developed to mitigate adverse impacts with this and future pandemics.
1. Baum A, Schwartz MD. Admissions to Veterans Affairs hospitals for emergency conditions during the COVID-19 pandemic. JAMA. 2020;324(1):96-99. https://doi.org/10.1001/jama.2020.9972
2. Hartnett KP, Kite-Powell A, DeVies J, et al; National Syndromic Surveillance Program Community of Practice. Impact of the COVID-19 pandemic on emergency department visits — United States, January 1, 2019–May 30, 2020. MMWR Morb Mortal Wkly Rep. 2020;69(23):699-704. https://doi.org/10.15585/mmwr.mm6923e1
3. Birkmeyer JD, Barnato A, Birkmeyer N, Bessler R, Skinner J. The impact of the COVID-19 pandemic on hospital admissions in the United States. Health Aff. 2020;39(11):2010-2017. https://doi.org/10.1377/hlthaff.2020.00980
4. Blecker S, Jones SA, Petrilli CM, et al. Hospitalizations for chronic disease and acute conditions in the time of COVID-19. JAMA Intern Med. 2021;181(2):269-271. https://doi.org/10.1001/jamainternmed.2020.3978
5. Bhambhvani HP, Rodrigues AJ, Yu JS, Carr JB 2nd, Hayden Gephart M. Hospital volumes of 5 medical emergencies in the COVID-19 pandemic in 2 US medical centers. JAMA Intern Med. 2021;181(2):272-274. https://doi.org/10.1001/jamainternmed.2020.3982
6. Lange SJ, Ritchey MD, Goodman AB, et al. Potential indirect effects of the COVID-19 pandemic on use of emergency departments for acute life-threatening conditions — United States, January–May 2020. MMWR Morb Mortal Wkly Rep. 2020;69(25);795-800. https://doi.org/10.15585/mmwr.mm6925e2
7. Solomon MD, McNulty EJ, Rana JS, et al. The Covid-19 pandemic and the incidence of acute myocardial infarction. N Engl J Med. 2020;383(7):691-693. https://doi.org/10.1056/NEJMc2015630
8. Kansagra AP, Goyal MS, Hamilton S, Albers GW. Collateral effect of Covid-19 on stroke evaluation in the United States. N Engl J Med. 2020;383(4):400-401. https://doi.org/10.1056/NEJMc2014816
9. Heist T, Schwartz K, Butler S. Trends in overall and non-COVID-19 hospital admissions. Kaiser Family Foundation. Accessed March 18, 2021. https://www.kff.org/health-costs/issue-brief/trends-in-overall-and-non-covid-19-hospital-admissions
10. Czeisler MÉ, Marynak K, Clarke KEN, et al. Delay or avoidance of medical care because of COVID-19–related concerns — United States, June 2020. MMWR Morb Mortal Wkly Rep. 2020;69(36);1250-1257. https://doi.org/10.15585/mmwr.mm6936a4
11. Chen J, McGeorge R. Spillover effects of the COVID-19 pandemic could drive long-term health consequences for non-COVID-19 patients. Health Affairs Blog. Accessed March 18, 2021. https://www.healthaffairs.org/do/10.1377/hblog20201020.566558/full/
12. Wong LE, Hawkins JE, Langness S, Murrell KL, Iris P, Sammann A. Where are all the patients? Addressing Covid-19 fear to encourage sick patients to seek emergency care. NEJM Catalyst. Accessed March 18, 2021. https://catalyst.nejm.org/doi/abs/10.1056/CAT.20.0193
13. Woolf SH, Chapman DA, Sabo RT, Weinberger DM, Hill L. Excess deaths from COVID-19 and other causes, March-April 2020. JAMA. 2020;324(5):510-513. https://doi.org/10.1001/jama.2020.11787
14. Clinical Classifications Software Refined (CCSR) for ICD-10-CM Diagnoses. Agency for Healthcare Research and Quality, Rockville, MD. Accessed April 22, 2021. https://www.hcup-us.ahrq.gov/toolssoftware/ccsr/dxccsr.jsp
15. MS-DRG Classifications and Software. Centers for Medicare & Medicaid Services. Accessed March 18, 2021. https://www.cms.gov/Medicare/Medicare-Fee-for-Service-Payment/AcuteInpatientPPS/MS-DRG-Classifications-and-Software
16. Jayasundera R, Neilly M, Smith TO, Myint PK. Are early warning scores useful predictors for mortality and morbidity in hospitalised acutely unwell older patients? A systematic review. J Clin Med. 2018;7(10):309. https://doi.org/10.3390/jcm7100309
17. Delgado-Hurtado JJ, Berger A, Bansal AB. Emergency department Modified Early Warning Score association with admission, admission disposition, mortality, and length of stay. J Community Hosp Intern Med Perspect. 2016;6(2):31456. https://doi.org/10.3402/jchimp.v6.31456
18. Woolf SH, Chapman DA, Sabo RT, Weinberger DM, Hill L, Taylor DDH. Excess deaths from COVID-19 and other causes, March-July 2020. JAMA. 2020;324(15):1562-1564. https://doi.org/10.1001/jama.2020.19545
19. Faust JS, Krumholz HM, Du C, et al. All-cause excess mortality and COVID-19–related mortality among US adults aged 25-44 years, March-July 2020. JAMA. 2021;325(8):785-787. https://doi.org/10.1001/jama.2020.24243
20. Weinberger DM, Chen J, Cohen T, et al. Estimation of excess deaths associated with the COVID-19 pandemic in the United States, March to May 2020. JAMA Intern Med. 2020;180(10):1336-1344. https://doi.org/10.1001/jamainternmed.2020.3391
21. Vandoros S. Excess mortality during the Covid-19 pandemic: Early evidence from England and Wales. Soc Sci Med. 2020; 258:113101. https://doi.org/10.1016/j.socscimed.2020.113101
22. Vestergaard LS, Nielsen J, Richter L, et al; ECDC Public Health Emergency Team for COVID-19. Excess all-cause mortality during the COVID-19 pandemic in Europe – preliminary pooled estimates from the EuroMOMO network, March to April 2020. Euro Surveill. 2020;25(26):2001214. https://doi.org/10.2807/1560-7917.ES.2020.25.26.2001214
23. Kontopantelis E, Mamas MA, Deanfield J, Asaria M, Doran T. Excess mortality in England and Wales during the first wave of the COVID-19 pandemic. J Epidemiol Community Health. 2021;75(3):213-223. https://doi.org/10.1136/jech-2020-214764
24. Liu J, Zhang L, Yan Y, et al. Excess mortality in Wuhan city and other parts of China during the three months of the covid-19 outbreak: findings from nationwide mortality registries. BMJ. 2021;372:n415. https://doi.org/10.1136/bmj.n415
25. Docherty KF, Butt JH, de Boer RA, et al. Excess deaths during the Covid-19 pandemic: An international comparison. Preprint. Posted online May 13, 2020. medRxiv. doi:https://doi.org/10.1101/2020.04.21.20073114
26. Barnett ML, Hu L, Martin T, Grabowski DC. Mortality, admissions, and patient census at SNFs in 3 US cities during the COVID-19 pandemic. JAMA. 2020;324(5):507-509. https://doi.org/10.1001/jama.2020.11642
27. Rosenbaum L. The untold toll — The pandemic’s effects on patients without Covid-19. N Engl J Med. 2020; 382:2368-2371 https://doi.org/10.1056/NEJMms2009984
28. Lai AG, Pasea L, Banerjee A, et al. Estimated impact of the COVID-19 pandemic on cancer services and excess 1-year mortality in people with cancer and multimorbidity: near real-time data on cancer care, cancer deaths and a population-based cohort study. BMJ Open. 2020;10(11):e043828. https://doi.org/10.1136/bmjopen-2020-043828
29. Van de Haar J, Hoes LR, Coles CE, et al. Caring for patients with cancer in the COVID-19 era. Nat Med. 2020;26(5):665-671. https://doi.org/10.1038/s41591-020-0874-8
30. Traylor AM, Tannenbaum SI, Thomas EJ, Salas E. Helping healthcare teams save lives during COVID-19: insights and countermeasures from team science. Am Psychol. 2020;76(1):1-13. https://doi.org/10.1037/amp0000750
31. Grimm CA. Hospital experiences responding to the COVID-19 pandemic: results of a National Pulse Survey March 23–27. U.S. Department of Health and Human Services Office of Inspector General; 2020. https://oig.hhs.gov/oei/reports/oei-06-20-00300.pdf
One of the most striking features of the early COVID-19 pandemic was the sudden and sharp reductions in emergency department (ED) visits and hospitalizations throughout the United States.1-4 Several studies have documented lower rates of hospitalization for many emergent, time-sensitive conditions, such as acute myocardial infarction, stroke, and hyperglycemic crises, starting shortly after community transmission of COVID-19 was recognized and social distancing guidelines were implemented.5-8 In most cases, hospital volumes rebounded after an initial drop, stabilizing at somewhat lower levels than those expected from historic trends.9
The observed shifts in hospital use largely have been attributed to patients’ forgoing or delaying necessary care,10 which underscores the indirect effects of the pandemic on patients without COVID-19.11 To date, the extent to which outcomes for patients without COVID-19 have been adversely affected is less well understood. Evidence suggests patients with acute and chronic illnesses have experienced increased morbidity and mortality since the onset of the pandemic. For example, in northern California, abrupt declines in ED visits for cardiac symptoms were coupled with higher rates of out-of-hospital cardiac arrest.12 Moreover, states with higher rates of COVID-19 also reported increased deaths attributed to heart disease, diabetes, and other conditions.13
To better understand these potential indirect effects, this study used data from a large, multistate health care system to examine changes in hospital volume and its relationship to in-hospital mortality for patients without COVID-19 during the first 10 months of the pandemic.
METHODS
Setting and Participants
We examined unplanned hospitalizations from January 2019 to December 2020 at 51 community hospitals across 6 states (Alaska, Washington, Montana, Oregon, California, and Texas) in the Providence St. Joseph Health system. Hospitals within the Providence system share a common standard dataset for each encounter with a centralized cloud data warehouse from which we extracted clinical and demographic data. No hospitals entered or left the system during the study period. Hospitalizations were considered unplanned if they had an “urgent” or “emergency” service type in the record; most originated in the ED. Hospitalizations for children younger than 18 years and those with evidence of COVID-19 (International Classification of Disease, Tenth Revision, Clinical Modification U07.1, a positive COVID-19 polymerase chain reaction test during the encounter, or an infection control-assigned label of COVID-19) were excluded. The Providence St. Joseph Health Institutional Review Board approved this study.
Measures
Trends in daily hospitalizations and their relationship to adjusted in-hospital mortality (percentage of patients who died during their hospital admission) were examined over time. In preliminary models using segmented regression, we identified three distinct pandemic periods with different trends in daily hospitalizations: (1) a 10-week period corresponding to the spring COVID-19 surge (March 4 to May 13, 2020; Period 1), (2) an intervening period extending over the summer and early fall (May 14 to October 19, 2020; Period 2), and (3) a second 10-week period corresponding to the fall COVID-19 surge (October 20 to December 31, 2020; Period 3). In-hospital mortality for these periods was compared with a baseline period (pre-COVID-19) from January 1, 2019 to March 3, 2020. To further assess differences in mortality by clinical condition, hospitalizations were first grouped by primary diagnosis using Clinical Classifications Software Refined (CCSR) categories from the Agency for Healthcare Research and Quality14 and ranked by the number of observed deaths and the percentage of patients who died while hospitalized in 2020. We selected common conditions that had >35 total deaths and an in-hospital mortality rate ≥1% for condition-specific analyses, of which 30 met these criteria.
Analysis
Multivariate logistic regression was used to evaluate changes in mortality for each of the pandemic periods compared with baseline for the overall cohort and selected diagnosis groups. Our main model adjusted for age, sex, race/ethnicity (White, Black, Latinx, Asian or Pacific Islander, and other), primary payor (commercial, Medicaid, Medicare, other, and self-pay), the presence or absence of 31 chronic comorbidities in the medical record, primary admitting diagnosis grouped by CCSR category (456 total diagnostic groups), and hospital fixed-effects to account for clustering. Results are expressed as the average marginal effects of each pandemic period on in-hospital mortality (eg, adjusted percentage point change in mortality over baseline). The number of excess deaths in each period was calculated by multiplying the estimated percentage point change in mortality for each period by the total number of hospitalizations. These excess deaths were subtracted from the number of observed deaths to derive the number of deaths that would be expected if pre-pandemic mortality rates persisted.
To further assess whether changes in adjusted mortality could be attributed to a smaller, sicker population of patients presenting to the hospital during the pandemic (meaning that less acutely ill patients stayed home), we conducted two sensitivity analyses. First, we tested whether substituting indicators for Medicare Severity Diagnosis Groups (MS-DRG) in lieu of CCSR categories had any impact on our results. MS-DRGs are designed to account for a patient’s illness severity and expected costs, whereas CCSR categories do not.15 MS-DRGs also better distinguish between surgical versus medical conditions. We re-ran our main model using indicators for CCSR to control for diagnostic mix, but further adjusted for severity using the DRG weight for the primary diagnosis and Modified Early Warning Score (MEWS) as continuous covariates. MEWS is a physiologic scoring system that incorporates abnormal vital signs and data related to mental status during the first 24 hours of a patient’s hospitalization into a risk-based score that has been shown to predict hospital mortality and need for intensive care.16,17 These sensitivity analyses were performed on a subset of inpatient admissions because DRG data are not available for hospitalizations billed as an observation stay, and only approximately 70% of hospitals in the sample contributed vital sign data to the Providence data warehouse. All statistical analyses were conducted with R, version 3.6.3 (R Foundation for Statistical Computing) and SAS Enterprise Guide 7.1 (SAS Institute Inc).
RESULTS
The characteristics of our sample are described in Table 1. A total of 61,300, 159,430, and 65,923 hospitalizations occurred in each of the three pandemic periods, respectively, compared with 503,190 hospitalizations in the pre-pandemic period. The mean (SD) age of patients in the study was 63.2 (19.4) years; most were women (52.4%), White (70.6%), and had Medicare as their primary payor (53.7%). Less than half (42.7%) of hospitalizations occurred in California, and just under one-quarter were observation stays (23.2%). Patient characteristics were similar in the pre-COVID-19 and COVID-19 pandemic periods.
Figure 1 shows trends in hospital volume and mortality. Overall daily hospitalizations declined abruptly from a mean of 1176 per day in the pre-pandemic period to 617 per day (47.5% relative decrease) during the first 3 weeks of Period 1. Mean daily hospitalizations began to rise over the next 2 months (Period 1), reaching steady state at <1000 hospitalizations per day (15% relative decrease from baseline) during Period 2. During Period 3, we observed a decline in mean daily hospitalizations, with a low point of 882 per day on December 31, 2020 (25% relative decrease from baseline), corresponding to the end of our study period. Although hospital volumes declined during both COVID-19 surge periods, the percentage of patients who died during their hospitalization increased. There was an initial spike in in-hospital mortality that peaked approximately 1 month into the pandemic (middle of Period 1), a return to levels at or slightly below that before the pandemic by the beginning of Period 2, and then a rise throughout the autumn COVID-19 surge in Period 3, not yet peaking by the end of the study.
Adjusted in-hospital mortality for the three COVID-19 periods compared with the pre-pandemic period is presented in Table 2. The percentage of patients who died during their hospitalization rose from 2.9% in the pre-pandemic period to 3.4% during Period 1 (absolute difference, 0.6 percentage points; 95% CI, 0.5-0.7), corresponding to a 19.3% relative increase during the spring COVID-19 surge. Among the subset of patients hospitalized with 1 of the 30 conditions selected for individual analysis, mortality increased from 5.0% to 5.9% during the same time period (absolute difference, 0.9 percentage points; 95% CI, 0.8-1.1), corresponding to an 18.9% relative increase. In Period 2, in-hospital mortality was similar to that noted pre-pandemic for the overall cohort and the 30 selected conditions. During Period 3, in-hospital mortality increased by a magnitude similar to that observed in Period 1 for all hospitalizations combined (absolute difference, 0.5 percentage points; 95% CI, 0.0-0.6; corresponding to a 16.5% relative increase) as well as the subgroup with 1 of the 30 selected conditions (0.9 percentage points; 95% CI, 0.8-1.0; corresponding to an 18% relative increase). Further adjustment for severity by swapping CCSR categories with MS-DRG indicators or inclusion of DRG weight and MEWS score as covariates in our sensitivity analyses did not change our results.
Table 3 and the Appendix Figure describe changes in volume and adjusted in-hospital mortality for the 30 conditions selected for analysis. There was a decrease in the mean daily admissions for all conditions studied. Among the 30 conditions, 26 showed increased mortality during Period 1, although the increase was only statistically significant for 16 of these conditions. Among the 10 most commonly admitted conditions (by number of daily hospital admissions during the baseline period), there was a statistically significant relative increase in mortality for patients with sepsis (20.1%), heart failure (17.6%), ischemic stroke (12.5%), device/graft/surgical complications (14.0%), cardiac dysrhythmias (14.4%), pneumonia (24.5%), respiratory failure (16.1%), and gastrointestinal hemorrhage (23.3%). In general, mortality returned to baseline or improved during Period 2. Thereafter, all 30 conditions showed increased mortality in Period 3. This increase was significant for only 16 conditions, which were not the same ones noted during Period 1. Of note, although there was higher mortality for some cardiovascular conditions (heart failure cardiac dysrhythmias), mortality for myocardial infarction remained unchanged from baseline across all 3 periods. In contrast, several solid cancer–related conditions showed progressively worsening mortality throughout the study, with 7.7% higher mortality in Period 1, 10.3% higher mortality in Period 2, and 16.5% higher mortality in Period 3, respectively, compared with baseline. Although a similar pattern was observed for acute renal failure and some neurologic conditions (traumatic brain injury, seizure, other nervous system disorders), mortality for drug poisonings and gastrointestinal bleeds improved over time.
DISCUSSION
In this study of unplanned hospitalizations from 51 community hospitals across 6 states in the US West, we found a significant increase in mortality—at a rate of approximately 5 to 6 excess deaths per 1000 hospitalizations—among patients admitted during the pandemic with a variety of non-COVID-19 illnesses and injuries. Higher in-hospital mortality was observed in the spring (March to May) and fall (October to December) of 2020 when COVID-19 case counts surged and shelter-in-place mandates were implemented. With the initial surge, higher mortality rates were largely transient, and, for most conditions evaluated, returned to baseline approximately 3 months after the pandemic onset. For the fall surge, mortality rates had not peaked by the end of the study period. Changes in mortality were closely and inversely correlated with hospital volume for non-COVID-19 illnesses during both surge periods.
Higher morbidity and mortality for patients without COVID-19 appears to be an unfortunate spillover effect that has been reported in several studies. Recent work examining national surveillance data suggest that up to one-third of excess deaths (deaths higher than those expected for season) early in the pandemic have occurred among patients without known COVID-19.13,18-20 Specifically, these studies estimate that mortality rates in the United States increased by 15% to 19% in the spring of 2020; of the identified excess deaths, only 38% to 77% could be attributed to COVID-19, with the remainder attributed to cardiovascular disease, diabetes, and Alzheimer’s disease, among others. In addition, reports from several European countries and China examining population death data have found similar trends,21-25 as well as a recent study examining excess deaths in nursing homes.26 Our results are largely consistent with these earlier studies in that we describe higher mortality in a sample of patients hospitalized with a variety of common conditions that otherwise are routinely treated in US hospitals. Reporting these indirect casualties of COVID-19 is important to fully understand the pandemic’s toll on patients and healthcare systems.
Our work builds on the current body of literature, highlighting the consistent relationship between rising COVID-19 case counts, hospital volume, and excess mortality over more than one surge period. Although several studies have looked at trends in hospital admissions or population mortality rates, few have examined the two outcomes together. The close correlation between daily hospital admissions and in-hospital mortality in this study suggests that the pandemic changed how patients use healthcare resources in ways that were important for their health and outcomes. The higher mortality rate that we and others have observed likely is related to patients’ delaying care because of fear of contracting COVID-19. In one survey, more than 4 in 10 adults in the United States reported that they avoided medical care during the early pandemic.10 Importantly, even a few days delay for many conditions, such as heart failure or sepsis, can result in precipitous declines in clinical status and outcomes.
It also is possible that we found increased rates of in-hospital mortality simply because patients with more moderate illness chose to stay home, resulting in a patient population enriched with those more likely to die. We found mixed evidence in our data that the observed increases in mortality could be attributable to a smaller, sicker population. Some characteristics that might be protective, such as a slightly younger mean age and lower mean DRG weight, were more common among those hospitalized during the pandemic. However, other characteristics, such as a slightly higher MEWS score and a greater percentage of total hospitalizations in the higher mortality subgroup, also were noted during the pandemic (Table 1). We do note, however, that the differences in these severity-related characteristics were small across the study periods. Further adjusting for these characteristics in our sensitivity analyses did not appreciably change our main findings, suggesting that the mortality increase could not be explained by changes in case-mix alone.
Other factors not dependent on patient behavior, such as barriers to accessing timely ambulatory care and impacts in the quality of care delivered, might have contributed. Shelter-in-place orders, reduced in-person access to clinicians in the ambulatory setting, slow implementation of telehealth services (with uncertainty about their equivalence to in-person exams), as well as delays in diagnostic tests and outpatient procedures could have played a role, especially during early months of the pandemic.27 Significant changes to ambulatory health care delivery might have left many patients with chronic illnesses or complex medical needs with limited care options. Importantly, these care interruptions might have had greater implications for some patients, such as those with cancer who rely on intensive, largely outpatient-based treatment.28,29 This, in part, could explain why we found persistently increased mortality among patients hospitalized with cancer after the spring surge. Later into the pandemic, however, most health systems had developed processes that allowed clinicians to resume timely care of ambulatory patients. Because of this, increases in mortality observed during the fall surge likely stem from other factors, such as patient behavior.
It is possible that care delays or changes in the quality of care delivered during the index hospitalization or pre-hospital setting might have contributed to the observed increase in mortality. This is particularly true for acute, time-sensitive conditions such as sepsis and stroke. Extra time spent donning personal protective equipment and/or new protocols instituted during the pandemic likely impacted the speed of emergency medical services transport, timeliness of ED evaluation, and delivery of definitive therapy. Although most hospitals in this study were not overwhelmed by the pandemic, the complexities associated with caring for known and suspected COVID-19 patients alongside those without the disease might have altered ideal care practices and strained healthcare teams.30 In addition, nearly all hospitalized patients during this period were deprived of in-person advocacy by family members, who were not permitted to visit.
Important limitations with this study exist. First, the data come only from hospitals in the western United States. Second, some data elements such as triage scores or vital signs were not available for the entire population, potentially limiting some risk-adjustment. Third, we were unable to determine the root cause of excess mortality based on our study design and the coded variables available. It is unknown to what extent undiagnosed COVID-19 played a role. Early in the pandemic, many community hospitals did not have access to timely COVID-19 testing, and some cases might have not been diagnosed.31 However, we do not expect this to be a significant concern in the later months of the pandemic, as testing became more widespread and hospitals implemented surveillance screening for COVID-19 for inpatients.
CONCLUSIONS
Our study indicates that the COVID-19 pandemic was associated with increased mortality among patients hospitalized for a range of clinical conditions. Although higher observed mortality rates were limited to periods of high COVID-19 activity, future studies will need to tease out the extent to which these findings relate to patient factors (ie, delayed presentation and more severe disease) or systemic factors (reduction in access or changes in quality of care). This is of key importance, and appropriate solutions will need to be developed to mitigate adverse impacts with this and future pandemics.
1. Baum A, Schwartz MD. Admissions to Veterans Affairs hospitals for emergency conditions during the COVID-19 pandemic. JAMA. 2020;324(1):96-99. https://doi.org/10.1001/jama.2020.9972
2. Hartnett KP, Kite-Powell A, DeVies J, et al; National Syndromic Surveillance Program Community of Practice. Impact of the COVID-19 pandemic on emergency department visits — United States, January 1, 2019–May 30, 2020. MMWR Morb Mortal Wkly Rep. 2020;69(23):699-704. https://doi.org/10.15585/mmwr.mm6923e1
3. Birkmeyer JD, Barnato A, Birkmeyer N, Bessler R, Skinner J. The impact of the COVID-19 pandemic on hospital admissions in the United States. Health Aff. 2020;39(11):2010-2017. https://doi.org/10.1377/hlthaff.2020.00980
4. Blecker S, Jones SA, Petrilli CM, et al. Hospitalizations for chronic disease and acute conditions in the time of COVID-19. JAMA Intern Med. 2021;181(2):269-271. https://doi.org/10.1001/jamainternmed.2020.3978
5. Bhambhvani HP, Rodrigues AJ, Yu JS, Carr JB 2nd, Hayden Gephart M. Hospital volumes of 5 medical emergencies in the COVID-19 pandemic in 2 US medical centers. JAMA Intern Med. 2021;181(2):272-274. https://doi.org/10.1001/jamainternmed.2020.3982
6. Lange SJ, Ritchey MD, Goodman AB, et al. Potential indirect effects of the COVID-19 pandemic on use of emergency departments for acute life-threatening conditions — United States, January–May 2020. MMWR Morb Mortal Wkly Rep. 2020;69(25);795-800. https://doi.org/10.15585/mmwr.mm6925e2
7. Solomon MD, McNulty EJ, Rana JS, et al. The Covid-19 pandemic and the incidence of acute myocardial infarction. N Engl J Med. 2020;383(7):691-693. https://doi.org/10.1056/NEJMc2015630
8. Kansagra AP, Goyal MS, Hamilton S, Albers GW. Collateral effect of Covid-19 on stroke evaluation in the United States. N Engl J Med. 2020;383(4):400-401. https://doi.org/10.1056/NEJMc2014816
9. Heist T, Schwartz K, Butler S. Trends in overall and non-COVID-19 hospital admissions. Kaiser Family Foundation. Accessed March 18, 2021. https://www.kff.org/health-costs/issue-brief/trends-in-overall-and-non-covid-19-hospital-admissions
10. Czeisler MÉ, Marynak K, Clarke KEN, et al. Delay or avoidance of medical care because of COVID-19–related concerns — United States, June 2020. MMWR Morb Mortal Wkly Rep. 2020;69(36);1250-1257. https://doi.org/10.15585/mmwr.mm6936a4
11. Chen J, McGeorge R. Spillover effects of the COVID-19 pandemic could drive long-term health consequences for non-COVID-19 patients. Health Affairs Blog. Accessed March 18, 2021. https://www.healthaffairs.org/do/10.1377/hblog20201020.566558/full/
12. Wong LE, Hawkins JE, Langness S, Murrell KL, Iris P, Sammann A. Where are all the patients? Addressing Covid-19 fear to encourage sick patients to seek emergency care. NEJM Catalyst. Accessed March 18, 2021. https://catalyst.nejm.org/doi/abs/10.1056/CAT.20.0193
13. Woolf SH, Chapman DA, Sabo RT, Weinberger DM, Hill L. Excess deaths from COVID-19 and other causes, March-April 2020. JAMA. 2020;324(5):510-513. https://doi.org/10.1001/jama.2020.11787
14. Clinical Classifications Software Refined (CCSR) for ICD-10-CM Diagnoses. Agency for Healthcare Research and Quality, Rockville, MD. Accessed April 22, 2021. https://www.hcup-us.ahrq.gov/toolssoftware/ccsr/dxccsr.jsp
15. MS-DRG Classifications and Software. Centers for Medicare & Medicaid Services. Accessed March 18, 2021. https://www.cms.gov/Medicare/Medicare-Fee-for-Service-Payment/AcuteInpatientPPS/MS-DRG-Classifications-and-Software
16. Jayasundera R, Neilly M, Smith TO, Myint PK. Are early warning scores useful predictors for mortality and morbidity in hospitalised acutely unwell older patients? A systematic review. J Clin Med. 2018;7(10):309. https://doi.org/10.3390/jcm7100309
17. Delgado-Hurtado JJ, Berger A, Bansal AB. Emergency department Modified Early Warning Score association with admission, admission disposition, mortality, and length of stay. J Community Hosp Intern Med Perspect. 2016;6(2):31456. https://doi.org/10.3402/jchimp.v6.31456
18. Woolf SH, Chapman DA, Sabo RT, Weinberger DM, Hill L, Taylor DDH. Excess deaths from COVID-19 and other causes, March-July 2020. JAMA. 2020;324(15):1562-1564. https://doi.org/10.1001/jama.2020.19545
19. Faust JS, Krumholz HM, Du C, et al. All-cause excess mortality and COVID-19–related mortality among US adults aged 25-44 years, March-July 2020. JAMA. 2021;325(8):785-787. https://doi.org/10.1001/jama.2020.24243
20. Weinberger DM, Chen J, Cohen T, et al. Estimation of excess deaths associated with the COVID-19 pandemic in the United States, March to May 2020. JAMA Intern Med. 2020;180(10):1336-1344. https://doi.org/10.1001/jamainternmed.2020.3391
21. Vandoros S. Excess mortality during the Covid-19 pandemic: Early evidence from England and Wales. Soc Sci Med. 2020; 258:113101. https://doi.org/10.1016/j.socscimed.2020.113101
22. Vestergaard LS, Nielsen J, Richter L, et al; ECDC Public Health Emergency Team for COVID-19. Excess all-cause mortality during the COVID-19 pandemic in Europe – preliminary pooled estimates from the EuroMOMO network, March to April 2020. Euro Surveill. 2020;25(26):2001214. https://doi.org/10.2807/1560-7917.ES.2020.25.26.2001214
23. Kontopantelis E, Mamas MA, Deanfield J, Asaria M, Doran T. Excess mortality in England and Wales during the first wave of the COVID-19 pandemic. J Epidemiol Community Health. 2021;75(3):213-223. https://doi.org/10.1136/jech-2020-214764
24. Liu J, Zhang L, Yan Y, et al. Excess mortality in Wuhan city and other parts of China during the three months of the covid-19 outbreak: findings from nationwide mortality registries. BMJ. 2021;372:n415. https://doi.org/10.1136/bmj.n415
25. Docherty KF, Butt JH, de Boer RA, et al. Excess deaths during the Covid-19 pandemic: An international comparison. Preprint. Posted online May 13, 2020. medRxiv. doi:https://doi.org/10.1101/2020.04.21.20073114
26. Barnett ML, Hu L, Martin T, Grabowski DC. Mortality, admissions, and patient census at SNFs in 3 US cities during the COVID-19 pandemic. JAMA. 2020;324(5):507-509. https://doi.org/10.1001/jama.2020.11642
27. Rosenbaum L. The untold toll — The pandemic’s effects on patients without Covid-19. N Engl J Med. 2020; 382:2368-2371 https://doi.org/10.1056/NEJMms2009984
28. Lai AG, Pasea L, Banerjee A, et al. Estimated impact of the COVID-19 pandemic on cancer services and excess 1-year mortality in people with cancer and multimorbidity: near real-time data on cancer care, cancer deaths and a population-based cohort study. BMJ Open. 2020;10(11):e043828. https://doi.org/10.1136/bmjopen-2020-043828
29. Van de Haar J, Hoes LR, Coles CE, et al. Caring for patients with cancer in the COVID-19 era. Nat Med. 2020;26(5):665-671. https://doi.org/10.1038/s41591-020-0874-8
30. Traylor AM, Tannenbaum SI, Thomas EJ, Salas E. Helping healthcare teams save lives during COVID-19: insights and countermeasures from team science. Am Psychol. 2020;76(1):1-13. https://doi.org/10.1037/amp0000750
31. Grimm CA. Hospital experiences responding to the COVID-19 pandemic: results of a National Pulse Survey March 23–27. U.S. Department of Health and Human Services Office of Inspector General; 2020. https://oig.hhs.gov/oei/reports/oei-06-20-00300.pdf
© 2021 Society of Hospital Medicine
Trends and Variation in the Use of Observation Stays at Children’s Hospitals
Payors have been refining reimbursement policies for observation and inpatient stays over the past decade, and the effects on the healthcare payment system are significant.1-4 Advocates claim that observation status could improve efficiency in the use of healthcare resources by reducing emergency department (ED) crowding and lowering costs for inpatient care.5,6 Critics consider observation status to be a cost-shifting strategy that could lead to financial burdens for patients and hospitals.7,8
Although reimbursement policies for observation stays traditionally have been set by the Centers for Medicare and Medicaid Services (CMS) in a uniform manner,4,8 state Medicaid programs and commercial health insurers have developed a variety of policies for using observation status in broader populations and hospitals.9-15 Coverage criteria and implementation timelines of these policies vary by states and commercial insurers.11-15 For example, the California Department of Health Care Services did not have a specific reimbursement rate for observation stays in 2020, while some state Medicaid programs have had reimbursement policies for observation services in place since 2010.11-15 These inconsistencies likely result in greater variation in use of observation stays across children’s hospitals than general hospitals.
Previous studies have shown rising trends in use of observation stays among adult patient populations and related implications for patients and general hospitals,16-19 but few studies have reported the trends for pediatric populations. In this study, we sought to (1) describe recent trends of observation stays for pediatric populations at children’s hospitals from 2010 through 2019 and (2) investigate features of this shifting pattern for pediatric populations and hospital-level use of observation stays.
METHODS
Study Design, Data, and Populations
We performed a retrospective analysis of the Pediatric Health Information System (PHIS), an administrative database that contains inpatient, observation, ambulatory, and ED encounter-level data from 50 not-for-profit, tertiary care children’s hospitals affiliated with the Children’s Hospital Association (CHA).20 PHIS has an indicator to classify patient types (inpatient, observation, ED visits, ambulatory surgery, clinic visit, and others). The data are de-identified at the time of submission and subjected to validity and reliability checks by CHA and Truven Health Analytics (Ann Arbor, MI) before being included in PHIS. Each encounter in PHIS has only one patient type; therefore, encounters that transition to a higher level of care are assigned to their highest level of care (eg, a patient transitions from observation to inpatient status is classified as an inpatient encounter) to avoid duplicate counting.
To ensure consistent evaluations over time, we included 29 children’s hospitals that consistently reported both inpatient and observation data to PHIS across all quarters from 2010 through 2019. We identified the 20 most common clinical conditions using the All Patients Refined Diagnosis Related Groups (APR-DRGs; 3M Corporation) based upon their total frequencies of observation and inpatient stays over the study period. Regression analyses were conducted using all encounters within the 20 most common APR-DRGs.
Because all data have been de-identified in the PHIS database, the institutional review board at Ann and Robert H. Lurie Children’s Hospital of Chicago granted this study institutional review board–exempt status.
Main Outcome and Measures
We first presented longitudinal trends of observation stays for children’s hospitals using annual percentage of observation stays defined as:

To determine whether different pediatric populations have different trends of observation stays, we measured the growth rates of observation stays for each APR-DRG. Specifically, we first calculated the percentage of observation stays by APR-DRGs and years as described, and then calculated the growth rate of observation stays for each APR-DRG:
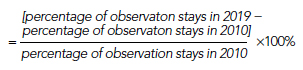
Next, we employed prolonged length of stay (LOS) and hospitalization resource-intensity scores for kids (H-RISK) to further investigate the shifting pattern of observation stays. Because most state Medicaid and commercial policies dictate that observation stays should not last longer than 48 hours, we defined prolonged LOS as >2 days.11-15 We defined the annual percentage of observation stays with prolonged LOS for each year as:
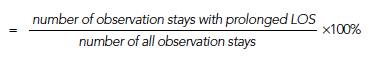
Numerators and denominators of the three measures were obtained by pooling all children’s hospitals included in this study. H-RISK is a continuous variable developed by CHA to measure use of intensive care for children, which is comparable across various APR-DRGs.21 Changes in the empirical distribution of H-RISK from observation stays were presented over years using percentiles.
Other measures included sex, age, race, payor, and LOS. To investigate the use of observation stays among payors, we categorized payors into five groups: private, in-state Medicaid (managed care), in-state Medicaid (Children’s Health Insurance Program [CHIP]/others), other government, and all others, according to the data availability. The “private” group consisted of commercial preferred provider organizations, commercial health maintenance organizations, and commercial others. We combined both CHIP and in-state Medicaid (others), including Medicaid fee-for-service or unspecified Medicaid together as “in-state Medicaid (CHIP/others).” Detailed categorization information is summarized in Appendix Table 1. LOS was classified into four groups: 1 day (24 hours), 2 days (48 hours), 3 to 4 days, and >4 days.
Statistical Analysis
Descriptive statistics were stratified by inpatient and observation status and were summarized using frequency, percent, median, and interquartile range (IQR). Chi-square or Wilcoxon rank-sum tests were performed to examine differences between observation and inpatient status. Trends in annual percentage of observation stays and annual percentage of observation stays with prolonged LOS were estimated using first-order autoregressive models, in which year was considered a continuous variable. A nonparametric measure of rank correlation (Spearman’s rank correlation coefficient) was employed to evaluate the correlation between year and H-RISK from observation stays.
The risk-adjusted probability of being admitted as an observation stay was estimated using generalized linear mixed models by adjusting for year, age, sex, race, payor, LOS, H-RISK, and a random intercept for each hospital to control for patient clustering within a hospital (Appendix Model). Hospital-level use of observation stays was measured by risk-adjusted percent use of observation stays for each hospital using the predicted values from generalized linear mixed models. All analyses were performed using SAS software, version 9.4 (SAS Institute) and R (R Core Team, 2019), and P < .05 was considered statistically significant.
RESULTS
Increasing Trend of Observation Stays
Over the study period, there were 5,611,001 encounters, including 3,901,873 (69.5%) inpatient and 1,709,128 (30.5%) observation stays (Appendix Table 1). The number of observation stays increased from 117,246 in 2010 to 207,842 in 2019, and the number of inpatient stays slightly increased from 378,433 to 397,994 over the 10 years (Appendix Table 1). Because of different growth rates between observation and inpatient status, the annual percentage of observation stays increased from 23.7% in 2010 to 34.3% in 2019, while the annual percentage of inpatient stays decreased from 76.3% in 2010 to 65.7% in 2019 (Appendix Table 1; Figure 1, P < .001).

Different Growth Rates of Observation Stays for Various Pediatric Populations
As shown in the Table, growth rates of observation stays increased for 19 of the 20 most common APR-DRGs. The four APR-DRGs having the highest growth rates in observation stays were appendectomy, diabetes mellitus, kidney and urinary tract infections, and cellulitis and other bacterial skin infections (Appendix Figure). In particular, the annual percentage of observation stays for appendectomy increased from 19.8% in 2010 to 54.7% in 2019, with the number of observation stays growing from 2,321 to 7,876, while the number of inpatient stays decreased from 9,384 to 6,535 (Appendix Figure). The annual percentage of observation stays for diabetes mellitus increased from 8.16% in 2010 to 22.74% in 2019. Tonsil and adenoid procedures consistently held the largest numbers of observation stays across the 10 years among all the APR-DRGs, with 115,207 and 31,125 total observation and inpatient stays, respectively (Table).

Characteristics of Observation and Inpatient Stays
Patient characteristics are summarized in Appendix Table 1. There were 542,344 (32.9%) observation stays among patients with in-state Medicaid (managed care), and 241,157 (27.4%) observation stays among in-state Medicaid (CHIP/others). The percentages of observation and inpatient stays were 29.8% and 70.2% for private payor, as well as 29.6% and 70.4% for other government payor. Overall, the median (IQR) of H-RISK among observation stays was 0.79 (0.57-1.19) vs 1.23 (0.72-2.43) for inpatient stays. There were 1,410,694 (82.5%) observation stays discharged within 1 day and 243,972 (14.3%) observation stays discharged within 2 days. However, there were 47,413 (2.8%) and 7,049 (0.4%) observation stays with LOS 3 to 4 days or >4 days, respectively.
Shifting Pattern in Observation Stays
The annual percentage of observation stays with prolonged LOS (>2 days) rose from 1.1% in 2010 to 4.6% in 2019 (P < .001; Figure 2). The empirical distribution of H-RISK from observation stays by years further suggests a slightly increasing trend in intensity of care under observation stays. As shown in Appendix Table 2, although the 1st, 5th, 10th, 25th, and 99th percentiles of H-RISK were relatively stable, the 50th, 75th, 90th, and 95th percentiles of H-RISK were increasing over time. The correlation between year and intensity of care used under observation stays (H-RISK from observation stays) was found to be weak but significantly positive (Spearman correlation coefficients = 0.04; P < .001).

Interaction coefficients from our regression model demonstrate that the existing inverse association between H-RISK and odds of admission as an observation stay became less negative over the years. In 2010, the adjusted odds ratio (OR) of H-RISK was 0.57 (95% CI, 0.55-0.59). By 2017, the adjusted OR had increased to 0.65 (95% CI, 0.64-0.66). Compared with 2010, the seven adjusted ORs of H-RISK at years 2012 through 2018 were observed to be higher and statistically significant (P < .001, Appendix Table 3).
Hospitals-Level Use of Observation Stays
After adjusting for all covariates and hospital random effects, hospital-level use of observation stays increased between 2010 and 2019 for 26 out of 29 children’s hospitals. Although observation status essentially was not used at two children’s hospitals over the study period, the median hospital-level use of observation stays was 26% in 2010 (IQR, 3%-36%) and increased to 46% (IQR: 39%; 55%) in 2019. As shown in Figure 3, the number of hospitals with a low percentage of observation stays (<26%) decreased from 15 in 2010 to 4 in 2019. The number of hospitals with a high percentage of observation stays (≥51%) increased from 5 in 2010 to 10 in 2019. Nevertheless, there remained significant variation in the use of observation stays, and the hospital-level use ranged from 0% to 67% in 2019.

DISCUSSION
By 2020, observation status has become a key component of healthcare for pediatric patients, and its relevance for children’s hospitals recently has been described.22,23 However, trends in observation stays for pediatric populations are not known. This represents the first study showing temporal trends of observation stays at children’s hospitals after 2010. Our results confirm that the increase in observation stays for pediatric populations is not attributable to decreasing patient acuity at children’s hospitals. We found a weak but significantly positive correlation between year and intensity of care used under observation stays. Although this correlation might not be clinically important, it demonstrates that patient acuity in observation stays is not decreasing. Regression results suggest that observation stays now encompass patients who need relatively higher intensity of care compared with those admitted under observation status in 2010.
This study also identifies a unique pattern in the use of observation stays among pediatric populations. Earlier studies exclusively focused on observation stays that were admitted from EDs.24 Our results indicate that observation status has been used beyond a bridge from ED care to inpatient admission. In particular, observation status has expanded to include pediatric populations with more diverse clinical conditions (eg, appendicitis and diabetes mellitus), and has become a substantial component of postprocedural admissions (Appendix Figure). Looking forward, it is likely that the use of observation stays might surpass inpatient admissions for more conditions that primarily involve short-term stays.
Observation status originally was designed as a reimbursement strategy for patients who needed short stays in dedicated ED units or hospitals, but did not qualify for inpatient services.5,25 After several changes in reimbursement policies, CMS released the “two midnight rule” for Medicare beneficiaries in 2013, which replaced condition-based criteria with time-based criteria to determine an inpatient or observation stay.1 Some Medicaid programs and commercial payors have developed similar policies. Unlike the universal policy for Medicare populations, the regulations for pediatric populations vary by states and health insurers.11-15,26-28 This might partially explain the wide variation observed among children’s hospital-level use of observation stays. For example, the California Medicaid program did not have a reimbursement rate for observation services as of 2020, while the Texas Medicaid program has had a policy for observation stays since 2010.12,13 We found that two children’s hospitals in California had the lowest use of observation stays (almost zero), whereas the hospital-level use of observation stays was more than 50% for three out of four children’s hospitals in Texas. In addition to reimbursement policies, individual hospitals also might have different strategies for observation status designation. An earlier survey showed that there was lack of consistency in billing and payor-based designations of observation status at children’s hospitals.29 These findings suggest that children’s hospital-level use of observation stays likely is influenced by reimbursement policy and practical strategy for observation status determination.
Earlier studies reported that observation status could be a more efficient use of healthcare resources.5,6 However, there are still at least two concerns relevant to children’s hospitals during the last decade. The first is whether the use of observation stays can promote cost-saving or if it is just a cost-shifting strategy. An earlier study demonstrated that observation stays with prolonged LOS might increase risk of cost-sharing among adult patients.29 Our study reveals an increasing trend of observation stays with prolonged LOS for pediatric patients. Similar to adult patients, LOS exceeding 24 or 48 hours could lead to uncovered healthcare costs and financial burdens on families.30-32 Meanwhile, children’s hospitals also might take on a higher financial liability by implementing observation status. Earlier studies have indicated that resource use between observation and inpatient stays at children’s hospitals is similar, and increasing use of observation stays might lead to financial risk rather than cost effectiveness.33 Further, administrative costs of observation determination are considerably high.34 Medicaid is the major payor for pediatric patients in children’s hospitals. In this study, more than 50% of encounters were paid through Medicaid programs. It is well known that Medicaid reimbursement rates are lower than Medicare and commercial plans.35 Therefore, the cost-saving conclusion drawn from Medicare patients cannot be generalized to pediatric populations at children’s hospitals without cautious reevaluation.
A second concern with increasing use of observation stays is selection bias in public reporting and comparisons of hospital performance. Presently, four main categories of quality indicators established by the Agency for Healthcare Research and Quality rely heavily on inpatient encounters.36 In this study, we found that the range of hospital-level use of observation stays was large. In 2019, the risk-adjusted percent use of observation stays was less than 5% at three hospitals, while the percent use was greater than 60% in another three hospitals. Therefore, comparisons made without uniform accounting of observation stays might have significant implications for national rankings of children’s hospitals across the United States. These consequences have been investigated in several published studies.22,23,37-39
There are several limitations to our study. First, the study sample was limited to children’s hospitals that consistently reported inpatient and observation data over the entire study period. Eighteen hospitals (86%) excluded from this study did not consistently submit inpatient and observation data to PHIS from 2010 through 2019. The primary purpose of this study was to present temporal trends of observation stays for children’s hospitals, and it was important to build the hospital cohort based on valid and consistent data during the study period. Appendix Table 4 presents differences of hospital characteristics by included and excluded groups of hospitals. Excluded hospitals might have fewer resources (eg, fewer pediatric intensive care beds). Nonetheless, the selection of hospitals was optimized based on data availability. Second, this study was a retrospective review of an administrative database of children’s hospitals and units. The sample does not represent all children’s hospitals or pediatric patients in the United States, but there are no available data sources—that we know of—that can generate national estimates for both inpatient and observation stays. Third, we did not attempt to conclusively infer any causal effects, and several factors could explain the increasing trends, such as reimbursement policies, hospital-level implementation strategies, determination guidelines for observation status designation, as well as changes in clinical care. Further studies should investigate impact of these factors on the use of observation stays for pediatric patients and children’s hospitals.
CONCLUSION
Observation status has been increasingly used for pediatric patients with more diverse clinical conditions, and there is a rising trend of prolonged LOS among observation stays since 2010. Considerable variation exists in hospital-level use of observation stays across children’s hospitals. Observation status could be an opportunity to improve efficiency of healthcare resource use or could lead to a financial risk for patients with prolonged LOS. Future studies should explore appropriateness of observation care in clinical practice through leveraging efficient care and alleviating financial risk.
1. Centers for Medicare & Medicaid Services. Fact Sheet: Two-Midnight Rule. Accessed April 11, 2021. https://www.cms.gov/newsroom/fact-sheets/fact-sheet-two-midnight-rule-0
2. BlueCross BlueShield of Rhode Island. Payment Policy Outpaient Observation. Accessed April 11, 2021. https://www.bcbsri.com/sites/default/files/polices/Outpatient-Observation.pdf
3. Blue Cross Blue Shield of Illinois. Observation Services Tool for Applying MCG Care Guidelines Clinical Payment and Coding Policy. Accessed April 11, 2021. https://www.bcbsil.com/pdf/standards/observation_services_cpcp.pdf
4. Medicare.gov. Inpatient or outpatient hospital status affects your costs. Accessed April 11, 2021. https://www.medicare.gov/what-medicare-covers/what-part-a-covers/inpatient-or-outpatient-hospital-status
5. Ross MA, Hockenberry JM, Mutter R, Barrett M, Wheatley M, Pitts SR. Protocol-driven emergency department observation units offer savings, shorter stays, and reduced admissions. Health Aff (Millwood). 2013;32(12):2149-2156. https://doi.org/10.1377/hlthaff.2013.0662
6. Baugh CW, Venkatesh AK, Hilton JA, Samuel PA, Schuur JD, Bohan JS. Making greater use of dedicated hospital observation units for many short-stay patients could save $3.1 billion a year. Health Aff (Millwood). 2012;31(10):2314-2323. https://doi.org/10.1377/hlthaff.2011.0926
7. Sheehy AM, Graf B, Gangireddy S, et al. Hospitalized but not admitted: characteristics of patients with “observation status” at an academic medical center. JAMA Intern Med. 2013;173(21):1991-1998. https://doi.org/10.1001/jamainternmed.2013.8185
8. Baugh CW, Schuur JD. Observation care—high-value care or a cost-shifting loophole? N Engl J Med. 2013;369(4):302-305. https://doi.org/10.1056/NEJMp1304493
9. Missouri Hospital Association. A patient’s guide to observation care. Accessed April 11, 2021. https://www.mhanet.com/mhaimages/PatientsGuideToObservationCareFlyer.pdf
10. Cigna. Employee-paid hospital care coverage- summary of benefits. Accessed April 11, 2021. https://www.cigna.com/iwov-resources/national-second-sale/docs/healthy-benefits/updated-HC-benefit-summary.pdf
11. BlueCross BlueShield of Minnesota. Reimbursement policy-observation care services. Accessed April 11, 2021. https://www.bluecrossmn.com/sites/default/files/DAM/2020-07/Evaluation%20and%20Management%20004_Observation%20Care%20Services%20_09.04.17.pdf
12. California Department of Health Care Services. Public Hospital Project Frequently Asked Questions. Accessed April 11, 2021. https://www.dhcs.ca.gov/provgovpart/Documents/Public%20Hospital%20Project/PHP_Final_FAQs_January2013ADA.pdf
13. Texas Medicaid & Healthcare Partnership. Inpatient and Outpatient Hospital Servicces Handbook. Accessed May 29, 2021. https://www.tmhp.com/sites/default/files/microsites/provider-manuals/tmppm/html/TMPPM/2_Inpatient_Outpatient_Hosp_Srvs/2_Inpatient_Outpatient_Hosp_Srvs.htm
14. Alabama Medicaid. Outpatient observation. Accessed April 11, 2021. https://medicaid.alabama.gov/news_detail.aspx?ID=5121
15. NC Medicaid. Medicaid and Health Choice Clinical Coverage Policy No: 2A-1. Accessed April 11, 2021. https://files.nc.gov/ncdma/documents/files/2A-1_0.pdf
16. Feng Z, Wright B, Mor V. Sharp rise in Medicare enrollees being held in hospitals for observation raises concerns about causes and consequences. Health Aff (Millwood). 2012;31(6):1251-1259. https://doi.org/10.1377/hlthaff.2012.0129
17. Wright B, O’Shea AM, Ayyagari P, Ugwi PG, Kaboli P, Vaughan Sarrazin M. Observation rates at veterans’ hospitals more than doubled during 2005-13, similar to Medicare trends. Health Aff (Millwood). 2015;34(10):1730-1737. https://doi.org/10.1377/hlthaff.2014.1474
18. Wright B, Jung HY, Feng Z, Mor V. Hospital, patient, and local health system characteristics associated with the prevalence and duration of observation care. Health Serv Res. 2014;49(4):1088-1107. https://doi.org/10.1111/1475-6773.12166
19. Sabbatini AK, Wright B, Hall MK, Basu A. The cost of observation care for commercially insured patients visiting the emergency department. Am J Emerg Med. 2018;36(9):1591-1596. https://doi.org/10.1016/j.ajem.2018.01.040
20. Children’s Hospital Association. Pediatric health information system. Accessed April 11, 2021. https://www.childrenshospitals.org/phis
21. Richardson T, Rodean J, Harris M, Berry J, Gay JC, Hall M. Development of hospitalization resource intensity scores for kids (H-RISK) and comparison across pediatric populations. J Hosp Med. 2018;13(9):602-608. https://doi.org/10.12788/jhm.2948
22. Gay JC, Hall M, Morse R, Fieldston ES, Synhorst DC, Macy ML.Observation encounters and length of stay benchmarking in children’s hospitals. Pediatrics. 2020;146(5):e20200120. https://doi.org/10.1542/peds.2020-0120
23. Synhorst DC, Hall M, Harris M, et al. Hospital observation status and readmission rates. Pediatrics. 2020;146(5):e2020003954. https://doi.org/10.1542/peds.2020-003954
24. Macy ML, Hall M, Shah SS, et al. Pediatric observation status: are we overlooking a growing population in children’s hospitals? J Hosp Med. 2012;7(7):530-536. https://doi.org/10.1002/jhm.1923
25. Macy ML, Kim CS, Sasson C, Lozon MM, Davis MM. Pediatric observation units in the United States: a systematic review. J Hosp Med. 2010;5(3):172-182. https://doi.org/10.1002/jhm.592
26. UnitedHealthcare. Observation services policy, facility. Accessed April 11, 2021. https://www.uhcprovider.com/content/dam/provider/docs/public/policies/medicaid-comm-plan-reimbursement/UHCCP-Facility-Observation-Services-Policy-(F7106).pdf
27. Cal SB-1076§1253.7. General acute care hospitals: observation services – Health and Safety. Accessed April 11, 2021. https://leginfo.legislature.ca.gov/faces/billTextClient.xhtml?bill_id=201520160SB1076
28. Nebraska Total Care. 2021 Provider Billing Guide. Accessed April 11, 2021. https://www.nebraskatotalcare.com/content/dam/centene/Nebraska/PDFs/ProviderRelations/NTC_Nebraska_Total_Care_Provider_Billing_Guide_508.pdf
29. Macy ML, Hall M, Shah SS, et al. Differences in designations of observation care in US freestanding children’s hospitals: are they virtual or real? J Hosp Med. 2012;7(4):287-293. https://doi.org/10.1002/jhm.949
30. Hockenberry JM, Mutter R, Barrett M, Parlato J, Ross MA. Factors associated with prolonged observation services stays and the impact of long stays on patient cost. Health Serv Res. 2014;49(3):893-909. https://doi.org/10.1111/1475-6773.12143
31. Anthem BlueCross BlueShield. Ohio Provider Manual. Accessed April11, 2021. https://www11.anthem.com/provider/oh/f1/s0/t0/pw_g357368.pdf?refer=ahpprovider&state=oh
32. Humana. Provider manual for physicians, hospitals and healthcare providers. Accessed April 11, 2021. https://docushare-web.apps.cf.humana.com/Marketing/docushare-app?file=3932669
33. Fieldston ES, Shah SS, Hall M, et al. Resource utilization for observation-status stays at children’s hospitals. Pediatrics. 2013;131(6):1050-1058 https://doi.org/10.1542/peds.2012-249
34. Tejedor-Sojo J. Observation status-a name at what cost? Hosp Pediatr. 2014;4(5):321-323. https://doi.org/10.1542/hpeds.2014-0037.
35. Selden TM, Karaca Z, Keenan P, White C, Kronick R. The growing difference between public and private payment rates for inpatient hospital care. Health Aff (Millwood). 2015;34(12):2147-2150. https://doi.org/10.1377/hlthaff.2015.0706
36. Agency for Healthcare Research and Quality. AHRQ Quality Indicators. Accessed April 11, 2021. https://www.qualityindicators.ahrq.gov
37. Figueroa JF, Burke LG, Zheng J, Orav EJ, Jha AK. Trends in hospitalization vs observation stay for ambulatory care-sensitive conditions. JAMA Intern Med. 2019;179(12):1714-1716. https://doi.org/10.1001/jamainternmed.2019.3177
38. Markham JL, Hall M, Gay JC, Bettenhausen JL, Berry JG. Length of stay and cost of pediatric readmissions. Pediatrics. 2018;141(4):e20172934. https://doi.org/10.1542/peds.2017-2934.
39. Overman RA, Freburger JK, Assimon MM, Li X, Brookhart, MA. Observation stays in administrative claims databases: underestimation of hospitalized cases. Pharmacoepidemiol Drug Saf. 2014;23(9):902-910. https://doi.org/10.1002/pds.3647.
Payors have been refining reimbursement policies for observation and inpatient stays over the past decade, and the effects on the healthcare payment system are significant.1-4 Advocates claim that observation status could improve efficiency in the use of healthcare resources by reducing emergency department (ED) crowding and lowering costs for inpatient care.5,6 Critics consider observation status to be a cost-shifting strategy that could lead to financial burdens for patients and hospitals.7,8
Although reimbursement policies for observation stays traditionally have been set by the Centers for Medicare and Medicaid Services (CMS) in a uniform manner,4,8 state Medicaid programs and commercial health insurers have developed a variety of policies for using observation status in broader populations and hospitals.9-15 Coverage criteria and implementation timelines of these policies vary by states and commercial insurers.11-15 For example, the California Department of Health Care Services did not have a specific reimbursement rate for observation stays in 2020, while some state Medicaid programs have had reimbursement policies for observation services in place since 2010.11-15 These inconsistencies likely result in greater variation in use of observation stays across children’s hospitals than general hospitals.
Previous studies have shown rising trends in use of observation stays among adult patient populations and related implications for patients and general hospitals,16-19 but few studies have reported the trends for pediatric populations. In this study, we sought to (1) describe recent trends of observation stays for pediatric populations at children’s hospitals from 2010 through 2019 and (2) investigate features of this shifting pattern for pediatric populations and hospital-level use of observation stays.
METHODS
Study Design, Data, and Populations
We performed a retrospective analysis of the Pediatric Health Information System (PHIS), an administrative database that contains inpatient, observation, ambulatory, and ED encounter-level data from 50 not-for-profit, tertiary care children’s hospitals affiliated with the Children’s Hospital Association (CHA).20 PHIS has an indicator to classify patient types (inpatient, observation, ED visits, ambulatory surgery, clinic visit, and others). The data are de-identified at the time of submission and subjected to validity and reliability checks by CHA and Truven Health Analytics (Ann Arbor, MI) before being included in PHIS. Each encounter in PHIS has only one patient type; therefore, encounters that transition to a higher level of care are assigned to their highest level of care (eg, a patient transitions from observation to inpatient status is classified as an inpatient encounter) to avoid duplicate counting.
To ensure consistent evaluations over time, we included 29 children’s hospitals that consistently reported both inpatient and observation data to PHIS across all quarters from 2010 through 2019. We identified the 20 most common clinical conditions using the All Patients Refined Diagnosis Related Groups (APR-DRGs; 3M Corporation) based upon their total frequencies of observation and inpatient stays over the study period. Regression analyses were conducted using all encounters within the 20 most common APR-DRGs.
Because all data have been de-identified in the PHIS database, the institutional review board at Ann and Robert H. Lurie Children’s Hospital of Chicago granted this study institutional review board–exempt status.
Main Outcome and Measures
We first presented longitudinal trends of observation stays for children’s hospitals using annual percentage of observation stays defined as:
To determine whether different pediatric populations have different trends of observation stays, we measured the growth rates of observation stays for each APR-DRG. Specifically, we first calculated the percentage of observation stays by APR-DRGs and years as described, and then calculated the growth rate of observation stays for each APR-DRG:
Next, we employed prolonged length of stay (LOS) and hospitalization resource-intensity scores for kids (H-RISK) to further investigate the shifting pattern of observation stays. Because most state Medicaid and commercial policies dictate that observation stays should not last longer than 48 hours, we defined prolonged LOS as >2 days.11-15 We defined the annual percentage of observation stays with prolonged LOS for each year as:
Numerators and denominators of the three measures were obtained by pooling all children’s hospitals included in this study. H-RISK is a continuous variable developed by CHA to measure use of intensive care for children, which is comparable across various APR-DRGs.21 Changes in the empirical distribution of H-RISK from observation stays were presented over years using percentiles.
Other measures included sex, age, race, payor, and LOS. To investigate the use of observation stays among payors, we categorized payors into five groups: private, in-state Medicaid (managed care), in-state Medicaid (Children’s Health Insurance Program [CHIP]/others), other government, and all others, according to the data availability. The “private” group consisted of commercial preferred provider organizations, commercial health maintenance organizations, and commercial others. We combined both CHIP and in-state Medicaid (others), including Medicaid fee-for-service or unspecified Medicaid together as “in-state Medicaid (CHIP/others).” Detailed categorization information is summarized in Appendix Table 1. LOS was classified into four groups: 1 day (24 hours), 2 days (48 hours), 3 to 4 days, and >4 days.
Statistical Analysis
Descriptive statistics were stratified by inpatient and observation status and were summarized using frequency, percent, median, and interquartile range (IQR). Chi-square or Wilcoxon rank-sum tests were performed to examine differences between observation and inpatient status. Trends in annual percentage of observation stays and annual percentage of observation stays with prolonged LOS were estimated using first-order autoregressive models, in which year was considered a continuous variable. A nonparametric measure of rank correlation (Spearman’s rank correlation coefficient) was employed to evaluate the correlation between year and H-RISK from observation stays.
The risk-adjusted probability of being admitted as an observation stay was estimated using generalized linear mixed models by adjusting for year, age, sex, race, payor, LOS, H-RISK, and a random intercept for each hospital to control for patient clustering within a hospital (Appendix Model). Hospital-level use of observation stays was measured by risk-adjusted percent use of observation stays for each hospital using the predicted values from generalized linear mixed models. All analyses were performed using SAS software, version 9.4 (SAS Institute) and R (R Core Team, 2019), and P < .05 was considered statistically significant.
RESULTS
Increasing Trend of Observation Stays
Over the study period, there were 5,611,001 encounters, including 3,901,873 (69.5%) inpatient and 1,709,128 (30.5%) observation stays (Appendix Table 1). The number of observation stays increased from 117,246 in 2010 to 207,842 in 2019, and the number of inpatient stays slightly increased from 378,433 to 397,994 over the 10 years (Appendix Table 1). Because of different growth rates between observation and inpatient status, the annual percentage of observation stays increased from 23.7% in 2010 to 34.3% in 2019, while the annual percentage of inpatient stays decreased from 76.3% in 2010 to 65.7% in 2019 (Appendix Table 1; Figure 1, P < .001).
Different Growth Rates of Observation Stays for Various Pediatric Populations
As shown in the Table, growth rates of observation stays increased for 19 of the 20 most common APR-DRGs. The four APR-DRGs having the highest growth rates in observation stays were appendectomy, diabetes mellitus, kidney and urinary tract infections, and cellulitis and other bacterial skin infections (Appendix Figure). In particular, the annual percentage of observation stays for appendectomy increased from 19.8% in 2010 to 54.7% in 2019, with the number of observation stays growing from 2,321 to 7,876, while the number of inpatient stays decreased from 9,384 to 6,535 (Appendix Figure). The annual percentage of observation stays for diabetes mellitus increased from 8.16% in 2010 to 22.74% in 2019. Tonsil and adenoid procedures consistently held the largest numbers of observation stays across the 10 years among all the APR-DRGs, with 115,207 and 31,125 total observation and inpatient stays, respectively (Table).
Characteristics of Observation and Inpatient Stays
Patient characteristics are summarized in Appendix Table 1. There were 542,344 (32.9%) observation stays among patients with in-state Medicaid (managed care), and 241,157 (27.4%) observation stays among in-state Medicaid (CHIP/others). The percentages of observation and inpatient stays were 29.8% and 70.2% for private payor, as well as 29.6% and 70.4% for other government payor. Overall, the median (IQR) of H-RISK among observation stays was 0.79 (0.57-1.19) vs 1.23 (0.72-2.43) for inpatient stays. There were 1,410,694 (82.5%) observation stays discharged within 1 day and 243,972 (14.3%) observation stays discharged within 2 days. However, there were 47,413 (2.8%) and 7,049 (0.4%) observation stays with LOS 3 to 4 days or >4 days, respectively.
Shifting Pattern in Observation Stays
The annual percentage of observation stays with prolonged LOS (>2 days) rose from 1.1% in 2010 to 4.6% in 2019 (P < .001; Figure 2). The empirical distribution of H-RISK from observation stays by years further suggests a slightly increasing trend in intensity of care under observation stays. As shown in Appendix Table 2, although the 1st, 5th, 10th, 25th, and 99th percentiles of H-RISK were relatively stable, the 50th, 75th, 90th, and 95th percentiles of H-RISK were increasing over time. The correlation between year and intensity of care used under observation stays (H-RISK from observation stays) was found to be weak but significantly positive (Spearman correlation coefficients = 0.04; P < .001).
Interaction coefficients from our regression model demonstrate that the existing inverse association between H-RISK and odds of admission as an observation stay became less negative over the years. In 2010, the adjusted odds ratio (OR) of H-RISK was 0.57 (95% CI, 0.55-0.59). By 2017, the adjusted OR had increased to 0.65 (95% CI, 0.64-0.66). Compared with 2010, the seven adjusted ORs of H-RISK at years 2012 through 2018 were observed to be higher and statistically significant (P < .001, Appendix Table 3).
Hospitals-Level Use of Observation Stays
After adjusting for all covariates and hospital random effects, hospital-level use of observation stays increased between 2010 and 2019 for 26 out of 29 children’s hospitals. Although observation status essentially was not used at two children’s hospitals over the study period, the median hospital-level use of observation stays was 26% in 2010 (IQR, 3%-36%) and increased to 46% (IQR: 39%; 55%) in 2019. As shown in Figure 3, the number of hospitals with a low percentage of observation stays (<26%) decreased from 15 in 2010 to 4 in 2019. The number of hospitals with a high percentage of observation stays (≥51%) increased from 5 in 2010 to 10 in 2019. Nevertheless, there remained significant variation in the use of observation stays, and the hospital-level use ranged from 0% to 67% in 2019.
DISCUSSION
By 2020, observation status has become a key component of healthcare for pediatric patients, and its relevance for children’s hospitals recently has been described.22,23 However, trends in observation stays for pediatric populations are not known. This represents the first study showing temporal trends of observation stays at children’s hospitals after 2010. Our results confirm that the increase in observation stays for pediatric populations is not attributable to decreasing patient acuity at children’s hospitals. We found a weak but significantly positive correlation between year and intensity of care used under observation stays. Although this correlation might not be clinically important, it demonstrates that patient acuity in observation stays is not decreasing. Regression results suggest that observation stays now encompass patients who need relatively higher intensity of care compared with those admitted under observation status in 2010.
This study also identifies a unique pattern in the use of observation stays among pediatric populations. Earlier studies exclusively focused on observation stays that were admitted from EDs.24 Our results indicate that observation status has been used beyond a bridge from ED care to inpatient admission. In particular, observation status has expanded to include pediatric populations with more diverse clinical conditions (eg, appendicitis and diabetes mellitus), and has become a substantial component of postprocedural admissions (Appendix Figure). Looking forward, it is likely that the use of observation stays might surpass inpatient admissions for more conditions that primarily involve short-term stays.
Observation status originally was designed as a reimbursement strategy for patients who needed short stays in dedicated ED units or hospitals, but did not qualify for inpatient services.5,25 After several changes in reimbursement policies, CMS released the “two midnight rule” for Medicare beneficiaries in 2013, which replaced condition-based criteria with time-based criteria to determine an inpatient or observation stay.1 Some Medicaid programs and commercial payors have developed similar policies. Unlike the universal policy for Medicare populations, the regulations for pediatric populations vary by states and health insurers.11-15,26-28 This might partially explain the wide variation observed among children’s hospital-level use of observation stays. For example, the California Medicaid program did not have a reimbursement rate for observation services as of 2020, while the Texas Medicaid program has had a policy for observation stays since 2010.12,13 We found that two children’s hospitals in California had the lowest use of observation stays (almost zero), whereas the hospital-level use of observation stays was more than 50% for three out of four children’s hospitals in Texas. In addition to reimbursement policies, individual hospitals also might have different strategies for observation status designation. An earlier survey showed that there was lack of consistency in billing and payor-based designations of observation status at children’s hospitals.29 These findings suggest that children’s hospital-level use of observation stays likely is influenced by reimbursement policy and practical strategy for observation status determination.
Earlier studies reported that observation status could be a more efficient use of healthcare resources.5,6 However, there are still at least two concerns relevant to children’s hospitals during the last decade. The first is whether the use of observation stays can promote cost-saving or if it is just a cost-shifting strategy. An earlier study demonstrated that observation stays with prolonged LOS might increase risk of cost-sharing among adult patients.29 Our study reveals an increasing trend of observation stays with prolonged LOS for pediatric patients. Similar to adult patients, LOS exceeding 24 or 48 hours could lead to uncovered healthcare costs and financial burdens on families.30-32 Meanwhile, children’s hospitals also might take on a higher financial liability by implementing observation status. Earlier studies have indicated that resource use between observation and inpatient stays at children’s hospitals is similar, and increasing use of observation stays might lead to financial risk rather than cost effectiveness.33 Further, administrative costs of observation determination are considerably high.34 Medicaid is the major payor for pediatric patients in children’s hospitals. In this study, more than 50% of encounters were paid through Medicaid programs. It is well known that Medicaid reimbursement rates are lower than Medicare and commercial plans.35 Therefore, the cost-saving conclusion drawn from Medicare patients cannot be generalized to pediatric populations at children’s hospitals without cautious reevaluation.
A second concern with increasing use of observation stays is selection bias in public reporting and comparisons of hospital performance. Presently, four main categories of quality indicators established by the Agency for Healthcare Research and Quality rely heavily on inpatient encounters.36 In this study, we found that the range of hospital-level use of observation stays was large. In 2019, the risk-adjusted percent use of observation stays was less than 5% at three hospitals, while the percent use was greater than 60% in another three hospitals. Therefore, comparisons made without uniform accounting of observation stays might have significant implications for national rankings of children’s hospitals across the United States. These consequences have been investigated in several published studies.22,23,37-39
There are several limitations to our study. First, the study sample was limited to children’s hospitals that consistently reported inpatient and observation data over the entire study period. Eighteen hospitals (86%) excluded from this study did not consistently submit inpatient and observation data to PHIS from 2010 through 2019. The primary purpose of this study was to present temporal trends of observation stays for children’s hospitals, and it was important to build the hospital cohort based on valid and consistent data during the study period. Appendix Table 4 presents differences of hospital characteristics by included and excluded groups of hospitals. Excluded hospitals might have fewer resources (eg, fewer pediatric intensive care beds). Nonetheless, the selection of hospitals was optimized based on data availability. Second, this study was a retrospective review of an administrative database of children’s hospitals and units. The sample does not represent all children’s hospitals or pediatric patients in the United States, but there are no available data sources—that we know of—that can generate national estimates for both inpatient and observation stays. Third, we did not attempt to conclusively infer any causal effects, and several factors could explain the increasing trends, such as reimbursement policies, hospital-level implementation strategies, determination guidelines for observation status designation, as well as changes in clinical care. Further studies should investigate impact of these factors on the use of observation stays for pediatric patients and children’s hospitals.
CONCLUSION
Observation status has been increasingly used for pediatric patients with more diverse clinical conditions, and there is a rising trend of prolonged LOS among observation stays since 2010. Considerable variation exists in hospital-level use of observation stays across children’s hospitals. Observation status could be an opportunity to improve efficiency of healthcare resource use or could lead to a financial risk for patients with prolonged LOS. Future studies should explore appropriateness of observation care in clinical practice through leveraging efficient care and alleviating financial risk.
1. Centers for Medicare & Medicaid Services. Fact Sheet: Two-Midnight Rule. Accessed April 11, 2021. https://www.cms.gov/newsroom/fact-sheets/fact-sheet-two-midnight-rule-0
2. BlueCross BlueShield of Rhode Island. Payment Policy Outpaient Observation. Accessed April 11, 2021. https://www.bcbsri.com/sites/default/files/polices/Outpatient-Observation.pdf
3. Blue Cross Blue Shield of Illinois. Observation Services Tool for Applying MCG Care Guidelines Clinical Payment and Coding Policy. Accessed April 11, 2021. https://www.bcbsil.com/pdf/standards/observation_services_cpcp.pdf
4. Medicare.gov. Inpatient or outpatient hospital status affects your costs. Accessed April 11, 2021. https://www.medicare.gov/what-medicare-covers/what-part-a-covers/inpatient-or-outpatient-hospital-status
5. Ross MA, Hockenberry JM, Mutter R, Barrett M, Wheatley M, Pitts SR. Protocol-driven emergency department observation units offer savings, shorter stays, and reduced admissions. Health Aff (Millwood). 2013;32(12):2149-2156. https://doi.org/10.1377/hlthaff.2013.0662
6. Baugh CW, Venkatesh AK, Hilton JA, Samuel PA, Schuur JD, Bohan JS. Making greater use of dedicated hospital observation units for many short-stay patients could save $3.1 billion a year. Health Aff (Millwood). 2012;31(10):2314-2323. https://doi.org/10.1377/hlthaff.2011.0926
7. Sheehy AM, Graf B, Gangireddy S, et al. Hospitalized but not admitted: characteristics of patients with “observation status” at an academic medical center. JAMA Intern Med. 2013;173(21):1991-1998. https://doi.org/10.1001/jamainternmed.2013.8185
8. Baugh CW, Schuur JD. Observation care—high-value care or a cost-shifting loophole? N Engl J Med. 2013;369(4):302-305. https://doi.org/10.1056/NEJMp1304493
9. Missouri Hospital Association. A patient’s guide to observation care. Accessed April 11, 2021. https://www.mhanet.com/mhaimages/PatientsGuideToObservationCareFlyer.pdf
10. Cigna. Employee-paid hospital care coverage- summary of benefits. Accessed April 11, 2021. https://www.cigna.com/iwov-resources/national-second-sale/docs/healthy-benefits/updated-HC-benefit-summary.pdf
11. BlueCross BlueShield of Minnesota. Reimbursement policy-observation care services. Accessed April 11, 2021. https://www.bluecrossmn.com/sites/default/files/DAM/2020-07/Evaluation%20and%20Management%20004_Observation%20Care%20Services%20_09.04.17.pdf
12. California Department of Health Care Services. Public Hospital Project Frequently Asked Questions. Accessed April 11, 2021. https://www.dhcs.ca.gov/provgovpart/Documents/Public%20Hospital%20Project/PHP_Final_FAQs_January2013ADA.pdf
13. Texas Medicaid & Healthcare Partnership. Inpatient and Outpatient Hospital Servicces Handbook. Accessed May 29, 2021. https://www.tmhp.com/sites/default/files/microsites/provider-manuals/tmppm/html/TMPPM/2_Inpatient_Outpatient_Hosp_Srvs/2_Inpatient_Outpatient_Hosp_Srvs.htm
14. Alabama Medicaid. Outpatient observation. Accessed April 11, 2021. https://medicaid.alabama.gov/news_detail.aspx?ID=5121
15. NC Medicaid. Medicaid and Health Choice Clinical Coverage Policy No: 2A-1. Accessed April 11, 2021. https://files.nc.gov/ncdma/documents/files/2A-1_0.pdf
16. Feng Z, Wright B, Mor V. Sharp rise in Medicare enrollees being held in hospitals for observation raises concerns about causes and consequences. Health Aff (Millwood). 2012;31(6):1251-1259. https://doi.org/10.1377/hlthaff.2012.0129
17. Wright B, O’Shea AM, Ayyagari P, Ugwi PG, Kaboli P, Vaughan Sarrazin M. Observation rates at veterans’ hospitals more than doubled during 2005-13, similar to Medicare trends. Health Aff (Millwood). 2015;34(10):1730-1737. https://doi.org/10.1377/hlthaff.2014.1474
18. Wright B, Jung HY, Feng Z, Mor V. Hospital, patient, and local health system characteristics associated with the prevalence and duration of observation care. Health Serv Res. 2014;49(4):1088-1107. https://doi.org/10.1111/1475-6773.12166
19. Sabbatini AK, Wright B, Hall MK, Basu A. The cost of observation care for commercially insured patients visiting the emergency department. Am J Emerg Med. 2018;36(9):1591-1596. https://doi.org/10.1016/j.ajem.2018.01.040
20. Children’s Hospital Association. Pediatric health information system. Accessed April 11, 2021. https://www.childrenshospitals.org/phis
21. Richardson T, Rodean J, Harris M, Berry J, Gay JC, Hall M. Development of hospitalization resource intensity scores for kids (H-RISK) and comparison across pediatric populations. J Hosp Med. 2018;13(9):602-608. https://doi.org/10.12788/jhm.2948
22. Gay JC, Hall M, Morse R, Fieldston ES, Synhorst DC, Macy ML.Observation encounters and length of stay benchmarking in children’s hospitals. Pediatrics. 2020;146(5):e20200120. https://doi.org/10.1542/peds.2020-0120
23. Synhorst DC, Hall M, Harris M, et al. Hospital observation status and readmission rates. Pediatrics. 2020;146(5):e2020003954. https://doi.org/10.1542/peds.2020-003954
24. Macy ML, Hall M, Shah SS, et al. Pediatric observation status: are we overlooking a growing population in children’s hospitals? J Hosp Med. 2012;7(7):530-536. https://doi.org/10.1002/jhm.1923
25. Macy ML, Kim CS, Sasson C, Lozon MM, Davis MM. Pediatric observation units in the United States: a systematic review. J Hosp Med. 2010;5(3):172-182. https://doi.org/10.1002/jhm.592
26. UnitedHealthcare. Observation services policy, facility. Accessed April 11, 2021. https://www.uhcprovider.com/content/dam/provider/docs/public/policies/medicaid-comm-plan-reimbursement/UHCCP-Facility-Observation-Services-Policy-(F7106).pdf
27. Cal SB-1076§1253.7. General acute care hospitals: observation services – Health and Safety. Accessed April 11, 2021. https://leginfo.legislature.ca.gov/faces/billTextClient.xhtml?bill_id=201520160SB1076
28. Nebraska Total Care. 2021 Provider Billing Guide. Accessed April 11, 2021. https://www.nebraskatotalcare.com/content/dam/centene/Nebraska/PDFs/ProviderRelations/NTC_Nebraska_Total_Care_Provider_Billing_Guide_508.pdf
29. Macy ML, Hall M, Shah SS, et al. Differences in designations of observation care in US freestanding children’s hospitals: are they virtual or real? J Hosp Med. 2012;7(4):287-293. https://doi.org/10.1002/jhm.949
30. Hockenberry JM, Mutter R, Barrett M, Parlato J, Ross MA. Factors associated with prolonged observation services stays and the impact of long stays on patient cost. Health Serv Res. 2014;49(3):893-909. https://doi.org/10.1111/1475-6773.12143
31. Anthem BlueCross BlueShield. Ohio Provider Manual. Accessed April11, 2021. https://www11.anthem.com/provider/oh/f1/s0/t0/pw_g357368.pdf?refer=ahpprovider&state=oh
32. Humana. Provider manual for physicians, hospitals and healthcare providers. Accessed April 11, 2021. https://docushare-web.apps.cf.humana.com/Marketing/docushare-app?file=3932669
33. Fieldston ES, Shah SS, Hall M, et al. Resource utilization for observation-status stays at children’s hospitals. Pediatrics. 2013;131(6):1050-1058 https://doi.org/10.1542/peds.2012-249
34. Tejedor-Sojo J. Observation status-a name at what cost? Hosp Pediatr. 2014;4(5):321-323. https://doi.org/10.1542/hpeds.2014-0037.
35. Selden TM, Karaca Z, Keenan P, White C, Kronick R. The growing difference between public and private payment rates for inpatient hospital care. Health Aff (Millwood). 2015;34(12):2147-2150. https://doi.org/10.1377/hlthaff.2015.0706
36. Agency for Healthcare Research and Quality. AHRQ Quality Indicators. Accessed April 11, 2021. https://www.qualityindicators.ahrq.gov
37. Figueroa JF, Burke LG, Zheng J, Orav EJ, Jha AK. Trends in hospitalization vs observation stay for ambulatory care-sensitive conditions. JAMA Intern Med. 2019;179(12):1714-1716. https://doi.org/10.1001/jamainternmed.2019.3177
38. Markham JL, Hall M, Gay JC, Bettenhausen JL, Berry JG. Length of stay and cost of pediatric readmissions. Pediatrics. 2018;141(4):e20172934. https://doi.org/10.1542/peds.2017-2934.
39. Overman RA, Freburger JK, Assimon MM, Li X, Brookhart, MA. Observation stays in administrative claims databases: underestimation of hospitalized cases. Pharmacoepidemiol Drug Saf. 2014;23(9):902-910. https://doi.org/10.1002/pds.3647.
© 2021 Society of Hospital Medicine
Inpatient Glycemic Control With Sliding Scale Insulin in Noncritical Patients With Type 2 Diabetes: Who Can Slide?
Sliding scale insulin (SSI) for inpatient glycemic control was first proposed by Elliott P Joslin in 1934 when he recommended titration of insulin based on urine glucose levels.1 As bedside glucose meters became widely available, physicians transitioned to dosing SSI based on capillary blood glucose (BG) levels,2,3 and SSI became widely used for the management of inpatient hyperglycemia.1 However, during the past decade, there has been strong opposition to the use of SSI in hospitals. Many authors oppose its use, highlighting the retrospective rather than prospective nature of SSI therapy and concerns about inadequate glycemic control.4-6 In 2004, the American College of Endocrinology first released a position statement discouraging the use of SSI alone and recommended basal-bolus insulin as the preferred method of glycemic control for inpatients with type 2 diabetes (T2D).7 The American Diabetes Association (ADA) inpatient guidelines in 20058 and the Endocrine Society guidelines in 20129 also opposed SSI monotherapy and reaffirmed that a basal-bolus insulin regimen should be used for most non–critically ill patients with diabetes. Those guidelines remain in place currently.
Several randomized controlled trials (RCTs) and meta-analyses have shown that basal-bolus insulin regimens provide superior glycemic control in non–critical inpatients when compared with SSI alone.10-14 In addition, the RABBIT 2 (Randomized Study of Basal-Bolus Insulin Therapy in the Inpatient Management of Patients With Type 2 Diabetes) trial showed a significant reduction in perioperative complications10 among surgical patients when treated with basal-bolus insulin therapy. Despite these studies and strong recommendations against its use, SSI continues to be widely used in the United States. According to a 2007 survey of 44 US hospitals, 41% of noncritical patients with hyperglycemia were treated with SSI alone.15 In addition, SSI remains one of the most commonly prescribed insulin regimens in many countries around the world.16-19 The persistence of SSI use raises questions as to why clinicians continue to use a therapy that has been strongly criticized. Some authors point to convenience and fear of hypoglycemia with a basal-bolus insulin regimen.20,21 Alternatively, it is possible that SSI usage remains so pervasive because it is effective in a subset of patients. In fact, a 2018 Cochrane review concluded that existing evidence is not sufficiently robust to definitively recommend basal-bolus insulin over SSI for inpatient diabetes management of non–critically ill patients despite existing guidelines.22
Owing to the ongoing controversy and widespread use of SSI, we designed an exploratory analysis to understand the rationale for such therapy by investigating whether a certain subpopulation of hospitalized patients with T2D may achieve target glycemic control with SSI alone. We hypothesized that noncritical patients with mild hyperglycemia and admission BG <180 mg/dL would do well with SSI alone and may not require intensive treatment with basal-bolus insulin regimens. To address this question, we used electronic health records with individual-level patient data to assess inpatient glycemic control of non–critically ill patients with T2D treated with SSI alone.
METHODS
Participants
Data from 25,813 adult noncritical inpatients with T2D, with an index admission between June 1, 2010, and June 30, 2018, were obtained through the Emory Healthcare Clinical Data Warehouse infrastructure program. All patients were admitted to Emory Healthcare hospitals, including Emory University Hospital, Emory University Hospital Midtown, and Emory Saint Joseph’s Hospital, in Atlanta, Georgia. Data were extracted for each patient during the index hospitalization, including demographics, anthropometrics, and admission and inpatient laboratory values. Information was collected on daily point-of-care glucose values, hemoglobin A1c (HbA1c), hypoglycemic events, insulin doses, hospital complications, comorbidities, and hospital setting (medical vs surgical admission). International Classification of Diseases, 9th and 10th Revisions (ICD-9/10) codes were used to determine diagnosis of T2D, comorbidities, and complications.
From our initial dataset, we identified 16,366 patients who were treated with SSI during hospitalization. We excluded patients who were admitted to the intensive care unit (ICU) or placed on intravenous insulin, patients with missing admission BG values, and patients with a length of stay less than 1 day. To prevent inclusion of patients presenting in diabetic ketoacidosis or hyperosmolar hyperglycemic syndrome, we excluded patients with an admission BG >500 mg/dL. We then excluded 6,739 patients who received basal insulin within the first 2 days of hospitalization, as well as 943 patients who were treated with noninsulin (oral or injectable) antidiabetic agents. Our final dataset included 8,095 patients (Appendix Figure).
Patients in the SSI cohort included all patients who were treated with short-acting insulin only (regular insulin or rapid-acting [lispro, aspart, glulisine] insulin analogs) during the first 2 days of hospitalization. Patients who remained on only short-acting insulin during the entire hospitalization were defined as continuous SSI patients. Patients who subsequently received basal insulin after day 2 of hospitalization were defined as patients who transitioned to basal. Patients were stratified according to admission BG levels (first BG available on day of admission) and HbA1c (when available during index admission). We compared the baseline characteristics and clinical outcomes of patients who remained on SSI alone throughout the entirety of hospitalization with those of patients who required transition to basal insulin. The mean hospital BG was calculated by taking the average of all BG measurements during the hospital stay. We defined hypoglycemia as a BG <70 mg/dL and severe hypoglycemia as BG <40 mg/dL. Repeated hypoglycemia values were excluded if they occurred within a period of 2 hours.
Outcome Measures
The primary outcome was the percentage of patients with T2D achieving target glycemic control with SSI therapy, defined as mean hospital BG between 70 and 180 mg/dL without hypoglycemia <70 mg/dL during hospital stay. This threshold was determined based on 2019 ADA recommendations targeting hospital BG <180 mg/dL and avoidance of hypoglycemia.23
Statistical Analysis
Patients were stratified according to continuous SSI versus transitioned to basal treatment. Patients who remained on continuous SSI were further categorized into four categories based on admission BG: <140 mg/dL, 140 to 180 mg/dL, 180 to 250 mg/dL, and ≥250 mg/dL. Clinical characteristics were compared using Wilcoxon rank-sum tests (if continuous) and chi-square tests or Fisher exact tests (if categorical). We then compared the clinical outcomes among continuous SSI patients with different admission BG levels (<140 mg/dL, 140-180 mg/dL, 180-250 mg/dL, and ≥250 mg/dL) and with different HbA1c levels (<7%, 7%-8%, 8%-9%, ≥9%). Within each scenario, logistic regression for the outcome of poor glycemic control, defined as mean hospital BG >180 mg/dL, was performed to evaluate the HbA1c levels and admission BG levels controlling for other factors (age, gender, body mass index [BMI], race, setting [medicine versus surgery] and Charlson Comorbidity Index score). A P value < .05 was regarded as statistically significant. All analyses were performed based on available cases and conducted in SAS version 9.4 (SAS Institute Inc.).
RESULTS
Among 25,813 adult patients with T2D, 8,095 patients (31.4%) were treated with SSI alone during the first 2 days of hospitalization. Of those patients treated with SSI, 6,903 (85%) remained on continuous SSI alone during the entire hospitalization, and 1,192 (15%) were transitioned to basal insulin. The clinical characteristics of these patients on continuous SSI and those who transitioned to basal insulin are shown in Table 1. Patients who transitioned to basal insulin had significantly higher mean (SD) admission BG (191.8 [88.2] mg/dL vs 156.4 [65.4] mg/dL, P < .001) and higher mean (SD) HbA1c (8.1% [2.0%] vs 7.01% [1.5%], P < .001), compared with those who remained on continuous SSI. Patients who transitioned to basal insulin were also younger and more likely to have chronic kidney disease (CKD), but less likely to have congestive heart failure, coronary artery disease, or chronic obstructive pulmonary disease (COPD). The Charlson Comorbidity Index score was significantly higher for patients who transitioned to basal (4.4 [2.5]) than for those who remained on continuous SSI (4.1 [2.5], P < .001). There were no significant differences among sex, BMI, or glomerular filtration rate (GFR) on admission. Of those transitioned to basal insulin, 53% achieved a mean hospitalization BG <180 mg/dL, compared with 82% of those on continuous SSI. The overall rate of hypoglycemia in the continuous SSI group was 8% compared with 18% in those transitioned to basal insulin.

Of the patients who remained on continuous SSI throughout the hospitalization, 3,319 patients (48%) had admission BG <140 mg/dL, 1,671 patients (24%) had admission BG 140 to 180 mg/dL, and 1,913 patients (28%) had admission BG >180 mg/dL. Only 9% of patients who remained on continuous SSI had admission BG ≥250 mg/dL. Patients with admission BG <140 mg/dL were older, had lower BMI and HbA1c, had higher rates of COPD and CKD, and were more likely to be admitted to a surgical service compared with patients with admission BG >140 mg/dL (P < .05 for all; Table 2).

Hospital glycemic control for patients on continuous SSI according to admission BG is displayed in Table 3. Among patients who remained on continuous SSI, 96% of patients with admission BG <140 mg/dL had a mean hospital BG <180 mg/dL; of them, 86% achieved target control without hypoglycemia. Similar rates of target control were achieved in patients with admission BG 140 to 180 mg/dL (83%), in contrast to patients with admission BG ≥250 mg/dL, of whom only 18% achieved target control (P < .001). These findings parallel those seen in patients transitioned to basal insulin. Of patients in the transition group admitted with BG <140 mg/dL and <180 mg/dL, 88.5% and 84.6% had mean hospital BG <180 mg/dL, respectively, while 69.1% and 68.9% had mean BG between 70 and 180 mg/dL without hypoglycemia. The overall frequency of hypoglycemia <70 mg/dL among patients on continuous SSI was 8% and was more common in patients with admission BG <140 mg/dL (10%) compared with patients with higher admission glucose levels (BG 140-180 mg/dL [4%], 180-250 mg/dL [4%], or ≥250 mg/dL [6%], P < .001). There was no difference in rates of severe hypoglycemia <40 mg/dL among groups.

HbA1c data were available for 2,560 of the patients on continuous SSI (Table 3). Mean hospital BG increased significantly with increasing HbA1c values. Patients admitted with HbA1c <7% had lower mean (SD) hospital BG (132.2 [28.2] mg/dL) and were more likely to achieve target glucose control during hospitalization (85%) compared with those with HbA1c 7% to 8% (mean BG, 148.7 [30.8] mg/dL; 80% target control), HbA1c 8% to 9% (mean BG, 169.1 [37.9] mg/dL; 61% target control), or HbA1c ≥9% (mean BG, 194.9 [53.4] mg/dL; 38% target control) (P < .001).
In a logistic regression analysis adjusted for age, gender, BMI, race, setting (medicine vs surgery), and Charlson Comorbidity Index score, the odds of poor glycemic control increased with higher admission BG (admission BG 140-180 mg/dL: odds ratio [OR], 1.8; 95% CI, 1.5-2.2; admission BG 180-250 mg/dL: OR, 3.7; 95% CI, 3.1-4.4; admission BG ≥250 mg/dL: OR, 7.2; 95% CI, 5.8-9.0; reference admission BG <140 mg/dL; Figure). Similarly, the logistic regression analysis showed greater odds of poor in-hospital glycemic control with increasing HbA1c (OR, 6.1; 95% CI, 4.3-8.8 for HbA1c >9% compared with HbA1c <7%).

DISCUSSION
This large retrospective cohort study examined the effectiveness of SSI for glycemic control in noncritical inpatients with T2D. Our results indicate that SSI is still widely used in our hospital system, with 31.4% of our initial cohort managed with SSI alone. We found that 86% of patients with BG <140 mg/dL and 83% of patients with BG 140 to 180 mg/dL achieved glycemic control without hypoglycemia when managed with SSI alone, compared with 53% of those admitted with BG 180 to 250 mg/dL and only 18% of those with admission BG ≥250 mg/dL. This high success rate of achieving optimal BG control with SSI alone is comparable to that seen with transition to basal insulin and may explain the prevalent use of SSI for the management of patients with T2D and mild to moderate hyperglycemia.
Published clinical guideline recommendations promoting the use of basal-bolus insulin treatment algorithms are based on the results of a few RCTs that compared the efficacy of SSI vs a basal-bolus insulin regimen. These studies reported significantly lower mean daily BG concentration with basal or basal-bolus insulin therapy compared with SSI.10,11,24 However, it is interesting to note that the mean admission BG of patients treated with SSI in these RCTs ranged from 184 to 225 mg/dL. Patients in these trials were excluded if admission BG was <140 mg/dL.10,11,24 This is in contrast to our study evaluating real-world data in non–critically ill settings in which we found that 48% of patients treated with SSI had admission BG <140 mg/dL, and nearly 75% had admission BG <180 mg/dL. This suggests that by nature of study design, most RCTs excluded the population of patients who do achieve good glycemic control with SSI and may have contributed to the perception that basal insulin is preferable in all populations.
Our analysis indicates that healthcare professionals should consider admission BG when selecting the type of insulin regimen to manage patients with T2D in the hospital. Our results suggest that SSI may be appropriate for many patients with admission BG <180 mg/dL and should be avoided as monotherapy in patients with admission BG ≥180 mg/dL, as the proportion of patients achieving target control decreased with increasing admission BG. More importantly, if a patient is not controlled with SSI alone, intensification of therapy with the addition of basal insulin is indicated to achieve glycemic control. In addition, we found that the admission HbA1c is an appropriate marker to consider as well, with hospital glycemic control deteriorating with increasing HbA1c values, paralleling the admission BG. The main limitation to widespread use of HbA1c for therapeutic decision-making is access to values at time of patient admission; in our population, only 37% of patients had an HbA1c value available during the index hospitalization.
Previous publications have reported that hypoglycemia carries significant safety concerns, especially among a hospitalized population.25-27 As such, we included hypoglycemia as an important metric in our definition of target glycemic control rather than simply using mean hospital BG or number of hyperglycemic events to define treatment effectiveness. We did find a higher rate of hypoglycemia in patients with moderate admission BG treated with SSI compared with those with higher admission BG; however, few patients overall experienced clinically significant (<54 mg/dL) or severe (<40 mg/dL) hypoglycemia.
In our population, only 15% of patients started on SSI received additional basal insulin during hospitalization. This finding is similar to data reported in the Rabbit 2 trial, in which 14% of patients failed SSI alone, with a higher failure rate among those with higher BG on admission.10 Given the observational nature of this study, we cannot definitively state why certain patients in our population required additional basal insulin, but we can hypothesize that these patients admitted with BG ≥180 mg/dL had higher treatment failure rates and greater rates of hyperglycemia, therefore receiving intensified insulin therapy as clinically indicated at the discretion of the treating physician. Patients who transitioned from SSI to basal insulin had significantly higher admission BG and HbA1c compared with patients who remained on SSI alone. We noted that the rates of hypoglycemia were higher in the group that transitioned to basal (18% vs 8%) and similar to rates reported in previous RCTs.11,24
This observational study takes advantage of a large, diverse study population and a combination of medicine and surgery patients in a real-world setting. We acknowledge several limitations in our study. Our primary data were observational in nature, and as such, some baseline patient characteristics were notably different between groups, suggesting selection bias for treatment allocation to SSI. We do not know which patients were managed by primary teams compared with specialized diabetes consult services, which may also influence treatment regimens. We did not have access to information about patients’ at-home diabetes medication regimens or duration of diabetes, both of which have been shown in prior publications to affect an individual’s overall hospital glycemic control. Data on HbA1c values were available for only approximately one-third of patients. In addition, our study did not include patients without a history of diabetes who developed stress-induced hyperglycemia, a population that may benefit from conservative therapy such as SSI.28 A diagnosis of CKD was defined based on ICD 9/10 codes and not on admission estimated GFR. More specific data regarding stage of CKD or changes in renal function over the duration of hospitalization are not available, which could influence insulin prescribing practice. In addition, we defined the basal group as patients prescribed any form of basal insulin (NPH, glargine, detemir or degludec), and we do not have information on the use of prandial versus correction doses of rapid-acting insulin in the basal insulin–treated group.
CONCLUSION
In conclusion, our observational study indicates that the use of SSI results in appropriate target glycemic control for most noncritical medicine and surgery patients with admission BG <180 mg/dL. In agreement with previous RCTs, our study confirms that SSI as monotherapy is frequently inadequate in patients with significant hyperglycemia >180 mg/dL.10,11,24,29 We propose that an individualized approach to inpatient glycemic management is imperative, and cautious use of SSI may be a viable option for certain patients with mild hyperglycemia and admission BG <180 mg/dL. Further observational and randomized studies are needed to confirm the efficacy of SSI therapy in T2D patients with mild hyperglycemia. By identifying which subset of patients can be safely managed with SSI alone, we can better understand which patients will require escalation of therapy with intensive glucose management.
1. Umpierrez GE, Palacio A, Smiley D. Sliding scale insulin use: myth or insanity? Am J Med. 2007;120(7):563-567. https://doi.org/10.1016/j.amjmed.2006.05.070
2. Kitabchi AE, Ayyagari V, Guerra SM. The efficacy of low-dose versus conventional therapy of insulin for treatment of diabetic ketoacidosis. Ann Intern Med. 1976;84(6):633-638. https://doi.org/10.7326/0003-4819-84-6-633
3. Skyler JS, Skyler DL, Seigler DE, O’Sullivan MJ. Algorithms for adjustment of insulin dosage by patients who monitor blood glucose. Diabetes Care. 1981;4(2):311-318. https://doi.org/10.2337/diacare.4.2.311
4. Gearhart JG, Duncan JL 3rd, Replogle WH, Forbes RC, Walley EJ. Efficacy of sliding-scale insulin therapy: a comparison with prospective regimens. Fam Pract Res J. 1994;14(4):313-322.
5. Queale WS, Seidler AJ, Brancati FL. Glycemic control and sliding scale insulin use in medical inpatients with diabetes mellitus. Arch Intern Med. 1997;157(5):545-552.
6. Clement S, Braithwaite SS, Magee MF, et al. Management of diabetes and hyperglycemia in hospitals. Diabetes Care. 2004;27(2):553-591. https://doi.org/10.2337/diacare.27.2.553
7. Garber AJ, Moghissi ES, Bransome ED Jr, et al. American College of Endocrinology position statement on inpatient diabetes and metabolic control. Endocr Pract. 2004;10(1):78-82. https://doi.org/10.4158/EP.10.1.77
8. American Diabetes Association. Standards of medical care in diabetes. Diabetes Care. 2005;28(suppl 1):S4-S36.
9. Umpierrez GE, Hellman R, Korytkowski MT, , et al. Management of hyperglycemia in hospitalized patients in non-critical care setting: an Endocrine Society clinical practice guideline. J Clin Endocrinol Metab. 2012;97(1):16-38. https://doi.org/10.1210/jc.2011-2098
10. Umpierrez GE, Smiley D, Zisman A, et al. Randomized study of basal-bolus insulin therapy in the inpatient management of patients with type 2 diabetes. Diabetes Care. 2007;30(9):2181-2186. https://doi.org/10.2337/dc07-0295
11. Umpierrez GE, Smiley D, Jacobs S, et al. Randomized study of basal-bolus insulin therapy in the inpatient management of patients with type 2 diabetes undergoing general surgery (RABBIT 2 surgery). Diabetes Care. 2011;34(2):256-261. https://doi.org/10.2337/dc10-1407
12. Schroeder JE, Liebergall M, Raz I, Egleston R, Ben Sussan G, Peyser A. Benefits of a simple glycaemic protocol in an orthopaedic surgery ward: a randomized prospective study. Diabetes Metab Res Rev. 2012;28:71-75. https://doi.org/10.1002/dmrr.1217
13. Lee YY, Lin YM, Leu WJ, et al. Sliding-scale insulin used for blood glucose control: a meta-analysis of randomized controlled trials. Metabolism. 2015;64(9):1183-1192. https://doi.org/10.1016/j.metabol.2015.05.011
14. Christensen MB, Gotfredsen A, Nørgaard K. Efficacy of basal-bolus insulin regimens in the inpatient management of non-critically ill patients with type 2 diabetes: a systematic review and meta-analysis. Diabetes Metab Res Rev. 2017;33(5):e2885. https://doi.org/10.1002/dmrr.2885
15. Wexler DJ, Meigs JB, Cagliero E, Nathan DM, Grant RW. Prevalence of hyper- and hypoglycemia among inpatients with diabetes: a national survey of 44 U.S. hospitals. Diabetes Care. 2007;30(2):367-369. https://doi.org/10.2337/dc06-1715
16. Moreira ED Jr, Silveira PCB, Neves RCS, Souza C Jr, Nunes ZO, Almeida MdCC. Glycemic control and diabetes management in hospitalized patients in Brazil. Diabetol Metab Syndr. 2013;5(1):62. https://doi.org/10.1186/1758-5996-5-62
17. Akhtar ST, Mahmood K, Naqvi IH, Vaswani AS. Inpatient management of type 2 diabetes mellitus: does choice of insulin regimen really matter? Pakistan J Med Sci. 2014;30(4):895-898.
18. Gómez Cuervo C, Sánchez Morla A, Pérez-Jacoiste Asín MA, Bisbal Pardo O, Pérez Ordoño L, Vila Santos J. Effective adverse event reduction with bolus-basal versus sliding scale insulin therapy in patients with diabetes during conventional hospitalization: systematic review and meta-analysis. Endocrinol Nutr. 2016;63(4):145-156. https://doi.org/10.1016/j.endonu.2015.11.008
19. Bain A, Hasan SS, Babar ZUD. Interventions to improve insulin prescribing practice for people with diabetes in hospital: a systematic review. Diabet Med. 2019;36(8):948-960. https://doi.org/10.1111/dme.13982
20. Ambrus DB, O’Connor MJ. Things We Do For No Reason: sliding-scale insulin as monotherapy for glycemic control in hospitalized patients. J Hosp Med. 2019;14(2):114-116. https://doi.org/10.12788/jhm.3109
21. Nau KC, Lorenzetti RC, Cucuzzella M, Devine T, Kline J. Glycemic control in hospitalized patients not in intensive care: beyond sliding-scale insulin. Am Fam Physician. 2010;81(9):1130-1135.
22. Colunga-Lozano LE, Gonzalez Torres FJ, Delgado-Figueroa N, et al. Sliding scale insulin for non-critically ill hospitalised adults with diabetes mellitus. Cochrane Database Syst Rev. 2018;11(11):CD011296. https://doi.org/10.1002/14651858.CD011296.pub2
23. American Diabetes Association. Diabetes care in the hospital: Standards of Medical Care in Diabetes—2019. Diabetes Care. 2019;42(suppl 1):S173-S181. https://doi.org/10.2337/dc19-S015
24. Umpierrez GE, Smiley D, Hermayer K, et al. Randomized study comparing a basal-bolus with a basal plus correction management of medical and surgical patients with type 2 diabetes: basal plus trial. Diabetes Care. 2013;36(8):2169-2174. https://doi.org/10.2337/dc12-1988
25. Turchin A, Matheny ME, Shubina M, Scanlon SV, Greenwood B, Pendergrass ML. Hypoglycemia and clinical outcomes in patients with diabetes hospitalized in the general ward. Diabetes Care. 2009;32(7):1153-1157. https://doi.org/10.2337/dc08-2127
26. Garg R, Hurwitz S, Turchin A, Trivedi A. Hypoglycemia, with or without insulin therapy, is associated with increased mortality among hospitalized patients. Diabetes Care. 2013;36(5):1107-1110. https://doi.org/10.2337/dc12-1296
27. Zapatero A, Gómez-Huelgas R, González N, et al. Frequency of hypoglycemia and its impact on length of stay, mortality, and short-term readmission in patients with diabetes hospitalized in internal medicine wards. Endocr Pract. 2014;20(9):870-875. https://doi.org/10.4158/EP14006.OR
28. Umpierrez GE, Isaacs SD, Bazargan N, You X, Thaler LM, Kitabchi AE. Hyperglycemia: an independent marker of in-hospital mortality in patients with undiagnosed diabetes. J Clin Endocrinol Metab. 2002;87(3):978-982. https://doi.org/10.1210/jcem.87.3.8341
29. Dickerson LM, Ye X, Sack JL, Hueston WJ. Glycemic control in medical inpatients with type 2 diabetes mellitus receiving sliding scale insulin regimens versus routine diabetes medications: a multicenter randomized controlled trial. Ann Fam Med. 2003;1(1):29-35. https://doi.org/10.1370/afm.2
Sliding scale insulin (SSI) for inpatient glycemic control was first proposed by Elliott P Joslin in 1934 when he recommended titration of insulin based on urine glucose levels.1 As bedside glucose meters became widely available, physicians transitioned to dosing SSI based on capillary blood glucose (BG) levels,2,3 and SSI became widely used for the management of inpatient hyperglycemia.1 However, during the past decade, there has been strong opposition to the use of SSI in hospitals. Many authors oppose its use, highlighting the retrospective rather than prospective nature of SSI therapy and concerns about inadequate glycemic control.4-6 In 2004, the American College of Endocrinology first released a position statement discouraging the use of SSI alone and recommended basal-bolus insulin as the preferred method of glycemic control for inpatients with type 2 diabetes (T2D).7 The American Diabetes Association (ADA) inpatient guidelines in 20058 and the Endocrine Society guidelines in 20129 also opposed SSI monotherapy and reaffirmed that a basal-bolus insulin regimen should be used for most non–critically ill patients with diabetes. Those guidelines remain in place currently.
Several randomized controlled trials (RCTs) and meta-analyses have shown that basal-bolus insulin regimens provide superior glycemic control in non–critical inpatients when compared with SSI alone.10-14 In addition, the RABBIT 2 (Randomized Study of Basal-Bolus Insulin Therapy in the Inpatient Management of Patients With Type 2 Diabetes) trial showed a significant reduction in perioperative complications10 among surgical patients when treated with basal-bolus insulin therapy. Despite these studies and strong recommendations against its use, SSI continues to be widely used in the United States. According to a 2007 survey of 44 US hospitals, 41% of noncritical patients with hyperglycemia were treated with SSI alone.15 In addition, SSI remains one of the most commonly prescribed insulin regimens in many countries around the world.16-19 The persistence of SSI use raises questions as to why clinicians continue to use a therapy that has been strongly criticized. Some authors point to convenience and fear of hypoglycemia with a basal-bolus insulin regimen.20,21 Alternatively, it is possible that SSI usage remains so pervasive because it is effective in a subset of patients. In fact, a 2018 Cochrane review concluded that existing evidence is not sufficiently robust to definitively recommend basal-bolus insulin over SSI for inpatient diabetes management of non–critically ill patients despite existing guidelines.22
Owing to the ongoing controversy and widespread use of SSI, we designed an exploratory analysis to understand the rationale for such therapy by investigating whether a certain subpopulation of hospitalized patients with T2D may achieve target glycemic control with SSI alone. We hypothesized that noncritical patients with mild hyperglycemia and admission BG <180 mg/dL would do well with SSI alone and may not require intensive treatment with basal-bolus insulin regimens. To address this question, we used electronic health records with individual-level patient data to assess inpatient glycemic control of non–critically ill patients with T2D treated with SSI alone.
METHODS
Participants
Data from 25,813 adult noncritical inpatients with T2D, with an index admission between June 1, 2010, and June 30, 2018, were obtained through the Emory Healthcare Clinical Data Warehouse infrastructure program. All patients were admitted to Emory Healthcare hospitals, including Emory University Hospital, Emory University Hospital Midtown, and Emory Saint Joseph’s Hospital, in Atlanta, Georgia. Data were extracted for each patient during the index hospitalization, including demographics, anthropometrics, and admission and inpatient laboratory values. Information was collected on daily point-of-care glucose values, hemoglobin A1c (HbA1c), hypoglycemic events, insulin doses, hospital complications, comorbidities, and hospital setting (medical vs surgical admission). International Classification of Diseases, 9th and 10th Revisions (ICD-9/10) codes were used to determine diagnosis of T2D, comorbidities, and complications.
From our initial dataset, we identified 16,366 patients who were treated with SSI during hospitalization. We excluded patients who were admitted to the intensive care unit (ICU) or placed on intravenous insulin, patients with missing admission BG values, and patients with a length of stay less than 1 day. To prevent inclusion of patients presenting in diabetic ketoacidosis or hyperosmolar hyperglycemic syndrome, we excluded patients with an admission BG >500 mg/dL. We then excluded 6,739 patients who received basal insulin within the first 2 days of hospitalization, as well as 943 patients who were treated with noninsulin (oral or injectable) antidiabetic agents. Our final dataset included 8,095 patients (Appendix Figure).
Patients in the SSI cohort included all patients who were treated with short-acting insulin only (regular insulin or rapid-acting [lispro, aspart, glulisine] insulin analogs) during the first 2 days of hospitalization. Patients who remained on only short-acting insulin during the entire hospitalization were defined as continuous SSI patients. Patients who subsequently received basal insulin after day 2 of hospitalization were defined as patients who transitioned to basal. Patients were stratified according to admission BG levels (first BG available on day of admission) and HbA1c (when available during index admission). We compared the baseline characteristics and clinical outcomes of patients who remained on SSI alone throughout the entirety of hospitalization with those of patients who required transition to basal insulin. The mean hospital BG was calculated by taking the average of all BG measurements during the hospital stay. We defined hypoglycemia as a BG <70 mg/dL and severe hypoglycemia as BG <40 mg/dL. Repeated hypoglycemia values were excluded if they occurred within a period of 2 hours.
Outcome Measures
The primary outcome was the percentage of patients with T2D achieving target glycemic control with SSI therapy, defined as mean hospital BG between 70 and 180 mg/dL without hypoglycemia <70 mg/dL during hospital stay. This threshold was determined based on 2019 ADA recommendations targeting hospital BG <180 mg/dL and avoidance of hypoglycemia.23
Statistical Analysis
Patients were stratified according to continuous SSI versus transitioned to basal treatment. Patients who remained on continuous SSI were further categorized into four categories based on admission BG: <140 mg/dL, 140 to 180 mg/dL, 180 to 250 mg/dL, and ≥250 mg/dL. Clinical characteristics were compared using Wilcoxon rank-sum tests (if continuous) and chi-square tests or Fisher exact tests (if categorical). We then compared the clinical outcomes among continuous SSI patients with different admission BG levels (<140 mg/dL, 140-180 mg/dL, 180-250 mg/dL, and ≥250 mg/dL) and with different HbA1c levels (<7%, 7%-8%, 8%-9%, ≥9%). Within each scenario, logistic regression for the outcome of poor glycemic control, defined as mean hospital BG >180 mg/dL, was performed to evaluate the HbA1c levels and admission BG levels controlling for other factors (age, gender, body mass index [BMI], race, setting [medicine versus surgery] and Charlson Comorbidity Index score). A P value < .05 was regarded as statistically significant. All analyses were performed based on available cases and conducted in SAS version 9.4 (SAS Institute Inc.).
RESULTS
Among 25,813 adult patients with T2D, 8,095 patients (31.4%) were treated with SSI alone during the first 2 days of hospitalization. Of those patients treated with SSI, 6,903 (85%) remained on continuous SSI alone during the entire hospitalization, and 1,192 (15%) were transitioned to basal insulin. The clinical characteristics of these patients on continuous SSI and those who transitioned to basal insulin are shown in Table 1. Patients who transitioned to basal insulin had significantly higher mean (SD) admission BG (191.8 [88.2] mg/dL vs 156.4 [65.4] mg/dL, P < .001) and higher mean (SD) HbA1c (8.1% [2.0%] vs 7.01% [1.5%], P < .001), compared with those who remained on continuous SSI. Patients who transitioned to basal insulin were also younger and more likely to have chronic kidney disease (CKD), but less likely to have congestive heart failure, coronary artery disease, or chronic obstructive pulmonary disease (COPD). The Charlson Comorbidity Index score was significantly higher for patients who transitioned to basal (4.4 [2.5]) than for those who remained on continuous SSI (4.1 [2.5], P < .001). There were no significant differences among sex, BMI, or glomerular filtration rate (GFR) on admission. Of those transitioned to basal insulin, 53% achieved a mean hospitalization BG <180 mg/dL, compared with 82% of those on continuous SSI. The overall rate of hypoglycemia in the continuous SSI group was 8% compared with 18% in those transitioned to basal insulin.
Of the patients who remained on continuous SSI throughout the hospitalization, 3,319 patients (48%) had admission BG <140 mg/dL, 1,671 patients (24%) had admission BG 140 to 180 mg/dL, and 1,913 patients (28%) had admission BG >180 mg/dL. Only 9% of patients who remained on continuous SSI had admission BG ≥250 mg/dL. Patients with admission BG <140 mg/dL were older, had lower BMI and HbA1c, had higher rates of COPD and CKD, and were more likely to be admitted to a surgical service compared with patients with admission BG >140 mg/dL (P < .05 for all; Table 2).
Hospital glycemic control for patients on continuous SSI according to admission BG is displayed in Table 3. Among patients who remained on continuous SSI, 96% of patients with admission BG <140 mg/dL had a mean hospital BG <180 mg/dL; of them, 86% achieved target control without hypoglycemia. Similar rates of target control were achieved in patients with admission BG 140 to 180 mg/dL (83%), in contrast to patients with admission BG ≥250 mg/dL, of whom only 18% achieved target control (P < .001). These findings parallel those seen in patients transitioned to basal insulin. Of patients in the transition group admitted with BG <140 mg/dL and <180 mg/dL, 88.5% and 84.6% had mean hospital BG <180 mg/dL, respectively, while 69.1% and 68.9% had mean BG between 70 and 180 mg/dL without hypoglycemia. The overall frequency of hypoglycemia <70 mg/dL among patients on continuous SSI was 8% and was more common in patients with admission BG <140 mg/dL (10%) compared with patients with higher admission glucose levels (BG 140-180 mg/dL [4%], 180-250 mg/dL [4%], or ≥250 mg/dL [6%], P < .001). There was no difference in rates of severe hypoglycemia <40 mg/dL among groups.
HbA1c data were available for 2,560 of the patients on continuous SSI (Table 3). Mean hospital BG increased significantly with increasing HbA1c values. Patients admitted with HbA1c <7% had lower mean (SD) hospital BG (132.2 [28.2] mg/dL) and were more likely to achieve target glucose control during hospitalization (85%) compared with those with HbA1c 7% to 8% (mean BG, 148.7 [30.8] mg/dL; 80% target control), HbA1c 8% to 9% (mean BG, 169.1 [37.9] mg/dL; 61% target control), or HbA1c ≥9% (mean BG, 194.9 [53.4] mg/dL; 38% target control) (P < .001).
In a logistic regression analysis adjusted for age, gender, BMI, race, setting (medicine vs surgery), and Charlson Comorbidity Index score, the odds of poor glycemic control increased with higher admission BG (admission BG 140-180 mg/dL: odds ratio [OR], 1.8; 95% CI, 1.5-2.2; admission BG 180-250 mg/dL: OR, 3.7; 95% CI, 3.1-4.4; admission BG ≥250 mg/dL: OR, 7.2; 95% CI, 5.8-9.0; reference admission BG <140 mg/dL; Figure). Similarly, the logistic regression analysis showed greater odds of poor in-hospital glycemic control with increasing HbA1c (OR, 6.1; 95% CI, 4.3-8.8 for HbA1c >9% compared with HbA1c <7%).
DISCUSSION
This large retrospective cohort study examined the effectiveness of SSI for glycemic control in noncritical inpatients with T2D. Our results indicate that SSI is still widely used in our hospital system, with 31.4% of our initial cohort managed with SSI alone. We found that 86% of patients with BG <140 mg/dL and 83% of patients with BG 140 to 180 mg/dL achieved glycemic control without hypoglycemia when managed with SSI alone, compared with 53% of those admitted with BG 180 to 250 mg/dL and only 18% of those with admission BG ≥250 mg/dL. This high success rate of achieving optimal BG control with SSI alone is comparable to that seen with transition to basal insulin and may explain the prevalent use of SSI for the management of patients with T2D and mild to moderate hyperglycemia.
Published clinical guideline recommendations promoting the use of basal-bolus insulin treatment algorithms are based on the results of a few RCTs that compared the efficacy of SSI vs a basal-bolus insulin regimen. These studies reported significantly lower mean daily BG concentration with basal or basal-bolus insulin therapy compared with SSI.10,11,24 However, it is interesting to note that the mean admission BG of patients treated with SSI in these RCTs ranged from 184 to 225 mg/dL. Patients in these trials were excluded if admission BG was <140 mg/dL.10,11,24 This is in contrast to our study evaluating real-world data in non–critically ill settings in which we found that 48% of patients treated with SSI had admission BG <140 mg/dL, and nearly 75% had admission BG <180 mg/dL. This suggests that by nature of study design, most RCTs excluded the population of patients who do achieve good glycemic control with SSI and may have contributed to the perception that basal insulin is preferable in all populations.
Our analysis indicates that healthcare professionals should consider admission BG when selecting the type of insulin regimen to manage patients with T2D in the hospital. Our results suggest that SSI may be appropriate for many patients with admission BG <180 mg/dL and should be avoided as monotherapy in patients with admission BG ≥180 mg/dL, as the proportion of patients achieving target control decreased with increasing admission BG. More importantly, if a patient is not controlled with SSI alone, intensification of therapy with the addition of basal insulin is indicated to achieve glycemic control. In addition, we found that the admission HbA1c is an appropriate marker to consider as well, with hospital glycemic control deteriorating with increasing HbA1c values, paralleling the admission BG. The main limitation to widespread use of HbA1c for therapeutic decision-making is access to values at time of patient admission; in our population, only 37% of patients had an HbA1c value available during the index hospitalization.
Previous publications have reported that hypoglycemia carries significant safety concerns, especially among a hospitalized population.25-27 As such, we included hypoglycemia as an important metric in our definition of target glycemic control rather than simply using mean hospital BG or number of hyperglycemic events to define treatment effectiveness. We did find a higher rate of hypoglycemia in patients with moderate admission BG treated with SSI compared with those with higher admission BG; however, few patients overall experienced clinically significant (<54 mg/dL) or severe (<40 mg/dL) hypoglycemia.
In our population, only 15% of patients started on SSI received additional basal insulin during hospitalization. This finding is similar to data reported in the Rabbit 2 trial, in which 14% of patients failed SSI alone, with a higher failure rate among those with higher BG on admission.10 Given the observational nature of this study, we cannot definitively state why certain patients in our population required additional basal insulin, but we can hypothesize that these patients admitted with BG ≥180 mg/dL had higher treatment failure rates and greater rates of hyperglycemia, therefore receiving intensified insulin therapy as clinically indicated at the discretion of the treating physician. Patients who transitioned from SSI to basal insulin had significantly higher admission BG and HbA1c compared with patients who remained on SSI alone. We noted that the rates of hypoglycemia were higher in the group that transitioned to basal (18% vs 8%) and similar to rates reported in previous RCTs.11,24
This observational study takes advantage of a large, diverse study population and a combination of medicine and surgery patients in a real-world setting. We acknowledge several limitations in our study. Our primary data were observational in nature, and as such, some baseline patient characteristics were notably different between groups, suggesting selection bias for treatment allocation to SSI. We do not know which patients were managed by primary teams compared with specialized diabetes consult services, which may also influence treatment regimens. We did not have access to information about patients’ at-home diabetes medication regimens or duration of diabetes, both of which have been shown in prior publications to affect an individual’s overall hospital glycemic control. Data on HbA1c values were available for only approximately one-third of patients. In addition, our study did not include patients without a history of diabetes who developed stress-induced hyperglycemia, a population that may benefit from conservative therapy such as SSI.28 A diagnosis of CKD was defined based on ICD 9/10 codes and not on admission estimated GFR. More specific data regarding stage of CKD or changes in renal function over the duration of hospitalization are not available, which could influence insulin prescribing practice. In addition, we defined the basal group as patients prescribed any form of basal insulin (NPH, glargine, detemir or degludec), and we do not have information on the use of prandial versus correction doses of rapid-acting insulin in the basal insulin–treated group.
CONCLUSION
In conclusion, our observational study indicates that the use of SSI results in appropriate target glycemic control for most noncritical medicine and surgery patients with admission BG <180 mg/dL. In agreement with previous RCTs, our study confirms that SSI as monotherapy is frequently inadequate in patients with significant hyperglycemia >180 mg/dL.10,11,24,29 We propose that an individualized approach to inpatient glycemic management is imperative, and cautious use of SSI may be a viable option for certain patients with mild hyperglycemia and admission BG <180 mg/dL. Further observational and randomized studies are needed to confirm the efficacy of SSI therapy in T2D patients with mild hyperglycemia. By identifying which subset of patients can be safely managed with SSI alone, we can better understand which patients will require escalation of therapy with intensive glucose management.
1. Umpierrez GE, Palacio A, Smiley D. Sliding scale insulin use: myth or insanity? Am J Med. 2007;120(7):563-567. https://doi.org/10.1016/j.amjmed.2006.05.070
2. Kitabchi AE, Ayyagari V, Guerra SM. The efficacy of low-dose versus conventional therapy of insulin for treatment of diabetic ketoacidosis. Ann Intern Med. 1976;84(6):633-638. https://doi.org/10.7326/0003-4819-84-6-633
3. Skyler JS, Skyler DL, Seigler DE, O’Sullivan MJ. Algorithms for adjustment of insulin dosage by patients who monitor blood glucose. Diabetes Care. 1981;4(2):311-318. https://doi.org/10.2337/diacare.4.2.311
4. Gearhart JG, Duncan JL 3rd, Replogle WH, Forbes RC, Walley EJ. Efficacy of sliding-scale insulin therapy: a comparison with prospective regimens. Fam Pract Res J. 1994;14(4):313-322.
5. Queale WS, Seidler AJ, Brancati FL. Glycemic control and sliding scale insulin use in medical inpatients with diabetes mellitus. Arch Intern Med. 1997;157(5):545-552.
6. Clement S, Braithwaite SS, Magee MF, et al. Management of diabetes and hyperglycemia in hospitals. Diabetes Care. 2004;27(2):553-591. https://doi.org/10.2337/diacare.27.2.553
7. Garber AJ, Moghissi ES, Bransome ED Jr, et al. American College of Endocrinology position statement on inpatient diabetes and metabolic control. Endocr Pract. 2004;10(1):78-82. https://doi.org/10.4158/EP.10.1.77
8. American Diabetes Association. Standards of medical care in diabetes. Diabetes Care. 2005;28(suppl 1):S4-S36.
9. Umpierrez GE, Hellman R, Korytkowski MT, , et al. Management of hyperglycemia in hospitalized patients in non-critical care setting: an Endocrine Society clinical practice guideline. J Clin Endocrinol Metab. 2012;97(1):16-38. https://doi.org/10.1210/jc.2011-2098
10. Umpierrez GE, Smiley D, Zisman A, et al. Randomized study of basal-bolus insulin therapy in the inpatient management of patients with type 2 diabetes. Diabetes Care. 2007;30(9):2181-2186. https://doi.org/10.2337/dc07-0295
11. Umpierrez GE, Smiley D, Jacobs S, et al. Randomized study of basal-bolus insulin therapy in the inpatient management of patients with type 2 diabetes undergoing general surgery (RABBIT 2 surgery). Diabetes Care. 2011;34(2):256-261. https://doi.org/10.2337/dc10-1407
12. Schroeder JE, Liebergall M, Raz I, Egleston R, Ben Sussan G, Peyser A. Benefits of a simple glycaemic protocol in an orthopaedic surgery ward: a randomized prospective study. Diabetes Metab Res Rev. 2012;28:71-75. https://doi.org/10.1002/dmrr.1217
13. Lee YY, Lin YM, Leu WJ, et al. Sliding-scale insulin used for blood glucose control: a meta-analysis of randomized controlled trials. Metabolism. 2015;64(9):1183-1192. https://doi.org/10.1016/j.metabol.2015.05.011
14. Christensen MB, Gotfredsen A, Nørgaard K. Efficacy of basal-bolus insulin regimens in the inpatient management of non-critically ill patients with type 2 diabetes: a systematic review and meta-analysis. Diabetes Metab Res Rev. 2017;33(5):e2885. https://doi.org/10.1002/dmrr.2885
15. Wexler DJ, Meigs JB, Cagliero E, Nathan DM, Grant RW. Prevalence of hyper- and hypoglycemia among inpatients with diabetes: a national survey of 44 U.S. hospitals. Diabetes Care. 2007;30(2):367-369. https://doi.org/10.2337/dc06-1715
16. Moreira ED Jr, Silveira PCB, Neves RCS, Souza C Jr, Nunes ZO, Almeida MdCC. Glycemic control and diabetes management in hospitalized patients in Brazil. Diabetol Metab Syndr. 2013;5(1):62. https://doi.org/10.1186/1758-5996-5-62
17. Akhtar ST, Mahmood K, Naqvi IH, Vaswani AS. Inpatient management of type 2 diabetes mellitus: does choice of insulin regimen really matter? Pakistan J Med Sci. 2014;30(4):895-898.
18. Gómez Cuervo C, Sánchez Morla A, Pérez-Jacoiste Asín MA, Bisbal Pardo O, Pérez Ordoño L, Vila Santos J. Effective adverse event reduction with bolus-basal versus sliding scale insulin therapy in patients with diabetes during conventional hospitalization: systematic review and meta-analysis. Endocrinol Nutr. 2016;63(4):145-156. https://doi.org/10.1016/j.endonu.2015.11.008
19. Bain A, Hasan SS, Babar ZUD. Interventions to improve insulin prescribing practice for people with diabetes in hospital: a systematic review. Diabet Med. 2019;36(8):948-960. https://doi.org/10.1111/dme.13982
20. Ambrus DB, O’Connor MJ. Things We Do For No Reason: sliding-scale insulin as monotherapy for glycemic control in hospitalized patients. J Hosp Med. 2019;14(2):114-116. https://doi.org/10.12788/jhm.3109
21. Nau KC, Lorenzetti RC, Cucuzzella M, Devine T, Kline J. Glycemic control in hospitalized patients not in intensive care: beyond sliding-scale insulin. Am Fam Physician. 2010;81(9):1130-1135.
22. Colunga-Lozano LE, Gonzalez Torres FJ, Delgado-Figueroa N, et al. Sliding scale insulin for non-critically ill hospitalised adults with diabetes mellitus. Cochrane Database Syst Rev. 2018;11(11):CD011296. https://doi.org/10.1002/14651858.CD011296.pub2
23. American Diabetes Association. Diabetes care in the hospital: Standards of Medical Care in Diabetes—2019. Diabetes Care. 2019;42(suppl 1):S173-S181. https://doi.org/10.2337/dc19-S015
24. Umpierrez GE, Smiley D, Hermayer K, et al. Randomized study comparing a basal-bolus with a basal plus correction management of medical and surgical patients with type 2 diabetes: basal plus trial. Diabetes Care. 2013;36(8):2169-2174. https://doi.org/10.2337/dc12-1988
25. Turchin A, Matheny ME, Shubina M, Scanlon SV, Greenwood B, Pendergrass ML. Hypoglycemia and clinical outcomes in patients with diabetes hospitalized in the general ward. Diabetes Care. 2009;32(7):1153-1157. https://doi.org/10.2337/dc08-2127
26. Garg R, Hurwitz S, Turchin A, Trivedi A. Hypoglycemia, with or without insulin therapy, is associated with increased mortality among hospitalized patients. Diabetes Care. 2013;36(5):1107-1110. https://doi.org/10.2337/dc12-1296
27. Zapatero A, Gómez-Huelgas R, González N, et al. Frequency of hypoglycemia and its impact on length of stay, mortality, and short-term readmission in patients with diabetes hospitalized in internal medicine wards. Endocr Pract. 2014;20(9):870-875. https://doi.org/10.4158/EP14006.OR
28. Umpierrez GE, Isaacs SD, Bazargan N, You X, Thaler LM, Kitabchi AE. Hyperglycemia: an independent marker of in-hospital mortality in patients with undiagnosed diabetes. J Clin Endocrinol Metab. 2002;87(3):978-982. https://doi.org/10.1210/jcem.87.3.8341
29. Dickerson LM, Ye X, Sack JL, Hueston WJ. Glycemic control in medical inpatients with type 2 diabetes mellitus receiving sliding scale insulin regimens versus routine diabetes medications: a multicenter randomized controlled trial. Ann Fam Med. 2003;1(1):29-35. https://doi.org/10.1370/afm.2
© 2021 Society of Hospital Medicine