User login
‘Striking’ differences in BP when wrong cuff size is used
Strong new evidence on the need to use an appropriately sized cuff in blood pressure measurement has come from the cross-sectional randomized trial Cuff(SZ).
The study found that in people in whom a small adult cuff was appropriate, systolic BP readings were on average 3.6 mm Hg lower when a regular adult size cuff was used.
However, systolic readings were on average 4.8 mm Hg higher when a regular cuff was used in people who required a large adult cuff and 19.5 mm Hg higher in those needing an extra-large cuff based on their mid-arm circumference.
The diastolic readings followed a similar pattern (-1.3 mm Hg, 1.8 mm Hg, and 7.4 mm Hg, respectively).
“We found that using the regular adult cuff in all individuals had striking differences in blood pressure,” lead author Tammy M. Brady, MD, PhD, Johns Hopkins University School of Medicine, Baltimore, told this news organization. “And that has a lot of clinical implications.”

She noted, for example, that people who required an extra-large cuff and were measured with a regular cuff had an average BP of 144/86.7 mm Hg, which is in the stage 2 hypertension range. But when the correct size cuff was used, the average BP was 124.5/79.3 mm Hg, or in the prehypertensive range.
Overall, the overestimation of BP due to using too small a cuff misclassified 39% of people as being hypertensive, while the underestimation of BP due to using a cuff that was too large missed 22% of people with hypertension.
“So, I think clinicians really need to have a renewed emphasis on cuff size, especially in populations where obesity is highly prevalent and many of their patients require extra-large cuffs, because those are the populations that are most impacted by mis-cuffing,” Dr. Brady said.
The findings were presented in an E-poster at the Epidemiology and Prevention/Lifestyle and Cardiometabolic Health (EPI/Lifestyle) 2022 conference sponsored by the American Heart Association.
Willie Lawrence, MD, chair of the AHA’s National Hypertension Control Initiative Advisory Committee, said in an interview that the magnitude of inaccuracy observed by the researchers “makes this a very, very important study.”
“Is it the first of its kind, no, but it’s incredibly important because it was so well done, and it comes at a time when people are once again dealing with issues around equity, and this study can have a significant impact on the state of hypertension in diverse communities,” said Dr. Lawrence, a cardiologist with Spectrum Health Lakeland, Benton Harbor, Michigan.
Previous studies examining the issue were older, had few participants, and used mercury sphygmomanometers instead of automated devices, which are typically recommended by professional societies for screening hypertension in adults, Dr. Brady explained.
For the Cuff Size Blood Pressure Measurement trial, 195 adults recruited from the community underwent 2 to 3 sets of 3 BP readings, 30 seconds apart, with an automated and validated device (Welch Allyn ProB 2000) using a BP cuff that was appropriated sized, one size lower, and one size higher. The order of cuff sizes was randomized. Before each set, patients walked for 2 minutes, followed by 5 minutes of rest to eliminate the potential effect of longer resting periods between tests on the results. The room was also kept quiet and participants were asked not to speak or use a smart phone.
Participants had a mean age of 54 years, 34% were male, 68% were Black, and 36% had a body mass index of at least 30 kg/m2, meeting the criteria for obesity.
Roughly one-half had a self-reported hypertension diagnosis, 31% had a systolic BP of 130 mm Hg or greater, and 26% had a diastolic BP of 80 mm Hg or greater.
Based on arm circumference (mean, 34 cm), the appropriate adult cuff size was small (20-25 cm) in 18%, regular (25.1-32 cm) in 28%, large (32.1-40 cm) in 34%, and extra-large (40.1-55 cm) in 21%.
Dr. Brady pointed out that the most recent hypertension guidelines detail sources of inaccuracy in BP measurement and say that if too small a cuff size is used, the blood pressure could be different by 2 to 11 mm Hg. “And what we show, is it can be anywhere from 5 to 20 mm Hg. So, I think that’s a significant difference from what studies have shown so far and is going to be very surprising to clinicians.”
A 2019 AHA scientific statement on the measurement of blood pressure stresses the importance of cuff size, and last year, the American Medical Association launched a new initiative to standardize training in BP measurement for future physicians and health care professionals.
Previous work also showed that children as young as 3 to 5 years of age often require an adult cuff size, and those in the 12- to 15-year age group may need an extra-large cuff, or what is often referred to as a thigh cuff, said Dr. Brady, who is also the medical director of the pediatric hypertension program at Johns Hopkins Children’s Center.
“Part of the problem is that many physicians aren’t often the one doing the measurement and that others may not be as in tune with some of these data and initiatives,” she said.
Other barriers are cost and availability. Offices and clinics don’t routinely stock multiple cuff sizes in exam rooms, and devices sold over the counter typically come with a regular adult cuff, Dr. Brady said. An extra cuff could add $25 to $50 on top of the $25 to $50 for the device for the growing number of patients measuring BP remotely.
“During the pandemic, I was trying to do telemedicine with my hypertensive patients, but the children who had significant obesity couldn’t afford or find blood pressure devices that had a cuff that was big enough for them,” she said. “It just wasn’t something that they could get. So I think people just don’t recognize how important this is.”
A version of this article first appeared on Medscape.com.
Strong new evidence on the need to use an appropriately sized cuff in blood pressure measurement has come from the cross-sectional randomized trial Cuff(SZ).
The study found that in people in whom a small adult cuff was appropriate, systolic BP readings were on average 3.6 mm Hg lower when a regular adult size cuff was used.
However, systolic readings were on average 4.8 mm Hg higher when a regular cuff was used in people who required a large adult cuff and 19.5 mm Hg higher in those needing an extra-large cuff based on their mid-arm circumference.
The diastolic readings followed a similar pattern (-1.3 mm Hg, 1.8 mm Hg, and 7.4 mm Hg, respectively).
“We found that using the regular adult cuff in all individuals had striking differences in blood pressure,” lead author Tammy M. Brady, MD, PhD, Johns Hopkins University School of Medicine, Baltimore, told this news organization. “And that has a lot of clinical implications.”
She noted, for example, that people who required an extra-large cuff and were measured with a regular cuff had an average BP of 144/86.7 mm Hg, which is in the stage 2 hypertension range. But when the correct size cuff was used, the average BP was 124.5/79.3 mm Hg, or in the prehypertensive range.
Overall, the overestimation of BP due to using too small a cuff misclassified 39% of people as being hypertensive, while the underestimation of BP due to using a cuff that was too large missed 22% of people with hypertension.
“So, I think clinicians really need to have a renewed emphasis on cuff size, especially in populations where obesity is highly prevalent and many of their patients require extra-large cuffs, because those are the populations that are most impacted by mis-cuffing,” Dr. Brady said.
The findings were presented in an E-poster at the Epidemiology and Prevention/Lifestyle and Cardiometabolic Health (EPI/Lifestyle) 2022 conference sponsored by the American Heart Association.
Willie Lawrence, MD, chair of the AHA’s National Hypertension Control Initiative Advisory Committee, said in an interview that the magnitude of inaccuracy observed by the researchers “makes this a very, very important study.”
“Is it the first of its kind, no, but it’s incredibly important because it was so well done, and it comes at a time when people are once again dealing with issues around equity, and this study can have a significant impact on the state of hypertension in diverse communities,” said Dr. Lawrence, a cardiologist with Spectrum Health Lakeland, Benton Harbor, Michigan.
Previous studies examining the issue were older, had few participants, and used mercury sphygmomanometers instead of automated devices, which are typically recommended by professional societies for screening hypertension in adults, Dr. Brady explained.
For the Cuff Size Blood Pressure Measurement trial, 195 adults recruited from the community underwent 2 to 3 sets of 3 BP readings, 30 seconds apart, with an automated and validated device (Welch Allyn ProB 2000) using a BP cuff that was appropriated sized, one size lower, and one size higher. The order of cuff sizes was randomized. Before each set, patients walked for 2 minutes, followed by 5 minutes of rest to eliminate the potential effect of longer resting periods between tests on the results. The room was also kept quiet and participants were asked not to speak or use a smart phone.
Participants had a mean age of 54 years, 34% were male, 68% were Black, and 36% had a body mass index of at least 30 kg/m2, meeting the criteria for obesity.
Roughly one-half had a self-reported hypertension diagnosis, 31% had a systolic BP of 130 mm Hg or greater, and 26% had a diastolic BP of 80 mm Hg or greater.
Based on arm circumference (mean, 34 cm), the appropriate adult cuff size was small (20-25 cm) in 18%, regular (25.1-32 cm) in 28%, large (32.1-40 cm) in 34%, and extra-large (40.1-55 cm) in 21%.
Dr. Brady pointed out that the most recent hypertension guidelines detail sources of inaccuracy in BP measurement and say that if too small a cuff size is used, the blood pressure could be different by 2 to 11 mm Hg. “And what we show, is it can be anywhere from 5 to 20 mm Hg. So, I think that’s a significant difference from what studies have shown so far and is going to be very surprising to clinicians.”
A 2019 AHA scientific statement on the measurement of blood pressure stresses the importance of cuff size, and last year, the American Medical Association launched a new initiative to standardize training in BP measurement for future physicians and health care professionals.
Previous work also showed that children as young as 3 to 5 years of age often require an adult cuff size, and those in the 12- to 15-year age group may need an extra-large cuff, or what is often referred to as a thigh cuff, said Dr. Brady, who is also the medical director of the pediatric hypertension program at Johns Hopkins Children’s Center.
“Part of the problem is that many physicians aren’t often the one doing the measurement and that others may not be as in tune with some of these data and initiatives,” she said.
Other barriers are cost and availability. Offices and clinics don’t routinely stock multiple cuff sizes in exam rooms, and devices sold over the counter typically come with a regular adult cuff, Dr. Brady said. An extra cuff could add $25 to $50 on top of the $25 to $50 for the device for the growing number of patients measuring BP remotely.
“During the pandemic, I was trying to do telemedicine with my hypertensive patients, but the children who had significant obesity couldn’t afford or find blood pressure devices that had a cuff that was big enough for them,” she said. “It just wasn’t something that they could get. So I think people just don’t recognize how important this is.”
A version of this article first appeared on Medscape.com.
How Lp(a) can help improve ASCVD risk assessment
A look back at a pair of large cohort studies suggests a telling relation between two distinct predictors of atherosclerotic cardiovascular disease (ASCVD) risk and may offer guidance on how to interpret them together.
Elevated levels of lipoprotein(a), or Lp(a), and high coronary artery calcium (CAC) scores were both predictive of ASCVD risk over 10 years, but independent of each other and a host of more traditional cardiovascular risk factors, for example, in the analysis of data from the MESA (Multi-Ethnic Study of Atherosclerosis) and DHS (Dallas Heart Study) longitudinal cohorts.
Notably, the risk when both Lp(a) and CAC scores were high far exceeded that associated with either marker alone. But when CAC scores were less than 100 Agatston units, predicted ASCVD risk wasn’t influenced by levels of Lp(a). Indeed, a CAC score of 0 predicted the lowest levels of ASCVD risk, even with elevated Lp(a).
That is, the findings suggest, the addition of Lp(a) makes a difference to the risk assessment only when CAC scores are high, at least 100 units, and elevated Lp(a) doesn’t mean increased ASCVD risk in the absence of coronary calcium.
“Our novel findings indicate that elevated Lp(a) drives ASCVD risk independent of the subclinical coronary atherosclerosis burden captured by CAC score,” concluded a report on the analysis, published in the Journal of the American College of Cardiology, with lead author Anurag Mehta, MD, Emory University, Atlanta.
There are no formal recommendations on how to interpret Lp(a) and CAC scores together, but the current findings “provide impetus for measuring Lp(a) in more individuals as part of the shared decision-making process,” the authors contended.
“Really, the calcium score carries the majority of the information in terms of risk, except in the highest CAC score group. That is, if you have a high Lp(a) and a high burden of calcium, your risk is significantly higher than if you just have the high calcium score and the normal Lp(a),” senior author Parag H. Joshi, MD, MHS, said in an interview.
“We thought we would see that the group with higher Lp(a) would have more events over 10 years, even among those who didn’t have coronary calcium,” said Dr. Joshi, of the University of Texas Southwestern Medical Center, Dallas. “But we really don’t see that, at least in a statistically significant way.”
A CAC score of 0 would at least support a more conservative approach in a patient with elevated Lp(a) “who is hesitant to be on a statin or to be more aggressive managing their risk,” Dr. Joshi said.
“This study should be very reassuring for a patient like that,” Ron Blankstein, MD, director of cardiac computed tomography at Brigham and Women’s Hospital, Boston, said in an interview.
“If you have a high Lp(a) and you’re concerned, I think this study really supports the role of calcium scoring for further risk assessment,” said Dr. Blankstein, who is not associated with the new report. “We often check Lp(a) in individuals who perhaps have a family history or who come to see us in a preventive cardiology clinic. If it is high and there is concern, a calcium score can be very helpful. If it’s zero, that really means a very low risk of events. And if it’s elevated, I think we’re going to be more concerned about that patient.”
The current analysis suggests “that, when a patient without clinical cardiovascular disease is identified with either CAC ≥100 or Lp(a) >50 mg/dL, the next step in the risk evaluation should be to measure either Lp(a) or CAC, respectively – if not already performed – to identify the patients at highest risk,” Sotirios Tsimikas, MD, director of vascular medicine at University of California, San Diego, wrote in an accompanying editorial.
“Both Lp(a) and CAC should be more broadly applied in clinical care settings in patients without prior ASCVD to identify those that most likely will benefit from more aggressive therapy and, in the future, from Lp(a)-lowering therapies,” he wrote.
The analyses were conducted separately on data from 4,512 initially asymptomatic patients in MESA and 2,078 from the DHS cohort, who were followed for ASCVD events an average of 13 years and 11 years, respectively. Such events included coronary heart disease–related death, nonfatal MI, and fatal or nonfatal stroke.
In the MESA cohort – 52% women, 36.8% White, 29.3% Black, 22.2% Hispanic, and 11.7% Chinese – elevated Lp(a) (quintile 5 vs. quintiles 1-4) and CAC scores of 1-99 and above 100 (both compared with 0) were each independently associated with increased risk for ASCVD events. The hazard ratio was 1.29 (P = .02) for elevated Lp(a), 1.68 (P < .01) for a CAC score of 1-99, and 2.66 (P < .01) for a CAC score of at least 100.
The corresponding HRs in the DHS cohort were 1.54 (P = .07) for Lp(a), 3.32 (P < .01) for a CAC score of 1-99, and 5.21 (P < .01) for a CAC score of at least 100.
Of note, the authors wrote, ASCVD risk among MESA participants with a CAC score of 0 was not significantly different in those with normal and elevated Lp(a).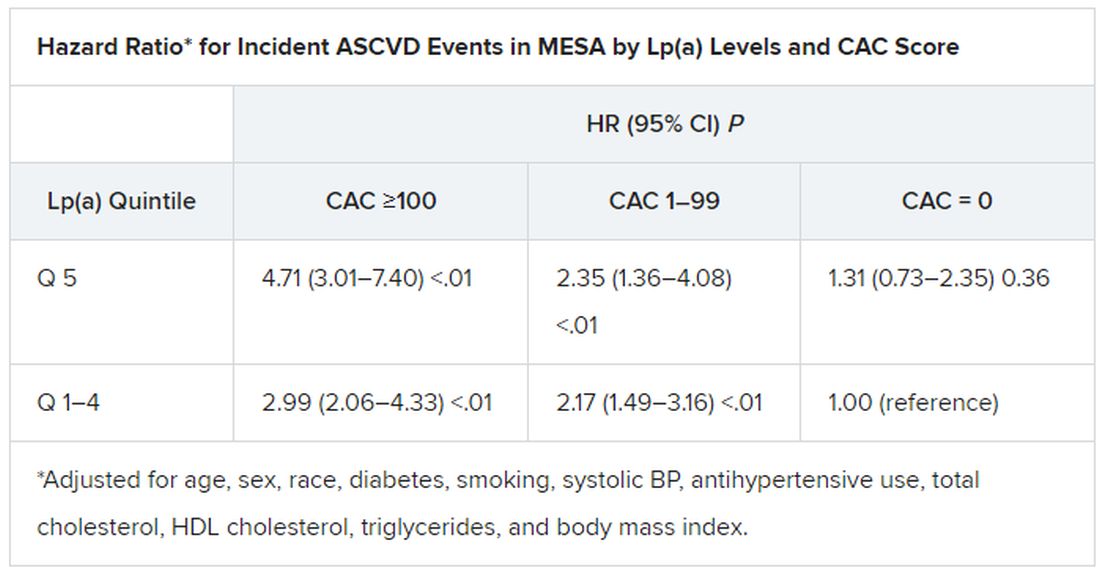
The findings were similar in the corresponding DHS analysis, the authors noted.
When both Lp(a) and CAC scores are considered as dichotomous variables, the highest 10-year ASCVD incidence in MESA was in participants with both elevated Lp(a) (≥50 mg/dL) and a high CAC score (≥100). The lowest risk was seen when Lp(a) was normal (<50 mg/dL) and the CAC score was no more than moderately high (<100).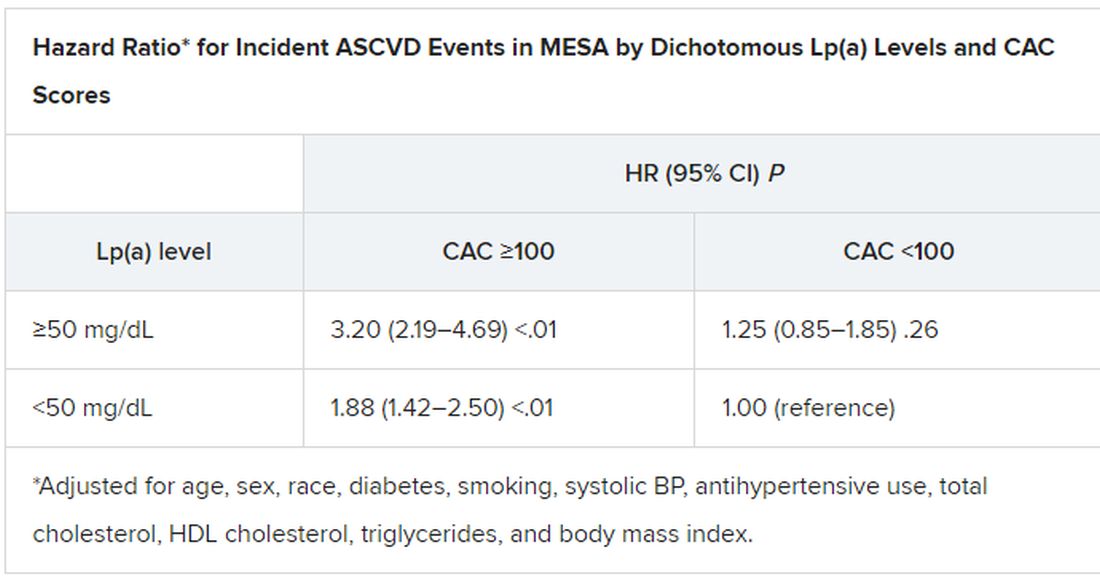
The results in the corresponding DHS analysis, according to the report, again mirrored those from MESA.
“This study has important implications for our patients and also potentially for future clinical trial design,” Dr. Blankstein noted. “A big part of developing a trial in this space is identifying the patients who are at higher risk,” and the current analysis supports CAC scores for identifying the highest-risk patient among those with elevated Lp(a).
Current wisdom is that, for the most part, Lp(a) levels are genetically mediated and are mostly unaffected by interventions such as diet management or exercise. It’s unknown whether reducing elevated Lp(a) levels pharmacologically will cut ASCVD risk, but there are a number of clinical trial programs currently aimed at learning just that. They include the Novartis-sponsored phase 3 HORIZON trial of the antisense agent pelacarsen (TQJ230), with an estimated enrollment of almost 7,700; a randomized, controlled dose-finding study of the small interfering RNA agent olpasiran (AMG890), with 290 patients and funded by Amgen; and an 88-patient phase 1 study of another siRNA agent, SLN360, supported by Silence Therapeutics.
Dr. Mehta reported no relevant relationships. Dr. Joshi has received grant support from Novo Nordisk and consulting income from Bayer and Regeneron; holds equity in G3 Therapeutics; and has served as site investigator for GlaxoSmithKline, Sanofi, AstraZeneca, and Novartis. Dr. Blankstein reported serving as a consultant to Amgen, Novartis, and Silence Therapeutics.
A version of this article first appeared on Medscape.com.
FROM THE JOURNAL OF THE AMERICAN COLLEGE OF CARDIOLOGY
USPSTF releases updated guidance on asymptomatic A-fib
In January 2022, the US Preventive Services Task Force updated its 2018 statement on screening for atrial fibrillation (AF) in older adults (≥ 50 years).1,2 The supporting evidence review sought to include data on newer screening methods, such as automated blood pressure cuffs, pulse oximeters, and consumer-facing devices (eg, smartphone apps). However, ultimately, the recommendation did not change; it remains an “I” statement, meaning the evidence is insufficient to assess the balance of benefits and harms of screening for AF in asymptomatic adults with no signs or symptoms.1,2
Atrial fibrillation and stroke. AF is common, and the prevalence increases with age: from < 0.2% in those younger than 55 years to about 10% for those ages 85 and older.1,2 AF is a strong risk factor for stroke, and when detected, stroke prevention measures—either restoration of normal rhythm or use of anticoagulants—can be implemented as appropriate.
The available evidence for the effectiveness of stroke prevention comes from patients with AF that was detected because of symptoms or pulse palpation during routine care. It is not known if screening asymptomatic adults using electrocardiography, or newer electronic devices that detect irregular heartbeats, achieves these same benefits—and there is the potential for harm from the use of anticoagulants.
How does this compare to other recommendations? The American Heart Association and the American Stroke Association recommend active screening for AF, by pulse assessment, in those ages 65 years and older.3 This does not differ as much as it appears to from the USPSTF statement. The difference is in terminology: The USPSTF considers pulse assessment part of routine care; the other organizations call it “screening.”
What you should—and shouldn’t—do. The USPSTF states that “Clinicians should use their clinical judgement regarding whether to screen and how to screen for AF.” Any patient with signs or symptoms of AF or who is discovered to have an irregular pulse should be assessed for AF. Those found to have AF should be assessed for their risk of stroke and treated accordingly. However, attempting to find “silent” AF in those who do not have an irregular pulse on exam, by way of any screening devices, has no proven benefit.
1. USPSTF; Davidson KW, Barry MJ, Mangione CM, et al. Screening for atrial fibrillation: US Preventive Services Task Force recommendation statement. JAMA. 2022;327:360-365.
2. USPSTF. Screening for atrial fibrillation: final recommendation statement. Published January 25, 2022. Accessed February 2, 2022. https://uspreventiveservicestaskforce.org/uspstf/recommendation/atrial-fibrillation-screening
3. Meschia JF, Bushnell C, Boden-Albala B, et al; American Heart Association Stroke Council; Council on Cardiovascular and Stroke Nursing; Council on Clinical Cardiology; Council on Functional Genomics and Translational Biology; Council on Hypertension. Guidelines for the primary prevention of stroke: a statement for healthcare professionals from the American Heart Association/American Stroke Association. Stroke. 2014;45:3754-3832. doi: 10.1161/STR.0000000000000046
In January 2022, the US Preventive Services Task Force updated its 2018 statement on screening for atrial fibrillation (AF) in older adults (≥ 50 years).1,2 The supporting evidence review sought to include data on newer screening methods, such as automated blood pressure cuffs, pulse oximeters, and consumer-facing devices (eg, smartphone apps). However, ultimately, the recommendation did not change; it remains an “I” statement, meaning the evidence is insufficient to assess the balance of benefits and harms of screening for AF in asymptomatic adults with no signs or symptoms.1,2
Atrial fibrillation and stroke. AF is common, and the prevalence increases with age: from < 0.2% in those younger than 55 years to about 10% for those ages 85 and older.1,2 AF is a strong risk factor for stroke, and when detected, stroke prevention measures—either restoration of normal rhythm or use of anticoagulants—can be implemented as appropriate.
The available evidence for the effectiveness of stroke prevention comes from patients with AF that was detected because of symptoms or pulse palpation during routine care. It is not known if screening asymptomatic adults using electrocardiography, or newer electronic devices that detect irregular heartbeats, achieves these same benefits—and there is the potential for harm from the use of anticoagulants.
How does this compare to other recommendations? The American Heart Association and the American Stroke Association recommend active screening for AF, by pulse assessment, in those ages 65 years and older.3 This does not differ as much as it appears to from the USPSTF statement. The difference is in terminology: The USPSTF considers pulse assessment part of routine care; the other organizations call it “screening.”
What you should—and shouldn’t—do. The USPSTF states that “Clinicians should use their clinical judgement regarding whether to screen and how to screen for AF.” Any patient with signs or symptoms of AF or who is discovered to have an irregular pulse should be assessed for AF. Those found to have AF should be assessed for their risk of stroke and treated accordingly. However, attempting to find “silent” AF in those who do not have an irregular pulse on exam, by way of any screening devices, has no proven benefit.
1. USPSTF; Davidson KW, Barry MJ, Mangione CM, et al. Screening for atrial fibrillation: US Preventive Services Task Force recommendation statement. JAMA. 2022;327:360-365.
2. USPSTF. Screening for atrial fibrillation: final recommendation statement. Published January 25, 2022. Accessed February 2, 2022. https://uspreventiveservicestaskforce.org/uspstf/recommendation/atrial-fibrillation-screening
3. Meschia JF, Bushnell C, Boden-Albala B, et al; American Heart Association Stroke Council; Council on Cardiovascular and Stroke Nursing; Council on Clinical Cardiology; Council on Functional Genomics and Translational Biology; Council on Hypertension. Guidelines for the primary prevention of stroke: a statement for healthcare professionals from the American Heart Association/American Stroke Association. Stroke. 2014;45:3754-3832. doi: 10.1161/STR.0000000000000046

What is the healthiest salt for you?
When we refer to “regular table salt,” it is most commonly in the form of sodium chloride, which is also a major constituent of packaged and ultraprocessed foods.
The best approach to finding the “healthiest salt” – which really means the lowest in sodium – is to look for the amount on the label. “Sodium-free” usually indicates less than 5 mg of sodium per serving, and “low-sodium” usually means 140 mg or less per serving. In contrast, regular table salt can contain as much as 560 mg of sodium in one serving.
Other en vogue salts, such as pink Himalayan salt, sea salt, and kosher salt, are high in sodium content – like regular table salt – but because of their larger crystal size, less sodium is delivered per serving.

Most salt substitutes are reduced in sodium, with the addition of potassium chloride instead.
FDA issues guidance on reducing salt
Currently, the U.S. sodium dietary guidelines for persons older than 14 stipulate 2,300 mg/d, which is equivalent to 1 teaspoon a day. However it is estimated that the average person in the United States consumes more than this – around 3,400 mg of sodium daily.
In October 2021, the U.S. Food and Drug Administration published guidance on voluntary sodium limitations in commercially processed, packaged, and prepared food. The FDA’s short-term approach is to slowly reduce exposure to sodium in processed and restaurant food by 2025, on the basis that people will eventually get used to less salt, as has happened in the United Kingdom and other countries.
Such strategies to reduce salt intake are now being used in national programs in several countries. Many of these successful initiatives include active engagement with the food industry to reduce the amount of sodium added to processed food, as well as public awareness campaigns to alert consumers to the dangers of eating too much salt. This includes increasing potassium in manufactured foods, primarily to target hypertension and heart disease, as described by Clare Farrand, MSc, BSc, and colleagues, in the Journal of Clinical Hypertension. The authors also make several recommendations regarding salt reduction policies:
- Food manufacturers should gradually reduce sodium in food to the lowest possible levels and explore the use of potassium-based sodium replacers to reduce sodium levels even further.
- Governments should continue to monitor sodium and potassium levels in processed foods.
- Further consideration may need to be given to how best to label salt substitutes (namely potassium) in processed foods to ensure that people who may be adversely affected are aware.
- Governments should systematically monitor potassium intake at the population level, including for specific susceptible groups.
- Governments should continue to systematically monitor sodium (salt) intake and iodine intake at the population level to adjust salt iodization over time as necessary, depending on observed salt intake in specific targeted groups, to ensure that they have sufficient but not excessive iodine intakes as salt intakes are reduced.
- Governments should consider opportunities for promoting and subsidizing salt substitutes, particularly in countries where salt added during cooking or at the table is the major source of salt in the diet.
The new FDA document includes 163 subcategories of foods in its voluntary salt reduction strategy.
Salt substitutes, high blood pressure, and mortality
Lowering sodium intake is almost certainly beneficial for persons with high blood pressure. In 2020, a review in Hypertension highlighted the benefit of salt substitutes in reducing hypertension, reporting that they lower systolic blood pressure by 5.58 mm Hg and diastolic blood pressure by 2.88 mm Hg.
And changes to dietary sodium intake can potentially reduce or obviate the need for medications for essential hypertension in some individuals. Although there are only a few studies on this topic, a study by Bruce Neal, MB, ChB, PhD, and colleagues, revealed a reduction in stroke, cardiovascular events, and deaths with the use of potassium-based salt substitutes.
Salt substitutes and sodium and potassium handling in the kidneys
Many studies have shown that potassium-rich salt substitutes are safe in individuals with normal kidney function, but are they safe and beneficial for people with chronic kidney disease (CKD)?
For anyone who is on a renal diet, potassium and sodium intake goals are limited according to their absolute level of kidney function.
There have been case reports of life-threatening blood potassium levels (hyperkalemia) due to potassium-rich salt substitutes in people with CKD, but no larger published studies on this topic can be found.
A diet modeling study by Rebecca Morrison and colleagues evaluated varying degrees of potassium-enriched salt substituted bread products and their impact on dietary intake in persons with CKD. They used dietary data from the National Nutrition and Physical Activity Survey 2011-2012 in Australia for 12,152 participants, 154 of whom had CKD. Replacing the sodium in bread with varying amounts of potassium chloride (20%, 30%, and 40%) would result in one-third of people with CKD exceeding the safe limits for dietary potassium consumption (31.8%, 32.6%, and 33%, respectively), they found.
“Potassium chloride substitution in staple foods such as bread and bread products have serious and potentially fatal consequences for people who need to restrict dietary potassium. Improved food labelling is required for consumers to avoid excessive consumption,” Ms. Morrison and colleagues concluded. They added that more studies are needed to further understand the risks of potassium dietary intake and hyperkalemia in CKD from potassium-based salt substitutes.
The American Heart Association recommends no more than 1,500 mg of sodium intake daily for persons with CKD, diabetes, or high blood pressure; those older than 51; and African American persons of any age.
The recommended daily intake of potassium in persons with CKD can range from 2,000 mg to 4,000 mg, depending on the individual and their degree of CKD. The potassium content in some salt substitutes varies from 440 mg to 2,800 mg per teaspoon.
The best recommendation for individuals with CKD and a goal to reduce their sodium intake is to use herbs and lower-sodium seasonings as a substitute, but these should always be reviewed with their physician and renal nutritionist.
Dr. Brookins is a board-certified nephrologist and internist practicing in Georgia. She is the founder and owner of Remote Renal Care, a telehealth kidney practice. She reported no relevant conflicts of interest.
A version of this article first appeared on Medscape.com.
When we refer to “regular table salt,” it is most commonly in the form of sodium chloride, which is also a major constituent of packaged and ultraprocessed foods.
The best approach to finding the “healthiest salt” – which really means the lowest in sodium – is to look for the amount on the label. “Sodium-free” usually indicates less than 5 mg of sodium per serving, and “low-sodium” usually means 140 mg or less per serving. In contrast, regular table salt can contain as much as 560 mg of sodium in one serving.
Other en vogue salts, such as pink Himalayan salt, sea salt, and kosher salt, are high in sodium content – like regular table salt – but because of their larger crystal size, less sodium is delivered per serving.
Most salt substitutes are reduced in sodium, with the addition of potassium chloride instead.
FDA issues guidance on reducing salt
Currently, the U.S. sodium dietary guidelines for persons older than 14 stipulate 2,300 mg/d, which is equivalent to 1 teaspoon a day. However it is estimated that the average person in the United States consumes more than this – around 3,400 mg of sodium daily.
In October 2021, the U.S. Food and Drug Administration published guidance on voluntary sodium limitations in commercially processed, packaged, and prepared food. The FDA’s short-term approach is to slowly reduce exposure to sodium in processed and restaurant food by 2025, on the basis that people will eventually get used to less salt, as has happened in the United Kingdom and other countries.
Such strategies to reduce salt intake are now being used in national programs in several countries. Many of these successful initiatives include active engagement with the food industry to reduce the amount of sodium added to processed food, as well as public awareness campaigns to alert consumers to the dangers of eating too much salt. This includes increasing potassium in manufactured foods, primarily to target hypertension and heart disease, as described by Clare Farrand, MSc, BSc, and colleagues, in the Journal of Clinical Hypertension. The authors also make several recommendations regarding salt reduction policies:
- Food manufacturers should gradually reduce sodium in food to the lowest possible levels and explore the use of potassium-based sodium replacers to reduce sodium levels even further.
- Governments should continue to monitor sodium and potassium levels in processed foods.
- Further consideration may need to be given to how best to label salt substitutes (namely potassium) in processed foods to ensure that people who may be adversely affected are aware.
- Governments should systematically monitor potassium intake at the population level, including for specific susceptible groups.
- Governments should continue to systematically monitor sodium (salt) intake and iodine intake at the population level to adjust salt iodization over time as necessary, depending on observed salt intake in specific targeted groups, to ensure that they have sufficient but not excessive iodine intakes as salt intakes are reduced.
- Governments should consider opportunities for promoting and subsidizing salt substitutes, particularly in countries where salt added during cooking or at the table is the major source of salt in the diet.
The new FDA document includes 163 subcategories of foods in its voluntary salt reduction strategy.
Salt substitutes, high blood pressure, and mortality
Lowering sodium intake is almost certainly beneficial for persons with high blood pressure. In 2020, a review in Hypertension highlighted the benefit of salt substitutes in reducing hypertension, reporting that they lower systolic blood pressure by 5.58 mm Hg and diastolic blood pressure by 2.88 mm Hg.
And changes to dietary sodium intake can potentially reduce or obviate the need for medications for essential hypertension in some individuals. Although there are only a few studies on this topic, a study by Bruce Neal, MB, ChB, PhD, and colleagues, revealed a reduction in stroke, cardiovascular events, and deaths with the use of potassium-based salt substitutes.
Salt substitutes and sodium and potassium handling in the kidneys
Many studies have shown that potassium-rich salt substitutes are safe in individuals with normal kidney function, but are they safe and beneficial for people with chronic kidney disease (CKD)?
For anyone who is on a renal diet, potassium and sodium intake goals are limited according to their absolute level of kidney function.
There have been case reports of life-threatening blood potassium levels (hyperkalemia) due to potassium-rich salt substitutes in people with CKD, but no larger published studies on this topic can be found.
A diet modeling study by Rebecca Morrison and colleagues evaluated varying degrees of potassium-enriched salt substituted bread products and their impact on dietary intake in persons with CKD. They used dietary data from the National Nutrition and Physical Activity Survey 2011-2012 in Australia for 12,152 participants, 154 of whom had CKD. Replacing the sodium in bread with varying amounts of potassium chloride (20%, 30%, and 40%) would result in one-third of people with CKD exceeding the safe limits for dietary potassium consumption (31.8%, 32.6%, and 33%, respectively), they found.
“Potassium chloride substitution in staple foods such as bread and bread products have serious and potentially fatal consequences for people who need to restrict dietary potassium. Improved food labelling is required for consumers to avoid excessive consumption,” Ms. Morrison and colleagues concluded. They added that more studies are needed to further understand the risks of potassium dietary intake and hyperkalemia in CKD from potassium-based salt substitutes.
The American Heart Association recommends no more than 1,500 mg of sodium intake daily for persons with CKD, diabetes, or high blood pressure; those older than 51; and African American persons of any age.
The recommended daily intake of potassium in persons with CKD can range from 2,000 mg to 4,000 mg, depending on the individual and their degree of CKD. The potassium content in some salt substitutes varies from 440 mg to 2,800 mg per teaspoon.
The best recommendation for individuals with CKD and a goal to reduce their sodium intake is to use herbs and lower-sodium seasonings as a substitute, but these should always be reviewed with their physician and renal nutritionist.
Dr. Brookins is a board-certified nephrologist and internist practicing in Georgia. She is the founder and owner of Remote Renal Care, a telehealth kidney practice. She reported no relevant conflicts of interest.
A version of this article first appeared on Medscape.com.
New data explore risk of magnetic interference with implantable devices
Building on several previous reports that the newest models of mobile telephones and other electronics that use magnets pose a threat to the function of defibrillators and other implantable cardiovascular devices, a new study implicates any device that emits a 10-gauss (G) magnetic field more than a couple of inches.
“Beside the devices described in our manuscript, this can be any portable consumer product [with magnets] like electric cigarettes or smart watches,” explained study author Sven Knecht, DSc, a research electrophysiologist associated with the department of cardiology, University Hospital Basel (Switzerland).

In the newly published article, the investigators evaluated earphones, earphone charging cases, and two electronic pens used to draw on electronic tablets. These particular devices are of interest because, like mobile phones, they are of a size and shape to fit in a breast pocket adjacent to where many cardiovascular devices are implanted.
The study joins several previous studies that have shown the same risk, but this study used three-dimensional (3D) mapping of the magnetic field rather than a one-axis sensor, which is a standard adopted by the U.S. Food and Drug Administration, according to the investigators.
3D mapping assessment used
Because of the 3D nature of magnetic fields, 3D mapping serves as a better tool to assess the risk of the magnetic force as the intensity gradient diminishes with distance from the source, the authors contended. The 3D maps used in this study have a resolution to 2 mm.
The ex vivo measurements of the magnetic field, which could be displayed in a configurable 3D volume in relation to the electronic products were performed on five different explanted cardioverter defibrillators from two manufacturers.
In the ex vivo setting, the ability of the earphones, earphone charging cases, and electronic pens to interfere with defibrillator function was compared to that of the Apple iPhone 12 Max, which was the subject of a small in vivo study published in 2021. When the iPhone 12 Max was placed on the skin over a cardiac implantable device in that study, clinically identifiable interference could be detected in all 3 patients evaluated.
Based on previous work, the International Organization for Standardization has established that a minimal field strength of 10 G is needed to interfere with an implantable device, but the actual risk from any specific device is determined by the distance at which this strength of magnetic field is projected.
In the 3D analysis, the 10-G intensity was found to project 20 mm from the surface of the ear phones, ear phone charging case, and one of the electronic pens and to project 29 mm from the other electronic pen. When tested against the five defibrillators, magnetic reversion mode was triggered by the portable electronics at distances ranging from 8 to 18 mm.
In an interview, Dr. Knecht explained that this study adds more devices to the list of those associated with potential for interfering with implantable cardiovascular devices, but added that the more important point is that any device that contains magnets emitting a force of 10 G or greater for more than a few inches can be expected to be associated with clinically meaningful interference. The devices tested in this study were produced by Apple and Microsoft, but a focus on specific devices obscures the main message.
“All portable electronics with an embedded permanent magnet creating a 10-G magnetic field have a theoretical capability of triggering implantable devices,” he said.
For pacemakers, the interference is likely to trigger constant pacing, which would not be expected to pose a significant health threat if detected with a reasonable period, according to Dr. Knecht. Interference is potentially more serious for defibrillators, which might fail during magnetic interference to provide the shock needed to terminate a serious arrhythmia.
The combination of events – interference at the time of an arrhythmia – make this risk “very low,” but Dr. Knecht said it is sufficient to mean that patients receiving an implantable cardiovascular device should be made aware of the risk and the need to avoid placing portable electronic products near the implanted device.
When in vivo evidence of a disturbance with the iPhone 12 was reported in 2021, it amplified existing concern. The American Heart Association maintains a list of electronic products with the potential to interfere with implantable devices on its website. But, again, understanding the potential for risk and the need to keep electronic products with magnets at a safe distance from cardiovascular implantable devices is more important than trying to memorize the ever-growing list of devices with this capability.
“Prudent education of patients receiving an implantable device is important,” said N.A. Mark Estes III, MD, professor of medicine in the division of cardiology at the University of Pittsburgh. However, in an interview, he warned that the growing list of implicated devices makes a complete survey impractical, and, even if achievable, likely to leave patients “feeling overwhelmed.”
In Dr. Estes’s practice, he does provide printed information about the risks of electronics to interfere with implantable devices as well as a list of dos and don’ts. He agreed that the absolute risk of interference from a device causing significant clinical complications is low, but the goal is to “bring it as close to zero as possible.”
“No clinical case of a meaningful interaction of an electronic product and dysfunction of an implantable device has ever been documented,” he said. Given the widespread use of the new generation of cellphones that contain magnets powerful enough to induce dysfunction in an implantable device, “this speaks to the fact that the risk continues to be very low.”
Dr. Knecht and coinvestigators, along with Dr. Estes, reported no potential conflicts of interest.
Building on several previous reports that the newest models of mobile telephones and other electronics that use magnets pose a threat to the function of defibrillators and other implantable cardiovascular devices, a new study implicates any device that emits a 10-gauss (G) magnetic field more than a couple of inches.
“Beside the devices described in our manuscript, this can be any portable consumer product [with magnets] like electric cigarettes or smart watches,” explained study author Sven Knecht, DSc, a research electrophysiologist associated with the department of cardiology, University Hospital Basel (Switzerland).
In the newly published article, the investigators evaluated earphones, earphone charging cases, and two electronic pens used to draw on electronic tablets. These particular devices are of interest because, like mobile phones, they are of a size and shape to fit in a breast pocket adjacent to where many cardiovascular devices are implanted.
The study joins several previous studies that have shown the same risk, but this study used three-dimensional (3D) mapping of the magnetic field rather than a one-axis sensor, which is a standard adopted by the U.S. Food and Drug Administration, according to the investigators.
3D mapping assessment used
Because of the 3D nature of magnetic fields, 3D mapping serves as a better tool to assess the risk of the magnetic force as the intensity gradient diminishes with distance from the source, the authors contended. The 3D maps used in this study have a resolution to 2 mm.
The ex vivo measurements of the magnetic field, which could be displayed in a configurable 3D volume in relation to the electronic products were performed on five different explanted cardioverter defibrillators from two manufacturers.
In the ex vivo setting, the ability of the earphones, earphone charging cases, and electronic pens to interfere with defibrillator function was compared to that of the Apple iPhone 12 Max, which was the subject of a small in vivo study published in 2021. When the iPhone 12 Max was placed on the skin over a cardiac implantable device in that study, clinically identifiable interference could be detected in all 3 patients evaluated.
Based on previous work, the International Organization for Standardization has established that a minimal field strength of 10 G is needed to interfere with an implantable device, but the actual risk from any specific device is determined by the distance at which this strength of magnetic field is projected.
In the 3D analysis, the 10-G intensity was found to project 20 mm from the surface of the ear phones, ear phone charging case, and one of the electronic pens and to project 29 mm from the other electronic pen. When tested against the five defibrillators, magnetic reversion mode was triggered by the portable electronics at distances ranging from 8 to 18 mm.
In an interview, Dr. Knecht explained that this study adds more devices to the list of those associated with potential for interfering with implantable cardiovascular devices, but added that the more important point is that any device that contains magnets emitting a force of 10 G or greater for more than a few inches can be expected to be associated with clinically meaningful interference. The devices tested in this study were produced by Apple and Microsoft, but a focus on specific devices obscures the main message.
“All portable electronics with an embedded permanent magnet creating a 10-G magnetic field have a theoretical capability of triggering implantable devices,” he said.
For pacemakers, the interference is likely to trigger constant pacing, which would not be expected to pose a significant health threat if detected with a reasonable period, according to Dr. Knecht. Interference is potentially more serious for defibrillators, which might fail during magnetic interference to provide the shock needed to terminate a serious arrhythmia.
The combination of events – interference at the time of an arrhythmia – make this risk “very low,” but Dr. Knecht said it is sufficient to mean that patients receiving an implantable cardiovascular device should be made aware of the risk and the need to avoid placing portable electronic products near the implanted device.
When in vivo evidence of a disturbance with the iPhone 12 was reported in 2021, it amplified existing concern. The American Heart Association maintains a list of electronic products with the potential to interfere with implantable devices on its website. But, again, understanding the potential for risk and the need to keep electronic products with magnets at a safe distance from cardiovascular implantable devices is more important than trying to memorize the ever-growing list of devices with this capability.
“Prudent education of patients receiving an implantable device is important,” said N.A. Mark Estes III, MD, professor of medicine in the division of cardiology at the University of Pittsburgh. However, in an interview, he warned that the growing list of implicated devices makes a complete survey impractical, and, even if achievable, likely to leave patients “feeling overwhelmed.”
In Dr. Estes’s practice, he does provide printed information about the risks of electronics to interfere with implantable devices as well as a list of dos and don’ts. He agreed that the absolute risk of interference from a device causing significant clinical complications is low, but the goal is to “bring it as close to zero as possible.”
“No clinical case of a meaningful interaction of an electronic product and dysfunction of an implantable device has ever been documented,” he said. Given the widespread use of the new generation of cellphones that contain magnets powerful enough to induce dysfunction in an implantable device, “this speaks to the fact that the risk continues to be very low.”
Dr. Knecht and coinvestigators, along with Dr. Estes, reported no potential conflicts of interest.
FROM CIRCULATION: ARRHYTHMIAS & ELECTROPHYSIOLOGY
Oil spill cleanup work tied to hypertension risk years later
Workers who had the highest exposure to hydrocarbons during the Deepwater Horizon oil spill disaster had a higher risk of having a hypertension diagnosis in the years following the event, a new study suggests.
Results showed that the highest exposure to total petroleum hydrocarbons during the cleanup operation was associated with a 31% higher risk of new hypertension 1-3 years later.
“What is remarkable is that we still found an increased risk of hypertension a couple of years after the cleanup had been completed. This suggests working in this environment even for a short period could have long-term health consequences,” lead author Richard Kwok, PhD, told this news organization.
The study was published online in JAMA Network Open.
For the study, Dr. Kwok, a scientist at the U.S. National Institute of Environmental Health Sciences, and colleagues estimated the levels of exposure to toxic hydrocarbons in 6,846 adults who had worked on the oil spill cleanup after the Deepwater Horizon disaster in 2010, during which 200 million gallons of oil spilled into the Gulf of Mexico. They then investigated whether there was an association with the development of hypertension 1-3 years later.
“Clean-up efforts started almost immediately and lasted over a year,” Dr. Kwok noted. “In the first few months, oil flowed freely into the Gulf of Mexico which released high levels of volatile organic compounds into the air that the workers could have been exposed to. The exposures change over time because the oil becomes weathered and starts to decompose and harden. This is associated with a lower level of volatile organic compounds but can still cause damage.”
Workers involved in the cleanup may have been there for just a few days or could have spent many months at the site and would have had different exposures depending on what types of jobs they were doing, Dr. Kwok reported.
“The highest levels of exposure to total hydrocarbons would have been to those involved in the early months of the oil spill response and cleanup when the oil was flowing freely, and those who were skimming oil off the water, burning oil, handling dispersants, or involved in the decontamination of the vessels. Others who were involved in the cleanup on land or support functions would have had lower exposures,” he said.
Each worker was interviewed and asked about their activities during the cleanup operation, the location of work, and period of work. Their level of exposure to total petroleum hydrocarbons (THCs) was estimated based on their self-reported activities, and when and where they worked.
Two measures of estimated cumulative THC were calculated: cumulative maximum daily exposure, which summed the maximum daily THC exposure level, and cumulative mean exposure, which summed the mean daily exposure levels. These THC values were categorized into quintiles based on the exposure distribution among workers.
Systolic and diastolic blood pressure measurements were collected for the workers during home exams from 2011 to 2013 using automated oscillometric monitors. Newly detected hypertension was defined as either antihypertensive medication use or elevated blood pressure since the spill.
Results showed a clear dose relationship between the level of THC exposure and the development of hypertension at follow-up.
Similar results were seen for the relationship between cumulative mean THC exposure levels and the development of hypertension.
Despite the limitations of accurately estimating THC exposure, Dr. Kwok believes the results are real. “We looked at many different covariates including smoking, education, gender, race, ethnicity, and body mass index, but even after controlling for all these we still saw an association between the amount of exposure to THC and risk of hypertension.”
But the risk of developing hypertension did appear to be greater in those individuals with other risk factors for hypertension such as high body mass index or smokers. “There seems to be a combined effect,” Dr. Kwok said.
He pointed out that, while previous studies have shown possible health effects related to THC exposure on an acute basis, in this study, the effect on blood pressure was still evident years after the exposure had ended.
Other occupational studies have looked at people in jobs that have had longer exposures to volatile organic compounds such as taxi drivers, but this is one of the first to look at the long-term effect of a more limited period of exposure, he added.
“Our results suggest that the damage caused by THCs is not just an acute effect, but is still there several years later,” Dr. Kwok commented.
He says he hoped this study will raise awareness of the health hazards to workers involved in future oil spills. “Our results suggest that we need better protective equipment and monitoring of workers and the local community with longer-term follow up for health outcomes.”
Another analysis showed no clear differences in hypertension risk between individuals who worked on the oil spill cleanup (workers) and others who had completed required safety training but did not participate in the clean-up operation (nonworkers). Dr. Kwok suggested this may have been a result of the “healthy worker effect,” which is based on the premise that individuals able to work are healthier than those unable to work.
This study was funded by the Intramural Research Program of the National Institutes of Health, National Institute of Environmental Health Sciences. The authors reported no disclosures.
A version of this article first appeared on Medscape.com.
FROM JAMA NETWORK OPEN
More than half of U.S. women enter pregnancy at higher CVD risk
Less than half of women in the United States enter pregnancy in favorable cardiovascular health, new research suggests.
In 2019, among women aged 20 to 44 years with live births in the United States, only 40.2% were in favorable cardiovascular health prior to pregnancy, defined as normal weight, no diabetes, and no hypertension.
Although all regions and states showed a decline in prepregnancy favorable cardiometabolic health, there were significant differences among geographic regions in the country, the authors report. “These data reveal critical deficiencies and geographic disparities in prepregnancy cardiometabolic health,” they conclude.
“One of the things that we know in the U.S. is that the maternal mortality rate has been increasing, and there are significant differences at the state level in both adverse maternal outcomes, such as maternal mortality, as well as adverse pregnancy outcomes,” corresponding author Sadiya S. Khan, MD, MS, FACC, Northwestern University Feinberg School of Medicine, Chicago, told this news organization.
“These outcomes are often related to health factors that predate pregnancy,” Dr. Khan explained, “and the processes that begin at the very, very beginning of conception are informed by health factors prior to pregnancy, in particular cardiometabolic factors like body mass index or obesity, high blood pressure, and diabetes.”
The results were published online on Feb. 14 in a special “Go Red for Women” spotlight issue of Circulation.
Cardiometabolic health factors
Using maternal birth records from live births in the Centers for Disease Control and Prevention Natality Database between 2016 and 2019, the authors analyzed data on 14,174,625 women with live births aged 20 to 44 years. The majority (81.4%) were 20 to 34 years of age, 22.7% were Hispanic or Latina, and 52.7% were non-Hispanic White.
Favorable cardiometabolic health was defined as a BMI of 18 to 24.9 kg/m2, absence of diabetes, and absence of hypertension.
Although all regions and states experienced a decline in favorable cardiometabolic health during the study period of 2016 to 2019, with a drop overall of 3.2% – from 43.5 to 40.2 per 100 live births – it was especially true of the South and Midwest regions.
In 2019, favorable prepregnancy cardiometabolic health was lowest in the South (38.1%) and Midwest (38.8%) and highest in the West (42.2%) and Northeast (43.6%).
State by state, the lowest prevalence of favorable cardiometabolic health was found in Mississippi, at 31.2%, and highest in Utah, at 47.2%.
They also found a correlation between favorable cardiometabolic health and state-level percentages of high-school education or less and enrollment in Medicaid in 2019.
Similar to what has been seen with cardiovascular disease, “we observe that the states with the lowest prevalence of favorable cardiometabolic health were in the Southeast United States,” said Dr. Khan, “and similar geographic variation was observed with some more patterns in education and Medicaid coverage for birth, and these were used as proxies for socioeconomic status in those areas.”
Although Dr. Khan notes that the relationships cannot be determined to be causal from this analysis, she said that “it does suggest that upstream social determinants of health are important determinants of cardiometabolic health.”
Socioeconomic intervention
Dr. Khan noted that policies at the federal and state level can identify ways to “ensure that individuals who are thinking about pregnancy have access to health care and have access to resources, too, from a broad range of health determinants, including housing stability, food security, as well as access to health care be optimized prior to pregnancy.”
The authors note that this analysis may actually overestimate the prevalence of favorable cardiometabolic health, and data on cholesterol, diet, a distinction between type 1 and type 2 diabetes, and physical activity were not available.
Only individuals with live births were included, which could result in the elimination of a potentially high-risk group; however, late pregnancy losses represent less than 0.3% of all pregnancies, they say.
The authors conclude that “future research is needed to equitably improve health prior to pregnancy and quantify the potential benefits in cardiovascular disease outcomes for birthing individuals and their offspring.”
This work was supported by grants from the National Heart, Lung, and Blood Institute and American Heart Association Transformational Project Award awarded to Sadiya S. Khan.
A version of this article first appeared on Medscape.com.
Excess sodium in soluble acetaminophen tied to CVD risk, death
a large observational study of more than 300,000 adults suggests.
“Numerous studies have reported that high sodium intake is associated with increased risks of cardiovascular disease,” Yuqing Zhang, DSc, with Massachusetts General Hospital and Harvard Medical School, Boston, told this news organization. “Given that the pain relief effect of non–sodium-containing acetaminophen is similar to that of sodium-containing acetaminophen, clinicians may prescribe non–sodium-containing acetaminophen to their patients to minimize the risk of CVD and mortality,” Dr. Zhang said.
The study was published online Feb. 24 in the European Heart Journal.
‘Compelling results’
Dr. Zhang and colleagues note that the effervescent and soluble formulations of 0.5 g acetaminophen contain 0.44 and 0.39 g of sodium, respectively.
Therefore, the intake of maximum daily dose (4 g/day) of sodium-containing acetaminophen corresponds to the ingestion of more than 3 g of sodium, a dose that alone exceeds the recommended total daily sodium intake allowance of the World Health Organization (2 g/day).
“This hidden extra sodium intake is often overlooked,” Dr. Zhang told this news organization.
Using data from the Health Improvement Network, a U.K. primary care database, the researchers examined 4,532 patients with hypertension taking sodium-containing acetaminophen and compared them with 146,866 patients with hypertension taking non–sodium-containing acetaminophen (tablet, capsule, or oral suspension formulations).
After 1 year, the risk of incident CVD (myocardial infarction, stroke, and heart failure) was 5.6% in those taking sodium-containing acetaminophen, compared with 4.6% in those taking non–sodium-containing acetaminophen (average weighted hazard ratio, 1.59; 95% confidence interval, 1.32-1.92).
A separate analysis of normotensive patients taking sodium-containing acetaminophen (n = 5,351) or non–sodium-containing acetaminophen (n = 141,948) gave similar results.
The 1-year risk of incident CVD was 4.4% in those taking sodium-containing acetaminophen vs. 3.7% among those taking non–sodium-containing acetaminophen (average weighted HR, 1.45; 95% CI, 1.18-1.79).
There was also evidence of a dose-response relationship.
In those with hypertension, CVD risk increased by roughly one-quarter (odds ratio, 1.26) for those with one prescription of sodium-containing acetaminophen and by nearly one half (OR, 1.45) for those with five or more prescriptions of sodium-containing acetaminophen. Similar findings were observed among adults without hypertension.
Mortality at 1 year was also higher in those taking sodium-containing acetaminophen than non–sodium-containing acetaminophen, in patients with hypertension (7.6% vs. 6.1%) and without hypertension (7.3% vs. 5.9%).
“The results are compelling,” write the authors of an editorial published with the study.
“The direct message from this study is clear – there are likely to be millions of people worldwide taking paracetamol on a daily basis in a ‘fast-acting’ effervescent or soluble formulation who are increasing their risks of cardiovascular disease and premature death,” say Aletta Schutte, PhD, and Bruce Neal, MBChB, PhD, of the George Institute for Global Health, Sydney.
“The weight of the evidence makes ongoing inaction on sodium-containing medications untenable. The widespread use of effervescent medication in the general population, and the enormous doses of sodium that can be consumed inadvertently by unsuspecting consumers requires urgent action,” Dr. Schutte and Dr. Neal say.
The study was supported by the National Natural Science Foundation of China, the National Key Research and Development Project, the Project Program of National Clinical Research Center for Geriatric Disorders, the Key Research and Development Program of Hunan Province, and the Science and Technology Program of Hunan Province. Dr. Zhang, Dr. Schutte, and Dr. Neal have disclosed no relevant financial relationships.
A version of this article first appeared on Medscape.com.
FROM THE EUROPEAN HEART JOURNAL
AHA targets ‘low-value’ heart care in new scientific statement
Low-value health care services that provide little or no benefit to patients are “common, potentially harmful, and costly,” and there is a critical need to reduce this kind of care, the American Heart Association said in a newly released scientific statement.
Each year, nearly half of patients in the United States will receive at least one low-value test or procedure, with the attendant risk of avoidable complications from cascades of care and excess costs to individuals and society, the authors noted. Reducing low-value care is particularly important in cardiology, given the high prevalence and costs of cardiovascular disease in the United States.
The statement was published online Feb. 22, 2022, in Circulation: Cardiovascular Quality and Outcomes.
High burden with uncertain benefit
“Cardiovascular disease is common and can present suddenly, such as a heart attack or abnormal heart rhythm,” Vinay Kini, MD, chair of the statement writing group and assistant professor of medicine at Weill Cornell Medicine, New York, said in a news release.

“Our desire to be vigilant about treating and preventing cardiovascular disease may sometimes lead to use of tests and procedures where the benefits to patients may be uncertain,” Dr. Kini said. “This may impose burdens on patients, in the form of increased risk of physical harm from the low-value procedure or potential complications, as well as follow-up care and out-of-pocket financial costs.”
For example, studies have shown that up to one in five echocardiograms and up to half of all stress tests performed in the United States may be rated as rarely appropriate, based on established guidelines for their use.
In addition, up to 15% of percutaneous coronary interventions (PCIs) are classified as rarely appropriate, the writing group said.
Annually, among Medicare fee-for-service beneficiaries, low-value stress testing in patients with stable coronary artery disease is estimated to cost between $212 million and $2.1 billion, while costs of PCI for stable CAD range from $212 million to $2.8 billion, the writing group noted.
“At best, spending on low-value care potentially diverts resources from higher-value services that would benefit patients more effectively at the same or reduced cost. At worst, low-value care results in physical harm in the form of preventable morbidity and mortality,” they said.
“Thus, reducing low-value care is one of the few patient-centered solutions that directly address both the need to control health care spending and the societal imperative to devote its limited resources to beneficial health care services that improve health,” they added.
The group outlines several ways to reduce low-value cardiovascular care targeting patients, providers, and payers/policymakers.
For patients, education and shared decision-making may help reduce low-value care and dispel misconceptions about the intended purpose of test or treatment, they suggested.
For clinicians, a “layered” approach to reducing low-value care may be most effective, such as through education, audit and feedback, and behavioral science tools (“nudges”) to shift behaviors and practices, they said.
For payers and policy leaders, interventions to reduce low-value care include national insurance coverage determinations; prior authorization; alternative payment models that reward lower costs and higher-quality health care; value-based insurance designs that financially penalize low-value care; and medical liability reform to reduce defensive medical practices.
Low-value cardiovascular care is a complex problem, the writing group acknowledged, and achieving meaningful reductions in low-value cardiovascular care will require a multidisciplinary approach that includes continuous research, implementation, evaluation, and adjustment while ensuring equitable access to care.
“Each approach has benefits and drawbacks,” Dr. Kini said. “For example, prior authorization imposes a large burden on health care professionals to obtain insurance approval for tests and treatments. Prior authorization and some value-based payment models may unintentionally worsen existing racial and ethnic health care disparities.
“A one-size-fits-all approach to reducing low-value care is unlikely to succeed; rather, acting through multiple perspectives and frequently measuring impacts and potential unintended consequences is critical,” he concluded.
The scientific statement was prepared by the volunteer writing group on behalf of the AHA’s Council on Quality of Care and Outcomes Research.
The research had no commercial funding. Dr. Kini disclosed no relevant financial relationships.
A version of this article first appeared on Medscape.com.
Low-value health care services that provide little or no benefit to patients are “common, potentially harmful, and costly,” and there is a critical need to reduce this kind of care, the American Heart Association said in a newly released scientific statement.
Each year, nearly half of patients in the United States will receive at least one low-value test or procedure, with the attendant risk of avoidable complications from cascades of care and excess costs to individuals and society, the authors noted. Reducing low-value care is particularly important in cardiology, given the high prevalence and costs of cardiovascular disease in the United States.
The statement was published online Feb. 22, 2022, in Circulation: Cardiovascular Quality and Outcomes.
High burden with uncertain benefit
“Cardiovascular disease is common and can present suddenly, such as a heart attack or abnormal heart rhythm,” Vinay Kini, MD, chair of the statement writing group and assistant professor of medicine at Weill Cornell Medicine, New York, said in a news release.
“Our desire to be vigilant about treating and preventing cardiovascular disease may sometimes lead to use of tests and procedures where the benefits to patients may be uncertain,” Dr. Kini said. “This may impose burdens on patients, in the form of increased risk of physical harm from the low-value procedure or potential complications, as well as follow-up care and out-of-pocket financial costs.”
For example, studies have shown that up to one in five echocardiograms and up to half of all stress tests performed in the United States may be rated as rarely appropriate, based on established guidelines for their use.
In addition, up to 15% of percutaneous coronary interventions (PCIs) are classified as rarely appropriate, the writing group said.
Annually, among Medicare fee-for-service beneficiaries, low-value stress testing in patients with stable coronary artery disease is estimated to cost between $212 million and $2.1 billion, while costs of PCI for stable CAD range from $212 million to $2.8 billion, the writing group noted.
“At best, spending on low-value care potentially diverts resources from higher-value services that would benefit patients more effectively at the same or reduced cost. At worst, low-value care results in physical harm in the form of preventable morbidity and mortality,” they said.
“Thus, reducing low-value care is one of the few patient-centered solutions that directly address both the need to control health care spending and the societal imperative to devote its limited resources to beneficial health care services that improve health,” they added.
The group outlines several ways to reduce low-value cardiovascular care targeting patients, providers, and payers/policymakers.
For patients, education and shared decision-making may help reduce low-value care and dispel misconceptions about the intended purpose of test or treatment, they suggested.
For clinicians, a “layered” approach to reducing low-value care may be most effective, such as through education, audit and feedback, and behavioral science tools (“nudges”) to shift behaviors and practices, they said.
For payers and policy leaders, interventions to reduce low-value care include national insurance coverage determinations; prior authorization; alternative payment models that reward lower costs and higher-quality health care; value-based insurance designs that financially penalize low-value care; and medical liability reform to reduce defensive medical practices.
Low-value cardiovascular care is a complex problem, the writing group acknowledged, and achieving meaningful reductions in low-value cardiovascular care will require a multidisciplinary approach that includes continuous research, implementation, evaluation, and adjustment while ensuring equitable access to care.
“Each approach has benefits and drawbacks,” Dr. Kini said. “For example, prior authorization imposes a large burden on health care professionals to obtain insurance approval for tests and treatments. Prior authorization and some value-based payment models may unintentionally worsen existing racial and ethnic health care disparities.
“A one-size-fits-all approach to reducing low-value care is unlikely to succeed; rather, acting through multiple perspectives and frequently measuring impacts and potential unintended consequences is critical,” he concluded.
The scientific statement was prepared by the volunteer writing group on behalf of the AHA’s Council on Quality of Care and Outcomes Research.
The research had no commercial funding. Dr. Kini disclosed no relevant financial relationships.
A version of this article first appeared on Medscape.com.
FROM CIRCULATION: CARDIOVASCULAR QUALITY AND OUTCOMES
FDA okays empagliflozin for HF regardless of ejection fraction
The Food and Drug Administration has approved an expanded heart failure indication for the sodium-glucose transporter 2 inhibitor empagliflozin (Jardiance) that now includes HF with mid-range or preserved left ventricular ejection fraction (LVEF), the agency announced on Feb. 24.
That means the SGLT2 inhibitor, once considered primarily an antidiabetic agent, is approved for use in patients with HF per se without regard to ventricular function. The drug received approval for HF with reduced LVEF in August 2021.
The expanded indication, specifically for reducing the risk of cardiovascular death and HF hospitalization in adults, was widely anticipated based on the landmark results from the EMPEROR-Preserved trial. The study saw a significant 21% relative reduction in that composite endpoint over about 2 years in patients with New York Heart Association class II-IV heart failure and an LVEF greater than 40% who received empagliflozin along with other standard care.
Interestingly, the drug’s expanded indication in HF resembles that approved for sacubitril/valsartan (Entresto) in February 2021 based mostly on the PARAGON-HF trial, which entered patients with HF and an LVEF at least 45%. The trial was “negative” in that it saw no significant advantage to the drug for its primary clinical outcome but did suggest benefit for some secondary endpoints.
The FDA had used more cautionary language in its expanded indication for sacubitril/valsartan, “to reduce the risk of cardiovascular death and hospitalization for heart failure in adult patients with chronic heart failure. Benefits are most clearly evident in patients with left ventricular ejection fraction below normal.”
A version of this article first appeared on Medscape.com.