User login
High-dose chemo no better than standard dose for B-cell lymphoma
After 10 years of follow-up, event-free survival and overall survival were similar between conventional chemotherapy treated patients with aggressive B-cell lymphoma and those receiving high-dose chemotherapy followed by autologous hematopoietic stem-cell transplantation (HSCT), according to a report published online in the Lancet Hematology.

The open-label, randomized, phase 3 trial (NCT00129090) was conducted across 61 centers in Germany on patients aged 18-60 years who had newly diagnosed, high-risk, aggressive B-cell lymphoma, according to Fabian Frontzek, MD, of the University Hospital Münster (Germany) and colleagues.
Between March 2003 and April 2009, patients were randomly assigned to eight cycles of conventional chemotherapy (cyclophosphamide, doxorubicin, vincristine, etoposide, and prednisolone) plus rituximab (R-CHOEP-14) or four cycles of high-dose chemotherapy plus rituximab followed by autologous HSCT (R-MegaCHOEP). The intention-to-treat population comprised 130 patients in the R-CHOEP-14 group and 132 patients in the R-MegaCHOEP group. The median follow-up was 9.3 years.
Similar outcomes
The 10-year event-free survival was 51% in the R-MegaCHOEP group and 57% in the R-CHOEP-14 group, a nonsignificant difference (P = .23). Similarly, the 10-year progression-free survival was 59% in the
R-MegaCHOEP group and 60% (P = .64). The 10-year overall survival was 66% in the R-MegaCHOEP group and 72% in the R-CHOEP-14 group (P = .26). Among the 190 patients who had complete remission or unconfirmed complete remission, relapse occurred in 30 (16%); 17 (17%) of 100 patients in the R-CHOEP-14 group and 13 (14%) of 90 patients in the R-MegaCHOEP group.
In terms of secondary malignancies, 22 were reported in the intention-to-treat population; comprising 12 (9%) of 127 patients in the R-CHOEP-14 group and 10 (8%) of 126 patients in the R-MegaCHOEP group.
Patients who relapsed with aggressive histology and with CNS involvement in particular had worse outcomes and “represent a group with an unmet medical need, for which new molecular and cellular therapies should be studied,” the authors stated.
“This study shows that, in the rituximab era, high-dose therapy and autologous HSCT in first-line treatment does not improve long-term survival of younger high-risk patients with aggressive B-cell lymphoma. The R-CHOEP-14 regimen led to favorable outcomes, supporting its continued use in such patients,” the researchers concluded.
In an accompanying commentary, Gita Thanarajasingam, MD, of the Mayo Clinic, Rochester, Minn., and colleagues added that the issue of long-term outcomes is critical to evaluating these new regimens.
They applauded the inclusion of secondary malignancies in the long-term follow-up, but regretted the lack of the, admittedly resource-intensive, information on long-term nonneoplastic adverse events. They added that “the burden of late adverse events such as cardiotoxicity, cumulative neuropathy, delayed infections, or lasting cognitive effects, among others that might drive substantial morbidity, does matter to lymphoma survivors.”
They also commented on the importance of considering effects on fertility in these patients, noting that R-MegaCHOEP patients would be unable to conceive naturally, but that the effect of R-CHOEP-14 was less clear.
“We encourage ongoing emphasis on this type of longitudinal follow-up of secondary malignancies and other nonneoplastic late toxicities in phase 3 studies as well as in the real world in hematological malignancies, so that after prioritizing cure in the front-line setting, we do not neglect the life we have helped survivors achieve for years and decades to come,” they concluded.
The study was sponsored by the German High-Grade Non-Hodgkin’s Lymphoma Study Group. The authors reported grants, personal fees, and non-financial support from multiple pharmaceutical and biotechnology companies. Dr. Thanarajasingam and her colleagues reported that they had no competing interests.
After 10 years of follow-up, event-free survival and overall survival were similar between conventional chemotherapy treated patients with aggressive B-cell lymphoma and those receiving high-dose chemotherapy followed by autologous hematopoietic stem-cell transplantation (HSCT), according to a report published online in the Lancet Hematology.
The open-label, randomized, phase 3 trial (NCT00129090) was conducted across 61 centers in Germany on patients aged 18-60 years who had newly diagnosed, high-risk, aggressive B-cell lymphoma, according to Fabian Frontzek, MD, of the University Hospital Münster (Germany) and colleagues.
Between March 2003 and April 2009, patients were randomly assigned to eight cycles of conventional chemotherapy (cyclophosphamide, doxorubicin, vincristine, etoposide, and prednisolone) plus rituximab (R-CHOEP-14) or four cycles of high-dose chemotherapy plus rituximab followed by autologous HSCT (R-MegaCHOEP). The intention-to-treat population comprised 130 patients in the R-CHOEP-14 group and 132 patients in the R-MegaCHOEP group. The median follow-up was 9.3 years.
Similar outcomes
The 10-year event-free survival was 51% in the R-MegaCHOEP group and 57% in the R-CHOEP-14 group, a nonsignificant difference (P = .23). Similarly, the 10-year progression-free survival was 59% in the
R-MegaCHOEP group and 60% (P = .64). The 10-year overall survival was 66% in the R-MegaCHOEP group and 72% in the R-CHOEP-14 group (P = .26). Among the 190 patients who had complete remission or unconfirmed complete remission, relapse occurred in 30 (16%); 17 (17%) of 100 patients in the R-CHOEP-14 group and 13 (14%) of 90 patients in the R-MegaCHOEP group.
In terms of secondary malignancies, 22 were reported in the intention-to-treat population; comprising 12 (9%) of 127 patients in the R-CHOEP-14 group and 10 (8%) of 126 patients in the R-MegaCHOEP group.
Patients who relapsed with aggressive histology and with CNS involvement in particular had worse outcomes and “represent a group with an unmet medical need, for which new molecular and cellular therapies should be studied,” the authors stated.
“This study shows that, in the rituximab era, high-dose therapy and autologous HSCT in first-line treatment does not improve long-term survival of younger high-risk patients with aggressive B-cell lymphoma. The R-CHOEP-14 regimen led to favorable outcomes, supporting its continued use in such patients,” the researchers concluded.
In an accompanying commentary, Gita Thanarajasingam, MD, of the Mayo Clinic, Rochester, Minn., and colleagues added that the issue of long-term outcomes is critical to evaluating these new regimens.
They applauded the inclusion of secondary malignancies in the long-term follow-up, but regretted the lack of the, admittedly resource-intensive, information on long-term nonneoplastic adverse events. They added that “the burden of late adverse events such as cardiotoxicity, cumulative neuropathy, delayed infections, or lasting cognitive effects, among others that might drive substantial morbidity, does matter to lymphoma survivors.”
They also commented on the importance of considering effects on fertility in these patients, noting that R-MegaCHOEP patients would be unable to conceive naturally, but that the effect of R-CHOEP-14 was less clear.
“We encourage ongoing emphasis on this type of longitudinal follow-up of secondary malignancies and other nonneoplastic late toxicities in phase 3 studies as well as in the real world in hematological malignancies, so that after prioritizing cure in the front-line setting, we do not neglect the life we have helped survivors achieve for years and decades to come,” they concluded.
The study was sponsored by the German High-Grade Non-Hodgkin’s Lymphoma Study Group. The authors reported grants, personal fees, and non-financial support from multiple pharmaceutical and biotechnology companies. Dr. Thanarajasingam and her colleagues reported that they had no competing interests.
FROM THE LANCET HEMATOLOGY
Neurologic drug prices jump 50% in five years
, new research shows. Results of the retrospective study also showed that most of the increased costs for these agents were due to rising costs for neuroimmunology drugs, mainly for those used to treat multiple sclerosis (MS).

“The same brand name medication in 2017 cost approximately 50% more than in 2013,” said Adam de Havenon, MD, assistant professor of neurology, University of Utah, Salt Lake City.
“An analogy would be if you bought an iPhone 5 in 2013 for $500, and then in 2017, you were asked to pay $750 for the exact same iPhone 5,” Dr. de Havenon added.
The study findings were published online March 10 in the journal Neurology.
$26 billion in payments
Both neurologists and patients are concerned about the high cost of prescription drugs for neurologic diseases, and Medicare Part D data indicate that these drugs are the most expensive component of neurologic care, the researchers noted. In addition, out-of-pocket costs have increased significantly for patients with neurologic disease such as Parkinson’s disease, epilepsy, and MS.
To understand trends in payments for neurologic drugs, Dr. de Havenon and colleagues analyzed Medicare Part D claims filed from 2013 to 2017. The payments include costs paid by Medicare, the patient, government subsidies, and other third-party payers.
In addition to examining more current Medicare Part D data than previous studies, the current analysis examined all medications prescribed by neurologists that consistently remained branded or generic during the 5-year study period, said Dr. de Havenon. This approach resulted in a large number of claims and a large total cost.
To calculate the percentage change in annual payment claims, the researchers used 2013 prices as a reference point. They identified drugs named in 2013 claims and classified them as generic, brand-name only, or brand-name with generic equivalent. Researchers also divided the drugs by neurologic subspecialty.
The analysis included 520 drugs, all of which were available in each year of the study period. Of these drugs, 322 were generic, 61 were brand-name only, and 137 were brand-name with a generic equivalent. There were 90.7 million total claims.
Results showed total payments amounted to $26.65 billion. Yearly total payments increased from $4.05 billion in 2013 to $6.09 billion in 2017, representing a 50.4% increase, even after adjusting for inflation. Total claims increased by 7.6% – from 17.1 million in 2013 to 18.4 million in 2017.
From 2013 to 2017, claim payments increased by 0.6% for generic drugs, 42.4% for brand-name only drugs, and 45% for brand-name drugs with generic equivalents. The proportion of claims increased from 81.9% to 88% for generic drugs and from 4.9% to 6.2% for brand-name only drugs.
However, the proportion of claims for brand-name drugs with generic equivalents decreased from 13.3% to 5.8%.
Treatment barrier
Neuroimmunologic drugs, most of which were prescribed for MS, had exceptional cost, the researchers noted. These drugs accounted for more than 50% of payments but only 4.3% of claims. Claim payment for these drugs increased by 46.9% during the study period, from $3,337 to $4,902.
When neuroimmunologic drugs were removed from the analysis there was still significant increase in claim payments for brand-name only drugs (50.4%) and brand-name drugs with generic equivalents (45.6%).
Although neuroimmunologic medicines, including monoclonal antibodies, are more expensive to produce, this factor alone does not explain their exceptional cost, said Dr. de Havenon. “The high cost of brand-name drugs in this speciality is likely because the market bears it,” he added. “In other words, MS is a disabling disease and the medications work, so historically the Centers for Medicare & Medicaid Services have been willing to tolerate the high cost of these primarily brand-name medications.”
Several countries have controlled drug costs by negotiating with pharmaceutical companies and through legislation, Dr. de Havenon noted.
“My intent with this article was to raise awareness on the topic, which I struggle with frequently as a clinician. I know I want my patients to have a medication, but the cost prevents it,” he said.
‘Unfettered’ price-setting
Commenting on the findings, Robert J. Fox, MD, vice chair for research at the Neurological Institute of the Cleveland Clinic, said the study “brings into clear light” what neurologists, particularly those who treat MS, have long suspected but did not really know. These neurologists “are typically distanced from the payment aspects of the medications they prescribe,” said Dr. Fox, who was not involved with the research.
Although a particular strength of the study was its comprehensiveness, the researchers excluded infusion claims – which account for a large portion of total patient care costs for many disorders, he noted.
Drugs for MS historically have been expensive, ostensibly because of their high cost of development. In addition, the large and continued price increase that occurs long after these drugs have been approved remains unexplained, said Dr. Fox.
He noted that the study findings might not directly affect clinical practice because neurologists will continue prescribing medications they think are best for their patients. “Instead, I think this is a lesson to lawmakers about the massive error in the Medicare Modernization Act of 2003, where the federal government was prohibited from negotiating drug prices. If the seller is unfettered in setting a price, then no one should be surprised when the price rises,” Dr. Fox said.
Because many new drugs and new generic formulations for treating MS have become available during the past year, “repeating these types of economic studies for the period 2020-2025 will help us understand if generic competition – as well as new laws if they are passed – alter price,” he concluded.
The study was funded by the American Academy of Neurology, which publishes Neurology. Dr. de Havenon has received clinical research funding from AMAG Pharmaceuticals and Regeneron Pharmaceuticals. Dr. Fox receives consulting fees from many pharmaceutical companies involved in the development of therapies for MS.
A version of this article first appeared on Medscape.com.
, new research shows. Results of the retrospective study also showed that most of the increased costs for these agents were due to rising costs for neuroimmunology drugs, mainly for those used to treat multiple sclerosis (MS).
“The same brand name medication in 2017 cost approximately 50% more than in 2013,” said Adam de Havenon, MD, assistant professor of neurology, University of Utah, Salt Lake City.
“An analogy would be if you bought an iPhone 5 in 2013 for $500, and then in 2017, you were asked to pay $750 for the exact same iPhone 5,” Dr. de Havenon added.
The study findings were published online March 10 in the journal Neurology.
$26 billion in payments
Both neurologists and patients are concerned about the high cost of prescription drugs for neurologic diseases, and Medicare Part D data indicate that these drugs are the most expensive component of neurologic care, the researchers noted. In addition, out-of-pocket costs have increased significantly for patients with neurologic disease such as Parkinson’s disease, epilepsy, and MS.
To understand trends in payments for neurologic drugs, Dr. de Havenon and colleagues analyzed Medicare Part D claims filed from 2013 to 2017. The payments include costs paid by Medicare, the patient, government subsidies, and other third-party payers.
In addition to examining more current Medicare Part D data than previous studies, the current analysis examined all medications prescribed by neurologists that consistently remained branded or generic during the 5-year study period, said Dr. de Havenon. This approach resulted in a large number of claims and a large total cost.
To calculate the percentage change in annual payment claims, the researchers used 2013 prices as a reference point. They identified drugs named in 2013 claims and classified them as generic, brand-name only, or brand-name with generic equivalent. Researchers also divided the drugs by neurologic subspecialty.
The analysis included 520 drugs, all of which were available in each year of the study period. Of these drugs, 322 were generic, 61 were brand-name only, and 137 were brand-name with a generic equivalent. There were 90.7 million total claims.
Results showed total payments amounted to $26.65 billion. Yearly total payments increased from $4.05 billion in 2013 to $6.09 billion in 2017, representing a 50.4% increase, even after adjusting for inflation. Total claims increased by 7.6% – from 17.1 million in 2013 to 18.4 million in 2017.
From 2013 to 2017, claim payments increased by 0.6% for generic drugs, 42.4% for brand-name only drugs, and 45% for brand-name drugs with generic equivalents. The proportion of claims increased from 81.9% to 88% for generic drugs and from 4.9% to 6.2% for brand-name only drugs.
However, the proportion of claims for brand-name drugs with generic equivalents decreased from 13.3% to 5.8%.
Treatment barrier
Neuroimmunologic drugs, most of which were prescribed for MS, had exceptional cost, the researchers noted. These drugs accounted for more than 50% of payments but only 4.3% of claims. Claim payment for these drugs increased by 46.9% during the study period, from $3,337 to $4,902.
When neuroimmunologic drugs were removed from the analysis there was still significant increase in claim payments for brand-name only drugs (50.4%) and brand-name drugs with generic equivalents (45.6%).
Although neuroimmunologic medicines, including monoclonal antibodies, are more expensive to produce, this factor alone does not explain their exceptional cost, said Dr. de Havenon. “The high cost of brand-name drugs in this speciality is likely because the market bears it,” he added. “In other words, MS is a disabling disease and the medications work, so historically the Centers for Medicare & Medicaid Services have been willing to tolerate the high cost of these primarily brand-name medications.”
Several countries have controlled drug costs by negotiating with pharmaceutical companies and through legislation, Dr. de Havenon noted.
“My intent with this article was to raise awareness on the topic, which I struggle with frequently as a clinician. I know I want my patients to have a medication, but the cost prevents it,” he said.
‘Unfettered’ price-setting
Commenting on the findings, Robert J. Fox, MD, vice chair for research at the Neurological Institute of the Cleveland Clinic, said the study “brings into clear light” what neurologists, particularly those who treat MS, have long suspected but did not really know. These neurologists “are typically distanced from the payment aspects of the medications they prescribe,” said Dr. Fox, who was not involved with the research.
Although a particular strength of the study was its comprehensiveness, the researchers excluded infusion claims – which account for a large portion of total patient care costs for many disorders, he noted.
Drugs for MS historically have been expensive, ostensibly because of their high cost of development. In addition, the large and continued price increase that occurs long after these drugs have been approved remains unexplained, said Dr. Fox.
He noted that the study findings might not directly affect clinical practice because neurologists will continue prescribing medications they think are best for their patients. “Instead, I think this is a lesson to lawmakers about the massive error in the Medicare Modernization Act of 2003, where the federal government was prohibited from negotiating drug prices. If the seller is unfettered in setting a price, then no one should be surprised when the price rises,” Dr. Fox said.
Because many new drugs and new generic formulations for treating MS have become available during the past year, “repeating these types of economic studies for the period 2020-2025 will help us understand if generic competition – as well as new laws if they are passed – alter price,” he concluded.
The study was funded by the American Academy of Neurology, which publishes Neurology. Dr. de Havenon has received clinical research funding from AMAG Pharmaceuticals and Regeneron Pharmaceuticals. Dr. Fox receives consulting fees from many pharmaceutical companies involved in the development of therapies for MS.
A version of this article first appeared on Medscape.com.
FROM NEUROLOGY
Novel Alzheimer’s drug slows cognitive decline in phase 2 trial
Results from the TRAILBLAZER-ALZ trial were presented at the 2021 International Conference on Alzheimer’s and Parkinson’s Diseases (AD/PD) and were simultaneously published online March 13 in the New England Journal of Medicine.
As previously reported by Medscape Medical News, topline results showed that donanemab slowed cognitive decline by 32% on the Integrated AD Rating Scale (iADRS) from baseline to 76 weeks relative to placebo.
The newly released detailed findings showed that “the use of donanemab resulted in a better composite score for cognition and for the ability to perform activities of daily living than placebo at 76 weeks, although results for secondary outcomes were mixed,” the investigators, with first author Mark A. Mintun, MD, an employee of Eli Lilly, reported.
Results revealed improvement in scores on the Clinical Dementia Rating Scale-Sum of Boxes (CDR-SB) and the 13-item cognitive subscale of the AD Assessment Scale (ADAS-Cog13), but the differences between the two treatment groups were not significant. In addition, score changes on the AD Cooperative Study–Instrumental Activities of Daily Inventory (ADCS-iADL) and the Mini-Mental State Examination (MMSE) were not “substantial.”
However, the donanemab group did show an 85-centiloid greater reduction in amyloid plaque level at 76 weeks, as shown on PET, compared with the placebo group.
Proof of concept?
The humanized antibody donanemab, which was previously known as LY3002813, targets a modified form of deposited amyloid-beta (A-beta) peptide called N3pG.
The randomized, placebo-controlled, double-blind TRAILBLAZER-ALZ trial, which was described as a “phase 2 proof of concept trial” in the AD/PD program, was conducted at 56 sites in the United States and Canada and included 257 patients between the ages of 60 and 85 years (52% were women). PET confirmed tau and amyloid deposition in all participants.
The active treatment group (n = 131) was randomly assigned to receive donanemab 700 mg for three doses; after that, treatment was bumped up to 1,400 mg. Both the donanemab and placebo groups (n = 126) received treatment intravenously every 4 weeks for up to 72 weeks.
Participants also underwent F-florbetapir and F-flortaucipir PET scans at various timepoints and completed a slew of cognitive tests.
The study’s primary outcome measure was change between baseline and 76 weeks post treatment on composite score for cognition, as measured by the iADRS. The iADRS combines the ADAS-Cog13 and the ADCS-iADL.
This measure ranges from 0 to 144, with lower scores associated with greater cognitive impairment. Both treatment groups had an iADRS score of 106 at baseline.
More research needed
Results showed that the score change from baseline on the iADRS was –6.86 for the active treatment group vs –10.06 for the placebo group (group difference, 3.2; 95% confidence interval [CI], 0.12-6.27; P = .04). Although significant, “the trial was powered to show a 6-point difference,” which was not met, the investigators note.
Differences in score changes from baseline to 76 weeks for the treatment vs. placebo groups on the following secondary outcome measures were:
- CDR-SB: –0.36 (95% CI, –0.83 to –0.12).
- ADAS-Cog13: –1.86 (95% CI, –3.63 to –0.09).
- ADCS-iADL: 1.21 (95% CI, –0.77 to 3.2).
- MMSE: 0.64 (95% CI, –0.4 to 1.67).
The CDR-SB was designated as the first secondary outcome, and because it did not show a significant between-group difference, “the hierarchy failed and no definite conclusions can be drawn from data regarding the differences between groups in the change in the ADAS-Cog13,” the investigators wrote.
In addition, the differences in scores on the latter two secondary outcomes were not “substantial,” they reported.
However, at 76 weeks, the donanemab group showed a reduction of 84.13 centiloids in amyloid plaque level vs. an increase of 0.93 centiloids in the placebo group (between-group difference, 85.06 centiloids). At 24 weeks, the active-treatment group had a 67.83-centiloids greater reduction vs. the placebo group.
In addition, 40%, 59.8%, and 67.8% of the donanemab group achieved “amyloid-negative status” at 24, 52, and 76 weeks, respectively. Amyloid-negative status was defined as an amyloid plaque level of less than 24.1 centiloids.
Total incidence of death or serious adverse events did not differ significantly between the groups. However, the donanemab group had significantly more reports of ARIA-E compared with the placebo group (26.7% vs. 0.8%).
Overall, the researchers noted that more trials of longer duration with larger patient numbers are warranted “to further determine the efficacy and safety of donanemab” in AD.
Positive signal?
In a statement, Maria Carrillo, PhD, chief science officer for the Alzheimer’s Association, said the organization “is encouraged by this promising data.
“It is the first phase 2 Alzheimer’s trial to show positive results on a primary outcome measure related to memory and thinking,” Dr. Carrillo said. However, “more work needs to be done on this experimental drug therapy.”
Dr. Carrillo noted that because the trial was moderately sized and only 180 participants completed the study, “we look forward to the results of a second, larger phase 2 trial of this drug.”
Still, she added, there were several “novel and innovative aspects” in the way the study was conducted noting that it showcases the evolution of AD research.
“I’m hopeful for the future,” Dr. Carrillo said.
Also commenting on the results, Howard Fillit, MD, neuroscientist and founding executive director and chief science officer of the Alzheimer’s Drug Discovery Foundation, said the study showed “the pharmacology works” and that the drug did what it was supposed to do in terms of removing A-beta plaque.
“It also gave us a signal in a relatively small phase 2 study that there might be a modest cognitive benefit,” said Dr. Fillit, who was not involved with the research.
He noted that although the rate of decline slowing was statistically significant it remains to be seen whether this is clinically meaningful, particularly in light of the fact that the secondary outcome results were mixed.
“Basically, it was a positive study that probably needs to be followed by another, much larger study to get us to really see the benefit,” Dr. Fillit said.
Dr. Mintun is an employee of Eli Lilly, which funded the study. Dr. Carrillo and Dr. Fillit have reported no relevant financial relationships.
A version of this article first appeared on Medscape.com.
Don’t discontinue osteoporosis meds for COVID-19 vaccines, expert guidance says
COVID-19 vaccines are safe and effective for patients taking osteoporosis medications, according to joint guidance from six endocrine and osteoporosis societies and foundations.

They noted, though, that some timing modifications with certain medications should be considered to help distinguish between adverse events from the medication versus the vaccine.
The American Society for Bone and Mineral Research “is an international organization, so we brought together our sister societies that have a vested interested in bone health. Vaccination is happening worldwide, and we wanted to present a united front and united recommendations about how to handle osteoporosis medications appropriately during vaccination,” said Suzanne Jan De Beur, MD, who is president of ASBMR and an associate professor of medicine at Johns Hopkins University, Baltimore.
There has been quite a lot of concern from the community about vaccine and medications, from both physicians and patients wondering whether treatments and vaccines should occur in a certain order, and whether there should be a time gap between the two, said Dr. Jan De Beur. “There was a dearth of information about the best practices for osteoporosis treatment management during vaccination, and we didn’t want people missing their opportunity for a vaccine, and we also didn’t want them unnecessarily delaying their osteoporosis treatment.”
There is no evidence that osteoporosis therapies affect the risk or severity of COVID-19 disease, nor do they appear to change the disease course. Osteoporosis itself does not appear associated with increased risk of infection or severe outcomes, so patients with osteoporosis do not need to be prioritized for vaccination based on that condition alone.
There is no evidence that osteoporosis therapies affect the safety or efficacy of vaccination, but given that vaccine availability is currently inconsistent, patients may need to make temporary changes to their osteoporosis regimens to ensure they can receive vaccine when it is available, such as ensuring a delay between medication and vaccination injections.
A key reason for a delay between injectable or infusion medications and a vaccine is to distinguish between adverse events that could occur, so that an adverse reaction to vaccine isn’t mistaken for an adverse reaction to a drug. Nevertheless, the real world is messy. Dr. Jan De Beur noted a recent patient who arrived at her clinic for an injectable treatment who had just received a COVID-19 vaccination that morning. “We decided to put the injection in the other arm, rather than reschedule the person and put them through the risk of coming back. We could distinguish between injection-site reactions, at least,” she said.
No changes should be made to general bone health therapies, such as calcium and vitamin D supplementation, weight-bearing exercises, and maintenance of a balanced diet.
The guidance includes some recommendations for specific osteoporosis medications.
- Oral bisphosphonates: Alendronate, risedronate, and ibandronate should be continued.
- Intravenous bisphosphonates: a 7-day interval (4-day minimum) is recommended between intravenous bisphosphonate (zoledronic acid and ibandronate) infusion and COVID-19 vaccination in order to distinguish potential autoimmune or inflammatory reactions that could be attributable to either intravenous bisphosphonate or the vaccine.
- Denosumab: There should be a 4- to 7-day delay between denosumab infusion and COVID-19 vaccination to account for injection-site reactions. Another option is to have denosumab injected into the contralateral arm or another site like the abdomen or upper thigh, if spacing the injections is not possible. In any case, denosumab injections should be performed within 7 months of the previous dose.
- Teriparatide and abaloparatide should be continued.
- Romosozumab: There should be a 4- to 7-day delay between a romosozumab injection and COVID-19 vaccine, or romosozumab can be injected in the abdomen (with the exception of a 2-inch area around the naval) or thigh if spacing is not possible.
- Raloxifene should be continued in patients receiving COVID-19 vaccination.
Guidance signatories include ASBMR, the American Association of Clinical Endocrinology, the Endocrine Society, the European Calcified Tissue Society, the National Osteoporosis Foundation, and the International Osteoporosis Foundation.
Dr. Jan De Beur has no relevant financial disclosures.
COVID-19 vaccines are safe and effective for patients taking osteoporosis medications, according to joint guidance from six endocrine and osteoporosis societies and foundations.
They noted, though, that some timing modifications with certain medications should be considered to help distinguish between adverse events from the medication versus the vaccine.
The American Society for Bone and Mineral Research “is an international organization, so we brought together our sister societies that have a vested interested in bone health. Vaccination is happening worldwide, and we wanted to present a united front and united recommendations about how to handle osteoporosis medications appropriately during vaccination,” said Suzanne Jan De Beur, MD, who is president of ASBMR and an associate professor of medicine at Johns Hopkins University, Baltimore.
There has been quite a lot of concern from the community about vaccine and medications, from both physicians and patients wondering whether treatments and vaccines should occur in a certain order, and whether there should be a time gap between the two, said Dr. Jan De Beur. “There was a dearth of information about the best practices for osteoporosis treatment management during vaccination, and we didn’t want people missing their opportunity for a vaccine, and we also didn’t want them unnecessarily delaying their osteoporosis treatment.”
There is no evidence that osteoporosis therapies affect the risk or severity of COVID-19 disease, nor do they appear to change the disease course. Osteoporosis itself does not appear associated with increased risk of infection or severe outcomes, so patients with osteoporosis do not need to be prioritized for vaccination based on that condition alone.
There is no evidence that osteoporosis therapies affect the safety or efficacy of vaccination, but given that vaccine availability is currently inconsistent, patients may need to make temporary changes to their osteoporosis regimens to ensure they can receive vaccine when it is available, such as ensuring a delay between medication and vaccination injections.
A key reason for a delay between injectable or infusion medications and a vaccine is to distinguish between adverse events that could occur, so that an adverse reaction to vaccine isn’t mistaken for an adverse reaction to a drug. Nevertheless, the real world is messy. Dr. Jan De Beur noted a recent patient who arrived at her clinic for an injectable treatment who had just received a COVID-19 vaccination that morning. “We decided to put the injection in the other arm, rather than reschedule the person and put them through the risk of coming back. We could distinguish between injection-site reactions, at least,” she said.
No changes should be made to general bone health therapies, such as calcium and vitamin D supplementation, weight-bearing exercises, and maintenance of a balanced diet.
The guidance includes some recommendations for specific osteoporosis medications.
- Oral bisphosphonates: Alendronate, risedronate, and ibandronate should be continued.
- Intravenous bisphosphonates: a 7-day interval (4-day minimum) is recommended between intravenous bisphosphonate (zoledronic acid and ibandronate) infusion and COVID-19 vaccination in order to distinguish potential autoimmune or inflammatory reactions that could be attributable to either intravenous bisphosphonate or the vaccine.
- Denosumab: There should be a 4- to 7-day delay between denosumab infusion and COVID-19 vaccination to account for injection-site reactions. Another option is to have denosumab injected into the contralateral arm or another site like the abdomen or upper thigh, if spacing the injections is not possible. In any case, denosumab injections should be performed within 7 months of the previous dose.
- Teriparatide and abaloparatide should be continued.
- Romosozumab: There should be a 4- to 7-day delay between a romosozumab injection and COVID-19 vaccine, or romosozumab can be injected in the abdomen (with the exception of a 2-inch area around the naval) or thigh if spacing is not possible.
- Raloxifene should be continued in patients receiving COVID-19 vaccination.
Guidance signatories include ASBMR, the American Association of Clinical Endocrinology, the Endocrine Society, the European Calcified Tissue Society, the National Osteoporosis Foundation, and the International Osteoporosis Foundation.
Dr. Jan De Beur has no relevant financial disclosures.
Impact of an Oral Antineoplastic Renewal Clinic on Medication Possession Ratio and Cost-Savings
Evaluation of oral antineoplastic agent (OAN) adherence patterns have identified correlations between nonadherence or over-adherence and poorer disease-related outcomes. Multiple studies have focused on imatinib use in chronic myeloid leukemia (CML) due to its continuous, long-term use. A study by Ganesan and colleagues found that nonadherence to imatinib showed a significant decrease in 5-year event-free survival between 76.7% of adherent participants compared with 59.8% of nonadherent participants.1 This study found that 44% of patients who were adherent to imatinib achieved complete cytogenetic response vs only 26% of patients who were nonadherent. In another study of imatinib for CML, major molecular response (MMR) was strongly correlated with adherence and no patients with adherence < 80% were able to achieve MMR.2 Similarly, in studies of tamoxifen for breast cancer, < 80% adherence resulted in a 10% decrease in survival when compared to those who were more adherent.3,4
In addition to the clinical implications of nonadherence, there can be a significant cost associated with suboptimal use of these medications. The price of a single dose of OAN medication may cost as much as $440.5
The benefits of multidisciplinary care teams have been identified in many studies.6,7 While studies are limited in oncology, pharmacists provide vital contributions to the oncology multidisciplinary team when managing OANs as these health care professionals have expert knowledge of the medications, potential adverse events (AEs), and necessary monitoring parameters.8 In one study, patients seen by the pharmacist-led oral chemotherapy management program experienced improved clinical outcomes and response to therapy when compared with preintervention patients (early molecular response, 88.9% vs 54.8%, P = .01; major molecular response, 83.3% vs 57.6%, P = .06).9 During the study, 318 AEs were reported, leading to 235 pharmacist interventions to ameliorate AEs and improve adherence.
The primary objective of this study was to measure the impact of a pharmacist-driven OAN renewal clinic on medication adherence. The secondary objective was to estimate cost-savings of this new service.
Methods
Prior to July 2014, several limitations were identified related to OAN prescribing and monitoring at the Richard L. Roudebush Veterans Affairs Medical Center in Indianapolis, Indiana (RLRVAMC). The prescription ordering process relied primarily on the patient to initiate refills, rather than the prescriber OAN prescriptions also lacked consistency for number of refills or quantities dispensed. Furthermore, ordering of antineoplastic products was not limited to hematology/oncology providers. Patients were identified with significant supply on hand at the time of medication discontinuation, creating concerns for medication waste, tolerability, and nonadherence.
As a result, opportunities were identified to improve the prescribing process, recommended monitoring, toxicity and tolerability evaluation, medication reconciliation, and medication adherence. In July of 2014, the RLRVAMC adopted a new chemotherapy order entry system capable of restricting prescriptions to hematology/oncology providers and limiting dispensed quantities and refill amounts. A comprehensive pharmacist driven OAN renewal clinic was implemented on September 1, 2014 with the goal of improving long-term adherence and tolerability, in addition to minimizing medication waste.
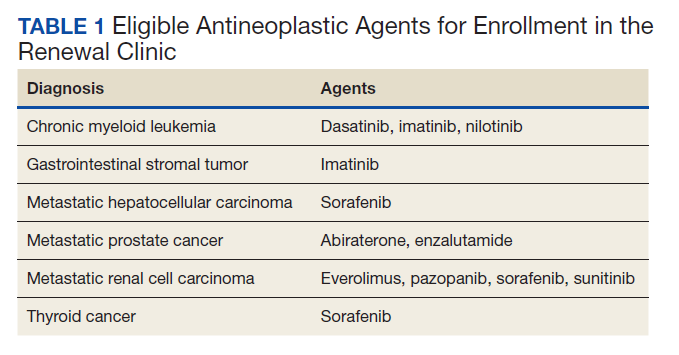
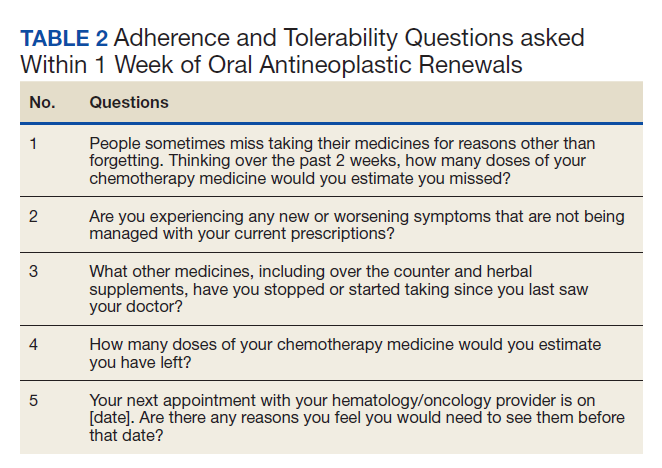
Patients were eligible for enrollment in the clinic if they had a cancer diagnosis and were concomitantly prescribed an OAN outlined in Table 1. All eligible patients were automatically enrolled in the clinic when they were deemed stable on their OAN by a hematology/oncology pharmacy specialist. Stability was defined as ≤ Grade 1 symptoms associated with the toxicities of OAN therapy managed with or without intervention as defined by the Common Terminology Criteria for Adverse Events (CTCAE) version 4.03. Once enrolled in the renewal clinic, patients were called by an oncology pharmacy resident (PGY2) 1 week prior to any OAN refill due date. Patients were asked a series of 5 adherence and tolerability questions (Table 2) to evaluate renewal criteria for approval or need for further evaluation. These questions were developed based on targeted information and published reports on monitoring adherence.10,11 Criteria for renewal included: < 10% self-reported missed doses of the OAN during the previous dispensing period, no hospitalizations or emergency department visits since most recent hematology/oncology provider appointment, no changes to concomitant medication therapies, and no new or worsening medication-related AEs. Patients meeting all criteria were given a 30-day supply of OAN. Prescribing, dispensing, and delivery of OAN were facilitated by the pharmacist. Patient cases that did not meet criteria for renewal were escalated to the hematology/oncology provider or oncology clinical pharmacy specialist for further evaluation.
Study Design and Setting
This was a pre/post retrospective cohort, quality improvement study of patients enrolled in the RLRVAMC OAN pharmacist renewal clinic. The study was deemed exempt from institutional review board (IRB) by the US Department of Veterans Affairs (VA) Research and Development Department.
Study Population
Patients were included in the preimplementation group if they had received at least 2 prescriptions of an eligible OAN. Therapy for the preimplementation group was required to be a monthly duration > 21 days and between the dates of September 1, 2013 and August 31, 2014. Patients were included in the postimplementation group if they had received at least 2 prescriptions of the studied OANs between September 1, 2014 and January 31, 2015. Patients were excluded if they had filled < 2 prescriptions of OAN; were managed by a non-VA oncologist or hematologist; or received an OAN other than those listed in Table 1.
Data Collection
For all patients in both the pre- and postimplementation cohorts, a standardized data collection tool was used to collect the following via electronic health record review by a PGY2 oncology resident: age, race, gender, oral antineoplastic agent, refill dates, days’ supply, estimated unit cost per dose cancer diagnosis, distance from the RLRVAMC, copay status, presence of hospitalizations/ED visits/dosage reductions, discontinuation rates, reasons for discontinuation, and total number of current prescriptions. The presence or absence of dosage reductions were collected to identify concerns for tolerability, but only the original dose for the preimplementation group and dosage at time of clinic enrollment for the postimplementation group was included in the analysis.
Outcomes and Statistical Analyses
The primary outcome was medication adherence defined as the median medication possession ratio (MPR) before and after implementation of the clinic. Secondary outcomes included the proportion of patients who were adherent from before implementation to after and estimated cost-savings of this clinic after implementation. MPR was used to estimate medication adherence by taking the cumulative day supply of medication on hand divided by the number of days on therapy.12 Number of days on therapy was determined by taking the difference on the start date of the new medication regimen and the discontinuation date of the same regimen. Patients were grouped by adherence into one of the following categories: < 0.8, 0.8 to 0.89, 0.9 to 1, and > 1.1. Patients were considered adherent if they reported taking ≥ 90% (MPR ≥ 0.9) of prescribed doses, adopted from the study by Anderson and colleagues.12 A patient with an MPR > 1, likely due to filling prior to the anticipated refill date, was considered 100% adherent (MPR = 1). If a patient switched OAN during the study, both agents were included as separate entities.
A conservative estimate of cost-savings was made by multiplying the RLRVAMC cost per unit of medication at time of initial prescription fill by the number of units taken each day multiplied by the total days’ supply on hand at time of therapy discontinuation. Patients with an MPR < 1 at time of therapy discontinuation were assumed to have zero remaining units on hand and zero cost savings was estimated. Waste, for purposes of cost-savings, was calculated for all MPR values > 1. Additional supply anticipated to be on hand from dose reductions was not included in the estimated cost of unused medication.
Descriptive statistics compared demographic characteristics between the pre- and postimplementation groups. MPR data were not normally distributed, which required the use of nonparametric Mann-Whitney U tests to compare pre- and postMPRs. Pearson χ2 compared the proportion of adherent patients between groups while descriptive statistics were used to estimate cost savings. Significance was determined based on a P value < .05. IBM SPSS Statistics software was used for all statistical analyses. As this was a complete sample of all eligible subjects, no sample size calculation was performed.
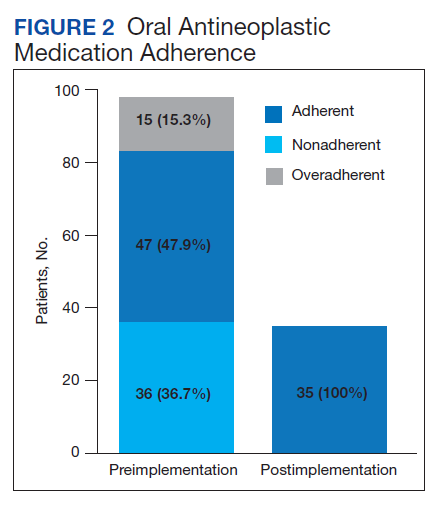
Results
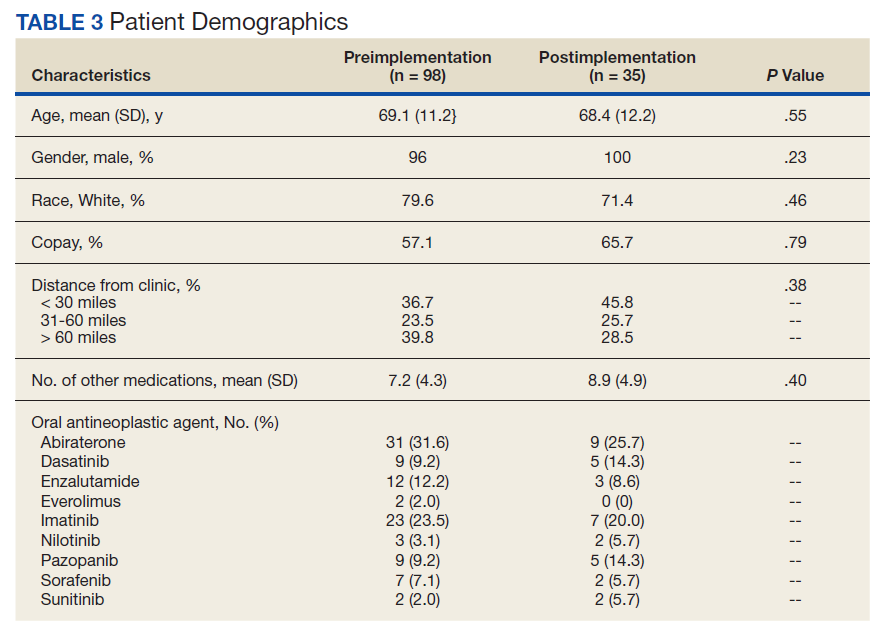
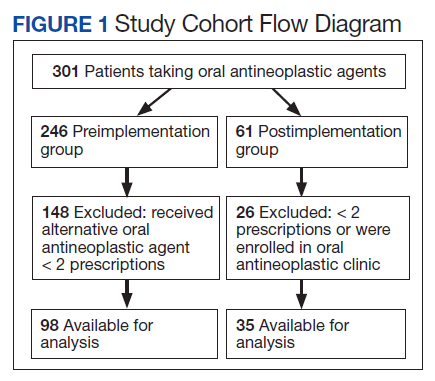
In the preimplementation period, 246 patients received an OAN and 61 patients received an OAN in the postimplementation period (Figure 1). Of the 246 patients in the preimplementation period, 98 were eligible and included in the preimplementation group. Similarly, of the 61 patients in the postimplementation period, 35 patients met inclusion criteria for the postimplementation group. The study population was predominantly male with an average age of approximately 70 years in both groups (Table 3). More than 70% of the population in each group was White. No statistically significant differences between groups were identified. The most commonly prescribed OAN in the preimplementation group were abiraterone, imatinib, and enzalutamide (Table 3). In the postimplementation group, the most commonly prescribed agents were abiraterone, imatinib, pazopanib, and dasatinib. No significant differences were observed in prescribing of individual agents between the pre- and postimplementation groups or other characteristics that may affect adherence including patient copay status, number of concomitant medications, and driving distance from the RLRVAMC.
Thirty-six (36.7%) patients in the preimplementation group were considered nonadherent (MPR < 0.9) and 18 (18.4%) had an MPR < 0.8. Fifteen (15.3%) patients in the preimplementation clinic were considered overadherent (MPR > 1.1). Forty-seven (47.9%) patients in the preimplementation group were considered adherent (MPR 0.9 - 1.1) while all 35 (100%) patients in the postimplementation group were considered adherent (MPR 0.9 - 1.1). No non- or overadherent patients were identified in the postimplementation group (Figure 2). The median MPR for all patients in the preimplementation group was 0.94 compared with 1.06 (P < .001) in the postimplementation group.
Thirty-five (35.7%) patients had therapy discontinued or held in the preimplementation group compared with 2 (5.7%) patients in the postimplementation group (P < .001). Reasons for discontinuation in the preimplementation group included disease progression (n = 27), death (n = 3), lost to follow up (n = 2), and intolerability of therapy (n = 3). Both patients that discontinued therapy in the postimplementation group did so due to disease progression. Of the 35 patients who had their OAN discontinued or held in the preimplementation group, 14 patients had excess supply on hand at time of discontinuation. The estimated value of the unused medication was $37,890. Nine (25%) of the 35 patients who discontinued therapy had a dosage reduction during the course of therapy and the additional supply was not included in the cost estimate. Similarly, 1 of the 2 patients in the postimplementation group had their OAN discontinued during study. The cost of oversupply of medication at the time of therapy discontinuation was estimated at $1,555. No patients in the postimplementation group had dose reductions. After implementation of the OAN renewal clinic, the total cost savings between pre ($37,890) and postimplementation ($1,555) groups was $36,355.
Discussion
OANs are widely used therapies, with more than 25 million doses administered per year in the United States alone.12 The use of these agents will continue to grow as more targeted agents become available and patients request more convenient treatment options. The role for hematology/oncology clinical pharmacy services must adapt to this increased usage of OANs, including increasing pharmacist involvement in medication education, adherence and tolerability assessments, and proactive drug interaction monitoring.However, additional research is needed to determine optimal management strategies.
Our study aimed to compare OAN adherence among patients at a tertiary care VA hospital before and after implementation of a renewal clinic. The preimplementation population had a median MPR of 0.94 compared with 1.06 in the postimplementation group (P < .001). Although an ideal MPR is 1.0, we aimed for a slightly higher MPR to allow a supply buffer in the event of prescription delivery delays, as more than 90% of prescriptions are mailed to patients from a regional mail-order pharmacy. Importantly, the median MPRs do not adequately convey the impact from this clinic. The proportion of patients who were considered adherent to OANs increased from 47.9% in the preimplementation to 100% in the postimplementation period. These finding suggest that the clinical pharmacist role to assess and encourage adherence through monitoring tolerability of these OANs improved the overall medication taking experience of these patients.
Upon initial evaluation of adherence pre- and postimplementation, median adherence rates in both groups appeared to be above goal at 0.94 and 1.06 respectively. Patients in the postimplementation group intentionally received a 5- to 7-day supply buffer to account for potential prescription delivery delays due to holidays and inclement weather. This would indicate that the patients in the postimplementation group would have 15% oversupply due to the 5-day supply buffer. After correcting for patients with confounding reasons for excess (dose reductions, breaks in treatment, etc.), the median MPR in the prerefill clinic group decreased to 0.9 and the MPR in the postrefill clinic group increased slightly to 1.08. Although the median adherence rate in both the pre- and postimplementation groups were above goal of 0.90, 36% of the patients in the preimplementation group were considered nonadherent (MPR < 0.9) compared with no patients in the postimplementation group. Therefore, our intervention to improve patient adherence appeared to be beneficial at our institution.
In addition to improving adherence, one of the goals of the renewal clinic was to minimize excess supply at the time of therapy discontinuation. This was accomplished by aligning medication fills with medical visits and objective monitoring, as well as limiting supply to no more than 30 days. Of the patients in the postimplementation group, only 1 patient had remaining medication at the time of therapy discontinuation compared with 14 patients in the preimplementation group. The estimated cost savings from excess supply was $36,335. Limiting the amount of unused supply not only saves money for the patient and the institution, but also decreases opportunity for improper hazardous waste disposal and unnecessary exposure of hazardous materials to others.
Our results show the pharmacist intervention in the coordination of renewals improved adherence, minimized medication waste, and saved money. The cost of pharmacist time participating in the refill clinic was not calculated. Each visit was completed in approximately 5 minutes, with subsequent documentation and coordination taking an additional 5 to 10 minutes. During the launch of this service, the oncology pharmacy resident provided all coverage of the clinic. Oversite of the resident was provided by hematology/oncology clinical pharmacy specialists. We have continued to utilize pharmacy resident coverage since that time to meet education needs and keep the estimated cost per visit low. Another option in the case that pharmacy residents are not available would be utilization of a pharmacy technician, intern, or professional student to conduct the adherence and tolerability phone assessments. Our escalation protocol allows intervention by clinical pharmacy specialist and/or other health care providers when necessary. Trainees have only required basic training on how to use the protocol.
Limitations
Due to this study’s retrospective design, an inherent limitation is dependence on prescriber and refill records for documentation of initiation and discontinuation dates. Therefore, only the association of impact of pharmacist intervention on medication adherence can be determined as opposed to causation. We did not take into account discrepancies in day supply secondary to ‘held’ therapies, dose reductions, or doses supplied during an inpatient admission, which may alter estimates of MPR and cost-savings data. Patients in the postimplementation group intentionally received a 5 to 7-day supply buffer to account for potential prescription delivery delays due to holidays and inclement weather. This would indicate that the patients in the postimplementation group would have 15% oversupply due to the 5-day supply buffer, thereby skewing MPR values. This study did not account for cost avoidance resulting from early identification and management of toxicity. Finally, the postimplementation data only spans 4 months and a longer duration of time is needed to more accurately determine sustainability of renewal clinic interventions and provide comprehensive evaluation of cost-avoidance.
Conclusion
Implementation of an OAN renewal clinic was associated with an increase in MPR, improved proportion of patients considered adherent, and an estimated $36,335 cost-savings. However, prospective evaluation and a longer study duration are needed to determine causality of improved adherence and cost-savings associated with a pharmacist-driven OAN renewal clinic.
1. Ganesan P, Sagar TG, Dubashi B, et al. Nonadherence to imatinib adversely affects event free survival in chronic phase chronic myeloid leukemia. Am J Hematol 2011; 86: 471-474. doi:10.1002/ajh.22019
2. Marin D, Bazeos A, Mahon FX, et al. Adherence is the critical factor for achieving molecular responses in patients with chronic myeloid leukemia who achieve complete cytogenetic responses on imatinib. J Clin Oncol 2010; 28: 2381-2388. doi:10.1200/JCO.2009.26.3087
3. McCowan C, Shearer J, Donnan PT, et al. Cohort study examining tamoxifen adherence and its relationship to mortality in women with breast cancer. Br J Cancer 2008; 99: 1763-1768. doi:10.1038/sj.bjc.6604758
4. Lexicomp Online. Sunitinib. Hudson, Ohio: Lexi-Comp, Inc; August 20, 2019.
5. Babiker A, El Husseini M, Al Nemri A, et al. Health care professional development: Working as a team to improve patient care. Sudan J Paediatr. 2014;14(2):9-16.
6. Spence MM, Makarem AF, Reyes SL, et al. Evaluation of an outpatient pharmacy clinical services program on adherence and clinical outcomes among patients with diabetes and/or coronary artery disease. J Manag Care Spec Pharm. 2014;20(10):1036-1045. doi:10.18553/jmcp.2014.20.10.1036
7. Holle LM, Puri S, Clement JM. Physician-pharmacist collaboration for oral chemotherapy monitoring: Insights from an academic genitourinary oncology practice. J Oncol Pharm Pract 2015; doi:10.1177/1078155215581524
8. Muluneh B, Schneider M, Faso A, et al. Improved Adherence Rates and Clinical Outcomes of an Integrated, Closed-Loop, Pharmacist-Led Oral Chemotherapy Management Program. Journal of Oncology Practice. 2018;14(6):371-333. doi:10.1200/JOP.17.00039.
9. Font R, Espinas JA, Gil-Gil M, et al. Prescription refill, patient self-report and physician report in assessing adherence to oral endocrine therapy in early breast cancer patients: a retrospective cohort study in Catalonia, Spain. British Journal of Cancer. 2012 ;107(8):1249-1256. doi:10.1038/bjc.2012.389.
10. Anderson KR, Chambers CR, Lam N, et al. Medication adherence among adults prescribed imatinib, dasatinib, or nilotinib for the treatment of chronic myeloid leukemia. J Oncol Pharm Practice. 2015;21(1):19–25. doi:10.1177/1078155213520261
11. Weingart SN, Brown E, Bach PB, et al. NCCN Task Force Report: oral chemotherapy. J Natl Compr Canc Netw. 2008;6(3): S1-S14.
Evaluation of oral antineoplastic agent (OAN) adherence patterns have identified correlations between nonadherence or over-adherence and poorer disease-related outcomes. Multiple studies have focused on imatinib use in chronic myeloid leukemia (CML) due to its continuous, long-term use. A study by Ganesan and colleagues found that nonadherence to imatinib showed a significant decrease in 5-year event-free survival between 76.7% of adherent participants compared with 59.8% of nonadherent participants.1 This study found that 44% of patients who were adherent to imatinib achieved complete cytogenetic response vs only 26% of patients who were nonadherent. In another study of imatinib for CML, major molecular response (MMR) was strongly correlated with adherence and no patients with adherence < 80% were able to achieve MMR.2 Similarly, in studies of tamoxifen for breast cancer, < 80% adherence resulted in a 10% decrease in survival when compared to those who were more adherent.3,4
In addition to the clinical implications of nonadherence, there can be a significant cost associated with suboptimal use of these medications. The price of a single dose of OAN medication may cost as much as $440.5
The benefits of multidisciplinary care teams have been identified in many studies.6,7 While studies are limited in oncology, pharmacists provide vital contributions to the oncology multidisciplinary team when managing OANs as these health care professionals have expert knowledge of the medications, potential adverse events (AEs), and necessary monitoring parameters.8 In one study, patients seen by the pharmacist-led oral chemotherapy management program experienced improved clinical outcomes and response to therapy when compared with preintervention patients (early molecular response, 88.9% vs 54.8%, P = .01; major molecular response, 83.3% vs 57.6%, P = .06).9 During the study, 318 AEs were reported, leading to 235 pharmacist interventions to ameliorate AEs and improve adherence.
The primary objective of this study was to measure the impact of a pharmacist-driven OAN renewal clinic on medication adherence. The secondary objective was to estimate cost-savings of this new service.
Methods
Prior to July 2014, several limitations were identified related to OAN prescribing and monitoring at the Richard L. Roudebush Veterans Affairs Medical Center in Indianapolis, Indiana (RLRVAMC). The prescription ordering process relied primarily on the patient to initiate refills, rather than the prescriber OAN prescriptions also lacked consistency for number of refills or quantities dispensed. Furthermore, ordering of antineoplastic products was not limited to hematology/oncology providers. Patients were identified with significant supply on hand at the time of medication discontinuation, creating concerns for medication waste, tolerability, and nonadherence.
As a result, opportunities were identified to improve the prescribing process, recommended monitoring, toxicity and tolerability evaluation, medication reconciliation, and medication adherence. In July of 2014, the RLRVAMC adopted a new chemotherapy order entry system capable of restricting prescriptions to hematology/oncology providers and limiting dispensed quantities and refill amounts. A comprehensive pharmacist driven OAN renewal clinic was implemented on September 1, 2014 with the goal of improving long-term adherence and tolerability, in addition to minimizing medication waste.
Patients were eligible for enrollment in the clinic if they had a cancer diagnosis and were concomitantly prescribed an OAN outlined in Table 1. All eligible patients were automatically enrolled in the clinic when they were deemed stable on their OAN by a hematology/oncology pharmacy specialist. Stability was defined as ≤ Grade 1 symptoms associated with the toxicities of OAN therapy managed with or without intervention as defined by the Common Terminology Criteria for Adverse Events (CTCAE) version 4.03. Once enrolled in the renewal clinic, patients were called by an oncology pharmacy resident (PGY2) 1 week prior to any OAN refill due date. Patients were asked a series of 5 adherence and tolerability questions (Table 2) to evaluate renewal criteria for approval or need for further evaluation. These questions were developed based on targeted information and published reports on monitoring adherence.10,11 Criteria for renewal included: < 10% self-reported missed doses of the OAN during the previous dispensing period, no hospitalizations or emergency department visits since most recent hematology/oncology provider appointment, no changes to concomitant medication therapies, and no new or worsening medication-related AEs. Patients meeting all criteria were given a 30-day supply of OAN. Prescribing, dispensing, and delivery of OAN were facilitated by the pharmacist. Patient cases that did not meet criteria for renewal were escalated to the hematology/oncology provider or oncology clinical pharmacy specialist for further evaluation.
Study Design and Setting
This was a pre/post retrospective cohort, quality improvement study of patients enrolled in the RLRVAMC OAN pharmacist renewal clinic. The study was deemed exempt from institutional review board (IRB) by the US Department of Veterans Affairs (VA) Research and Development Department.
Study Population
Patients were included in the preimplementation group if they had received at least 2 prescriptions of an eligible OAN. Therapy for the preimplementation group was required to be a monthly duration > 21 days and between the dates of September 1, 2013 and August 31, 2014. Patients were included in the postimplementation group if they had received at least 2 prescriptions of the studied OANs between September 1, 2014 and January 31, 2015. Patients were excluded if they had filled < 2 prescriptions of OAN; were managed by a non-VA oncologist or hematologist; or received an OAN other than those listed in Table 1.
Data Collection
For all patients in both the pre- and postimplementation cohorts, a standardized data collection tool was used to collect the following via electronic health record review by a PGY2 oncology resident: age, race, gender, oral antineoplastic agent, refill dates, days’ supply, estimated unit cost per dose cancer diagnosis, distance from the RLRVAMC, copay status, presence of hospitalizations/ED visits/dosage reductions, discontinuation rates, reasons for discontinuation, and total number of current prescriptions. The presence or absence of dosage reductions were collected to identify concerns for tolerability, but only the original dose for the preimplementation group and dosage at time of clinic enrollment for the postimplementation group was included in the analysis.
Outcomes and Statistical Analyses
The primary outcome was medication adherence defined as the median medication possession ratio (MPR) before and after implementation of the clinic. Secondary outcomes included the proportion of patients who were adherent from before implementation to after and estimated cost-savings of this clinic after implementation. MPR was used to estimate medication adherence by taking the cumulative day supply of medication on hand divided by the number of days on therapy.12 Number of days on therapy was determined by taking the difference on the start date of the new medication regimen and the discontinuation date of the same regimen. Patients were grouped by adherence into one of the following categories: < 0.8, 0.8 to 0.89, 0.9 to 1, and > 1.1. Patients were considered adherent if they reported taking ≥ 90% (MPR ≥ 0.9) of prescribed doses, adopted from the study by Anderson and colleagues.12 A patient with an MPR > 1, likely due to filling prior to the anticipated refill date, was considered 100% adherent (MPR = 1). If a patient switched OAN during the study, both agents were included as separate entities.
A conservative estimate of cost-savings was made by multiplying the RLRVAMC cost per unit of medication at time of initial prescription fill by the number of units taken each day multiplied by the total days’ supply on hand at time of therapy discontinuation. Patients with an MPR < 1 at time of therapy discontinuation were assumed to have zero remaining units on hand and zero cost savings was estimated. Waste, for purposes of cost-savings, was calculated for all MPR values > 1. Additional supply anticipated to be on hand from dose reductions was not included in the estimated cost of unused medication.
Descriptive statistics compared demographic characteristics between the pre- and postimplementation groups. MPR data were not normally distributed, which required the use of nonparametric Mann-Whitney U tests to compare pre- and postMPRs. Pearson χ2 compared the proportion of adherent patients between groups while descriptive statistics were used to estimate cost savings. Significance was determined based on a P value < .05. IBM SPSS Statistics software was used for all statistical analyses. As this was a complete sample of all eligible subjects, no sample size calculation was performed.
Results
In the preimplementation period, 246 patients received an OAN and 61 patients received an OAN in the postimplementation period (Figure 1). Of the 246 patients in the preimplementation period, 98 were eligible and included in the preimplementation group. Similarly, of the 61 patients in the postimplementation period, 35 patients met inclusion criteria for the postimplementation group. The study population was predominantly male with an average age of approximately 70 years in both groups (Table 3). More than 70% of the population in each group was White. No statistically significant differences between groups were identified. The most commonly prescribed OAN in the preimplementation group were abiraterone, imatinib, and enzalutamide (Table 3). In the postimplementation group, the most commonly prescribed agents were abiraterone, imatinib, pazopanib, and dasatinib. No significant differences were observed in prescribing of individual agents between the pre- and postimplementation groups or other characteristics that may affect adherence including patient copay status, number of concomitant medications, and driving distance from the RLRVAMC.
Thirty-six (36.7%) patients in the preimplementation group were considered nonadherent (MPR < 0.9) and 18 (18.4%) had an MPR < 0.8. Fifteen (15.3%) patients in the preimplementation clinic were considered overadherent (MPR > 1.1). Forty-seven (47.9%) patients in the preimplementation group were considered adherent (MPR 0.9 - 1.1) while all 35 (100%) patients in the postimplementation group were considered adherent (MPR 0.9 - 1.1). No non- or overadherent patients were identified in the postimplementation group (Figure 2). The median MPR for all patients in the preimplementation group was 0.94 compared with 1.06 (P < .001) in the postimplementation group.
Thirty-five (35.7%) patients had therapy discontinued or held in the preimplementation group compared with 2 (5.7%) patients in the postimplementation group (P < .001). Reasons for discontinuation in the preimplementation group included disease progression (n = 27), death (n = 3), lost to follow up (n = 2), and intolerability of therapy (n = 3). Both patients that discontinued therapy in the postimplementation group did so due to disease progression. Of the 35 patients who had their OAN discontinued or held in the preimplementation group, 14 patients had excess supply on hand at time of discontinuation. The estimated value of the unused medication was $37,890. Nine (25%) of the 35 patients who discontinued therapy had a dosage reduction during the course of therapy and the additional supply was not included in the cost estimate. Similarly, 1 of the 2 patients in the postimplementation group had their OAN discontinued during study. The cost of oversupply of medication at the time of therapy discontinuation was estimated at $1,555. No patients in the postimplementation group had dose reductions. After implementation of the OAN renewal clinic, the total cost savings between pre ($37,890) and postimplementation ($1,555) groups was $36,355.
Discussion
OANs are widely used therapies, with more than 25 million doses administered per year in the United States alone.12 The use of these agents will continue to grow as more targeted agents become available and patients request more convenient treatment options. The role for hematology/oncology clinical pharmacy services must adapt to this increased usage of OANs, including increasing pharmacist involvement in medication education, adherence and tolerability assessments, and proactive drug interaction monitoring.However, additional research is needed to determine optimal management strategies.
Our study aimed to compare OAN adherence among patients at a tertiary care VA hospital before and after implementation of a renewal clinic. The preimplementation population had a median MPR of 0.94 compared with 1.06 in the postimplementation group (P < .001). Although an ideal MPR is 1.0, we aimed for a slightly higher MPR to allow a supply buffer in the event of prescription delivery delays, as more than 90% of prescriptions are mailed to patients from a regional mail-order pharmacy. Importantly, the median MPRs do not adequately convey the impact from this clinic. The proportion of patients who were considered adherent to OANs increased from 47.9% in the preimplementation to 100% in the postimplementation period. These finding suggest that the clinical pharmacist role to assess and encourage adherence through monitoring tolerability of these OANs improved the overall medication taking experience of these patients.
Upon initial evaluation of adherence pre- and postimplementation, median adherence rates in both groups appeared to be above goal at 0.94 and 1.06 respectively. Patients in the postimplementation group intentionally received a 5- to 7-day supply buffer to account for potential prescription delivery delays due to holidays and inclement weather. This would indicate that the patients in the postimplementation group would have 15% oversupply due to the 5-day supply buffer. After correcting for patients with confounding reasons for excess (dose reductions, breaks in treatment, etc.), the median MPR in the prerefill clinic group decreased to 0.9 and the MPR in the postrefill clinic group increased slightly to 1.08. Although the median adherence rate in both the pre- and postimplementation groups were above goal of 0.90, 36% of the patients in the preimplementation group were considered nonadherent (MPR < 0.9) compared with no patients in the postimplementation group. Therefore, our intervention to improve patient adherence appeared to be beneficial at our institution.
In addition to improving adherence, one of the goals of the renewal clinic was to minimize excess supply at the time of therapy discontinuation. This was accomplished by aligning medication fills with medical visits and objective monitoring, as well as limiting supply to no more than 30 days. Of the patients in the postimplementation group, only 1 patient had remaining medication at the time of therapy discontinuation compared with 14 patients in the preimplementation group. The estimated cost savings from excess supply was $36,335. Limiting the amount of unused supply not only saves money for the patient and the institution, but also decreases opportunity for improper hazardous waste disposal and unnecessary exposure of hazardous materials to others.
Our results show the pharmacist intervention in the coordination of renewals improved adherence, minimized medication waste, and saved money. The cost of pharmacist time participating in the refill clinic was not calculated. Each visit was completed in approximately 5 minutes, with subsequent documentation and coordination taking an additional 5 to 10 minutes. During the launch of this service, the oncology pharmacy resident provided all coverage of the clinic. Oversite of the resident was provided by hematology/oncology clinical pharmacy specialists. We have continued to utilize pharmacy resident coverage since that time to meet education needs and keep the estimated cost per visit low. Another option in the case that pharmacy residents are not available would be utilization of a pharmacy technician, intern, or professional student to conduct the adherence and tolerability phone assessments. Our escalation protocol allows intervention by clinical pharmacy specialist and/or other health care providers when necessary. Trainees have only required basic training on how to use the protocol.
Limitations
Due to this study’s retrospective design, an inherent limitation is dependence on prescriber and refill records for documentation of initiation and discontinuation dates. Therefore, only the association of impact of pharmacist intervention on medication adherence can be determined as opposed to causation. We did not take into account discrepancies in day supply secondary to ‘held’ therapies, dose reductions, or doses supplied during an inpatient admission, which may alter estimates of MPR and cost-savings data. Patients in the postimplementation group intentionally received a 5 to 7-day supply buffer to account for potential prescription delivery delays due to holidays and inclement weather. This would indicate that the patients in the postimplementation group would have 15% oversupply due to the 5-day supply buffer, thereby skewing MPR values. This study did not account for cost avoidance resulting from early identification and management of toxicity. Finally, the postimplementation data only spans 4 months and a longer duration of time is needed to more accurately determine sustainability of renewal clinic interventions and provide comprehensive evaluation of cost-avoidance.
Conclusion
Implementation of an OAN renewal clinic was associated with an increase in MPR, improved proportion of patients considered adherent, and an estimated $36,335 cost-savings. However, prospective evaluation and a longer study duration are needed to determine causality of improved adherence and cost-savings associated with a pharmacist-driven OAN renewal clinic.
1. Ganesan P, Sagar TG, Dubashi B, et al. Nonadherence to imatinib adversely affects event free survival in chronic phase chronic myeloid leukemia. Am J Hematol 2011; 86: 471-474. doi:10.1002/ajh.22019
2. Marin D, Bazeos A, Mahon FX, et al. Adherence is the critical factor for achieving molecular responses in patients with chronic myeloid leukemia who achieve complete cytogenetic responses on imatinib. J Clin Oncol 2010; 28: 2381-2388. doi:10.1200/JCO.2009.26.3087
3. McCowan C, Shearer J, Donnan PT, et al. Cohort study examining tamoxifen adherence and its relationship to mortality in women with breast cancer. Br J Cancer 2008; 99: 1763-1768. doi:10.1038/sj.bjc.6604758
4. Lexicomp Online. Sunitinib. Hudson, Ohio: Lexi-Comp, Inc; August 20, 2019.
5. Babiker A, El Husseini M, Al Nemri A, et al. Health care professional development: Working as a team to improve patient care. Sudan J Paediatr. 2014;14(2):9-16.
6. Spence MM, Makarem AF, Reyes SL, et al. Evaluation of an outpatient pharmacy clinical services program on adherence and clinical outcomes among patients with diabetes and/or coronary artery disease. J Manag Care Spec Pharm. 2014;20(10):1036-1045. doi:10.18553/jmcp.2014.20.10.1036
7. Holle LM, Puri S, Clement JM. Physician-pharmacist collaboration for oral chemotherapy monitoring: Insights from an academic genitourinary oncology practice. J Oncol Pharm Pract 2015; doi:10.1177/1078155215581524
8. Muluneh B, Schneider M, Faso A, et al. Improved Adherence Rates and Clinical Outcomes of an Integrated, Closed-Loop, Pharmacist-Led Oral Chemotherapy Management Program. Journal of Oncology Practice. 2018;14(6):371-333. doi:10.1200/JOP.17.00039.
9. Font R, Espinas JA, Gil-Gil M, et al. Prescription refill, patient self-report and physician report in assessing adherence to oral endocrine therapy in early breast cancer patients: a retrospective cohort study in Catalonia, Spain. British Journal of Cancer. 2012 ;107(8):1249-1256. doi:10.1038/bjc.2012.389.
10. Anderson KR, Chambers CR, Lam N, et al. Medication adherence among adults prescribed imatinib, dasatinib, or nilotinib for the treatment of chronic myeloid leukemia. J Oncol Pharm Practice. 2015;21(1):19–25. doi:10.1177/1078155213520261
11. Weingart SN, Brown E, Bach PB, et al. NCCN Task Force Report: oral chemotherapy. J Natl Compr Canc Netw. 2008;6(3): S1-S14.
Clinical Impact of Initiation of U-500 Insulin vs Continuation of U-100 Insulin in Subjects With Diabetes
More than 70% of Americans are overweight or obese and 1 in 10 has type 2 diabetes mellitus (T2DM). In the last 20 years, the prevalence of obesity and DM has each increased drastically according to the Centers for Disease Control and Prevention.1,2 Thus, an increase in severe insulin-resistant DM is predicted. Severe insulin resistance occurs when insulin doses exceed 200 units per day or 2 units/kg per day.3-5 Treating this condition demands large volumes of U-100 insulin and a high frequency of injections (usually 4-7 per day), which can lead to reduced patient adherence.8-10 Likewise, large injected volumes are more painful and can lead to altered absorption.3,9-11
U-500 insulin (500 units/mL) is 5 times more concentrated than U-100 insulin and has advantages in the management of severe insulin-resistant DM.11-13 Its pharmacokinetic profile is unique, for the clinical effect can last for up to 24 hours.4-6 U-500 can replace basal-bolus and other complex insulin regimens, offering convenient, effective glycemic control with 2 or 3 injections per day.11,14-20 U-500 can also improve the quality of life and adherence compared with formulations that require more frequent injections.7,14,21 Historically, only exceptional or “special” cases were treated with U-500, but demand for concentrated insulins has increased in the last decade as clinicians adjust their care for this growing patient population.17
The purpose of this study was to determine whether a population of subjects with severe insulin-resistant T2DM would benefit from the use of U-500 vs U-100 insulin regimens. The hypothesis was that this population would obtain equal or better glycemic control while achieving improved adherence. Other studies have demonstrated that U-500 yields improvements in glycemic control but also potentially increases hypoglycemic episodes.15-18,22-24 To our knowledge, this study is the first to evaluate the clinical outcomes of subjects with severe insulin-resistant T2DM who changed from U-100 to U-500 vs subjects who remained on high-dose U-100 insulin.
Methods
This was a single-site, retrospective chart review of subjects with T2DM who attended the endocrinology specialty clinic at the James A. Haley Veterans’ Hospital (JAHVA) in Tampa, Florida, between July 2002 and June 2011. The study included a group of subjects using U-500 insulin and a comparison group using U-100 insulin. The study was approved by the JAHVA Research & Development Committee and by the University of South Florida Institutional Review Board.
Inclusion criteria included diagnosis of T2DM, body mass index (BMI) of more than 30, use of U-500 insulin, or > 200 units daily of U-100 insulin. Exclusion criteria included hypoglycemia unawareness, type 1 DM, and use of an insulin pump. A total of 142 subjects met the inclusion criteria (68 in the U-500 group and 74 in the U-100 group).
All study subjects had at least 1 DM education session. U-500 subjects used insulin vials and 1-mL volumetric hypodermal syringes. All U-500 prescriptions were issued electronically in units and volume (U-500 insulin was available exclusively in vials during the time frame from which data were collected). Subjects in the U-100 group used insulin vials or pen devices. Laboratory studies were processed in house by the institution using high-pressure liquid chromatography to determine hemoglobin A1C (Hb A1C) levels. All study subjects required at least 2 Hb A1C measurements over the observed 12 months for inclusion.
Transition to U-500 Insulin
U-500 transition was considered routinely and presented as an option for patients requiring > 200 units of insulin daily. The transition criteria included adherence to medications, follow-up appointments, and glucose monitoring recommendations, and ability to learn and apply insulin self-adjustment instructions. All subjects were given an additional U-500 insulin education session before transition. The endocrinologist calculated all starting doses by reducing the total daily dose by 20%.
Data Collection
Data were collected using the automatic data mining tools within the JAHVA Computerized Patient Record System and confirmed individually by clinical staff. Demographic data included age, race, and sex. Other parameters were weight; BMI; Hb A1C; estimated glomerular filtration rate (eGFR); duration of DM; use of metformin and other oral agents; total daily insulin dose; number of daily injections; prior history of atherosclerotic cardiovascular disease (ASCVD), including coronary artery disease (CAD), cerebrovascular accident (CVA), or peripheral vascular disease (PVD); occurrence of severe hypoglycemia (symptomatic hypoglycemia requiring treatment assistance from another individual) and of new cardiovascular events, classified as CAD, CVA, or PVD.
For the U-500 group, data were collected and analyzed for the 3 months before (baseline) and the 12 months after the initiation of concentrated insulin. For the U-100 group, data were collected and analyzed for the comparable 3 months before (baseline) and the 12 months after the first clinic visit in which the subject started using more than 200 units per day of U-100. Frequency of follow-up visits was individualized according to clinical needs.
Clinical Endpoints
Primary outcomes included changes in Hb A1C from baseline to the following 12 months, and the occurrence of severe hypoglycemia. Secondary outcomes included the occurrence of new ASCVD events during the study, and changes in weight, BMI, and number of injections.
Statistical Analysis
The primary and secondary outcomes were assessed through univariate and multivariate general linear models. Multivariate models were used to compare differences in the variation of Hb A1C over time. Data were incomplete for the Hb A1C in 27 subjects, 6% of the dataset (Each subject had more than one variable or observation). Therefore, a multiple imputation was used to account for the incompleteness on Hb A1C (value substitutions by the mean and by the prior Hb A1C and models were balanced against the unaltered data). A P value of ≤ .05 was used to determine statistical significance. The statistical analyses were performed using IBM SPSS Statistics 21.
Results
Most patients were male (94%) of white race (86%), with a mean age of 57 years and comparable duration of DM (Table 1). Demographics were balanced between the groups, except for weight and BMI, both higher in the U-500 group (P < .001). Use of oral antidiabetic agents was not significantly different between groups, nor were comorbid conditions, with nearly 50% of subjects in each group affected by CKD and ASCVD, of which CAD was the most common (approximately 40% of both groups). Only about one-third of subjects used metformin and/or other oral agents, likely due to the high prevalence of CKD (contraindicating metformin) and high insulin requirements (due to correlation with β cell failure). A subgroup analysis of subjects on metformin did not demonstrate significant differences in risk of severe hypoglycemia or in Hb A1C levels (data not shown).
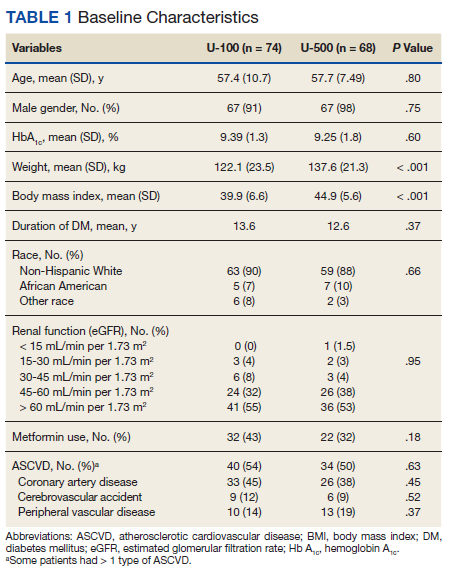
Both groups had similar initial Hb A1C baselines (> 9%) and both improved glycemic control during the study period. However, the Hb A1C reduction was greater in the U-500 group (P= .034), 0.84% vs 0.56% for U-100 and the between-groups difference was 0.4%. (Figure 1, Tables 2 and 3).
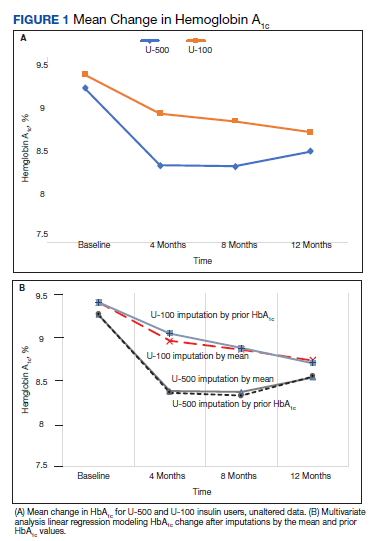
The univariate general linear model shows a statistically significant difference in the levels of Hb A1C within each treatment group, regardless of the imputation strategy. However, the differences were not significant when comparing postintervention Hb A1C means between groups with unaltered data (P = .23), because the U-500 group Hb A1C improvement gap narrowed at the end of study. In the multivariate analysis, irrespective of imputation method, the differences in Hb A1C between group treated with U-100 and U-500 were statistically significant (Table 3).
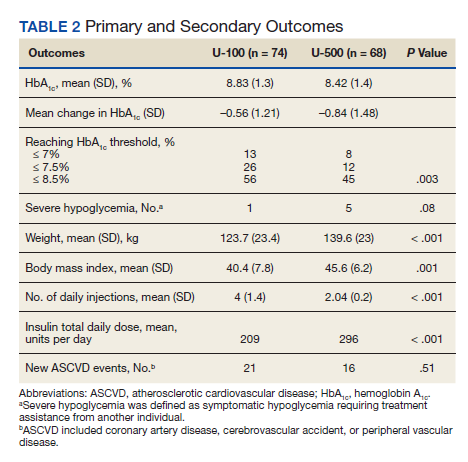
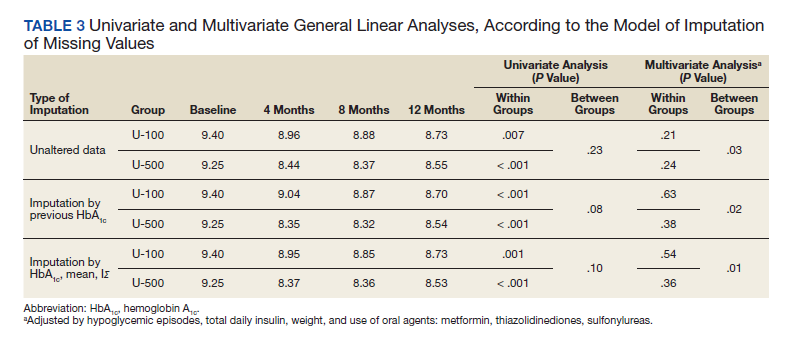
Overall, more subjects in the U-500 group than in the U-100 group achieved Hb A1C levels < 8.5% (56% vs 46%, respectively, P = .003) and the proportion of subjects achieving Hb A1C levels < 7.5% doubled that of the U-100 group (26% vs 12%; Figure 2). Five subjects in the U-500 group experienced severe hypoglycemia, compared with 1 in the U-100 group (P = .08). The total daily insulin dose was significantly higher in the U-500 group (296 units daily) than in the U-100 group (209 units daily) (P < .001) (Table 2). Baseline weight and BMI differences were also significant for the U-500 and U-100 groups (P < .001). Weight gain of approximately 2 kg occurred in both groups, a change that was not statistically significant (P = .79)
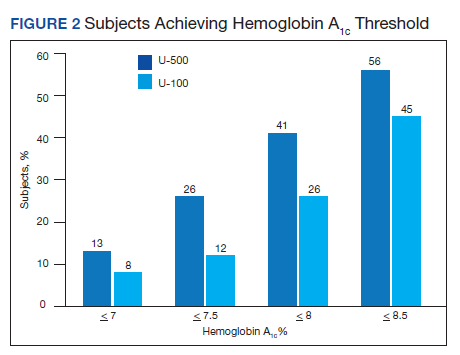
There were 21 new ASCVD events in the U-100 and 16 in the U-500 group (P = .51) and there were no statistically significant differences in the incidence of new CAD, PVD or CVA events. The U-500 group required significantly fewer injections than U-100 insulin users (2 vs 4; P < .001).
Discussion
The purpose of the study was to compare subjects with obesity and T2DM using U-500 concentrated insulin with similarly matched subjects using U-100 insulin. Available studies using U-500 insulin, including prospective trials, have reported the experience after transitioning patients who “failed” U-100 regimens.13-16,18,21-24 This failure is a relative and transient condition that, in theory, could be improved with medical intervention and lifestyle changes. Such changes cannot be easily quantified in a clinical trial or retrospective study without a control group. This study was an attempt to fill this knowledge gap.
The U-500 intervention resulted in a 0.8% overall reduction in Hb A1C and a significant 0.4% reduction compared to subjects using U-100. While both groups had improvement in Hb A1C , U-500 was associated with superior reductions in Hb A1C . This finding confirms prior assertions that U-500, compared with U-100, is associated with larger Hb A1C improvement.14-16
The preintervention and postintervention Hb A1C means were > 8% in both groups. This finding suggests that lowering Hb A1C is challenging, similar to published results demonstrating that Hb A1C levels < 7% are achieved by fewer than one-third of U-500 users.16-18 The explanation for this finding remains elusive, due to the methodologic limitations of a retrospective analysis. A possible explanation is the high prevalence of CKD and ASCVD among the study population, conditions which, according to guidelines justify less aggressive glycemic control efforts.25 Multiple prior studies using retrospective data8,13-16 and 2 prospective trials18,22 demonstrated similar Hb A1C reductions after failure of U-100 regimens.
In this study, U-500 resulted in a nominal increase in the risk of severe hypoglycemic episodes. A detailed review of the events found that most of these patients had preestablished CKD and ASCVD, and half of the subjects with sever hypoglycemic episodes had new vascular events during the study (Appendix). These findings suggest a possible correlation between CKD and ASCVD complications and the risk of severe hypoglycemic events. Pharmacokinetic profiles for U-500 have not been studied in subjects with CKD, but the clinical effect of CKD is likely prolonged by the expected reduction in insulin clearance. Similarly, the frailty associated with preexisting ASCVD, or the related polypharmacy, could be factors increasing the risk of hypoglycemia and deserve further study.
Most of the U-500 subjects used it twice daily in this study, which could have contributed to the higher hypoglycemia rate. In a prospective randomized trial Hood and colleagues reported a rate of symptomatic hypoglycemia exceeding 90% in the 2 study groups, and 8 subjects (of 325 total) had severe hypoglycemia during the 6-month observation. The group assigned to 2 daily injections had a significantly higher rate of hypoglycemic events compared with a group that had 3 injections per day.18 Additional studies are required to ascertain whether U-500, compared with specific U-100 regimens (basal-bolus vs premixed; human vs insulin analogs), results in a higher risk of severe hypoglycemia.
This study also investigated the incidence of new cardiovascular events, and no difference was found between the 2 groups. A longer observation would be required to better assess whether U-500 therapy can reduce the incidence of microvascular and macrovascular complications. The similar incidence of complications is further evidence of the similarity between the 2 studied groups. It was also reassuring to find that weight gains were small and nearly identical in both insulin groups.
Strengths and Limitations
This study has several limitations. Data about hospitalizations for congestive heart failure, amputations, progression of diabetic retinopathy, neuropathy, and nephropathy were not collected for this analysis. As both groups of subjects were relatively small, statistical power to assess outcomes is a concern. Retrospective chart reviews may also be affected by incomplete data collections and multiple biases. No data were available for other hypoglycemic episodes, especially to calculate the rate of the more common forms of hypoglycemia. The period of data analyzed spanned only about 15 months. A longer, longitudinal assessment of the differences between these 2 groups may yield more differences, and clearer results and conclusions. Moreover, the data set had aged before publication of this report; however, the authors think that the analysis and information remain highly clinically relevant. The uncommon use of U-500, and prominence as a “special case” insulin may also lead to a detection bias for severe hypoglycemia in the U-500 group. In contrast, lapses in documentation of hypoglycemia in subjects using U-100 could have occurred. Finally, the differences in total daily dose and body weight among groups were significant and may reflect on important physiologic differences between the 2 groups that may affect the reproducibility of our results.
Nevertheless, this study had notable strengths. Comparing U-500 insulin users with similar subjects using U-100 over a period of time provides head-to-head data with potentially important clinical utility. Also, we collected and analyzed a sizable number of clinically important variables, including cardiovascular risk factors, the occurrence of new cardiovascular events, and prevalence of renal disease. The use of linear regression and multivariate analysis using multiple models also strengthened the results. Previous studies compared the outcomes in subjects using U-500 insulin with only their historical selves.8,13-16,18,19,22-25 Therefore, these studies analyzed the data for preconversion and postconversion of U-500 only and consistently favored U-500. This design in a retrospective study cannot eliminate the selection and/or intervention biases, as the subjects of study had inevitably “failed” prior therapies. Similarly, there is no prospective clinical trial data comparing patients on U-500 with patients on high doses of U-100 insulin. Finally, the patients in our study had high rates of comorbidities, which may have increased the applicability of our results to those of “real-life” patients in the community. To our knowledge, no other study has attempted a similar study design approach either prospectively or retrospectively.
Conclusions
In this population of elderly veterans with severely insulin-resistant T2DM, with a high incidence of CKD and ASCVD, U-500 insulin was associated with significantly greater reductions in Hb A1C than U-100 insulin-based regimens, while requiring fewer injections. No difference was noted in the incidence of new ASCVD events. More studies are needed to assess whether U-500 may increase the risk of severe hypoglycemic episodes.
Acknowledgments
The authors recognize the invaluable help provided by the editorial staff of University of South Florida IMpact, the Intramural Review to Support Research and Scientific Publication, and especially to Richard F. Lockey, MD, who has mentored us in this beautiful journey of scientific writing and for his editorial assistance. A portion of this study preliminary data was presented as an abstract at ENDO 2013, The Endocrine Society Annual meeting in San Francisco, CA, June 15-18, 2013.
Appendix. Severe Hypoglycemic Events
Subject 1: U-500 user, 61-year-old African American male. Hypoglycemia occurred during fasting and was associated with a seizure-like event 9 months after transition to concentrated insulin. He was taken by ambulance to a local hospital. No additional data were obtained. Hb A1C was 8.2% in the month before the episode (lowest of the studied period) and increased to 9.1% in the last segment of the study.
Subject 2: U-500 user, 57-year-old white male. The severe hypoglycemic episode occurred approximately 8 months after transition. His Hb A1C was 5.6% around the time of the event, the lowest of the studied period, and increased to 6.8% over the next 4 months. No other data were available.
Subject 3: U-500 user, 67-year-old white male. The event occurred at home in the morning while fasting, 3 months after transition. He was assisted by his family. Hb A1C was 7.1% 10 weeks after the event and was 7% at the end of the studied period. He had a history of CKD and PVD.
Subject 4: U-500 user, 68-year-old white male. He presented with altered consciousness, hypoglycemia, and elevated troponin levels, which was later confirmed as a non-ST elevation myocardial infarction (NSTEMI), 7 months after transition. Hb A1C during the events was 7.1% and was followed by a 9.3% level 9 weeks later. He had history of CKD and PVD.
Subject 5: U-500 user, 67-year-old white man. Hypoglycemia occurred 6 months after transition to U-500. Hb A1C was 8.4% 2 months prior, and was followed by a 7% during the admission for severe hypoglycemia. 3 months later, his HbA1c rose to 8.2%. He had an extensive history of CAD and had a NSTEMI during the study period.
Subject 6: U-100 user, 65-year-old white man. He was found unconscious in the morning while fasting, 6 months after his first clinic visit. He had CKD and advanced ASCVD with prior CAD, PVD, and CVA. He had also had a recent CVA that had affected his movement and cognition.
1. Hales CM, Carroll MD, Fryar CD, Ogden CL. Prevalence of obesity among adults and youth: United States, 2015–2016. NCHS data brief no. 288. Published October 2017. Accessed January 29, 2021. https://www.cdc.gov/nchs/products/databriefs/db288.htm
2. Centers for Disease Control and Prevention. Diabetes and prediabetes: CDC works to prevent type 2 diabetes and improve the health of all people with diabetes. Updated November 30, 2020. Accessed February 17, 2021. https://www.cdc.gov/chronicdisease/resources/publications/factsheets/diabetes-prediabetes.htm
3. Cochran E, Gorden P. Use of U-500 insulin in the treatment of severe insulin resistance. Insulin. 2008;3(4):211-218 [Published correction appears in Insulin. 2009;4(1):81]. doi:10.1016/S1557-0843(08)80049-8
4. Shrestha RT, Kumar AF, Taddese A, et al. Duration and onset of action of high dose U-500 regular insulin in severely insulin resistant subjects with type 2 diabetes. Endocrinol Diabetes Metab. 2018;1(4):e00041. Published 2018 Sep 10. doi:10.1002/edm2.41
5. Dailey AM, Tannock LR. Extreme insulin resistance: indications and approaches to the use of U-500 insulin in type 2 diabetes mellitus. Curr Diab Rep. 2011;11(2):77-82. doi:10.1007/s11892-010-0167-6
6. de la Peña A, Riddle M, Morrow LA, et al. Pharmacokinetics and pharmacodynamics of high-dose human regular U-500 insulin versus human regular U-100 insulin in healthy obese subjects [published correction appears in Diabetes Care. 2014 Aug;37(8):2414]. Diabetes Care. 2011;34(12):2496-2501. doi:10.2337/dc11-0721
7. Brusko C, Jackson JA, de la Peña A. Comparative properties of U-500 and U-100 regular human insulin. Am J Health Syst Pharm. 2013;70(15):1283-1284. doi:10.2146/130117
8. Dailey AM, Williams S, Taneja D, Tannock LR. Clinical efficacy and patient satisfaction with U-500 insulin use. Diabetes Res Clin Pract. 2010;88(3):259-264. doi:10.1016/j.diabres.2010.02.012
9. Wysham C, Hood RC, Warren ML, Wang T, Morwick TM, Jackson JA. Effect of total daily dose on efficacy, dosing, and safety of 2 dose titration regimens of human regular U-500 insulin in severely insulin-resistant patients with type 2 diabetes. Endocr Pract. 2010;22(6):653-665. doi:10.4158/EP15959.OR
10. Gagnon-Auger M, du Souich P, Baillargeon JP, et al. Dose-dependent delay of the hypoglycemic effect of short-acting insulin analogs in obese subjects with type 2 diabetes: a pharmacokinetic and pharmacodynamic study. Diabetes Care. 2010;33(12):2502-2507. doi:10.2337/dc10-1126
11. Schloot NC, Hood RC, Corrigan SM, Panek RL, Heise T. Concentrated insulins in current clinical practice. Diabetes Res Clin Pract. 2019;148:93-101. doi:10.1016/j.diabres.2018.12.007
12. Lane WS, Cochran EK, Jackson JA, et al. High-dose insulin therapy: is it time for U-500 insulin?. Endocr Pract. 2009;15(1):71-79. doi:10.4158/EP.15.1.71
13. Boldo A, Comi RJ. Clinical experience with U500 insulin: risks and benefits. Endocr Pract. 2012;18(1):56-61. doi:10.4158/EP11163.OR
14. Granata JA, Nawarskas AD, Resch ND, Vigil JM. Evaluating the effect of u-500 insulin therapy on glycemic control in veterans with type 2 diabetes. Clin Diabetes. 2015;33(1):14-19. doi:10.2337/diaclin.33.1.14
15. Eby EL, Zagar AJ, Wang P, et al. Healthcare costs and adherence associated with human regular U-500 versus high-dose U-100 insulin in patients with diabetes. Endocr Pract. 2014;20(7):663-670. doi:10.4158/EP13407.OR
16. Eby EL, Curtis BH, Gelwicks SC, et al. Initiation of human regular U-500 insulin use is associated with improved glycemic control: a real-world US cohort study. BMJ Open Diabetes Res Care. 2015;3(1):e000074. Published 2015 Apr 30. doi:10.1136/bmjdrc-2014-000074
17. Jones P, Idris I. The use of U-500 regular insulin in the management of patients with obesity and insulin resistance. Diabetes Obes Metab. 2013;15(10):882-887. doi:10.1111/dom.12094
18. Hood RC, Arakaki RF, Wysham C, Li YG, Settles JA, Jackson JA. Two treatment approaches for human regular U-500 insulin in patients with type 2 diabetes not achieving adequate glycemic control on high-dose U-100 insulin therapy with or without oral agents: a randomized, titration-to-target clinical trial. Endocr Pract. 2015;21(7):782-793. doi: 10.4158/EP15612.OR
19. Ballani P, Tran MT, Navar MD, Davidson MB. Clinical experience with U-500 regular insulin in obese, markedly insulin-resistant type 2 diabetic patients [published correction appears in Diabetes Care. 2007 Feb;30(2):455]. Diabetes Care. 2006;29(11):2504-2505. doi:10.2337/dc06-1478
20. Davidson MB, Navar MD, Echeverry D, Duran P. U-500 regular insulin: clinical experience and pharmacokinetics in obese, severely insulin-resistant type 2 diabetic patients. Diabetes Care. 2010;33(2):281-283. doi:10.2337/dc09-1490
21. Bulchandani DG, Konrady T, Hamburg MS. Clinical efficacy and patient satisfaction with U-500 insulin pump therapy in patients with type 2 diabetes. Endocr Pract. 2007;13(7):721-725. doi:10.4158/EP.13.7.721
22. Lane WS, Weinrib SL, Rappaport JM, Przestrzelski T. A prospective trial of U500 insulin delivered by Omnipod in patients with type 2 diabetes mellitus and severe insulin resistance [published correction appears in Endocr Pract. 2010 Nov-Dec;16(6):1082]. Endocr Pract. 2010;16(5):778-784. doi:10.4158/EP10014.OR
23. Martin C, Perez-Molinar D, Shah M, Billington C. U500 Disposable Patch Insulin Pump: Results and Discussion of a Veterans Affairs Pilot Study. J Endocr Soc. 2018;2(11):1275-1283. Published 2018 Sep 17. doi:10.1210/js.2018-00198
24. Ziesmer AE, Kelly KC, Guerra PA, George KG, Dunn FL. U500 regular insulin use in insulin-resistant type 2 diabetic veteran patients. Endocr Pract. 2012;18(1):34-38. doi:10.4158/EP11043.OR
25. American Diabetes Association. 6. Glycemic Targets: Standards of Medical Care in Diabetes-2019. Diabetes Care. 2019;42(Suppl 1):S61-S70. doi:10.2337/dc19-S006
More than 70% of Americans are overweight or obese and 1 in 10 has type 2 diabetes mellitus (T2DM). In the last 20 years, the prevalence of obesity and DM has each increased drastically according to the Centers for Disease Control and Prevention.1,2 Thus, an increase in severe insulin-resistant DM is predicted. Severe insulin resistance occurs when insulin doses exceed 200 units per day or 2 units/kg per day.3-5 Treating this condition demands large volumes of U-100 insulin and a high frequency of injections (usually 4-7 per day), which can lead to reduced patient adherence.8-10 Likewise, large injected volumes are more painful and can lead to altered absorption.3,9-11
U-500 insulin (500 units/mL) is 5 times more concentrated than U-100 insulin and has advantages in the management of severe insulin-resistant DM.11-13 Its pharmacokinetic profile is unique, for the clinical effect can last for up to 24 hours.4-6 U-500 can replace basal-bolus and other complex insulin regimens, offering convenient, effective glycemic control with 2 or 3 injections per day.11,14-20 U-500 can also improve the quality of life and adherence compared with formulations that require more frequent injections.7,14,21 Historically, only exceptional or “special” cases were treated with U-500, but demand for concentrated insulins has increased in the last decade as clinicians adjust their care for this growing patient population.17
The purpose of this study was to determine whether a population of subjects with severe insulin-resistant T2DM would benefit from the use of U-500 vs U-100 insulin regimens. The hypothesis was that this population would obtain equal or better glycemic control while achieving improved adherence. Other studies have demonstrated that U-500 yields improvements in glycemic control but also potentially increases hypoglycemic episodes.15-18,22-24 To our knowledge, this study is the first to evaluate the clinical outcomes of subjects with severe insulin-resistant T2DM who changed from U-100 to U-500 vs subjects who remained on high-dose U-100 insulin.
Methods
This was a single-site, retrospective chart review of subjects with T2DM who attended the endocrinology specialty clinic at the James A. Haley Veterans’ Hospital (JAHVA) in Tampa, Florida, between July 2002 and June 2011. The study included a group of subjects using U-500 insulin and a comparison group using U-100 insulin. The study was approved by the JAHVA Research & Development Committee and by the University of South Florida Institutional Review Board.
Inclusion criteria included diagnosis of T2DM, body mass index (BMI) of more than 30, use of U-500 insulin, or > 200 units daily of U-100 insulin. Exclusion criteria included hypoglycemia unawareness, type 1 DM, and use of an insulin pump. A total of 142 subjects met the inclusion criteria (68 in the U-500 group and 74 in the U-100 group).
All study subjects had at least 1 DM education session. U-500 subjects used insulin vials and 1-mL volumetric hypodermal syringes. All U-500 prescriptions were issued electronically in units and volume (U-500 insulin was available exclusively in vials during the time frame from which data were collected). Subjects in the U-100 group used insulin vials or pen devices. Laboratory studies were processed in house by the institution using high-pressure liquid chromatography to determine hemoglobin A1C (Hb A1C) levels. All study subjects required at least 2 Hb A1C measurements over the observed 12 months for inclusion.
Transition to U-500 Insulin
U-500 transition was considered routinely and presented as an option for patients requiring > 200 units of insulin daily. The transition criteria included adherence to medications, follow-up appointments, and glucose monitoring recommendations, and ability to learn and apply insulin self-adjustment instructions. All subjects were given an additional U-500 insulin education session before transition. The endocrinologist calculated all starting doses by reducing the total daily dose by 20%.
Data Collection
Data were collected using the automatic data mining tools within the JAHVA Computerized Patient Record System and confirmed individually by clinical staff. Demographic data included age, race, and sex. Other parameters were weight; BMI; Hb A1C; estimated glomerular filtration rate (eGFR); duration of DM; use of metformin and other oral agents; total daily insulin dose; number of daily injections; prior history of atherosclerotic cardiovascular disease (ASCVD), including coronary artery disease (CAD), cerebrovascular accident (CVA), or peripheral vascular disease (PVD); occurrence of severe hypoglycemia (symptomatic hypoglycemia requiring treatment assistance from another individual) and of new cardiovascular events, classified as CAD, CVA, or PVD.
For the U-500 group, data were collected and analyzed for the 3 months before (baseline) and the 12 months after the initiation of concentrated insulin. For the U-100 group, data were collected and analyzed for the comparable 3 months before (baseline) and the 12 months after the first clinic visit in which the subject started using more than 200 units per day of U-100. Frequency of follow-up visits was individualized according to clinical needs.
Clinical Endpoints
Primary outcomes included changes in Hb A1C from baseline to the following 12 months, and the occurrence of severe hypoglycemia. Secondary outcomes included the occurrence of new ASCVD events during the study, and changes in weight, BMI, and number of injections.
Statistical Analysis
The primary and secondary outcomes were assessed through univariate and multivariate general linear models. Multivariate models were used to compare differences in the variation of Hb A1C over time. Data were incomplete for the Hb A1C in 27 subjects, 6% of the dataset (Each subject had more than one variable or observation). Therefore, a multiple imputation was used to account for the incompleteness on Hb A1C (value substitutions by the mean and by the prior Hb A1C and models were balanced against the unaltered data). A P value of ≤ .05 was used to determine statistical significance. The statistical analyses were performed using IBM SPSS Statistics 21.
Results
Most patients were male (94%) of white race (86%), with a mean age of 57 years and comparable duration of DM (Table 1). Demographics were balanced between the groups, except for weight and BMI, both higher in the U-500 group (P < .001). Use of oral antidiabetic agents was not significantly different between groups, nor were comorbid conditions, with nearly 50% of subjects in each group affected by CKD and ASCVD, of which CAD was the most common (approximately 40% of both groups). Only about one-third of subjects used metformin and/or other oral agents, likely due to the high prevalence of CKD (contraindicating metformin) and high insulin requirements (due to correlation with β cell failure). A subgroup analysis of subjects on metformin did not demonstrate significant differences in risk of severe hypoglycemia or in Hb A1C levels (data not shown).
Both groups had similar initial Hb A1C baselines (> 9%) and both improved glycemic control during the study period. However, the Hb A1C reduction was greater in the U-500 group (P= .034), 0.84% vs 0.56% for U-100 and the between-groups difference was 0.4%. (Figure 1, Tables 2 and 3).
The univariate general linear model shows a statistically significant difference in the levels of Hb A1C within each treatment group, regardless of the imputation strategy. However, the differences were not significant when comparing postintervention Hb A1C means between groups with unaltered data (P = .23), because the U-500 group Hb A1C improvement gap narrowed at the end of study. In the multivariate analysis, irrespective of imputation method, the differences in Hb A1C between group treated with U-100 and U-500 were statistically significant (Table 3).
Overall, more subjects in the U-500 group than in the U-100 group achieved Hb A1C levels < 8.5% (56% vs 46%, respectively, P = .003) and the proportion of subjects achieving Hb A1C levels < 7.5% doubled that of the U-100 group (26% vs 12%; Figure 2). Five subjects in the U-500 group experienced severe hypoglycemia, compared with 1 in the U-100 group (P = .08). The total daily insulin dose was significantly higher in the U-500 group (296 units daily) than in the U-100 group (209 units daily) (P < .001) (Table 2). Baseline weight and BMI differences were also significant for the U-500 and U-100 groups (P < .001). Weight gain of approximately 2 kg occurred in both groups, a change that was not statistically significant (P = .79)
There were 21 new ASCVD events in the U-100 and 16 in the U-500 group (P = .51) and there were no statistically significant differences in the incidence of new CAD, PVD or CVA events. The U-500 group required significantly fewer injections than U-100 insulin users (2 vs 4; P < .001).
Discussion
The purpose of the study was to compare subjects with obesity and T2DM using U-500 concentrated insulin with similarly matched subjects using U-100 insulin. Available studies using U-500 insulin, including prospective trials, have reported the experience after transitioning patients who “failed” U-100 regimens.13-16,18,21-24 This failure is a relative and transient condition that, in theory, could be improved with medical intervention and lifestyle changes. Such changes cannot be easily quantified in a clinical trial or retrospective study without a control group. This study was an attempt to fill this knowledge gap.
The U-500 intervention resulted in a 0.8% overall reduction in Hb A1C and a significant 0.4% reduction compared to subjects using U-100. While both groups had improvement in Hb A1C , U-500 was associated with superior reductions in Hb A1C . This finding confirms prior assertions that U-500, compared with U-100, is associated with larger Hb A1C improvement.14-16
The preintervention and postintervention Hb A1C means were > 8% in both groups. This finding suggests that lowering Hb A1C is challenging, similar to published results demonstrating that Hb A1C levels < 7% are achieved by fewer than one-third of U-500 users.16-18 The explanation for this finding remains elusive, due to the methodologic limitations of a retrospective analysis. A possible explanation is the high prevalence of CKD and ASCVD among the study population, conditions which, according to guidelines justify less aggressive glycemic control efforts.25 Multiple prior studies using retrospective data8,13-16 and 2 prospective trials18,22 demonstrated similar Hb A1C reductions after failure of U-100 regimens.
In this study, U-500 resulted in a nominal increase in the risk of severe hypoglycemic episodes. A detailed review of the events found that most of these patients had preestablished CKD and ASCVD, and half of the subjects with sever hypoglycemic episodes had new vascular events during the study (Appendix). These findings suggest a possible correlation between CKD and ASCVD complications and the risk of severe hypoglycemic events. Pharmacokinetic profiles for U-500 have not been studied in subjects with CKD, but the clinical effect of CKD is likely prolonged by the expected reduction in insulin clearance. Similarly, the frailty associated with preexisting ASCVD, or the related polypharmacy, could be factors increasing the risk of hypoglycemia and deserve further study.
Most of the U-500 subjects used it twice daily in this study, which could have contributed to the higher hypoglycemia rate. In a prospective randomized trial Hood and colleagues reported a rate of symptomatic hypoglycemia exceeding 90% in the 2 study groups, and 8 subjects (of 325 total) had severe hypoglycemia during the 6-month observation. The group assigned to 2 daily injections had a significantly higher rate of hypoglycemic events compared with a group that had 3 injections per day.18 Additional studies are required to ascertain whether U-500, compared with specific U-100 regimens (basal-bolus vs premixed; human vs insulin analogs), results in a higher risk of severe hypoglycemia.
This study also investigated the incidence of new cardiovascular events, and no difference was found between the 2 groups. A longer observation would be required to better assess whether U-500 therapy can reduce the incidence of microvascular and macrovascular complications. The similar incidence of complications is further evidence of the similarity between the 2 studied groups. It was also reassuring to find that weight gains were small and nearly identical in both insulin groups.
Strengths and Limitations
This study has several limitations. Data about hospitalizations for congestive heart failure, amputations, progression of diabetic retinopathy, neuropathy, and nephropathy were not collected for this analysis. As both groups of subjects were relatively small, statistical power to assess outcomes is a concern. Retrospective chart reviews may also be affected by incomplete data collections and multiple biases. No data were available for other hypoglycemic episodes, especially to calculate the rate of the more common forms of hypoglycemia. The period of data analyzed spanned only about 15 months. A longer, longitudinal assessment of the differences between these 2 groups may yield more differences, and clearer results and conclusions. Moreover, the data set had aged before publication of this report; however, the authors think that the analysis and information remain highly clinically relevant. The uncommon use of U-500, and prominence as a “special case” insulin may also lead to a detection bias for severe hypoglycemia in the U-500 group. In contrast, lapses in documentation of hypoglycemia in subjects using U-100 could have occurred. Finally, the differences in total daily dose and body weight among groups were significant and may reflect on important physiologic differences between the 2 groups that may affect the reproducibility of our results.
Nevertheless, this study had notable strengths. Comparing U-500 insulin users with similar subjects using U-100 over a period of time provides head-to-head data with potentially important clinical utility. Also, we collected and analyzed a sizable number of clinically important variables, including cardiovascular risk factors, the occurrence of new cardiovascular events, and prevalence of renal disease. The use of linear regression and multivariate analysis using multiple models also strengthened the results. Previous studies compared the outcomes in subjects using U-500 insulin with only their historical selves.8,13-16,18,19,22-25 Therefore, these studies analyzed the data for preconversion and postconversion of U-500 only and consistently favored U-500. This design in a retrospective study cannot eliminate the selection and/or intervention biases, as the subjects of study had inevitably “failed” prior therapies. Similarly, there is no prospective clinical trial data comparing patients on U-500 with patients on high doses of U-100 insulin. Finally, the patients in our study had high rates of comorbidities, which may have increased the applicability of our results to those of “real-life” patients in the community. To our knowledge, no other study has attempted a similar study design approach either prospectively or retrospectively.
Conclusions
In this population of elderly veterans with severely insulin-resistant T2DM, with a high incidence of CKD and ASCVD, U-500 insulin was associated with significantly greater reductions in Hb A1C than U-100 insulin-based regimens, while requiring fewer injections. No difference was noted in the incidence of new ASCVD events. More studies are needed to assess whether U-500 may increase the risk of severe hypoglycemic episodes.
Acknowledgments
The authors recognize the invaluable help provided by the editorial staff of University of South Florida IMpact, the Intramural Review to Support Research and Scientific Publication, and especially to Richard F. Lockey, MD, who has mentored us in this beautiful journey of scientific writing and for his editorial assistance. A portion of this study preliminary data was presented as an abstract at ENDO 2013, The Endocrine Society Annual meeting in San Francisco, CA, June 15-18, 2013.
Appendix. Severe Hypoglycemic Events
Subject 1: U-500 user, 61-year-old African American male. Hypoglycemia occurred during fasting and was associated with a seizure-like event 9 months after transition to concentrated insulin. He was taken by ambulance to a local hospital. No additional data were obtained. Hb A1C was 8.2% in the month before the episode (lowest of the studied period) and increased to 9.1% in the last segment of the study.
Subject 2: U-500 user, 57-year-old white male. The severe hypoglycemic episode occurred approximately 8 months after transition. His Hb A1C was 5.6% around the time of the event, the lowest of the studied period, and increased to 6.8% over the next 4 months. No other data were available.
Subject 3: U-500 user, 67-year-old white male. The event occurred at home in the morning while fasting, 3 months after transition. He was assisted by his family. Hb A1C was 7.1% 10 weeks after the event and was 7% at the end of the studied period. He had a history of CKD and PVD.
Subject 4: U-500 user, 68-year-old white male. He presented with altered consciousness, hypoglycemia, and elevated troponin levels, which was later confirmed as a non-ST elevation myocardial infarction (NSTEMI), 7 months after transition. Hb A1C during the events was 7.1% and was followed by a 9.3% level 9 weeks later. He had history of CKD and PVD.
Subject 5: U-500 user, 67-year-old white man. Hypoglycemia occurred 6 months after transition to U-500. Hb A1C was 8.4% 2 months prior, and was followed by a 7% during the admission for severe hypoglycemia. 3 months later, his HbA1c rose to 8.2%. He had an extensive history of CAD and had a NSTEMI during the study period.
Subject 6: U-100 user, 65-year-old white man. He was found unconscious in the morning while fasting, 6 months after his first clinic visit. He had CKD and advanced ASCVD with prior CAD, PVD, and CVA. He had also had a recent CVA that had affected his movement and cognition.
1. Hales CM, Carroll MD, Fryar CD, Ogden CL. Prevalence of obesity among adults and youth: United States, 2015–2016. NCHS data brief no. 288. Published October 2017. Accessed January 29, 2021. https://www.cdc.gov/nchs/products/databriefs/db288.htm
2. Centers for Disease Control and Prevention. Diabetes and prediabetes: CDC works to prevent type 2 diabetes and improve the health of all people with diabetes. Updated November 30, 2020. Accessed February 17, 2021. https://www.cdc.gov/chronicdisease/resources/publications/factsheets/diabetes-prediabetes.htm
3. Cochran E, Gorden P. Use of U-500 insulin in the treatment of severe insulin resistance. Insulin. 2008;3(4):211-218 [Published correction appears in Insulin. 2009;4(1):81]. doi:10.1016/S1557-0843(08)80049-8
4. Shrestha RT, Kumar AF, Taddese A, et al. Duration and onset of action of high dose U-500 regular insulin in severely insulin resistant subjects with type 2 diabetes. Endocrinol Diabetes Metab. 2018;1(4):e00041. Published 2018 Sep 10. doi:10.1002/edm2.41
5. Dailey AM, Tannock LR. Extreme insulin resistance: indications and approaches to the use of U-500 insulin in type 2 diabetes mellitus. Curr Diab Rep. 2011;11(2):77-82. doi:10.1007/s11892-010-0167-6
6. de la Peña A, Riddle M, Morrow LA, et al. Pharmacokinetics and pharmacodynamics of high-dose human regular U-500 insulin versus human regular U-100 insulin in healthy obese subjects [published correction appears in Diabetes Care. 2014 Aug;37(8):2414]. Diabetes Care. 2011;34(12):2496-2501. doi:10.2337/dc11-0721
7. Brusko C, Jackson JA, de la Peña A. Comparative properties of U-500 and U-100 regular human insulin. Am J Health Syst Pharm. 2013;70(15):1283-1284. doi:10.2146/130117
8. Dailey AM, Williams S, Taneja D, Tannock LR. Clinical efficacy and patient satisfaction with U-500 insulin use. Diabetes Res Clin Pract. 2010;88(3):259-264. doi:10.1016/j.diabres.2010.02.012
9. Wysham C, Hood RC, Warren ML, Wang T, Morwick TM, Jackson JA. Effect of total daily dose on efficacy, dosing, and safety of 2 dose titration regimens of human regular U-500 insulin in severely insulin-resistant patients with type 2 diabetes. Endocr Pract. 2010;22(6):653-665. doi:10.4158/EP15959.OR
10. Gagnon-Auger M, du Souich P, Baillargeon JP, et al. Dose-dependent delay of the hypoglycemic effect of short-acting insulin analogs in obese subjects with type 2 diabetes: a pharmacokinetic and pharmacodynamic study. Diabetes Care. 2010;33(12):2502-2507. doi:10.2337/dc10-1126
11. Schloot NC, Hood RC, Corrigan SM, Panek RL, Heise T. Concentrated insulins in current clinical practice. Diabetes Res Clin Pract. 2019;148:93-101. doi:10.1016/j.diabres.2018.12.007
12. Lane WS, Cochran EK, Jackson JA, et al. High-dose insulin therapy: is it time for U-500 insulin?. Endocr Pract. 2009;15(1):71-79. doi:10.4158/EP.15.1.71
13. Boldo A, Comi RJ. Clinical experience with U500 insulin: risks and benefits. Endocr Pract. 2012;18(1):56-61. doi:10.4158/EP11163.OR
14. Granata JA, Nawarskas AD, Resch ND, Vigil JM. Evaluating the effect of u-500 insulin therapy on glycemic control in veterans with type 2 diabetes. Clin Diabetes. 2015;33(1):14-19. doi:10.2337/diaclin.33.1.14
15. Eby EL, Zagar AJ, Wang P, et al. Healthcare costs and adherence associated with human regular U-500 versus high-dose U-100 insulin in patients with diabetes. Endocr Pract. 2014;20(7):663-670. doi:10.4158/EP13407.OR
16. Eby EL, Curtis BH, Gelwicks SC, et al. Initiation of human regular U-500 insulin use is associated with improved glycemic control: a real-world US cohort study. BMJ Open Diabetes Res Care. 2015;3(1):e000074. Published 2015 Apr 30. doi:10.1136/bmjdrc-2014-000074
17. Jones P, Idris I. The use of U-500 regular insulin in the management of patients with obesity and insulin resistance. Diabetes Obes Metab. 2013;15(10):882-887. doi:10.1111/dom.12094
18. Hood RC, Arakaki RF, Wysham C, Li YG, Settles JA, Jackson JA. Two treatment approaches for human regular U-500 insulin in patients with type 2 diabetes not achieving adequate glycemic control on high-dose U-100 insulin therapy with or without oral agents: a randomized, titration-to-target clinical trial. Endocr Pract. 2015;21(7):782-793. doi: 10.4158/EP15612.OR
19. Ballani P, Tran MT, Navar MD, Davidson MB. Clinical experience with U-500 regular insulin in obese, markedly insulin-resistant type 2 diabetic patients [published correction appears in Diabetes Care. 2007 Feb;30(2):455]. Diabetes Care. 2006;29(11):2504-2505. doi:10.2337/dc06-1478
20. Davidson MB, Navar MD, Echeverry D, Duran P. U-500 regular insulin: clinical experience and pharmacokinetics in obese, severely insulin-resistant type 2 diabetic patients. Diabetes Care. 2010;33(2):281-283. doi:10.2337/dc09-1490
21. Bulchandani DG, Konrady T, Hamburg MS. Clinical efficacy and patient satisfaction with U-500 insulin pump therapy in patients with type 2 diabetes. Endocr Pract. 2007;13(7):721-725. doi:10.4158/EP.13.7.721
22. Lane WS, Weinrib SL, Rappaport JM, Przestrzelski T. A prospective trial of U500 insulin delivered by Omnipod in patients with type 2 diabetes mellitus and severe insulin resistance [published correction appears in Endocr Pract. 2010 Nov-Dec;16(6):1082]. Endocr Pract. 2010;16(5):778-784. doi:10.4158/EP10014.OR
23. Martin C, Perez-Molinar D, Shah M, Billington C. U500 Disposable Patch Insulin Pump: Results and Discussion of a Veterans Affairs Pilot Study. J Endocr Soc. 2018;2(11):1275-1283. Published 2018 Sep 17. doi:10.1210/js.2018-00198
24. Ziesmer AE, Kelly KC, Guerra PA, George KG, Dunn FL. U500 regular insulin use in insulin-resistant type 2 diabetic veteran patients. Endocr Pract. 2012;18(1):34-38. doi:10.4158/EP11043.OR
25. American Diabetes Association. 6. Glycemic Targets: Standards of Medical Care in Diabetes-2019. Diabetes Care. 2019;42(Suppl 1):S61-S70. doi:10.2337/dc19-S006
Semaglutide for meaningful weight loss in obesity and diabetes?
A 2.4-mg weekly injection of the glucagon-like peptide-1 (GLP-1) receptor agonist semaglutide led to a clinically meaningful 5% loss in weight for roughly two-thirds of patients with both overweight/obesity and type 2 diabetes, researchers report.
These findings from the Semaglutide Treatment Effect in People With Obesity 2 (STEP 2) trial, one of four phase 3 trials of this drug, which is currently under regulatory review for weight loss, were published March 2 in The Lancet.
More than 1,000 patients (mean initial weight, 100 kg [220 pounds]) were randomly assigned to receive a lifestyle intervention plus a weekly injection of semaglutide 2.4 mg or semaglutide 1.0 mg or placebo. At 68 weeks, they had lost a mean of 9.6%, 7.0%, and 3.4%, respectively, of their starting weight.
In addition, 69% of patients who had received semaglutide 2.4 mg experienced a clinically meaningful 5% loss of weight, compared with 57% of patients who had received the lower dose and 29% of patients who had received placebo.
The higher dose of semaglutide was associated with a greater improvement in cardiometabolic risk factors. The safety profile was similar to that seen with other drugs in this class.
“By far the best results with any weight loss medicine in diabetes”
Importantly, “more than a quarter of participants lost over 15% of their body weight,” senior author Ildiko Lingvay, MD, stressed. This “is by far the best result we had with any weight loss medicine in patients with diabetes,” Dr. Lingvay, of the University of Texas, Dallas, said in a statement from the university.

“The drug works by suppressing appetite centers in the brain to reduce caloric intake,” she explained. “The medication continually tells the body that you just ate, you’re full.”
Similarly, lead author Melanie J. Davies, MD, said that the STEP 2 results “are exciting and represent a new era in weight management in people with type 2 diabetes.

“They mark a real paradigm shift in our ability to treat obesity,” with results closer to those achieved with bariatric surgery, Dr. Davies, of the University of Leicester, England, said in a statement from her institution.
“It is really encouraging,” she continued, “that along with the weight loss we saw real improvements in general health, with significant improvement in physical functioning scores, blood pressure, and blood glucose control.”
Dr. Lingvay noted that on average, patients in the four STEP clinical trials lost 10%-17% of their body weight, “which is a huge step forward compared with all other medications currently available to treat obesity.” She stressed that these results are comparable to the 20%-30% weight loss seen with bariatric surgery.
One of four trials under review
More than 90% of people with type 2 diabetes are overweight or have obesity, and more than 20% of people with obesity have diabetes, wrote Dr. Davies and colleagues.
Semaglutide (Ozempic), administered subcutaneously at a dose of 0.5 mg to 1 mg weekly, is approved by the Food and Drug Administration for the treatment of type 2 diabetes. Dosing studies indicated that it is associated with weight loss.
As previously reported, four trials of the use of semaglutide for weight loss (STEP 1, 2, 3, and 4) have been completed. The combined data were submitted to the FDA on Dec. 4, 2020 (a decision is expected within 6 months) and to the European Medicines Agency on Dec. 18, 2020.
The STEP 1 and STEP 3 trials of semaglutide 2.4 mg vs. placebo were recently published. The STEP 1 trial involved 1,961 adults with obesity or overweight; the STEP 3 trial, 611 adults with obesity or overweight. In each of the trials, some patients also underwent an intensive lifestyle intervention, and some did not. In both trials, patients with type 2 diabetes were excluded.
Topline results from STEP 2 were reported in June 2020.
STEP 2 enrolled patients with type 2 diabetes
STEP 2 involved 1,210 adults in 149 outpatient clinics in 12 countries in Europe, North America, South America, the Middle East, South Africa, and Asia. All participants had type 2 diabetes.
For all patients, the body mass index was ≥27 kg/m2, and the A1c concentration was 7%-10%. The mean BMI was 35.7 kg/m2, and the mean A1c was 8.1%.
The mean age of the patients was 55 years, and 51% were women; 62% were White, 26% were Asian, 13% were Hispanic, 8% were Black, and 4% were of other ethnicity.
Participants were managed with diet and exercise alone or underwent treatment with a stable dose of up to three oral glucose-lowering agents (metformin, sulfonylureas, SGLT2 inhibitors, or thiazolidinediones) for at least 90 days. They were then randomly assigned in 1:1:1 ratio to receive semaglutide 2.4 mg, semaglutide 1.0 mg, or placebo.
The starting dose of semaglutide was 0.25 mg/wk; the dose was escalated every 4 weeks to reach the target dose.
All patients received monthly counseling from a dietitian about calories (the goal was a 500-calorie/day deficit) and activity (the goal was 150 minutes of walking or stair climbing per week).
The mean A1c dropped by 1.6% and 1.5% in the semaglutide groups and by 0.4% in the placebo group.
Adverse events were more frequent among the patients who received semaglutide (88% and 82%) than in the placebo group (77%).
Gastrointestinal events that were mainly mild to moderate in severity were reported by 64% of patients in the 2.4-mg semaglutide group, 58% in the 1.0-mg semaglutide group, and 34% in the placebo group.
Semaglutide (Rybelsus) is approved in the United States as a once-daily oral agent for use in type 2 diabetes in doses of 7 mg and 14 mg to improve glycemic control along with diet and exercise. It is the first GLP-1 agonist available in tablet form.
The study was supported by Novo Nordisk. The authors’ relevant financial relationships are listed in the original article.
A version of this article first appeared on Medscape.com.
A 2.4-mg weekly injection of the glucagon-like peptide-1 (GLP-1) receptor agonist semaglutide led to a clinically meaningful 5% loss in weight for roughly two-thirds of patients with both overweight/obesity and type 2 diabetes, researchers report.
These findings from the Semaglutide Treatment Effect in People With Obesity 2 (STEP 2) trial, one of four phase 3 trials of this drug, which is currently under regulatory review for weight loss, were published March 2 in The Lancet.
More than 1,000 patients (mean initial weight, 100 kg [220 pounds]) were randomly assigned to receive a lifestyle intervention plus a weekly injection of semaglutide 2.4 mg or semaglutide 1.0 mg or placebo. At 68 weeks, they had lost a mean of 9.6%, 7.0%, and 3.4%, respectively, of their starting weight.
In addition, 69% of patients who had received semaglutide 2.4 mg experienced a clinically meaningful 5% loss of weight, compared with 57% of patients who had received the lower dose and 29% of patients who had received placebo.
The higher dose of semaglutide was associated with a greater improvement in cardiometabolic risk factors. The safety profile was similar to that seen with other drugs in this class.
“By far the best results with any weight loss medicine in diabetes”
Importantly, “more than a quarter of participants lost over 15% of their body weight,” senior author Ildiko Lingvay, MD, stressed. This “is by far the best result we had with any weight loss medicine in patients with diabetes,” Dr. Lingvay, of the University of Texas, Dallas, said in a statement from the university.
“The drug works by suppressing appetite centers in the brain to reduce caloric intake,” she explained. “The medication continually tells the body that you just ate, you’re full.”
Similarly, lead author Melanie J. Davies, MD, said that the STEP 2 results “are exciting and represent a new era in weight management in people with type 2 diabetes.
“They mark a real paradigm shift in our ability to treat obesity,” with results closer to those achieved with bariatric surgery, Dr. Davies, of the University of Leicester, England, said in a statement from her institution.
“It is really encouraging,” she continued, “that along with the weight loss we saw real improvements in general health, with significant improvement in physical functioning scores, blood pressure, and blood glucose control.”
Dr. Lingvay noted that on average, patients in the four STEP clinical trials lost 10%-17% of their body weight, “which is a huge step forward compared with all other medications currently available to treat obesity.” She stressed that these results are comparable to the 20%-30% weight loss seen with bariatric surgery.
One of four trials under review
More than 90% of people with type 2 diabetes are overweight or have obesity, and more than 20% of people with obesity have diabetes, wrote Dr. Davies and colleagues.
Semaglutide (Ozempic), administered subcutaneously at a dose of 0.5 mg to 1 mg weekly, is approved by the Food and Drug Administration for the treatment of type 2 diabetes. Dosing studies indicated that it is associated with weight loss.
As previously reported, four trials of the use of semaglutide for weight loss (STEP 1, 2, 3, and 4) have been completed. The combined data were submitted to the FDA on Dec. 4, 2020 (a decision is expected within 6 months) and to the European Medicines Agency on Dec. 18, 2020.
The STEP 1 and STEP 3 trials of semaglutide 2.4 mg vs. placebo were recently published. The STEP 1 trial involved 1,961 adults with obesity or overweight; the STEP 3 trial, 611 adults with obesity or overweight. In each of the trials, some patients also underwent an intensive lifestyle intervention, and some did not. In both trials, patients with type 2 diabetes were excluded.
Topline results from STEP 2 were reported in June 2020.
STEP 2 enrolled patients with type 2 diabetes
STEP 2 involved 1,210 adults in 149 outpatient clinics in 12 countries in Europe, North America, South America, the Middle East, South Africa, and Asia. All participants had type 2 diabetes.
For all patients, the body mass index was ≥27 kg/m2, and the A1c concentration was 7%-10%. The mean BMI was 35.7 kg/m2, and the mean A1c was 8.1%.
The mean age of the patients was 55 years, and 51% were women; 62% were White, 26% were Asian, 13% were Hispanic, 8% were Black, and 4% were of other ethnicity.
Participants were managed with diet and exercise alone or underwent treatment with a stable dose of up to three oral glucose-lowering agents (metformin, sulfonylureas, SGLT2 inhibitors, or thiazolidinediones) for at least 90 days. They were then randomly assigned in 1:1:1 ratio to receive semaglutide 2.4 mg, semaglutide 1.0 mg, or placebo.
The starting dose of semaglutide was 0.25 mg/wk; the dose was escalated every 4 weeks to reach the target dose.
All patients received monthly counseling from a dietitian about calories (the goal was a 500-calorie/day deficit) and activity (the goal was 150 minutes of walking or stair climbing per week).
The mean A1c dropped by 1.6% and 1.5% in the semaglutide groups and by 0.4% in the placebo group.
Adverse events were more frequent among the patients who received semaglutide (88% and 82%) than in the placebo group (77%).
Gastrointestinal events that were mainly mild to moderate in severity were reported by 64% of patients in the 2.4-mg semaglutide group, 58% in the 1.0-mg semaglutide group, and 34% in the placebo group.
Semaglutide (Rybelsus) is approved in the United States as a once-daily oral agent for use in type 2 diabetes in doses of 7 mg and 14 mg to improve glycemic control along with diet and exercise. It is the first GLP-1 agonist available in tablet form.
The study was supported by Novo Nordisk. The authors’ relevant financial relationships are listed in the original article.
A version of this article first appeared on Medscape.com.
Are long-acting injectables the future of TB treatment?
Long-acting injectable (LAI) drug formulations represent a promising new strategy for the prevention and treatment of tuberculosis in women and children, according to an online presentation at the Conference on Retroviruses & Opportunistic Infections, held virtually.
“As a delivery strategy, LAIs hold the potential to unlock a vast chemical space of lipophilic compounds with very potent anti-TB activity that would otherwise not be developed due to poor predicted oral bioavailability,” explained presenter Eric Nuermberger, MD.
He summarized current preventive treatment options for TB and reviewed the potential impact of LAI formulations on TB therapy. In addition, he identified key challenges for future LAI development and proposed a new development path for clinical implementation.
Current TB preventive therapies
Despite widespread availability, the uptake of TB preventive therapy is poor and currently lags behind global targets. One key barrier to widespread uptake is the long duration of treatment, which may hinder patient adherence to therapy.
While shorter preventive regimens, such as 1 month of daily isoniazid plus rifapentine, show similar efficacy and higher completion rates, further shortening of therapy and reducing clinic visits are the most direct methods to increase adherence and treatment completion rates, Dr. Nuermberger said.
LAI drugs
LAI drug formulations allow for slow release of suitable drugs from a depot injected subcutaneously or intramuscularly.
The goal of LAI formulations is to free patients from the daily burden of oral administration. Other potential benefits include better adherence and efficacy, drug exposure, and the potential to overcome intrinsic poor oral bioavailability by bypassing the GI tract entirely.
Potential indications for LAIs include treatment of latent tuberculosis infection (LTBI), and as continuous therapy in people living with HIV in high-burden settings. There is also potential for treating younger children, such as household contacts, who have difficulty taking oral medications.
“We’ve already seen LAIs revolutionize other areas, such as psychiatry and contraception, and we appear to have another revolution in HIV prevention and treatment,” Dr. Nuermberger explained.
Not all existing TB drugs are suitable for LAI formulations, but drugs such as rifapentine, rifabutin, delamanid, and bedaquiline, show more promise than isoniazid or rifampin because of their physiochemical composition. Of all, bedaquiline may offer the best profile for LAI formulation, Dr. Nuermberger said.
Early proof-of-concept in vivo studies have shown potential use of LAI bedaquiline for TB prevention in both drug-sensitive and drug-resistant TB contacts. Translational PK modeling and simulation predicted that a 1-g intramuscular injection of LAI bedaquiline could maintain therapeutic plasma concentrations in humans for greater than 1 month.
Dr. Nuermberger noted that novel diarylquinoline-based therapies, currently in phase 1 studies, may be even better candidates for LAI-based TB preventive therapy. Early data suggests these compounds may be 10-20 times more potent and have a lower CV risk profile than that of bedaquiline.
Considerations for development and implementation
“Despite the promising potential of long-acting injectables for TB, we are still in the very early stages,” said Dr. Nuermberger.
Ensuring and optimizing acceptance of LAI formulations, especially in at-risk populations, will be very important, he explained. Early involvement of children and pregnant women in studies of who may benefit most from LAI drugs will also be essential.
Other important considerations include cost-effectiveness, particularly in at-risk and vulnerable populations. Furthermore, new dedicated research and development programs are needed to continue to develop more drug candidates suitable for LAI.
“Long-acting formulations hold enormous promise to be transformative for combating TB, through simplification of delivery and overcoming issues of adherence that can compromise success of current interventions,” said Andrew Owen, PhD, of the University of Liverpool (England).
“The ability to deliver an entire course of drug in a single visit promises to ensure missed doses don’t compromise outcomes or place unnecessary selective pressure in favor of drug resistance,” Dr. Owen said.
“Recent studies showing the value of one-month oral treatment regimens for LTBI make long-acting formulations seem more realistic and drugs such as long-acting bedaquiline put a one-shot regimen within reach,” Charles W. Flexner, MD, of Johns Hopkins University, Baltimore, said in an interview.
While no LAIs have been approved for TB, Dr. Nuermberger was optimistic that the recent success of LAI formulations for HIV treatment and prevention will catalyze further efforts in the TB landscape.
Dr. Nuermberger disclosed research support from Janssen Pharmaceuticals, TB Alliance, and the Gates Medical Research Institute. The presentation was sponsored by Janssen Pharmaceuticals, Johns Hopkins CFAR, NIH, Unitaid, and the TB Alliance.
FROM CROI 2021
DOACs offered after heart valve surgery despite absence of data
Direct oral anticoagulants (DOACs) are used in about 1% of patients undergoing surgical mechanical aortic and mitral valve replacement, but in up to 6% of surgical bioprosthetic valve replacements, according to registry data presented at CRT 2021.
In an analysis of the Society of Thoracic Surgery (STS) registry during 2014-2017, DOAC use increased steadily among those undergoing surgical bioprosthetic valve replacement, reaching a number that is potentially clinically significant, according to Ankur Kalra, MD, an interventional cardiologist at Akron General Hospital who has an academic appointment at the Cleveland Clinic.
There was no increase in the use of DOACs observed among patients undergoing mechanical valve replacement, “but even if the number is 1%, they should probably not be used at all until we accrue more data,” Dr. Kalra said.
DOACs discouraged in patients with mechanical or bioprosthetic valves
In Food and Drug Administration labeling, DOACs are contraindicated or not recommended. This can be traced to the randomized RE-ALIGN trial, which was stopped prematurely due to evidence of harm from a DOAC, according to Dr. Kalra.
In RE-ALIGN, which enrolled patients undergoing mechanical aortic or mitral valve replacement, dabigatran was associated not only with more bleeding events than warfarin, but also more thromboembolic events.
There are no randomized data comparing the factor Xa inhibitors rivaroxaban or apixaban to warfarin in heart valve surgery, but Dr. Kalra noted cautionary language is found in the labeling of both, “perhaps due to the RE-ALIGN data.”
Registry shows trends in prescribing
In the STS registry data, 193 (1.1%) of the 18,142 patients undergoing mechanical aortic valve surgery, 139 (1.0%) of the 13,942 patients undergoing mechanical mitral valve surgery, 5,625 (4.7%) of the 116,203 patients undergoing aortic bioprosthetic aortic valve surgery, and 2,180 (5.9%) of the 39,243 patients undergoing bioprosthetic mitral valve surgery were on a DOAC at discharge.
Among those receiving a mechanical value and placed on a DOAC, about two-thirds were on a factor Xa inhibitor rather than dabigatran. For those receiving a bioprosthetic value, the proportion was greater than 80%. Dr. Kalra speculated that the RE-ALIGN trial might be the reason factor Xa inhibitors were favored.
In both types of valves, whether mechanical or bioprosthetic, more comorbidities predicted a greater likelihood of receiving a DOAC rather than warfarin. For those receiving mechanical values, the comorbidities with a significant association with greater DOAC use included hypertension (P = .003), dyslipidemia (P = .02), arrhythmia (P < .001), and peripheral arterial disease (P < 0.001).
The same factors were significant for predicting increased likelihood of a DOAC following bioprosthetic valve replacement, but there were additional factors, including atrial fibrillation independent of other types of arrhythmias (P < .001), a factor not significant for mechanical valves, as well as diabetes (P < .001), cerebrovascular disease (P < .001), dialysis (P < .001), and endocarditis (P < .001).
“This is probably intuitive, but patients who were on a factor Xa inhibitor before their valve replacement were also more likely to be discharged on a factor Xa inhibitor,” Dr. Kalra said at the virtual meeting, sponsored by MedStar Heart & Vascular Institute.
The year-to-year increase in DOAC use among those undergoing bioprosthetic valve replacement over the study period, which was a significant trend, was not observed among those undergoing mechanical valve replacement. Rather, the 1% proportion remained stable over the study period.
“We wanted to look at outcomes, but we found that the STS database, which only includes data out to 30 days, is not structured for this type of analysis,” Dr. Kalra said. He was also concerned about the limitations of a comparison in which 1% of the sample was being compared to 99%.
Expert: One percent is ‘very small number’
David J. Cohen, MD, commented on the 1% figure, which was so low that a moderator questioned whether it could be due mostly to coding errors.
“This is a very, very small number so at some level it is reassuring that it is so low in the mechanical valves,” Dr. Cohen said. However, he was more circumspect about the larger number in bioprosthetic valves.
“I have always thought it was a bit strange there was a warning against using them in bioprosthetic valves, especially in the aortic position,” he said.

“The trials that established the benefits of DOACs were all in nonvalvular atrial fibrillation, but this did not mean non–aortic stenosis; it meant non–mitral valvular. There have been articles written about how that has been misinterpreted,” said Dr. Cohen, director of clinical and outcomes research at the Cardiovascular Research Foundation and director of academic affairs at St. Francis Hospital, Roslyn, N.Y.
For his part, Dr. Kalra reported that he does not consider DOACs in patients who have undergone a surgical mechanical valve replacement. For bioprosthetic valves, he “prefers” warfarin over DOACs.
Overall, the evidence from the registry led Dr. Kalra to suggest that physicians should continue to “exercise caution” in using DOACs instead of warfarin after any surgical valve replacement “until randomized clinical trials provide sufficient evidence” to make a judgment about relative efficacy and safety.
Results of the study were published online as a research letter in Jama Network Open after Dr. Kalra’s presentation. Dr. Kalra and Dr. Cohen report no potential conflicts of interest.
Direct oral anticoagulants (DOACs) are used in about 1% of patients undergoing surgical mechanical aortic and mitral valve replacement, but in up to 6% of surgical bioprosthetic valve replacements, according to registry data presented at CRT 2021.
In an analysis of the Society of Thoracic Surgery (STS) registry during 2014-2017, DOAC use increased steadily among those undergoing surgical bioprosthetic valve replacement, reaching a number that is potentially clinically significant, according to Ankur Kalra, MD, an interventional cardiologist at Akron General Hospital who has an academic appointment at the Cleveland Clinic.
There was no increase in the use of DOACs observed among patients undergoing mechanical valve replacement, “but even if the number is 1%, they should probably not be used at all until we accrue more data,” Dr. Kalra said.
DOACs discouraged in patients with mechanical or bioprosthetic valves
In Food and Drug Administration labeling, DOACs are contraindicated or not recommended. This can be traced to the randomized RE-ALIGN trial, which was stopped prematurely due to evidence of harm from a DOAC, according to Dr. Kalra.
In RE-ALIGN, which enrolled patients undergoing mechanical aortic or mitral valve replacement, dabigatran was associated not only with more bleeding events than warfarin, but also more thromboembolic events.
There are no randomized data comparing the factor Xa inhibitors rivaroxaban or apixaban to warfarin in heart valve surgery, but Dr. Kalra noted cautionary language is found in the labeling of both, “perhaps due to the RE-ALIGN data.”
Registry shows trends in prescribing
In the STS registry data, 193 (1.1%) of the 18,142 patients undergoing mechanical aortic valve surgery, 139 (1.0%) of the 13,942 patients undergoing mechanical mitral valve surgery, 5,625 (4.7%) of the 116,203 patients undergoing aortic bioprosthetic aortic valve surgery, and 2,180 (5.9%) of the 39,243 patients undergoing bioprosthetic mitral valve surgery were on a DOAC at discharge.
Among those receiving a mechanical value and placed on a DOAC, about two-thirds were on a factor Xa inhibitor rather than dabigatran. For those receiving a bioprosthetic value, the proportion was greater than 80%. Dr. Kalra speculated that the RE-ALIGN trial might be the reason factor Xa inhibitors were favored.
In both types of valves, whether mechanical or bioprosthetic, more comorbidities predicted a greater likelihood of receiving a DOAC rather than warfarin. For those receiving mechanical values, the comorbidities with a significant association with greater DOAC use included hypertension (P = .003), dyslipidemia (P = .02), arrhythmia (P < .001), and peripheral arterial disease (P < 0.001).
The same factors were significant for predicting increased likelihood of a DOAC following bioprosthetic valve replacement, but there were additional factors, including atrial fibrillation independent of other types of arrhythmias (P < .001), a factor not significant for mechanical valves, as well as diabetes (P < .001), cerebrovascular disease (P < .001), dialysis (P < .001), and endocarditis (P < .001).
“This is probably intuitive, but patients who were on a factor Xa inhibitor before their valve replacement were also more likely to be discharged on a factor Xa inhibitor,” Dr. Kalra said at the virtual meeting, sponsored by MedStar Heart & Vascular Institute.
The year-to-year increase in DOAC use among those undergoing bioprosthetic valve replacement over the study period, which was a significant trend, was not observed among those undergoing mechanical valve replacement. Rather, the 1% proportion remained stable over the study period.
“We wanted to look at outcomes, but we found that the STS database, which only includes data out to 30 days, is not structured for this type of analysis,” Dr. Kalra said. He was also concerned about the limitations of a comparison in which 1% of the sample was being compared to 99%.
Expert: One percent is ‘very small number’
David J. Cohen, MD, commented on the 1% figure, which was so low that a moderator questioned whether it could be due mostly to coding errors.
“This is a very, very small number so at some level it is reassuring that it is so low in the mechanical valves,” Dr. Cohen said. However, he was more circumspect about the larger number in bioprosthetic valves.
“I have always thought it was a bit strange there was a warning against using them in bioprosthetic valves, especially in the aortic position,” he said.
“The trials that established the benefits of DOACs were all in nonvalvular atrial fibrillation, but this did not mean non–aortic stenosis; it meant non–mitral valvular. There have been articles written about how that has been misinterpreted,” said Dr. Cohen, director of clinical and outcomes research at the Cardiovascular Research Foundation and director of academic affairs at St. Francis Hospital, Roslyn, N.Y.
For his part, Dr. Kalra reported that he does not consider DOACs in patients who have undergone a surgical mechanical valve replacement. For bioprosthetic valves, he “prefers” warfarin over DOACs.
Overall, the evidence from the registry led Dr. Kalra to suggest that physicians should continue to “exercise caution” in using DOACs instead of warfarin after any surgical valve replacement “until randomized clinical trials provide sufficient evidence” to make a judgment about relative efficacy and safety.
Results of the study were published online as a research letter in Jama Network Open after Dr. Kalra’s presentation. Dr. Kalra and Dr. Cohen report no potential conflicts of interest.
FROM CRT 2021
Five-day course of oral antiviral appears to stop SARS-CoV-2 in its tracks
A single pill of the investigational drug molnupiravir taken twice a day for 5 days eliminated SARS-CoV-2 from the nasopharynx of 49 participants.
That led Carlos del Rio, MD, distinguished professor of medicine at Emory University, Atlanta, to suggest a future in which a drug like molnupiravir could be taken in the first few days of symptoms to prevent severe disease, similar to Tamiflu for influenza.
“I think it’s critically important,” he said of the data. Emory University was involved in the trial of molnupiravir but Dr. del Rio was not part of that team. “This drug offers the first antiviral oral drug that then could be used in an outpatient setting.”
Still, Dr. del Rio said it’s too soon to call this particular drug the breakthrough clinicians need to keep people out of the ICU. “It has the potential to be practice changing; it’s not practice changing at the moment.”
Wendy Painter, MD, of Ridgeback Biotherapeutics, who presented the data at the Conference on Retroviruses and Opportunistic Infections, agreed. While the data are promising, “We will need to see if people get better from actual illness” to assess the real value of the drug in clinical care.
“That’s a phase 3 objective we’ll need to prove,” she said in an interview.
Phase 2/3 efficacy and safety studies of the drug are now underway in hospitalized and nonhospitalized patients.
In a brief prerecorded presentation of the data, Dr. Painter laid out what researchers know so far: Preclinical studies suggest that molnupiravir is effective against a number of viruses, including coronaviruses and specifically SARS-CoV-2. It prevents a virus from replicating by inducing viral error catastrophe (Proc Natl Acad Sci U S A. 2002 Oct 15;99[21]:13374-6) – essentially overloading the virus with replication and mutation until the virus burns itself out and can’t produce replicable copies.
In this phase 2a, randomized, double-blind, controlled trial, researchers recruited 202 adults who were treated at an outpatient clinic with fever or other symptoms of a respiratory virus and confirmed SARS-CoV-2 infection by day 4. Participants were randomly assigned to three different groups: 200 mg of molnupiravir, 400 mg, or 800 mg. The 200-mg arm was matched 1:1 with a placebo-controlled group, and the other two groups had three participants in the active group for every one control.
Participants took the pills twice daily for 5 days, and then were followed for a total of 28 days to monitor for complications or adverse events. At days 3, 5, 7, 14, and 28, researchers also took nasopharyngeal swabs for polymerase chain reaction tests, to sequence the virus, and to grow cultures of SARS-CoV-2 to see if the virus that’s present is actually capable of infecting others.
Notably, the pills do not have to be refrigerated at any point in the process, alleviating the cold-chain challenges that have plagued vaccines.
“There’s an urgent need for an easily produced, transported, stored, and administered antiviral drug against SARS-CoV-2,” Dr. Painter said.
Of the 202 people recruited, 182 had swabs that could be evaluated, of which 78 showed infection at baseline. The results are based on labs of those 78 participants.
By day 3, 28% of patients in the placebo arm had SARS-CoV-2 in their nasopharynx, compared with 20.4% of patients receiving any dose of molnupiravir. But by day 5, none of the participants receiving the active drug had evidence of SARS-CoV-2 in their nasopharynx. In comparison, 24% of people in the placebo arm still had detectable virus.
Halfway through the treatment course, differences in the presence of infectious virus were already evident. By day 3 of the 5-day course, 36.4% of participants in the 200-mg group had detectable virus in the nasopharynx, compared with 21% in the 400-mg group and just 12.5% in the 800-mg group. And although the reduction in SARS-CoV-2 was noticeable in the 200-mg and the 400-mg arms, it was only statistically significant in the 800-mg arm.
In contrast, by the end of the 5 days in the placebo groups, infectious virus varied from 18.2% in the 200-mg placebo group to 30% in the 800-mg group. This points out the variability of the disease course of SARS-CoV-2.
“You just don’t know” which infections will lead to serious disease, Dr. Painter said in an interview. “And don’t you wish we did?”
Seven participants discontinued treatment, though only four experienced adverse events. Three of those discontinued the trial because of adverse events. The study is still blinded, so it’s unclear what those events were, but Dr. Painter said that they were not thought to be related to the study drug.
The bottom line, said Dr. Painter, was that people treated with molnupiravir had starkly different outcomes in lab measures during the study.
“An average of 10 days after symptom onset, 24% of placebo patients remained culture positive” for SARS-CoV-2 – meaning there wasn’t just virus in the nasopharynx, but it was capable of replicating, Dr. Painter said. “In contrast, no infectious virus could be recovered at study day 5 in any molnupiravir-treated patients.”
A version of this article first appeared on Medscape.com.