User login
News and Views that Matter to Pediatricians
The leading independent newspaper covering news and commentary in pediatrics.
‘No mobile phone’ phobia tied to sleep problems in college students
In a study of more than 300 college students, nearly 9 in 10 (89%) were classified as having moderate to severe nomophobia. Greater levels of nomophobia were significantly linked to daytime sleepiness and more behaviors associated with poor sleep hygiene.
“My undergraduate research team came up with the idea for this study,” said study investigator Jennifer Peszka, PhD, professor of psychology at Hendrix College, Conway, Ark. She explained that her students had been looking at the impact of technology use in the 2 hours before bed, and hypothesized that ‘cell phone addiction’ might play a role in sleep problems.
Incidentally, “that group of students were all pretty high on nomophobia themselves so they were really interested in the outcome,” Dr. Peszka said.
The study findings were presented at the virtual annual meeting of the Associated Professional Sleep Societies.
A likely suspect
The study involved 327 undergraduates (mean age, 19.7 years) recruited from introductory psychology courses and campus newsletters. They completed several questionnaires, including the Nomophobia Questionnaire, the Epworth Sleepiness Scale, and the Sleep Hygiene Index.
Nomophobia was prevalent, with mild, moderate, and severe nomophobia reported by 10%, 83%, and 7% of students, respectively. Only one student reported no nomophobia at all. Dr. Peszka said the fact that 89% of students had moderate or severe nomophobia is “concerning,” given a 2012 study suggesting that 77% of 18- to 24-year-olds had nomophobia. This phobia “very well may be on a rapid rise,” she lamented.
Greater severity of nomophobia was significantly correlated with greater sleepiness measured by both the Epworth Sleepiness Scale (P < .05) and the Associated Features of Poor Sleep Hygiene daytime sleepiness item (P < .05). More severe nomophobia was also related to decreased motivation (a commonly reported symptom of insufficient sleep) and with more maladaptive sleep hygiene behaviors (including using technology during sleep time, long daytime naps, inconsistent wake and bed times, using bed for nonsleep purposes, uncomfortable bed, and bedtime cognitive rumination).
Prior research has shown that smartphones may lead to compulsive “checking” habits, compulsive usage, increased distress, and potentially addictive behaviors. Active phone use at bedtime has also been implicated in disrupted sleep. Nomophobia is likely to be an important consideration when treating sleep disorders and/or making any sleep hygiene recommendations, Dr. Peszka said.
Proliferation of ‘night owls’
Reached for comment, Rajkumar (Raj) Dasgupta, MD, University of Southern California, Los Angeles, said this is a “very timely study with COVID-19. Right now, more than ever, technology is a double-edged sword. I’m a father of three kids and, for now, technology is the only way some kids are going to be socializing and learning.”
Yet a foundation of good sleep hygiene is keeping a nightly sleep routine, said Dr. Dasgupta, who was not involved in the study. “Right now, it seems like all my sleep patients are becoming night owls and sleep time is becoming more and more delayed because there is so much news to keep up with. Also, you may be stressed at night and you may not have the motivation to wake up early in the morning.”
He said it is important to counsel patients to “put technology away at night. That goes for kids and adults.”
Support for the study was provided by Hendrix College Charles Brewer Fund for Psychology. Dr. Peszka and Dr. Dasgupta disclosed no relevant financial relationships.
A version of this article originally appeared on Medscape.com.
FROM SLEEP 2020
CSF metabolomic profile linked to cancer-related fatigue in children with ALL
Children and adolescents with cancer report significantly more fatigue than their counterparts without cancer, and cancer-related fatigue (CRF) is “one of the most prevalent and distressing symptoms reported during childhood cancer therapy,” according to Austin L. Brown, PhD, and his colleagues.
Cerebrospinal fluid (CSF) profiles suggest three metabolites are significantly associated with CRF in children with acute lymphoblastic leukemia (ALL), according to a report published in the Journal of Pain and Symptom Management.
The researchers assessed the clinical and demographic characteristics of 171 pediatric ALL patients, who were divided into discovery (n = 86) and replication (n = 85) cohorts.
The entire population had a mean age at diagnosis of 8.48 years; was 56.1% male; and 85.4% had B-lineage ALL. A total of 63.7% received high- or very-high-risk treatment.
CSF samples were obtained and subjected to metabolomic analysis, according to Dr. Brown, an assistant professor at the Baylor College of Medicine, Houston, and colleagues.
The researchers analyzed postinduction CSF from the aforementioned 171 patients as well as diagnostic CSF from 48 patients in an additional replication cohort.
Significant metabolites
Analysis of postinduction CSF showed that three metabolites were significantly associated with fatigue in both the discovery and replication cohorts, comprising gamma-glutamylglutamine, dimethylglycine, and asparagine (P < .05).
In diagnostic CSF samples, the abundance of gamma-glutamylglutamine was significantly associated with fatigue (P =.0062).
The metabolites have been implicated in neurotransmitter transportation and glutathione recycling, suggesting glutamatergic pathways or oxidative stress may contribute to ALL-associated CRF, according to the researchers.
“Ultimately, this line of investigation may aid in the development of new prevention and treatment approaches informed by an improved understanding of the etiology and risk factors for cancer-related fatigue,” the researchers concluded.
The study was sponsored by the National Cancer Institute and several nonprofit organizations. The authors reported that they had no conflicts of interest.
SOURCE: Brown AL et al. J Pain Symptom Manage. 2020 Sep 1. doi: 10.1016/j.jpainsymman.2020.08.030.
FROM THE JOURNAL OF PAIN AND SYMPTOM MANAGEMENT
Ten ways docs are cutting costs and saving money
“Some of our physician clients have seen their income decrease by as much as 50%,” says Joel Greenwald, MD, CEO of Greenwald Wealth Management in St. Louis Park, Minnesota. “Many physicians had previously figured that whatever financial obligations they had wouldn’t be a problem because whatever amount they were making would continue, and if there were a decline it would be gradual.” However, assumption is now creating financial strain for many doctors.
Vikram Tarugu, MD, a gastroenterologist and CEO of Detox of South Florida in Okeechobee, Florida, says he has watched his budget for years, but has become even more careful with his spending in the past few months.
“It has helped me a lot to adjust to the new normal when it comes to the financial side of things,” Dr. Tarugu said. “Patients aren’t coming in as much as they used to, so my income has really been affected.”
Primary care physicians have seen a 55% decrease in revenue and a 20%-30% decrease in patient volume as a result of COVID-19. The impact has been even more severe for specialists. Even for physicians whose practices remain busy and whose family members haven’t lost their jobs or income, broader concerns about the economy may be reason enough for physicians to adopt cost-cutting measures.
In Medscape’s Physician Compensation Report 2020, we asked physicians to share their best cost-cutting tips. Many illustrate the lengths to which physicians are going to conserve money.
Here’s a look at some of the advice they shared, along with guidance from experts on how to make it work for you:
1. Create a written budget, even if you think it’s pointless.
Physicians said their most important piece of advice includes the following: “Use a formal budget to track progress,” “write out a budget,” “plan intermittent/large expenses in advance,” “Make sure all expenses are paid before you spend on leisure.”
Nearly 7 in 10 physicians say they have a budget for personal expenses, yet only one-quarter of those who do have a formal, written budget. Writing out a spending plan is key to being intentional about your spending, making sure that you’re living within your means, and identifying areas in which you may be able to cut back.
“Financial planning is all about cash flow, and everybody should know the amount of money coming in, how much is going out, and the difference between the two,” says Amy Guerich, a partner with Stepp & Rothwell, a Kansas City–based financial planning firm. “That’s important in good times, but it’s even more important now when we see physicians taking pay cuts.”
Many physicians have found that budget apps or software programs are easier to work with than anticipated; some even walk you through the process of creating a budget. To get the most out of the apps, you’ll need to check them regularly and make changes based on their data.
“Sometimes there’s this false belief that just by signing up, you are automatically going to be better at budgeting,” says Scott Snider, CFP, a certified financial planner and partner with Mellen Money Management in Ponte Vedra Beach, Florida. “Basically, these apps are a great way to identify problem areas of spending. We have a tendency as humans to underestimate how much we spend on things like Starbucks, dining out, and Amazon shopping.”
One of the doctors’ tips that requires the most willpower is to “pay all expenses before spending on leisure.” That’s because we live in an instant gratification world, and want everything right away, Ms. Guerich said.
“I also think there’s an element of ‘keeping up with the Joneses’ and pressure associated with this profession,” she said. “The stereotype is that physicians are high-income earners so ‘We should be able to do that’ or ‘Mom and dad are doctors, so they can afford it.’ “
Creating and then revisiting your budget progress on a monthly or quarterly basis can give you a feeling of accomplishment and keep you motivated to stay with it.
Keep in mind that budgeting is a continual process rather than a singular event, and you’ll likely adjust it over time as your income and goals change.
2. Save more as you earn more.
Respondents to our Physician Compensation Report gave the following recommendations: “Pay yourself first,” “I put half of my bonus into an investment account no matter how much it is,” “I allocate extra money and put it into a savings account.”
Dr. Greenwald said, “I have a rule that every client needs to be saving 20% of their gross income toward retirement, including whatever the employer is putting in.”
Putting a portion of every paycheck into savings is key to making progress toward financial goals. Start by building an emergency fund with at least 3-6 months’ worth of expenses in it and making sure you’re saving at least enough for retirement to get any potential employer match.
Mr. Snider suggests increasing the percentage you save every time you get a raise.
“The thought behind that strategy is that when a doctor receives a pay raise – even if it’s just a cost-of-living raise of 3% – an extra 1% saved doesn’t reduce their take-home pay year-over-year,” he says. “In fact, they still take home more money, and they save more money. Win-win.”
3. Focus on paying down your debt.
Physicians told us how they were working to pay down debt with the following recommendations: “Accelerate debt reduction,” “I make additional principal payment to our home mortgage,” “We are aggressively attacking our remaining student loans.”
Reducing or eliminating debt is key to increasing cash flow, which can make it easier to meet all of your other financial goals. One-quarter of physicians have credit card debt, which typically carries interest rates higher than other types of debt, making it far more expensive. Focus on paying off such high-interest debt first, before moving on to other types of debt such as auto loans, student loans, or a mortgage.
“Credit card debt and any unsecured debt should be paid before anything else,” Mr. Snider says. “Getting rid of those high interest rates should be a priority. And that type of debt has less flexible terms than student debt.”
4. Great opportunity to take advantage of record-low interest rates.
Physicians said that, to save money, they are recommending the following: “Consolidating student debt into our mortgage,” “Accelerating payments of the principle on our mortgage,” “Making sure we have an affordable mortgage.”
With interest rates at an all-time low, even those who’ve recently refinanced might see significant savings by refinancing again. Given the associated fees, it typically makes sense to refinance if you can reduce your mortgage rate by at least a point, and you’re planning to stay in the home for at least 5 years.
“Depending on how much lower your rate is, refinancing can make a big difference in your monthly payments,” Ms. Guerich said. “For physicians who might need an emergency reserve but don’t have cash on hand, a HELOC [Home Equity Line of Credit] is a great way to accomplish that.”
5. Be wary of credit cards dangers; use cards wisely.
Physician respondents recommended the following: “Use 0% interest offers on credit cards,” “Only have one card and pay it off every month,” “Never carry over balance.”
Nearly 80% of physicians have three or more credit cards, with 18% reporting that they have seven or more. When used wisely, credit cards can be an important tool for managing finances. Many credit cards come with tools that can help with budgeting, and credit cards rewards and perks can offer real value to users. That said, rewards typically are not valuable enough to offset the cost of interest on balances (or the associated damage to your credit score) that aren’t paid off each month.
“If you’re paying a high rate on credit card balances that carry over every month, regardless of your income, that could be a symptom that you may be spending more than you should,” says Dan Keady, a CFP and chief financial planning strategist at financial services firm TIAA.
6. Give less to Uncle Sam: Keep it for yourself.
Physicians said that they do the following: “Maximize tax-free/deferred savings (401k, HSA, etc.),” “Give to charity to reduce tax,” “Use pre-tax dollars for childcare and healthcare.”
Not only does saving in workplace retirement accounts help you build your nest egg, but it also reduces the amount that you have to pay in taxes in a given year. Physicians should also take advantage of other ways to reduce their income for tax purposes, such as saving money in a health savings account or flexible savings account.
The 401(k) or 403(b) contribution limit for this year is $19,500 ($26,000) for those age 50 years and older. Self-employed physicians can save even more money via a Simplified Employee Pension (SEP) IRA, says Ms. Guerich said. They can save up to 25% of compensation, up to $57,000 in 2020.
7. Automate everything and spare yourself the headache.
Physicians said the following: “Designate money from your paycheck directly to tax deferred and taxable accounts automatically,” “Use automatic payment for credit card balance monthly,” “Automate your savings.”
You probably already automate your 401(k) contributions, but you can also automate bill payments, emergency savings contributions and other financial tasks. For busy physicians, this can make it easier to stick to your financial plan and achieve your goals.
“The older you get, the busier you get, said Mr. Snider says. “Automation can definitely help with that. But make sure you are checking in quarterly to make sure that everything is still in line with your plan. The problem with automation is when you forget about it completely and just let everything sit there.”
8. Save separately for big purchases.
Sometimes it’s the big major expenses that can start to derail a budget. Physicians told us the following tactics for large purchases: “We buy affordable cars and take budget vacations,” “I buy used cars,” “We save in advance for new cars and only buy cars with cash.”
The decision of which car to purchase or where to go on a family vacation is a personal one, and some physicians take great enjoyment and pride in driving a luxury vehicle or traveling to exotic locales. The key, experts say, is to factor the cost of that car into the rest of your budget, and make sure that it’s not preventing you from achieving other financial goals.
“I don’t like to judge or tell clients how they should spend their money,” said Andrew Musbach, a certified financial planner and cofounder of MD Wealth Management in Chelsea, Mich. “Some people like cars, we have clients that have two planes, others want a second house or like to travel. Each person has their own interest where they may spend more relative to other people, but as long as they are meeting their savings targets, I encourage them to spend their money and enjoy what they enjoy most, guilt free.”
Mr. Snider suggests setting up a savings account separate from emergency or retirement accounts to set aside money if you have a goal for a large future purchase, such as a boat or a second home.
“That way, the funds don’t get commingled, and it’s explicitly clear whether or not the doctor is on target,” he says. “It also prevents them from treating their emergency savings account as an ATM machine.”
9. Start saving for college when the kids are little.
Respondents said the following: “We are buying less to save for the kids’ college education,” “We set up direct deposit into college and retirement savings plans,” “We have a 529 account for college savings.”
Helping pay for their children’s college education is an important financial goal for many physicians. The earlier that you start saving, the less you’ll have to save overall, thanks to compound interest. State 529 accounts are often a good place to start, especially if your state offers a tax incentive for doing so.
Mr. Snider recommends that physicians start small, with an initial investment of $1,000 per month and $100 per month contributions. Assuming a 7% rate of return and 17 years’ worth of savings, this would generate just over $42,000. (Note, current typical rates of return are less than 7%).
“Ideally, as other goals are accomplished and personal debt gets paid off, the doctor is ramping up their savings to have at least 50% of college expenses covered from their 529 college savings,” he says.
10. Watch out for the temptation of impulse purchases.
Physicians said the following: “Avoid impulse purchases,” “Avoid impulse shopping, make a list for the store and stick to it,” “Wait to buy things on sale.”
Nothing wrecks a budget like an impulse buy. More than half (54%) of U.S. shoppers have admitted to spending $100 or more on an impulse purchase. And 20% of shoppers have spent at least $1,000 on an impulse buy. Avoid buyers’ remorse by waiting a few days to make large purchase decisions or by limiting your unplanned spending to a certain dollar amount within your budget.
Online shopping may be a particular temptation. Dr. Tarugu, the Florida gastroenterologist, has focused on reducing those impulse buys as well, deleting all online shopping apps from his and his family’s phones.
“You won’t notice how much you have ordered online until it arrives at your doorstep,” he said. “It’s really important to keep it at bay.”
Mr. Keady, the TIAA chief planning strategist, recommended this tactic: Calculate the number of patients (or hours) you’d need to see in order to earn the cash required to make the purchase.
“Then, in a mindful way, figure out the amount of value derived from the purchase,” he said.
A version of this article originally appeared on Medscape.com.
Asymptomatic children may transmit COVID-19 in communities
About 22% of children with COVID-19 infections were asymptomatic, and 66% of the symptomatic children had unrecognized symptoms at the time of diagnosis, based on data from a case series of 91 confirmed cases.

Although recent reports suggest that COVID-19 infections in children are generally mild, data on the full spectrum of illness and duration of viral RNA in children are limited, wrote Mi Seon Han, MD, PhD, of Seoul (South Korea) Metropolitan Government–Seoul National University Boramae Medical Center, and colleagues.
To examine the full clinical course and duration of COVID-19 RNA detectability in children with confirmed infections, the researchers reviewed data from 91 individuals with confirmed infections. The children ranged in age from 27 days to 18 years, and 58% were male. The children were monitored at 20 hospitals and 2 isolation facilities for a mean 21.9 days. The findings were published in JAMA Pediatrics.
Overall, COVID-19 viral RNA was present in the study population for a mean 17.6 days, with testing done at a median interval of 3 days. A total of 20 children (22%) were asymptomatic throughout the study period. In these children, viral RNA was detected for a mean 14 days.
“The major hurdle implicated in this study in diagnosing and treating children with COVID-19 is that the researchers noted.
Of the 71 symptomatic children, 47 (66%) had unrecognized symptoms prior to diagnosis, 18 (25%) developed symptoms after diagnosis, and 6 (9%) were diagnosed at the time of symptom onset. The symptomatic children were symptomatic for a median of 11 days; 43 (61%) remained symptomatic at 7 days’ follow-up after the study period, 27 (38%) were symptomatic at 14 days, and 7 (10%) were symptomatic at 21 days.
A total of 41 children had upper respiratory infections (58%) and 22 children (24%) had lower respiratory tract infections. No difference in the duration of virus RNA was detected between children with upper respiratory tract infections and lower respiratory tract infections (average, 18.7 days vs. 19.9 days).
Among the symptomatic children, 46 (65%) had mild cases and 20 (28%) had moderate cases.
For treatment, 14 children (15%) received lopinavir-ritonavir and/or hydroxychloroquine. Two patients had severe illness and received oxygen via nasal prong, without the need for mechanical ventilation. All the children in the case series recovered from their infections with no fatalities.
The study’s main limitation was the inability to analyze the transmission potential of the children because of the quarantine and isolation policies in Korea, the researchers noted. In addition, the researchers did not perform follow-up testing at consistent intervals, so the duration of COVID-19 RNA detection may be inexact.
However, the results suggest “that suspecting and diagnosing COVID-19 in children based on their symptoms without epidemiologic information and virus testing is very challenging,” the researchers emphasized.
“Most of the children with COVID-19 have silent disease, but SARS-CoV-2 RNA can still be detected in the respiratory tract for a prolonged period,” they wrote. More research is needed to explore the potential for disease transmission by children in the community, and increased surveillance with laboratory screening can help identify children with unrecognized infections.
The study is the first known to focus on the frequency of asymptomatic infection in children and the duration of symptoms in both asymptomatic and symptomatic children, Roberta L. DeBiasi, MD, and Meghan Delaney, DO, both affiliated with Children’s National Hospital and Research Institute, Washington, and George Washington University, Washington, wrote in an accompanying editorial. The structure of the Korean public health system “allowed for the sequential observation, testing (median testing interval of every 3 days), and comparison of 91 asymptomatic, presymptomatic, and symptomatic children with mild to moderate upper and lower respiratory tract infection, identified primarily by contact tracing from laboratory-proven cases.”
Two take-home points from the study are that not all infected children are symptomatic, and the duration of symptoms in those who are varies widely, they noted. “Interestingly, this study aligns with adult data in which up to 40% of adults may remain asymptomatic in the face of infection.”
However, “The third and most important take-home point from this study relates to the duration of viral shedding in infected pediatric patients,” Dr. DeBiasi and Dr. Delaney said (JAMA Pediatr. 2020 Aug 28. doi: 10.1001/jamapediatrics.2020.3996).
“Fully half of symptomatic children with both upper and lower tract disease were still shedding virus at 21 days. These are striking data, particularly since 86 of 88 diagnosed children (98%) either had no symptoms or mild or moderate disease,” they explained. The results highlight the need for improvements in qualitative molecular testing and formal studies to identify differences in results from different testing scenarios, such as hospital entry, preprocedure screening, and symptomatic testing. In addition, “these findings are highly relevant to the development of public health strategies to mitigate and contain spread within communities, particularly as affected communities begin their recovery phases.”
The study is important because “schools are opening, and we don’t know what is going to happen,” Michael E. Pichichero, MD, of Rochester General Hospital, N.Y., said in an interview.
“Clinicians, parents, students, school administrators and politicians are worried,” he said. “This study adds to others recently published, bringing into focus the challenges to several suppositions that existed when the COVID-19 pandemic began and over the summer.”
“This study of 91 Korean children tells us that taking a child’s temperature as a screening tool to decide if they may enter school will not be a highly successful strategy,” he said. “Many children are without fever and asymptomatic when infected and contagious. The notion that children shed less virus or shed it for shorter lengths of time we keep learning from this type of research is not true. In another recent study the authors found that children shed as much of the SARS-CoV-2 virus as an adult in the ICU on a ventilator.”
Dr. Pichichero said he was not surprised by the study findings. “A similar paper was published last week in the Journal of Pediatrics from Massachusetts General Hospital, so the findings in the JAMA paper are similar to what has been reported in the United States.”
“Availability of testing will continue to be a challenge in some communities,” said Dr. Pichichero. “Here in the Rochester, New York, area we will use a screening questionnaire based on the CDC [Centers for Disease Control and Prevention] symptom criteria of SARS-CoV-2 infections to decide whom to test.”
As for additional research, “We have so much more to learn about SARS-CoV-2 in children,” he emphasized. “The focus has been on adults because the morbidity and mortality has been greatest in adults, especially the elderly and those with compromised health.”
“The National Institutes of Health has issued a call for more research in children to characterize the spectrum of SARS-CoV-2 illness, including the multisystem inflammatory syndrome in children [MIS-C] and try to identify biomarkers and/or biosignatures for a prognostic algorithm to predict the longitudinal risk of disease severity after a child is exposed to and may be infected with SARS-CoV-2,” said Dr. Pichichero. “NIH has asked researchers to answer the following questions.”
- Why do children have milder illness?
- Are there differences in childhood biology (e.g., gender, puberty, etc.) that contribute to illness severity?
- Are there genetic host differences associated with different disease severity phenotypes, including MIS-C?
- Are there innate mucosal, humoral, cellular and other adaptive immune profiles that are associated with reduced or increased risk of progressive disease, including previous coronavirus infections?
- Will SARS-CoV-2 reinfection cause worse disease as seen with antibody-dependent enhancement (ADE) in other viral infections (e.g., dengue)? Will future vaccines carry a risk of the ADE phenomenon?
- Does substance use (e.g., nicotine, marijuana) exacerbate or trigger MIS-C through immune activation?
“We have no knowledge yet about SARS-CoV-2 vaccination of children, especially young children,” Dr. Pichichero emphasized. “There are different types of vaccines – messenger RNA, adenovirus vector and purified spike proteins of the virus – among others, but questions remain: Will the vaccines work in children? What about side effects? Will the antibodies and cellular immunity protect partially or completely?”
The researchers and editorialists had no financial conflicts to disclose. Dr. Pichichero had no financial conflicts to disclose.
SOURCE: Han MS et al. JAMA Pediatr. 2020 Aug 28. doi:10.1001/jamapediatrics.2020.3988.
About 22% of children with COVID-19 infections were asymptomatic, and 66% of the symptomatic children had unrecognized symptoms at the time of diagnosis, based on data from a case series of 91 confirmed cases.
Although recent reports suggest that COVID-19 infections in children are generally mild, data on the full spectrum of illness and duration of viral RNA in children are limited, wrote Mi Seon Han, MD, PhD, of Seoul (South Korea) Metropolitan Government–Seoul National University Boramae Medical Center, and colleagues.
To examine the full clinical course and duration of COVID-19 RNA detectability in children with confirmed infections, the researchers reviewed data from 91 individuals with confirmed infections. The children ranged in age from 27 days to 18 years, and 58% were male. The children were monitored at 20 hospitals and 2 isolation facilities for a mean 21.9 days. The findings were published in JAMA Pediatrics.
Overall, COVID-19 viral RNA was present in the study population for a mean 17.6 days, with testing done at a median interval of 3 days. A total of 20 children (22%) were asymptomatic throughout the study period. In these children, viral RNA was detected for a mean 14 days.
“The major hurdle implicated in this study in diagnosing and treating children with COVID-19 is that the researchers noted.
Of the 71 symptomatic children, 47 (66%) had unrecognized symptoms prior to diagnosis, 18 (25%) developed symptoms after diagnosis, and 6 (9%) were diagnosed at the time of symptom onset. The symptomatic children were symptomatic for a median of 11 days; 43 (61%) remained symptomatic at 7 days’ follow-up after the study period, 27 (38%) were symptomatic at 14 days, and 7 (10%) were symptomatic at 21 days.
A total of 41 children had upper respiratory infections (58%) and 22 children (24%) had lower respiratory tract infections. No difference in the duration of virus RNA was detected between children with upper respiratory tract infections and lower respiratory tract infections (average, 18.7 days vs. 19.9 days).
Among the symptomatic children, 46 (65%) had mild cases and 20 (28%) had moderate cases.
For treatment, 14 children (15%) received lopinavir-ritonavir and/or hydroxychloroquine. Two patients had severe illness and received oxygen via nasal prong, without the need for mechanical ventilation. All the children in the case series recovered from their infections with no fatalities.
The study’s main limitation was the inability to analyze the transmission potential of the children because of the quarantine and isolation policies in Korea, the researchers noted. In addition, the researchers did not perform follow-up testing at consistent intervals, so the duration of COVID-19 RNA detection may be inexact.
However, the results suggest “that suspecting and diagnosing COVID-19 in children based on their symptoms without epidemiologic information and virus testing is very challenging,” the researchers emphasized.
“Most of the children with COVID-19 have silent disease, but SARS-CoV-2 RNA can still be detected in the respiratory tract for a prolonged period,” they wrote. More research is needed to explore the potential for disease transmission by children in the community, and increased surveillance with laboratory screening can help identify children with unrecognized infections.
The study is the first known to focus on the frequency of asymptomatic infection in children and the duration of symptoms in both asymptomatic and symptomatic children, Roberta L. DeBiasi, MD, and Meghan Delaney, DO, both affiliated with Children’s National Hospital and Research Institute, Washington, and George Washington University, Washington, wrote in an accompanying editorial. The structure of the Korean public health system “allowed for the sequential observation, testing (median testing interval of every 3 days), and comparison of 91 asymptomatic, presymptomatic, and symptomatic children with mild to moderate upper and lower respiratory tract infection, identified primarily by contact tracing from laboratory-proven cases.”
Two take-home points from the study are that not all infected children are symptomatic, and the duration of symptoms in those who are varies widely, they noted. “Interestingly, this study aligns with adult data in which up to 40% of adults may remain asymptomatic in the face of infection.”
However, “The third and most important take-home point from this study relates to the duration of viral shedding in infected pediatric patients,” Dr. DeBiasi and Dr. Delaney said (JAMA Pediatr. 2020 Aug 28. doi: 10.1001/jamapediatrics.2020.3996).
“Fully half of symptomatic children with both upper and lower tract disease were still shedding virus at 21 days. These are striking data, particularly since 86 of 88 diagnosed children (98%) either had no symptoms or mild or moderate disease,” they explained. The results highlight the need for improvements in qualitative molecular testing and formal studies to identify differences in results from different testing scenarios, such as hospital entry, preprocedure screening, and symptomatic testing. In addition, “these findings are highly relevant to the development of public health strategies to mitigate and contain spread within communities, particularly as affected communities begin their recovery phases.”
The study is important because “schools are opening, and we don’t know what is going to happen,” Michael E. Pichichero, MD, of Rochester General Hospital, N.Y., said in an interview.
“Clinicians, parents, students, school administrators and politicians are worried,” he said. “This study adds to others recently published, bringing into focus the challenges to several suppositions that existed when the COVID-19 pandemic began and over the summer.”
“This study of 91 Korean children tells us that taking a child’s temperature as a screening tool to decide if they may enter school will not be a highly successful strategy,” he said. “Many children are without fever and asymptomatic when infected and contagious. The notion that children shed less virus or shed it for shorter lengths of time we keep learning from this type of research is not true. In another recent study the authors found that children shed as much of the SARS-CoV-2 virus as an adult in the ICU on a ventilator.”
Dr. Pichichero said he was not surprised by the study findings. “A similar paper was published last week in the Journal of Pediatrics from Massachusetts General Hospital, so the findings in the JAMA paper are similar to what has been reported in the United States.”
“Availability of testing will continue to be a challenge in some communities,” said Dr. Pichichero. “Here in the Rochester, New York, area we will use a screening questionnaire based on the CDC [Centers for Disease Control and Prevention] symptom criteria of SARS-CoV-2 infections to decide whom to test.”
As for additional research, “We have so much more to learn about SARS-CoV-2 in children,” he emphasized. “The focus has been on adults because the morbidity and mortality has been greatest in adults, especially the elderly and those with compromised health.”
“The National Institutes of Health has issued a call for more research in children to characterize the spectrum of SARS-CoV-2 illness, including the multisystem inflammatory syndrome in children [MIS-C] and try to identify biomarkers and/or biosignatures for a prognostic algorithm to predict the longitudinal risk of disease severity after a child is exposed to and may be infected with SARS-CoV-2,” said Dr. Pichichero. “NIH has asked researchers to answer the following questions.”
- Why do children have milder illness?
- Are there differences in childhood biology (e.g., gender, puberty, etc.) that contribute to illness severity?
- Are there genetic host differences associated with different disease severity phenotypes, including MIS-C?
- Are there innate mucosal, humoral, cellular and other adaptive immune profiles that are associated with reduced or increased risk of progressive disease, including previous coronavirus infections?
- Will SARS-CoV-2 reinfection cause worse disease as seen with antibody-dependent enhancement (ADE) in other viral infections (e.g., dengue)? Will future vaccines carry a risk of the ADE phenomenon?
- Does substance use (e.g., nicotine, marijuana) exacerbate or trigger MIS-C through immune activation?
“We have no knowledge yet about SARS-CoV-2 vaccination of children, especially young children,” Dr. Pichichero emphasized. “There are different types of vaccines – messenger RNA, adenovirus vector and purified spike proteins of the virus – among others, but questions remain: Will the vaccines work in children? What about side effects? Will the antibodies and cellular immunity protect partially or completely?”
The researchers and editorialists had no financial conflicts to disclose. Dr. Pichichero had no financial conflicts to disclose.
SOURCE: Han MS et al. JAMA Pediatr. 2020 Aug 28. doi:10.1001/jamapediatrics.2020.3988.
FROM JAMA PEDIATRICS
Post-acne nasal papules described in a series of patients
, but researchers believe the condition could be an underrecognized problem, affecting patients with skin of color in particular, according to the authors of a case series published in Pediatric Dermatology.
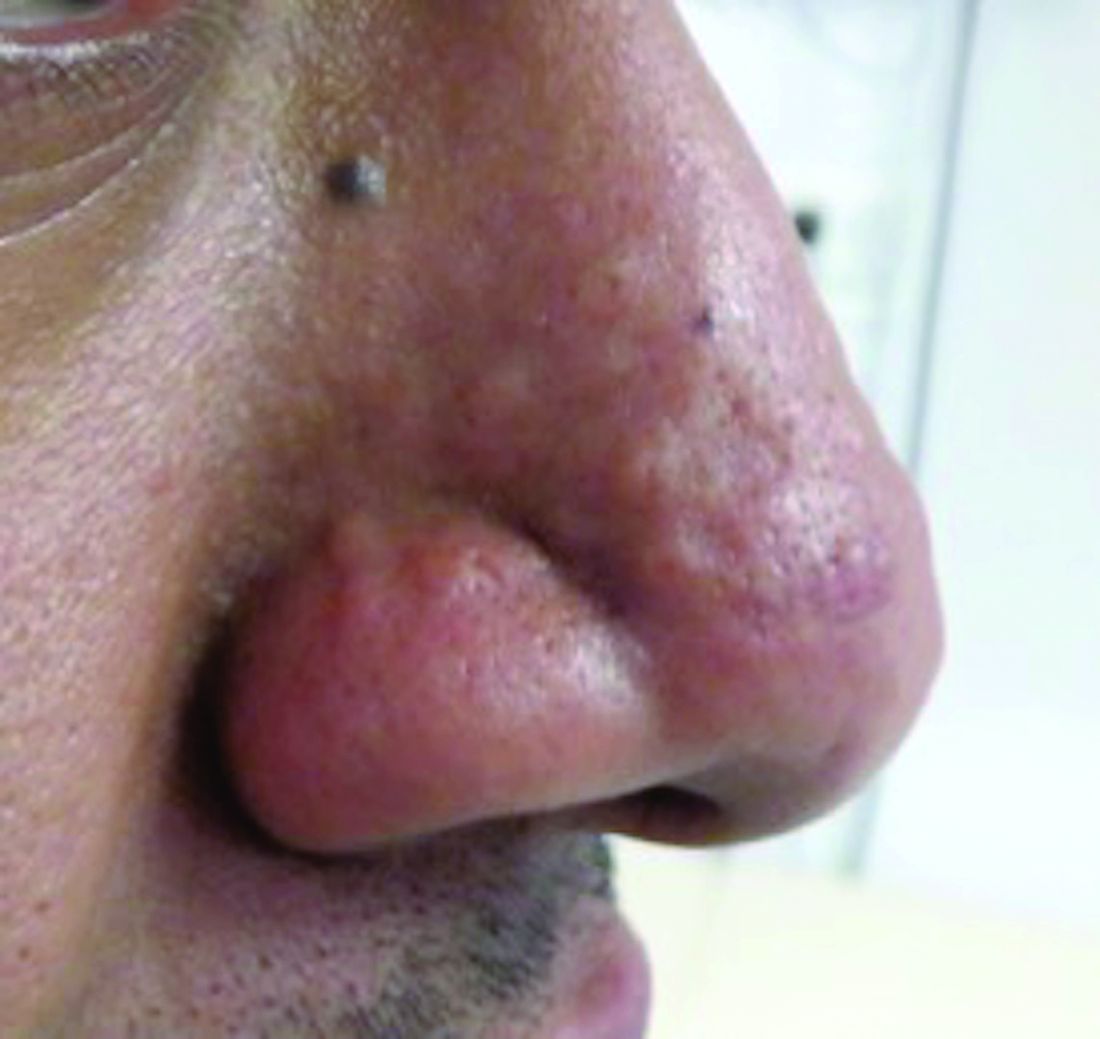
Jorge Roman, MD, and coauthors in the department of dermatology at New York (N.Y.) University identified 20 patients with a history of acne who had nasal papules, in a retrospective review of electronic medical records at NYU over 1 year (April 2018 to April 2019). The presentation ranged from “a few, small skin-colored papules to large, dome-shaped papulonodules, to more extensive rhinophymatous-like” changes with some patients having papular lesions on the chin in addition to the nose, they wrote in the report.

These papules greatly resembled angiofibromas, but appear to be a sequela of acne, according to the authors. In five patients who had biopsies, the results showed “a dome-shaped proliferation of spindle and stellate-shaped cells with thickened collagen bundles and dilated thin-walled blood vessels,” the authors wrote. “The histopathological findings of these nasal papules were indistinguishable from those of a conventional angiofibroma.”
In addition, the patients did not have evidence of underlying genetic conditions that could explain the angiofibroma-like lesions. “Although acne has not previously been implicated in the development of angiofibromas, based on the data available for our patients, it seems extremely unlikely that the lesions would be related to anything else,” Dr. Roman, a dermatology resident at New York University, said in an interview.
He said he first recognized the nasal papules in clinic as a first-year resident, but was surprised to find a lack of information on the condition. “Dermatology has a name for just about every skin disease imaginable, so I found it very odd when I couldn’t find much describing this condition,” he said. “There was a large disparity between what we were seeing in clinic and what was reported in the literature.”
Nearly all the patients were Hispanic (17 of 20) and adolescent males (17 patients), with a median age of 16 years at the time of presentation. There were two Black patients and one Asian patient. Race and ethnicity were not mentioned in two previous reports describing papular acne scarring, but Dr. Roman and colleagues noted that in their clinic, the condition appeared to affect adolescent patients with skin of color predominantly.
Reasons why nasal papules may be underreported are unclear, Dr. Roman noted. One possible explanation is lower use of dermatologic care among patients with skin of color. “Interestingly, previous research has shown that racial minorities are lower utilizers of dermatologic care. It is possible that the patient demographic most afflicted by this condition face significant barriers when seeking care,” he said.
Due to a low level of awareness of acne-related nasal papules, “clinicians may not recognize it as an acne-related scarring process. This is significant, as early recognition and treatment can prevent the development or progression of these potentially disfiguring sequelae,” Dr. Roman said.
Although the results are from a small case series at a single center, Dr. Roman said this condition may be more prevalent than realized. “Having been raised in a predominately Latino community in Texas, I can easily recall seeing people with these papules growing up. I don’t think it would be surprising for dermatologists reading our paper to say, ‘I’ve seen this in clinic before,’ ” he said.
Regarding treatment, there is an ongoing investigation into what treatments are effective for the acne-related nasal papules. “Physical treatment modalities such as ablative laser or surgical removal seem to be the most efficacious,” Dr. Roman said. “In the future, a prospective clinical study will help to better define the prevalence and risk factors for the condition,” he said.
He and coauthors reported no conflicts of interest. No funding source was listed.
SOURCE: Roman J et al. Pediatr Dermatol. 2020 Aug 7. doi: 10.1111/pde.14319.
, but researchers believe the condition could be an underrecognized problem, affecting patients with skin of color in particular, according to the authors of a case series published in Pediatric Dermatology.
Jorge Roman, MD, and coauthors in the department of dermatology at New York (N.Y.) University identified 20 patients with a history of acne who had nasal papules, in a retrospective review of electronic medical records at NYU over 1 year (April 2018 to April 2019). The presentation ranged from “a few, small skin-colored papules to large, dome-shaped papulonodules, to more extensive rhinophymatous-like” changes with some patients having papular lesions on the chin in addition to the nose, they wrote in the report.
These papules greatly resembled angiofibromas, but appear to be a sequela of acne, according to the authors. In five patients who had biopsies, the results showed “a dome-shaped proliferation of spindle and stellate-shaped cells with thickened collagen bundles and dilated thin-walled blood vessels,” the authors wrote. “The histopathological findings of these nasal papules were indistinguishable from those of a conventional angiofibroma.”
In addition, the patients did not have evidence of underlying genetic conditions that could explain the angiofibroma-like lesions. “Although acne has not previously been implicated in the development of angiofibromas, based on the data available for our patients, it seems extremely unlikely that the lesions would be related to anything else,” Dr. Roman, a dermatology resident at New York University, said in an interview.
He said he first recognized the nasal papules in clinic as a first-year resident, but was surprised to find a lack of information on the condition. “Dermatology has a name for just about every skin disease imaginable, so I found it very odd when I couldn’t find much describing this condition,” he said. “There was a large disparity between what we were seeing in clinic and what was reported in the literature.”
Nearly all the patients were Hispanic (17 of 20) and adolescent males (17 patients), with a median age of 16 years at the time of presentation. There were two Black patients and one Asian patient. Race and ethnicity were not mentioned in two previous reports describing papular acne scarring, but Dr. Roman and colleagues noted that in their clinic, the condition appeared to affect adolescent patients with skin of color predominantly.
Reasons why nasal papules may be underreported are unclear, Dr. Roman noted. One possible explanation is lower use of dermatologic care among patients with skin of color. “Interestingly, previous research has shown that racial minorities are lower utilizers of dermatologic care. It is possible that the patient demographic most afflicted by this condition face significant barriers when seeking care,” he said.
Due to a low level of awareness of acne-related nasal papules, “clinicians may not recognize it as an acne-related scarring process. This is significant, as early recognition and treatment can prevent the development or progression of these potentially disfiguring sequelae,” Dr. Roman said.
Although the results are from a small case series at a single center, Dr. Roman said this condition may be more prevalent than realized. “Having been raised in a predominately Latino community in Texas, I can easily recall seeing people with these papules growing up. I don’t think it would be surprising for dermatologists reading our paper to say, ‘I’ve seen this in clinic before,’ ” he said.
Regarding treatment, there is an ongoing investigation into what treatments are effective for the acne-related nasal papules. “Physical treatment modalities such as ablative laser or surgical removal seem to be the most efficacious,” Dr. Roman said. “In the future, a prospective clinical study will help to better define the prevalence and risk factors for the condition,” he said.
He and coauthors reported no conflicts of interest. No funding source was listed.
SOURCE: Roman J et al. Pediatr Dermatol. 2020 Aug 7. doi: 10.1111/pde.14319.
FROM PEDIATRIC DERMATOLOGY
Who’s better off: Employed or self-employed physicians?
Self-employed physicians have the highest salaries, largest homes, and greatest wealth – yet they feel the least fairly compensated, according to an analysis of data from over 17,000 physicians.
A new examination of survey responses from the Medscape Physician Compensation Report 2020, which included information about income, job satisfaction, and more, compared responses from self-employed physicians, independent contractors, and employed physicians.
Income and wealth, benefits, and job satisfaction were compared. From the results of the questionnaire, self-employed physicians stand out among their peers across all categories: They enjoy greater income, wealth, and benefits and appear to be more satisfied by their choice of practice.
“The survey confirms that self-employed is the most satisfying, although the trend in health care is to take employed positions,” said Robert Scroggins, JD, CPA, certified health care business consultant with ScrogginsGreer, Cincinnati. “Doctors who become employees primarily do that to escape the management responsibilities for the practice. It seems to be more a decision to get away from something than to go toward something.”
The financial and work picture for self-employed physicians
Self-employed physicians reported the largest salaries for 2019 (average, $360,752), followed by independent contractors ($336,005). Employees reported the lowest average salary ($297,332).
The largest percentage of self-employed physicians (46%) work in an office-based group practice, followed by those in office-based solo practices (30%). Almost two-thirds of self-employed respondents are owners and 37% are partners.
Self-employed physicians are more likely to be older than 45 years; 79% fall into that age bracket, compared with 57% of employees and 70% of independent contractors.
Self-employed physicians reported the highest levels of wealth among their peers. About 44% of self-employed respondents declared a net wealth of over $2 million, compared with 25% of employees. Only 6% of contractors and employed physicians reported a net wealth of over $5 million, compared with 13% of self-employed physicians.
Self-employed physicians also managed their personal expenses slightly differently. They were more likely to pool their income with their spouse in a common account used for bills and expenses, regardless of how much they each earned (63% of self-employed respondents, compared with 58% of employees and 50% of independent contractors).
Perhaps unsurprisingly, self-employed physicians also reported having the largest homes, with an average square footage of 3,629 square feet, compared with 3,023 square feet for employees and 2,984 square feet for independent contractors. Self-employed physicians’ mortgages (average, $240,389) were similar to those of employed physicians’ mortgages but were higher than those of independent contractors’ mortgages (average, $213,740).
Self-employed physicians were also most likely to highly appraise their own performance: Half of all self-employed respondents felt “very satisfied” with their job performance, compared with 40% of employees and 44% of independent contractors.
When asked what they consider to be the most rewarding aspect of their job, self-employed physicians were more likely to choose gratitude and patient relationships than their peers (32%, compared with 26% of employees and 19% of independent contractors).
Despite their higher net wealth and larger salaries, self-employed physicians were least likely to feel fairly compensated; 49% of self-employed physicians said they did not feel fairly compensated for their work, compared with 40% of employees and 40% of independent contractors.
“Self-employed physicians may be better compensated than others of the same specialty who are employees, so some of that may be perception,” said Mr. Scroggins. “Or they feel they should be compensated to a far greater degree than those who are employed.”
Self-employed physicians were also more likely to respond that they would choose the same practice setting again, though across all three categories, fewer than 50% of respondents would do so: 34% of self-employed physicians, compared with 29% of employees and 28% of independent contractors.
The financial and work picture for employed physicians
About a third (32%) of employed physician respondents work in hospitals; 28% work in private practices.
Employed physicians were most likely to report a salary increase from 2018 to 2019: 74%, compared with 45% of self-employed and 52% of independent contractors.
As for declines in income, self-employed physicians and independent contractors suffered a comparable loss, with 13% and 12% of them, respectively, reporting salary cuts greater than 10%. Decreases of up to 10% were felt mostly by the self-employed, with 17% experiencing such cuts, compared with 7% of employees and 10% of independent contractors.
In contrast, employees were the least likely of the three categories to have incurred large financial losses over the past year: 77% of employed respondents indicated that they had not experienced any significant financial losses in the past year, compared with 63% of self-employed physicians and 63% of independent contractors. They were also least likely to have made any investments at all over the past year – 21% of employees reported having made none at all in 2019, compared to 11% of self-employed physicians and 16% of independent contractors.
The financial and work picture for independent contractors
Just over half (52%) of all independent contractors who responded to our questionnaire work in hospitals, 15% work in group practices, 9% work in outpatient clinics, and just 2% work in solo practices.
Independent contractors were less likely than their peers to have received employment benefits such as health insurance, malpractice coverage, and paid time off. They were also less likely to be saving for retirement. Almost half (45%) of independent contractors said they received no employment benefits at all, compared to 20% of self-employed physicians and just 8% of employees.
What’s more, 27% of independent contractors do not currently put money into a 401(k) retirement account or tax-deferred college savings account on a regular basis, compared with 16% of self-employed physicians and 8% of employees. Similarly, they were less likely to put money into a taxable savings account (39% responded that they do not, compared with 32% of self-employed physicians and 27% of employees).
“Net worth and retirement funding findings do line up with what I’ve observed,” said Mr. Scroggins. “Those who have independent practices as opposed to working for a hospital do tend to more heavily fund retirement plan accounts, which is typically the biggest driver of building net worth.”
Despite the lack of retirement planning, independent contractors were more likely than their peers to derive satisfaction from making money at a job they like (18%, compared with 12% of employees and 11% of self-employed physicians). They’re also far more likely to be in emergency medicine (22% of independent contractors, compared with 3% of self-employed and 5% of employees) or psychiatry (11% of independent contractors, compared with 5% of self-employed and 6% of employees).
Among the three categories of physicians, independent contractors were least likely to say that they would choose the same practice setting again. Across all three categories, fewer than 50% of respondents would do so: 34% of self-employed physicians, compared with 29% of employees and 28% of independent contractors.
Physicians who are considering leaving their own practice for a hospital setting should do so with caution and fully understand what they are getting into, said Mr. Scroggins. “If they’re just looking at compensation, they also should be looking very carefully at retirement plan benefits. If that’s their main method of saving and building net worth, then that’s a dramatic difference.”
And of course, there’s always the intangible value of feeling connected to a practice and its patients: “Physicians got into this line of work to treat patients and help people become healthier, and in hospitals they end up being more disconnected from their patients,” Mr. Scroggins said. “That’s a big factor as well.”
Editor’s note: Only differences that are statistically significant at a 95% confidence level between categories of employment have been included. Of the 13,893 responses included in this analysis, 3,860 physicians identified as self-employed, 9,262 as employees, and 772 as independent contractors.
A version of this article originally appeared on Medscape.com.
High schoolers prefer tobacco as vapor, not smoke
according to the Centers for Disease Control and Prevention.
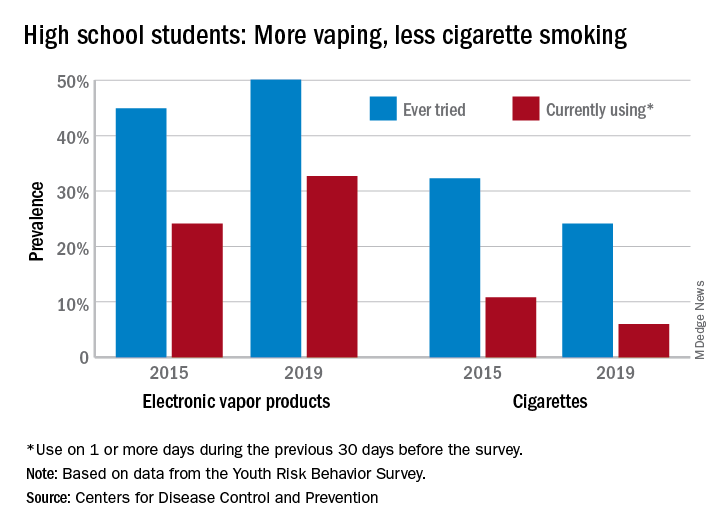
From 2015 to 2019, current use of electronic vapor products among students in grades 9-12 rose from 24.1% to 32.7%, while the same level of cigarette use – on 1 or more days in the previous 30 – dropped from 10.8% to 6.0%, based on data from the Youth Risk Behavior Survey.
Among the survey respondents, 50.1% had at least tried an electronic vapor product by 2019, up from 44.9% in 2015. Cigarettes again showed a decline, as ever use fell from 32.3% to 24.1%, or less than half of the e-product prevalence. Everyday use of vaping products was 7.2% in 2019 (up from 2.0% in 2015), compared with 1.1% for cigarettes (down from 2.3%), the YRBS data show.
“The dramatic increase in electronic vapor product use among high school students has led to increases in overall tobacco product use among U.S. youths, erasing gains made in previous years and leading the U.S. Surgeon General to declare youth e-cigarette use an epidemic in the United States,” MeLisa R. Creamer, PhD, and associates at the CDC wrote in the MMWR.
Electronic vapor products, as defined by the survey, “include e-cigarettes, vapes, vape pens, e-cigars, e-hookahs, hookah pens, and mods.”
Current use of cigarettes among high school students, as measured by the YRBS, has been declining since reaching a high of 36.4% in 1997; the prevalence of everyday use peaked at 12.8% in 1999. Current use of cigars declined as well, falling from 17.7% in 1999 to 5.7% in 2019, according to YRBS data.
“In 2019, a total of 36.5% of high school students currently used any tobacco product, with electronic vapor products being the most commonly used product,” Dr. Creamer and associates wrote in their recent analysis of the YRBS data (MMWR Supp. 2020 Aug 21;69[1]:56-63).
For the first time since the use of electronic vapor products was included in the every-other-year survey in 2015, females were more likely than males to be current users of vaping products last year, 33.5% to 32.0%. Males were heavier users of cigarettes by a margin of 6.9% to 4.9%, the CDC reported.
Geographically speaking, use of both electronic vapor products and cigarettes varied considerably among the 43 states with available data. Current use of electronic products ranged from a low of 9.7% in Utah to a high of 35.7% in West Virginia, with the two states in the same positions regarding current cigarette use: Utah (2.2%) lowest and West Virginia (13.5%) highest, based on the 2019 YRBS data.
“Tobacco product usage has evolved, and the increasing prevalence of electronic vapor product use among youths during recent years is concerning,” Dr. Creamer and associates wrote.
according to the Centers for Disease Control and Prevention.
From 2015 to 2019, current use of electronic vapor products among students in grades 9-12 rose from 24.1% to 32.7%, while the same level of cigarette use – on 1 or more days in the previous 30 – dropped from 10.8% to 6.0%, based on data from the Youth Risk Behavior Survey.
Among the survey respondents, 50.1% had at least tried an electronic vapor product by 2019, up from 44.9% in 2015. Cigarettes again showed a decline, as ever use fell from 32.3% to 24.1%, or less than half of the e-product prevalence. Everyday use of vaping products was 7.2% in 2019 (up from 2.0% in 2015), compared with 1.1% for cigarettes (down from 2.3%), the YRBS data show.
“The dramatic increase in electronic vapor product use among high school students has led to increases in overall tobacco product use among U.S. youths, erasing gains made in previous years and leading the U.S. Surgeon General to declare youth e-cigarette use an epidemic in the United States,” MeLisa R. Creamer, PhD, and associates at the CDC wrote in the MMWR.
Electronic vapor products, as defined by the survey, “include e-cigarettes, vapes, vape pens, e-cigars, e-hookahs, hookah pens, and mods.”
Current use of cigarettes among high school students, as measured by the YRBS, has been declining since reaching a high of 36.4% in 1997; the prevalence of everyday use peaked at 12.8% in 1999. Current use of cigars declined as well, falling from 17.7% in 1999 to 5.7% in 2019, according to YRBS data.
“In 2019, a total of 36.5% of high school students currently used any tobacco product, with electronic vapor products being the most commonly used product,” Dr. Creamer and associates wrote in their recent analysis of the YRBS data (MMWR Supp. 2020 Aug 21;69[1]:56-63).
For the first time since the use of electronic vapor products was included in the every-other-year survey in 2015, females were more likely than males to be current users of vaping products last year, 33.5% to 32.0%. Males were heavier users of cigarettes by a margin of 6.9% to 4.9%, the CDC reported.
Geographically speaking, use of both electronic vapor products and cigarettes varied considerably among the 43 states with available data. Current use of electronic products ranged from a low of 9.7% in Utah to a high of 35.7% in West Virginia, with the two states in the same positions regarding current cigarette use: Utah (2.2%) lowest and West Virginia (13.5%) highest, based on the 2019 YRBS data.
“Tobacco product usage has evolved, and the increasing prevalence of electronic vapor product use among youths during recent years is concerning,” Dr. Creamer and associates wrote.
High mortality rates reported in large COVID-19 study
Factors including older age and certain comorbidities have been linked to more serious COVID-19 outcomes in previous research, and now a large dataset collected from hundreds of hospitals nationwide provides more detailed data regarding risk for mechanical ventilation and death.
History of pulmonary disease or smoking, interestingly, were not.
One expert urges caution when interpreting the results, however. Although the study found a number of risk factors for ventilation and mortality, she says the dataset lacks information on race and disease severity, and the sample may not be nationally representative.
The investigators hope their level of granularity will further assist researchers searching for effective treatments and clinicians seeking to triage patients during the COVID-19 pandemic.
The study was published online August 28 in Clinical Infectious Diseases.
COVID-19 and comorbidities
“What I found most illuminating was this whole concept of comorbid conditions. This provides suggestive data about who we need to worry about most and who we may need to worry about less,” study author Robert S. Brown Jr, MD, MPH, told Medscape Medical News.
Comorbid conditions included hypertension in 47% of patients, diabetes in 28%, and cardiovascular disease in 19%. Another 16% were obese and 12% had chronic kidney disease. People with comorbid obesity, chronic kidney disease, and cardiovascular disease were more likely to receive mechanical ventilation compared to those without a history of these conditions in an adjusted, multivariable logistic analysis.
With the exception of obesity, the same factors were associated with risk for death during hospitalization.
In contrast, hypertension, history of smoking, and history of pulmonary disease were associated with a lower risk of needing mechanical ventilation and/or lower risk for mortality.
Furthermore, people with liver disease, gastrointestinal diseases, and even autoimmune diseases – which are likely associated with immunosuppression – “are not at that much of an increased risk that we noticed it in our data,” Brown said.
“As I tell many of my patients who have mild liver disease, for example, I would rather have mild liver disease and be on immunosuppressant therapy than be an older, obese male,” he added.
Assessing data for people in 38 U.S. states, and not limiting outcomes to patients in a particular COVID-19 hot spot, was a unique aspect of the research, said Brown, clinical chief of the Division of Gastroenterology and Hepatology at Weill Cornell Medicine in New York City.
Brown, lead author Michael W. Fried, MD, from TARGET PharmaSolutions in Durham, North Carolina, and colleagues studied adults from a commercially available Target Real-World Evidence (RWE) dataset of nearly 70,000 patients. They examined hospital chargemaster data and ICD-10 codes for COVID-19 inpatients between February 15 and April 20.
This population tended to be older, with 60% older than 60 years. A little more than half of participants, 53%, were men.
Key findings
A total of 21% of patients died after a median hospital length of stay of 8 days.
Older patients were significantly more likely to die, particularly those older than 60 years (P < .0001).
“This confirms some of the things we know about age and its impact on outcome,” Brown said.
The risk for mortality among patients older than 60 years was 7.2 times that of patients between 18 and 40 years in an adjusted multivariate analysis. The risk for death for those between 41 and 60 years of age was lower (odds ratio [OR], 2.6), compared with the youngest cohort.
Men were more likely to die than women (OR, 1.5).
When asked if he was surprised by the high mortality rates, Brown said, “Having worked here in New York? No, I was not.”
Mechanical ventilation and mortality
Male sex, age older than 40 years, obesity, and presence of cardiovascular or chronic kidney disease were risk factors for mechanical ventilation.
Among the nearly 2,000 hospitalized adults requiring mechanical ventilation in the current report, only 27% were discharged alive. “The outcomes of people who are mechanically ventilated are really quite sobering,” Brown said.
People who ever required mechanical ventilation were 32 times more likely to die compared with others whose highest level of oxygenation was low-flow, high-flow, or no-oxygen therapy in an analysis that controlled for demographics and comorbidities.
Furthermore, patients placed on mechanical ventilation earlier – within 24 hours of admission – tended to experience better outcomes.
COVID-19 therapies?
Brown and colleagues also evaluated outcomes in patients who were taking either remdesivir or hydroxychloroquine. A total of 48 people were treated with remdesivir.
The four individuals receiving remdesivir who died were among 11 who were taking remdesivir and also on mechanical ventilation.
“The data for remdesivir is very encouraging,” Brown said.
Many more participants were treated with hydroxychloroquine, more than 4,200 or 36% of the total study population.
A higher proportion of people treated with hydroxychloroquine received mechanical ventilation, at 25%, versus 12% not treated with hydroxychloroquine.
The unadjusted mortality rate was also higher among those treated with the agent, at 25%, compared to 20% not receiving hydroxychloroquine.
The data with hydroxychloroquine can lead to two conclusions, Brown said: “One, it doesn’t work. Or two, it doesn’t work in the way that we use it.”
The researchers cautioned that their hydroxychloroquine findings must be interpreted carefully because those treated with the agent were also more likely to have comorbidities and greater COVID-19 disease severity.
“This study greatly contributes to understanding the natural course of COVID-19 infection by describing characteristics and outcomes of patients with COVID-19 hospitalized throughout the US,” the investigators note. “It identified categories of patients at greatest risk for poor outcomes, which should be used to prioritize prevention and treatment strategies in the future.”
Some limitations
“The findings that patients with hypertension and who were smokers had lower ventilation rates, and patients with hypertension, pulmonary disease, who were smokers had lower mortality risks was very surprising,” Ninez A. Ponce, PhD, MPP, told Medscape Medical News when asked to comment on the study.
Although the study identified multiple risk factors for ventilation and mortality, “unfortunately the dataset did not have race available or disease severity,” said Ponce, director of the UCLA Center for Health Policy Research and professor in the Department of Health Policy and Management at the UCLA Fielding School of Public Health.
“These omitted variables could have a considerable effect on the significance, magnitude, and direction of point estimates provided, so I would be cautious in interpreting the results as a picture of a nationally representative sample,” she said.
On a positive note, the study and dataset could illuminate the utility of medications used to treat COVID-19, Ponce said. In addition, as the authors note, “the data will expand over time.”
Brown has reported receiving grants and consulting for Gilead. Ponce has disclosed no relevant financial relationships.
This article first appeared on Medscape.com.
Fatal pediatric melanomas diverse in presentation
results of a retrospective multicenter study showed.
“The most striking thing that we learned from this study is that pediatric melanoma can present in so many different ways, and it’s distinct from the adult population in that we see more presentations associated with congenital nevi, or spitz melanoma, which is a special class of pigmented lesions that looks a little different under the microscope,” Elena B. Hawryluk, MD, PhD, of the department of dermatology at Massachusetts General Hospital (MGH) and Harvard University, Boston, said in an interview. Dr. Hawryluk is lead author of the study, which was published online ahead of print in the Journal of the American Academy of Dermatology.
Dr. Hawryluk and colleagues at MGH and 11 other centers conducted a retrospective review of all cases of fatal pediatric melanoma among patients younger than 20 years diagnosed from late 1994 through early 2017.
They identified a total of 38 fatal cases over more than 2 decades. The cases were distinguished primarily by their heterogeneous clinical presentation and by the diversity of the patients, their precursor lesions, and the tumor histopathology, she said in an interview.
“We were surprised to find that patients with each of these presentations could end up with a fatal course, it wasn’t just all the adolescents, or all the patients with giant congenital nevi; it really presented quite diversely.”
Rare malignancy
Melanoma is far less common in the pediatric population than in adults, with an annual incidence of 18 per 1 million among adolescents aged 15-18 years, and 1 per 1 million in children under 10 years, the authors noted.
“Melanoma in children and adolescents often has distinct clinical presentations such as association with a congenital melanocytic nevus (CMN), spitzoid melanoma, or amelanotic melanoma, which are more rarely observed in adult melanoma patients. Unique pediatric-specific clinical detection criteria have been proposed to highlight these differences, such as a tendency to present amelanotically,” they wrote.
Factors associated with worse prognosis, such as higher Breslow thickness and mitotic index, are more frequently present at the time of diagnosis in children compared with adults, particularly those diagnosed before age 11 years.
“It is unclear if this difference is secondary to diagnostic delays due to low clinical suspicion, atypical clinical presentations, or more rapid tumor growth rate, as many childhood melanomas are of nodular or spitzoid subtypes,” Dr. Hawryluk and her coauthors wrote.
Study details
The investigators sought to characterize the clinical and histopathologic features of fatal pediatric melanomas.
They found that 21 of the 38 patients (57%) were of White heritage, 7 (19%) were of Hispanic or Latino background, 1 (3%) was of Asian lineage, and 1 each were of Black African American or Black Hispanic background. The remaining children were classified as “other” or did not have their ethnic backgrounds recorded.
The “striking prevalence” of Hispanic patients observed in the study is consistent with surveillance reports of an increasing incidence of melanoma among children of Hispanic background, they noted.
The mean age at diagnosis was 12.7 years, and the mean age at death was 15.6 years.
Of the 16 cases with known identifiable disease subtypes, 8 (50%) were nodular, 5 (31%) were superficial spreading, and 3 (19%) were spitzoid melanomas. Of the 38 fatal melanomas, 10 were thought to have originated from congenital melanocytic nevi.
Outlook improving
Recent therapeutic breakthroughs such as targeted agents and immunotherapy with checkpoint inhibitors augur well for children diagnosed with melanoma, Dr. Hawryluk said.
“Fortunately, it’s not superaggressive in children at high frequency, so we generally use adult algorithms to inform treatment decisions,” she said. “It’s just important to note that melanomas that arise in congenital nevi tend to have different driver mutations than those that arise in older patients who may have lots of sun exposure.”
“Nowadays, we’re lucky to have a lot of extra tests and workups so that, if a patient does have metastatic or advance disease, they can have a better genetic profile that would guide our choice of medications,” she added.
The study was supported by a Pediatric Dermatology Research Alliance Study Support grant and Society for Pediatric Dermatology, Pediatric Dermatology Research Alliance Pilot award. Dr. Hawryluk is supported by the Dermatology Foundation and the Harvard Medical School Eleanor and Miles Shore Fellowship award. The authors reported no conflicts of interest.
SOURCE: Hawryluk EB et al. J Am Acad Dermatol. 2020 Jul 1. doi: 10.1016/j.jaad.2020.06.1010.
FROM JAAD
Colorism can lead to intrafamily conflict
The color hue of a person’s skin is the most obvious criteria for society to judge a person and has always been deeply rooted in racism. Discrimination based on skin color is called colorism and is usually meted out by members of the same race and in the same family. The general belief is that someone with a lighter complexion is more beautiful, intelligent, or valuable than someone with a darker complexion. The term colorism can be widely applied in our assessment of conflict within families and society. The following case example gives guidance for psychiatrists faced with a family where colorism fuels family conflict.
Meeting the family
The Jaspers, a Black family, arrive at the psychiatrist’s office. They come in and look around before they choose their seats. Dr. Sally watches who sits next to whom and how they organize themselves in the office. After brief introductions, Mr. Jaspers begins, explaining why they are there.
“We are always fighting. We need this to stop. She, my wife, contradicts me all the time. Our kids are getting frustrated, and Bruce is acting out in school. He got in a fight again last week.”
Everyone looks at Bruce. He is darker skinned than the other siblings and carries all the African features in a family that favors the lighter end of the color spectrum. He sits next to his mother who leans into him. Mrs. Jaspers speaks next.
“Bruce gets picked on in school.”
Mr. Jaspers responds, “Well, if you didn’t run in there all the time and take him out, maybe he would learn how to deal with it better!”
“But they are mistreating him,” Mrs. Jaspers says.
The other children look away and play with their phones. Dr. Sally wonders whether this is a pattern: The parents fighting about how to deal with Bruce and his difficulties in the world – and the other siblings getting ignored and not included.
Dr. Sally asks Mrs. Jaspers for more details. She tells a narrative that is a strong thread in this family’s story.
“As you can see, Bruce is darker than the rest of our children. When we see the rest of our family, they all comment on what good skin and light coloring and good hair the other children have. Bruce just sits there. He is always being left out. He doesn’t speak up for himself. Maybe they think he can’t hear them, but I know he does and it affects him. They say the others are more intelligent, but I don’t think that is true. Bruce just gets picked on in school and he doesn’t feel like he matters. He doesn’t say anything, so maybe people think he doesn’t care, but I know he does.”
Dr. Sally turns to Bruce, who is still sitting silently next to his mother, his head down.
“Bruce, what do you have to say?”
Bruce shrugs his shoulders. His siblings still do not want to be drawn in and are otherwise occupied.
At this point, Dr. Sally might be thinking that she could see Bruce alone to assess his depression/self-esteem and maybe find ways to try to build him up. She does not want this to be an opportunity wasted. The goal is to work with the family to get Bruce where he needs to be faster and help the whole family.
Dr. Sally presses on. “Mr. Jaspers, what is your opinion?”
“She babies him. She treats him differently from the other kids. She is driving a wedge between him and his siblings. We fight about it all the time. She is driving a wedge between us, too.”
Mrs. Jaspers jumps in: “But you don’t know what it is like! When I was the only Black person in math class, I got picked on all the time! It made me self-conscious, and I couldn’t do my work. “
The other siblings look up briefly then back down at their devices. Dr. Sally asks them as a group:
“Can I ask you a question as a family? Can I ask the children a question?” They look up again. “Is this what goes on at home?” They all nod but offer no details.
Dr. Sally asks the oldest: “How does this affect your relationship with Bruce?”
They all look back and forth at each other. There is another long silence.
“See!” says Mr. Jaspers! “You can't protect him forever, and you are just ostracizing him from the rest of us! “
“But, but, he, he needs to learn different things. He is different. He faces different struggles. The police will stop him more. I am afraid for him.” Mrs. Jaspers starts to cry.
“You can’t protect him forever,” says her husband, gently reaching over to her.
Bruce has psychologically disappeared from the room, hiding behind his mother, who is now the largest and neediest presence in the room. Mr. Jaspers looks at Dr. Sally helplessly.
Dr. Sally asks the important question to the whole family.
“How do you all think this should work? If you don’t think Mrs. Jaspers is right, what do you think should be the way forward?”
This question is the turning point and indicates that Dr. Sally sees that the solution lies in how the family wants to manage things.
“I believe that your whole family has the answers, that you all have thought through this situation much more deeply and for much longer than I have. I am just hearing about it, and I am White and don’t have this experience. I have faith in your family, that with an opportunity to openly discuss this issue, that this knot can be unraveled. It does not mean that there are not more knots to unravel. For today, how to help you all help Bruce, is the work."
Dr. Sally talks to everyone but finishes up by looking at Mr. Jaspers, who has indicated that Bruce is part of the family and should not be treated differently from the other children.
Sean, the oldest sibling, now pipes up: “Bruce gets everything he wants. Mum spoils him; she always takes his side if there are arguments. Bruce knows this, and he steals our stuff because he knows he will get away with it.”
Bruce is quiet and leans in more to his mother. Dr. Sally motions to the mother not to speak.
“Is this true, Bruce?” Silence speaks that the answer is yes. The disparities in the family are aired for a while longer.
“Mrs. Jaspers, it is now your turn to respond.”
“Bruce is darker and faces more challenges than the others; he needs more protection and to know that he is loved.”
“Your family seems to think otherwise. They seem to think that your protection, while admirable, needs to be tempered to allow him to grow into a man who can stand on his own feet.”
Dr. Sally guides the family as a whole to a place where they can agree on the problem. The problem is now framed as a mother who cares too much and is too protective of Bruce but now her love and care need to be tempered. As a mother, she feels that it is her duty to protect her most vulnerable son. The family knows that Bruce will face more social scrutiny than the others, that he will have more internal struggles with self-worth than the others. How can the family help?
This conceptualization causes the family to look searchingly at one another. It is nothing they haven’t thought about privately, but this is the first time they are together thinking about it.
Dr. Sally says that she can help by providing time and space for them to wok through this together. They all agree to come back the following week with some thoughts about moving forward.
Offering perspective on colorism
In her book “Facing the Black Shadow,” couples and family therapist Marlene F. Watson, PhD, discusses colorism.
“African Americans still have a tough time talking about slavery – the origin of colorism. Seriously, what can we really expect to change without acknowledging and challenging the psychological residuals of slavery in our families and communities? What doesn’t get resolved in one generation is passed on to the next so our issues from slavery go from one generation to the next.”
Dr. Watson continues: “Confronting the secret about skin color in our families and communities is necessary for all Black girls to feel lovable, worthy, and deserving of care and for all Black boys to feel their value lies within them, not a dark, light, bright, near-white or White woman. African Americans need to get that preferring light over dark or dark over light is problematic for all of us. Skin color preferences in the African American community follow society’s racial hierarchy. African Americans as a group are at the bottom in the larger society and dark-skinned African Americans are at the bottom in the Black community.”
and patterns about skin color. Her advice is to ask each family member, from oldest to youngest, to identify the spoken and unspoken skin color beliefs he or she experiences in the family. Ask about skin color beliefs from outside that affect family members, and what each person thinks the family could do to stop promoting the “less than/better than” mentality that is often present with skin color assignment.
Thank you to Lynette Ramsingh Barros, who collaborated on creating the case.
Dr. Heru is professor of psychiatry at the University of Colorado Denver, Aurora. She is editor of “Working With Families in Medical Settings: A Multidisciplinary Guide for Psychiatrists and Other Health Professionals” (New York: Routledge, 2013). She has no conflicts of interest.