User login
Evaluation of Clerkship Structure
The third‐year pediatric clerkship at the University of Utah School of Medicine has a relatively unique inpatient service, the Glasgow Service, which consists of an academic attending, a third‐year pediatric resident, and 4 third‐year medical students, but no interns. (This service was named in honor of Lowell Glasgow, chair of pediatrics, 1972‐82.) This structure was introduced in 1992 by the chair of pediatrics, Michael Simmons, the residency program director, Richard Molteni, and the clerkship director, Karen Hansen. These individuals desired to improve students' inpatient experience by providing greater responsibility for patient care. An additional motive was to increase the total number of patients followed by house staff without increasing the size of the residency program.
This inpatient service is a part of a 6‐week pediatric clerkship. All students perform the 3‐week inpatient portion of their clerkship at Primary Children's Medical Center, a tertiary‐care, freestanding children's hospital. (The students also spend 1 week each in a newborn nursery, an outpatient clinic, and a subspecialty setting). The academic attendings include generalists, hospitalists, and specialists who concurrently have other clinical responsibilities. The students take in‐house call every fourth night, supervised by senior residents who are not necessarily members of their service. All students share the same formal teaching activities, including morning report, a noon conference, and a student conference.
Patients are assigned to the ward services by a senior admitting resident. The admitting resident distributes patients among the services based on the complexity and acuity of the patients' conditions as well as the census on the various services. The senior resident supervising a particular service then assigns patients among the members of that service. Each third‐year medical student is expected to care for 2 or 3 patients at a time.
In addition to the intervention service, students also rotate on 2 similar traditional services. These services are traditional in the sense that they are composed of an academic attending, a community attending, a third‐year pediatric resident, 4 interns, and up to 2 fourth‐year and 2 third‐year medical students. Faculty preferences regarding service assignments were accommodated when possible. Therefore, some faculty attended only on one type of service, intervention or traditional, and others attended on both types. Because they have more members and because interns are capable of caring for more patients than are medical students, the traditional services cared for more patients than the intervention service. Although identical in composition, the 2 traditional services differ with each other in several ways. One service typically admits children 3 years old and younger, whereas the other admits children who are between 3 and 12 years old. The service that admits older children also admits most of the hematology‐oncology patients.
Although other authors have described similar inpatient clerkship structures, to our knowledge, none have evaluated them through a prospective randomized controlled trial.1, 2 The recent literature on ambulatory experiences during third‐year clerkships provided a methodological framework for this study. Collectively, such studies have evaluated outcomes with a variety of measures, including patient logs,35 evaluations,3, 4, 6, 7 examinations,37 surveys,3, 5, 7, 8 and career choices.4, 68 Additional outcomes, such as the effect of educational interventions on patient care, have been emphasized.9
In the light of this research, we conducted a prospective, randomized controlled trial to compare outcomes on the intervention service with those on the traditional services. We hypothesized that, compared with the traditional services, the intervention service would show:
improved process measures in terms of increased number of patients admitted, number of key diagnoses encountered in the patients cared for, and range of ages of the patients admitted;
similar or improved student performance, as measured by faculty and resident evaluations and a National Board of Medical Examiners (NBME) subject examination;
increased student satisfaction, as assessed by an end‐of‐rotation questionnaire;
increased interest in pediatric and, more broadly, primary care careers, as measured by subinternship and internship selections; and
comparable or improved resource utilization in terms of length of stay and total charges.
METHODS
All students enrolled in the third‐year pediatric rotation during the 2001‐2003 academic years were individually randomized by the clerkship assistant to the intervention service or 1 of the 2 traditional services without respect to career preference. A 5:3 student randomization ratio was used to fulfill the requirement that 4 students be assigned to the intervention service during every 3‐week block. This permitted the service to have call every fourth night.
To evaluate the adequacy of the randomization process, we obtained baseline student characteristics on age, sex, and United States Medical Licensing Examination (USMLE) Step 1 score from the Dean of Student Affairs. The dean also reported the discipline each student enrolled in for the required fourth‐year subinternship(s) and matched in for internship. These data were reported anonymously and linked to the service to which the student was assigned. In this study, pediatrics, internal medicine, and family practice were all considered primary care, but preliminary or transitional internships were not.
Process Measures
Students were required to submit logs at the end of their rotations, recording patients' names, ages, diagnoses, and admission dates. The accuracy and completeness of these logs were not independently verified.
As there was no authoritative list of key diagnoses third‐year medical students should encounter in the patients they care for during their inpatient rotations, we relied on expert opinion at our institution. The Council on Medical Student Education in Pediatrics' curriculum was not used because it did not differentiate between inpatient and ambulatory contexts. A preliminary list of 93 diagnoses was developed from the table of contents of Pediatric Hospital Medicine.10 This list was distributed to the 26 clinical faculty members in the Divisions of Pediatric Inpatient Medicine and General Pediatrics who were asked to select the 10 most important diagnoses. Surveys were numerically coded to permit 1 reminder.
The survey had a response rate of 92.3% (24 of 26 surveys). One survey was excluded because the respondent significantly deviated from the instructions. The 10 key diagnoses and the percentages of respondents who selected each individual diagnosis are: asthma (100%), febrile infant (95.6%), diarrhea and dehydration (91.3%), bronchiolitis (78.2%), diabetes mellitus and diabetic ketoacidemia (60.9%), failure to thrive (56.5%), urinary tract infections (52.1%), pneumonia (47.8%), upper airway infections such as croup (43.5%), and seizures and status epilepticus (43.5%).
Two of the authors independently coded the diagnoses on the students' patient logs in terms of these 93 diagnoses. The authors were blinded to the students' service assignment. As many students reported more than 1 diagnosis, the authors prioritized primary, secondary, and tertiary diagnoses to simplify the evaluation. The most likely cause of admission was listed as the primary diagnosis. If the authors could not reconcile divergent views, a third party was consulted.
Student Performance
Students were evaluated by both the attending physician(s) and senior resident(s) using a standardized evaluation form available from the corresponding author. The evaluation contained 18 items in 7 categories: data gathering, data recording/reporting, knowledge, data interpretation, clinical performance, professional attitudes, and professional demeanor. The student was rated exceptional, above expectations, meets expectations, below expectations, unacceptable, or not observed on each item. A short narrative description illustrated each rating. The ratings were converted to a 5‐point scale, with exceptional being 5. If the evaluator marked the line between 2 ratings, it was recorded as half. When multiple attendings or residents evaluated a student, the scores for a given item were collapsed into an average score.
Students also completed a NBME pediatric subject examination on the last day of their rotation.
Additionally, students were requested to complete a questionnaire during the final week of the clerkship. The items on the questionnaire were meant to access students' perceptions of the quality of their attendings' and residents' teaching, a potentially confounding variable. The survey was piloted on a group of similar subjects. Informed consent was obtained for survey completion. The survey was anonymous and required approximately 7 minutes to complete.
Resource Utilization
Last, resource utilization data, length of stay and total charges, for the 4 most common primary diagnoses were compared between the intervention and the traditional services. The 4 most common primary diagnoses and the percentage of total diagnoses (n = 2047) that each represents were bronchiolitis, 13%; febrile infant, 8.6%; pneumonia, 7.1%; and asthma, 6.5% (the diagnosis other accounted for 12% of the total diagnoses). Unique patient identifiers were used to obtain length of stay and total charges from the hospital's database. All‐Patient‐Refined Diagnosis‐Related Groups Severity of Illness (APR‐DRG‐SOI) were also obtained and used to construct multivariate models. Patients who were admitted to the pediatric intensive care unit (PICU) were excluded from the analysis.
Statistical Analysis
Statistical analyses were conducted and frequencies and percentages were calculated using Stata SE version 8.0 (College Station, TX). For all interval and ratio‐scaled variables, distributions were tested for normality using the Shapiro‐Wilks test to determine whether to use parametric or nonparametric statistical tests. For distributions meeting the normality assumption, the unpaired t test was used to compare the intervention service with traditional services. Where the normality assumption was not met, the Mann‐Whitney test was used. Categorically scaled data were compared using Pearson's chi‐square test. The standardized mean differences, reported as d values, were calculated to determine the effect size. Small, medium, and large effect sizes were defined as d values of 0.20, 0.50, and 0.80, respectively.11 Teaching quality, an effect modifier, was entered as a covariate into a linear regression model. Analyses of length of stay and total charges were conducted using multivariate linear regression controlling for patient age and severity of illness.
This study was approved by the University of Utah and Primary Children's Medical Center's Institutional Review Board.
RESULTS
Two hundred and three students enrolled in the third‐year pediatric clerkship during the study period, and all students completed the clerkship on their assigned services. One hundred and twenty‐eight were randomized to the intervention service and 75 to the traditional services. There were no statistically significant differences in median age, percentage of male students, or mean USMLE Step 1 score between the students randomized to the intervention service and those randomized to the traditional services (Table 1).
| Intervention service | Traditional services | P value | |
|---|---|---|---|
| |||
| Age (median) | 28 | 28 | .76* |
| Sex (% male) | 58.6 | 62.7 | .57 |
| USMLE Step 1 score | 217 | 217 | .94 |
Process Measures
Overall, 96.6% of students (196 of 203) submitted patient logs; 97.7% of students (125 of 128) on the intervention service and 94.7% of students (71 of 75) on the traditional services. The students on the intervention service admitted a median of 10 patients, whereas the students on the traditional services admitted a median of 11 patients (d = 0.45, P < .01). Age data were recorded on 137 patient logs (69.9% of submitted logs, 72.0% of students on the intervention service vs. 66.2% of students on the traditional services). The percentage of students who saw at least 1 newborn (birth‐23 months), child (2‐12 years), and adolescent (12‐18 years) was 34.8% on the intervention service and 33.3% on the traditional services (P = .87) (Table 2).
| Intervention service | Traditional services | d | P value | |
|---|---|---|---|---|
| ||||
| Median number of patients | 10 | 11 | 0.45 | < .01* |
| Percent of students who saw 1 newborn, child, and adolescent | 34.8% | 33.3% | 0.03 | .87 |
| Top 10 diagnoses cared for (n) | 4.4 | 3.6 | 0.48 | < .01 |
| Percent of patients cared for whose diagnoses were in top 10 | 59.3% | 46.8% | 0.62# | < .01 |
| Percent of unique diagnoses (median) | 80.0% | 80.0% | 0.02 | .62 |
Students on the intervention service encountered, on average, a larger number of the 10 key diagnoses (4.4 vs. 3.6, d = 0.48, P < .01) and a higher percentage of their patients had clinical conditions among the key diagnoses (59.3 vs. 46.8, d = 0.62, P < .01). To determine if this higher percentage was the result of admitting multiple patients with the same diagnosis, we examined the percentage of unique primary diagnosesthe number of different primary diagnoses divided by the total number of patientsand found no differences (Table 2).
Student Performance
The faculty and resident evaluations of the students showed statistically significant differences between those in the intervention service and those in the traditional services in only 2 of the 18 items. These items were analysis in the data interpretation category (3.81 vs. 3.64, d = 0.35, P = .02) and patient interaction in the professional demeanor category (3.89 vs. 3.76, d = 0.31, P < .05). Both differences favored the intervention service. There were no statistical differences by service in student performance on the NBME subject examination (73.2 vs. 72.3, P = .39).
Student Satisfaction
Overall, 87.2% of students (177 of 203) completed the survey; 87.5% of students (112 of 124) on the intervention service and 86.7% of students (65 of 75) on the traditional services. The students on the intervention service both had a more positive overall attitude about their rotation and were more likely to find it a satisfying educational experience. Students on the intervention service also reported greater participation in patient care. Effect sizes ranged from small to medium (Table 3). The internal consistency of answers about participation in patient care was high (Pearson correlation coefficient r = 0.80).
| Intervention service | Traditional services | d | P value | |
|---|---|---|---|---|
| ||||
| My overall attitude toward this rotation is: 1. highly negative to 5. highly positive | 4.48 | 4.26 | 0.26 | .02* |
| I found this rotation a satisfying educational experience: 1. strongly disagree to 5. strongly agree | 4.49 | 4.22 | 0.35 | < .01* |
| My role on this rotation was that of an: 1. observer, 3. participant, 5. director | 3.77 | 3.33 | 0.60# | < .01 |
| My supervising interns/residents were _____ teachers: 1. poor, 3. good, 5. exemplary | 3.91 | 3.75 | 0.17 | .26* |
| My input into patient care decisions was: 1. strongly discouraged to 5. strongly encouraged | 4.45 | 3.98 | 0.66# | < .01* |
| I was able to make a significant contribution to patient care: 1. strongly disagree to 5. strongly agree | 4.19 | 3.92 | 0.34 | .02* |
| I had direct responsibility for patient care: 1. strongly disagree to 5. strongly agree | 4.33 | 3.95 | 0.46 | .01* |
| My attendings were _____ teachers: 1. poor, 3. good, 5. exemplary | 4.09 | 3.75 | 0.40 | < .01* |
| I found the feedback I received during this rotation to be: 1. insufficient, 3. appropriate, 5. excessive | 2.84 | 2.65 | 0.22 | .17* |
| The following best describes the quality of my supervision during this rotation: 1. I was expected to do things beyond my competence unsupervised 3. The degree of supervision was appropriate for my level of training 5. I was excessively supervised on skills I had already demonstrated | 2.95 | 3.06 | 0.18 | .19 |
| During this rotation: 1. I was expected to see too many patients 3. I was expected to see an appropriate number of patients 5. I expected to see more patients | 3.46 | 3.31 | 0.18 | .33* |
| Before this rotation I _____ pediatrics as a career choice: 1. had rejected, 3. was considering, 5. had decided on | 2.37 | 2.14 | 0.22 | .11* |
| This rotation increased my interest in pursuing pediatrics as a career: 1. strongly disagree to 5. strongly agree | 3.74 | 3.60 | 0.14 | .32* |
Students on the intervention service rated the teaching of their attendings, but not of their residents, higher than did students on the traditional services. Controlling for the perceived quality of the attending, 3 of 6 satisfaction outcomes remained statistically significant: role on rotation (P < .01), input into patient care decisions (P < .01), and direct responsibility for patient care (P = .04). Students on both services believed they were appropriately supervised (P = .19). Despite the students on the traditional services on average admitting more patients, there was no significant difference by service in the students' rating of patient load (P = .33).
Career Choice
The odds ratio and 95% confidence interval for students enrolling in a pediatric subinternship was 1.94 (0.83‐4.49) and matching in a pediatric residency was 2.52 (0.99‐6.37). There were no statistically significant differences by service in the percentage of students enrolling in primary care (pediatric, internal medicine, and family practice) subinternships or residencies (Table 4).
| Intervention service | Traditional services | Odds ratio (95% CI) | |
|---|---|---|---|
| Pediatric subinternship | 19.5% | 11.1% | 1.94 (0.83‐4.49) |
| Primary care subinternship | 68.3% | 70.8% | 0.89 (0.47‐1.67) |
| Pediatric residency | 18.6% | 8.3% | 2.52 (0.99‐6.37) |
| Primary care residency | 40.7% | 31.9% | 1.46 (0.79‐2.70) |
Resource Utilization
One hundred and thirty‐five patients were excluded from the resource utilization analysis (n = 594) because their unique identifiers could not be found or they had been admitted to the PICU. Univariate analysis demonstrated statistically significant differences for patients with asthma, but not patients with bronchiolitis, febrile infants, or patients with pneumonia, favoring the intervention service. Patients with asthma admitted to the intervention service had a shorter length of stay (49.9 vs. 70.1 hours, P = .02) and lower total charges ($3600 vs. $4600, P = .02), as shown in Table 5. Of 4 multivariate models controlling for age and severity of illness, each with length of stay and total charges as the dependant variables, length of stay was significantly less for patients with asthma admitted to the intervention service only. Such patients were discharged an average of 23.3 hours earlier than patients with asthma admitted to the traditional services (P = .02).
| Diagnosis (n) | n | Length of stay (hours) | P value | Total charges | ||||
|---|---|---|---|---|---|---|---|---|
| Intervention service | Traditional services | Intervention service | Traditional services | Intervention service | Traditional services | P value | ||
| ||||||||
| Bronchiolitis (210) | 159 | 51 | 63.7 | 70.5 | .20* | $4300 | $4800 | .20* |
| Febrile infant (152) | 105 | 47 | 58.8 | 58.9 | .50* | $4800 | $4900 | .28* |
| Pneumonia (123) | 82 | 41 | 84.3 | 116.8 | .71* | $6300 | $9200 | .63* |
| Asthma (109) | 80 | 29 | 49.9 | 70.1 | .02* | $3600 | $4600 | .02* |
DISCUSSION
This study's objective was to evaluate a third‐year pediatric clerkship structure that focuses on students, using multiple outcome parameters. Utilizing a robust design, the results of this study have demonstrated that the intervention service is more successful than the traditional services in several outcomes. Students assigned to the intervention service were more satisfied and more likely to select pediatrics as a career. These improvements were accomplished while maintaining similar process measures, student performance, and resource utilization compared with those of the traditional services.
Methods
The methods used in this study compare favorably with other evaluations of educational interventions. The present study incorporated a randomized controlled design.12 Although several studies of ambulatory clerkships used a randomized design, few randomized all eligible students.7, 8 The others used some form of selection prior to randomization. For example, in the Pangaro et al. study, students selected their clerkship site by lottery, with students selecting a certain site then offered the opportunity to participate in the intervention.6 The present study manifested several additional strengths. Multiple outcomes, including effects on patient care, were evaluated. Moreover, this study had a relatively large intervention group and total sample size compared with those in other medical education studies. Finally, because the intervention service had been in place for several years prior to its evaluation, the confounding influence of difficulties working out its implementation was minimized.
Results
Few studies of ambulatory experiences demonstrated statistically significant, let alone clinically significant, results. Most studies showed no statistically significant differences in student evaluations or examination scores. An exception is Grum et al., who showed improvements on 3 of 5 examinations.4 A few studies have found improved student satisfaction.3 None of the randomized controlled trials demonstrate increases in students matching in internal medicine or primary care residencies.4, 68 In contrast, this study produced statistically or programmatically significant results in process measures, evaluations, satisfaction, and career choices.
Several of our specific findings deserve additional comment. Although the admitting residents were instructed to assign patients to the intervention service based on their acuity and complexity, it is important to examine these residents' actual behavior. Several of our hypotheses were not validated. The students on the intervention service admitted fewer patients and were no more likely to see at least 1 patient in each age category. The admitting resident may have limited the number of patients admitted to the intervention service based on the workload of the supervising resident not that of the student. The supervising resident on the intervention service must round on all the patients, whereas the oversight of patients seen by students on the traditional services is shared with the interns. Having the attending on the intervention service share this supervising responsibility might improve this outcome.
Students on the intervention service had more positive attitudes toward the rotation. In addition, potentially negative attitudes were not manifest. For example, it might be argued that third‐year medical students are not prepared to bear this increased responsibility. However, there was not a significant difference in students' perception of the quality of supervision or the workload.
Although the goal of medical education is the production of competent physicians, it is important that the process not place undo burdens on patients and the health care system. Univariate analysis showed similar resource utilization. It might be contended that the admitting resident assigned the intervention service patients who were less acutely ill. Therefore, we performed multivariate analysis using APR‐DRG‐SOI to control for severity of illness. Of 8 comparisons, the only statistically significant difference, length of stay of patients with asthma, favored the intervention service.
Limitations
Although this study had numerous strengths, it also had several limitations. The primary limitations were lack of generalizability, difficulty in obtaining authentic assessments, the potential difference between statistical and educational significance, and inability to identify which components of the intervention service were responsible for the outcomes. This study's findings may not be generalizable to other institutions. For example, institutions without age or organ systembased teams may not observe increases in the number of key diagnoses encountered in the patients cared for. Regarding the assessments, there may be better measures of clinical competence, such as an objective structured clinical examination (OSCE),13 than those used in this study. However, there were not sufficient resources to implement an OSCE at the end of the rotation.
Some might question whether the statistically significant differences have educational significance. Although that is an important concern, this study should be compared with other educational interventions that found few statistically significant, let alone educationally significant, differences. To address this concern, we calculated effect sizes. The differences in student satisfaction were small to moderate. Although the lower limit of the 95% confidence interval of the odds ratio for matching in a pediatric residency was 0.99, the magnitude was programmatically important.
Finally, this study was an evaluation of an existing program. The authors were unable to control some potential confounders including patient allocation, average daily census, and quality of teaching. For example, Griffith and colleagues have shown that working with the best teachers improves student performance.14 We were not able to randomly assign the faculty among the services, and unequal distribution of better teachers could have biased this study's outcomes. The students on the intervention service rated their attendings, but not their residents, higher than did the students on the other services. However, the linear regression model showed that the perceived quality of the attending did not account for all the differences in student satisfaction. It was not possible to control for this factor in comparing student performance or subinternship or residency selection because the survey, which included the faculty evaluations, was anonymous and therefore could not be linked to the other data sets.
The perceived differences in the quality of teaching may not have been the result of differences in the attendings but instead of differences in the structure of the services. Accessibility is one of the characteristics of excellent clinical teachers.15 The intervention structure may permit faculty to spend more time with students, and this may increase the perceived quality of the teaching. However, it is not possible to resolve this issue with the available data.
CONCLUSIONS
The intervention service is a structure for the pediatric inpatient rotation of third‐year medical students that, instead of dividing the faculty and supervising resident's attention between interns and students, focuses their attention on the students. Although it has been difficult to demonstrate improvements as a result of the educational interventions, we have shown several improvements in the evaluations of the students. Moreover, the pattern of increased student satisfaction and a tendency toward more student selecting careers in pediatrics are remarkable. This was accomplished with similar resource utilization. Therefore, this program merits being continued at our institution and possibly adopted at other medical schools. Further research is needed to determine which aspects of the intervention are responsible for its effects. Some components, such as focused time with students, may be applicable to traditional services.
Acknowledgements
The authors thank Ronald Bloom for encouraging us to conduct this study; Kathy Bailey, Alice Dowling, and Margie Thompson for their assistance in the data collection; and Elizabeth Allen, Ronald Bloom, Flory Nkoy, Louis Pangaro, Stephanie Richardson, and Rajendu Srivastava for manuscript review.
- ,,.The role of the student ward in the medical clerkships.J Med Educ.1985;60:524–529.
- .Changing the fourth‐year medicine clerkship structure: A successful model for a teaching service without housestaff.J Gen Intern Med.1993;8:31–32.
- ,.A randomized, controlled pilot study of placing third‐year medical clerks in a continuity clinic.Acad Med.1993;68:845–847.
- ,,.Consequences of shifting medical‐student education to the outpatient setting: effects on performance and experiences.Acad Med.1996;71(suppl 1):S99–S101.
- ,.Learning outcomes of an ambulatory care rotation in internal medicine for junior medical students.J Gen Intern Med.1993;8:189–192.
- ,,,,.A prospective, randomized trial of a six‐week ambulatory medicine rotation.Acad Med.1995;70:537–541.
- ,,,,.Ambulatory versus inpatient rotations in teaching third‐year students internal medicine.J Gen Intern Med.1998;13:327–330.
- ,,,,.The effect of an ambulatory internal medicine rotation on students' career choices.Acad Med.1997;72:147–149.
- .Theme issue on medical education: Call for papers.JAMA.2005;293:742.
- Perkin RM,Swift JD,Newton DA, eds.Pediatric Hospital Medicine: Textbook of Inpatient Management.Philadelphia:Lippincott Williams 2003.
- .Call for greater emphasis on effect‐size measures in published articles in Teaching and Learning in Medicine.Teach Learn Med.2002;14:206–210.
- .Educational research and randomised trials.Med Educ.2002;36:1002–1003.
- ,.The objective structured clinical examination.Arch Pediatr Adolesc Med.2000;154:736–741.
- ,,,.Relationship of how well attending physicians teach to their student's performances and residency choices.Acad Med.1997;72(suppl 1):S118–S120.
- ,.Assessing quality and costs of education in the ambulatory setting: A review of the literature.Acad Med.2002;77:621–680.
The third‐year pediatric clerkship at the University of Utah School of Medicine has a relatively unique inpatient service, the Glasgow Service, which consists of an academic attending, a third‐year pediatric resident, and 4 third‐year medical students, but no interns. (This service was named in honor of Lowell Glasgow, chair of pediatrics, 1972‐82.) This structure was introduced in 1992 by the chair of pediatrics, Michael Simmons, the residency program director, Richard Molteni, and the clerkship director, Karen Hansen. These individuals desired to improve students' inpatient experience by providing greater responsibility for patient care. An additional motive was to increase the total number of patients followed by house staff without increasing the size of the residency program.
This inpatient service is a part of a 6‐week pediatric clerkship. All students perform the 3‐week inpatient portion of their clerkship at Primary Children's Medical Center, a tertiary‐care, freestanding children's hospital. (The students also spend 1 week each in a newborn nursery, an outpatient clinic, and a subspecialty setting). The academic attendings include generalists, hospitalists, and specialists who concurrently have other clinical responsibilities. The students take in‐house call every fourth night, supervised by senior residents who are not necessarily members of their service. All students share the same formal teaching activities, including morning report, a noon conference, and a student conference.
Patients are assigned to the ward services by a senior admitting resident. The admitting resident distributes patients among the services based on the complexity and acuity of the patients' conditions as well as the census on the various services. The senior resident supervising a particular service then assigns patients among the members of that service. Each third‐year medical student is expected to care for 2 or 3 patients at a time.
In addition to the intervention service, students also rotate on 2 similar traditional services. These services are traditional in the sense that they are composed of an academic attending, a community attending, a third‐year pediatric resident, 4 interns, and up to 2 fourth‐year and 2 third‐year medical students. Faculty preferences regarding service assignments were accommodated when possible. Therefore, some faculty attended only on one type of service, intervention or traditional, and others attended on both types. Because they have more members and because interns are capable of caring for more patients than are medical students, the traditional services cared for more patients than the intervention service. Although identical in composition, the 2 traditional services differ with each other in several ways. One service typically admits children 3 years old and younger, whereas the other admits children who are between 3 and 12 years old. The service that admits older children also admits most of the hematology‐oncology patients.
Although other authors have described similar inpatient clerkship structures, to our knowledge, none have evaluated them through a prospective randomized controlled trial.1, 2 The recent literature on ambulatory experiences during third‐year clerkships provided a methodological framework for this study. Collectively, such studies have evaluated outcomes with a variety of measures, including patient logs,35 evaluations,3, 4, 6, 7 examinations,37 surveys,3, 5, 7, 8 and career choices.4, 68 Additional outcomes, such as the effect of educational interventions on patient care, have been emphasized.9
In the light of this research, we conducted a prospective, randomized controlled trial to compare outcomes on the intervention service with those on the traditional services. We hypothesized that, compared with the traditional services, the intervention service would show:
improved process measures in terms of increased number of patients admitted, number of key diagnoses encountered in the patients cared for, and range of ages of the patients admitted;
similar or improved student performance, as measured by faculty and resident evaluations and a National Board of Medical Examiners (NBME) subject examination;
increased student satisfaction, as assessed by an end‐of‐rotation questionnaire;
increased interest in pediatric and, more broadly, primary care careers, as measured by subinternship and internship selections; and
comparable or improved resource utilization in terms of length of stay and total charges.
METHODS
All students enrolled in the third‐year pediatric rotation during the 2001‐2003 academic years were individually randomized by the clerkship assistant to the intervention service or 1 of the 2 traditional services without respect to career preference. A 5:3 student randomization ratio was used to fulfill the requirement that 4 students be assigned to the intervention service during every 3‐week block. This permitted the service to have call every fourth night.
To evaluate the adequacy of the randomization process, we obtained baseline student characteristics on age, sex, and United States Medical Licensing Examination (USMLE) Step 1 score from the Dean of Student Affairs. The dean also reported the discipline each student enrolled in for the required fourth‐year subinternship(s) and matched in for internship. These data were reported anonymously and linked to the service to which the student was assigned. In this study, pediatrics, internal medicine, and family practice were all considered primary care, but preliminary or transitional internships were not.
Process Measures
Students were required to submit logs at the end of their rotations, recording patients' names, ages, diagnoses, and admission dates. The accuracy and completeness of these logs were not independently verified.
As there was no authoritative list of key diagnoses third‐year medical students should encounter in the patients they care for during their inpatient rotations, we relied on expert opinion at our institution. The Council on Medical Student Education in Pediatrics' curriculum was not used because it did not differentiate between inpatient and ambulatory contexts. A preliminary list of 93 diagnoses was developed from the table of contents of Pediatric Hospital Medicine.10 This list was distributed to the 26 clinical faculty members in the Divisions of Pediatric Inpatient Medicine and General Pediatrics who were asked to select the 10 most important diagnoses. Surveys were numerically coded to permit 1 reminder.
The survey had a response rate of 92.3% (24 of 26 surveys). One survey was excluded because the respondent significantly deviated from the instructions. The 10 key diagnoses and the percentages of respondents who selected each individual diagnosis are: asthma (100%), febrile infant (95.6%), diarrhea and dehydration (91.3%), bronchiolitis (78.2%), diabetes mellitus and diabetic ketoacidemia (60.9%), failure to thrive (56.5%), urinary tract infections (52.1%), pneumonia (47.8%), upper airway infections such as croup (43.5%), and seizures and status epilepticus (43.5%).
Two of the authors independently coded the diagnoses on the students' patient logs in terms of these 93 diagnoses. The authors were blinded to the students' service assignment. As many students reported more than 1 diagnosis, the authors prioritized primary, secondary, and tertiary diagnoses to simplify the evaluation. The most likely cause of admission was listed as the primary diagnosis. If the authors could not reconcile divergent views, a third party was consulted.
Student Performance
Students were evaluated by both the attending physician(s) and senior resident(s) using a standardized evaluation form available from the corresponding author. The evaluation contained 18 items in 7 categories: data gathering, data recording/reporting, knowledge, data interpretation, clinical performance, professional attitudes, and professional demeanor. The student was rated exceptional, above expectations, meets expectations, below expectations, unacceptable, or not observed on each item. A short narrative description illustrated each rating. The ratings were converted to a 5‐point scale, with exceptional being 5. If the evaluator marked the line between 2 ratings, it was recorded as half. When multiple attendings or residents evaluated a student, the scores for a given item were collapsed into an average score.
Students also completed a NBME pediatric subject examination on the last day of their rotation.
Additionally, students were requested to complete a questionnaire during the final week of the clerkship. The items on the questionnaire were meant to access students' perceptions of the quality of their attendings' and residents' teaching, a potentially confounding variable. The survey was piloted on a group of similar subjects. Informed consent was obtained for survey completion. The survey was anonymous and required approximately 7 minutes to complete.
Resource Utilization
Last, resource utilization data, length of stay and total charges, for the 4 most common primary diagnoses were compared between the intervention and the traditional services. The 4 most common primary diagnoses and the percentage of total diagnoses (n = 2047) that each represents were bronchiolitis, 13%; febrile infant, 8.6%; pneumonia, 7.1%; and asthma, 6.5% (the diagnosis other accounted for 12% of the total diagnoses). Unique patient identifiers were used to obtain length of stay and total charges from the hospital's database. All‐Patient‐Refined Diagnosis‐Related Groups Severity of Illness (APR‐DRG‐SOI) were also obtained and used to construct multivariate models. Patients who were admitted to the pediatric intensive care unit (PICU) were excluded from the analysis.
Statistical Analysis
Statistical analyses were conducted and frequencies and percentages were calculated using Stata SE version 8.0 (College Station, TX). For all interval and ratio‐scaled variables, distributions were tested for normality using the Shapiro‐Wilks test to determine whether to use parametric or nonparametric statistical tests. For distributions meeting the normality assumption, the unpaired t test was used to compare the intervention service with traditional services. Where the normality assumption was not met, the Mann‐Whitney test was used. Categorically scaled data were compared using Pearson's chi‐square test. The standardized mean differences, reported as d values, were calculated to determine the effect size. Small, medium, and large effect sizes were defined as d values of 0.20, 0.50, and 0.80, respectively.11 Teaching quality, an effect modifier, was entered as a covariate into a linear regression model. Analyses of length of stay and total charges were conducted using multivariate linear regression controlling for patient age and severity of illness.
This study was approved by the University of Utah and Primary Children's Medical Center's Institutional Review Board.
RESULTS
Two hundred and three students enrolled in the third‐year pediatric clerkship during the study period, and all students completed the clerkship on their assigned services. One hundred and twenty‐eight were randomized to the intervention service and 75 to the traditional services. There were no statistically significant differences in median age, percentage of male students, or mean USMLE Step 1 score between the students randomized to the intervention service and those randomized to the traditional services (Table 1).
| Intervention service | Traditional services | P value | |
|---|---|---|---|
| |||
| Age (median) | 28 | 28 | .76* |
| Sex (% male) | 58.6 | 62.7 | .57 |
| USMLE Step 1 score | 217 | 217 | .94 |
Process Measures
Overall, 96.6% of students (196 of 203) submitted patient logs; 97.7% of students (125 of 128) on the intervention service and 94.7% of students (71 of 75) on the traditional services. The students on the intervention service admitted a median of 10 patients, whereas the students on the traditional services admitted a median of 11 patients (d = 0.45, P < .01). Age data were recorded on 137 patient logs (69.9% of submitted logs, 72.0% of students on the intervention service vs. 66.2% of students on the traditional services). The percentage of students who saw at least 1 newborn (birth‐23 months), child (2‐12 years), and adolescent (12‐18 years) was 34.8% on the intervention service and 33.3% on the traditional services (P = .87) (Table 2).
| Intervention service | Traditional services | d | P value | |
|---|---|---|---|---|
| ||||
| Median number of patients | 10 | 11 | 0.45 | < .01* |
| Percent of students who saw 1 newborn, child, and adolescent | 34.8% | 33.3% | 0.03 | .87 |
| Top 10 diagnoses cared for (n) | 4.4 | 3.6 | 0.48 | < .01 |
| Percent of patients cared for whose diagnoses were in top 10 | 59.3% | 46.8% | 0.62# | < .01 |
| Percent of unique diagnoses (median) | 80.0% | 80.0% | 0.02 | .62 |
Students on the intervention service encountered, on average, a larger number of the 10 key diagnoses (4.4 vs. 3.6, d = 0.48, P < .01) and a higher percentage of their patients had clinical conditions among the key diagnoses (59.3 vs. 46.8, d = 0.62, P < .01). To determine if this higher percentage was the result of admitting multiple patients with the same diagnosis, we examined the percentage of unique primary diagnosesthe number of different primary diagnoses divided by the total number of patientsand found no differences (Table 2).
Student Performance
The faculty and resident evaluations of the students showed statistically significant differences between those in the intervention service and those in the traditional services in only 2 of the 18 items. These items were analysis in the data interpretation category (3.81 vs. 3.64, d = 0.35, P = .02) and patient interaction in the professional demeanor category (3.89 vs. 3.76, d = 0.31, P < .05). Both differences favored the intervention service. There were no statistical differences by service in student performance on the NBME subject examination (73.2 vs. 72.3, P = .39).
Student Satisfaction
Overall, 87.2% of students (177 of 203) completed the survey; 87.5% of students (112 of 124) on the intervention service and 86.7% of students (65 of 75) on the traditional services. The students on the intervention service both had a more positive overall attitude about their rotation and were more likely to find it a satisfying educational experience. Students on the intervention service also reported greater participation in patient care. Effect sizes ranged from small to medium (Table 3). The internal consistency of answers about participation in patient care was high (Pearson correlation coefficient r = 0.80).
| Intervention service | Traditional services | d | P value | |
|---|---|---|---|---|
| ||||
| My overall attitude toward this rotation is: 1. highly negative to 5. highly positive | 4.48 | 4.26 | 0.26 | .02* |
| I found this rotation a satisfying educational experience: 1. strongly disagree to 5. strongly agree | 4.49 | 4.22 | 0.35 | < .01* |
| My role on this rotation was that of an: 1. observer, 3. participant, 5. director | 3.77 | 3.33 | 0.60# | < .01 |
| My supervising interns/residents were _____ teachers: 1. poor, 3. good, 5. exemplary | 3.91 | 3.75 | 0.17 | .26* |
| My input into patient care decisions was: 1. strongly discouraged to 5. strongly encouraged | 4.45 | 3.98 | 0.66# | < .01* |
| I was able to make a significant contribution to patient care: 1. strongly disagree to 5. strongly agree | 4.19 | 3.92 | 0.34 | .02* |
| I had direct responsibility for patient care: 1. strongly disagree to 5. strongly agree | 4.33 | 3.95 | 0.46 | .01* |
| My attendings were _____ teachers: 1. poor, 3. good, 5. exemplary | 4.09 | 3.75 | 0.40 | < .01* |
| I found the feedback I received during this rotation to be: 1. insufficient, 3. appropriate, 5. excessive | 2.84 | 2.65 | 0.22 | .17* |
| The following best describes the quality of my supervision during this rotation: 1. I was expected to do things beyond my competence unsupervised 3. The degree of supervision was appropriate for my level of training 5. I was excessively supervised on skills I had already demonstrated | 2.95 | 3.06 | 0.18 | .19 |
| During this rotation: 1. I was expected to see too many patients 3. I was expected to see an appropriate number of patients 5. I expected to see more patients | 3.46 | 3.31 | 0.18 | .33* |
| Before this rotation I _____ pediatrics as a career choice: 1. had rejected, 3. was considering, 5. had decided on | 2.37 | 2.14 | 0.22 | .11* |
| This rotation increased my interest in pursuing pediatrics as a career: 1. strongly disagree to 5. strongly agree | 3.74 | 3.60 | 0.14 | .32* |
Students on the intervention service rated the teaching of their attendings, but not of their residents, higher than did students on the traditional services. Controlling for the perceived quality of the attending, 3 of 6 satisfaction outcomes remained statistically significant: role on rotation (P < .01), input into patient care decisions (P < .01), and direct responsibility for patient care (P = .04). Students on both services believed they were appropriately supervised (P = .19). Despite the students on the traditional services on average admitting more patients, there was no significant difference by service in the students' rating of patient load (P = .33).
Career Choice
The odds ratio and 95% confidence interval for students enrolling in a pediatric subinternship was 1.94 (0.83‐4.49) and matching in a pediatric residency was 2.52 (0.99‐6.37). There were no statistically significant differences by service in the percentage of students enrolling in primary care (pediatric, internal medicine, and family practice) subinternships or residencies (Table 4).
| Intervention service | Traditional services | Odds ratio (95% CI) | |
|---|---|---|---|
| Pediatric subinternship | 19.5% | 11.1% | 1.94 (0.83‐4.49) |
| Primary care subinternship | 68.3% | 70.8% | 0.89 (0.47‐1.67) |
| Pediatric residency | 18.6% | 8.3% | 2.52 (0.99‐6.37) |
| Primary care residency | 40.7% | 31.9% | 1.46 (0.79‐2.70) |
Resource Utilization
One hundred and thirty‐five patients were excluded from the resource utilization analysis (n = 594) because their unique identifiers could not be found or they had been admitted to the PICU. Univariate analysis demonstrated statistically significant differences for patients with asthma, but not patients with bronchiolitis, febrile infants, or patients with pneumonia, favoring the intervention service. Patients with asthma admitted to the intervention service had a shorter length of stay (49.9 vs. 70.1 hours, P = .02) and lower total charges ($3600 vs. $4600, P = .02), as shown in Table 5. Of 4 multivariate models controlling for age and severity of illness, each with length of stay and total charges as the dependant variables, length of stay was significantly less for patients with asthma admitted to the intervention service only. Such patients were discharged an average of 23.3 hours earlier than patients with asthma admitted to the traditional services (P = .02).
| Diagnosis (n) | n | Length of stay (hours) | P value | Total charges | ||||
|---|---|---|---|---|---|---|---|---|
| Intervention service | Traditional services | Intervention service | Traditional services | Intervention service | Traditional services | P value | ||
| ||||||||
| Bronchiolitis (210) | 159 | 51 | 63.7 | 70.5 | .20* | $4300 | $4800 | .20* |
| Febrile infant (152) | 105 | 47 | 58.8 | 58.9 | .50* | $4800 | $4900 | .28* |
| Pneumonia (123) | 82 | 41 | 84.3 | 116.8 | .71* | $6300 | $9200 | .63* |
| Asthma (109) | 80 | 29 | 49.9 | 70.1 | .02* | $3600 | $4600 | .02* |
DISCUSSION
This study's objective was to evaluate a third‐year pediatric clerkship structure that focuses on students, using multiple outcome parameters. Utilizing a robust design, the results of this study have demonstrated that the intervention service is more successful than the traditional services in several outcomes. Students assigned to the intervention service were more satisfied and more likely to select pediatrics as a career. These improvements were accomplished while maintaining similar process measures, student performance, and resource utilization compared with those of the traditional services.
Methods
The methods used in this study compare favorably with other evaluations of educational interventions. The present study incorporated a randomized controlled design.12 Although several studies of ambulatory clerkships used a randomized design, few randomized all eligible students.7, 8 The others used some form of selection prior to randomization. For example, in the Pangaro et al. study, students selected their clerkship site by lottery, with students selecting a certain site then offered the opportunity to participate in the intervention.6 The present study manifested several additional strengths. Multiple outcomes, including effects on patient care, were evaluated. Moreover, this study had a relatively large intervention group and total sample size compared with those in other medical education studies. Finally, because the intervention service had been in place for several years prior to its evaluation, the confounding influence of difficulties working out its implementation was minimized.
Results
Few studies of ambulatory experiences demonstrated statistically significant, let alone clinically significant, results. Most studies showed no statistically significant differences in student evaluations or examination scores. An exception is Grum et al., who showed improvements on 3 of 5 examinations.4 A few studies have found improved student satisfaction.3 None of the randomized controlled trials demonstrate increases in students matching in internal medicine or primary care residencies.4, 68 In contrast, this study produced statistically or programmatically significant results in process measures, evaluations, satisfaction, and career choices.
Several of our specific findings deserve additional comment. Although the admitting residents were instructed to assign patients to the intervention service based on their acuity and complexity, it is important to examine these residents' actual behavior. Several of our hypotheses were not validated. The students on the intervention service admitted fewer patients and were no more likely to see at least 1 patient in each age category. The admitting resident may have limited the number of patients admitted to the intervention service based on the workload of the supervising resident not that of the student. The supervising resident on the intervention service must round on all the patients, whereas the oversight of patients seen by students on the traditional services is shared with the interns. Having the attending on the intervention service share this supervising responsibility might improve this outcome.
Students on the intervention service had more positive attitudes toward the rotation. In addition, potentially negative attitudes were not manifest. For example, it might be argued that third‐year medical students are not prepared to bear this increased responsibility. However, there was not a significant difference in students' perception of the quality of supervision or the workload.
Although the goal of medical education is the production of competent physicians, it is important that the process not place undo burdens on patients and the health care system. Univariate analysis showed similar resource utilization. It might be contended that the admitting resident assigned the intervention service patients who were less acutely ill. Therefore, we performed multivariate analysis using APR‐DRG‐SOI to control for severity of illness. Of 8 comparisons, the only statistically significant difference, length of stay of patients with asthma, favored the intervention service.
Limitations
Although this study had numerous strengths, it also had several limitations. The primary limitations were lack of generalizability, difficulty in obtaining authentic assessments, the potential difference between statistical and educational significance, and inability to identify which components of the intervention service were responsible for the outcomes. This study's findings may not be generalizable to other institutions. For example, institutions without age or organ systembased teams may not observe increases in the number of key diagnoses encountered in the patients cared for. Regarding the assessments, there may be better measures of clinical competence, such as an objective structured clinical examination (OSCE),13 than those used in this study. However, there were not sufficient resources to implement an OSCE at the end of the rotation.
Some might question whether the statistically significant differences have educational significance. Although that is an important concern, this study should be compared with other educational interventions that found few statistically significant, let alone educationally significant, differences. To address this concern, we calculated effect sizes. The differences in student satisfaction were small to moderate. Although the lower limit of the 95% confidence interval of the odds ratio for matching in a pediatric residency was 0.99, the magnitude was programmatically important.
Finally, this study was an evaluation of an existing program. The authors were unable to control some potential confounders including patient allocation, average daily census, and quality of teaching. For example, Griffith and colleagues have shown that working with the best teachers improves student performance.14 We were not able to randomly assign the faculty among the services, and unequal distribution of better teachers could have biased this study's outcomes. The students on the intervention service rated their attendings, but not their residents, higher than did the students on the other services. However, the linear regression model showed that the perceived quality of the attending did not account for all the differences in student satisfaction. It was not possible to control for this factor in comparing student performance or subinternship or residency selection because the survey, which included the faculty evaluations, was anonymous and therefore could not be linked to the other data sets.
The perceived differences in the quality of teaching may not have been the result of differences in the attendings but instead of differences in the structure of the services. Accessibility is one of the characteristics of excellent clinical teachers.15 The intervention structure may permit faculty to spend more time with students, and this may increase the perceived quality of the teaching. However, it is not possible to resolve this issue with the available data.
CONCLUSIONS
The intervention service is a structure for the pediatric inpatient rotation of third‐year medical students that, instead of dividing the faculty and supervising resident's attention between interns and students, focuses their attention on the students. Although it has been difficult to demonstrate improvements as a result of the educational interventions, we have shown several improvements in the evaluations of the students. Moreover, the pattern of increased student satisfaction and a tendency toward more student selecting careers in pediatrics are remarkable. This was accomplished with similar resource utilization. Therefore, this program merits being continued at our institution and possibly adopted at other medical schools. Further research is needed to determine which aspects of the intervention are responsible for its effects. Some components, such as focused time with students, may be applicable to traditional services.
Acknowledgements
The authors thank Ronald Bloom for encouraging us to conduct this study; Kathy Bailey, Alice Dowling, and Margie Thompson for their assistance in the data collection; and Elizabeth Allen, Ronald Bloom, Flory Nkoy, Louis Pangaro, Stephanie Richardson, and Rajendu Srivastava for manuscript review.
- ,,.The role of the student ward in the medical clerkships.J Med Educ.1985;60:524–529.
- .Changing the fourth‐year medicine clerkship structure: A successful model for a teaching service without housestaff.J Gen Intern Med.1993;8:31–32.
- ,.A randomized, controlled pilot study of placing third‐year medical clerks in a continuity clinic.Acad Med.1993;68:845–847.
- ,,.Consequences of shifting medical‐student education to the outpatient setting: effects on performance and experiences.Acad Med.1996;71(suppl 1):S99–S101.
- ,.Learning outcomes of an ambulatory care rotation in internal medicine for junior medical students.J Gen Intern Med.1993;8:189–192.
- ,,,,.A prospective, randomized trial of a six‐week ambulatory medicine rotation.Acad Med.1995;70:537–541.
- ,,,,.Ambulatory versus inpatient rotations in teaching third‐year students internal medicine.J Gen Intern Med.1998;13:327–330.
- ,,,,.The effect of an ambulatory internal medicine rotation on students' career choices.Acad Med.1997;72:147–149.
- .Theme issue on medical education: Call for papers.JAMA.2005;293:742.
- Perkin RM,Swift JD,Newton DA, eds.Pediatric Hospital Medicine: Textbook of Inpatient Management.Philadelphia:Lippincott Williams 2003.
- .Call for greater emphasis on effect‐size measures in published articles in Teaching and Learning in Medicine.Teach Learn Med.2002;14:206–210.
- .Educational research and randomised trials.Med Educ.2002;36:1002–1003.
- ,.The objective structured clinical examination.Arch Pediatr Adolesc Med.2000;154:736–741.
- ,,,.Relationship of how well attending physicians teach to their student's performances and residency choices.Acad Med.1997;72(suppl 1):S118–S120.
- ,.Assessing quality and costs of education in the ambulatory setting: A review of the literature.Acad Med.2002;77:621–680.
Copyright © 2007 Society of Hospital Medicine
Alcohol‐Dependent Patients
Alcohol dependence is commonly associated with severe medical disease1 and is common among hospitalized medical patients. A nationally representative hospital sample found current alcohol use disorders to have a prevalence of 7.4%; most of those with these disorders were alcohol dependent.2 However, depending on the communities served by specific hospitals, prevalence can be much higher among medical inpatients,25 with studies finding problem drinking in as many as 28% of such patients. Although heavy drinking and the psychosocial problems that characterize alcohol dependence cause disease and interfere with disease management, remission is often difficult to achieve. As a result, although inpatient care of such patients probably does not differ from the average,6 this population is at high risk for poor health outcomes. as illustrated by factors such as suboptimal chronic disease management,7 preventable hospitalization,8 and increased mortality.9, 10 Remission involves a major behavior change that has been conceived of as a progression of stages, including precontemplation, contemplation, preparation, action, and maintenance.11 Clinically, this process encompasses an initial lack of awareness of the problem, followed by problem recognition and ambivalence about change, an increasing desire to change and concrete attempts at behavior change, and eventually long‐lasting behavioral improvements. The work described in this article was based on the broad hypothesis that acute illness and other alcohol‐related consequences will accelerate the process of change and that it might be possible to utilize this effect of acute illness to improve treatment outcomes for medically ill, alcohol‐dependent patients. If so, then measures of the change process should be correlated with measures of health status and alcohol consequences, correlations that were estimated in this study. If such measures are correlated and future research supports a causal relationship, then the link between illness and desire to change at the time of hospitalization could be exploited to help motivate changes in drinking and involvement in alcohol dependence treatment following hospital discharge.
METHODS
Study Design and Patients
Fifty clinically suspected and subsequently confirmed medical inpatients with current alcohol dependence were surveyed. Exclusion criteria were having chronic cognitive impairment, determined clinically; being nonEnglish speaking, and living in an institutional setting prior to hospitalization. Patients with suspected alcohol dependence were consecutively identified through consultation with attending internists, senior residents, and nurse case managers staffing internal medicine inpatient services of a university‐affiliated public hospital. Patients were identified by these hospitalist teams on the basis of their usual clinical care during the admission and acute care process. Thus, they were identified by characteristics such as alcohol‐related disease, self‐reported heavy drinking, abnormalities in laboratory test results such as transaminases and MCV, intoxication and withdrawal, or known history of dependence. However, the method of identification was not specifically tracked. Research staffers approached such patients to request participation in and obtain informed consent for participation in a survey of inpatients with acute medical conditions and possible drinking problems. Those who provided informed consent were interviewed by a member of the research team for DSM‐IV current alcohol dependence12 using a brief assessment instrument that covered all 7 dependence criteria. Patients who met 3 or more criteria during the past year were considered alcohol dependent and were asked to complete additional surveys. The study protocol was approved by the appropriate university institutional review board and by the director of research at the medical center.
Process of Change Variables
The Stages of Change Readiness and Treatment Eagerness Scale (SOCRATES) was developed to capture certain key elements of the process of change in persons with alcohol dependence, including recognition of the drinking problem, ambivalence about change, and planning or initiating changes to alter drinking behavior.13 The SOCRATES is a 19‐item instrument consisting of 3 scales (Recognition, Ambivalence, and Taking Steps). Each scale score is the sum of several items, with all items having 5 ordinal responses ranging from strongly disagree to strongly agree. The Recognition scale is composed of 7 items (score range 735) that estimate an individual's recognition of his or her alcohol use as an important problem, desire to change, and perception of harm related to drinking. The Ambivalence scale contains 4 items (score range 420) that ask respondents if they wonder if they are alcoholic, drink too much, are hurting others, and are in control of their drinking. Degree of wondering (as opposed to knowing) about such issues is considered a reflection of uncertainty, or ambivalence, and higher scores suggest that the patient is at a more contemplative stage of change. The Taking Steps scale has 8 items (score range 840) that assess if positive change has already been initiated and the desire for help to prevent relapse.
Perceived Overall Health Status Variables
Perceived physical and mental health status were estimated using the Medical Outcome Study Short Form‐12 physical and mental subscales, continuous measures that were standardized to the 1998 U.S. adult population.14
Perceived Alcohol‐Related Adverse Consequences
Tto assess the consequences attributed to alcohol by the patient, we administered the Short Inventory of Problems.15 This is a 15‐item instrument that assesses consequences in 5 domains (physical, interpersonal, intrapersonal, impulse control, and social responsibility). Each domain is measured by a 3‐item subscale with 4 ordinal responses ranging from never (score = 0) to daily or almost daily (score = 3), so the subscale scores range from 0 to 9. The physical subscale asks subjects if their physical health has been harmed by drinking, if their physical appearance has been harmed by drinking, and if they have not eaten properly because of drinking. Given the premise that poor health would accelerate the process of change, we were particularly interested in the physical subscale, but evaluated all adverse‐consequence domains as correlates of the change variables.
Other Descriptive Variables
The admission diagnoses of each participant were recorded. Demographic factors, determined by self‐report or from the medical record, were age, sex, ethnicity (Hispanic, non‐Hispanic black, non‐Hispanic white), years of education, and health insurance. Previous 4‐week alcohol consumption was measured using alcohol timeline follow‐back methodology.16 This method defines a standard drink and, with the help of memory cues, asks the patient to estimate how much alcohol was consumed on each day. Percent drinking days (days on which any amount of alcohol was consumed) and average number of drinks per drinking day were calculated from the resulting daily drinking record.
Analysis
Because not all scales were normally distributed, we calculated Spearman correlation coefficients to estimate the association of the change variables (SOCRATES subscales) with perceived health variables (SF‐12 subscales and SIP physical subscale) and the other adverse consequence domains of the SIP. Although the study was underpowered for subset analyses, we did explore confounding by age, sex, and ethnicity when the unadjusted association between a health or adverse consequence variable with a SOCRATES subscale was statistically significant (P < .05). We also added adjustment for alcohol consumption (ie, percent drinking days and average drinks per drinking day) when these consumption measures were associated with the process‐of‐change variables. Because the distributions of the problem Recognition and Ambivalence scores were censored at their upper limits, tobit regression, a method appropriate for censored outcomes, was used to compare adjusted and unadjusted associations. The Taking Steps scores were approximately normally distributed, and ordinary least‐squares regression was used for multivariable analyses.
RESULTS
We identified 117 potential participants, accounting for 6% of total admissions (n = 1964) during the 7‐month recruitment period (late 2004 through mid‐2005). Of this total, 20 (17%) refused or withdrew prior to completing the study questionnaires, 17 (14.5%) were not eligible because of chronic cognitive impairment, 15 (12.8%) were discharged prior to being interviewed, 14 (12%) did not meet current alcohol dependence criteria (4 of whom met abuse criteria), and 1 (<1%) did not speak English. The remaining 50 subjects were included in this analysis. Characteristics of this group are listed in Table 1. They were primarily male, and socioeconomic status (assessed on the basis of education and health insurance) was low relative to the general population.17 Persons listed as having public insurance only were mainly covered by state Medicaid plans with or without Medicare. The less common diagnoses listed as other in Table 1, pertaining to no more than 2 patients, include arrhythmia, upper gastrointestinal bleeding, gout, electrolyte imbalance, hypoglycemia, diabetic ketoacidosis, diarrhea, stroke, and congestive heart failure. Measures of alcohol consumption were consistent with the clinical diagnosis of current alcohol dependence.
| Male | 40 (80%) |
| Mean age (SD) | 50 (11) |
| Ethnicity | |
| Hispanic | 8 (16%) |
| Non‐Hispanic black | 13 (26%) |
| Non‐Hispanic white | 29 (58%) |
| Mean years of education (SD) | 11.6 (2.1) |
| Health insurance | |
| Only public | 35 (70%) |
| Private | 5 (10%) |
| None | 10 (20%) |
| Mean percent drinking days (SD) | 68 (35) |
| Mean number of drinks/drinking day (SD) | 8.4 (4.9) |
| Most common admission diagnoses | |
| Liver disease | 8 (16%) |
| Pancreatitis | 7 (14%) |
| Withdrawal seizure | 7 (14%) |
| Chest pain and/or myocardial infarction | 6 (12%) |
| Drug overdose | 5 (10%) |
| Infection | 4 (8%) |
| Other | 13 (26%) |
Of the components of the change process measured, the Recognition and Ambivalence subscales tended to have high scores. Thirty percent of subjects had the highest possible score on the Recognition scale, and 16% had the highest possible score on the Ambivalence scale. The scores for taking steps to change were more evenly distributed. A description of the study variables is included in Table 2.
| Variable* | Mean (Standard Deviation), Range |
|---|---|
| |
| Process‐of‐change variables (SOCRATES) | |
| Problem recognition | 28.9 (6.2), 1035 |
| Ambivalence | 15.3 (3.8), 420 |
| Taking steps to change | 30.6 (5.9), 1440 |
| Overall health perceptions (SF‐12) | |
| Perceived physical health status | 42.5 (8.4), 2958 |
| Perceived mental health status | 39.2 (8.3), 1855 |
| Alcohol‐related consequences (SIP) | |
| Physical | 5.7 (2.8), 09 |
| Interpersonal | 5.5 (3.1), 09 |
| Intrapersonal | 5.3 (2.8), 09 |
| Impulse control | 4.0 (2.4), 09 |
| Social responsibility | 5.1 (3.0), 09 |
The unadjusted correlations of alcohol problem recognition, ambivalence, and taking steps to change drinking with each perceived health status and alcohol‐consequence variable are shown in Table 3. Problem recognition was modestly and inversely associated with overall perception of physical health as measured by the SF‐12 but was not associated with perceived mental health. All the SIP subscales had strong univariate associations with problem recognition (P < .001 for each subscale). Problem recognition was associated with both percent drinking days (r = 0.39, P = .005) and average drinks per drinking day (r = 0.34, P = .0191). Adjustment for age, sex, and ethnicity did not modify the associations of recognition with perceived health and adverse consequences. Additional adjustment for percent drinking days eliminated the significant association with overall physical health from the SF‐12 (35% reduction in the regression coefficient, adjusted P = .100). A similar reduction in the association between problem recognition and overall physical health was observed for average drinks per drinking day (36% reduction in the regression coefficient, adjusted P = .102). All SIP subscales remained strongly associated with problem recognition despite the additional adjustment for alcohol consumption measures (all adjusted P values 0.001).
| SOCRATES process‐of‐change variables | |||
|---|---|---|---|
| Recognition | Ambivalence | Taking Steps | |
| |||
| Perceived health (SF‐12) | |||
| Physical | 0.31 (0.54, 0.03) | 0.41 (0.61, 0.14) | 0.26 (0.50, 0.03) |
| Mental | 0.06 (0.33, 0.23) | 0.10 (0.19, 0.37) | 0.09 (0.19, 0.36) |
| Alcohol consequences (SIP) | |||
| Physical | 0.72 (0.55, 0.83) | 0.44 (0.18, 0.64) | 0.42 (0.16, 0.63) |
| Interpersonal | 0.69 (0.51, 0.81) | 0.62 (0.41, 0.76) | 0.38 (0.11, 0.60) |
| Intrapersonal | 0.66 (0.46, 0.79) | 0.40 (0.13, 0.61) | 0.30 (0.02, 0.53) |
| Impulse control | 0.54 (0.31, 0.71) | 0.37 (0.10, 0.59) | 0.24 (0.04, 0.49) |
| Social responsibility | 0.57 (0.34, 0.73) | 0.48 (0.22, 0.66) | 0.19 (0.10, 0.44) |
Ambivalence was associated with overall perception of physical health (P = .003) but not perceived mental health. All SIP subscales were associated with ambivalence (all P < .010). Alcohol consumption measures were not significantly associated with ambivalence (for percent drinking days, r = 0.25, P = .083; for average drinks per drinking day, r = 0.24, P = .106). Adjustment for age, sex, and ethnicity did not alter these findings.
Taking steps to change drinking behavior was not significantly associated with overall perceptions of physical and mental health. The physical (P = .002), interpersonal (P = .006), and intrapersonal (P = .034) SIP subscales were associated with taking steps to change. Alcohol consumption measures were not significantly associated with taking steps (percent drinking days, r = 0.19, P = .196; average drinks per drinking day, r = 0.24, P = .105). Adjustment for age, sex, and ethnicity, had minimal impact on the associations between taking steps and the physical, interpersonal, and intrapersonal SIP subscales.
DISCUSSION
This study evaluated the association of recognition of problem drinking, ambivalence about change, and taking steps to change with measures of perceived health status and alcohol‐related consequences. The results suggest that most medically hospitalized patients with clinically recognized alcohol dependence are highly cognizant of their drinking problem and wonder about the consequences of their drinking, and many feel they either have taken or will take steps to change their drinking behavior. Overall physical health perceptions during hospitalization were correlated with problem recognition (possibly mediated by heavy drinking) and ambivalence, but not with taking steps to change. Conversely, specific alcohol‐related physical and other consequences were often correlated with each process of change.
The SOCRATES results for this group were similar to those found in a large group of alcohol‐dependent persons participating in a large treatment trial.18 Relative to the distribution of SOCRATES scores in that group, 42% of this hospital sample would be above the median for recognition, 66% for ambivalence, and 44% for taking steps to change.19 This finding, coupled with the correlations of problem recognition and ambivalence (but not taking steps to change) with perceived physical health, suggests that medical hospitalization presents a unique opportunity for fostering change by moving ambivalent patients toward initiating change. However, additional research is needed to establish that these change processes during hospitalization predict participation after hospitalization in available treatment programs or other objective indicators of positive behavioral change.
Several limitations should be considered in interpreting our results. The participants represent clinically recognized and subsequently confirmed alcohol‐dependent patients. Results might differ for those initially detected by systematic screening, for example, by using a heavy‐drinking‐day item, as recommended by the NIH,20 or biomarkers.21 It is possible that such patients would have fewer apparent alcohol‐related consequences and may thus be less contemplative of change. In addition, our sample was recruited from a single hospital, and was primarily male and socioeconomically disadvantaged. Results may not generalize to other groups. Although we did not find any evidence that age, sex, and ethnicity altered the relationships examined in this work, the study was not adequately powered for firm conclusions about this. Finally, although the study demonstrated an association of perceived health status with readiness to change drinking, a causal relationship may not exist. Theoretically, poorer health would increase recognition, ambivalence, and intent to change, but close measurement of these variables over time would be required to establish this.
In conclusion, clinically recognized alcohol‐dependent patients with acute medical illness typically are highly cognizant of their drinking problems and often wish to change at the time of hospitalization. This is linked to perceptions of physical health and a variety of alcohol‐related consequences. The association of recognition, ambivalence, and intention to change at the time of hospitalization with postdischarge treatment participation and outcomes should be evaluated further. If these factors do predict such outcomes, intervention studies aimed at enhancing the process of change during hospitalization will be warranted.
- .Medical and Surgical Complications of Addiction. In:Graham AW,Schultz TK,Mayo‐Smith MF, et al., eds.Principles of Addiction Medicine.3rd ed.Chevy Chase, MD:American Society of Addiction Medicine;2003:1027–1052.
- ,,.Prevalence of current DSM‐IV alcohol use disorders in short‐stay, general hospital admissions, United States, 1994.Arch Intern Med.2003;163:713–719.
- ,,,,,Point prevalence of alcoholism in hospitalized patients: continuing challenges of detection, assessment, and diagnosis.Mayo Clin Proc.2001;76:460–466.
- ,,,,.The effect of patient gender on the prevalence and recognition of alcoholism on a general medicine inpatient service.J Gen Intern Med.1992;7:38–45.
- ,,,,,.Prevalence, detection, and treatment of alcoholism in hospitalized patients.JAMA.1989;261:403–407.
- ,,,,.Quality of care for acute myocardial infarction in elderly patients with alcohol‐related diagnoses.Alcohol Clin Exp Res.2006;30:70–75.
- ,,, et al.A temporal and dose‐response association between alcohol consumption and medication adherence among veterans in care.Alcohol Clin Exp Res.2005;29:1190–1197.
- ,,, et al.The roles of low literacy and social support in predicting the preventability of hospital admission.J Gen Intern Med.2006;21:140–145.
- .Mortality risks in alcoholism and effects of abstinence and addiction treatment.Psychiatr Clin North Am.1999;22:371–383.
- ,,,,.Alcohol screening results in elderly male veterans: association with health status and mortality.J Am Geriatr Soc.2004;52:1510–1517.
- ,,.Substance Abuse Treatment and the Stages of Change.New York:Guilford Press;2001.
- American Psychiatric Association.Diagnostic and Statistical Manual4th ed. (text revision).Washington, DC:American Psychiatric Association;2000.
- ,.Assessing drinkers' motivation for change: The Stages of Change Readiness and Treatment Eagerness Scale (SOCRATES).Psychol Addict Behav.1996;10:81–89.
- ,,,.How to Score Version 2 of the SF‐12 Health Survey (With a Supplement Documenting Version 1).Lincoln, RI:QualityMetric Inc.;2002.
- ,,.The Drinker Inventory of Consequences (DrinC): An Instrument for Assessing Adverse Consequence of Alcohol Abuse. NIAAA Project MATCH Monograph Series.Washington, DC:U.S. Government Printing Office;1995.
- ,.Timeline Follow‐back: A technique for assessing self‐reported ethanol consumption. In:Allen J,Litten R, eds.Measuring Alcohol Consumption: Psychosocial and Biological Methods.Totowa, NJ:Humana Press;1992:41–72.
- Current Population Survey, 2005 Annual Social and Economic Supplement. U.S. Census Bureau. Available at pubdb3.census.gov/macro/032005/health/h01_000.htm. Accessed January 22,2007.
- Project MATCH Research Group.Matching alcoholism treatments to client heterogeneity: Project MATCH posttreatment drinking outcomes.J Stud Alcohol.1997;5:7–29.
- Stages of Change Readiness and Treatment Eagerness Scale (SOCRATES). In:Allen J,Wilson V, eds.Assessing Alcohol Problems. A Guide for Clinicians and Researchers.2nd ed.Bethesda, MD:U.S. Department of Health and Human Services, National Institute of Alcohol Abuse and Alcoholism;2003:576–582.
- Helping patients who drink too much: a clinician's guide. U.S. Dept. of Health and Human Services, National Institute on Alcohol Abuse and Alcoholism, NIH Pub. No. 05‐3769, 2005. Available at www.niaaa.nih.gov/Publications/EducationTrainingMaterials. Accessed November, 29,2006.
- ,,,.Biomarkers of heavy drinking. In:Allen J,Wilson V, eds.Assessing Alcohol Problems. A Guide for Clinicians and Researchers.2nd ed.Bethesda, MD:U.S. Department of Health and Human Services, National Institute on Alcohol Abuse and Alcoholism;2003:37–53.
Alcohol dependence is commonly associated with severe medical disease1 and is common among hospitalized medical patients. A nationally representative hospital sample found current alcohol use disorders to have a prevalence of 7.4%; most of those with these disorders were alcohol dependent.2 However, depending on the communities served by specific hospitals, prevalence can be much higher among medical inpatients,25 with studies finding problem drinking in as many as 28% of such patients. Although heavy drinking and the psychosocial problems that characterize alcohol dependence cause disease and interfere with disease management, remission is often difficult to achieve. As a result, although inpatient care of such patients probably does not differ from the average,6 this population is at high risk for poor health outcomes. as illustrated by factors such as suboptimal chronic disease management,7 preventable hospitalization,8 and increased mortality.9, 10 Remission involves a major behavior change that has been conceived of as a progression of stages, including precontemplation, contemplation, preparation, action, and maintenance.11 Clinically, this process encompasses an initial lack of awareness of the problem, followed by problem recognition and ambivalence about change, an increasing desire to change and concrete attempts at behavior change, and eventually long‐lasting behavioral improvements. The work described in this article was based on the broad hypothesis that acute illness and other alcohol‐related consequences will accelerate the process of change and that it might be possible to utilize this effect of acute illness to improve treatment outcomes for medically ill, alcohol‐dependent patients. If so, then measures of the change process should be correlated with measures of health status and alcohol consequences, correlations that were estimated in this study. If such measures are correlated and future research supports a causal relationship, then the link between illness and desire to change at the time of hospitalization could be exploited to help motivate changes in drinking and involvement in alcohol dependence treatment following hospital discharge.
METHODS
Study Design and Patients
Fifty clinically suspected and subsequently confirmed medical inpatients with current alcohol dependence were surveyed. Exclusion criteria were having chronic cognitive impairment, determined clinically; being nonEnglish speaking, and living in an institutional setting prior to hospitalization. Patients with suspected alcohol dependence were consecutively identified through consultation with attending internists, senior residents, and nurse case managers staffing internal medicine inpatient services of a university‐affiliated public hospital. Patients were identified by these hospitalist teams on the basis of their usual clinical care during the admission and acute care process. Thus, they were identified by characteristics such as alcohol‐related disease, self‐reported heavy drinking, abnormalities in laboratory test results such as transaminases and MCV, intoxication and withdrawal, or known history of dependence. However, the method of identification was not specifically tracked. Research staffers approached such patients to request participation in and obtain informed consent for participation in a survey of inpatients with acute medical conditions and possible drinking problems. Those who provided informed consent were interviewed by a member of the research team for DSM‐IV current alcohol dependence12 using a brief assessment instrument that covered all 7 dependence criteria. Patients who met 3 or more criteria during the past year were considered alcohol dependent and were asked to complete additional surveys. The study protocol was approved by the appropriate university institutional review board and by the director of research at the medical center.
Process of Change Variables
The Stages of Change Readiness and Treatment Eagerness Scale (SOCRATES) was developed to capture certain key elements of the process of change in persons with alcohol dependence, including recognition of the drinking problem, ambivalence about change, and planning or initiating changes to alter drinking behavior.13 The SOCRATES is a 19‐item instrument consisting of 3 scales (Recognition, Ambivalence, and Taking Steps). Each scale score is the sum of several items, with all items having 5 ordinal responses ranging from strongly disagree to strongly agree. The Recognition scale is composed of 7 items (score range 735) that estimate an individual's recognition of his or her alcohol use as an important problem, desire to change, and perception of harm related to drinking. The Ambivalence scale contains 4 items (score range 420) that ask respondents if they wonder if they are alcoholic, drink too much, are hurting others, and are in control of their drinking. Degree of wondering (as opposed to knowing) about such issues is considered a reflection of uncertainty, or ambivalence, and higher scores suggest that the patient is at a more contemplative stage of change. The Taking Steps scale has 8 items (score range 840) that assess if positive change has already been initiated and the desire for help to prevent relapse.
Perceived Overall Health Status Variables
Perceived physical and mental health status were estimated using the Medical Outcome Study Short Form‐12 physical and mental subscales, continuous measures that were standardized to the 1998 U.S. adult population.14
Perceived Alcohol‐Related Adverse Consequences
Tto assess the consequences attributed to alcohol by the patient, we administered the Short Inventory of Problems.15 This is a 15‐item instrument that assesses consequences in 5 domains (physical, interpersonal, intrapersonal, impulse control, and social responsibility). Each domain is measured by a 3‐item subscale with 4 ordinal responses ranging from never (score = 0) to daily or almost daily (score = 3), so the subscale scores range from 0 to 9. The physical subscale asks subjects if their physical health has been harmed by drinking, if their physical appearance has been harmed by drinking, and if they have not eaten properly because of drinking. Given the premise that poor health would accelerate the process of change, we were particularly interested in the physical subscale, but evaluated all adverse‐consequence domains as correlates of the change variables.
Other Descriptive Variables
The admission diagnoses of each participant were recorded. Demographic factors, determined by self‐report or from the medical record, were age, sex, ethnicity (Hispanic, non‐Hispanic black, non‐Hispanic white), years of education, and health insurance. Previous 4‐week alcohol consumption was measured using alcohol timeline follow‐back methodology.16 This method defines a standard drink and, with the help of memory cues, asks the patient to estimate how much alcohol was consumed on each day. Percent drinking days (days on which any amount of alcohol was consumed) and average number of drinks per drinking day were calculated from the resulting daily drinking record.
Analysis
Because not all scales were normally distributed, we calculated Spearman correlation coefficients to estimate the association of the change variables (SOCRATES subscales) with perceived health variables (SF‐12 subscales and SIP physical subscale) and the other adverse consequence domains of the SIP. Although the study was underpowered for subset analyses, we did explore confounding by age, sex, and ethnicity when the unadjusted association between a health or adverse consequence variable with a SOCRATES subscale was statistically significant (P < .05). We also added adjustment for alcohol consumption (ie, percent drinking days and average drinks per drinking day) when these consumption measures were associated with the process‐of‐change variables. Because the distributions of the problem Recognition and Ambivalence scores were censored at their upper limits, tobit regression, a method appropriate for censored outcomes, was used to compare adjusted and unadjusted associations. The Taking Steps scores were approximately normally distributed, and ordinary least‐squares regression was used for multivariable analyses.
RESULTS
We identified 117 potential participants, accounting for 6% of total admissions (n = 1964) during the 7‐month recruitment period (late 2004 through mid‐2005). Of this total, 20 (17%) refused or withdrew prior to completing the study questionnaires, 17 (14.5%) were not eligible because of chronic cognitive impairment, 15 (12.8%) were discharged prior to being interviewed, 14 (12%) did not meet current alcohol dependence criteria (4 of whom met abuse criteria), and 1 (<1%) did not speak English. The remaining 50 subjects were included in this analysis. Characteristics of this group are listed in Table 1. They were primarily male, and socioeconomic status (assessed on the basis of education and health insurance) was low relative to the general population.17 Persons listed as having public insurance only were mainly covered by state Medicaid plans with or without Medicare. The less common diagnoses listed as other in Table 1, pertaining to no more than 2 patients, include arrhythmia, upper gastrointestinal bleeding, gout, electrolyte imbalance, hypoglycemia, diabetic ketoacidosis, diarrhea, stroke, and congestive heart failure. Measures of alcohol consumption were consistent with the clinical diagnosis of current alcohol dependence.
| Male | 40 (80%) |
| Mean age (SD) | 50 (11) |
| Ethnicity | |
| Hispanic | 8 (16%) |
| Non‐Hispanic black | 13 (26%) |
| Non‐Hispanic white | 29 (58%) |
| Mean years of education (SD) | 11.6 (2.1) |
| Health insurance | |
| Only public | 35 (70%) |
| Private | 5 (10%) |
| None | 10 (20%) |
| Mean percent drinking days (SD) | 68 (35) |
| Mean number of drinks/drinking day (SD) | 8.4 (4.9) |
| Most common admission diagnoses | |
| Liver disease | 8 (16%) |
| Pancreatitis | 7 (14%) |
| Withdrawal seizure | 7 (14%) |
| Chest pain and/or myocardial infarction | 6 (12%) |
| Drug overdose | 5 (10%) |
| Infection | 4 (8%) |
| Other | 13 (26%) |
Of the components of the change process measured, the Recognition and Ambivalence subscales tended to have high scores. Thirty percent of subjects had the highest possible score on the Recognition scale, and 16% had the highest possible score on the Ambivalence scale. The scores for taking steps to change were more evenly distributed. A description of the study variables is included in Table 2.
| Variable* | Mean (Standard Deviation), Range |
|---|---|
| |
| Process‐of‐change variables (SOCRATES) | |
| Problem recognition | 28.9 (6.2), 1035 |
| Ambivalence | 15.3 (3.8), 420 |
| Taking steps to change | 30.6 (5.9), 1440 |
| Overall health perceptions (SF‐12) | |
| Perceived physical health status | 42.5 (8.4), 2958 |
| Perceived mental health status | 39.2 (8.3), 1855 |
| Alcohol‐related consequences (SIP) | |
| Physical | 5.7 (2.8), 09 |
| Interpersonal | 5.5 (3.1), 09 |
| Intrapersonal | 5.3 (2.8), 09 |
| Impulse control | 4.0 (2.4), 09 |
| Social responsibility | 5.1 (3.0), 09 |
The unadjusted correlations of alcohol problem recognition, ambivalence, and taking steps to change drinking with each perceived health status and alcohol‐consequence variable are shown in Table 3. Problem recognition was modestly and inversely associated with overall perception of physical health as measured by the SF‐12 but was not associated with perceived mental health. All the SIP subscales had strong univariate associations with problem recognition (P < .001 for each subscale). Problem recognition was associated with both percent drinking days (r = 0.39, P = .005) and average drinks per drinking day (r = 0.34, P = .0191). Adjustment for age, sex, and ethnicity did not modify the associations of recognition with perceived health and adverse consequences. Additional adjustment for percent drinking days eliminated the significant association with overall physical health from the SF‐12 (35% reduction in the regression coefficient, adjusted P = .100). A similar reduction in the association between problem recognition and overall physical health was observed for average drinks per drinking day (36% reduction in the regression coefficient, adjusted P = .102). All SIP subscales remained strongly associated with problem recognition despite the additional adjustment for alcohol consumption measures (all adjusted P values 0.001).
| SOCRATES process‐of‐change variables | |||
|---|---|---|---|
| Recognition | Ambivalence | Taking Steps | |
| |||
| Perceived health (SF‐12) | |||
| Physical | 0.31 (0.54, 0.03) | 0.41 (0.61, 0.14) | 0.26 (0.50, 0.03) |
| Mental | 0.06 (0.33, 0.23) | 0.10 (0.19, 0.37) | 0.09 (0.19, 0.36) |
| Alcohol consequences (SIP) | |||
| Physical | 0.72 (0.55, 0.83) | 0.44 (0.18, 0.64) | 0.42 (0.16, 0.63) |
| Interpersonal | 0.69 (0.51, 0.81) | 0.62 (0.41, 0.76) | 0.38 (0.11, 0.60) |
| Intrapersonal | 0.66 (0.46, 0.79) | 0.40 (0.13, 0.61) | 0.30 (0.02, 0.53) |
| Impulse control | 0.54 (0.31, 0.71) | 0.37 (0.10, 0.59) | 0.24 (0.04, 0.49) |
| Social responsibility | 0.57 (0.34, 0.73) | 0.48 (0.22, 0.66) | 0.19 (0.10, 0.44) |
Ambivalence was associated with overall perception of physical health (P = .003) but not perceived mental health. All SIP subscales were associated with ambivalence (all P < .010). Alcohol consumption measures were not significantly associated with ambivalence (for percent drinking days, r = 0.25, P = .083; for average drinks per drinking day, r = 0.24, P = .106). Adjustment for age, sex, and ethnicity did not alter these findings.
Taking steps to change drinking behavior was not significantly associated with overall perceptions of physical and mental health. The physical (P = .002), interpersonal (P = .006), and intrapersonal (P = .034) SIP subscales were associated with taking steps to change. Alcohol consumption measures were not significantly associated with taking steps (percent drinking days, r = 0.19, P = .196; average drinks per drinking day, r = 0.24, P = .105). Adjustment for age, sex, and ethnicity, had minimal impact on the associations between taking steps and the physical, interpersonal, and intrapersonal SIP subscales.
DISCUSSION
This study evaluated the association of recognition of problem drinking, ambivalence about change, and taking steps to change with measures of perceived health status and alcohol‐related consequences. The results suggest that most medically hospitalized patients with clinically recognized alcohol dependence are highly cognizant of their drinking problem and wonder about the consequences of their drinking, and many feel they either have taken or will take steps to change their drinking behavior. Overall physical health perceptions during hospitalization were correlated with problem recognition (possibly mediated by heavy drinking) and ambivalence, but not with taking steps to change. Conversely, specific alcohol‐related physical and other consequences were often correlated with each process of change.
The SOCRATES results for this group were similar to those found in a large group of alcohol‐dependent persons participating in a large treatment trial.18 Relative to the distribution of SOCRATES scores in that group, 42% of this hospital sample would be above the median for recognition, 66% for ambivalence, and 44% for taking steps to change.19 This finding, coupled with the correlations of problem recognition and ambivalence (but not taking steps to change) with perceived physical health, suggests that medical hospitalization presents a unique opportunity for fostering change by moving ambivalent patients toward initiating change. However, additional research is needed to establish that these change processes during hospitalization predict participation after hospitalization in available treatment programs or other objective indicators of positive behavioral change.
Several limitations should be considered in interpreting our results. The participants represent clinically recognized and subsequently confirmed alcohol‐dependent patients. Results might differ for those initially detected by systematic screening, for example, by using a heavy‐drinking‐day item, as recommended by the NIH,20 or biomarkers.21 It is possible that such patients would have fewer apparent alcohol‐related consequences and may thus be less contemplative of change. In addition, our sample was recruited from a single hospital, and was primarily male and socioeconomically disadvantaged. Results may not generalize to other groups. Although we did not find any evidence that age, sex, and ethnicity altered the relationships examined in this work, the study was not adequately powered for firm conclusions about this. Finally, although the study demonstrated an association of perceived health status with readiness to change drinking, a causal relationship may not exist. Theoretically, poorer health would increase recognition, ambivalence, and intent to change, but close measurement of these variables over time would be required to establish this.
In conclusion, clinically recognized alcohol‐dependent patients with acute medical illness typically are highly cognizant of their drinking problems and often wish to change at the time of hospitalization. This is linked to perceptions of physical health and a variety of alcohol‐related consequences. The association of recognition, ambivalence, and intention to change at the time of hospitalization with postdischarge treatment participation and outcomes should be evaluated further. If these factors do predict such outcomes, intervention studies aimed at enhancing the process of change during hospitalization will be warranted.
- .Medical and Surgical Complications of Addiction. In:Graham AW,Schultz TK,Mayo‐Smith MF, et al., eds.Principles of Addiction Medicine.3rd ed.Chevy Chase, MD:American Society of Addiction Medicine;2003:1027–1052.
- ,,.Prevalence of current DSM‐IV alcohol use disorders in short‐stay, general hospital admissions, United States, 1994.Arch Intern Med.2003;163:713–719.
- ,,,,,Point prevalence of alcoholism in hospitalized patients: continuing challenges of detection, assessment, and diagnosis.Mayo Clin Proc.2001;76:460–466.
- ,,,,.The effect of patient gender on the prevalence and recognition of alcoholism on a general medicine inpatient service.J Gen Intern Med.1992;7:38–45.
- ,,,,,.Prevalence, detection, and treatment of alcoholism in hospitalized patients.JAMA.1989;261:403–407.
- ,,,,.Quality of care for acute myocardial infarction in elderly patients with alcohol‐related diagnoses.Alcohol Clin Exp Res.2006;30:70–75.
- ,,, et al.A temporal and dose‐response association between alcohol consumption and medication adherence among veterans in care.Alcohol Clin Exp Res.2005;29:1190–1197.
- ,,, et al.The roles of low literacy and social support in predicting the preventability of hospital admission.J Gen Intern Med.2006;21:140–145.
- .Mortality risks in alcoholism and effects of abstinence and addiction treatment.Psychiatr Clin North Am.1999;22:371–383.
- ,,,,.Alcohol screening results in elderly male veterans: association with health status and mortality.J Am Geriatr Soc.2004;52:1510–1517.
- ,,.Substance Abuse Treatment and the Stages of Change.New York:Guilford Press;2001.
- American Psychiatric Association.Diagnostic and Statistical Manual4th ed. (text revision).Washington, DC:American Psychiatric Association;2000.
- ,.Assessing drinkers' motivation for change: The Stages of Change Readiness and Treatment Eagerness Scale (SOCRATES).Psychol Addict Behav.1996;10:81–89.
- ,,,.How to Score Version 2 of the SF‐12 Health Survey (With a Supplement Documenting Version 1).Lincoln, RI:QualityMetric Inc.;2002.
- ,,.The Drinker Inventory of Consequences (DrinC): An Instrument for Assessing Adverse Consequence of Alcohol Abuse. NIAAA Project MATCH Monograph Series.Washington, DC:U.S. Government Printing Office;1995.
- ,.Timeline Follow‐back: A technique for assessing self‐reported ethanol consumption. In:Allen J,Litten R, eds.Measuring Alcohol Consumption: Psychosocial and Biological Methods.Totowa, NJ:Humana Press;1992:41–72.
- Current Population Survey, 2005 Annual Social and Economic Supplement. U.S. Census Bureau. Available at pubdb3.census.gov/macro/032005/health/h01_000.htm. Accessed January 22,2007.
- Project MATCH Research Group.Matching alcoholism treatments to client heterogeneity: Project MATCH posttreatment drinking outcomes.J Stud Alcohol.1997;5:7–29.
- Stages of Change Readiness and Treatment Eagerness Scale (SOCRATES). In:Allen J,Wilson V, eds.Assessing Alcohol Problems. A Guide for Clinicians and Researchers.2nd ed.Bethesda, MD:U.S. Department of Health and Human Services, National Institute of Alcohol Abuse and Alcoholism;2003:576–582.
- Helping patients who drink too much: a clinician's guide. U.S. Dept. of Health and Human Services, National Institute on Alcohol Abuse and Alcoholism, NIH Pub. No. 05‐3769, 2005. Available at www.niaaa.nih.gov/Publications/EducationTrainingMaterials. Accessed November, 29,2006.
- ,,,.Biomarkers of heavy drinking. In:Allen J,Wilson V, eds.Assessing Alcohol Problems. A Guide for Clinicians and Researchers.2nd ed.Bethesda, MD:U.S. Department of Health and Human Services, National Institute on Alcohol Abuse and Alcoholism;2003:37–53.
Copyright © 2007 Society of Hospital Medicine
Identification of Inpatient DNR Status / Sehgal and Wachter
As modern medicine developed the technological capacity to deliver aggressive life‐sustaining interventionsthrough methods such as cardiopulmonary resuscitation (CPR), intensive care units, and mechanical ventilationthe concept of do‐not‐resuscitate (DNR) orders emerged to allow individual patients to choose to forego selected treatments. To encourage patients to articulate these preferences, Congress passed the Patient Self‐Determination Act in 1991, a measure that required health care facilities to discuss advance directives with patients as they enter their system.1 Although the act has had less of an impact on the quality of DNR discussions than originally hoped for,25 its passage was evidence of the importance our society places on patientclinician discussions regarding goals of care. In addition to this legislative push, many organizations and advocacy groups use a variety of marketing campaigns, accreditation standards,6 and standard instruments and tools79 to promote the use of advance directives
Despite all these efforts, fewer than 30% of Americans (54% older than age 65) have completed advance directives.10 Nevertheless, many patientsparticularly those at highest risk for requiring end‐of‐life caredo express preferences regarding resuscitation at the time of hospital admission. In an ideal world, these preferences would be available for all providers to view, respect, and act on.
Unfortunately, research on patient safety and quality has demonstrated wide gaps between ideal and actual practice.1112 In the context of DNR wishes, despite strong efforts to collect patients' preferences, no current regulation provides or mandates a best practice on making these preferences operational. There are also few data that indicate whether patients' preferences are in fact transmitted to providers at the point of care and in an accurate and reliable manner.
Past research on proper identification of DNR orders is limited, with much of the focus on prehospital protocols.1315 Anecdotally, hospitals seem to employ varying strategies to highlight DNR orders using a combination of paper or electronic documentation and color‐coded patient wristbands. There have been several reports of errors involving this issue, including patients receiving CPR despite stated DNR preferences and a patient having CPR withheld because the wrong chart (of another patient with a DNR order) was mistakenly pulled.1617
The patient safety field emphasizes standardization as a key strategy to prevent errors. Because of problems articulating DNR orders (and other important patient‐related information), several hospitals promote the use of color‐coded wristbands to denote preferences for resuscitation. However, without national regulations or standards, the possibility remains that one safety hazard (advance directives on a paper chart distant from a patient's room) may be traded for another hazard (front‐line providers interpreting a color‐coded wristband incorrectly). In addition to the ethical problems inherent in failing to adhere to patients' resuscitation preferences, errors in following advance directives may also create legal liability.18 With all this in mind, we conducted a national survey to determine practice variations in the identification of DNR orders and the use of color‐coded patient wristbands. We hypothesized that there is considerable variation both in identification practices and in the use of color‐coded wristbands across academic medical centers.
METHODS
The project was approved by the University of California, San Francisco Committee on Human Research. We anonymously surveyed nursing executives who are members of the University HealthSystem Consortium (UHC), an alliance of 97 academic medical centers and their affiliated hospitals representing 90% of the nation's nonprofit academic medical centers.19 The nursing executives are senior nursing leaders at participating UHC institutions and members of a dedicated UHC Chief Nursing Officer Council E‐mail listserv. We designed a brief survey and distributed it via their E‐mail listserv using an online commercial survey administration tool.20 Respondents were asked to complete the survey or have one of their colleagues familiar with local DNR identification practices complete it on their behalf. The online tool also provided summary reports and descriptive findings to meet the study objectives. We provided a 1‐month window (during summer 2006) with 1 interval E‐mail reminder to complete the surveys.
RESULTS
Survey announcements were E‐mailed to 127 nursing executives, 69 of whom completed it (response rate 54%). The respondents represented mostly academic medical centers (87%; another 13% represented affiliated community teaching hospitals), public institutions (89%), and large facilities (60% with more than 400 beds; 40% with 201‐400 beds). More than half the respondents (56%) reported their hospitals use paper chart documentation as the only method of identifying patients with a DNR order, whereas 16% reported their hospitals use only electronic health record (EHR) documentation (Fig. 1). Twenty‐five percent of hospitals (n = 17) use a color‐coded patient wristband in addition to either paper or electronic documentation. Of these 17 hospitals, a total of 8 colors or color schemes were employed to designate DNR status (Table 1).
| Green5 |
| Yellow3 |
| Blue3 |
| White with blue stars versus green stars (full DNR versus limited DNR)1 |
| Red1 |
| Red and white1 |
| Purple1 |
| Gold1 |
| Other (not listed)1 |
The use of color‐coded wristbands was not limited to identification of DNR status. Fifty‐five percent of hospitals (n = 31) use color‐coded wristbands to indicate another piece of patient‐related data such as an allergy, fall risk, or same last name alert (Table 2). In fact, 12 indications were depicted by various colors, with variations in both the color choice for a given indication (eg, allergy wristbands red at one hospital and yellow at another) and across indications (eg, red for allergy at one hospital and red for bleeding risk at another). Nearly 3 of 4 respondents (n = 48) reported being aware of a case at your institution in which confusion about a DNR order led to problems or confusion in patient care. A few respondents shared a brief anecdote of the event, illustrating the spectrum of clinical scenarios that lead to potential confusion (Table 3). Respondents reporting a case of confusion were not more likely to be from an institution that used color‐coded wristbands.
| Indication (n) | Colors used (n) |
|---|---|
| Drug/allergy (22) | Red (16) Yellow (4) White (1) Orange (1) |
| Fall risk (18) | Orange (5) Green (3) (and lime green [1]) Blue (3) Purple (3) Yellow (2) (and fluorescent yellow [1]) |
| Same name alert (7) | Blue (3) Orange (2) Yellow2) |
| Bleeding risk (3) | Red |
| Patient identification (3) | Green Red White |
| Wandering risk (3) | Pink (2) (and hot pink [1]) |
| Contact isolation (2) | Green |
| Latex allergy (2) | Purple |
| No blood draws on this arm (1) | Orange |
| MRSA infection (1) | Green |
| No blood products (1) | Red |
| Sleep apnea (1) | Purple |
| The patient had a DNR order written in the chart but no other identifiers at bedside, so a consult service started CPR while trying to determine code status. |
| Nurse called a code on a patient who was DNR because she failed to see order in chart. |
| Resuscitation efforts took place on a patient with a DNR order because the entire chart did not accompany the patient to a diagnostic testing area. |
| Patient was off the unit for a procedure, and staff in the other department did not know patients code status (DNR) and called a code. |
| Patient transported off nursing unit to radiology and coded. Patient was a DNR, but the order was buried in thinned chart materials. |
| Prior to implementing the wristbands, there were delays in care. Once wristbands were implemented with stars only, there was confusion as to what a blue star meant and what a green star meant (limited versus no resuscitation efforts). |
| We used to place a sticker on the chart. A sticker was left on the chart of a discharged patient when a new patient was admitted. The mistake was caught before an incident occurred. |
When asked whether most (greater than 75%) physicians and nurses could properly identify the color associated with a DNR patient wristband, responses differed by discipline. Eight‐five percent of respondents believed that most nurses at their institutions could correctly report the color for DNR, whereas only 15% believed physicians could do the same. Only 22% of respondents anticipated a change in the current system within the next 2 years; all these changes were a transition from paper to electronic documentation systems.
DISCUSSION
Regardless of whether the DNR documentation occurs in paper or electronic form (and our study demonstrates significant practice variation in the documentation method), the risk that a hospitalized patient may suddenly stop breathing or become pulseless is ever present. When such a patient is discovered, providers race to the bedside and initiate care, but immediately ask, Is the patient a full code? In these often‐chaotic moments, accurate and timely information about DNR status is critical to respecting a patient's preferences and avoiding a potentially devastating error. A number of the anecdotes shared by survey respondents and highlighted in Table 3 reinforce this concern. Many of these scenarios occur in the middle of the night or off a patient's primary unit (ie, at a test or procedure area), increasing the need for quick and easy identification of DNR status.
Our study demonstrates that a logical point‐of‐care solutiona color‐coded DNR patient wristbandmay create its own safety hazards, particularly if the color designations are not known by all providers (including floating and traveling nurses or trainees who rotate at different hospitals) and if the colors being employed represent different indications at a given hospital (see accompanying Images Dx, page 445). We found that approximately 1 in 4 surveyed hospitals depict DNR status by a color‐coded wristband. We also discovered remarkable variation in the colors chosen and the degree to which institutions use color‐coded wristbands to signal a panoply of other patient‐related issues. Human factors research demonstrates that even well‐meaning patient safety solutions may cause harm in new ways if they are poorly implemented or if the interface between the technology and human work patterns is not well appreciated. For example, recent studies illustrate unintended consequences from safety‐driven solutions, such as the implementation of computerized order entry,2122 quality measurement,23 adoption of EHRs,24 and bar code medication administration systems.25 Because standardization is a key mechanism for decreasing the opportunities for error, our findings raise serious concerns about current wristband use.
Interestingly, the lack of standardization and its related risk of failing to recall the conditions associated with color‐coded wristbands are complicated by societal trends. In December 2004 the issue of patient wristbands made headlines in Florida, when hospitals using yellow DNR wristbands (as was the case in 3 hospitals in our sample) reported several near‐misses among patients wearing yellow Lance Armstrong Livestrong bracelets.2627 Given recent estimates that nearly 1 in 5 Americans wears these bracelets to support people living with cancer,28 even safety‐minded journals and national newspapers have highlighted the issue.2930 Most hospitals that continue to use yellow DNR wristbands now either remove or cover Livestrong bracelets at the time of hospital admission. Furthermore, many other self‐help organizations now issue wristbands in a variety of colors as well, creating a potential hazard for any person wearing one in the hospital. Although patients do not mind wearing color‐coded wristbands,31 they might feel differently if they knew the potential for confusion.
After these anecdotal reports of identification mistakes surfaced, several states, most notably Arizona and Pennsylvania, launched initiatives to address the problem.3233 Arizona, after discovering 8 colors being used in the state, developed plans for a purple DNR color‐coded wristband. The choice of purple, and the careful decision to avoid blue, occurred because many hospitals call their resuscitative efforts a code blue, creating yet another potential source of confusion if a blue wristband is associated with a DNR order. The Pennsylvania Patient Safety Authority also found tremendous color variations in patient wristbands used in a statewide survey. Both states ultimately promoted standardized colors and indications and provided tool kits and implementation manuals.3233
Although statewide initiatives represent a step forward, we believe that a national standard for color‐coded wristbands would improve patient safety. Precedents for this call to action exist. For many years, anecdotal information circulated about the errors caused by ambiguous use of abbreviations, such as qd instead of daily or U instead of units. Individual hospitals often banned or limited the use of such abbreviations, but no standard list of high‐risk abbreviations guided practice or required adherence, and cross‐hospital variation undoubtedly led to confusion. In 2004 the Joint Commission created a uniform list of high‐risk abbreviations as part of their National Patient Safety Goals, which instantly ended the debate about which abbreviations to ban and mandated compliance with the safety practice.34 A national group of stakeholders should similarly be convened to develop a list of colors and associated conditions that should be widely disseminated and enforced by the Joint Commission or a similar body. The statewide efforts by Arizona and Pennsylvania are instructive in this regard. Despite being guided by the goal of standardization, these 2 states chose different colors for DNR identification (interestingly, Pennsylvania chose blue for DNR, perhaps for the same reason that Arizona avoided itcode blue), further supporting the need for national guidelines (Table 4).
| Indication | Color (PA) | Color (AZ) |
|---|---|---|
| DNR | Blue | Purple |
| Allergy | Red | Red |
| Fall risk | Yellow | Yellow |
| Latex allergy | Green | |
| Restricted extremity | Pink | |
| Preregistration in emergency room | Yellow | |
| Admission and identification | Clear |
Our study represents the first national sample of DNR identification practices. Although it targeted academic health centers and affiliated institutions, we believe that these practice variations likely exist in all health care settings. Our study limitations included reliance on self‐reported institutional practices rather than direct review of existing policies and limited information about the surveyed population, making it impossible to compare respondents and nonrespondents. However, we have no reason to believe that these groups differed sufficiently to influence the study's main findings.
In the future, better technology may ultimately replace color‐coded wristbands. For instance, the time may come when wireless technologies seamlessly linked to the electronic health record will alert providers to a patient's DNR status when entering the patient's room. However, for today, point‐of‐care solutions using color‐coded wristbands remain a reasonable solution. Creating a nationally enforced standardized methodology, understandable and memorable to providers and free of stigma to patients (eg, a black wristband for DNR or writing DNR on a wristband) should be a patient safety priority. Because simplification is another key characteristic of safe systems, it seems prudent to aim for a national system that involves a maximum of 3‐4 colors.
CONCLUSIONS
Patients and families dedicate tremendous energy to making decisions about their advance directives, and discussions of these issues often create considerable angst and sadness. Health care providers are trained to elicit and advocate for such directives so they can act with patients' wishes in mind. Despite the high stakes, all these efforts can be undermined when the system for making providers aware of a patient's DNR status is flawed. Our data confirm the tremendous variability in the systems used to indicate DNR status (and other types of indications), variability that may place patients at risk from catastrophic errors. Following the lead of a few states, we call for a national mandate to standardize the identification of DNR orders and to make the colors of wristbands for a small set of indications uniform in every hospital across the country.
Acknowledgements
We thank Mark Keroack, MD, MPH, and Cathy Krsek, RN, MSN, MBA, from the University HealthSystem Consortium for their contributions to the survey and assistance with administration. We also thank members of the UHC Chief Nursing Council for participating in the survey study.
Copyright © 2007 Society of Hospital Medicine

Common Myths in Caring for Patients with Terminal Illness
Shortcomings in the quality of care of hospitalized patients at the end of life, especially in the final days, are well documented.1, 2 Recent studies have highlighted inadequate pain and symptom control for hospitalized terminally ill patients,24 poor communication about treatment preferences,57 and limited or delayed referral for hospice care.810 Efforts to improve the quality of end‐of‐life care have been diverse, including increased educational programs,1113 development of palliative care units in hospitals,14, 15 and greater exposure to palliative care for physicians during residency training.16 Despite these efforts, studies assessing the attitudes and knowledge of physicians about hospice and palliative care continue to show deficits in knowledge about managing pain17, 18 as well as hospice policies and services.9
Among the interventions aimed at improving hospital care, the hospitalist movement has emerged as a model of care for improving the quality and cost efficiency of hospital care.1922 Because hospitalists spend substantial time on inpatient services,23 they are often involved in the care of patients with terminal illness, with potential to improve the quality of care that these patients receive while hospitalized. However, little is known about what specific knowledge and perspectives hospitalists and residents have about the care of patients with terminal illness. Although many studies have been conducted among physicians in private practice,9, 10, 2426 they have not focused on the knowledge, reported practices, and attitudes of hospitalists and residents concerning key aspects of end‐of‐life care and hospice. Such information can help to identify potential areas for improving knowledge and addressing common barriers highlighted in linking hospital and posthospital hospice care.
METHODS
Study Design and Sample
During 2006 we surveyed hospitalists and medical residents who were on their oncology rotation at a large academic medical center that did not have a hospital‐based palliative care unit in order to examine their knowledge, attitudes, and practices regarding terminally ill patients and hospice referrals. Hospitalists (n = 23) and medical residents (n = 29) made up a convenience sample of 52 physicians. The medical residents were completing their oncology rotation during the spring of 2006. The Institutional Review Board at Yale University School of Medicine approved the research protocol and verbal consent procedures.
Survey
The brief survey instrument (see Appendix) assessed physicians' knowledge and attitudes about and practices in caring for patients with terminal illness. The survey was adapted from previously published instruments8, 24 that have been shown24 to have good test‐retest reliability and construct validity. The survey contained 5 items pertaining to clinical knowledge about palliative care practices, including common symptoms and drug indications, doses, and side effects.27 An additional 2 items pertained to respondents' knowledge about nonclinical issues concerning eligibility rules for hospice,8 such as how a patient becomes eligible for hospice and whether Medicare benefits can be revoked or reinstated after hospice is elected. The survey also included 10 statements24 assessing physician attitudes about caring for patients with terminal illness. Responses, provided using a 5‐point Likert scale, were collapsed for reporting into a 3‐point scale of agree, neutral, and disagree. The instrument also included an open‐ended question asking physicians to specify what from their perspective was needed to ensure timely referral for hospice and palliative care.
Data Analysis
We used standard frequency analysis to describe the distribution of responses to the survey items. Based on an analysis of common erroneous answers to clinical knowledge questions, we identified several common myths prevalent among hospitalists and medicine residents. We also examined whether knowledge, reported practices, and attitudes differed significantly between the hospitalist and the resident samples using ANOVA or chi‐square statistics as appropriate. We used content analysis to summarize the open‐ended responses about potential ways to overcome what respondents perceived was underutilization of hospice.
RESULTS
Overview
The response rate for the survey was 85.2%. Almost half of the respondents (44.2%) were hospitalists (Table 1). The remaining respondents included first‐year (n = 9) and second‐ or third‐year (n = 16) residents or fellows (n = 4). Approximately 54% of the 52 respondents were female, and the majority (83%) had graduated from medical school between 2000 and 2005. Several common myths were apparent and pertained to essential areas of treating patients with terminal illness: pain control, symptom control, and eligibility for hospice (Table 2). Respondents generally had strong beliefs about caring for patients with terminal illness, and most agreed that many patients who would benefit from hospice either do not receive hospice or receive it only late in the course of their illness (Table 3).
| Characteristic | n | % |
|---|---|---|
| Sex | ||
| Female | 28 | 53.9% |
| Male | 24 | 46.1% |
| Years since graduation from medical school | ||
| 1‐2 Years | 26 | 56.5% |
| 3‐5 Years | 12 | 26.1% |
| >5 Years | 8 | 17.4% |
| Missing | 6 | |
| Physician type | ||
| Hospitalist | 23 | 44.2% |
| First‐year resident | 9 | 17.3% |
| Second‐ or third‐year resident | 16 | 30.8% |
| Fellow | 4 | 7.7% |
| Questions about hospice and palliative care practices | Response (%) |
|---|---|
| |
| The incidence of psychological dependence (addiction) to opioids and analgesics when treating pain from cancer or other medical conditions is: | |
| Common (1 in 10 patients) | 17.3 |
| Uncommon (1 in 100 patients) | 48.1 |
| Very rare (fewer than 1 in 1000 patients) | 34.6 |
| When a patient with cancer who is receiving opioids for pain complains of increasing pain, it most likely indicates: | |
| Opioid tolerance | 69.2 |
| Increasing pathology of the cancer | 26.9 |
| Patient noncompliance | 0.0 |
| New onset of a different opioid‐resisting pain | 3.9 |
| In the pain patient receiving opioids, 30 mg of oral morphine is equipotent to of IV morphine | |
| 1 mg | 4.0 |
| 5 mg | 40.0 |
| 10 mg | 56.0 |
| 20 mg | 0.0 |
| The 2 classes of drugs most commonly recommended for treating terminal dyspnea are: | |
| Beta‐blockers and Lasix | 7.7 |
| Opioids and benzodiazepines | 82.7 |
| Beta‐blockers and corticosteroids | 9.6 |
| Beta‐blockers and Singulair (montelukast) | 0.0 |
| A hospice patient whose agitation is primarily from anxiety should be treated with: | |
| Chlorpromazine (thorazine) | 0.0 |
| Haloperidol | 21.6 |
| Lorazepam (Ativan) | 76.4 |
| Morphine | 2.0 |
| Questions about eligibility for hospice care | Response (%) |
| Under the Medicare program, a physician must certify that the patient is expected to die within a specified time for the patients to be eligible for hospice services. To the best of your knowledge, patients become eligible for inpatient hospice care when they are expected to die in: | |
| 2 Weeks | 5.8 |
| 6 Weeks | 9.6 |
| 2 Months | 9.6 |
| 6 Months | 69.2 |
| Other | 1.9 |
| Don't know | 3.8 |
| To the best of your knowledge, patients become eligible for home hospice care when they are expected to die in: | |
| 2 Weeks | 0.0 |
| 6 Weeks | 5.8 |
| 2 Months | 7.7 |
| 6 Months | 73.1 |
| Other | 0.0 |
| Don't know | 13.4 |
| Beliefs | Disagree (%) | Neutral (%) | Agree (%) |
|---|---|---|---|
| Most patients want me to tell them their life‐expectancy. | 0.0 | 17.4 | 82.6 |
| Generally, family caregivers want me to tell them the patient's life expectancy. | 4.4 | 8.7 | 86.9 |
| Telling the patient and family members that the patient's illness is incurable is difficult for me. | 23.0 | 13.5 | 63.5 |
| I think it is essential to discuss the prognosis with a patient, even if it is very poor. | 0.0 | 4.4 | 95.6 |
| Most patients' physical symptoms (eg, pain, shortness of breath, and nausea) are controlled better with hospice than with the care that they would receive in the hospital. | 0.0 | 21.7 | 78.3 |
| Most patients' emotional symptoms (eg, depression, anxiety) are controlled better with hospice than with the care they would receive in the hospital. | 0.0 | 8.7 | 91.3 |
| Hospice meets the needs of the family better than conventional care does. | 0.0 | 8.7 | 91.3 |
| Many patients who should receive hospice care do not receive hospice care. | 21.8 | 13.0 | 65.2 |
| Many patients would benefit if hospice care were initiated earlier in the course of their illness. | 0.0 | 9.1 | 90.9 |
| I feel knowledgeable enough to discuss palliative and hospice care with patients and families. | 19.2 | 38.5 | 42.3 |
Common Myths in Treating Patients with Terminal Illness
Myth 1. Treating cancer pain with opioids or analgesics causes addiction in 1 in 100 patients. Most physicians thought that addiction in patients treated for cancer pain with opioids or analgesics was much more common than it is. Almost half the respondents (48.1%) thought addiction occurred in 1 in 100 patients, and an additional 17.3% of respondents thought addiction occurred in 1 in 10 patients treated for cancer pain with opioids or analgesics. In contrast, the incidence of addiction in patients treated with opioids or analgesics for cancer pain is fewer than 1 in 1000 patients.28
Myth 2. When patients with cancer already receiving opioids for pain control complain of increasing pain, it most likely indicates opioid tolerance. Nearly 70% of respondents reported that the most likely reason for complaints of increased pain was tolerance to the opioid. However, the most likely reason for increased pain is increasing pathology of the cancer.27
Myth 3. The equipotent to 30 mg of oral morphine is 5 mg intravenous. More than half of respondents were inaccurate in their conversion of oral to intravenous (IV) morphine dosing, a common task of physicians caring for terminally ill patients. Almost half the physicians (44%) erroneously reported that 30 mg of oral morphine was equipotent to 5 mg or less morphine IV. However, in fact, 30 mg of oral morphine is equipotent to 10 mg of morphine IV.27
Myth 4. The most highly recommended drug for treating terminal dyspnea is a beta‐blocker, and the most appropriate drug for agitation due to anxiety is Haldol or morphine. Most respondents were able to identify the correct drugs; however, a sizable proportion of respondents (17.3%) erroneously responded that beta‐blockers and Lasix or beta‐blockers and corticosteroids were the best drugs for treating terminal dyspnea. About one‐fifth of respondents (21.6%) responded that Haldol or morphine was the recommended medication for treating agitation. In fact, opioids and benzodiazepines are the recommended drugs for treating terminal dyspnea,27 and the proper drug for treating agitation is lorazepam (Ativan).27
Myth 5. Patient life expectancy must be 2 months or less to be eligible for hospice. One‐quarter of respondents believed this to be true for inpatient hospice, and nearly 13.5% of respondents believe this to be true for home hospice. In fact, patients are eligible for hospice benefits earlier in the course of their illness. Under Medicare and most insurance policies, patients are eligible for hospice benefits as soon as their life expectancy is 6 months or less, not 2 months or less.27
Physician Beliefs about Caring for Patients with Terminal Illness
The physicians' beliefs about hospice were generally positive; the vast majority of respondents agreed or strongly agreed with the statement that physical and emotional symptoms of patients and family needs are better addressed with hospice than with the hospital care (Table 3). Most respondents also agreed that many patients do not receive hospice as they should and that hospice should be initiated earlier in the course of the illness. In addition, more than 80% of respondents believed patients and their families want their doctors to tell them the patient's life expectancy, and 95.6% of respondents thought it was essential to discuss prognosis, even a poor one, with the patient. Nevertheless, many respondents (65.3%) reported it was difficult to tell patients and their families that an illness was incurable. Furthermore, fewer than half the respondents (42.3%) believed they were knowledgeable enough to discuss hospice and palliative care with patients and their families.
In subgroup analyses comparing responses to knowledge and attitude items reported in Tables 2 and 3, we found no significant differences between hospitalists and any subgroup of residents by year of training or fellows, or between hospitalists and the full sample of residents and fellows. Because of the sample size, the statistical power for evaluating significance was limited in these exploratory subgroup analyses.
Among physicians who provided responses to the open‐ended question (n = 42) about how to enhance hospice referral rates and improve their timeliness, the most commonly reported suggestions were: (1) involve family members, not only patients, in discussions of hospice (38.1%), (2) have discussions about hospice earlier in the course of care with patients (26.2%), and (3) be clear with patients and families about the patient's prognosis (19.0%). Table 4 has a list of all responses provided to this question.
| Response | n | %* |
|---|---|---|
| ||
| Involving family members as well as patients in discussions of hospice | 16 | 38.1 |
| Having earlier discussion with patients | 11 | 26.2 |
| Being clear with patients and families about patient prognosis | 8 | 19.0 |
| Providing education about hospice to patients and families | 6 | 14.3 |
| Discussions of goals of care with patients and families | 6 | 14.3 |
| Involving social worker in discussions | 4 | 9.5 |
| Providing literature to patients and families about hospice | 3 | 7.1 |
| Having hospice representative available to provide education to patient and families | 2 | 4.8 |
DISCUSSION
This study demonstrated that, among hospitalists and residents, there are several misconceptions about fundamental aspects of caring for terminally ill patients. Given the potential importance of the role hospitalists play in improving the quality of inpatient care,1922 it is critical to identify and address these misconceptions. Additionally, physicians in this study indicated that more and earlier communication with patients and families about prognosis and about the option of hospice would be beneficial, but they themselves did not feel knowledgeable enough to discuss hospice and palliative care with patients and their families.
The nature of the misconceptions identified in this study shed light on the well‐documented phenomena of inadequate pain control24, 29 and poor symptom management2, 4 at the end of life. Having many of the erroneous beliefs apparent in this study may be consistent with providing less pain medication than needed and appropriate. For instance, many physicians believed that developing addiction to opioids used for cancer pain is more likely to occur than it really is, according to research evidence. It is extremely rare for these patients to become addicted to opioids or other analgesics (fewer than 1 in 1000 patients).28 In addition, most physicians believed that complaints of increased pain among patients receiving opioid therapy for pain control meant tolerance to the medication, a belief consistent with physician reluctance to prescribe more medication because it would lead to tolerance.28 In reality, the increased pain experienced in these situations is typically not a result of tolerance to the pain medication but to the cancer getting worse.27 Additionally, many physicians mistakenly decreased the dose of morphine in converting the route of administration from PO to IV, as is often done in hospitals. Such an error may be a contributing factor to the unintended undertreatment of pain in hospitals. Given the variability of cancer pain4 and the difference in time to peak effect depending on the route of administration,5 it is critical for physicians to understand proper dosing in order to effectively treat cancer pain. Furthermore, many physicians were incorrect about the recommended medications for dyspnea and for agitation, 2 symptoms that are prevalent among patients at the end of life.
The hospitalists and residents reported having very positive views about hospice, as is consistent with the literature.10, 30 However, many respondents indicated that patients who would have benefited from hospice did not receive it at all or only late in their illness. Physicians indicated that better communication with patients and families about hospice, prognosis, and goals of care would enhance appropriate use of hospice. While hospitalists and residents are in a position to initiate such discussions, they reported that these discussions were difficult for them. The challenge is how to promote what is necessary and valuable conversation with patients and families despite their difficulty, so that a realistic plan of care can be designed for all involved. Providing hospitalists and residents with evidence about what approaches are most effective in such discussions would be helpful to better prepare them for their roles in caring for hospitalized patients with terminal illness.
The results of this study have substantiated the need to enhance the education of hospitalists and resident physicians, who can play a vital role in improving the transition from hospital to hospice. Such education could take place as part of the residency experience or be embedded in various continuing medical education requirements that most states now have. The results of a recent national survey of hospitalists31 indicates they consider their palliative care training inadequate and feel ill prepared to care for patients with terminal illness. Our findings are consistent with those of that survey, highlighting information that is poorly understood by both residents and hospitalists. As hospitalists continue to play key roles in linking hospital to posthospital care,21 including hospice, there is greater opportunity to improve end‐of‐life care by expanding hospitalists' understanding of these issues.
Our findings should be interpreted in light of the study's limitations. First, this was an exploratory study, and the sample was modest in size. Nevertheless, the response rate was high: 85.2%. Second, we conducted the study in a single location; results may differ in other geographical areas. Last, we were unable to link reported knowledge and attitudes to patient experiences including quality of care or adequacy of pain control. Inadequate knowledge likely limits the quality of clinical practices, but the magnitude of this effect remains unknown and worthy of future study.
Despite these limitations, this study has contributed to the literature by identifying a set of misunderstandings or myths that may be common among hospitalists and residents who frequently care for hospitalized patients with terminal illness. Many of these misunderstandings were related to pain and symptom management, although some misunderstandings related to logistical issues such as hospice eligibility rules. Previous studies have described interventions to improve physicians' knowledge about palliative and end‐of‐life care practices at the undergraduate, graduate, and postgraduate levels.13 Our findings identified specific gaps in physicians' knowledge. Interventions aimed at closing these gaps might emphasize both specific clinical information about pain management and medication recommendations, and more general information about eligibility for hospice and best practices for communicating early with patients and family is needed to promote more effective care for patients with terminal illness being cared for in acute care settings.
As the use of hospitalists has become a widely accepted model of hospital care,32 ensuring their increased training and education in the care of patients with terminal illness is an important step in improving end‐of‐life care. Larger comparison studies are needed to identify differences in the practices and perspectives of hospitalists and residents and to target educational interventions to meet their particular needs. Further, conducting these studies at additional sites including those with established palliative care programs would be useful for identifying needs among a more diverse set of physicians involved in delivering end‐of‐life care.
APPENDIX
Survey on Hospice and End‐of‐Life Care
Survey ID _________________
Date ______________
DEMOGRAPHICS
What is your gender?
□ Male
□ Female
What year did you graduate from medical school? ___________
What is your primary specialty or area of practice?
□ Hospitalist
□ Oncology fellow
□ Oncology resident
□ Physician assistant
□ Other: _____________
KNOWLEDGE OF HOSPICE AND PALLIATIVE CARE PRACTICES
The incidence of psychological dependence (addiction) to opioids and analgesics when treating pain from cancer or other medical conditions is:
Common (1 in 10 patients)
Uncommon (1 in 100 patients)
Very rare (fewer than 1 in 1000 patients)
When a patient with cancer who is receiving opioids for pain complains of increasing pain, it most likely indicates:
Opioid tolerance
Increasing pathology of the cancer
Patient noncompliance
New onset of a different opioid‐resisting pain
In the pain patient receiving opioids, 30 mg of oral morphine is equipotent to _______________ of IV.
1mg
5 mg
10 mg
20 mg
The 2 classes of drugs most commonly recommended for treating terminal dyspnea are:
Beta‐blockers and Lasix
Opioids and benzodiazepines
Beta‐blockers and corticosteroids
Beta‐blockers and Singulair (montelukast)
A hospice patient whose agitation is due primarily to anxiety should be treated with:
Chlorpromazine
Haloperidol
Lorazepam
Morphine
ELIGIBILITY FOR HOSPICE CARE
Under the Medicare program, a physician must certify that the patient is expected to die within a specified time for the patients to be eligible for hospice services. To the best of your knowledge, patients become eligible for inpatient hospice care when they are expected to die in:
□ 2 Weeks
□ 6 Weeks
□ 2 Months
□ 6 Months
□ Other: ________________________
□ Don't know
To the best of your knowledge, patients are eligible for home hospice care when they are expected to die in:
□ 2 Weeks
□ 6 Weeks
□ 2 Months
□ 6 Months
□ Other: __________________________
□ Don't know
ATTITUDES ABOUT HOSPICE CARE 0
Following is a series of statements. Please state whether you strongly agree, agree, neither agree nor disagree, disagree, or strongly disagree with each statement. Strongly agree Strongly disagree 11) Most patients want me to tell them their life expectancy. 1 □ 2 □ 3 □ 4 □ 5 □ 12) Generally, family caregivers want me to tell them the patient's life expectancy. 1 □ 2 □ 3 □ 4 □ 5 □ 13) Telling the patient and family members that the patient's illness is incurable is difficult for me. 1 □ 2 □ 3 □ 4 □ 5 □ 14) I think it is essential to discuss the prognosis with a patient, even if it is very poor. 1 □ 2 □ 3 □ 4 □ 5 □ 15) Most patients' physical symptoms (eg, pain, shortness of breath, and nausea) are controlled better with hospice than with the care they would receive in the hospital. 1 □ 2 □ 3 □ 4 □ 5 □ 16) Most patients' emotional symptoms (eg, depression, anxiety) are controlled better with hospice than with the care they would receive in the hospital. 1 □ 2 □ 3 □ 4 □ 5 □ 17) Hospice care generally meets the needs of the family better than conventional care does. 1 □ 2 □ 3 □ 4 □ 5 □ 18) Many terminally ill patients who should receive hospice care do not receive hospice care. 1 □ 2 □ 3 □ 4 □ 5 □ 19) Many patients would benefit if hospice care were initiated earlier in the course of their illness. 1 □ 2 □ 3 □ 4 □ 5 □ 20) I feel knowledgeable enough to discuss palliative and hospice care with patients and families. 1 □ 2 □ 3 □ 4 □ 5 □ 21) What do you see as the primary ways to facilitate earlier initiation of hospice care for patients who are eligible? _____________________________________________________________________________________ ___________________________________________________________________________________________
- Institute of Medicine.Approaching Death.Washington, DC:National Academy Press;1997.
- SUPPORT Principle Investigators.A controlled trial to improve care for seriously ill hospitalized patients.JAMA.1995;274:1591–1598.
- ,,, et al.Improving the management of pain in hospitalized adults.Arch Intern Med.2006;166:1033–1039.
- .Interventions to manage symptoms at the end of life.J Palliat Med.2005;8(suppl 1):S88–S94.
- ,,, et al.Documentation of discussions about prognosis with terminally ill patients.Am J Med.2001;111:218–223.
- ,,.Discussing resuscitation preferences with patients: challenges and rewards.J Hosp Med.2006;1:231–249.
- ,,,,,.At the crossroads: making the transition to hospice.Palliat Support Care.2004;2:351–360.
- ,,,,,.Referral of terminally ill patients for hospice: frequency and correlates.J Palliat Care.2000;16(4):20–26.
- ,,.Hospice and primary care physicians: attitudes, knowledge, and barriers.Am J Hosp Palliat Care.2003;20(1):41–51.
- ,,.Physicians and hospice care: attitudes, knowledge, and referrals.J Palliat Med.2002;5(1):85–92.
- .Medical education in end‐of‐life care: the status of reform.J Palliat Med.2002;5(2):243–248.
- ,,.Improving palliative care.Ann Intern Med.1997;127(3):225–230.
- ,,,,,.Improving end‐of‐life care: internal medicine curriculum project—abstracts/progress reports.J Palliat Med.2001;4(1):75–102.
- ,,, et al.Improving processes of hospital care during the last hours of life.Arch Intern Med.2005;165:1722–1727.
- ,,, et al.How prevalent are hospital‐based palliative care programs? Status report and future directions.J Palliat Med.2001;4:315–324.
- ,,,,,.Evidence of improved knowledge and skills after an elective rotation in a hospice and palliative care program for internal medicine residents.Am J Hosp Palliat Care.2005;22(3):195–203.
- ,,,,,.Factors associated with palliative care knowledge among internal medicine house staff.J Palliat Care.2003;19:253–257.
- ,,.Unrestricted opiate administration for pain and suffering at the end of life: knowledge and attitudes as barriers to care.J Palliat Med.2006;9:873–883.
- ,.The impact of hospitalists on the cost and quality of inpatient care in the United States: a research synthesis.Med Care Res Rev.2005;62:379–406.
- ,,, et al.Effects of physician experience on costs and outcomes on an academic general medicine service: results of a trial of hospitalists.Ann Intern Med.2002;137:866–874.
- ,.Palliative care and the hospitalist: an opportunity for cross‐fertilization.Am J Med.2001;111 (9B):10S–14S.
- .The evolution of the hospitalist model in the United States.Med Clin North Am.2002;86:687–706.
- ,.The emerging role of “hospitalists” in the American health care system.N Engl J Med.1996;335:514–517.
- ,,, et al.Attitudes about care at the end of life among clinicians: a quick, reliable, and valid assessment instrument.J Palliat Care.2000;16(1):6–14.
- ,,,,,.Physicians' ratings of their knowledge, attitudes, and end‐of‐life‐care practices.Acad Med.2002;77:305–311.
- .Barriers to the physician decision to offer hospice as an option for terminal care.WMJ.1999;98(3):49–53.
- Doyle D,Hanks G,Cherny N,Calman K, eds.Oxford Textbook of Palliative Medicine.3rd ed.Oxford, UK:Oxford University Press;2004.
- ,.Controversies in the long‐term management of analgesic therapy in patients with advanced cancer.J Pain Symptom Manage.1990;5:307–319.
- .Use of opioids in the treatment of severe pain in terminally ill patients—dying should not be painful.Mayo Clin Proc.2003;78:1397–1401.
- ,.Attitude and self‐reported practice regarding hospice referral in a national sample of internists.J Palliat Med.1998;1:241–248.
- ,,,.Hospitalists' perceptions of their residency training needs: results of a national survey.Am J Med.2001;111:247–254.
- ,.The hospitalist movement 5 years later.JAMA.2002;287:487–494.
Shortcomings in the quality of care of hospitalized patients at the end of life, especially in the final days, are well documented.1, 2 Recent studies have highlighted inadequate pain and symptom control for hospitalized terminally ill patients,24 poor communication about treatment preferences,57 and limited or delayed referral for hospice care.810 Efforts to improve the quality of end‐of‐life care have been diverse, including increased educational programs,1113 development of palliative care units in hospitals,14, 15 and greater exposure to palliative care for physicians during residency training.16 Despite these efforts, studies assessing the attitudes and knowledge of physicians about hospice and palliative care continue to show deficits in knowledge about managing pain17, 18 as well as hospice policies and services.9
Among the interventions aimed at improving hospital care, the hospitalist movement has emerged as a model of care for improving the quality and cost efficiency of hospital care.1922 Because hospitalists spend substantial time on inpatient services,23 they are often involved in the care of patients with terminal illness, with potential to improve the quality of care that these patients receive while hospitalized. However, little is known about what specific knowledge and perspectives hospitalists and residents have about the care of patients with terminal illness. Although many studies have been conducted among physicians in private practice,9, 10, 2426 they have not focused on the knowledge, reported practices, and attitudes of hospitalists and residents concerning key aspects of end‐of‐life care and hospice. Such information can help to identify potential areas for improving knowledge and addressing common barriers highlighted in linking hospital and posthospital hospice care.
METHODS
Study Design and Sample
During 2006 we surveyed hospitalists and medical residents who were on their oncology rotation at a large academic medical center that did not have a hospital‐based palliative care unit in order to examine their knowledge, attitudes, and practices regarding terminally ill patients and hospice referrals. Hospitalists (n = 23) and medical residents (n = 29) made up a convenience sample of 52 physicians. The medical residents were completing their oncology rotation during the spring of 2006. The Institutional Review Board at Yale University School of Medicine approved the research protocol and verbal consent procedures.
Survey
The brief survey instrument (see Appendix) assessed physicians' knowledge and attitudes about and practices in caring for patients with terminal illness. The survey was adapted from previously published instruments8, 24 that have been shown24 to have good test‐retest reliability and construct validity. The survey contained 5 items pertaining to clinical knowledge about palliative care practices, including common symptoms and drug indications, doses, and side effects.27 An additional 2 items pertained to respondents' knowledge about nonclinical issues concerning eligibility rules for hospice,8 such as how a patient becomes eligible for hospice and whether Medicare benefits can be revoked or reinstated after hospice is elected. The survey also included 10 statements24 assessing physician attitudes about caring for patients with terminal illness. Responses, provided using a 5‐point Likert scale, were collapsed for reporting into a 3‐point scale of agree, neutral, and disagree. The instrument also included an open‐ended question asking physicians to specify what from their perspective was needed to ensure timely referral for hospice and palliative care.
Data Analysis
We used standard frequency analysis to describe the distribution of responses to the survey items. Based on an analysis of common erroneous answers to clinical knowledge questions, we identified several common myths prevalent among hospitalists and medicine residents. We also examined whether knowledge, reported practices, and attitudes differed significantly between the hospitalist and the resident samples using ANOVA or chi‐square statistics as appropriate. We used content analysis to summarize the open‐ended responses about potential ways to overcome what respondents perceived was underutilization of hospice.
RESULTS
Overview
The response rate for the survey was 85.2%. Almost half of the respondents (44.2%) were hospitalists (Table 1). The remaining respondents included first‐year (n = 9) and second‐ or third‐year (n = 16) residents or fellows (n = 4). Approximately 54% of the 52 respondents were female, and the majority (83%) had graduated from medical school between 2000 and 2005. Several common myths were apparent and pertained to essential areas of treating patients with terminal illness: pain control, symptom control, and eligibility for hospice (Table 2). Respondents generally had strong beliefs about caring for patients with terminal illness, and most agreed that many patients who would benefit from hospice either do not receive hospice or receive it only late in the course of their illness (Table 3).
| Characteristic | n | % |
|---|---|---|
| Sex | ||
| Female | 28 | 53.9% |
| Male | 24 | 46.1% |
| Years since graduation from medical school | ||
| 1‐2 Years | 26 | 56.5% |
| 3‐5 Years | 12 | 26.1% |
| >5 Years | 8 | 17.4% |
| Missing | 6 | |
| Physician type | ||
| Hospitalist | 23 | 44.2% |
| First‐year resident | 9 | 17.3% |
| Second‐ or third‐year resident | 16 | 30.8% |
| Fellow | 4 | 7.7% |
| Questions about hospice and palliative care practices | Response (%) |
|---|---|
| |
| The incidence of psychological dependence (addiction) to opioids and analgesics when treating pain from cancer or other medical conditions is: | |
| Common (1 in 10 patients) | 17.3 |
| Uncommon (1 in 100 patients) | 48.1 |
| Very rare (fewer than 1 in 1000 patients) | 34.6 |
| When a patient with cancer who is receiving opioids for pain complains of increasing pain, it most likely indicates: | |
| Opioid tolerance | 69.2 |
| Increasing pathology of the cancer | 26.9 |
| Patient noncompliance | 0.0 |
| New onset of a different opioid‐resisting pain | 3.9 |
| In the pain patient receiving opioids, 30 mg of oral morphine is equipotent to of IV morphine | |
| 1 mg | 4.0 |
| 5 mg | 40.0 |
| 10 mg | 56.0 |
| 20 mg | 0.0 |
| The 2 classes of drugs most commonly recommended for treating terminal dyspnea are: | |
| Beta‐blockers and Lasix | 7.7 |
| Opioids and benzodiazepines | 82.7 |
| Beta‐blockers and corticosteroids | 9.6 |
| Beta‐blockers and Singulair (montelukast) | 0.0 |
| A hospice patient whose agitation is primarily from anxiety should be treated with: | |
| Chlorpromazine (thorazine) | 0.0 |
| Haloperidol | 21.6 |
| Lorazepam (Ativan) | 76.4 |
| Morphine | 2.0 |
| Questions about eligibility for hospice care | Response (%) |
| Under the Medicare program, a physician must certify that the patient is expected to die within a specified time for the patients to be eligible for hospice services. To the best of your knowledge, patients become eligible for inpatient hospice care when they are expected to die in: | |
| 2 Weeks | 5.8 |
| 6 Weeks | 9.6 |
| 2 Months | 9.6 |
| 6 Months | 69.2 |
| Other | 1.9 |
| Don't know | 3.8 |
| To the best of your knowledge, patients become eligible for home hospice care when they are expected to die in: | |
| 2 Weeks | 0.0 |
| 6 Weeks | 5.8 |
| 2 Months | 7.7 |
| 6 Months | 73.1 |
| Other | 0.0 |
| Don't know | 13.4 |
| Beliefs | Disagree (%) | Neutral (%) | Agree (%) |
|---|---|---|---|
| Most patients want me to tell them their life‐expectancy. | 0.0 | 17.4 | 82.6 |
| Generally, family caregivers want me to tell them the patient's life expectancy. | 4.4 | 8.7 | 86.9 |
| Telling the patient and family members that the patient's illness is incurable is difficult for me. | 23.0 | 13.5 | 63.5 |
| I think it is essential to discuss the prognosis with a patient, even if it is very poor. | 0.0 | 4.4 | 95.6 |
| Most patients' physical symptoms (eg, pain, shortness of breath, and nausea) are controlled better with hospice than with the care that they would receive in the hospital. | 0.0 | 21.7 | 78.3 |
| Most patients' emotional symptoms (eg, depression, anxiety) are controlled better with hospice than with the care they would receive in the hospital. | 0.0 | 8.7 | 91.3 |
| Hospice meets the needs of the family better than conventional care does. | 0.0 | 8.7 | 91.3 |
| Many patients who should receive hospice care do not receive hospice care. | 21.8 | 13.0 | 65.2 |
| Many patients would benefit if hospice care were initiated earlier in the course of their illness. | 0.0 | 9.1 | 90.9 |
| I feel knowledgeable enough to discuss palliative and hospice care with patients and families. | 19.2 | 38.5 | 42.3 |
Common Myths in Treating Patients with Terminal Illness
Myth 1. Treating cancer pain with opioids or analgesics causes addiction in 1 in 100 patients. Most physicians thought that addiction in patients treated for cancer pain with opioids or analgesics was much more common than it is. Almost half the respondents (48.1%) thought addiction occurred in 1 in 100 patients, and an additional 17.3% of respondents thought addiction occurred in 1 in 10 patients treated for cancer pain with opioids or analgesics. In contrast, the incidence of addiction in patients treated with opioids or analgesics for cancer pain is fewer than 1 in 1000 patients.28
Myth 2. When patients with cancer already receiving opioids for pain control complain of increasing pain, it most likely indicates opioid tolerance. Nearly 70% of respondents reported that the most likely reason for complaints of increased pain was tolerance to the opioid. However, the most likely reason for increased pain is increasing pathology of the cancer.27
Myth 3. The equipotent to 30 mg of oral morphine is 5 mg intravenous. More than half of respondents were inaccurate in their conversion of oral to intravenous (IV) morphine dosing, a common task of physicians caring for terminally ill patients. Almost half the physicians (44%) erroneously reported that 30 mg of oral morphine was equipotent to 5 mg or less morphine IV. However, in fact, 30 mg of oral morphine is equipotent to 10 mg of morphine IV.27
Myth 4. The most highly recommended drug for treating terminal dyspnea is a beta‐blocker, and the most appropriate drug for agitation due to anxiety is Haldol or morphine. Most respondents were able to identify the correct drugs; however, a sizable proportion of respondents (17.3%) erroneously responded that beta‐blockers and Lasix or beta‐blockers and corticosteroids were the best drugs for treating terminal dyspnea. About one‐fifth of respondents (21.6%) responded that Haldol or morphine was the recommended medication for treating agitation. In fact, opioids and benzodiazepines are the recommended drugs for treating terminal dyspnea,27 and the proper drug for treating agitation is lorazepam (Ativan).27
Myth 5. Patient life expectancy must be 2 months or less to be eligible for hospice. One‐quarter of respondents believed this to be true for inpatient hospice, and nearly 13.5% of respondents believe this to be true for home hospice. In fact, patients are eligible for hospice benefits earlier in the course of their illness. Under Medicare and most insurance policies, patients are eligible for hospice benefits as soon as their life expectancy is 6 months or less, not 2 months or less.27
Physician Beliefs about Caring for Patients with Terminal Illness
The physicians' beliefs about hospice were generally positive; the vast majority of respondents agreed or strongly agreed with the statement that physical and emotional symptoms of patients and family needs are better addressed with hospice than with the hospital care (Table 3). Most respondents also agreed that many patients do not receive hospice as they should and that hospice should be initiated earlier in the course of the illness. In addition, more than 80% of respondents believed patients and their families want their doctors to tell them the patient's life expectancy, and 95.6% of respondents thought it was essential to discuss prognosis, even a poor one, with the patient. Nevertheless, many respondents (65.3%) reported it was difficult to tell patients and their families that an illness was incurable. Furthermore, fewer than half the respondents (42.3%) believed they were knowledgeable enough to discuss hospice and palliative care with patients and their families.
In subgroup analyses comparing responses to knowledge and attitude items reported in Tables 2 and 3, we found no significant differences between hospitalists and any subgroup of residents by year of training or fellows, or between hospitalists and the full sample of residents and fellows. Because of the sample size, the statistical power for evaluating significance was limited in these exploratory subgroup analyses.
Among physicians who provided responses to the open‐ended question (n = 42) about how to enhance hospice referral rates and improve their timeliness, the most commonly reported suggestions were: (1) involve family members, not only patients, in discussions of hospice (38.1%), (2) have discussions about hospice earlier in the course of care with patients (26.2%), and (3) be clear with patients and families about the patient's prognosis (19.0%). Table 4 has a list of all responses provided to this question.
| Response | n | %* |
|---|---|---|
| ||
| Involving family members as well as patients in discussions of hospice | 16 | 38.1 |
| Having earlier discussion with patients | 11 | 26.2 |
| Being clear with patients and families about patient prognosis | 8 | 19.0 |
| Providing education about hospice to patients and families | 6 | 14.3 |
| Discussions of goals of care with patients and families | 6 | 14.3 |
| Involving social worker in discussions | 4 | 9.5 |
| Providing literature to patients and families about hospice | 3 | 7.1 |
| Having hospice representative available to provide education to patient and families | 2 | 4.8 |
DISCUSSION
This study demonstrated that, among hospitalists and residents, there are several misconceptions about fundamental aspects of caring for terminally ill patients. Given the potential importance of the role hospitalists play in improving the quality of inpatient care,1922 it is critical to identify and address these misconceptions. Additionally, physicians in this study indicated that more and earlier communication with patients and families about prognosis and about the option of hospice would be beneficial, but they themselves did not feel knowledgeable enough to discuss hospice and palliative care with patients and their families.
The nature of the misconceptions identified in this study shed light on the well‐documented phenomena of inadequate pain control24, 29 and poor symptom management2, 4 at the end of life. Having many of the erroneous beliefs apparent in this study may be consistent with providing less pain medication than needed and appropriate. For instance, many physicians believed that developing addiction to opioids used for cancer pain is more likely to occur than it really is, according to research evidence. It is extremely rare for these patients to become addicted to opioids or other analgesics (fewer than 1 in 1000 patients).28 In addition, most physicians believed that complaints of increased pain among patients receiving opioid therapy for pain control meant tolerance to the medication, a belief consistent with physician reluctance to prescribe more medication because it would lead to tolerance.28 In reality, the increased pain experienced in these situations is typically not a result of tolerance to the pain medication but to the cancer getting worse.27 Additionally, many physicians mistakenly decreased the dose of morphine in converting the route of administration from PO to IV, as is often done in hospitals. Such an error may be a contributing factor to the unintended undertreatment of pain in hospitals. Given the variability of cancer pain4 and the difference in time to peak effect depending on the route of administration,5 it is critical for physicians to understand proper dosing in order to effectively treat cancer pain. Furthermore, many physicians were incorrect about the recommended medications for dyspnea and for agitation, 2 symptoms that are prevalent among patients at the end of life.
The hospitalists and residents reported having very positive views about hospice, as is consistent with the literature.10, 30 However, many respondents indicated that patients who would have benefited from hospice did not receive it at all or only late in their illness. Physicians indicated that better communication with patients and families about hospice, prognosis, and goals of care would enhance appropriate use of hospice. While hospitalists and residents are in a position to initiate such discussions, they reported that these discussions were difficult for them. The challenge is how to promote what is necessary and valuable conversation with patients and families despite their difficulty, so that a realistic plan of care can be designed for all involved. Providing hospitalists and residents with evidence about what approaches are most effective in such discussions would be helpful to better prepare them for their roles in caring for hospitalized patients with terminal illness.
The results of this study have substantiated the need to enhance the education of hospitalists and resident physicians, who can play a vital role in improving the transition from hospital to hospice. Such education could take place as part of the residency experience or be embedded in various continuing medical education requirements that most states now have. The results of a recent national survey of hospitalists31 indicates they consider their palliative care training inadequate and feel ill prepared to care for patients with terminal illness. Our findings are consistent with those of that survey, highlighting information that is poorly understood by both residents and hospitalists. As hospitalists continue to play key roles in linking hospital to posthospital care,21 including hospice, there is greater opportunity to improve end‐of‐life care by expanding hospitalists' understanding of these issues.
Our findings should be interpreted in light of the study's limitations. First, this was an exploratory study, and the sample was modest in size. Nevertheless, the response rate was high: 85.2%. Second, we conducted the study in a single location; results may differ in other geographical areas. Last, we were unable to link reported knowledge and attitudes to patient experiences including quality of care or adequacy of pain control. Inadequate knowledge likely limits the quality of clinical practices, but the magnitude of this effect remains unknown and worthy of future study.
Despite these limitations, this study has contributed to the literature by identifying a set of misunderstandings or myths that may be common among hospitalists and residents who frequently care for hospitalized patients with terminal illness. Many of these misunderstandings were related to pain and symptom management, although some misunderstandings related to logistical issues such as hospice eligibility rules. Previous studies have described interventions to improve physicians' knowledge about palliative and end‐of‐life care practices at the undergraduate, graduate, and postgraduate levels.13 Our findings identified specific gaps in physicians' knowledge. Interventions aimed at closing these gaps might emphasize both specific clinical information about pain management and medication recommendations, and more general information about eligibility for hospice and best practices for communicating early with patients and family is needed to promote more effective care for patients with terminal illness being cared for in acute care settings.
As the use of hospitalists has become a widely accepted model of hospital care,32 ensuring their increased training and education in the care of patients with terminal illness is an important step in improving end‐of‐life care. Larger comparison studies are needed to identify differences in the practices and perspectives of hospitalists and residents and to target educational interventions to meet their particular needs. Further, conducting these studies at additional sites including those with established palliative care programs would be useful for identifying needs among a more diverse set of physicians involved in delivering end‐of‐life care.
APPENDIX
Survey on Hospice and End‐of‐Life Care
Survey ID _________________
Date ______________
DEMOGRAPHICS
What is your gender?
□ Male
□ Female
What year did you graduate from medical school? ___________
What is your primary specialty or area of practice?
□ Hospitalist
□ Oncology fellow
□ Oncology resident
□ Physician assistant
□ Other: _____________
KNOWLEDGE OF HOSPICE AND PALLIATIVE CARE PRACTICES
The incidence of psychological dependence (addiction) to opioids and analgesics when treating pain from cancer or other medical conditions is:
Common (1 in 10 patients)
Uncommon (1 in 100 patients)
Very rare (fewer than 1 in 1000 patients)
When a patient with cancer who is receiving opioids for pain complains of increasing pain, it most likely indicates:
Opioid tolerance
Increasing pathology of the cancer
Patient noncompliance
New onset of a different opioid‐resisting pain
In the pain patient receiving opioids, 30 mg of oral morphine is equipotent to _______________ of IV.
1mg
5 mg
10 mg
20 mg
The 2 classes of drugs most commonly recommended for treating terminal dyspnea are:
Beta‐blockers and Lasix
Opioids and benzodiazepines
Beta‐blockers and corticosteroids
Beta‐blockers and Singulair (montelukast)
A hospice patient whose agitation is due primarily to anxiety should be treated with:
Chlorpromazine
Haloperidol
Lorazepam
Morphine
ELIGIBILITY FOR HOSPICE CARE
Under the Medicare program, a physician must certify that the patient is expected to die within a specified time for the patients to be eligible for hospice services. To the best of your knowledge, patients become eligible for inpatient hospice care when they are expected to die in:
□ 2 Weeks
□ 6 Weeks
□ 2 Months
□ 6 Months
□ Other: ________________________
□ Don't know
To the best of your knowledge, patients are eligible for home hospice care when they are expected to die in:
□ 2 Weeks
□ 6 Weeks
□ 2 Months
□ 6 Months
□ Other: __________________________
□ Don't know
ATTITUDES ABOUT HOSPICE CARE 0
Following is a series of statements. Please state whether you strongly agree, agree, neither agree nor disagree, disagree, or strongly disagree with each statement. Strongly agree Strongly disagree 11) Most patients want me to tell them their life expectancy. 1 □ 2 □ 3 □ 4 □ 5 □ 12) Generally, family caregivers want me to tell them the patient's life expectancy. 1 □ 2 □ 3 □ 4 □ 5 □ 13) Telling the patient and family members that the patient's illness is incurable is difficult for me. 1 □ 2 □ 3 □ 4 □ 5 □ 14) I think it is essential to discuss the prognosis with a patient, even if it is very poor. 1 □ 2 □ 3 □ 4 □ 5 □ 15) Most patients' physical symptoms (eg, pain, shortness of breath, and nausea) are controlled better with hospice than with the care they would receive in the hospital. 1 □ 2 □ 3 □ 4 □ 5 □ 16) Most patients' emotional symptoms (eg, depression, anxiety) are controlled better with hospice than with the care they would receive in the hospital. 1 □ 2 □ 3 □ 4 □ 5 □ 17) Hospice care generally meets the needs of the family better than conventional care does. 1 □ 2 □ 3 □ 4 □ 5 □ 18) Many terminally ill patients who should receive hospice care do not receive hospice care. 1 □ 2 □ 3 □ 4 □ 5 □ 19) Many patients would benefit if hospice care were initiated earlier in the course of their illness. 1 □ 2 □ 3 □ 4 □ 5 □ 20) I feel knowledgeable enough to discuss palliative and hospice care with patients and families. 1 □ 2 □ 3 □ 4 □ 5 □ 21) What do you see as the primary ways to facilitate earlier initiation of hospice care for patients who are eligible? _____________________________________________________________________________________ ___________________________________________________________________________________________
- Institute of Medicine.Approaching Death.Washington, DC:National Academy Press;1997.
- SUPPORT Principle Investigators.A controlled trial to improve care for seriously ill hospitalized patients.JAMA.1995;274:1591–1598.
- ,,, et al.Improving the management of pain in hospitalized adults.Arch Intern Med.2006;166:1033–1039.
- .Interventions to manage symptoms at the end of life.J Palliat Med.2005;8(suppl 1):S88–S94.
- ,,, et al.Documentation of discussions about prognosis with terminally ill patients.Am J Med.2001;111:218–223.
- ,,.Discussing resuscitation preferences with patients: challenges and rewards.J Hosp Med.2006;1:231–249.
- ,,,,,.At the crossroads: making the transition to hospice.Palliat Support Care.2004;2:351–360.
- ,,,,,.Referral of terminally ill patients for hospice: frequency and correlates.J Palliat Care.2000;16(4):20–26.
- ,,.Hospice and primary care physicians: attitudes, knowledge, and barriers.Am J Hosp Palliat Care.2003;20(1):41–51.
- ,,.Physicians and hospice care: attitudes, knowledge, and referrals.J Palliat Med.2002;5(1):85–92.
- .Medical education in end‐of‐life care: the status of reform.J Palliat Med.2002;5(2):243–248.
- ,,.Improving palliative care.Ann Intern Med.1997;127(3):225–230.
- ,,,,,.Improving end‐of‐life care: internal medicine curriculum project—abstracts/progress reports.J Palliat Med.2001;4(1):75–102.
- ,,, et al.Improving processes of hospital care during the last hours of life.Arch Intern Med.2005;165:1722–1727.
- ,,, et al.How prevalent are hospital‐based palliative care programs? Status report and future directions.J Palliat Med.2001;4:315–324.
- ,,,,,.Evidence of improved knowledge and skills after an elective rotation in a hospice and palliative care program for internal medicine residents.Am J Hosp Palliat Care.2005;22(3):195–203.
- ,,,,,.Factors associated with palliative care knowledge among internal medicine house staff.J Palliat Care.2003;19:253–257.
- ,,.Unrestricted opiate administration for pain and suffering at the end of life: knowledge and attitudes as barriers to care.J Palliat Med.2006;9:873–883.
- ,.The impact of hospitalists on the cost and quality of inpatient care in the United States: a research synthesis.Med Care Res Rev.2005;62:379–406.
- ,,, et al.Effects of physician experience on costs and outcomes on an academic general medicine service: results of a trial of hospitalists.Ann Intern Med.2002;137:866–874.
- ,.Palliative care and the hospitalist: an opportunity for cross‐fertilization.Am J Med.2001;111 (9B):10S–14S.
- .The evolution of the hospitalist model in the United States.Med Clin North Am.2002;86:687–706.
- ,.The emerging role of “hospitalists” in the American health care system.N Engl J Med.1996;335:514–517.
- ,,, et al.Attitudes about care at the end of life among clinicians: a quick, reliable, and valid assessment instrument.J Palliat Care.2000;16(1):6–14.
- ,,,,,.Physicians' ratings of their knowledge, attitudes, and end‐of‐life‐care practices.Acad Med.2002;77:305–311.
- .Barriers to the physician decision to offer hospice as an option for terminal care.WMJ.1999;98(3):49–53.
- Doyle D,Hanks G,Cherny N,Calman K, eds.Oxford Textbook of Palliative Medicine.3rd ed.Oxford, UK:Oxford University Press;2004.
- ,.Controversies in the long‐term management of analgesic therapy in patients with advanced cancer.J Pain Symptom Manage.1990;5:307–319.
- .Use of opioids in the treatment of severe pain in terminally ill patients—dying should not be painful.Mayo Clin Proc.2003;78:1397–1401.
- ,.Attitude and self‐reported practice regarding hospice referral in a national sample of internists.J Palliat Med.1998;1:241–248.
- ,,,.Hospitalists' perceptions of their residency training needs: results of a national survey.Am J Med.2001;111:247–254.
- ,.The hospitalist movement 5 years later.JAMA.2002;287:487–494.
Copyright © 2007 Society of Hospital Medicine
Editorial / Kutner
Communication, palliative care, and patient safety have been identified by the Society of Hospital Medicine as core competencies in hospital medicine. Effective communication is recognized as being central to the role of the hospitalist to promote efficient, safe, and high quality care.1 Hospitalists are increasingly recognized as having a central role in initiatives to improve palliative care for hospitalized patients and their families24 and have a vital role in leading and participating in interventions to mitigate system and process failures that affect patient safety.1 The obligation of the hospitalist to assure safe, quality care for hospitalized people with advanced illness extends from direct patient care to advocacy for systems that facilitate the provision of such care.
Four articles in this issue of the Journal of Hospital Medicine provide complementary perspectives on these crucial roles of the hospitalist. Cherlin and colleagues describe findings from a survey of hospitalists and medical residents regarding their knowledge, attitudes, and practices relative to caring for patients with terminal illness. The article identifies misperceptions related to core components of quality palliative care: pain and symptom control, hospice eligibility, and communication about prognosis and hospice and palliative care.5 Although this study was conducted at only a single academic medical center and certainly deserves to be repeated in an expanded and more representative sample, it clearly identifies deficits in core components of quality care for persons with advanced illness. The article by Minichiello and colleagues provides practical guidance and resources for addressing one of the deficits identified: communicating a poor prognosis, or bad news.6
Pain and symptom management and communication are commonly recognized aspects of quality care for persons with advanced illness. Less often appreciated are the significant threats to patient safety and medical errors that occur in the care of this vulnerable population.79 Potential errors include failure of a planned action to be completed as intended (ie, not following advance directives) and failure to treat symptoms adequately. The original research article and accompanying images discussion by Sehgal and colleagues serve as a call to action to both recognize and address the potentially significant patient safety issue related to the use of color‐coded wristbands, particularly variation in color used by different hospitals to designate do not resuscitate status.10, 11 What is exciting about this sequence of articles is that they describe opportunities for improvement and provide potential solutions. We have to be aware that there is a problem in order to initiate change. Hospitalists are in an a prime position to both identify these potential critical issues and effect the necessary changes to facilitate our ability to provide safe, effective care to our patients with advanced illness.
Palliative care is increasingly being accepted as a means for improving care for persons with advanced illness. The National Consensus Project Clinical Practice Guidelines for Quality Palliative Care, released in 2004, was endorsed by the National Quality Forum and incorporated into its Framework for Hospice and Palliative Care in 2007.12, 13 The Joint Commission (TJC; previously known as JCAHO) is developing a Health Care Services Certification Program for palliative care services modeled on existing programs for diabetes and stroke care, to take effect in 2008.14 Newsweek featured palliative care in its August 2006 issue focused on Fixing America's Hospitals.15 US News and World Report has included hospice and palliative care indicators in its ranking of America's Best Hospitals since 2002.16 There has been significant recent growth in hospital‐based palliative care programs, with 1250 hospitals reporting palliative care programs in 2005, an increase of almost 100% over 2000. Seventy percent of U.S. hospitals with more than 250 beds report having a palliative care program.17
Although hospital‐based palliative care programs are increasing, it is the obligation of all hospitalists who care for an ill, often elderly population to assure that all hospitalized patients with advanced illness receive safe, quality care while hospitalized. This includes avoiding medical errors such as inappropriate resuscitation attempts because of miscommunication of do‐not‐resuscitate orders or advance directives, as well as minimizing distress, maximizing comfort, and addressing informational and psychosocial support needs. As evidenced by the 4 articles in this issue of the Journal of Hospital Medicine, we need to make safe, effective care for people with advanced illness a priority, then implement appropriate training and education and create systems that assure delivery of quality care.
- ,,,,.The core competencies in hospital medicine: a framework for curriculum development.J Hosp Med.2006;1:1–67.
- ,.Palliative care and the hospitalist: an opportunity for cross‐fertilization.Am J Med.2001;111:10S–14S.
- .Palliative care and hospitalists: a partnership for hope.J Hosp Med.2006;1:5–6.
- .Palliative Care in Hospitals.J Hosp Med.2006;1:21–28.
- ,,,,,.Common myths about caring for patients with terminal illness: opportunities to improve care in the hospital setting.J Hosp Med.2007;2:357–365.
- ,, andBreaking bad news: a practical approach for the hospitalist.J Hosp Med.2007;2:415–421.
- ,.Patients with eventually fatal chronic illness: their importance within a national research agenda on improving patient safety and reducing medical errors.J Palliat Med.2001;4:325–332.
- ,.Advance care planning for fatal chronic illness: avoiding commonplace errors and unwarranted suffering.Ann Intern Med.2003;138:812–818.
- ,.Mortality as a measure of quality: implications for palliative and end‐of‐life care.JAMA.2007;298:802–804.
- ,.Color‐coded wristbands: promoting safety or confusion?J Hosp Med.2007;2:445.
- ,.Identification of inpatient DNR status: a safety hazard begging for standardization.J Hosp Med.2007;2:366–371.
- National Consensus Project for Quality Palliative Care. Clinical Practice Guidelines for Quality Palliative Care. Available at: http://www.nationalconsensusproject.org. Accessed August 26,2007.
- National Quality Forum. Available at: Available at: http://www.qualityforum.org. Accessed August 25,2007.
- Joint Commission for Accreditation of Health Care Organizations. Available at: http://www.jointcommission.org. Accessed August 26,2007.
- .Special Care at the End of Life.Newsweek. October 16,2006. Available at: http://www.msnbc.msn.com/id/15175919/site/newsweek/page/0/. Accessed September 22,year="2007"2007.
- U.S. News and World Report America's Best Hospitals 2007 Methodology. Available at: http://health.usnews.com/usnews/health/best‐hospitals/methodology_report.pdf. Accessed September 22,2007.
- Center to Advance Palliative Care (CAPC). Available at: http://www.capc.org. Accessed August 26,2007.
Communication, palliative care, and patient safety have been identified by the Society of Hospital Medicine as core competencies in hospital medicine. Effective communication is recognized as being central to the role of the hospitalist to promote efficient, safe, and high quality care.1 Hospitalists are increasingly recognized as having a central role in initiatives to improve palliative care for hospitalized patients and their families24 and have a vital role in leading and participating in interventions to mitigate system and process failures that affect patient safety.1 The obligation of the hospitalist to assure safe, quality care for hospitalized people with advanced illness extends from direct patient care to advocacy for systems that facilitate the provision of such care.
Four articles in this issue of the Journal of Hospital Medicine provide complementary perspectives on these crucial roles of the hospitalist. Cherlin and colleagues describe findings from a survey of hospitalists and medical residents regarding their knowledge, attitudes, and practices relative to caring for patients with terminal illness. The article identifies misperceptions related to core components of quality palliative care: pain and symptom control, hospice eligibility, and communication about prognosis and hospice and palliative care.5 Although this study was conducted at only a single academic medical center and certainly deserves to be repeated in an expanded and more representative sample, it clearly identifies deficits in core components of quality care for persons with advanced illness. The article by Minichiello and colleagues provides practical guidance and resources for addressing one of the deficits identified: communicating a poor prognosis, or bad news.6
Pain and symptom management and communication are commonly recognized aspects of quality care for persons with advanced illness. Less often appreciated are the significant threats to patient safety and medical errors that occur in the care of this vulnerable population.79 Potential errors include failure of a planned action to be completed as intended (ie, not following advance directives) and failure to treat symptoms adequately. The original research article and accompanying images discussion by Sehgal and colleagues serve as a call to action to both recognize and address the potentially significant patient safety issue related to the use of color‐coded wristbands, particularly variation in color used by different hospitals to designate do not resuscitate status.10, 11 What is exciting about this sequence of articles is that they describe opportunities for improvement and provide potential solutions. We have to be aware that there is a problem in order to initiate change. Hospitalists are in an a prime position to both identify these potential critical issues and effect the necessary changes to facilitate our ability to provide safe, effective care to our patients with advanced illness.
Palliative care is increasingly being accepted as a means for improving care for persons with advanced illness. The National Consensus Project Clinical Practice Guidelines for Quality Palliative Care, released in 2004, was endorsed by the National Quality Forum and incorporated into its Framework for Hospice and Palliative Care in 2007.12, 13 The Joint Commission (TJC; previously known as JCAHO) is developing a Health Care Services Certification Program for palliative care services modeled on existing programs for diabetes and stroke care, to take effect in 2008.14 Newsweek featured palliative care in its August 2006 issue focused on Fixing America's Hospitals.15 US News and World Report has included hospice and palliative care indicators in its ranking of America's Best Hospitals since 2002.16 There has been significant recent growth in hospital‐based palliative care programs, with 1250 hospitals reporting palliative care programs in 2005, an increase of almost 100% over 2000. Seventy percent of U.S. hospitals with more than 250 beds report having a palliative care program.17
Although hospital‐based palliative care programs are increasing, it is the obligation of all hospitalists who care for an ill, often elderly population to assure that all hospitalized patients with advanced illness receive safe, quality care while hospitalized. This includes avoiding medical errors such as inappropriate resuscitation attempts because of miscommunication of do‐not‐resuscitate orders or advance directives, as well as minimizing distress, maximizing comfort, and addressing informational and psychosocial support needs. As evidenced by the 4 articles in this issue of the Journal of Hospital Medicine, we need to make safe, effective care for people with advanced illness a priority, then implement appropriate training and education and create systems that assure delivery of quality care.
- ,,,,.The core competencies in hospital medicine: a framework for curriculum development.J Hosp Med.2006;1:1–67.
- ,.Palliative care and the hospitalist: an opportunity for cross‐fertilization.Am J Med.2001;111:10S–14S.
- .Palliative care and hospitalists: a partnership for hope.J Hosp Med.2006;1:5–6.
- .Palliative Care in Hospitals.J Hosp Med.2006;1:21–28.
- ,,,,,.Common myths about caring for patients with terminal illness: opportunities to improve care in the hospital setting.J Hosp Med.2007;2:357–365.
- ,, andBreaking bad news: a practical approach for the hospitalist.J Hosp Med.2007;2:415–421.
- ,.Patients with eventually fatal chronic illness: their importance within a national research agenda on improving patient safety and reducing medical errors.J Palliat Med.2001;4:325–332.
- ,.Advance care planning for fatal chronic illness: avoiding commonplace errors and unwarranted suffering.Ann Intern Med.2003;138:812–818.
- ,.Mortality as a measure of quality: implications for palliative and end‐of‐life care.JAMA.2007;298:802–804.
- ,.Color‐coded wristbands: promoting safety or confusion?J Hosp Med.2007;2:445.
- ,.Identification of inpatient DNR status: a safety hazard begging for standardization.J Hosp Med.2007;2:366–371.
- National Consensus Project for Quality Palliative Care. Clinical Practice Guidelines for Quality Palliative Care. Available at: http://www.nationalconsensusproject.org. Accessed August 26,2007.
- National Quality Forum. Available at: Available at: http://www.qualityforum.org. Accessed August 25,2007.
- Joint Commission for Accreditation of Health Care Organizations. Available at: http://www.jointcommission.org. Accessed August 26,2007.
- .Special Care at the End of Life.Newsweek. October 16,2006. Available at: http://www.msnbc.msn.com/id/15175919/site/newsweek/page/0/. Accessed September 22,year="2007"2007.
- U.S. News and World Report America's Best Hospitals 2007 Methodology. Available at: http://health.usnews.com/usnews/health/best‐hospitals/methodology_report.pdf. Accessed September 22,2007.
- Center to Advance Palliative Care (CAPC). Available at: http://www.capc.org. Accessed August 26,2007.
Play by the Rules

How does your hospitalist group make decisions on important issues? There are many reasonable approaches. The best method will vary significantly depending on the group’s size and whether the doctors own their own private practice or are employees of a hospital or large multisite private hospitalist group.
Because many doctors are drawn to the profession in part seeking autonomy and independence, there is often a tension between their desire to make many decisions about business and practice operations independently and the need to set aside some personal interests in order for the group to function well. This can become apparent when the group reaches an agreement regarding a difficult issue for which there are different points of view.
Consider a hospitalist group made up of internists occasionally asked to admit teenagers younger than 17. There might be a variety of opinions about whether this is appropriate, but it will be best for everyone in the group to follow the same policy. If the majority decision is that it is reasonable to admit patients as long as they’re post-pubertal, everyone in the group should abide by this policy.
But when called by the emergency department about such a patient, a dissenting hospitalist might feel entitled to decline the admission despite the group’s decision. For this doctor, autonomy trumps cohesive group functioning.
The best approach to individual doctors not feeling bound by the group’s decisions is complex and will vary depending on the situation. But it can be mitigated by ensuring that the group has a clear governance structure and method for reaching controversial decisions.
Group Size Matters
A look at hospitalist groups of varying sizes illustrates the growing complexity of decision-making processes.
Small groups (eight or fewer individuals): Hospitalist groups nearly always start with a small number of doctors (often between one and three at the group’s inception) and find little need for a formal governance structure. They tend to make all important decisions based on consensus.
One risk of making decisions by consensus is that the group may be limited by the lowest common denominator. Even if most doctors in the group want to change something to avoid disadvantaging a doctor with a different point of view, the group may be held back and not make the change. In essence, the group can be ruled by the minority. This may not happen often, and as long as the group keeps this risk in mind it is usually fine to operate on consensus.
Medium-size groups (nine-14): A group this size probably needs to acknowledge that it will be unable to reach consensus on a number of issues and will need a voting system. It can be uncomfortable to jump from a culture of consensus to one of majority rule because the latter means there will be winners and losers. A clear set of rules or bylaws can increase the likelihood that those on the losing end of the issue will comply with the majority.
Large groups (more than 14): A large group usuallys face more complex decisions and has a wider range of opinions. Meetings may drag on as an issue is debated and all members have their say.
For this reason, large groups should consider forming a small executive committee consisting of the group’s leader and several representatives elected by a vote of the whole group. This can be a much more efficient way for the group to reach decisions. The executive committee researches issues and forms recommendations for the whole group. For some issues it might be reasonable for the executive committee’s decisions to be final. For others, the decisions of the executive committee might be presented to the whole group as a recommendation and put to a vote of all members.
It is important for a group of any size to have a clearly designated leader to oversee its operations and meetings and represent the group to external constituents. It’s critical that all groups have a culture of physician ownership even if they are contractual employees of another entity, such as the hospital.
It is best if the leader is not viewed as a boss others work for. That will lead to an employee—not an owner—mentality on the part of the others. TH
Dr. Nelson has been a practicing hospitalist since 1988 and is co-founder and past president of SHM. He is a principal in Nelson/Flores Associates, a national hospitalist practice management consulting firm. He also on the faculty of SHM’s “Best Practices in Managing a Hospital Medicine Program.” This column represents his views and is not intended to reflect an official position of SHM.
Hours to Expertise

Glass of wine in one hand and the Sept. 30 copy of Wine Spectator in the other, I intended to relax a bit—the future of hospital medicine not necessarily uppermost in my mind. But then I was struck by an article by Matt Kramer titled “10,000 hours.” In it he discusses the implications Daniel Levitin’s new book This Is Your Brain on Music: The Science of a Human Obsession (Dutton) may have for the field of wine tasting.
Levitin notes that “ten thousand hours of practice is required to achieve the level of mastery associated with being a world-class expert—in anything.” It turns out it doesn’t matter what you are trying to master.
“In study after study of composers, basketball players, fiction writers, ice skaters, concert pianists, chess players, master criminals, and what have you, this number comes up again and again,” he says. “No one has yet found a case in which true world-class expertise was accomplished in less time.” This is consistent with how we learn. “Learning requires the assimilation and consolidation of information in neural tissue,” writes Levitin. “The more experiences we have with something the stronger the memory/learning trace for the experience becomes.”
Ten thousand hours. Are you an expert in hospital medicine? Have you compiled the requisite 10,000 hours? The average hospitalist working approximately 200 shifts a year of 10 to 12 hours each would take four to five years to master the practice of hospital medicine. On the other hand, a provider spending 10 hours a week in the hospital would require 20 years to achieve the numeric equivalent of expert status.
While Levitin was discussing the impact of this calculation on music and Kramer on wine expertise, it struck me as applicable to one of the great debates surrounding hospital medicine. Early in the days of the hospitalist movement, many inside and outside the field opined as to whether hospitals should be the domain of hospitalists and clinics the domain of primary care doctors, without overlap. SHM and I proclaimed hospitals should be open to all providers, regardless of primary practice site.
Over time the argument has died down as the threat of a hospitalist takeover has given way to the realization that many primary care doctors prefer a practice without inpatient obligations.
Recently the American Board of Internal Medicine (ABIM) has decided to move forward with a Recognition of Focused Practice in hospital medicine (RFP-HM) certification. This designation will utilize the structure of the ABIM Maintenance of Certification (MOC) program. It will be available to those who have practiced hospital medicine at least three years, meet inpatient volume requirements, and successfully complete hospital medicine-specific Self-Evaluation Process (SEP) modules, Practice Improvement Modules (PIM) and a secure exam.
This has again raised concerns about the growth and direction of hospital medicine and the implications for internal medicine. Would this confer specialty status to hospitalists while leaving primary care doctors as the remaining generalists? Would this further fracture the field of internal medicine? Would this allow hospital-credentialing boards to preferentially allow only those with RFP-HM to practice within their walls, effectively outlawing the primary care doctor?
Having been a member of the task force that worked on RFP-HM, I can say emphatically that it is not intended to confer specialty status to hospitalists or exalt them above other general internists. Rather, it is meant to recognize that a practitioner has focused his or her practice in a manner that demonstrates greater proficiency in the practice of hospital medicine. While this denotes a presumably higher level of proficiency by RFP-HM providers, it does not mean those without it are not capable providers.
How then should we define who is a capable provider in the hospital setting? According to the Dreyfus Model of Skills Acquisition, as learners develop along the continuum from novice to beginner to competent to proficient to expert, their skills become more developed, letting them tackle more complex issues and tasks more efficiently.
For example, the novice knows that a patient with dyspnea might have pneumonia and orders a chest X-ray but little more. The competent provider realizes many other disease states can cause dyspnea and would assess for those as well, often getting bogged down in extraneous details. The proficient provider immediately focuses on the important details and determines pneumonia as the cause of the dyspnea, applying the proper treatment algorithms with a level of efficiency beyond that of the competent peer.
The expert intuitively diagnoses the pneumonia and prescribes the proper diagnostic and therapeutic evaluation. He does so while considering the patient’s immune status, the impact of the hospital’s antimicrobial resistance patterns, and the potential risks and benefits of short-course antimicrobial therapy—all through the prism of quality core measures, cost, and throughput.
In a healthcare system at best strained and by most evidence severely fractured, we can no longer accept competence as the determinant of a capable provider. Rather, we should use proficiency moving toward expertise as the measuring stick for caring for increasingly more complex patients.
The designation “hospitalist” or even RFP-HM should not determine if one is proficient to practice hospital medicine, just as the designation of primary care provider should not exclude one from practicing in the hospital. Certainly, there are practitioners able to seamlessly cross the inpatient/outpatient boundary without losing a step. However, I suspect the more likely scenario is expertise in one and at best proficiency in the other.
Levitin’s 10,000-hour threshold supports this assumption, as it would take at least 10 years to amass 10,000 hours in each practice setting. Most likely, development of expertise in one arena means mere competence in another. As exhibit A, I tremble at the thought of the mischief I would cause if I took my stethoscope to the primary care clinic.
Instead, the ethical standards of our profession should dictate that each provider determines if they meet this pursuit-of-expertise standard. Employers and credentialing boards need to raise the bar toward expertise, ensuring these thresholds are met.
In the end, hospital or clinic sites should be the domain of capable providers, regardless of their primary practice site. However, we need to recalibrate how we define a capable provider who is moving away from competence toward proficiency verging on expertise. Experience as a surrogate for expertise, more than primary practice setting or RFP-HM status, should be the major determinant for who cares for hospitalized patients. TH
Dr. Glasheen is associate professor of medicine at the University of Colorado at Denver, where he serves as director of the Hospital Medicine Program and the Hospitalist Training Program, and as associate program director of the Internal Medicine Residency Program.
A Year of Progress

It’s hard to believe eight years have gone by since I came to SHM. More than that, it is strange to think of a world without hospitalists. Hospital medicine is part of the fabric of healthcare; there’s no longer a debate over whether hospitalists are good or bad. Now, the talk is about how hospitalists can help solve so many of the ills that vex our healthcare system.
This year has been an extraordinary year even by SHM standards. Witness our progress in the following areas.
ABIM Progress
In a landmark and revolutionary decision, the American Board of Internal Medicine (ABIM) recommended proceeding with a recognition of focused practice (RFP) in hospital medicine as an option in its maintenance of certification (MOC).
This is the culmination of a strategy SHM laid out three years ago. SHM is working with ABIM to continue to make the MOC process meaningful to hospitalists as the ABIM recommendations wend their way through the American Board of Medical Specialties. SHM continues to reach out to the pediatric and family medicine boards so the RFP can be available to all hospitalists.
JHM Listed
In its first year of publication, the Journal of Hospital Medicine (JHM) has been included in PubMed, the National Institutes of Health online archive of life science journals. JHM now resides among other established journals, fielding a marked increased in submissions for publication.
Quality
SHM received its third consecutive grant from the John A. Hartford Foundation, this one for $1.4 million over three years to develop interventions to improve care transitions for older adults at discharge.
As part of our work to improve quality for our nation’s seniors, SHM is developing discharge-planning tools and implementation strategies to limit the voltage drop in care at discharge. Hartford’s support means funders see that hospitalists, with SHM support, improve quality at their hospitals. SHM has become a leader in discharge planning tools and is helping set standards for transitions of care.
To help give hospitalists tools and resources to effect change on the front lines, SHM continues to develop online resource rooms and unique strategies such as mentored implementation.
We also have several hospitalist leaders on key panels at the National Quality Forum (NQF). The American Medical Association’s Physician Consortium on Practice Improvement has asked SHM to take the lead in forming a coalition for setting transitions-of-care measurements.
When the Institute for Healthcare Improvement needed a physician group to join the announcement of its 5 Million Lives Campaign, it reached out to SHM. President Rusty Holman took the stage to support the initiative, which intends to protect 5 million patients from incidents of medical harm over the next two years.
Further, the Joint Commission on Accreditation of Healthcare Organizations asked SHM to co-sponsor its medication reconciliation workgroup. Lastly, SHM continues to get significant visibility for hospitalists with our leadership of the deep-vein thrombosis awareness coalition of more than 35 organizations.
Annual Meeting
In May, SHM took over the Gaylord Texan in Dallas with professional meeting staging that rivaled older, larger organizations. With banners, Jumbotrons, and devices projecting the SHM logo, we transformed the Gaylord into a “hospitalist city.” We treated the nearly 1,200 attendees to three superlative speakers:
- David Brailer, MD, national coordinator for health information technology, United States Department of Health and Human Services;
- Jonathan Perlin, MD, former undersecretary for health at the Veterans Health Administration and now chief medical officer and senior vice president of quality for Hospital Corporation of America in Nashville; and
- Bob Wachter, MD, professor and chief of the division of hospital medicine at the University of California, San Francisco.
And, we had our largest poster session ever, with more than 200 submissions, and our largest exhibit hall. We plan to take it up a notch in San Diego in April.
Advocacy and Policy
Our presence in Washington, D.C., allows us to be active in Medicare payment reform. SHM leadership has met with senior staff at MedPAC, the organization that makes recommendations to the Centers for Medicare and Medicaid Services and Congress. MedPAC is interested in working with SHM as Medicare attempts to move away from paying for just visits and procedures and toward reimbursement strategies that drive performance and efficiency.
Current, Future Initiatives
In June, SHM forged a partnership with the Society of General Internal Medicine (SGIM) and the Association of Chiefs of General Internal Medicine to hold an academic summit to develop strategies for academic hospitalists to have a strong and sustainable career in teaching, training, and research in hospital medicine. When the Alliance for Academic Internal Medicine developed its proposal to redesign internal medicine training, SHM took the lead in crafting the hospitalist response.
In July, we joined the SGIM and American College of Physicians to hold a consensus conference on transitions of care. This coalition of more than 25 organizations produced a statement as the basis for future standards and measurements. Also in July, SHM worked with key leaders in emergency medicine and others to redefine the management and opportunities in observation units.
We held a multidisciplinary workforce summit in November to examine the challenges and solutions in growing hospital medicine from 20,000 to 40,000 or more physicians.
Diversity
While at times we may seem to focus more on internal-medicine-trained hospitalists, who make up more than 80% of the field, SHM continues to include hospitalists in family medicine and pediatrics, among other specialties. We also are home to nonphysician providers and physician assistants. We are working to support academic hospitalists, small groups, and multistate companies. In our toughest tightrope walk, SHM continues to be relevant and supportive of labor and management in hospital medicine.
Looking to 2008
The growth and influence of hospital medicine is relentless. Maybe 2008 is the year we will see hospitalists practicing in more than 3,000 hospitals or see the specialty grow to more than 25,000 hospitalists. One thing is for sure: SHM, with your suggestions, ideas, and energy, will be on the front lines with you, supporting and advocating a better healthcare system. TH
Dr. Wellikson is CEO of SHM.
Care & Prayer
Charles Petit, MD, like many healthcare professionals, spends a good deal of time addressing the needs of the underprivileged. Since 2004, he has taken up the cause of the indigenous Miskito Indians of Puerto Lempira, Honduras. He is putting his own money into developing a modern clinic and international medicine program there.
But medicine isn’t his only mission. Dr. Petit, 56, a hospitalist at Palmetto Health Care’s Richland Memorial Hospital in Columbia, S.C., is also an Episcopal priest.
He joined Palmetto Health Senior Care as its first medical director in 1988 and reconnected with the group in 2004—not in his previous role as an office-based physician but as a hospitalist. In between those stints he pursued his ordination and medical missionary work in Africa and Latin America.
As a physician, Dr. Petit says he feels God’s presence at each patient’s bedside. Years ago he wondered how to handle that.
To deepen his connection between medicine and spirituality, he lived in a Christian intentional community in Indiana, Pa., from 1981 to 1988. Gradually, his views on medicine and spirituality crystallized.
“How does God do what he does?” Dr. Petit wondered. “Can medicine put Him to the test? I have seen that prayer works, including a patient miraculously healed of metastatic ovarian cancer. But God isn’t a vending machine. You don’t drop in a prayer and get a healing back.”
The Second Calling
Recognizing he needed something more to integrate medicine and spirituality, Dr. Petit sought a firmer grounding in religious studies.
He moved to Simpsonville, S.C., in 1995 and entered the Episcopal seminary, working as an emergency department doctor to pay the bills. Later, he earned a master’s of divinity from the University of the South in Sewanee, Tenn., in 2003.
His spiritual “internship” was a transitional deaconship from 2003 to 2005, under the Rev. Michael Flanagan, rector at Simpsonville’s Holy Cross Episcopal Church. Both had dual vocations—Flanagan was an engineer who sold electrical equipment for 10 years before ordination. Prior to meeting Dr. Petit, Flanagan was leery of the doctor’s ability to balance pastoral and medical duties.
“Would he be a doctor/priest?” Flanagan wondered. “A priest/doctor? His desire was to meld both and he did. Medicine and spirituality are both in his blood. He sees both as calls from God and connects medicine with spirituality into a holistic view of each person.” He says Dr. Petit “seems to know everything and sucks up knowledge, which he wants to share. He loves being the doctor and having the knowledge to fix the patient’s problem.”
While Dr. Petit keeps his hospitalist and priest roles mostly separate, working with elderly patients sometimes requires the skills of both disciplines. At Richland he wears a clerical collar on pastoral rounds. If a family or patient asks him to pray with them or discuss life’s ending, he does. He has conducted funerals for his own and colleagues’ patients.
“It’s a very powerful experience being both a priest and a doctor,” he says. “I grow so close to the patients and their families that it is natural for me to serve in both roles.”

Honduras Mission
As a seminarian, Dr. Petit took medical mission trips and briefly supported an African orphanage, looking for a cause to call his own. Until his first trip to Puerto Lempira, a village on the Miskito Coast of the Atlantic Ocean.
The abject poverty and medical needs of the Miskito Indians there pulled at him. Early on he enlisted the help of Ennis Whiddon, a builder and Holy Cross parishioner. Whiddon, who usually accompanies Dr. Petit to Puerto Lempira, says of his friend: “I knew him as [an emergency department] doctor first. Then I realized his extraordinary spiritual commitment. I went to Puerto Lempira on his first mission trip and I asked myself why anyone would want to be there, but I knew Chuck couldn’t bear not to be there. I also knew he wasn’t just going to give people two aspirins, come home and pray for them.”
Dr. Petit returns to Puerto Lempira three or four times a year with a team of doctors, seeing several hundred patients a day. During one two-week stint he dispensed $200,000 worth of medication he cadged from drug companies for $600 out of his pocket to rid the town’s youngsters of debilitating parasites.
Dr. Petit works with a Miskito nurse who runs their rudimentary clinic in his absence. He also uses hyperbaric medicine to treat divers whose crippling injuries result from diving deeply using pressurized oxygen tanks and rising too quickly to the surface.
“You wouldn’t believe the indescribably poor facilities we found there,” Whiddon says of the town’s clinic. “You wouldn’t have your dog treated there if you loved your dog.”
Last year Dr. Petit ratcheted up his commitment to Puerto Lempira, dreaming of building a permanent clinic there.
He decided to use his money to buy land to build a clinic, but got stonewalled by a stubborn local bureaucracy.
Then Andres Leone, a like-minded younger doctor who was part of the mission trip, stepped in with handy language and cultural skills. Leone who had attended medical school in Ecuador, is a Lutheran seminarian, and is completing a geriatric hospitalist fellowship at Palmetto Healthcare.
“We were in Puerto Lempira for two weeks and visited the mayor several times to buy land,” Dr. Leone explains. “He said the price was $600,000, which was ridiculous. In the town I overheard some conversations, which led to us meeting the 77-year-old daughter of missionaries. She sold us some of her land and even donated money to help build the clinic, which will be dedicated in her name.”
Thinking big, Dr. Petit is adding an apartment complete with air conditioning and a modern bathroom to the clinic’s blueprint, to attract residents in a to-be-formed international medicine program. As an assistant professor of family medicine at the University of South Carolina’s (USC) School of Medicine, he intends to oversee those residents.
Just back from Puerto Lempira, Dr. Petit finalized the clinic’s design, lined up local workers to figure out how to make concrete building blocks with native materials, and met with Anglican bishop the Right Rev. Lloyd E. Allen, bolstering support for the new clinic and the possibility of HIV outreach. Side by side with Honduran and Cuban doctors, Dr. Petit treated hundreds of Puerto Lempira’s villagers every day.
Back in the Hospital
Dr. Petit always wanted to be a doctor. Although his father suggested he become a hospital orderly, Dr. Petit knew being a physician was his calling, graduating from the University of West Virginia School of Medicine (Morgantown) family medicine program in 1978.
He enjoys hospital medicine as a holistic approach to caring for patients, consistent with his work early in his career.
An earlier 10-year stint as a hospitalist at HealthSouth Rehabilitation Hospital, also at USC, involved teaching residents and students rotating through the hospital, as well as a consultative service for neurosurgical patients at Richland. At Wheeling Hospital early in his career he became comfortable as a generalist, covering intensive care, assisting in surgery, and delivering many babies.
Being a hospitalist keeps that spirit alive. “It gives me the gift of time to spend with patients,” he says. “I try not to tie frail elderly patients down with IVs, Foley catheters, EKG monitors, worries that eating a leafy green vegetable will react badly with their Coumadin [warfarin], and polypharmacy.”
He discusses advanced directives, palliative care, and how the elderly in fragile condition can maintain as much freedom as possible. The hospital medicine group’s accommodating scheduling allows time for his parish duties and medical mission trips.
The group’s medical director, Victor Hirth, MD, describes Dr. Petit as a borderline workaholic who’s always looking for ways to make things better for the practice and patients. “The patients absolutely love him because he takes time to sit and talk to them,” says Dr. Hirth.
Dr. Petit also embraces new technologies. “Our [electronic medical record] makes working with my outpatient colleagues smooth and straightforward.” He relies on a personal digital device assistant for updates on clinical guidelines and optimal drug doses for elderly patients. Integrating a healer’s touch with new technology he says: “While medicine is a science, it’s still an art, a ministry, and a gift.”
What’s Next?
Back in South Carolina, Dr. Petit has picked up his hospitalist and pastoral responsibilities without missing a beat. He looks forward to building the palliative care consulting service and intends to launch a nonprofit corporation to receive donations to support the Puerto Lempira clinic’s construction.
He is planning more mission trips. He thrives on the work. Infused with boundless energy, he’s always looking for more to do.
“I love what I do,” he concludes. “If I felt much better they’d charge me an amusement tax.” TH
Marlene Piturro is a medical writer based in New York.
Charles Petit, MD, like many healthcare professionals, spends a good deal of time addressing the needs of the underprivileged. Since 2004, he has taken up the cause of the indigenous Miskito Indians of Puerto Lempira, Honduras. He is putting his own money into developing a modern clinic and international medicine program there.
But medicine isn’t his only mission. Dr. Petit, 56, a hospitalist at Palmetto Health Care’s Richland Memorial Hospital in Columbia, S.C., is also an Episcopal priest.
He joined Palmetto Health Senior Care as its first medical director in 1988 and reconnected with the group in 2004—not in his previous role as an office-based physician but as a hospitalist. In between those stints he pursued his ordination and medical missionary work in Africa and Latin America.
As a physician, Dr. Petit says he feels God’s presence at each patient’s bedside. Years ago he wondered how to handle that.
To deepen his connection between medicine and spirituality, he lived in a Christian intentional community in Indiana, Pa., from 1981 to 1988. Gradually, his views on medicine and spirituality crystallized.
“How does God do what he does?” Dr. Petit wondered. “Can medicine put Him to the test? I have seen that prayer works, including a patient miraculously healed of metastatic ovarian cancer. But God isn’t a vending machine. You don’t drop in a prayer and get a healing back.”
The Second Calling
Recognizing he needed something more to integrate medicine and spirituality, Dr. Petit sought a firmer grounding in religious studies.
He moved to Simpsonville, S.C., in 1995 and entered the Episcopal seminary, working as an emergency department doctor to pay the bills. Later, he earned a master’s of divinity from the University of the South in Sewanee, Tenn., in 2003.
His spiritual “internship” was a transitional deaconship from 2003 to 2005, under the Rev. Michael Flanagan, rector at Simpsonville’s Holy Cross Episcopal Church. Both had dual vocations—Flanagan was an engineer who sold electrical equipment for 10 years before ordination. Prior to meeting Dr. Petit, Flanagan was leery of the doctor’s ability to balance pastoral and medical duties.
“Would he be a doctor/priest?” Flanagan wondered. “A priest/doctor? His desire was to meld both and he did. Medicine and spirituality are both in his blood. He sees both as calls from God and connects medicine with spirituality into a holistic view of each person.” He says Dr. Petit “seems to know everything and sucks up knowledge, which he wants to share. He loves being the doctor and having the knowledge to fix the patient’s problem.”
While Dr. Petit keeps his hospitalist and priest roles mostly separate, working with elderly patients sometimes requires the skills of both disciplines. At Richland he wears a clerical collar on pastoral rounds. If a family or patient asks him to pray with them or discuss life’s ending, he does. He has conducted funerals for his own and colleagues’ patients.
“It’s a very powerful experience being both a priest and a doctor,” he says. “I grow so close to the patients and their families that it is natural for me to serve in both roles.”
Honduras Mission
As a seminarian, Dr. Petit took medical mission trips and briefly supported an African orphanage, looking for a cause to call his own. Until his first trip to Puerto Lempira, a village on the Miskito Coast of the Atlantic Ocean.
The abject poverty and medical needs of the Miskito Indians there pulled at him. Early on he enlisted the help of Ennis Whiddon, a builder and Holy Cross parishioner. Whiddon, who usually accompanies Dr. Petit to Puerto Lempira, says of his friend: “I knew him as [an emergency department] doctor first. Then I realized his extraordinary spiritual commitment. I went to Puerto Lempira on his first mission trip and I asked myself why anyone would want to be there, but I knew Chuck couldn’t bear not to be there. I also knew he wasn’t just going to give people two aspirins, come home and pray for them.”
Dr. Petit returns to Puerto Lempira three or four times a year with a team of doctors, seeing several hundred patients a day. During one two-week stint he dispensed $200,000 worth of medication he cadged from drug companies for $600 out of his pocket to rid the town’s youngsters of debilitating parasites.
Dr. Petit works with a Miskito nurse who runs their rudimentary clinic in his absence. He also uses hyperbaric medicine to treat divers whose crippling injuries result from diving deeply using pressurized oxygen tanks and rising too quickly to the surface.
“You wouldn’t believe the indescribably poor facilities we found there,” Whiddon says of the town’s clinic. “You wouldn’t have your dog treated there if you loved your dog.”
Last year Dr. Petit ratcheted up his commitment to Puerto Lempira, dreaming of building a permanent clinic there.
He decided to use his money to buy land to build a clinic, but got stonewalled by a stubborn local bureaucracy.
Then Andres Leone, a like-minded younger doctor who was part of the mission trip, stepped in with handy language and cultural skills. Leone who had attended medical school in Ecuador, is a Lutheran seminarian, and is completing a geriatric hospitalist fellowship at Palmetto Healthcare.
“We were in Puerto Lempira for two weeks and visited the mayor several times to buy land,” Dr. Leone explains. “He said the price was $600,000, which was ridiculous. In the town I overheard some conversations, which led to us meeting the 77-year-old daughter of missionaries. She sold us some of her land and even donated money to help build the clinic, which will be dedicated in her name.”
Thinking big, Dr. Petit is adding an apartment complete with air conditioning and a modern bathroom to the clinic’s blueprint, to attract residents in a to-be-formed international medicine program. As an assistant professor of family medicine at the University of South Carolina’s (USC) School of Medicine, he intends to oversee those residents.
Just back from Puerto Lempira, Dr. Petit finalized the clinic’s design, lined up local workers to figure out how to make concrete building blocks with native materials, and met with Anglican bishop the Right Rev. Lloyd E. Allen, bolstering support for the new clinic and the possibility of HIV outreach. Side by side with Honduran and Cuban doctors, Dr. Petit treated hundreds of Puerto Lempira’s villagers every day.
Back in the Hospital
Dr. Petit always wanted to be a doctor. Although his father suggested he become a hospital orderly, Dr. Petit knew being a physician was his calling, graduating from the University of West Virginia School of Medicine (Morgantown) family medicine program in 1978.
He enjoys hospital medicine as a holistic approach to caring for patients, consistent with his work early in his career.
An earlier 10-year stint as a hospitalist at HealthSouth Rehabilitation Hospital, also at USC, involved teaching residents and students rotating through the hospital, as well as a consultative service for neurosurgical patients at Richland. At Wheeling Hospital early in his career he became comfortable as a generalist, covering intensive care, assisting in surgery, and delivering many babies.
Being a hospitalist keeps that spirit alive. “It gives me the gift of time to spend with patients,” he says. “I try not to tie frail elderly patients down with IVs, Foley catheters, EKG monitors, worries that eating a leafy green vegetable will react badly with their Coumadin [warfarin], and polypharmacy.”
He discusses advanced directives, palliative care, and how the elderly in fragile condition can maintain as much freedom as possible. The hospital medicine group’s accommodating scheduling allows time for his parish duties and medical mission trips.
The group’s medical director, Victor Hirth, MD, describes Dr. Petit as a borderline workaholic who’s always looking for ways to make things better for the practice and patients. “The patients absolutely love him because he takes time to sit and talk to them,” says Dr. Hirth.
Dr. Petit also embraces new technologies. “Our [electronic medical record] makes working with my outpatient colleagues smooth and straightforward.” He relies on a personal digital device assistant for updates on clinical guidelines and optimal drug doses for elderly patients. Integrating a healer’s touch with new technology he says: “While medicine is a science, it’s still an art, a ministry, and a gift.”
What’s Next?
Back in South Carolina, Dr. Petit has picked up his hospitalist and pastoral responsibilities without missing a beat. He looks forward to building the palliative care consulting service and intends to launch a nonprofit corporation to receive donations to support the Puerto Lempira clinic’s construction.
He is planning more mission trips. He thrives on the work. Infused with boundless energy, he’s always looking for more to do.
“I love what I do,” he concludes. “If I felt much better they’d charge me an amusement tax.” TH
Marlene Piturro is a medical writer based in New York.
Do feeding tubes improve outcomes in patients with dementia?
Case
A 68-year-old cachectic female with a history of Alzheimer’s dementia presents with a slowly progressive decline in functional status. She is bed bound, minimally verbal, and has lost interest in eating.
Her problems with decreased oral intake started when her diet was changed to nectar-thickened liquids. This change was made after the patient was hospitalized multiple times for aspiration pneumonia and she underwent a fluoroscopic swallowing evaluation that revealed aspiration of thin liquids. The patient’s husband requests that a feeding tube be placed so his wife doesn’t “die of pneumonia or starve to death.”
Overview
As the U.S. population ages, hospitalists are seeing a steady increase in the average patient age and the prevalence of dementia. Alzheimer’s dementia affects an estimated 4 million to 5 million Americans; this number expected to triple by the year 2050.1
As patients with dementia near the end of life, they often fail to thrive, with less oral intake and more swallowing disorders leading to aspiration. This is when physicians and patient family members must decide whether a feeding tube should be placed.
Placement of a nasogastric or percutaneous endogastric gastrostomy (PEG) feeding tube has become a relatively common medical intervention instituted to maintain or improve a patient’s nutritional status. Prior to 1980, permanent gastric or postpyloric feeding tubes were placed surgically by laparotomy, but the advent of endoscopy and computed tomography (CT) guided procedures offers a simplified procedure requiring only mild sedation and local anesthesia.2
Many patients who suffer multiple bouts of aspiration pneumonia and fail a swallowing evaluation because of an irreversible process are offered a percutaneous feeding tube to maintain nutrition. A feeding tube is also seen as a way to supply nutrition at the end of life in patients no longer able or willing to take food orally.
Although it seems logical that a feeding tube might improve the outcomes of these clinical scenarios, limited literature exists on the topic because of the legal, ethical, emotional, and religious implications a large, randomized, placebo-controlled trial would entail.
Review of the Data
Placement of a PEG has become accepted as a relatively benign procedure, although it is associated with significant morbidity and mortality. Minor complications including pain, abdominal wall ulcers, wound infections, peristomal leakage, and tube displacement occur in approximately 10% of cases.3 Major complications including hemorrhage, bowel or liver perforation, or aspiration occur in 3% of cases.4
These numbers do not account for long-term complications including peristomal infections, leakage problems, or the use of physical restraints to avoid self-extubation.
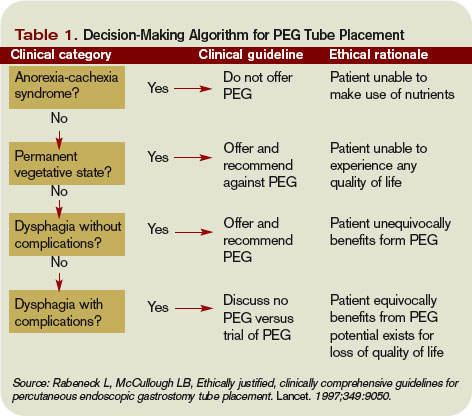
Aspiration Risk
A common indication for PEG placement is aspiration risk. PEG tubes are often placed in patients who fail swallowing evaluations in order to decrease their risk of aspiration and aspiration pneumonia.
True aspiration pneumonia is thought to originate from an inoculum of oral cavity or nasopharynx bacteria, which placement of a PEG tube would not prevent. Leibovitz, et al., showed that elderly patients with nasogastric or percutaneous feeding tubes are associated with colonization of the oropharynx with more pathogenic bacteria when compared with orally fed patients.5 Thus, the use of PEG tubes might put them at higher risk for pathogenic inoculation.
Aspiration pneumonia occurs in up to 50% of patients with feeding tubes. Studies have shown PEG tube placement decreases lower esophageal sphincter tone, potentially increasing regurgitation risk.6 It has also been shown that aspiration of gastric contents produces a pneumonitis with the resultant inflammatory response allowing for establishment of infection by smaller inoculums of or less virulent organisms.7
Small, randomized trials have shown no decrease in aspiration risk with post-pyloric versus gastric feeding tubes, nasogastric versus percutaneous feeding tubes, or continuous versus intermittent tube feeds.8 There have been no sizable randomized prospective trials to determine if feeding tube placement versus hand feeding patients with end-stage dementia alters aspiration pneumonia risk.
Pressure Ulcers
Patients with end-stage dementia often become bed bound as their disease progresses, and they commonly suffer from pressure ulcers. Pressure ulcers often coexist in patients with malnutrition, and it is well established that patients with biochemical markers of malnutrition are at higher risk for pressure ulcer formation.
Still, no studies show that improved nutrition prevents pressure ulcer formation. In a nursing home population of patients with dementia, a two-year follow-up study showed no significant improvement in pressure ulcer healing or decreased ulcer formation with nutrition by feeding tube.9 These studies are adjusted for independent risk factors for mortality and indication for PEG placement, but we can assume there are confounders that go into the decision for feeding tube placement that are not necessarily identifiable.
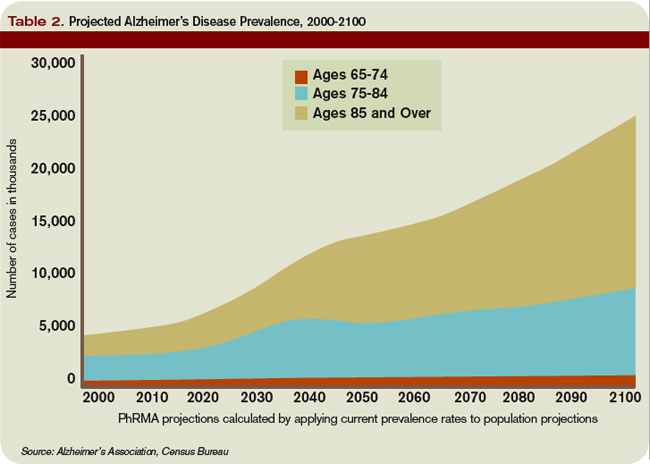
Nutritional Status
Family members are often concerned that if the patient is unable to take food by mouth and no feeding tube is placed, then the patient will suffer from the discomfort of starvation and dehydration.
As a patient with a severe dementing illness enters the end stage of his/her clinical course, practitioners frequently make a plan with families to change the goals of care toward keeping the patient comfortable. Comfort is a difficult clinical parameter to measure, but studies in the hospice population of patients with end-stage cancer and AIDS report that the hunger and thirst are transient and improve with ice chips and mouth swabs.10
Despite the lack of evidence of PEG tubes prolonging survival in patients with dementia who are no longer able or willing to take in food orally, it is logical that withholding all hydration or nutritional support will hasten death despite the risks associated with feeding tubes. This is where the ethical argument arises regarding prolonging life of decreasing quality.
In certain medical and legal sectors, artificial nutrition, and hydration are considered a medical intervention. Therefore, the ideals of patient autonomy dictate that the patient’s proxy should decide whether or not the patient would have wanted the intervention after weighing the risks and benefits.
If hospitalists view artificial nutrition as a medical intervention, our moral obligation is to instruct patients and their families about these risks and benefits.
Often, the patient will not clinically improve with artificial nutrition. But we can maintain physiologic processes or at least slow their decline.
Emerging research indicates the standard of care in how we present this information is changing to include presentation of data instead of only using a patient’s suspected beliefs about quality of life.
A useful algorithm proposed by Rabeneck, et al., provides comprehensive guidelines for PEG placement in all patient populations based on the reason for PEG consideration.11
Back to the Case
Our patient is likely nearing the end of her life because of end-stage dementia. There is no evidence to suggest placement of a feeding tube would extend her life more than hand feeding.
We know feeding-tube placement could increase aspiration pneumonia risk and significant short- and long-term morbidity and mortality. We can keep her comfortable with small amounts of water, wetting her lips with swabs. If a feeding tube is placed, its use should be evaluated based on the patient’s clinical course. TH
Dr. Pell is an instructor of medicine in the Section of Hospital Medicine at the University of Colorado, Denver.
References
- Gauderer MW, Ponsky JL, Izant RJ Jr. Gastrostomy without laparotomy: a percutaneous endoscopic technique. J Pediatr Surg. 1980;15(6):872-875.
- Hebert LE, Beckett LA, Scherr PA, and Evans DA. Annual incidence of Alzheimer disease in the United States projected to the years 2000 through 2050. Alzheimer Dis Assoc Disord. 2001;15:169-173.
- Grant MD, Rudberg MA, Brody JA. Gastrostomy placement and mortality among hospitalized Medicare beneficiaries. JAMA. 1998;279:1973-1976.
- Finocchiaro C, Galletti R, Rovera G, et al. Percutaneous endoscopic gastrostomy: a long-term follow-up. Nutrition. 1997;13(6):520-523.
- Leibovitz A, Plotnikov G, Habot B, et al. Pathogenic colonization of oral flora in frail elderly patients fed by nasogastric tube or percutaneous enterogastric tube. J Gerontol A Biol Sci Med. 2003;58(1):52-55.
- McCann R. Lack of evidence about tube feeding: food for thought. JAMA. 1999;282(14):1380-1381.
- Cameron JL, Caldini P, Toung J-K, et al. Aspiration pneumonia: physiologic data following experimental Aspiration. Surgery. 1972;72:238.
- Loeb MB, Becker M, Eady A, et al. Interventions to prevent aspiration pneumonia in older adults: a systematic review. JAGS. 2003;51(7):1018-1022.
- Mitchell SL, Kiely DK, Lipsitz LA. The risk factors and impact on survival of feeding tube placement in nursing home residents with severe cognitive impairment. Arch Intern Med. 1997;157:327-332.
- McCann RM, Hall WJ, Groth-Junker A. Comfort care for terminally ill patients: the appropriate use of nutrition and hydration. JAMA. 1994;272:1263-1266.
- Rabeneck L, McCullough LB. Ethically justified, clinically comprehensive guidelines for percutaneous endoscopic gastrostomy tube placement. Lancet. 1997;349(9050):496-498.
Case
A 68-year-old cachectic female with a history of Alzheimer’s dementia presents with a slowly progressive decline in functional status. She is bed bound, minimally verbal, and has lost interest in eating.
Her problems with decreased oral intake started when her diet was changed to nectar-thickened liquids. This change was made after the patient was hospitalized multiple times for aspiration pneumonia and she underwent a fluoroscopic swallowing evaluation that revealed aspiration of thin liquids. The patient’s husband requests that a feeding tube be placed so his wife doesn’t “die of pneumonia or starve to death.”
Overview
As the U.S. population ages, hospitalists are seeing a steady increase in the average patient age and the prevalence of dementia. Alzheimer’s dementia affects an estimated 4 million to 5 million Americans; this number expected to triple by the year 2050.1
As patients with dementia near the end of life, they often fail to thrive, with less oral intake and more swallowing disorders leading to aspiration. This is when physicians and patient family members must decide whether a feeding tube should be placed.
Placement of a nasogastric or percutaneous endogastric gastrostomy (PEG) feeding tube has become a relatively common medical intervention instituted to maintain or improve a patient’s nutritional status. Prior to 1980, permanent gastric or postpyloric feeding tubes were placed surgically by laparotomy, but the advent of endoscopy and computed tomography (CT) guided procedures offers a simplified procedure requiring only mild sedation and local anesthesia.2
Many patients who suffer multiple bouts of aspiration pneumonia and fail a swallowing evaluation because of an irreversible process are offered a percutaneous feeding tube to maintain nutrition. A feeding tube is also seen as a way to supply nutrition at the end of life in patients no longer able or willing to take food orally.
Although it seems logical that a feeding tube might improve the outcomes of these clinical scenarios, limited literature exists on the topic because of the legal, ethical, emotional, and religious implications a large, randomized, placebo-controlled trial would entail.
Review of the Data
Placement of a PEG has become accepted as a relatively benign procedure, although it is associated with significant morbidity and mortality. Minor complications including pain, abdominal wall ulcers, wound infections, peristomal leakage, and tube displacement occur in approximately 10% of cases.3 Major complications including hemorrhage, bowel or liver perforation, or aspiration occur in 3% of cases.4
These numbers do not account for long-term complications including peristomal infections, leakage problems, or the use of physical restraints to avoid self-extubation.
Aspiration Risk
A common indication for PEG placement is aspiration risk. PEG tubes are often placed in patients who fail swallowing evaluations in order to decrease their risk of aspiration and aspiration pneumonia.
True aspiration pneumonia is thought to originate from an inoculum of oral cavity or nasopharynx bacteria, which placement of a PEG tube would not prevent. Leibovitz, et al., showed that elderly patients with nasogastric or percutaneous feeding tubes are associated with colonization of the oropharynx with more pathogenic bacteria when compared with orally fed patients.5 Thus, the use of PEG tubes might put them at higher risk for pathogenic inoculation.
Aspiration pneumonia occurs in up to 50% of patients with feeding tubes. Studies have shown PEG tube placement decreases lower esophageal sphincter tone, potentially increasing regurgitation risk.6 It has also been shown that aspiration of gastric contents produces a pneumonitis with the resultant inflammatory response allowing for establishment of infection by smaller inoculums of or less virulent organisms.7
Small, randomized trials have shown no decrease in aspiration risk with post-pyloric versus gastric feeding tubes, nasogastric versus percutaneous feeding tubes, or continuous versus intermittent tube feeds.8 There have been no sizable randomized prospective trials to determine if feeding tube placement versus hand feeding patients with end-stage dementia alters aspiration pneumonia risk.
Pressure Ulcers
Patients with end-stage dementia often become bed bound as their disease progresses, and they commonly suffer from pressure ulcers. Pressure ulcers often coexist in patients with malnutrition, and it is well established that patients with biochemical markers of malnutrition are at higher risk for pressure ulcer formation.
Still, no studies show that improved nutrition prevents pressure ulcer formation. In a nursing home population of patients with dementia, a two-year follow-up study showed no significant improvement in pressure ulcer healing or decreased ulcer formation with nutrition by feeding tube.9 These studies are adjusted for independent risk factors for mortality and indication for PEG placement, but we can assume there are confounders that go into the decision for feeding tube placement that are not necessarily identifiable.
Nutritional Status
Family members are often concerned that if the patient is unable to take food by mouth and no feeding tube is placed, then the patient will suffer from the discomfort of starvation and dehydration.
As a patient with a severe dementing illness enters the end stage of his/her clinical course, practitioners frequently make a plan with families to change the goals of care toward keeping the patient comfortable. Comfort is a difficult clinical parameter to measure, but studies in the hospice population of patients with end-stage cancer and AIDS report that the hunger and thirst are transient and improve with ice chips and mouth swabs.10
Despite the lack of evidence of PEG tubes prolonging survival in patients with dementia who are no longer able or willing to take in food orally, it is logical that withholding all hydration or nutritional support will hasten death despite the risks associated with feeding tubes. This is where the ethical argument arises regarding prolonging life of decreasing quality.
In certain medical and legal sectors, artificial nutrition, and hydration are considered a medical intervention. Therefore, the ideals of patient autonomy dictate that the patient’s proxy should decide whether or not the patient would have wanted the intervention after weighing the risks and benefits.
If hospitalists view artificial nutrition as a medical intervention, our moral obligation is to instruct patients and their families about these risks and benefits.
Often, the patient will not clinically improve with artificial nutrition. But we can maintain physiologic processes or at least slow their decline.
Emerging research indicates the standard of care in how we present this information is changing to include presentation of data instead of only using a patient’s suspected beliefs about quality of life.
A useful algorithm proposed by Rabeneck, et al., provides comprehensive guidelines for PEG placement in all patient populations based on the reason for PEG consideration.11
Back to the Case
Our patient is likely nearing the end of her life because of end-stage dementia. There is no evidence to suggest placement of a feeding tube would extend her life more than hand feeding.
We know feeding-tube placement could increase aspiration pneumonia risk and significant short- and long-term morbidity and mortality. We can keep her comfortable with small amounts of water, wetting her lips with swabs. If a feeding tube is placed, its use should be evaluated based on the patient’s clinical course. TH
Dr. Pell is an instructor of medicine in the Section of Hospital Medicine at the University of Colorado, Denver.
References
- Gauderer MW, Ponsky JL, Izant RJ Jr. Gastrostomy without laparotomy: a percutaneous endoscopic technique. J Pediatr Surg. 1980;15(6):872-875.
- Hebert LE, Beckett LA, Scherr PA, and Evans DA. Annual incidence of Alzheimer disease in the United States projected to the years 2000 through 2050. Alzheimer Dis Assoc Disord. 2001;15:169-173.
- Grant MD, Rudberg MA, Brody JA. Gastrostomy placement and mortality among hospitalized Medicare beneficiaries. JAMA. 1998;279:1973-1976.
- Finocchiaro C, Galletti R, Rovera G, et al. Percutaneous endoscopic gastrostomy: a long-term follow-up. Nutrition. 1997;13(6):520-523.
- Leibovitz A, Plotnikov G, Habot B, et al. Pathogenic colonization of oral flora in frail elderly patients fed by nasogastric tube or percutaneous enterogastric tube. J Gerontol A Biol Sci Med. 2003;58(1):52-55.
- McCann R. Lack of evidence about tube feeding: food for thought. JAMA. 1999;282(14):1380-1381.
- Cameron JL, Caldini P, Toung J-K, et al. Aspiration pneumonia: physiologic data following experimental Aspiration. Surgery. 1972;72:238.
- Loeb MB, Becker M, Eady A, et al. Interventions to prevent aspiration pneumonia in older adults: a systematic review. JAGS. 2003;51(7):1018-1022.
- Mitchell SL, Kiely DK, Lipsitz LA. The risk factors and impact on survival of feeding tube placement in nursing home residents with severe cognitive impairment. Arch Intern Med. 1997;157:327-332.
- McCann RM, Hall WJ, Groth-Junker A. Comfort care for terminally ill patients: the appropriate use of nutrition and hydration. JAMA. 1994;272:1263-1266.
- Rabeneck L, McCullough LB. Ethically justified, clinically comprehensive guidelines for percutaneous endoscopic gastrostomy tube placement. Lancet. 1997;349(9050):496-498.