User login
Obokata fails to create STAP cells, resigns

Credit: Associated Press
After months of trying, Haruko Obokata, PhD, and a team of researchers at her institution, RIKEN, have failed to produce stimulus-triggered acquisition of pluripotency (STAP) cells.
Officials from RIKEN said they have accepted Dr Obokata’s resignation, and the institution has decided to end its efforts to recreate the STAP cell phenomenon.
Dr Obokata and her colleagues initially reported the creation of STAP cells in an article and a letter published in Nature last January. The researchers said they had induced pluripotency in somatic cells by exposing the cells to a low-pH environment.
Not long after the papers were published, members of the scientific community began to question the validity of the research.
So RIKEN launched an investigation, ultimately concluding that Dr Obokata was guilty of misconduct, and some of her colleagues—including the deceased Yoshiki Sasai, MD, PhD—were guilty of negligence.
RIKEN also called for the papers to be retracted, and, in July, they were.
Throughout these proceedings, Dr Obokata insisted the STAP cell phenomenon is real. To investigate this claim, RIKEN organized a group of researchers to recreate Dr Obokata’s experiments.
In August, the group reported initial results, saying their attempts had failed, but they would continue trying to create STAP cells until March 2015. Meanwhile, Dr Obokata was trying to recreate the STAP cell phenomenon on her own, under supervision.
Shinichi Aizawa, PhD, the leader of RIKEN’s team, explained the final results of their experiments, as well as Dr Obokata’s, in a press conference in Tokyo on Friday.
Dr Obokata was able to show a fluorescent phenomenon that indicates the possibility of pluripotency in cells, albeit at a very low rate. However, she could not confirm the pluripotency of STAP cells in mice.
The RIKEN team had similar results. So they have decided not to continue with the experiments.
RIKEN accepted Dr Obokata’s resignation, and a disciplinary committee has been discussing how they will reprimand her for research misconduct. RIKEN officials said they will make an announcement once the decision has been made. ![]()
Are These Leg Lesions and a Family History of Diabetes Related?
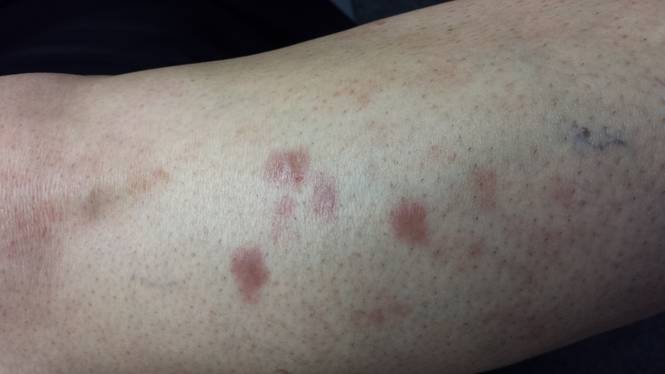
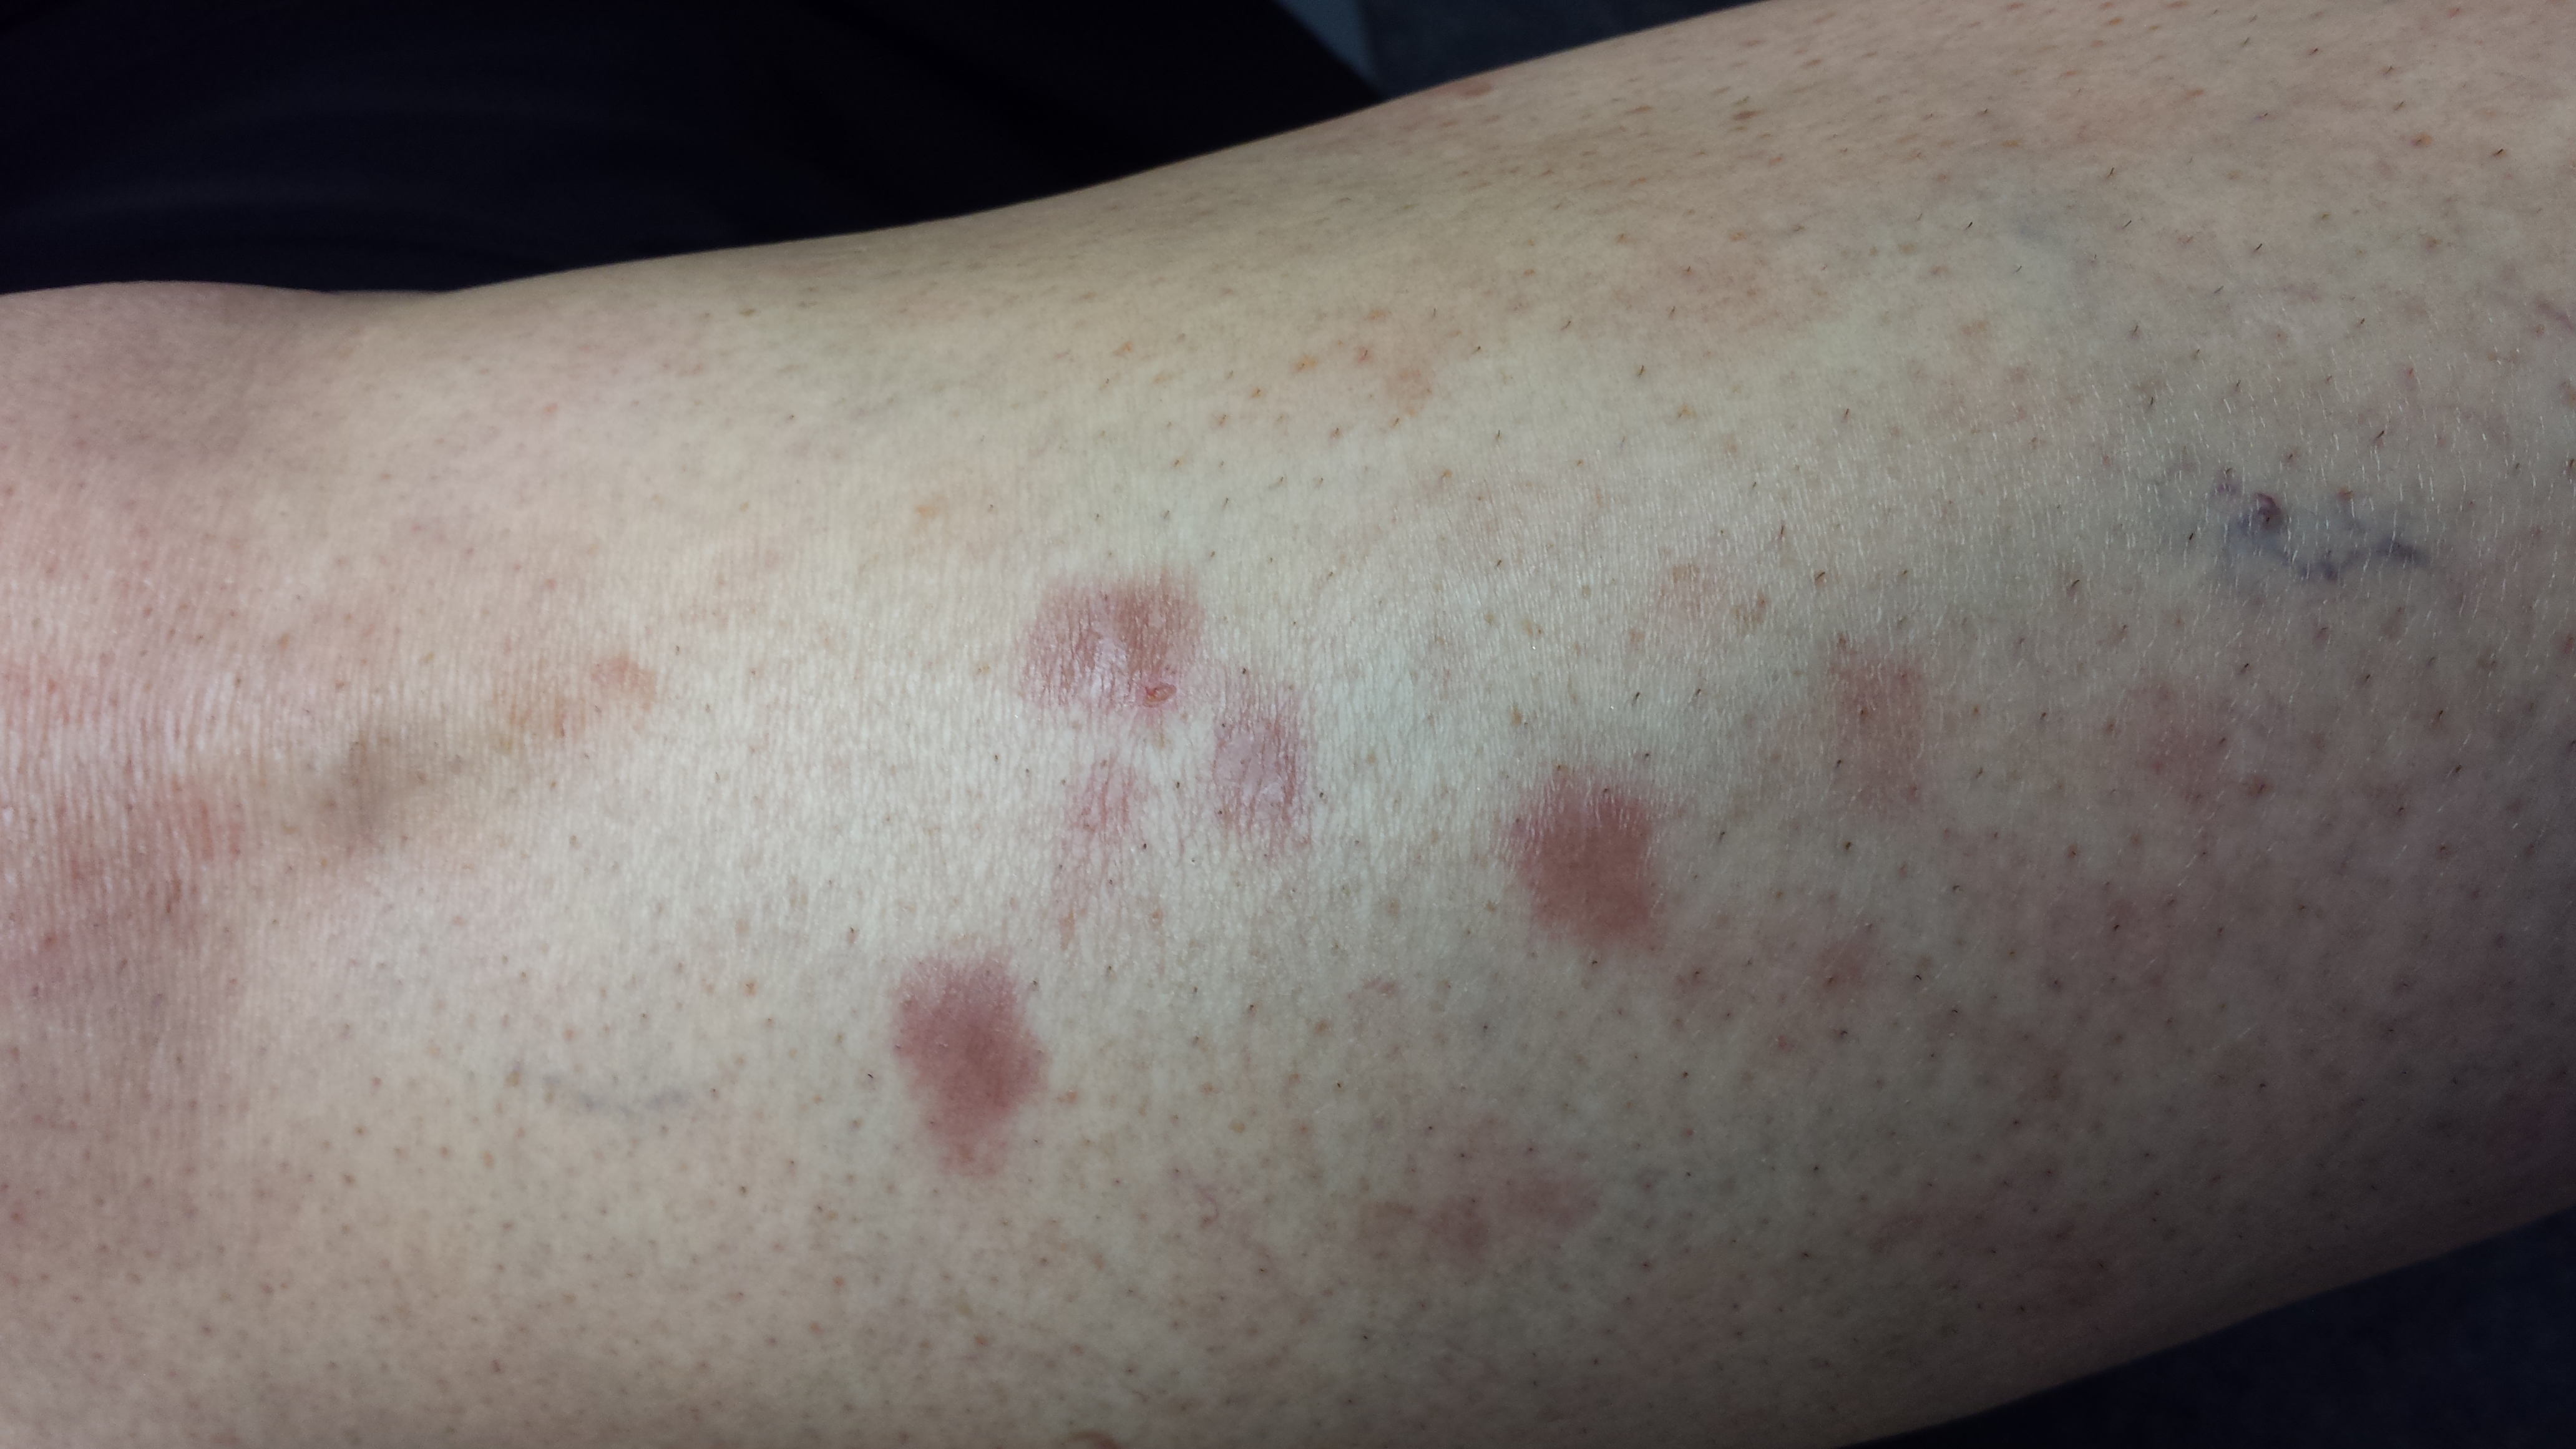
Several months ago, a 51-year-old woman first noticed brownish red lesions on her leg. She initially dismissed them as insect bites and regarded them as mostly a cosmetic concern. When the lesions failed to disappear after six months, her primary care provider referred the patient to dermatology. (In the interim, a friend did suggest ringworm as a diagnosis, but the OTC tolnaftate cream the patient tried had no effect.)
The patient claims to be quite healthy, which she attributes to walking several miles a day and working out at the gym every other day. She denies any shortness of breath, unexplained fever, or night sweats. There is no personal history of diabetes, but she has had glucose tolerance tests every six months for years because of a significant family history of the disease.
EXAMINATION
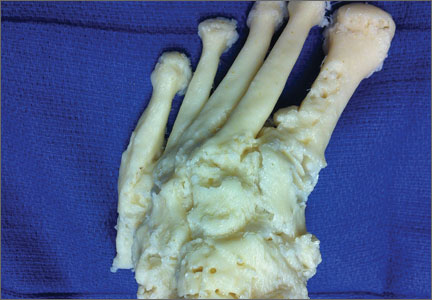
There are four intradermal shiny round nodules, averaging about 1.8 cm, on the upper anterior tibial area. The margins of the lesions are sharply drawn, and there is no surrounding erythema or increased warmth on palpation. The surfaces are quite uniform in texture.
Examination of her skin elsewhere reveals no noteworthy lesions. There is no palpable adenopathy in the groin on the affected side.
Results of a punch biopsy show interstitial and palisaded granulomas of the subcutaneous tissue, especially the dermis. Thickening of blood vessel walls and endothelial cell swelling are also noted.
What is the diagnosis?
DISCUSSION
Based on the appearance of the lesions, the patient’s family history, and the histopathologic findings, a diagnosis of necrobiosis lipoidica (NL) was made. When NL was first described in 1929, it was only seen in diabetic persons and thus was named necrobiosis lipoidica diabeticorum. By 1932, however, cases of NL were being reported in persons without diabetes—so the “diabeticorum” was dropped.
Only 0.3% of diabetic persons develop NL. In 15% of cases, NL precedes diabetes; in 60%, diabetes manifests first. Simultaneous diagnosis of both occurs about 25% of the time.
The cause of NL is still unknown. Most theories suggest it is related in some way to diabetes, since most persons with NL have a personal or family history of diabetes or register abnormal results to glucose tolerance testing. Furthermore, the microvascular changes seen in NL lesions are reminiscent of those seen in microangiopathic lesions in diabetic patients. Oddly enough, though, the presence or progression of NL does not correlate with how well controlled the patient’s diabetes is.
Other theories center on an autoimmune mechanism, based on demonstrable deposition of immunoglobulins, components of complement, and fibrinogen in vessel walls. High levels of TNF-a are found in many cases of NL, a fact that researchers are pursuing vigorously.
NL can manifest anywhere but is most common on the legs, where 75% of patients report no symptoms beyond a slight loss of sensation. The remaining 25% do report moderate to severe pain.
In terms of diagnosis, the appearance and history are sufficient in most cases. In this particular case, the lesions were fairly new and small, and the differential thus included such worrisome items as sarcoidosis or even Hansen’s disease. Less concerning differential items included granuloma annulare, other xanthomatous processes, and rheumatoid nodules.
In this case, a punch biopsy was necessary (the defect from which was closed carefully with interrupted sutures). Such procedures are discouraged in patients with larger and more advanced lesions, for fear of inducing a nonhealing wound. In fact, ulceration, usually from trauma, is the most feared complication of NL—and effective treatment is hard to come by.
This patient was treated with perilesional injection of triamcinolone suspension 10 mg per cc and given a prescription for 0.1% tacrolimus cream (to be applied twice daily). A follow-up visit was arranged for two months down the road. Her long-term prognosis is guarded, at best. Since she was already acutely aware of her risk for diabetes, there was no need for additional action in that arena.
Many other treatments have been tried for NL, with varying success, including dihydrochloroquine (Plaquenil and others) pentoxifylline, and TNF-a inhibitors.
TAKE-HOME LEARNING POINTS
• Early manifestations of necrobiosis lipoidica (NL) can be puzzling, and biopsy may be required for diagnosis.
• However, with advanced, obvious lesions, it is preferable to make the diagnosis of NL without biopsy, since punch biopsy can result in a nonhealing wound.
• Mature NL lesions become atrophic and yellowed, with marked telangiectasia formation on their surfaces.
• Just 0.3% of diabetic patients ever develop NL, but most affected persons have a family history of diabetes or an abnormal glucose tolerance test results, if not a personal history of diabetes.
Several months ago, a 51-year-old woman first noticed brownish red lesions on her leg. She initially dismissed them as insect bites and regarded them as mostly a cosmetic concern. When the lesions failed to disappear after six months, her primary care provider referred the patient to dermatology. (In the interim, a friend did suggest ringworm as a diagnosis, but the OTC tolnaftate cream the patient tried had no effect.)
The patient claims to be quite healthy, which she attributes to walking several miles a day and working out at the gym every other day. She denies any shortness of breath, unexplained fever, or night sweats. There is no personal history of diabetes, but she has had glucose tolerance tests every six months for years because of a significant family history of the disease.
EXAMINATION
There are four intradermal shiny round nodules, averaging about 1.8 cm, on the upper anterior tibial area. The margins of the lesions are sharply drawn, and there is no surrounding erythema or increased warmth on palpation. The surfaces are quite uniform in texture.
Examination of her skin elsewhere reveals no noteworthy lesions. There is no palpable adenopathy in the groin on the affected side.
Results of a punch biopsy show interstitial and palisaded granulomas of the subcutaneous tissue, especially the dermis. Thickening of blood vessel walls and endothelial cell swelling are also noted.
What is the diagnosis?
DISCUSSION
Based on the appearance of the lesions, the patient’s family history, and the histopathologic findings, a diagnosis of necrobiosis lipoidica (NL) was made. When NL was first described in 1929, it was only seen in diabetic persons and thus was named necrobiosis lipoidica diabeticorum. By 1932, however, cases of NL were being reported in persons without diabetes—so the “diabeticorum” was dropped.
Only 0.3% of diabetic persons develop NL. In 15% of cases, NL precedes diabetes; in 60%, diabetes manifests first. Simultaneous diagnosis of both occurs about 25% of the time.
The cause of NL is still unknown. Most theories suggest it is related in some way to diabetes, since most persons with NL have a personal or family history of diabetes or register abnormal results to glucose tolerance testing. Furthermore, the microvascular changes seen in NL lesions are reminiscent of those seen in microangiopathic lesions in diabetic patients. Oddly enough, though, the presence or progression of NL does not correlate with how well controlled the patient’s diabetes is.
Other theories center on an autoimmune mechanism, based on demonstrable deposition of immunoglobulins, components of complement, and fibrinogen in vessel walls. High levels of TNF-a are found in many cases of NL, a fact that researchers are pursuing vigorously.
NL can manifest anywhere but is most common on the legs, where 75% of patients report no symptoms beyond a slight loss of sensation. The remaining 25% do report moderate to severe pain.
In terms of diagnosis, the appearance and history are sufficient in most cases. In this particular case, the lesions were fairly new and small, and the differential thus included such worrisome items as sarcoidosis or even Hansen’s disease. Less concerning differential items included granuloma annulare, other xanthomatous processes, and rheumatoid nodules.
In this case, a punch biopsy was necessary (the defect from which was closed carefully with interrupted sutures). Such procedures are discouraged in patients with larger and more advanced lesions, for fear of inducing a nonhealing wound. In fact, ulceration, usually from trauma, is the most feared complication of NL—and effective treatment is hard to come by.
This patient was treated with perilesional injection of triamcinolone suspension 10 mg per cc and given a prescription for 0.1% tacrolimus cream (to be applied twice daily). A follow-up visit was arranged for two months down the road. Her long-term prognosis is guarded, at best. Since she was already acutely aware of her risk for diabetes, there was no need for additional action in that arena.
Many other treatments have been tried for NL, with varying success, including dihydrochloroquine (Plaquenil and others) pentoxifylline, and TNF-a inhibitors.
TAKE-HOME LEARNING POINTS
• Early manifestations of necrobiosis lipoidica (NL) can be puzzling, and biopsy may be required for diagnosis.
• However, with advanced, obvious lesions, it is preferable to make the diagnosis of NL without biopsy, since punch biopsy can result in a nonhealing wound.
• Mature NL lesions become atrophic and yellowed, with marked telangiectasia formation on their surfaces.
• Just 0.3% of diabetic patients ever develop NL, but most affected persons have a family history of diabetes or an abnormal glucose tolerance test results, if not a personal history of diabetes.
Depletive Fluid Management Strategy During Weaning from Mechanical Ventilation Can Lower VAP Rates
Clinical question: What is the benefit associated with a depletive fluid management strategy on ventilator-associated complication (VAC) and ventilator-associated pneumonia (VAP) during weaning from mechanical ventilation?
Background: VAP is common in the ICU. Pulmonary edema predisposes patients to pneumonia by altering the alveolar microenvironment through enhancement of bacterial colonization and infectivity and a decrease in host bactericidal capacities. A fluid management strategy aimed at lowering lung fluid balance may prove useful in reducing both VAC and VAP.
Study design: Randomized controlled trial.
Setting: Nine ICUs in Europe and South America, between May 2007 and July 2009.
Synopsis: Data from the B-type Natriuretic Peptide for the Management of Weaning (BMW) trial was used to compare the cumulative incidence of VAC and VAP between the biomarker-driven, depletive fluid management group and the usual care group during the 14 days following randomization. The trial enrolled 304 randomized patients, 152 in each group.
Compared with usual care, the interventional strategy was associated with a higher proportion of patients receiving diuretics, in higher doses, resulting in a significantly more negative fluid balance during weaning and a shorter duration of mechanical ventilation. VAC (as defined by worsening oxygenation) occurred in 13.2% of patients during the 14 days following randomization: 17.8% in the usual care group and 8.6% in the interventional group. VAP occurred in 13.5% during the 14 days following randomization: 17.8% in the usual care group and 9.2% in the interventional group.
Bottom line: A biomarker-driven, depletive fluid strategy decreases the cumulative incidence of VAC and VAP.
Citation: Mekontso Dessap A, Katsahian S, Roche-Campo F, et al. Ventilator-associated pneumonia during weaning from mechanical ventilation: role of fluid management. Chest. 2014;146(1):58-65.
Visit our website for more physician reviews of HM-related research.
Antibiotic Therapy Guidelines for Pediatric Pneumonia Helpful, Not Hurtful
Hospitalists need not fear negative consequences when prescribing guideline-recommended antibiotic therapy for children hospitalized with community-acquired pneumonia (CAP), according to a recent study conducted at Cincinnati Children’s Hospital Medical Center (CCHMC).
"Guideline-recommended therapy for pediatric pneumonia did not result in different outcomes than nonrecommended [largely cephalosporin] therapy," lead author and CCHMC-based hospitalist Joanna Thomson MD, MPH, says in an email to The Hospitalist.
Published in the Journal of Hospital Medicine, the study followed the outcomes of 168 pediatric inpatients ages 3 months to 18 years who were prescribed empiric guideline-recommended therapy, which advises using an aminopenicillin first rather than a broad-spectrum antibiotic. The study focused on patients’ outcomes, specifically length of stay (LOS), total cost of hospitalization, and inpatient pharmacy costs, and found no difference in LOS or costs for patients treated according to guidelines compared with those whose treatment varied from the recommendations.
"Given growing concerns regarding antimicrobial resistance, it is pretty easy to extrapolate the benefits of using narrow-spectrum therapy, but we wanted to make sure that it wasn't resulting in negative unintended consequences," Dr. Thomson says. "Indeed, use of guideline-recommended therapy did not change our outcomes."
However, most patients hospitalized with CAP do not currently receive guideline-recommended therapy, according to Dr. Thomson. CCHMC had been one of those institutions overprescribing cephalosporin, with nearly 70% of children admitted with pneumonia receiving the antibiotic. That practice has since changed, she notes.
"The majority of hospitalized patients in the U.S. still receive broad-spectrum cephalosporins," Dr. Thomson says. "I suspect that this may partially be due to fears of unintended negative consequences. We should all be good stewards and prescribe guideline-recommended therapy whenever possible."
Visit our website for more information on antibiotic prescription practices.
Brentuximab combinations highly active in Hodgkin lymphoma

Photo courtesy of ASH
SAN FRANCISCO—Two recent studies have shown combination therapy with brentuximab vedotin to be highly active in newly diagnosed patients with Hodgkin lymphoma (HL) and in relapsed or refractory patients after frontline therapy.
The first study evaluated brentuximab with ABVD or AVD and the second with bendamustine.
Objective response rates were 95% with ABVD, 96% with AVD, and 96% with bendamustine.
Both studies were presented at the 2014 ASH Annual Meeting, and both were sponsored by Seattle Genetics, Inc., the company developing brentuximab vedotin.
Brentuximab with ABVD or AVD
Standard frontline therapy with ABVD (adriamycin, bleomycin, vinblastine, and dacarbazine) or AVD (the same regimen without bleomycin) fails to cure up to 30% of patients with HL.
So investigators decided to try a new approach to increase efficacy and reduce toxicity—combining brentuximab with standard therapy.
Joseph M. Connors, MD, of the BC Cancer Agency and University of British Columbia in Vancouver, Canada, presented long-term outcomes of the brentuximab-ABVD combination as abstract 292.*
Phase 1 dose-escalation study
The key initial study of the combination determined the maximum tolerated dose of brentuximab to be 1.2 mg/kg delivered on a 2-week schedule to match the other agents in the ABVD regimen. Brentuximab was delivered for up to 6 cycles.
Of the 50 patients treated, 75% were males with an ECOG status of 0 or 1. Their median age was 32.5 years (range, 18 to 59). Approximately 80% were stage III or IV.
“We learned several key lessons from that initial study,” Dr Connors said. “The first was that when one adds brentuximab vedotin to the full-dose combination ABVD, unacceptable levels of pulmonary toxicity occurred, with 44% of the patients eventually experiencing pulmonary toxicity, typically manifest between the third and sixth cycle of treatment.”
The toxicity resolved in 9 of the 11 patients, but was fatal in 2. The median time to resolution was 2.6 weeks.
Eight patients discontinued bleomycin but were able to complete treatment with AVD and brentuximab.
“When we dropped bleomycin from the combination and shifted to AVD without bleomycin, no patients experienced pulmonary toxicity,” Dr Connors added.
Ultimately, the combination produced a response rate of 95% with ABVD and 96% with AVD.
Long-term follow-up
Investigators then assessed the durability of the response and the time distribution of any relapses.
All but 1 patient was available for follow-up. Patients were followed for a median of 45 months in the ABVD arm and 36 months in the AVD arm.
In the ABVD arm, 22 of 24 patients are living, and all 26 patients in the AVD group are alive. Altogether, there have been 5 relapses—3 in the ABVD arm (occurring at 9, 22, and 23 months) and 2 in the AVD arm (occurring at 7 and 22 months).
The 3-year failure-free survival is 79% with ABVD and 92% with AVD. And the 3-year overall survival is 92% in the ABVD arm and 100% in the AVD arm.
No deaths from HL have occurred, and all 5 relapsed patients have undergone autologous stem cell transplant. One of those has subsequently relapsed.
“So far,” Dr Connors said, “survival has been excellent.” And responses are durable.
“This has encouraged activation of the large, international trial,” Dr Connors said, comparing AVD plus brentuximab to standard ABVD in frontline treatment of HL.
Brentuximab with bendamustine
Brentuximab is also active as a single agent in relapsed/refractory HL, producing a 34% complete response (CR) rate. And the alkylating agent bendamustine produces a 33% CR rate in these patients. Furthermore, both agents have manageable safety profiles and different mechanisms of action.
Investigators therefore hypothesized that brentuximab in combination with bendamustine could induce more CRs in HL patients with relapsed or refractory disease after frontline therapy.
Ann LaCasce, MD, of Dana-Farber Cancer Institute in Boston, presented the data at ASH as abstract 293.*
Ten patients were enrolled in the phase 1 portion of the study to determine the optimal dose level of bendamustine and to assess safety and tolerability.
No dose-limiting toxicities were observed. So the investigators used bendamustine at 90 mg/m2 and brentuximab at 1.8 mg/kg. Patients received a median of 2 cycles (range, 1 to 6) of combination therapy.
Patients had the option to proceed to an autologous stem cell transplant at any time after cycle 2 and could receive brentuximab monotherapy thereafter for up to 16 total doses.
The phase 2 expansion portion enrolled 44 patients and assessed the best response, duration of response, and progression-free survival.
Results
Patients were a median age of 37 years (range, 27 to 51), and 57% were male. Ninety-eight percent were ECOG status 0 or 1, and 54% had stage III or IV disease at diagnosis.
The majority of patients had received ABVD as frontline therapy, Dr LaCasce pointed out.
The most common treatment-emergent adverse event was infusion-related reactions, accounting for 96% of the events. Dyspnea (15%), chills (13%), and flushing (13%) were the most common symptoms, and hypotension requiring vasopressor support also occurred.
Most reactions occurred within 24 hours of the cycle 2 infusion and were considered related to both agents. However, delayed hypersensitivity reactions also occurred, Dr LaCasce said, the most common being rash in 14 patients up to 22 days after infusion.
“Based on the number of infusion-related reactions after 24 patients, the protocol was amended to require mandatory corticosteroids and anthistamine premedication,” Dr LaCasce explained. “[T]his resulted in a significant decrease in the severity of the infusion-related reactions.”
The best clinical response for the 48 evaluable patients was 83% CR and 13% partial remission, for an objective response rate of 96%.
The median progression-free survival has not yet been reached, and the combination has had no negative impact on stem cell mobilization or engraftment to date.
The response rate compares very favorably to historical data, Dr LaCasce said, and the combination represents a promising salvage regimen for HL patients. ![]()
*Data in the presentation differ from the abstract.
FDA approves pathogen inactivation system for platelets
The US Food and Drug Administration (FDA) has approved the INTERCEPT Blood System for platelets, the first system of its kind to be approved in the US.
It is used to inactivate viruses, bacteria, spirochetes, parasites, and leukocytes in apheresis platelet components.
This can reduce the risk of transfusion-transmitted infection and, potentially, transfusion-associated graft-vs-host disease, although the system cannot inactivate all pathogens.
Certain non-enveloped viruses (such as HAV, HEV, B19, and poliovirus) and Bacillus cereus spores have demonstrated resistance to the INTERCEPT process.
Earlier this week, the FDA approved the INTERCEPT Blood System for plasma (also the first system of its kind to gain FDA approval).
The platelet and plasma systems use the same illumination device, the same active compound (amotosalen), and very similar production steps.
The INTERCEPT systems target a basic biological difference between the therapeutic components of blood. Platelets, plasma, and red blood cells do not require functional DNA or RNA for therapeutic efficacy. But pathogens and white blood cells do, in order to transmit infection.
The INTERCEPT systems use a proprietary molecule that, when activated by UVA light, binds to and blocks the replication of DNA and RNA, preventing nucleic acid replication and rendering the pathogen inactive.
The INTERCEPT Blood System for platelets has been approved in Europe since 2002 and is currently used in 20 countries.
The system was recently made available in the US and its territories under an investigational device exemption study to reduce the risk of transfusion-transmitted dengue and Chikungunya viruses, both of which are epidemic in the Caribbean region, including Puerto Rico, as well as sporadically in the southern US. No approved blood bank screening tests are available for either virus.
Researchers have evaluated INTERCEPT-processed platelets in 10 controlled clinical trials. Details on these trials can be found in the package insert. ![]()
Studies show TRALI underreported, TACO on the decline
Credit: Elise Amendola
Two studies shed new light on the prevalence of transfusion-related acute lung injury (TRALI) and transfusion-associated circulatory overload (TACO) in the US.
The research showed that postoperative TRALI is significantly underreported and more common than previously thought, with an overall rate of 1.4%.
And the rate of TACO is on the decline, but the risk to surgical patients remains high, at 4%, similar to previous TACO estimates in non-surgical patients.
“An accurate understanding of the risks associated with blood transfusions is essential when determining the safety and appropriateness of transfusion therapies for patients,” said Daryl Kor, MD, senior author of both studies and an associate professor at Mayo Clinic in Rochester, Minnesota.
“Our research provides a greater awareness of the incidence of TRALI and TACO in surgical patients, a population that has been perhaps underrepresented in studies in this area. We believe this to be an important first step in our efforts to prevent these life-threatening transfusion complications.”
Dr Kor and his colleagues described this research in Anesthesiology alongside a related editorial.
In the two retrospective studies, the researchers examined the incidence of TRALI in 3379 patients and TACO in 4070 patients who received blood transfusions during non-cardiac surgery under general anesthesia in 2004 and 2011.
Using a novel algorithm, followed by a rigorous manual review, the team performed a detailed epidemiologic analysis for both complications.
The first study showed that TRALI occurred in 1.4% of surgical patients, with higher rates in specific surgical populations such as those having surgery inside the chest cavity, on major blood vessels, or having an organ transplant. Patients who received larger volumes of blood were also at increased risk.
Previous studies investigating TRALI rates have primarily focused on the critically ill and reported variable incidence rates. Many studies have reported incidences between 0.02% and 0.05%.
The second study showed that TACO occurs in 4.3% of surgical patients, with higher rates associated with increased volume of blood transfused, advanced age, and total intraoperative fluid balance. Again, patients having surgery inside the chest cavity, on major blood vessels, or organ transplants were at the greatest risk.
The study also revealed that the rate of TACO decreased significantly from 2004 to 2011—from 5.5% to 3%. This decline was not fully explained by any of the patient or transfusion characteristics evaluated in the study.
The researchers said future studies are needed to further explore which mechanisms and risk factors are responsible for TACO and TRALI.
“With improved understanding of the mechanisms underlying TRALI and TACO, we may be able to refine the novel electronic algorithms used to screen patients in these studies,” Dr Kor said. “Ultimately, we hope to develop a real-time prediction model for these complications so that we can identify those at greatest risk and perhaps implement strategies to reduce this risk.” ![]()
NICE backs dabigatran for VTE

Credit: CDC
The UK’s National Institute for Health and Care Excellence (NICE) has published a final guidance recommending the anticoagulant dabigatran (Pradaxa, Boehringer Ingelheim) as an option for treating and preventing recurrent deep vein thrombosis (DVT) and pulmonary embolism (PE) in adults.
The guidance says dabigatran can provide a benefit for these patients, with cost- and clinical-effectiveness similar to rivaroxaban and added convenience compared to warfarin.
“For many people, using warfarin can be difficult because of the need for frequent tests to see if the blood is clotting properly, and having to adjust the dose of the
drug if it is not,” said Carole Longson, NICE Health Technology Evaluation Centre Director.
“The appraisal committee felt that dabigatran represents a potential benefit for many people who have had a DVT or PE, particularly those who have risk factors for recurrence of a blood clot and who therefore need longer-term treatment. We are pleased, therefore, to be able to recommend dabigatran as a cost-effective option for treating DVT and PE and preventing further episodes in adults.”
NICE expects dabigatran to be available on the National Health Service within 3 months.
Cost considerations
Dabigatran costs £65.90 for a 60-capsule pack of the 150 mg or 110 mg doses (excluding tax) and £2.20 per day of treatment, although costs may vary in different settings.
The most plausible incremental cost-effectiveness ratio (ICER) for dabigatran compared with warfarin for acute treatment was uncertain.
However, both Boehringer Ingelheim’s and the evidence review group’s exploratory ICER remained in the range that could be considered a cost-effective use of National Health Service resources. That is, both were under £20,000 per quality-adjusted life-year gained (QALY).
Neither Boehringer Ingelheim nor the evidence review group found any significant difference in efficacy between dabigatran and rivaroxaban for acute treatment of venous thromboembolism (VTE) in their indirect comparisons, and the costs were also very similar between these two treatments.
For combined treatment and secondary prevention of VTE, the appraisal committee said the company’s base case ICER for dabigatran compared with warfarin was likely too low (£9973 per QALY gained).
But the evidence review group’s exploratory base case for dabigatran compared with warfarin may have overestimated the ICER (£35,786 per QALY gained). So the ICER probably lies somewhere between these estimates.
Clinical evidence
To assess the clinical effectiveness of dabigatran, the appraisal committee evaluated data from the RECOVER, RE-MEDY, and RESONATE trials.
In the first RE-COVER trial, dabigatran proved noninferior to warfarin for preventing VTE recurrence, and rates of major bleeding were similar between the treatment arms.
However, patients were more likely to discontinue dabigatran due to adverse events. Results from this trial were presented at ASH 2009 and published in NEJM.
The RE-COVER II trial also suggested that dabigatran was noninferior to warfarin for preventing VTE recurrence and related deaths, and dabigatran was associated with a lower rate of major bleeding.
Rates of death, adverse events, and acute coronary syndromes were similar between the treatment arms. Results from this trial were published in Circulation in 2013.
The RE-MEDY and RE-SONATE trials were designed to evaluate dabigatran as extended VTE prophylaxis. Results of both trials were reported in a single NEJM article published in 2013.
The RE-MEDY trial suggested that dabigatran was noninferior to warfarin as extended prophylaxis for recurrent VTE, and warfarin presented a significantly higher risk of bleeding.
Results of the RE-SONATE trial indicated that dabigatran was superior to placebo for preventing recurrent VTE, although the drug significantly increased the risk of major or clinically relevant bleeding. ![]()
Effect of Hospitalist Discontinuity on AE
Although definitions vary, continuity of care can be thought of as the patient's experience of a continuous caring relationship with an identified healthcare professional.[1] Research in ambulatory settings has found that patients who see their primary care physician for a higher proportion of office visits have higher patient satisfaction, better hypertensive control, lower risk of hospitalization, and fewer emergency department visits.[2, 3, 4, 5] Continuity with a single hospital‐based physician is difficult to achieve because of the need to provide care 24 hours a day, 7 days a week. Key clinical information may be lost during physician‐to‐physician handoffs (eg, at admission, at the end of rotations on service) during hospitalization. Our research group recently found that lower hospital physician continuity was associated with modestly increased hospital costs, but also a trend toward lower readmissions.[6] We speculated that physicians newly taking over patient care from colleagues reassess diagnoses and treatment plans. This reassessment may identify errors missed by the previous hospital physician. Thus, discontinuity may theoretically help or hinder the provision of safe hospital care.
We sought to examine the relationship between hospital physician continuity and the incidence of adverse events (AEs). We combined data from 2 previously published studies by our research group; one investigated the relationship between hospital physician continuity and costs and 30‐day readmissions, the other assessed the impact of unit‐based interventions on AEs.[6, 7]
METHODS
Setting and Study Design
This retrospective, observational study was conducted at Northwestern Memorial Hospital, an 876‐bed tertiary care teaching hospital in Chicago, Illinois, and was approved by the institutional review board of Northwestern University. Subjects included patients admitted to an adult nonteaching hospitalist service between March 1, 2009 and December 31, 2011. Hospitalists on this service worked without resident physicians in rotations usually lasting 7 consecutive days beginning on Mondays and ending on Sundays. Hospitalists were allowed to switch portions of their schedule with one another, creating the possibility that certain rotations may have been slightly shorter or longer than 7 days. Hospitalists gave verbal sign‐out via telephone to the hospitalist taking over their service on the afternoon of the last day of their rotation. These handoffs customarily involved both hospitalists viewing the electronic health record during the discussion but were not standardized. Night hospitalists performed admissions and cross‐coverage each night from 7 pm to 7 am. Night hospitalists printed history and physicals for day hospitalists, but typically did not give verbal sign‐out on new admissions.
Acquisition of Study Population Data
We identified all patients admitted to the nonteaching hospitalist service using the Northwestern Medicine Enterprise Data Warehouse (EDW), an integrated repository of all clinical and research data sources on the campus. We excluded patients admitted under observation status, those initially admitted to other services (eg, intensive care, general surgery), those discharged from other services, and those cared for by advanced practice providers (ie, nurse practitioners and physician assistants).
Predictor Variables
We identified physicians completing the primary service history and physicals (H&P) and progress notes throughout patients' hospitalizations to calculate 2 measures of continuity: the Number of Physicians Index (NPI), and the Usual Provider of Continuity (UPC) Index.[8, 9] The NPI represented the total number of unique hospitalists completing H&Ps and/or progress notes for a patient. The UPC was calculated as the largest number of notes signed by a single hospitalist divided by the total number of hospitalist notes for a patient. For example, if Dr. John Smith wrote notes on the first 4 days of a patient's hospital stay, and Dr. Mary Jones wrote notes on the following 2 days (total stay=6 days), the NPI would be 2 and the UPC would be 0.67. Therefore, higher NPI and lower UPC designate lower continuity. Significant events occurring during the nighttime were documented in separate notes titled cross‐cover notes. These cross‐cover notes were not included in the calculation of NPI or UPC. In the rare event that 2 or more progress notes were written on the same day, we selected the one used for billing to calculate UPC and NPI.
Outcome Variables
We used AE data from a study we conducted to assess the impact of unit‐based interventions to improve teamwork and patient safety, the methods of which have been previously described.[7] Briefly, we used a 2‐stage medical record review similar to that performed in prior studies.[10, 11, 12, 13] In the first stage, we identified potential AEs using automated queries of the Northwestern Medicine EDW. These queries were based on screening criteria used in the Harvard Medical Practice Study and the Institute for Healthcare Improvement (IHI) Global Trigger Tool.[12, 13] Examples of queries included abnormal laboratory values (eg, international normalized ratio [INR] >6 after hospital day 2 and excluding patients with INR >4 on day 1), administration of rescue medications (eg, naloxone), certain types of incident reports (eg, pressure ulcer), International Classification of Diseases, Ninth Revision (ICD‐9) codes indicating hospital‐acquired conditions (eg, venous thromboembolism), and text searches of progress notes and discharge summaries using natural language processing.[14] Prior research by our group confirmed these automated screens identify a similar number of AEs as manual medical record screening.[14] For each patient with 1 or more potential AE, a research nurse performed a medical record abstraction and created a description of each potential AE.
In the second stage, 2 physician researchers independently reviewed each potential AE in a blinded fashion to determine whether or not an AE was present. An AE was defined as injury due to medical management rather than the natural history of the illness,[15] and included injuries that prolonged the hospital stay or produced disability as well as those resulting in transient disability or abnormal lab values.[16] After independent review, physician reviewers discussed discrepancies in their ratings to achieve consensus.
We tested the reliability of medical record abstractions in our prior study by conducting duplicate abstractions and consensus ratings for a randomly selected sample of 294 patients.[7] The inter‐rater reliability was good for determining the presence of AEs (=0.63).
Statistical Analyses
We calculated descriptive statistics for patient characteristics. Primary discharge diagnosis ICD‐9 codes were categorized using the Healthcare Cost and Utilization Project Clinical Classification Software.[17] We created multivariable logistic regression models with the independent variable being the measure of continuity (NPI or UPC) and the dependent variable being experiencing 1 or more AEs. Covariates included patient age, sex, race, payer, night admission, weekend admission, intensive care unit stay, Medicare Severity Diagnosis Related Group (MS‐DRG) weight, and total number of Elixhauser comorbidities.[18] The length of stay (LOS) was also included as a covariate, as longer LOS increases the probability of discontinuity and may increase the risk for AEs. Because MS‐DRG weight and LOS were highly correlated, we created several models; the first including both as continuous variables, the second including both categorized into quartiles, and a third excluding MS‐DRG weight and including LOS as a continuous variable. Our prior study assessing the impact of unit‐based interventions did not show a statistically significant difference in the pre‐ versus postintervention period, thus we did not include study period as a covariate.
RESULTS
Patient Characteristics
Our analyses included data from 474 hospitalizations. Patient characteristics are shown in Table 1. Patients were a mean 51.118.8 years of age, hospitalized for a mean 3.43.1 days, included 241 (50.8%) women, and 233 (49.2%) persons of nonwhite race. The mean and standard deviation of NPI and UPC were 2.51.0 and 0.60.2. Overall, 47 patients (9.9%) experienced 55 total AEs. AEs included 31 adverse drug events, 6 falls, 5 procedural injuries, 4 manifestations of poor glycemic control, 3 hospital‐acquired infections, 2 episodes of acute renal failure, 1 episode of delirium, 1 pressure ulcer, and 2 categorized as other.
| Characteristic | Value |
|---|---|
| |
| Mean age (SD), y | 55.1 (18.8) |
| Mean length of stay (SD), d | 3.4 (3.1) |
| Women, n (%) | 241 (50.8) |
| Nonwhite race, n (%) | 233 (49.2) |
| Payer, n (%) | |
| Private | 180 (38) |
| Medicare | 165 (34.8) |
| Medicaid | 47 (9.9) |
| Self‐pay/other | 82 (17.3) |
| Night admission, n (%) | 245 (51.7) |
| Weekend admission, n (%) | 135 (28.5) |
| Intensive care unit stay, n (%) | 18 (3.8) |
| Diagnosis, n (%) | |
| Diseases of the circulatory system | 95 (20.0) |
| Diseases of the digestive system | 65 (13.7) |
| Diseases of the respiratory system | 49 (10.3) |
| Injury and poisoning | 41 (8.7) |
| Diseases of the skin and soft tissue | 31 (6.5) |
| Symptoms, signs, and ill‐defined conditions and factors influencing health status | 28 (5.9) |
| Endocrine, nutritional, and metabolic diseases and immunity disorders | 25 (5.3) |
| Diseases of the genitourinary system | 24 (5.1) |
| Diseases of the musculoskeletal system and connective tissue | 23 (4.9) |
| Diseases of the nervous system | 23 (4.9) |
| Other | 70 (14.8) |
| Mean no. of Elixhauser comorbidities (SD) | 2.3 (1.7) |
| Mean MS‐DRG weight (SD) | 1.0 (1.0) |
| Mean NPI (SD) | 2.5 (1.0) |
| Mean UPC (SD) | 0.6 (0.2) |
Association Between Continuity and Adverse Events
In unadjusted models, each 1‐unit increase in the NPI (ie, less continuity) was significantly associated with the incidence of 1 or more AEs (odds ratio [OR]=1.75; P<0.001). However, UPC was not associated with incidence of AEs (OR=1.03; P=0.68) (Table 2). Across all adjusted models, neither NPI nor UPC was significantly associated with the incidence of AEs. The direction of the effect of discontinuity on AEs was inconsistent across models. Though all 3 adjusted models using NPI as the independent variable showed a trend toward increased odds of experiencing 1 or more AE with discontinuity, 2 of the 3 models using UPC showed trends in the opposite direction.
| NPI OR (95% CI)* | P Value | UPC OR (95% CI)* | P Value | ||
|---|---|---|---|---|---|
| |||||
| Unadjusted model | 1.75 (1.332.29) | <0.0001 | 1.03 (0.89‐1.21) | 0.68 | |
| Adjusted models | |||||
| Model 1 | MS‐DRG and LOS continuous | 1.16 (0.781.72) | 0.47 | 0.96 (0.791.14) | 0.60 |
| Model 2 | MS‐DRG and LOS in quartiles | 1.38 (0.981.94) | 0.07 | 1.05 (0.881.26) | 0.59 |
| Model 3 | MS‐DRG dropped, LOS continuous | 1.14 (0.771.70) | 0.51 | 0.95 (0.791.14) | 0.56 |
DISCUSSION
We found that hospitalist physician continuity was not associated with the incidence of AEs. Our findings are somewhat surprising because of the high value placed on continuity of care and patient safety concerns related to handoffs. Key clinical information may be lost when patient care is transitioned to a new hospitalist shortly after admission (eg, from a night hospitalist) or at the end of a rotation. Thus, it is logical to assume that discontinuity inherently increases the risk for harm. On the other hand, a physician newly taking over patient care from another may not be anchored to the initial diagnosis and treatment plan established by the first. This second look could potentially prevent missed/delayed diagnoses and optimize the plan of care.[19] These countervailing forces may explain our findings.
Several other potential explanations for our findings should be considered. First, the quality of handoffs may have been sufficient to overcome the potential for information loss. We feel this is unlikely given that little attention had been dedicated to improving the quality of patient handoffs among hospitalists in our institution. Notably, though a number of studies have evaluated resident physician handoffs, most of the work has focused on night coverage, and little is known about the quality of attending handoffs.[20] Second, access to a fully integrated electronic health record may have assisted hospitalists in complementing information received during handoffs. For example, a hospitalist about to start his or her rotation may have remotely accessed and reviewed patient medical records prior to receiving the phone handoff from the outgoing hospitalist. Third, other efforts to improve patient safety may have reduced the overall risk and provided some resilience in the system. Unit‐based interventions, including structured interdisciplinary rounds and nurse‐physician coleadership, improved teamwork climate and reduced AEs in the study hospital over time.[7]
Another factor to consider relates to the fact that hospital care is provided by teams of clinicians (eg, nurses, specialist physicians, therapists, social workers). Hospital teams are often large and have dynamic team membership. Similar to hospitalists, nurses, physician specialists, and other team members handoff care throughout the course of a patient's hospital stay. Yet, discontinuity for each professional type may occur at different times and frequencies. For example, a patient may be handed off from one hospitalist to another, yet the care continues with the same cardiologist or nurse. Future research should better characterize hospital team complexity (eg, size, relationships among members) and dynamics (eg, continuity for various professional types) and the impact of these factors on patient outcomes.
Our findings are important because hospitalist physician discontinuity is common during hospital stays. Hospital medicine groups vary in their staffing and scheduling models. Policies related to admission distribution and rotation length (consecutive days worked) systematically impact physician continuity. Few studies have evaluated the effect on continuity on hospitalized patient outcomes, and no prior research, to our knowledge, has explored the association of continuity on measures of patient safety.[6, 21, 22] Though our study might suggest that staffing models have little impact on patient safety, as previously mentioned, other team factors may influence patient outcomes.
Our study has several limitations. First, we assessed the impact of continuity on AEs in a single site. Although the 7 days on/7 days off model is the most common scheduling pattern used by adult hospital medicine groups,[23] staffing models and patient safety practices vary across hospitals, potentially limiting the generalizability of our study. Second, continuity can be defined and measured in a variety of ways. We used 2 different measures of physician continuity. As previously mentioned, assessing continuity of other clinicians may allow for a more complete understanding of the potential problems related to fragmentation of care. Third, this study excluded patients who experienced care transitions from other hospitals or other units within the hospital. Patients transferred from other hospitals are often complex, severely ill, and may be at higher risk for loss of key clinical information. Fourth, we used automated screens of an EDW to identify potential AEs. Although our prior research found that this method identified a similar number of AEs as manual medical record review screening, there was poor agreement between the 2 methods. Unfortunately, there is no gold standard to identify AEs. The EDW‐facilitated method allowed us to feasibly screen a larger number of charts, increasing statistical power, and minimized any potential bias that might occur during a manual review to identify potential AEs. Finally, we used data available from 2 prior studies and may have been underpowered to detect a significant association between continuity and AEs due to the relatively low percentage of patients experiencing an AE. In a post hoc power calculation, we estimated that we had 70% power to detect a 33% change in the proportion of patients with 1 or more AE for each 1‐unit increase in NPI, and 80% power to detect a 20% change for each 0.1‐unit decrease in UPC.
CONCLUSION
In conclusion, we found that hospitalist physician continuity was not associated with the incidence of AEs. We speculate that hospitalist continuity is only 1 of many team factors that may influence patient safety, and that prior efforts within our institution may have reduced our ability to detect an association. Future research should better characterize hospital team complexity and dynamics and the impact of these factors on patient outcomes.
Disclosures
This project was supported by a grant from the Agency for Healthcare Research and Quality and an Excellence in Academic Medicine Award, administered by Northwestern Memorial Hospital. The authors report no conflicts of interest.
- , , . What is “continuity of care”? J Health Serv Res Policy. 2006;11:248–250.
- , . Interpersonal continuity of care and care outcomes: a critical review. Ann Fam Med. 2005;3:159–166.
- , , , . The association between continuity of care and outcomes: a systematic and critical review. J Eval Clin Pract. 2010;16:947–956.
- , . Interpersonal continuity of care and patient satisfaction: a critical review. Ann Fam Med. 2004;2:445–451.
- , , , . Continuity of care in a family practice residency program. Impact on physician satisfaction. J Fam Pract. 1990;31:69–73.
- , , , et al. The impact of hospitalist discontinuity on hospital cost, readmissions, and patient satisfaction. J Gen Intern Med. 2014;29:1004–1008.
- , , , et al. Implementation of unit‐based interventions to improve teamwork and patient safety on a medical service [published online ahead of print June 11, 2014]. Am J Med Qual. doi: 10.1177/1062860614538093.
- . Measuring provider continuity in ambulatory care: an assessment of alternative approaches. Med Care. 1979;17:551–565.
- . Defining and measuring interpersonal continuity of care. Ann Fam Med. 2003;1:134–143.
- U.S. Department of Health and Human Services. Agency for Healthcare Research and Quality. Adverse events in hospitals: national incidence among medical beneficiaries. Available at: http://psnet.ahrq.gov/resource.aspx?resourceID=19811. Published November 2010. Accessed on December 15, 2014.
- , , , et al. “Global trigger tool” shows that adverse events in hospitals may be ten times greater than previously measured. Health Aff (Millwood). 2011;30:581–589.
- , , , et al. A study of medical injury and medical malpractice. N Engl J Med. 1989;321:480–484.
- , , , et al. Incidence and types of adverse events and negligent care in Utah and Colorado. Med Care. 2000;38:261–271.
- , , , et al. Comparison of traditional trigger tool to data warehouse based screening for identifying hospital adverse events. BMJ Qual Saf. 2013;22:130–138.
- , , , et al. Incidence of adverse events and negligence in hospitalized patients. Results of the Harvard Medical Practice Study I. N Engl J Med. 1991;324:370–376.
- , , . Safety of patients isolated for infection control. JAMA. 2003;290:1899–1905.
- HCUP Clinical Classification Software. Agency for Healthcare Research and Quality, Rockville, MD. http://www.hcup-us.ahrq.gov/toolssoftware/ccs/ccs.jsp. Accessed on December 15, 2014.
- , , , . Comorbidity measures for use with administrative data. Med Care. 1998;36:8–27.
- . Does continuity of care matter? No: discontinuity can improve patient care. West J Med. 2001;175:5.
- , , , , , . Hospitalist handoffs: a systematic review and task force recommendations. J Hosp Med. 2009;4:433–440.
- , , , , . The impact of fragmentation of hospitalist care on length of stay. J Hosp Med. 2010;5:335–338.
- , , . The Creating Incentives and Continuity Leading to Efficiency staffing model: a quality improvement initiative in hospital medicine. Mayo Clin Proc. 2012;87:364–371.
- Society of Hospital Medicine. 2014 state of hospital medicine report. Philadelphia, PA: Society of Hospital Medicine; 2014.
Although definitions vary, continuity of care can be thought of as the patient's experience of a continuous caring relationship with an identified healthcare professional.[1] Research in ambulatory settings has found that patients who see their primary care physician for a higher proportion of office visits have higher patient satisfaction, better hypertensive control, lower risk of hospitalization, and fewer emergency department visits.[2, 3, 4, 5] Continuity with a single hospital‐based physician is difficult to achieve because of the need to provide care 24 hours a day, 7 days a week. Key clinical information may be lost during physician‐to‐physician handoffs (eg, at admission, at the end of rotations on service) during hospitalization. Our research group recently found that lower hospital physician continuity was associated with modestly increased hospital costs, but also a trend toward lower readmissions.[6] We speculated that physicians newly taking over patient care from colleagues reassess diagnoses and treatment plans. This reassessment may identify errors missed by the previous hospital physician. Thus, discontinuity may theoretically help or hinder the provision of safe hospital care.
We sought to examine the relationship between hospital physician continuity and the incidence of adverse events (AEs). We combined data from 2 previously published studies by our research group; one investigated the relationship between hospital physician continuity and costs and 30‐day readmissions, the other assessed the impact of unit‐based interventions on AEs.[6, 7]
METHODS
Setting and Study Design
This retrospective, observational study was conducted at Northwestern Memorial Hospital, an 876‐bed tertiary care teaching hospital in Chicago, Illinois, and was approved by the institutional review board of Northwestern University. Subjects included patients admitted to an adult nonteaching hospitalist service between March 1, 2009 and December 31, 2011. Hospitalists on this service worked without resident physicians in rotations usually lasting 7 consecutive days beginning on Mondays and ending on Sundays. Hospitalists were allowed to switch portions of their schedule with one another, creating the possibility that certain rotations may have been slightly shorter or longer than 7 days. Hospitalists gave verbal sign‐out via telephone to the hospitalist taking over their service on the afternoon of the last day of their rotation. These handoffs customarily involved both hospitalists viewing the electronic health record during the discussion but were not standardized. Night hospitalists performed admissions and cross‐coverage each night from 7 pm to 7 am. Night hospitalists printed history and physicals for day hospitalists, but typically did not give verbal sign‐out on new admissions.
Acquisition of Study Population Data
We identified all patients admitted to the nonteaching hospitalist service using the Northwestern Medicine Enterprise Data Warehouse (EDW), an integrated repository of all clinical and research data sources on the campus. We excluded patients admitted under observation status, those initially admitted to other services (eg, intensive care, general surgery), those discharged from other services, and those cared for by advanced practice providers (ie, nurse practitioners and physician assistants).
Predictor Variables
We identified physicians completing the primary service history and physicals (H&P) and progress notes throughout patients' hospitalizations to calculate 2 measures of continuity: the Number of Physicians Index (NPI), and the Usual Provider of Continuity (UPC) Index.[8, 9] The NPI represented the total number of unique hospitalists completing H&Ps and/or progress notes for a patient. The UPC was calculated as the largest number of notes signed by a single hospitalist divided by the total number of hospitalist notes for a patient. For example, if Dr. John Smith wrote notes on the first 4 days of a patient's hospital stay, and Dr. Mary Jones wrote notes on the following 2 days (total stay=6 days), the NPI would be 2 and the UPC would be 0.67. Therefore, higher NPI and lower UPC designate lower continuity. Significant events occurring during the nighttime were documented in separate notes titled cross‐cover notes. These cross‐cover notes were not included in the calculation of NPI or UPC. In the rare event that 2 or more progress notes were written on the same day, we selected the one used for billing to calculate UPC and NPI.
Outcome Variables
We used AE data from a study we conducted to assess the impact of unit‐based interventions to improve teamwork and patient safety, the methods of which have been previously described.[7] Briefly, we used a 2‐stage medical record review similar to that performed in prior studies.[10, 11, 12, 13] In the first stage, we identified potential AEs using automated queries of the Northwestern Medicine EDW. These queries were based on screening criteria used in the Harvard Medical Practice Study and the Institute for Healthcare Improvement (IHI) Global Trigger Tool.[12, 13] Examples of queries included abnormal laboratory values (eg, international normalized ratio [INR] >6 after hospital day 2 and excluding patients with INR >4 on day 1), administration of rescue medications (eg, naloxone), certain types of incident reports (eg, pressure ulcer), International Classification of Diseases, Ninth Revision (ICD‐9) codes indicating hospital‐acquired conditions (eg, venous thromboembolism), and text searches of progress notes and discharge summaries using natural language processing.[14] Prior research by our group confirmed these automated screens identify a similar number of AEs as manual medical record screening.[14] For each patient with 1 or more potential AE, a research nurse performed a medical record abstraction and created a description of each potential AE.
In the second stage, 2 physician researchers independently reviewed each potential AE in a blinded fashion to determine whether or not an AE was present. An AE was defined as injury due to medical management rather than the natural history of the illness,[15] and included injuries that prolonged the hospital stay or produced disability as well as those resulting in transient disability or abnormal lab values.[16] After independent review, physician reviewers discussed discrepancies in their ratings to achieve consensus.
We tested the reliability of medical record abstractions in our prior study by conducting duplicate abstractions and consensus ratings for a randomly selected sample of 294 patients.[7] The inter‐rater reliability was good for determining the presence of AEs (=0.63).
Statistical Analyses
We calculated descriptive statistics for patient characteristics. Primary discharge diagnosis ICD‐9 codes were categorized using the Healthcare Cost and Utilization Project Clinical Classification Software.[17] We created multivariable logistic regression models with the independent variable being the measure of continuity (NPI or UPC) and the dependent variable being experiencing 1 or more AEs. Covariates included patient age, sex, race, payer, night admission, weekend admission, intensive care unit stay, Medicare Severity Diagnosis Related Group (MS‐DRG) weight, and total number of Elixhauser comorbidities.[18] The length of stay (LOS) was also included as a covariate, as longer LOS increases the probability of discontinuity and may increase the risk for AEs. Because MS‐DRG weight and LOS were highly correlated, we created several models; the first including both as continuous variables, the second including both categorized into quartiles, and a third excluding MS‐DRG weight and including LOS as a continuous variable. Our prior study assessing the impact of unit‐based interventions did not show a statistically significant difference in the pre‐ versus postintervention period, thus we did not include study period as a covariate.
RESULTS
Patient Characteristics
Our analyses included data from 474 hospitalizations. Patient characteristics are shown in Table 1. Patients were a mean 51.118.8 years of age, hospitalized for a mean 3.43.1 days, included 241 (50.8%) women, and 233 (49.2%) persons of nonwhite race. The mean and standard deviation of NPI and UPC were 2.51.0 and 0.60.2. Overall, 47 patients (9.9%) experienced 55 total AEs. AEs included 31 adverse drug events, 6 falls, 5 procedural injuries, 4 manifestations of poor glycemic control, 3 hospital‐acquired infections, 2 episodes of acute renal failure, 1 episode of delirium, 1 pressure ulcer, and 2 categorized as other.
| Characteristic | Value |
|---|---|
| |
| Mean age (SD), y | 55.1 (18.8) |
| Mean length of stay (SD), d | 3.4 (3.1) |
| Women, n (%) | 241 (50.8) |
| Nonwhite race, n (%) | 233 (49.2) |
| Payer, n (%) | |
| Private | 180 (38) |
| Medicare | 165 (34.8) |
| Medicaid | 47 (9.9) |
| Self‐pay/other | 82 (17.3) |
| Night admission, n (%) | 245 (51.7) |
| Weekend admission, n (%) | 135 (28.5) |
| Intensive care unit stay, n (%) | 18 (3.8) |
| Diagnosis, n (%) | |
| Diseases of the circulatory system | 95 (20.0) |
| Diseases of the digestive system | 65 (13.7) |
| Diseases of the respiratory system | 49 (10.3) |
| Injury and poisoning | 41 (8.7) |
| Diseases of the skin and soft tissue | 31 (6.5) |
| Symptoms, signs, and ill‐defined conditions and factors influencing health status | 28 (5.9) |
| Endocrine, nutritional, and metabolic diseases and immunity disorders | 25 (5.3) |
| Diseases of the genitourinary system | 24 (5.1) |
| Diseases of the musculoskeletal system and connective tissue | 23 (4.9) |
| Diseases of the nervous system | 23 (4.9) |
| Other | 70 (14.8) |
| Mean no. of Elixhauser comorbidities (SD) | 2.3 (1.7) |
| Mean MS‐DRG weight (SD) | 1.0 (1.0) |
| Mean NPI (SD) | 2.5 (1.0) |
| Mean UPC (SD) | 0.6 (0.2) |
Association Between Continuity and Adverse Events
In unadjusted models, each 1‐unit increase in the NPI (ie, less continuity) was significantly associated with the incidence of 1 or more AEs (odds ratio [OR]=1.75; P<0.001). However, UPC was not associated with incidence of AEs (OR=1.03; P=0.68) (Table 2). Across all adjusted models, neither NPI nor UPC was significantly associated with the incidence of AEs. The direction of the effect of discontinuity on AEs was inconsistent across models. Though all 3 adjusted models using NPI as the independent variable showed a trend toward increased odds of experiencing 1 or more AE with discontinuity, 2 of the 3 models using UPC showed trends in the opposite direction.
| NPI OR (95% CI)* | P Value | UPC OR (95% CI)* | P Value | ||
|---|---|---|---|---|---|
| |||||
| Unadjusted model | 1.75 (1.332.29) | <0.0001 | 1.03 (0.89‐1.21) | 0.68 | |
| Adjusted models | |||||
| Model 1 | MS‐DRG and LOS continuous | 1.16 (0.781.72) | 0.47 | 0.96 (0.791.14) | 0.60 |
| Model 2 | MS‐DRG and LOS in quartiles | 1.38 (0.981.94) | 0.07 | 1.05 (0.881.26) | 0.59 |
| Model 3 | MS‐DRG dropped, LOS continuous | 1.14 (0.771.70) | 0.51 | 0.95 (0.791.14) | 0.56 |
DISCUSSION
We found that hospitalist physician continuity was not associated with the incidence of AEs. Our findings are somewhat surprising because of the high value placed on continuity of care and patient safety concerns related to handoffs. Key clinical information may be lost when patient care is transitioned to a new hospitalist shortly after admission (eg, from a night hospitalist) or at the end of a rotation. Thus, it is logical to assume that discontinuity inherently increases the risk for harm. On the other hand, a physician newly taking over patient care from another may not be anchored to the initial diagnosis and treatment plan established by the first. This second look could potentially prevent missed/delayed diagnoses and optimize the plan of care.[19] These countervailing forces may explain our findings.
Several other potential explanations for our findings should be considered. First, the quality of handoffs may have been sufficient to overcome the potential for information loss. We feel this is unlikely given that little attention had been dedicated to improving the quality of patient handoffs among hospitalists in our institution. Notably, though a number of studies have evaluated resident physician handoffs, most of the work has focused on night coverage, and little is known about the quality of attending handoffs.[20] Second, access to a fully integrated electronic health record may have assisted hospitalists in complementing information received during handoffs. For example, a hospitalist about to start his or her rotation may have remotely accessed and reviewed patient medical records prior to receiving the phone handoff from the outgoing hospitalist. Third, other efforts to improve patient safety may have reduced the overall risk and provided some resilience in the system. Unit‐based interventions, including structured interdisciplinary rounds and nurse‐physician coleadership, improved teamwork climate and reduced AEs in the study hospital over time.[7]
Another factor to consider relates to the fact that hospital care is provided by teams of clinicians (eg, nurses, specialist physicians, therapists, social workers). Hospital teams are often large and have dynamic team membership. Similar to hospitalists, nurses, physician specialists, and other team members handoff care throughout the course of a patient's hospital stay. Yet, discontinuity for each professional type may occur at different times and frequencies. For example, a patient may be handed off from one hospitalist to another, yet the care continues with the same cardiologist or nurse. Future research should better characterize hospital team complexity (eg, size, relationships among members) and dynamics (eg, continuity for various professional types) and the impact of these factors on patient outcomes.
Our findings are important because hospitalist physician discontinuity is common during hospital stays. Hospital medicine groups vary in their staffing and scheduling models. Policies related to admission distribution and rotation length (consecutive days worked) systematically impact physician continuity. Few studies have evaluated the effect on continuity on hospitalized patient outcomes, and no prior research, to our knowledge, has explored the association of continuity on measures of patient safety.[6, 21, 22] Though our study might suggest that staffing models have little impact on patient safety, as previously mentioned, other team factors may influence patient outcomes.
Our study has several limitations. First, we assessed the impact of continuity on AEs in a single site. Although the 7 days on/7 days off model is the most common scheduling pattern used by adult hospital medicine groups,[23] staffing models and patient safety practices vary across hospitals, potentially limiting the generalizability of our study. Second, continuity can be defined and measured in a variety of ways. We used 2 different measures of physician continuity. As previously mentioned, assessing continuity of other clinicians may allow for a more complete understanding of the potential problems related to fragmentation of care. Third, this study excluded patients who experienced care transitions from other hospitals or other units within the hospital. Patients transferred from other hospitals are often complex, severely ill, and may be at higher risk for loss of key clinical information. Fourth, we used automated screens of an EDW to identify potential AEs. Although our prior research found that this method identified a similar number of AEs as manual medical record review screening, there was poor agreement between the 2 methods. Unfortunately, there is no gold standard to identify AEs. The EDW‐facilitated method allowed us to feasibly screen a larger number of charts, increasing statistical power, and minimized any potential bias that might occur during a manual review to identify potential AEs. Finally, we used data available from 2 prior studies and may have been underpowered to detect a significant association between continuity and AEs due to the relatively low percentage of patients experiencing an AE. In a post hoc power calculation, we estimated that we had 70% power to detect a 33% change in the proportion of patients with 1 or more AE for each 1‐unit increase in NPI, and 80% power to detect a 20% change for each 0.1‐unit decrease in UPC.
CONCLUSION
In conclusion, we found that hospitalist physician continuity was not associated with the incidence of AEs. We speculate that hospitalist continuity is only 1 of many team factors that may influence patient safety, and that prior efforts within our institution may have reduced our ability to detect an association. Future research should better characterize hospital team complexity and dynamics and the impact of these factors on patient outcomes.
Disclosures
This project was supported by a grant from the Agency for Healthcare Research and Quality and an Excellence in Academic Medicine Award, administered by Northwestern Memorial Hospital. The authors report no conflicts of interest.
- , , . What is “continuity of care”? J Health Serv Res Policy. 2006;11:248–250.
- , . Interpersonal continuity of care and care outcomes: a critical review. Ann Fam Med. 2005;3:159–166.
- , , , . The association between continuity of care and outcomes: a systematic and critical review. J Eval Clin Pract. 2010;16:947–956.
- , . Interpersonal continuity of care and patient satisfaction: a critical review. Ann Fam Med. 2004;2:445–451.
- , , , . Continuity of care in a family practice residency program. Impact on physician satisfaction. J Fam Pract. 1990;31:69–73.
- , , , et al. The impact of hospitalist discontinuity on hospital cost, readmissions, and patient satisfaction. J Gen Intern Med. 2014;29:1004–1008.
- , , , et al. Implementation of unit‐based interventions to improve teamwork and patient safety on a medical service [published online ahead of print June 11, 2014]. Am J Med Qual. doi: 10.1177/1062860614538093.
- . Measuring provider continuity in ambulatory care: an assessment of alternative approaches. Med Care. 1979;17:551–565.
- . Defining and measuring interpersonal continuity of care. Ann Fam Med. 2003;1:134–143.
- U.S. Department of Health and Human Services. Agency for Healthcare Research and Quality. Adverse events in hospitals: national incidence among medical beneficiaries. Available at: http://psnet.ahrq.gov/resource.aspx?resourceID=19811. Published November 2010. Accessed on December 15, 2014.
- , , , et al. “Global trigger tool” shows that adverse events in hospitals may be ten times greater than previously measured. Health Aff (Millwood). 2011;30:581–589.
- , , , et al. A study of medical injury and medical malpractice. N Engl J Med. 1989;321:480–484.
- , , , et al. Incidence and types of adverse events and negligent care in Utah and Colorado. Med Care. 2000;38:261–271.
- , , , et al. Comparison of traditional trigger tool to data warehouse based screening for identifying hospital adverse events. BMJ Qual Saf. 2013;22:130–138.
- , , , et al. Incidence of adverse events and negligence in hospitalized patients. Results of the Harvard Medical Practice Study I. N Engl J Med. 1991;324:370–376.
- , , . Safety of patients isolated for infection control. JAMA. 2003;290:1899–1905.
- HCUP Clinical Classification Software. Agency for Healthcare Research and Quality, Rockville, MD. http://www.hcup-us.ahrq.gov/toolssoftware/ccs/ccs.jsp. Accessed on December 15, 2014.
- , , , . Comorbidity measures for use with administrative data. Med Care. 1998;36:8–27.
- . Does continuity of care matter? No: discontinuity can improve patient care. West J Med. 2001;175:5.
- , , , , , . Hospitalist handoffs: a systematic review and task force recommendations. J Hosp Med. 2009;4:433–440.
- , , , , . The impact of fragmentation of hospitalist care on length of stay. J Hosp Med. 2010;5:335–338.
- , , . The Creating Incentives and Continuity Leading to Efficiency staffing model: a quality improvement initiative in hospital medicine. Mayo Clin Proc. 2012;87:364–371.
- Society of Hospital Medicine. 2014 state of hospital medicine report. Philadelphia, PA: Society of Hospital Medicine; 2014.
© 2014 Society of Hospital Medicine
Office-Based Rapid Prototyping in Orthopedic Surgery: A Novel Planning Technique and Review of the Literature
Three-dimensional (3-D) printing is a rapidly evolving technology with both medical and nonmedical applications.1,2 Rapid prototyping involves creating a physical model of human tissue from a 3-D computer-generated rendering.3 The method relies on export of Digital Imaging and Communications in Medicine (DICOM)–based computed tomography (CT) or magnetic resonance imaging (MRI) data into standard triangular language (STL) format. Reducing CT or MRI slice thickness increases resolution of the final model.2 Five types of rapid prototyping exist: STL, selective laser sintering, fused deposition modeling, multijet modeling, and 3-D printing.
Most implant manufacturers can produce a 3-D model based on surgeon-provided DICOM images. The ability to produce anatomical models in an office-based setting is a more recent development. Three-dimensional modeling may allow for more accurate and extensive preoperative planning than radiographic examination alone does, and may even allow surgeons to perform procedures as part of preoperative preparation. This can allow for early recognition of unanticipated intraoperative problems or of the need for special techniques and implants that would not have been otherwise available, all of which may ultimately reduce operative time.
The breadth of applications for office-based 3-D prototyping is not well described in the orthopedic surgery literature. In this article, we describe 7 cases of complex orthopedic disorders that were surgically treated after preoperative planning in which use of a 3-D printer allowed for “mock” surgery before the actual procedures. In 3 of the cases, the models were made by the implant manufacturers. Working with these models prompted us to buy a 3-D printer (Fortus 250; Stratasys, Eden Prairie, Minnesota) for in-office use. In the other 4 cases, we used this printer to create our own models. As indicated in the manufacturer’s literature, the printer uses fused deposition modeling, which builds a model layer by layer by heating thermoplastic material to a semi-liquid state and extruding it according to computer-controlled pathways.
We present preoperative images, preoperative 3-D modeling, and intraoperative and postoperative images along with brief case descriptions (Table). The patients provided written informed consent for print and electronic publication of these case reports.
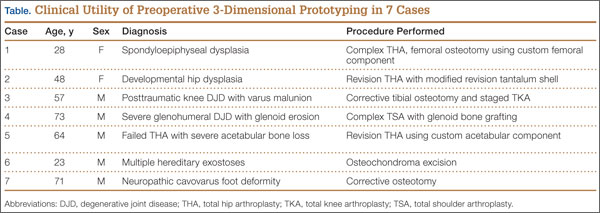
Case Reports
Case 1
A 28-year-old woman with a history of spondyloepiphyseal dysplasia presented to our clinic with bilateral hip pain. About 8 years earlier, she had undergone bilateral proximal and distal femoral osteotomies. Her function had initially improved, but over the 2 to 3 years before presentation she began having more pain and stiffness with activity. At time of initial evaluation, she was able to walk only 1 to 2 blocks and had difficulty getting in and out of a car and up out of a seated position.
On physical examination, the patient was 3 feet 10 inches tall and weighed 77 pounds. She ambulated with decreased stance phase on both lower extremities and had developed a significant amount of increased forward pelvic inclination and increased lumbar lordosis. Both hips and thighs had multiple healed scars from prior surgeries and pin tracts. Range of motion (ROM) on both sides was restricted to 85° of flexion, 10° of internal rotation, 15° of external rotation, and 15° of abduction.
Plain radiographs showed advanced degenerative joint disease (DJD) of both hips with dysplastic acetabuli and evidence of healed osteotomies (Figure 1). Femoral deformities, noted bilaterally, consisted of marked valgus proximally and varus distally. Preoperative CT was used to create a 3-D model of the pelvis and femur. The model was created by the same implant manufacturer that produced the final components (Depuy, Warsaw, Indiana). Corrective femoral osteotomy was performed on the model to allow for design and use of a custom implant, while the modeled pelvis confirmed the ability to reproduce the normal hip center with a 44-mm conventional hemispherical socket.
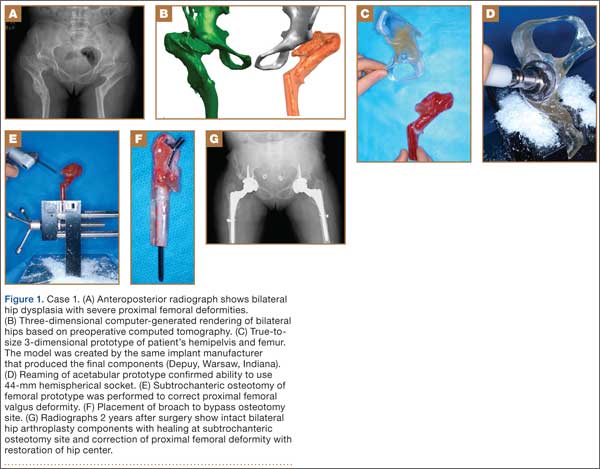
After surgery, the patient was able to ambulate without a limp and return to work. Her hip ROM was pain-free passively and actively with flexion to 100°, internal rotation to 35°, external rotation to 20°, and abduction to 30°.
Case 2
A 48-year-old woman with a history of Crowe IV hip dysplasia presented to our clinic with a chronically dislocated right total hip arthroplasty (THA) (Figure 2). Her initial THA was revised 1 year later because of acetabular component failure. Two years later, she was diagnosed with a deep periprosthetic infection, which was ultimately treated with 2-stage reimplantation. She subsequently dislocated and underwent re-revision of the S-ROM body and stem (DePuy Synthes, Warsaw, Indiana). At a visit after that revision, she was noted to be chronically dislocated, and was sent to our clinic for further management.
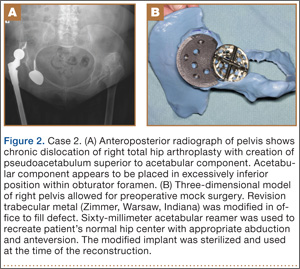
Preoperative radiographs showed a right uncemented THA with the femoral head dislocated toward the false acetabulum, retained hardware, and an old ununited trochanteric fragment. Both the femoral and acetabular components appeared well-fixed, though the acetabular component was positioned inferior, toward the obturator foramen.
Preoperative CT with metal artifact subtraction was used to create a 3-D model of the residual bony pelvis. The model was made by an implant manufacturer (Zimmer, Warsaw, Indiana). The shape of the superior defect was amenable to reconstruction using a modified revision trabecular metal socket. The pelvic model was reamed to accept a conventional hemispherical socket. The defect was reamed to accept a modified revision trabecular metal socket. The real implant was fashioned before surgery and was sterilized to avoid the need for intraoperative modification. Use of the preoperative model significantly reduced the time that would have been needed to modify the implant during actual surgery.
The patient’s right THA was revised. At time of surgery, the modified revision trabecular metal acetabular component was noted to seat appropriately in the superior defect. The true acetabulum was reestablished, and a hemispherical socket was placed with multiple screws. The 2 components were then unitized using cement in the same manner as would be done with an off-the-shelf augment.
Case 3
A 57-year-old man presented with a 10-year history of right knee pain. About 30 years before presentation at our clinic, he was treated for an open right tibia fracture sustained in a motorcycle accident. He had been treated nonsurgically, with injections, but they failed to provide sustained relief.
Preoperative radiographs showed severe advanced DJD in conjunction with an extra-articular posttraumatic varus tibial shaft deformity (Figure 3). An implant manufacturer (Zimmer) used a CT scan to create a model of the deformity. The resultant center of rotation angle was calculated using preoperative images and conventional techniques for deformity correction, and a lateral closing-wedge osteotomy was performed on the CT-based model. The initial attempt at deformity correction was slightly excessive, and the amount of resected bone slightly thicker than the calculated wedge, resulting in a valgus deformity. This error was noted, and the decision was made to recut a new model with a slight amount of residual varus that could be corrected during the final knee arthroplasty procedure.
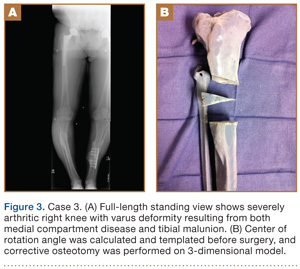
Corrective osteotomy was performed with a lateral plate. Six months later, the patient had no residual pain, and CT confirmed union at the osteotomy site and a slight amount of residual varus. The patient then underwent routine total knee arthroplasty (TKA) using an abbreviated keel to avoid the need for removal of the previously placed hardware. The varus deformity was completely corrected.
Case 4
A 73-year-old man had a history of shoulder pain dating back to his childhood. Despite treatment with nonsteroidal anti-inflammatory drugs, physical therapy, and injections, his debilitating pain persisted. Physical examination revealed limited ROM and an intact rotator cuff.
Plain radiographs showed severe DJD of the glenohumeral joint (Figure 4). Severe erosions of the glenoid were noted, prompting further workup with CT, which showed significant bone loss, particularly along the posterior margin of the glenoid. We used our 3-D printer to create a model of the scapula from CT images. The model was then reamed in the usual fashion to accept a 3-pegged glenoid component. On placement of a trial implant, a large deficiency was seen posteriorly. We thought the size and location of the defect made it amenable to grafting using the patient’s humeral head.
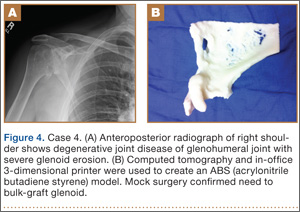
The patient elected to undergo right total shoulder arthroplasty. During the procedure, the glenoid defect was found to be identical to what was encountered with the model before surgery. A portion of the patient’s humeral head was then fashioned to fit the defect, and was secured with three 2.7-mm screws, after provisional fixation using 2.0-mm Kirschner wires. The screws were countersunk, and the graft was contoured by hand to match the previous reaming. A 3-pegged 52-mm glenoid component was then cemented into position with excellent stability.
Case 5
A 64-year-old man presented to our clinic with left hip pain 40 years after THA. The original procedure was performed for resolved proximal femoral osteomyelitis. Plain radiographs showed a loose cemented McKee-Farrar hip arthroplasty (Figure 5). Because of the elevated position of the acetabular component relative to the native hip center, CT was used to determine the amount of femoral bone loss.
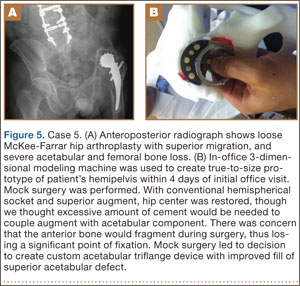
We used our 3-D printer to create a model and tried to recreate the native hip center with conventional off-the-shelf implants. A 50-mm hemispherical socket trial was placed in the appropriate location, along with a trabecular metal augment trial to provide extended coverage over the superolateral portion of the socket. Noted between the socket and the augment was a large gap; a substantial amount of cement would have been needed to unitize the construct. We thought a custom acetabular component would avoid the need for cement. In addition, given the patient’s small stature, the conventional acetabular component would allow a head only 32 mm in diameter. With a custom implant, the head could be enlarged to 36 mm, providing improved ROM and stability.
The patient underwent revision left hip arthroplasty using a custom acetabular component. A 3-D model available at time of surgery was used to aid implant placement.
Case 6
A 23-year-old man with multiple hereditary exostoses presented to our clinic with a painful mass in the left calf. Plain radiographs showed extensive osteochondromatosis involving the left proximal tibiofibular joint (Figure 6). The exostosis extended posteromedially, displacing the arterial trifurcation. MRI showed a small cartilage cap without evidence of malignant transformation.
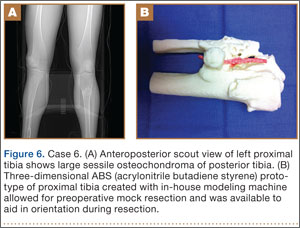
CT angiogram allowed the vasculature to be modeled along with the deformity. A 3-D model was fabricated. The model included the entire proximal tibiofibular joint, as well as the anterior tibial, peroneal, and posterior tibial arteries. Cautious intralesional resection was recommended because of the proximity to all 3 vessels.
The patient underwent tumor resection through a longitudinal posterior approach. The interval between the medial and lateral heads of the gastrocnemius muscles was developed to expose the underlying soleus muscle. The soleus was split longitudinally from its hiatus to the inferior portion of the exostosis. This allowed for identification of the trifurcation and the tibial nerve, which were protected. Osteotomes were used to resect the mass at its base, the edges were carefully trimmed, and bone wax was placed over the defect. Anterior and lateral to this mass was another large mass (under the soleus muscle), which was also transected using an osteotome. The gastrocnemius and soleus muscles were then reflected off the fibula in order to remove 2 other exostoses, beneath the neck and head of the fibula.
Case 7
A 71-year-old man with a history of idiopathic lymphedema and peripheral neuropathy presented to our clinic with a left cavovarus foot deformity and a history of recurrent neuropathic foot ulcers (Figure 7). Physical examination revealed a callus over the lateral aspect of the base of the fifth metatarsal. Preoperative radiograph showed evidence of prior triple arthrodesis with a cavovarus foot deformity. CT scan was used to create a 3-D model of the foot. The model was then used to identify an appropriate location for lateral midtarsal and calcaneal closing-wedge osteotomies.
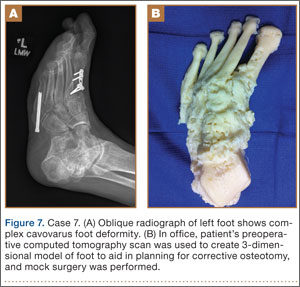
The patient underwent midfoot and hindfoot surgical correction. At surgery, the lateral closing-wedge osteotomies were performed according to the preoperative model. Radiographs 1 year after surgery showed correction of the forefoot varus.
Discussion
Three-dimensional printing for medical applications of anatomical modeling is not a new concept.1,3,4 Its use has been reported for a variety of applications in orthopedic surgery, including the printing of porous and metallic surfaces5 and bone-tissue engineering.6-9 Rapid prototyping for medical application was first reported in 1990 when a CT-based model was used to create a cranial bone.10 Reports of using the technique are becoming more widespread, particularly in the dental and maxillofacial literature, which includes reports on a variety of applications, including patient-specific drill guides, splints, and implants.11-14 The ability to perform mock surgery in advance of an actual procedure provides an invaluable opportunity to anticipate potential intraoperative problems, reduce operative time, and improve the accuracy of reconstruction.
Office-based rapid prototyping that uses an in-house 3-D printer is a novel application of this technology. It allows for creation of a patient-specific model for preoperative planning purposes. We are unaware of any other reports demonstrating the breadth and utility of office-based rapid prototyping in orthopedic surgery. For general reference, a printer similar to ours requires an initial investment of $52,000 to $56,000. This cost generally covers the printer, printer base cabinet, installation, training, and printer software (different from the 3-D modeling software), plus a 1-year warranty. A service agreement costs about $4000 annually. Printer and model supply expenses depend on the material used for the model (eg, ABS [acrylonitrile butadiene styrene]) and on the size and complexity of the 3-D models created. Average time to generate an appropriately formatted 3-D printing file is about 1 hour, though times can vary largely, according to amount of metal artifact subtraction necessary and the experience of the software user. For the rare, extremely complex deformities that require a significant amount of metal artifact subtraction, file preparation times can exceed 3 or 4 hours. We think these preparation times will decrease as communication between radiology file export format and modeling software ultimately allows for metal artifact subtraction images to function within the modeling software environment. Once an appropriately formatted file has been created, typical printing times vary according to the size of the to-be-modeled bone. For a hemipelvis, printing time is 30 to 40 hours; printing that is started on a Friday afternoon will be complete by Monday morning.
There are few reports of rapid prototyping in orthopedic surgery. In 2003, Minns and colleagues15 used a 3-D model in the planning of a tibial resection for TKA. They found the model to be accurate at time of surgery, resulting in appropriate tibial coverage by a conventional meniscal-bearing implant. Munjal and colleagues16 reported on 10 complex failed hip arthroplasty cases in which patients had revision surgery after preoperative planning using 3-D modeling techniques. The authors found that, in 8 of the 10 cases, conventional classification systems of bone loss were inaccurate in comparison with the prototype. Four cases required reconstruction with a custom triflange when conventional implants were not deemed reasonable based on the pelvic model. Tam and colleagues17 reported using a 3-D prototype as an aid in surgical planning for resection of a scapular osteochondroma in a 6-year-old patient. They found the rapid prototype to be useful at time of resection—similar to what we found with 1 patient (case 6). Adding contrast media to our patient’s scan allowed for 3-D visualization of the lesion and the encased vasculature. Fu and colleagues18 reported using a patient-specific drill template to insert anterior transpedicular screws. They constructed 24 prototypes of a formalin-preserved cervical vertebra to create a patient-specific biocompatible drill template for use in correcting multilevel cervical instability. They found the technique to be highly reproducible and accurate. Zein and colleagues19 used a rapid prototype of 3 consecutive human livers to preoperatively identify the vascular and biliary tract anatomy. They reported a high degree of accuracy—mean dimensional errors of less than 4 mm for the entire model and 1.3 mm for the vascular diameter.
The models created by implant manufacturers in this series were used to perform “mock” surgery before the actual procedures. Working with these models prompted us to buy our own 3-D printer. The learning curve can be steep, but commercially available 3-D printers allow for prompt in-office production of high-quality realistic prototypes at relatively low per-case cost (Figure 8). Three-dimensional modeling allows surgeons to assess the accuracy of their original surgical plans and, if necessary, correct them before surgery. Although computer-aided design models are useful, the ability to “perform surgery preoperatively” adds another element to surgeons’ understanding of the potential issues that may arise. Also, an in-office printer can help improve surgeons’ understanding and control over the process by which images are translated from radiographic file to 3-D model. Disadvantages of an in-office system include start-up and maintenance costs, office space requirements, and a significant learning curve for software and hardware applications. In addition, creation of 3-D models requires close interaction with radiologists who can provide appropriately formatted DICOM images, as metal artifact subtraction can be challenging. We think that, as image formatting and software capabilities are continually refined, this technology will become an invaluable part of multiple subspecialties across orthopedic surgery, with potentially infinite clinical, educational, and research applications.
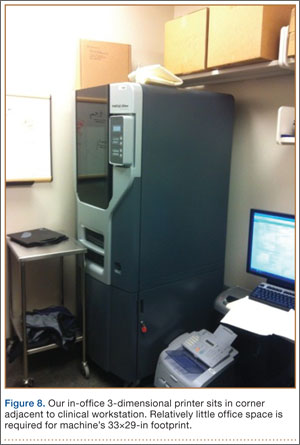
1. McGurk M, Amis AA, Potamianos P, Goodger NM. Rapid prototyping techniques for anatomical modelling in medicine. Ann R Coll Surg Engl. 1997;79(3):169-174.
2. Webb PA. A review of rapid prototyping (RP) techniques in the medical and biomedical sector. J Med Eng Technol. 2000;24(4):149-153.
3. Esses SJ, Berman P, Bloom AI, Sosna J. Clinical applications of physical 3D models derived from MDCT data and created by rapid prototyping. AJR Am J Roentgenol. 2011;196(6):W683-W688.
4. Torres K, Staśkiewicz G, Śnieżyński M, Drop A, Maciejewski R. Application of rapid prototyping techniques for modelling of anatomical structures in medical training and education. Folia Morphol. 2011;70(1):1-4.
5. Melican MC, Zimmerman MC, Dhillon MS, Ponnambalam AR, Curodeau A, Parsons JR. Three-dimensional printing and porous metallic surfaces: a new orthopedic application. J Biomed Mater Res. 2001;55(2):194-202.
6. Butscher A, Bohner M, Hofmann S, Gauckler L, Müller R. Structural and material approaches to bone tissue engineering in powder-based three-dimensional printing. Acta Biomater. 2011;7(3):907-920.
7. Ciocca L, De Crescenzio F, Fantini M, Scotti R. CAD/CAM and rapid prototyped scaffold construction for bone regenerative medicine and surgical transfer of virtual planning: a pilot study. Comput Med Imaging Graph. 2009;33(1):58-62.
8. Leukers B, Gülkan H, Irsen SH, et al. Hydroxyapatite scaffolds for bone tissue engineering made by 3D printing. J Mater Sci Mater Med. 2005;16(12):1121-1124.
9. Seitz H, Rieder W, Irsen S, Leukers B, Tille C. Three-dimensional printing of porous ceramic scaffolds for bone tissue engineering. J Biomed Mater Res B Appl Biomater. 2005;74(2):782-788.
10. Mankovich NJ, Cheeseman AM, Stoker NG. The display of three-dimensional anatomy with stereolithographic models. J Digit Imaging. 1990;3(3):200-203.
11. Flügge TV, Nelson K, Schmelzeisen R, Metzger MC. Three-dimensional plotting and printing of an implant drilling guide: simplifying guided implant surgery. J Oral Maxillofac Surg. 2013;71(8):1340-1346.
12. Goiato MC, Santos MR, Pesqueira AA, Moreno A, dos Santos DM, Haddad MF. Prototyping for surgical and prosthetic treatment. J Craniofac Surg. 2011;22(3):914-917.
13. Metzger MC, Hohlweg-Majert B, Schwarz U, Teschner M, Hammer B, Schmelzeisen R. Manufacturing splints for orthognathic surgery using a three-dimensional printer. Oral Surg Oral Med Oral Pathol Oral Radiol Endod. 2008;105(2):e1-e7.
14. Robiony M, Salvo I, Costa F, et al. Virtual reality surgical planning for maxillofacial distraction osteogenesis: the role of reverse engineering rapid prototyping and cooperative work. J Oral Maxillofac Surg. 2007;65(6):1198-1208.
15. Minns RJ, Bibb R, Banks R, Sutton RA. The use of a reconstructed three-dimensional solid model from CT to aid the surgical management of a total knee arthroplasty: a case study. Med Eng Phys. 2003;25(6):523-526.
16. Munjal S, Leopold SS, Kornreich D, Shott S, Finn HA. CT-generated 3-dimensional models for complex acetabular reconstruction. J Arthroplasty. 2000;15(5):644-653.
17. Tam MD, Laycock SD, Bell D, Chojnowski A. 3-D printout of a DICOM file to aid surgical planning in a 6 year old patient with a large scapular osteochondroma complicating congenital diaphyseal aclasia. J Radiol Case Rep. 2012;6(1):31-37.
18. Fu M, Lin L, Kong X, et al. Construction and accuracy assessment of patient-specific biocompatible drill template for cervical anterior transpedicular screw (ATPS) insertion: an in vitro study. PLoS One. 2013;8(1):e53580.
19. Zein NN, Hanouneh IA, Bishop PD, et al. Three-dimensional print of a liver for preoperative planning in living donor liver transplantation. Liver Transpl. 2013;19(12):1304-1310.
Three-dimensional (3-D) printing is a rapidly evolving technology with both medical and nonmedical applications.1,2 Rapid prototyping involves creating a physical model of human tissue from a 3-D computer-generated rendering.3 The method relies on export of Digital Imaging and Communications in Medicine (DICOM)–based computed tomography (CT) or magnetic resonance imaging (MRI) data into standard triangular language (STL) format. Reducing CT or MRI slice thickness increases resolution of the final model.2 Five types of rapid prototyping exist: STL, selective laser sintering, fused deposition modeling, multijet modeling, and 3-D printing.
Most implant manufacturers can produce a 3-D model based on surgeon-provided DICOM images. The ability to produce anatomical models in an office-based setting is a more recent development. Three-dimensional modeling may allow for more accurate and extensive preoperative planning than radiographic examination alone does, and may even allow surgeons to perform procedures as part of preoperative preparation. This can allow for early recognition of unanticipated intraoperative problems or of the need for special techniques and implants that would not have been otherwise available, all of which may ultimately reduce operative time.
The breadth of applications for office-based 3-D prototyping is not well described in the orthopedic surgery literature. In this article, we describe 7 cases of complex orthopedic disorders that were surgically treated after preoperative planning in which use of a 3-D printer allowed for “mock” surgery before the actual procedures. In 3 of the cases, the models were made by the implant manufacturers. Working with these models prompted us to buy a 3-D printer (Fortus 250; Stratasys, Eden Prairie, Minnesota) for in-office use. In the other 4 cases, we used this printer to create our own models. As indicated in the manufacturer’s literature, the printer uses fused deposition modeling, which builds a model layer by layer by heating thermoplastic material to a semi-liquid state and extruding it according to computer-controlled pathways.
We present preoperative images, preoperative 3-D modeling, and intraoperative and postoperative images along with brief case descriptions (Table). The patients provided written informed consent for print and electronic publication of these case reports.
Case Reports
Case 1
A 28-year-old woman with a history of spondyloepiphyseal dysplasia presented to our clinic with bilateral hip pain. About 8 years earlier, she had undergone bilateral proximal and distal femoral osteotomies. Her function had initially improved, but over the 2 to 3 years before presentation she began having more pain and stiffness with activity. At time of initial evaluation, she was able to walk only 1 to 2 blocks and had difficulty getting in and out of a car and up out of a seated position.
On physical examination, the patient was 3 feet 10 inches tall and weighed 77 pounds. She ambulated with decreased stance phase on both lower extremities and had developed a significant amount of increased forward pelvic inclination and increased lumbar lordosis. Both hips and thighs had multiple healed scars from prior surgeries and pin tracts. Range of motion (ROM) on both sides was restricted to 85° of flexion, 10° of internal rotation, 15° of external rotation, and 15° of abduction.
Plain radiographs showed advanced degenerative joint disease (DJD) of both hips with dysplastic acetabuli and evidence of healed osteotomies (Figure 1). Femoral deformities, noted bilaterally, consisted of marked valgus proximally and varus distally. Preoperative CT was used to create a 3-D model of the pelvis and femur. The model was created by the same implant manufacturer that produced the final components (Depuy, Warsaw, Indiana). Corrective femoral osteotomy was performed on the model to allow for design and use of a custom implant, while the modeled pelvis confirmed the ability to reproduce the normal hip center with a 44-mm conventional hemispherical socket.
After surgery, the patient was able to ambulate without a limp and return to work. Her hip ROM was pain-free passively and actively with flexion to 100°, internal rotation to 35°, external rotation to 20°, and abduction to 30°.
Case 2
A 48-year-old woman with a history of Crowe IV hip dysplasia presented to our clinic with a chronically dislocated right total hip arthroplasty (THA) (Figure 2). Her initial THA was revised 1 year later because of acetabular component failure. Two years later, she was diagnosed with a deep periprosthetic infection, which was ultimately treated with 2-stage reimplantation. She subsequently dislocated and underwent re-revision of the S-ROM body and stem (DePuy Synthes, Warsaw, Indiana). At a visit after that revision, she was noted to be chronically dislocated, and was sent to our clinic for further management.
Preoperative radiographs showed a right uncemented THA with the femoral head dislocated toward the false acetabulum, retained hardware, and an old ununited trochanteric fragment. Both the femoral and acetabular components appeared well-fixed, though the acetabular component was positioned inferior, toward the obturator foramen.
Preoperative CT with metal artifact subtraction was used to create a 3-D model of the residual bony pelvis. The model was made by an implant manufacturer (Zimmer, Warsaw, Indiana). The shape of the superior defect was amenable to reconstruction using a modified revision trabecular metal socket. The pelvic model was reamed to accept a conventional hemispherical socket. The defect was reamed to accept a modified revision trabecular metal socket. The real implant was fashioned before surgery and was sterilized to avoid the need for intraoperative modification. Use of the preoperative model significantly reduced the time that would have been needed to modify the implant during actual surgery.
The patient’s right THA was revised. At time of surgery, the modified revision trabecular metal acetabular component was noted to seat appropriately in the superior defect. The true acetabulum was reestablished, and a hemispherical socket was placed with multiple screws. The 2 components were then unitized using cement in the same manner as would be done with an off-the-shelf augment.
Case 3
A 57-year-old man presented with a 10-year history of right knee pain. About 30 years before presentation at our clinic, he was treated for an open right tibia fracture sustained in a motorcycle accident. He had been treated nonsurgically, with injections, but they failed to provide sustained relief.
Preoperative radiographs showed severe advanced DJD in conjunction with an extra-articular posttraumatic varus tibial shaft deformity (Figure 3). An implant manufacturer (Zimmer) used a CT scan to create a model of the deformity. The resultant center of rotation angle was calculated using preoperative images and conventional techniques for deformity correction, and a lateral closing-wedge osteotomy was performed on the CT-based model. The initial attempt at deformity correction was slightly excessive, and the amount of resected bone slightly thicker than the calculated wedge, resulting in a valgus deformity. This error was noted, and the decision was made to recut a new model with a slight amount of residual varus that could be corrected during the final knee arthroplasty procedure.
Corrective osteotomy was performed with a lateral plate. Six months later, the patient had no residual pain, and CT confirmed union at the osteotomy site and a slight amount of residual varus. The patient then underwent routine total knee arthroplasty (TKA) using an abbreviated keel to avoid the need for removal of the previously placed hardware. The varus deformity was completely corrected.
Case 4
A 73-year-old man had a history of shoulder pain dating back to his childhood. Despite treatment with nonsteroidal anti-inflammatory drugs, physical therapy, and injections, his debilitating pain persisted. Physical examination revealed limited ROM and an intact rotator cuff.
Plain radiographs showed severe DJD of the glenohumeral joint (Figure 4). Severe erosions of the glenoid were noted, prompting further workup with CT, which showed significant bone loss, particularly along the posterior margin of the glenoid. We used our 3-D printer to create a model of the scapula from CT images. The model was then reamed in the usual fashion to accept a 3-pegged glenoid component. On placement of a trial implant, a large deficiency was seen posteriorly. We thought the size and location of the defect made it amenable to grafting using the patient’s humeral head.
The patient elected to undergo right total shoulder arthroplasty. During the procedure, the glenoid defect was found to be identical to what was encountered with the model before surgery. A portion of the patient’s humeral head was then fashioned to fit the defect, and was secured with three 2.7-mm screws, after provisional fixation using 2.0-mm Kirschner wires. The screws were countersunk, and the graft was contoured by hand to match the previous reaming. A 3-pegged 52-mm glenoid component was then cemented into position with excellent stability.
Case 5
A 64-year-old man presented to our clinic with left hip pain 40 years after THA. The original procedure was performed for resolved proximal femoral osteomyelitis. Plain radiographs showed a loose cemented McKee-Farrar hip arthroplasty (Figure 5). Because of the elevated position of the acetabular component relative to the native hip center, CT was used to determine the amount of femoral bone loss.
We used our 3-D printer to create a model and tried to recreate the native hip center with conventional off-the-shelf implants. A 50-mm hemispherical socket trial was placed in the appropriate location, along with a trabecular metal augment trial to provide extended coverage over the superolateral portion of the socket. Noted between the socket and the augment was a large gap; a substantial amount of cement would have been needed to unitize the construct. We thought a custom acetabular component would avoid the need for cement. In addition, given the patient’s small stature, the conventional acetabular component would allow a head only 32 mm in diameter. With a custom implant, the head could be enlarged to 36 mm, providing improved ROM and stability.
The patient underwent revision left hip arthroplasty using a custom acetabular component. A 3-D model available at time of surgery was used to aid implant placement.
Case 6
A 23-year-old man with multiple hereditary exostoses presented to our clinic with a painful mass in the left calf. Plain radiographs showed extensive osteochondromatosis involving the left proximal tibiofibular joint (Figure 6). The exostosis extended posteromedially, displacing the arterial trifurcation. MRI showed a small cartilage cap without evidence of malignant transformation.
CT angiogram allowed the vasculature to be modeled along with the deformity. A 3-D model was fabricated. The model included the entire proximal tibiofibular joint, as well as the anterior tibial, peroneal, and posterior tibial arteries. Cautious intralesional resection was recommended because of the proximity to all 3 vessels.
The patient underwent tumor resection through a longitudinal posterior approach. The interval between the medial and lateral heads of the gastrocnemius muscles was developed to expose the underlying soleus muscle. The soleus was split longitudinally from its hiatus to the inferior portion of the exostosis. This allowed for identification of the trifurcation and the tibial nerve, which were protected. Osteotomes were used to resect the mass at its base, the edges were carefully trimmed, and bone wax was placed over the defect. Anterior and lateral to this mass was another large mass (under the soleus muscle), which was also transected using an osteotome. The gastrocnemius and soleus muscles were then reflected off the fibula in order to remove 2 other exostoses, beneath the neck and head of the fibula.
Case 7
A 71-year-old man with a history of idiopathic lymphedema and peripheral neuropathy presented to our clinic with a left cavovarus foot deformity and a history of recurrent neuropathic foot ulcers (Figure 7). Physical examination revealed a callus over the lateral aspect of the base of the fifth metatarsal. Preoperative radiograph showed evidence of prior triple arthrodesis with a cavovarus foot deformity. CT scan was used to create a 3-D model of the foot. The model was then used to identify an appropriate location for lateral midtarsal and calcaneal closing-wedge osteotomies.
The patient underwent midfoot and hindfoot surgical correction. At surgery, the lateral closing-wedge osteotomies were performed according to the preoperative model. Radiographs 1 year after surgery showed correction of the forefoot varus.
Discussion
Three-dimensional printing for medical applications of anatomical modeling is not a new concept.1,3,4 Its use has been reported for a variety of applications in orthopedic surgery, including the printing of porous and metallic surfaces5 and bone-tissue engineering.6-9 Rapid prototyping for medical application was first reported in 1990 when a CT-based model was used to create a cranial bone.10 Reports of using the technique are becoming more widespread, particularly in the dental and maxillofacial literature, which includes reports on a variety of applications, including patient-specific drill guides, splints, and implants.11-14 The ability to perform mock surgery in advance of an actual procedure provides an invaluable opportunity to anticipate potential intraoperative problems, reduce operative time, and improve the accuracy of reconstruction.
Office-based rapid prototyping that uses an in-house 3-D printer is a novel application of this technology. It allows for creation of a patient-specific model for preoperative planning purposes. We are unaware of any other reports demonstrating the breadth and utility of office-based rapid prototyping in orthopedic surgery. For general reference, a printer similar to ours requires an initial investment of $52,000 to $56,000. This cost generally covers the printer, printer base cabinet, installation, training, and printer software (different from the 3-D modeling software), plus a 1-year warranty. A service agreement costs about $4000 annually. Printer and model supply expenses depend on the material used for the model (eg, ABS [acrylonitrile butadiene styrene]) and on the size and complexity of the 3-D models created. Average time to generate an appropriately formatted 3-D printing file is about 1 hour, though times can vary largely, according to amount of metal artifact subtraction necessary and the experience of the software user. For the rare, extremely complex deformities that require a significant amount of metal artifact subtraction, file preparation times can exceed 3 or 4 hours. We think these preparation times will decrease as communication between radiology file export format and modeling software ultimately allows for metal artifact subtraction images to function within the modeling software environment. Once an appropriately formatted file has been created, typical printing times vary according to the size of the to-be-modeled bone. For a hemipelvis, printing time is 30 to 40 hours; printing that is started on a Friday afternoon will be complete by Monday morning.
There are few reports of rapid prototyping in orthopedic surgery. In 2003, Minns and colleagues15 used a 3-D model in the planning of a tibial resection for TKA. They found the model to be accurate at time of surgery, resulting in appropriate tibial coverage by a conventional meniscal-bearing implant. Munjal and colleagues16 reported on 10 complex failed hip arthroplasty cases in which patients had revision surgery after preoperative planning using 3-D modeling techniques. The authors found that, in 8 of the 10 cases, conventional classification systems of bone loss were inaccurate in comparison with the prototype. Four cases required reconstruction with a custom triflange when conventional implants were not deemed reasonable based on the pelvic model. Tam and colleagues17 reported using a 3-D prototype as an aid in surgical planning for resection of a scapular osteochondroma in a 6-year-old patient. They found the rapid prototype to be useful at time of resection—similar to what we found with 1 patient (case 6). Adding contrast media to our patient’s scan allowed for 3-D visualization of the lesion and the encased vasculature. Fu and colleagues18 reported using a patient-specific drill template to insert anterior transpedicular screws. They constructed 24 prototypes of a formalin-preserved cervical vertebra to create a patient-specific biocompatible drill template for use in correcting multilevel cervical instability. They found the technique to be highly reproducible and accurate. Zein and colleagues19 used a rapid prototype of 3 consecutive human livers to preoperatively identify the vascular and biliary tract anatomy. They reported a high degree of accuracy—mean dimensional errors of less than 4 mm for the entire model and 1.3 mm for the vascular diameter.
The models created by implant manufacturers in this series were used to perform “mock” surgery before the actual procedures. Working with these models prompted us to buy our own 3-D printer. The learning curve can be steep, but commercially available 3-D printers allow for prompt in-office production of high-quality realistic prototypes at relatively low per-case cost (Figure 8). Three-dimensional modeling allows surgeons to assess the accuracy of their original surgical plans and, if necessary, correct them before surgery. Although computer-aided design models are useful, the ability to “perform surgery preoperatively” adds another element to surgeons’ understanding of the potential issues that may arise. Also, an in-office printer can help improve surgeons’ understanding and control over the process by which images are translated from radiographic file to 3-D model. Disadvantages of an in-office system include start-up and maintenance costs, office space requirements, and a significant learning curve for software and hardware applications. In addition, creation of 3-D models requires close interaction with radiologists who can provide appropriately formatted DICOM images, as metal artifact subtraction can be challenging. We think that, as image formatting and software capabilities are continually refined, this technology will become an invaluable part of multiple subspecialties across orthopedic surgery, with potentially infinite clinical, educational, and research applications.
1. McGurk M, Amis AA, Potamianos P, Goodger NM. Rapid prototyping techniques for anatomical modelling in medicine. Ann R Coll Surg Engl. 1997;79(3):169-174.
2. Webb PA. A review of rapid prototyping (RP) techniques in the medical and biomedical sector. J Med Eng Technol. 2000;24(4):149-153.
3. Esses SJ, Berman P, Bloom AI, Sosna J. Clinical applications of physical 3D models derived from MDCT data and created by rapid prototyping. AJR Am J Roentgenol. 2011;196(6):W683-W688.
4. Torres K, Staśkiewicz G, Śnieżyński M, Drop A, Maciejewski R. Application of rapid prototyping techniques for modelling of anatomical structures in medical training and education. Folia Morphol. 2011;70(1):1-4.
5. Melican MC, Zimmerman MC, Dhillon MS, Ponnambalam AR, Curodeau A, Parsons JR. Three-dimensional printing and porous metallic surfaces: a new orthopedic application. J Biomed Mater Res. 2001;55(2):194-202.
6. Butscher A, Bohner M, Hofmann S, Gauckler L, Müller R. Structural and material approaches to bone tissue engineering in powder-based three-dimensional printing. Acta Biomater. 2011;7(3):907-920.
7. Ciocca L, De Crescenzio F, Fantini M, Scotti R. CAD/CAM and rapid prototyped scaffold construction for bone regenerative medicine and surgical transfer of virtual planning: a pilot study. Comput Med Imaging Graph. 2009;33(1):58-62.
8. Leukers B, Gülkan H, Irsen SH, et al. Hydroxyapatite scaffolds for bone tissue engineering made by 3D printing. J Mater Sci Mater Med. 2005;16(12):1121-1124.
9. Seitz H, Rieder W, Irsen S, Leukers B, Tille C. Three-dimensional printing of porous ceramic scaffolds for bone tissue engineering. J Biomed Mater Res B Appl Biomater. 2005;74(2):782-788.
10. Mankovich NJ, Cheeseman AM, Stoker NG. The display of three-dimensional anatomy with stereolithographic models. J Digit Imaging. 1990;3(3):200-203.
11. Flügge TV, Nelson K, Schmelzeisen R, Metzger MC. Three-dimensional plotting and printing of an implant drilling guide: simplifying guided implant surgery. J Oral Maxillofac Surg. 2013;71(8):1340-1346.
12. Goiato MC, Santos MR, Pesqueira AA, Moreno A, dos Santos DM, Haddad MF. Prototyping for surgical and prosthetic treatment. J Craniofac Surg. 2011;22(3):914-917.
13. Metzger MC, Hohlweg-Majert B, Schwarz U, Teschner M, Hammer B, Schmelzeisen R. Manufacturing splints for orthognathic surgery using a three-dimensional printer. Oral Surg Oral Med Oral Pathol Oral Radiol Endod. 2008;105(2):e1-e7.
14. Robiony M, Salvo I, Costa F, et al. Virtual reality surgical planning for maxillofacial distraction osteogenesis: the role of reverse engineering rapid prototyping and cooperative work. J Oral Maxillofac Surg. 2007;65(6):1198-1208.
15. Minns RJ, Bibb R, Banks R, Sutton RA. The use of a reconstructed three-dimensional solid model from CT to aid the surgical management of a total knee arthroplasty: a case study. Med Eng Phys. 2003;25(6):523-526.
16. Munjal S, Leopold SS, Kornreich D, Shott S, Finn HA. CT-generated 3-dimensional models for complex acetabular reconstruction. J Arthroplasty. 2000;15(5):644-653.
17. Tam MD, Laycock SD, Bell D, Chojnowski A. 3-D printout of a DICOM file to aid surgical planning in a 6 year old patient with a large scapular osteochondroma complicating congenital diaphyseal aclasia. J Radiol Case Rep. 2012;6(1):31-37.
18. Fu M, Lin L, Kong X, et al. Construction and accuracy assessment of patient-specific biocompatible drill template for cervical anterior transpedicular screw (ATPS) insertion: an in vitro study. PLoS One. 2013;8(1):e53580.
19. Zein NN, Hanouneh IA, Bishop PD, et al. Three-dimensional print of a liver for preoperative planning in living donor liver transplantation. Liver Transpl. 2013;19(12):1304-1310.