I am a psychiatric nurse and am concerned about the new group of hospitalists who are taking over all the new ED patients:
Are signing off to the nursing staff or in the electronic health record (EHR); they do not speak with the attending psychiatrist;
Are not monitoring their own medications, including Coumadin or insulin (from what some other nurses have reported);
Require that, if we need to speak with one, we are to call the triage hospitalist, who typically says that they can’t do anything because they didn’t start the medication and they don’t know the patient.
Many of our patients are very ill, not only psychiatrically but also medically. We feel the hospital has placed us and the patients in jeopardy. Is this typical? Do other hospitalist groups manage their patients like the ones I have described?
–Sincerely,
Psych Nurse Caught in the Middle
Dr. Hospitalist responds:
amane kaneko
Since you mention that the “new group” of hospitalists is caring for “all the new ED patients,” I’m assuming the patients are being assigned to the hospitalist group because they are unassigned and either don’t have a primary care physician (who would direct them to a specific hospitalist) or the group is the only one in the hospital and receives all patients admitted through the ED who require admission to a hospitalist service. After all, if either you or the PCP is dissatisfied with the group and there were other groups to choose from, you would simply call another group.
I’ll address your concerns individually:
Although signing off from a consult in the EHR is fairly common, especially in busy practices, the process is usually mutually agreed upon by the clinicians involved. If the attending psychiatrist would like a call from the hospitalists before they sign off, then he or she should make that known to the group.
On most occasions, the sign-off does not occur until the hospitalist/consultant feels the patient is stable and the clinicians involved can handle “basic medical issues.” There are many patients in the hospital on insulin, Coumadin, and anti-hypertensive medications; if the hospitalist followed all of them throughout their entire hospitalization, there would be no time for the new consults. It is customary to follow patients until they are stable (e.g. the blood sugars are not markedly fluctuating and there is good sliding scale coverage, or the PT/INR [prothrombin time/international normalized ratio] has been relatively unchanged for several days). To do otherwise might also alert the CMS auditors to check the “medical necessity” for the ongoing visits.
While most large hospitalist programs have a designated triage person who receives all the calls from the ED, the other providers, and the transfer service, that person can usually answer basic patient care questions. If the person is very busy, or if the problem is more complex and the original consultant is not available, there is always someone covering for that person or the consult service to answer questions, since this is a very common occurrence.
Consults are meant to answer a specific question or assist with complex medical management issues. In order for the arrangement to work, both parties have to agree to well-defined parameters, and, at some point, there should be mutually agreed upon closure.
If no such arrangement exists, I would discuss the issue with the hospitalist director.
CHICAGO – Progression-free survival for patients with rituximab-refractory indolent non-Hodgkin’s lymphomas was effectively doubled with a combination of obinutuzumab and bendamustine, compared with bendamustine alone.
Dr. Laura Helen Sehn from the British Columbia (Canada) Cancer Agency in Vancouver, says that the study, the GADOLIN trial. “is remarkable, because it does demonstrate the first randomized evidence of a clinical benefit of a novel anti-CD20 monoclonal antibiody for patients who are rituximab refractory.”
She described the study’s key findings at the annual meeting of the American Society of Clinical Oncology.
The video associated with this article is no longer available on this site. Please view all of our videos on the MDedge YouTube channel
CHICAGO—The JAK2/FLT3 inhibitor pacritinib may fulfill an unmet need in the treatment of myelofibrosis (MF), according to a speaker at the 2015 ASCO Annual Meeting.
Results of the phase 3 PERSIST-1 trial indicate that pacritinib is safe and effective for MF patients with thrombocytopenia.
“Thrombocytopenia is a common feature in people with advanced [MF], and current treatment options have not been able to concurrently improve splenomegaly symptoms and cytopenias in these patients,” said study investigator Ruben A. Mesa, MD, of the Mayo Clinic Cancer Center in Scottsdale, Arizona.
But PERSIST-1 showed that pacritinib can accomplish this. And the drug proved more effective than best available therapy (BAT), excluding JAK inhibitors, in reducing spleen volume and alleviating MF symptoms in the entire cohort of MF patients.
Dr Mesa presented these results at ASCO as abstract LBA7006. The study was funded by CTI BioPharma Corp., the company developing pacritinib.
The trial included 327 patients who were randomized to receive pacritinib (n=220) or BAT (n=107).
Patients in the BAT arm received therapies that are routinely prescribed off-label for MF, such as erythropoietin-stimulating agents, immunomodulatory drugs, and hydroxyurea. Ruxolitinib was intentionally excluded from this trial because the study included patients with thrombocytopenia.
Dr Mesa said the patients’ baseline characteristics “demonstrate a group of individuals with advanced myelofibrosis, a heavy percentage of those with primary myelofibrosis, the vast majority having intermediate-2 or high-risk disease, with very significant splenomegaly, and the vast majority having the JAK2 mutation.”
“About half the individuals were anemic or transfusion-dependent,” he noted. “And a full third were thrombocytopenic, under 100,000 [platelets/µL], with 16% under 50,000 [platelets/µL]. This was the first phase 3 study of myelofibrosis that allowed individuals with a platelet count of less than 100,000 to be enrolled.”
Fifty-six percent of patients remained on pacritinib at the time of analysis, as did 8% of patients on BAT. Seventy-nine percent of patients crossed over from the BAT arm to the pacritinib arm.
Spleen reduction
The study’s primary endpoint was a reduction in spleen volume of 35% or greater.
In the intent-to-treat (ITT) population, 19.1% of patients in the pacritinib arm met this endpoint, as did 4.7% of patients in the BAT arm (P=0.0003). In the evaluable population—165 patients in the pacritinib arm and 85 patients in the BAT arm—the rates were 25% and 5.9%, respectively (P=0.0001).
Dr Mesa noted that pacritinib was able to reduce spleen volume in all subgroups of patients, including those with thrombocytopenia.
“Both the group [with platelet counts] under 100,000 as well as under 50,000 uniquely responded only on the pacritinib arm, with no responses on the BAT arm,” he said.
In the ITT population, 16.7% of patients with platelet counts under 100,000/µL and 22.9% of patients with platelet counts under 50,000/µL met the primary endpoint. The P values, in the comparison with the BAT arm, were 0.0451 and 0.0086, respectively.
In the evaluable population, 23.5% of patients with platelet counts under 100,000/µL and 33.3% of patients with platelet counts under 50,000/µL met the primary endpoint. The P values were 0.0370 and 0.0072, respectively.
“It is too early to know if pacritinib has an impact on survival, but that is clearly our expectation [based on the spleen responses observed],” Dr Mesa said.
TSS and transfusion
The study’s secondary endpoint was the proportion of patients with a 50% or greater reduction in Total Symptom Score (TSS) from baseline to week 24. TSS was measured by patient responses on the Myeloproliferative Neoplasm Symptom Assessment Form.
In the ITT population, 24.5% of pacritinib-treated patients and 6.5% of BAT-treated patients had a 50% or greater reduction in TSS score (P<0.0001). In the evaluable population, 40.9% and 9.9% of patients, respectively (P<0.0001), met this endpoint.
Dr Mesa also pointed out that 25.7% of pacritinib-treated patients who were severely anemic and transfusion-dependent—requiring at least 6 units of blood in the 90 days prior to study entry—became transfusion independent. But none of the BAT-treated patients did so (P<0.043).
Adverse events
“The most common adverse events [in the pacritinib arm] were consistent with the earlier studies,” Dr Mesa said. “Gastrointestinal toxicities were most common, although typically at low grades.”
“As expected, we saw very few individuals with any significant thrombocytopenia or anemia as drug-emergent. There were individuals who enrolled in the study as a grade 4, so some of those remained.”
The most common adverse events of any grade were diarrhea (53.2% in the pacritinib arm and 12.3% in the BAT arm), nausea (26.8% vs 6.6%), anemia (22.3% vs 19.8%), thrombocytopenia (16.8% vs 13.2%), and vomiting (15.9% vs 5.7%).
Ten percent of patients in the pacritinib arm required dose reductions due to adverse events. Diarrhea prompted dose interruptions in 13 patients and discontinuation in 3 patients. But pacritinib-associated diarrhea typically resolved in a little over a week.
“Based on these preliminary results, pacritinib may represent a very important agent for individuals with advanced disease and may have an impact on the disease course,” Dr Mesa concluded.
A 44-year-old-man with type 1 diabetes mellitus (DM) was transported to the ED via emergency medical services (EMS) with a chief complaint of hypoglycemia. His wife stated the patient had been acting strangely prior to presentation. She further noted that after checking his blood sugar, which was 19 mg/dL, she gave her husband an oral glucose tablet with some water before calling EMS.
Upon arrival to the ED, the patient was triaged and designated as an urgent level III. At that time, he was alert and oriented, with a blood glucose level of 66 mg/dL. The patient was examined by a physician assistant (PA) within 15 minutes of his arrival. When interviewed by the PA, the patient described feelings of weakness, dizziness, and lightheadedness. The PA attributed these symptoms to the patient’s hypoglycemic state and ordered him a food tray. The patient was then observed for approximately 2 hours, during which time repeat blood-glucose testing revealed a level of 438 mg/dL. Approximately 20 minutes later, another blood-glucose test showed a level of 400 mg/dL. The patient felt well, appeared back to baseline, and expressed the desire to go home. At discharge, the PA instructed the patient to reduce his insulin by 20% and to follow up with his primary care physician (PCP) that same week.
Approximately 3 hours after discharge, the patient was found unresponsive by his wife, and EMS was again called. When EMS arrived at the patient’s house, his blood glucose level was 85 mg/dL. At presentation to the ED, the patient was unresponsive and without a pulse. Despite approximately 30 minutes of intensive resuscitative efforts, the code was called and the patient was pronounced dead.
The family sued the hospital, the emergency physician (EP), and the PA. They claimed the triage nurse failed to obtain an adequate history of the patient’s recent glucometer checks, previous hypoglycemic episodes, the amount and time of his last dose of insulin, and when and how much food he had recently ingested. The plaintiff further argued that that PA failed to obtain an electrocardiogram (ECG) to determine if the patient’s heart rhythm had been affected by his hypoglycemic state. The plaintiff also claimed the PA should have notified the patient’s PCP that the patient was in the ED, so that he could be admitted.
The defendants denied any negligence and argued the patient’s death was due to a sudden cardiac event, which was unrelated to the low-blood sugar levels. The defense contended that the patient’s enlarged heart and preexisting cardiovascular disease, hypertension, hypercholesterolemia, poorly controlled type 1 DM, history of alcohol abuse, and documented evidence of medication noncompliance were the cause of death. According to published accounts, a defense verdict was returned.
Discussion
It seems that rarely a shift goes by without a patient presenting with diabetes-associated complications such as hyperglycemia or hypoglycemia. While the jury reached the correct conclusion in this case, it does serve as a reminder that cases of hypoglycemia should not be treated lightly, and the EP must attempt to determine its cause.
The most commonly accepted definition of hypoglycemia is a blood-glucose level <50 mg/dL with associated symptoms. The causes of hypoglycemia in patients treated with insulin typically involves inadequate or no food intake, or accidental administration of too much insulin or the wrong type of insulin.1
The differential diagnosis, however, needs to be more than just these two conditions. Since insulin is cleared by the kidneys, and patients with DM are at increased risk for kidney disease, acute renal failure should be considered in the differential. Other conditions to consider include infection, acute coronary syndromes, or unusual physical or mental stress.2
As with every patient presenting to the ED, patients with DM require a good history taking and physical examination. Additional testing, such as an ECG, troponin level, and kidney function test, should be performed based on the history and physical examination. Once the cause is determined, the majority of these patients can be treated with either intravenous (IV) or oral medications, observed, and discharged home with follow-up instructions.
Diabetic patients presenting with hypoglycemia due to a sulfonylurea agent or a long-acting insulin are in a completely different category. Because of the longer half-life of these agents, such patients will usually require admission to the hospital for serial glucose monitoring and treatment.2 On occasion, patients with diabetic hypoglycemia and who are on a regular form of insulin will also require hospital admission. Those at highest risk are patients with DM aged 80 years and older.1
Hyperkalemia
A 59-year-old man presented to the ED complaining of generalized weakness, the onset of which he stated had developed gradually over the previous 3 days. He denied chest pain, shortness of breath, or nausea and vomiting. His medical history was significant only for renal insufficiency. The patient was on no medications and denied alcohol or tobacco use.
Monkey Business Images/ Shutterstock
On physical examination, the patient had normal vital signs, including normal pulse oximetry. Similarly, the heart, lung, and abdominal examinations were all normal. On neurological examination, the patient had 5/5 motor strength in all four extremities and exhibited a normal gait.
The EP ordered an ECG, complete blood count (CBC), basic metabolic panel, urinalysis, and a chest X-ray (CXR). Laboratory evaluation showed an elevated potassium level of 6 mEq/L. The results of the CBC, urinalysis, and CXR were all reported as normal. (Unfortunately, there was no published information on the results of the BUN, creatinine, serum bicarbonate, or ECG findings.)
Based on the patient’s elevated potassium level, the EP ordered sodium polystyrene (Kayexalate) orally and arranged for admission to the hospital. The sodium polystyrene was administered to the patient approximately 1 hour after it was ordered. While waiting for an inpatient bed, the patient experienced a cardiac arrest and died in the ED.
The family sued the EP and hospital for failure to properly respond to the patient’s elevated potassium level. The hospital denied any negligence, and the defense argued that the death was not related to any electrolyte abnormality, but was due to a respiratory arrest that led to the cardiac arrest. The defendants also maintained the sodium polystyrene had been administered in a timely manner. At trial, a defense verdict was returned.
Discussion
Hyperkalemia has been variably defined as serum potassium concentrations >5 mEq/L, >5.5 mEq/L, or >6 mEq/L.1 Symptoms of hyperkalemia include generalized muscle weakness (as seen in this patient), muscle cramps, paresthesias, nausea, vomiting, and/or diarrhea. However, it is the cardiac manifestations (eg, ventricular arrhythmias, complete heart block, asystole) associated with hyperkalemia that are most concerning.
There are numerous causes of hyperkalemia, including medications, renal failure, digitalis toxicity, and metabolic acidosis. Therefore, it is important for the EP to identify the etiology in order to definitively treat the hyperkalemia.
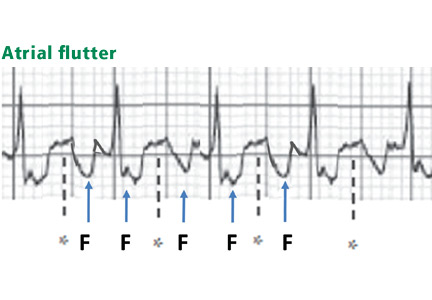
Traditionally, it has been taught that hyperkalemia only requires treatment if abnormalities on the ECG are noted. Classic findings seen on ECG include prolonged PR interval, peaked T waves,2 shortened QT interval, QRS widening, and a sinusoidal wave pattern. Once fictitious or hemolysis has been ruled out as the etiology, most EPs will initiate treatment above a specific threshold value (frequently 6 mEq/L),
Since it is the cardiac effects of hyperkalemia that can result in death, the initial treatment must be directed toward cardiac membrane stabilization. This is best accomplished by the administration of calcium gluconate 10% IV. This medication has a rapid onset of action (typically 1-3 minutes) and helps prevent the development of cardiac arrhythmias. Additional measures, which involve moving potassium intracellullarly, include sodium bicarbonate IV and insulin with glucose IV.
Actual removal of potassium from the body involves either the administration sodium polystyrene sulfonate or hemodialysis. Sodium polystyrene sulfonate, which is an ion-exchange resin designed to exchange sodium for potassium in the colon, can be given either orally or as an enema. Even though sodium polystyrene sulfonate has been approved for the treatment of hyperkalemia since 1958, it does not take effect for 1 to 2 hours after administration; there is also growing evidence questioning its efficacy and safety.3 In addition, sodium polystyrene sulfonate can exacerbate volume overload due to the associated increase in serum sodium. Therefore, hemodialysis is the most effective treatment for hyperkalemia, and is the treatment of choice for unstable patients with hyperkalemia and acute or chronic renal failure.
References
Reference - Hypoglycemia
Geller AI, Shehab N, Lovegrove MC, et al. National estimates of insulin-related hypoglycemia and errors leading to emergency department visits and hospitalizations. JAMA Intern Med. 2014;174(5): 678-686.
Jalili M: Type 2 Diabetes Mellitus. In: Tintinalli JE, et al, eds. Tintinalli’s Emergency Medicine – A Comprehensive Study Guide, 7th ed. New York; McGraw Hill Medical; 2011:1419.
Reference - Hyperkalemia
Jain N, Kotla S, Little BB, et al. Predictors of hyperkalemia and death in patients with cardiac and renal disease. Am J Cardiol. 2012;109(10):1510-1513.
Welch A, Maroz N, Wingo CS. Hyperkalemia: getting to the heart of the matter. Nephrol Dial Transplant. 2013;28(1):15-16.
Sterns RH, Rojas M, Bernstein P, Chennupati S. Ion-exchange resins for the treatment of hyperkalemia: are they safe and effective? J Am Soc Nephrol. 2010; 21(5):73-735.
A 44-year-old-man with type 1 diabetes mellitus (DM) was transported to the ED via emergency medical services (EMS) with a chief complaint of hypoglycemia. His wife stated the patient had been acting strangely prior to presentation. She further noted that after checking his blood sugar, which was 19 mg/dL, she gave her husband an oral glucose tablet with some water before calling EMS.
Upon arrival to the ED, the patient was triaged and designated as an urgent level III. At that time, he was alert and oriented, with a blood glucose level of 66 mg/dL. The patient was examined by a physician assistant (PA) within 15 minutes of his arrival. When interviewed by the PA, the patient described feelings of weakness, dizziness, and lightheadedness. The PA attributed these symptoms to the patient’s hypoglycemic state and ordered him a food tray. The patient was then observed for approximately 2 hours, during which time repeat blood-glucose testing revealed a level of 438 mg/dL. Approximately 20 minutes later, another blood-glucose test showed a level of 400 mg/dL. The patient felt well, appeared back to baseline, and expressed the desire to go home. At discharge, the PA instructed the patient to reduce his insulin by 20% and to follow up with his primary care physician (PCP) that same week.
Approximately 3 hours after discharge, the patient was found unresponsive by his wife, and EMS was again called. When EMS arrived at the patient’s house, his blood glucose level was 85 mg/dL. At presentation to the ED, the patient was unresponsive and without a pulse. Despite approximately 30 minutes of intensive resuscitative efforts, the code was called and the patient was pronounced dead.
The family sued the hospital, the emergency physician (EP), and the PA. They claimed the triage nurse failed to obtain an adequate history of the patient’s recent glucometer checks, previous hypoglycemic episodes, the amount and time of his last dose of insulin, and when and how much food he had recently ingested. The plaintiff further argued that that PA failed to obtain an electrocardiogram (ECG) to determine if the patient’s heart rhythm had been affected by his hypoglycemic state. The plaintiff also claimed the PA should have notified the patient’s PCP that the patient was in the ED, so that he could be admitted.
The defendants denied any negligence and argued the patient’s death was due to a sudden cardiac event, which was unrelated to the low-blood sugar levels. The defense contended that the patient’s enlarged heart and preexisting cardiovascular disease, hypertension, hypercholesterolemia, poorly controlled type 1 DM, history of alcohol abuse, and documented evidence of medication noncompliance were the cause of death. According to published accounts, a defense verdict was returned.
Discussion
It seems that rarely a shift goes by without a patient presenting with diabetes-associated complications such as hyperglycemia or hypoglycemia. While the jury reached the correct conclusion in this case, it does serve as a reminder that cases of hypoglycemia should not be treated lightly, and the EP must attempt to determine its cause.
The most commonly accepted definition of hypoglycemia is a blood-glucose level <50 mg/dL with associated symptoms. The causes of hypoglycemia in patients treated with insulin typically involves inadequate or no food intake, or accidental administration of too much insulin or the wrong type of insulin.1
The differential diagnosis, however, needs to be more than just these two conditions. Since insulin is cleared by the kidneys, and patients with DM are at increased risk for kidney disease, acute renal failure should be considered in the differential. Other conditions to consider include infection, acute coronary syndromes, or unusual physical or mental stress.2
As with every patient presenting to the ED, patients with DM require a good history taking and physical examination. Additional testing, such as an ECG, troponin level, and kidney function test, should be performed based on the history and physical examination. Once the cause is determined, the majority of these patients can be treated with either intravenous (IV) or oral medications, observed, and discharged home with follow-up instructions.
Diabetic patients presenting with hypoglycemia due to a sulfonylurea agent or a long-acting insulin are in a completely different category. Because of the longer half-life of these agents, such patients will usually require admission to the hospital for serial glucose monitoring and treatment.2 On occasion, patients with diabetic hypoglycemia and who are on a regular form of insulin will also require hospital admission. Those at highest risk are patients with DM aged 80 years and older.1
Hyperkalemia
A 59-year-old man presented to the ED complaining of generalized weakness, the onset of which he stated had developed gradually over the previous 3 days. He denied chest pain, shortness of breath, or nausea and vomiting. His medical history was significant only for renal insufficiency. The patient was on no medications and denied alcohol or tobacco use.
Monkey Business Images/ Shutterstock
On physical examination, the patient had normal vital signs, including normal pulse oximetry. Similarly, the heart, lung, and abdominal examinations were all normal. On neurological examination, the patient had 5/5 motor strength in all four extremities and exhibited a normal gait.
The EP ordered an ECG, complete blood count (CBC), basic metabolic panel, urinalysis, and a chest X-ray (CXR). Laboratory evaluation showed an elevated potassium level of 6 mEq/L. The results of the CBC, urinalysis, and CXR were all reported as normal. (Unfortunately, there was no published information on the results of the BUN, creatinine, serum bicarbonate, or ECG findings.)
Based on the patient’s elevated potassium level, the EP ordered sodium polystyrene (Kayexalate) orally and arranged for admission to the hospital. The sodium polystyrene was administered to the patient approximately 1 hour after it was ordered. While waiting for an inpatient bed, the patient experienced a cardiac arrest and died in the ED.
The family sued the EP and hospital for failure to properly respond to the patient’s elevated potassium level. The hospital denied any negligence, and the defense argued that the death was not related to any electrolyte abnormality, but was due to a respiratory arrest that led to the cardiac arrest. The defendants also maintained the sodium polystyrene had been administered in a timely manner. At trial, a defense verdict was returned.
Discussion
Hyperkalemia has been variably defined as serum potassium concentrations >5 mEq/L, >5.5 mEq/L, or >6 mEq/L.1 Symptoms of hyperkalemia include generalized muscle weakness (as seen in this patient), muscle cramps, paresthesias, nausea, vomiting, and/or diarrhea. However, it is the cardiac manifestations (eg, ventricular arrhythmias, complete heart block, asystole) associated with hyperkalemia that are most concerning.
There are numerous causes of hyperkalemia, including medications, renal failure, digitalis toxicity, and metabolic acidosis. Therefore, it is important for the EP to identify the etiology in order to definitively treat the hyperkalemia.
Traditionally, it has been taught that hyperkalemia only requires treatment if abnormalities on the ECG are noted. Classic findings seen on ECG include prolonged PR interval, peaked T waves,2 shortened QT interval, QRS widening, and a sinusoidal wave pattern. Once fictitious or hemolysis has been ruled out as the etiology, most EPs will initiate treatment above a specific threshold value (frequently 6 mEq/L),
Since it is the cardiac effects of hyperkalemia that can result in death, the initial treatment must be directed toward cardiac membrane stabilization. This is best accomplished by the administration of calcium gluconate 10% IV. This medication has a rapid onset of action (typically 1-3 minutes) and helps prevent the development of cardiac arrhythmias. Additional measures, which involve moving potassium intracellullarly, include sodium bicarbonate IV and insulin with glucose IV.
Actual removal of potassium from the body involves either the administration sodium polystyrene sulfonate or hemodialysis. Sodium polystyrene sulfonate, which is an ion-exchange resin designed to exchange sodium for potassium in the colon, can be given either orally or as an enema. Even though sodium polystyrene sulfonate has been approved for the treatment of hyperkalemia since 1958, it does not take effect for 1 to 2 hours after administration; there is also growing evidence questioning its efficacy and safety.3 In addition, sodium polystyrene sulfonate can exacerbate volume overload due to the associated increase in serum sodium. Therefore, hemodialysis is the most effective treatment for hyperkalemia, and is the treatment of choice for unstable patients with hyperkalemia and acute or chronic renal failure.
Hypoglycemia
mrfiza/ Shutterstock
A 44-year-old-man with type 1 diabetes mellitus (DM) was transported to the ED via emergency medical services (EMS) with a chief complaint of hypoglycemia. His wife stated the patient had been acting strangely prior to presentation. She further noted that after checking his blood sugar, which was 19 mg/dL, she gave her husband an oral glucose tablet with some water before calling EMS.
Upon arrival to the ED, the patient was triaged and designated as an urgent level III. At that time, he was alert and oriented, with a blood glucose level of 66 mg/dL. The patient was examined by a physician assistant (PA) within 15 minutes of his arrival. When interviewed by the PA, the patient described feelings of weakness, dizziness, and lightheadedness. The PA attributed these symptoms to the patient’s hypoglycemic state and ordered him a food tray. The patient was then observed for approximately 2 hours, during which time repeat blood-glucose testing revealed a level of 438 mg/dL. Approximately 20 minutes later, another blood-glucose test showed a level of 400 mg/dL. The patient felt well, appeared back to baseline, and expressed the desire to go home. At discharge, the PA instructed the patient to reduce his insulin by 20% and to follow up with his primary care physician (PCP) that same week.
Approximately 3 hours after discharge, the patient was found unresponsive by his wife, and EMS was again called. When EMS arrived at the patient’s house, his blood glucose level was 85 mg/dL. At presentation to the ED, the patient was unresponsive and without a pulse. Despite approximately 30 minutes of intensive resuscitative efforts, the code was called and the patient was pronounced dead.
The family sued the hospital, the emergency physician (EP), and the PA. They claimed the triage nurse failed to obtain an adequate history of the patient’s recent glucometer checks, previous hypoglycemic episodes, the amount and time of his last dose of insulin, and when and how much food he had recently ingested. The plaintiff further argued that that PA failed to obtain an electrocardiogram (ECG) to determine if the patient’s heart rhythm had been affected by his hypoglycemic state. The plaintiff also claimed the PA should have notified the patient’s PCP that the patient was in the ED, so that he could be admitted.
The defendants denied any negligence and argued the patient’s death was due to a sudden cardiac event, which was unrelated to the low-blood sugar levels. The defense contended that the patient’s enlarged heart and preexisting cardiovascular disease, hypertension, hypercholesterolemia, poorly controlled type 1 DM, history of alcohol abuse, and documented evidence of medication noncompliance were the cause of death. According to published accounts, a defense verdict was returned.
Discussion
It seems that rarely a shift goes by without a patient presenting with diabetes-associated complications such as hyperglycemia or hypoglycemia. While the jury reached the correct conclusion in this case, it does serve as a reminder that cases of hypoglycemia should not be treated lightly, and the EP must attempt to determine its cause.
The most commonly accepted definition of hypoglycemia is a blood-glucose level <50 mg/dL with associated symptoms. The causes of hypoglycemia in patients treated with insulin typically involves inadequate or no food intake, or accidental administration of too much insulin or the wrong type of insulin.1
The differential diagnosis, however, needs to be more than just these two conditions. Since insulin is cleared by the kidneys, and patients with DM are at increased risk for kidney disease, acute renal failure should be considered in the differential. Other conditions to consider include infection, acute coronary syndromes, or unusual physical or mental stress.2
As with every patient presenting to the ED, patients with DM require a good history taking and physical examination. Additional testing, such as an ECG, troponin level, and kidney function test, should be performed based on the history and physical examination. Once the cause is determined, the majority of these patients can be treated with either intravenous (IV) or oral medications, observed, and discharged home with follow-up instructions.
Diabetic patients presenting with hypoglycemia due to a sulfonylurea agent or a long-acting insulin are in a completely different category. Because of the longer half-life of these agents, such patients will usually require admission to the hospital for serial glucose monitoring and treatment.2 On occasion, patients with diabetic hypoglycemia and who are on a regular form of insulin will also require hospital admission. Those at highest risk are patients with DM aged 80 years and older.1
Hyperkalemia
A 59-year-old man presented to the ED complaining of generalized weakness, the onset of which he stated had developed gradually over the previous 3 days. He denied chest pain, shortness of breath, or nausea and vomiting. His medical history was significant only for renal insufficiency. The patient was on no medications and denied alcohol or tobacco use.
Monkey Business Images/ Shutterstock
On physical examination, the patient had normal vital signs, including normal pulse oximetry. Similarly, the heart, lung, and abdominal examinations were all normal. On neurological examination, the patient had 5/5 motor strength in all four extremities and exhibited a normal gait.
The EP ordered an ECG, complete blood count (CBC), basic metabolic panel, urinalysis, and a chest X-ray (CXR). Laboratory evaluation showed an elevated potassium level of 6 mEq/L. The results of the CBC, urinalysis, and CXR were all reported as normal. (Unfortunately, there was no published information on the results of the BUN, creatinine, serum bicarbonate, or ECG findings.)
Based on the patient’s elevated potassium level, the EP ordered sodium polystyrene (Kayexalate) orally and arranged for admission to the hospital. The sodium polystyrene was administered to the patient approximately 1 hour after it was ordered. While waiting for an inpatient bed, the patient experienced a cardiac arrest and died in the ED.
The family sued the EP and hospital for failure to properly respond to the patient’s elevated potassium level. The hospital denied any negligence, and the defense argued that the death was not related to any electrolyte abnormality, but was due to a respiratory arrest that led to the cardiac arrest. The defendants also maintained the sodium polystyrene had been administered in a timely manner. At trial, a defense verdict was returned.
Discussion
Hyperkalemia has been variably defined as serum potassium concentrations >5 mEq/L, >5.5 mEq/L, or >6 mEq/L.1 Symptoms of hyperkalemia include generalized muscle weakness (as seen in this patient), muscle cramps, paresthesias, nausea, vomiting, and/or diarrhea. However, it is the cardiac manifestations (eg, ventricular arrhythmias, complete heart block, asystole) associated with hyperkalemia that are most concerning.
There are numerous causes of hyperkalemia, including medications, renal failure, digitalis toxicity, and metabolic acidosis. Therefore, it is important for the EP to identify the etiology in order to definitively treat the hyperkalemia.
Traditionally, it has been taught that hyperkalemia only requires treatment if abnormalities on the ECG are noted. Classic findings seen on ECG include prolonged PR interval, peaked T waves,2 shortened QT interval, QRS widening, and a sinusoidal wave pattern. Once fictitious or hemolysis has been ruled out as the etiology, most EPs will initiate treatment above a specific threshold value (frequently 6 mEq/L),
Since it is the cardiac effects of hyperkalemia that can result in death, the initial treatment must be directed toward cardiac membrane stabilization. This is best accomplished by the administration of calcium gluconate 10% IV. This medication has a rapid onset of action (typically 1-3 minutes) and helps prevent the development of cardiac arrhythmias. Additional measures, which involve moving potassium intracellullarly, include sodium bicarbonate IV and insulin with glucose IV.
Actual removal of potassium from the body involves either the administration sodium polystyrene sulfonate or hemodialysis. Sodium polystyrene sulfonate, which is an ion-exchange resin designed to exchange sodium for potassium in the colon, can be given either orally or as an enema. Even though sodium polystyrene sulfonate has been approved for the treatment of hyperkalemia since 1958, it does not take effect for 1 to 2 hours after administration; there is also growing evidence questioning its efficacy and safety.3 In addition, sodium polystyrene sulfonate can exacerbate volume overload due to the associated increase in serum sodium. Therefore, hemodialysis is the most effective treatment for hyperkalemia, and is the treatment of choice for unstable patients with hyperkalemia and acute or chronic renal failure.
References
Reference - Hypoglycemia
Geller AI, Shehab N, Lovegrove MC, et al. National estimates of insulin-related hypoglycemia and errors leading to emergency department visits and hospitalizations. JAMA Intern Med. 2014;174(5): 678-686.
Jalili M: Type 2 Diabetes Mellitus. In: Tintinalli JE, et al, eds. Tintinalli’s Emergency Medicine – A Comprehensive Study Guide, 7th ed. New York; McGraw Hill Medical; 2011:1419.
Reference - Hyperkalemia
Jain N, Kotla S, Little BB, et al. Predictors of hyperkalemia and death in patients with cardiac and renal disease. Am J Cardiol. 2012;109(10):1510-1513.
Welch A, Maroz N, Wingo CS. Hyperkalemia: getting to the heart of the matter. Nephrol Dial Transplant. 2013;28(1):15-16.
Sterns RH, Rojas M, Bernstein P, Chennupati S. Ion-exchange resins for the treatment of hyperkalemia: are they safe and effective? J Am Soc Nephrol. 2010; 21(5):73-735.
A previously healthy 4-month-old girl was brought into the ED for concerns of alcohol ingestion. Reportedly, the infant’s father reconstituted 4 ounces of powdered formula using what he thought was water from an unmarked bottle in his refrigerator. He later realized that the bottle contained rum, although he still let the child finish the 4 ounces of formula in the hopes that she would vomit—which did not occur.
Upon arrival to the ED, the infant’s vital signs were: blood pressure, 100/61 mm Hg; heart rate, 155 beats/minute; respiratory rate, 36 breaths/minute; and temperature, normal. Oxygen saturation was 98% on room air. A rapid bedside blood glucose test was 89 mg/dL. The infant’s physical examination was unremarkable. She appeared active but hungry, had a strong cry, and had a developmentally appropriate gross neurological examination.
How does ethanol exposure in children typically occur?
Recent reports from the American Association of Poison Control Centers’ National Poison Data System demonstrate that ethanol exposures comprise 1% to 3% of total exposures in children aged ≤5 years.
The most common sources are ethanol-containing beverages, mouthwash, and cologne/perfume.1 Ethanol can also be found as a solvent for certain pediatric liquid medications (eg, ranitidine) or in flavor extracts (eg, vanilla extract, orange extract). Any clear alcohol (eg, vodka, gin, rum) stored in an accessible site, such as a refrigerator, may be mistaken for water. In many reports, a caregiver unintentionally used the alcohol to reconstitute formula; however, intentional provision of alcohol to toddlers, usually as a sedative, is a recurring concern.2
What are the clinical concerns in children with ethanol intoxication?
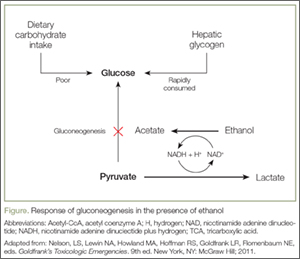
An understanding of the pathways of ethanol metabolism frames the key issues surrounding ethanol exposure in small children. Ethanol is metabolized in the liver primarily through sequential oxidation by alcohol-dehydrogenase (ADH) and aldehyde-dehydrogenase (ALDH), which reduce nicotinamide adenine dinucleotide (NAD+) to NAD plus hydrogen (NADH) in each step. The final product of this pathway, acetate, is then converted to acetyl coenzyme A (acetyl-CoA), which enters into the Krebs cycle for thiamine-dependent metabolism to carbon dioxide and water (Figure). With substantial exposures to ethanol, the accumulation of NADH creates an imbalance in the body’s reducing potential, resulting in metabolic disturbances such as alcoholic ketoacidosis.
Under usual conditions, a normal serum glucose concentration is maintained from ingested carbohydrates and via glycogenolysis of hepatic glycogen stores. Such glycogen reserves can sustain normal blood glucose concentrations for several hours in adults but for a shorter period in children. Once glycogen is depleted, as is common after an overnight fast, glucose can be generated through gluconeogenesis.
However, in the presence of ethanol (Figure), the excessive reducing potential (ie, NADH) that results from ethanol metabolism shunts pyruvate away from the gluconeogenic pathway (toward lactate), inhibiting glucose production. Unlike adults, children and infants, who have relatively low glycogen reserves, are at significant risk for hypoglycemia following ethanol exposure. This represents the largest contributor to morbidity and mortality of children with ethanol intoxication.3 Patients with hypoglycemia can have a highly variable clinical presentation including agitation, seizures, focality, or coma.4
Case Continuation
Intravenous (IV) access was obtained, and the patient was placed on a dextrose-containing fluid at 1.5 times the maintenance flow rate. Pertinent laboratory studies revealed a serum glucose level of 90 mg/dL, normal electrolyte panel, and an initial blood alcohol concentration of 337 mg/dL (approximately 30 minutes postingestion).
How do children with ethanol intoxication present?
While there is some variation in clinical effects among nontolerant adults, acute ethanol intoxication with a serum concentration >250 mg/dL is frequently associated with stupor, respiratory depression, and hypotension. A concentration >400 mg/dL may be associated with coma or apnea. Although similar clinical effects are expected in adolescents and children, infants often have counterintuitive clinical findings.
To date, eight cases of significant infant ethanol exposure exist in the literature (age range, 29 days to 9 months; ethanol concentration, 183-524 mg/dL). Respiratory depression was absent in all cases.5-9 In all but two cases, the neurological examination revealed only subtle decreases in interaction or tone. The remaining two children were described as obtunded and flaccid (ethanol levels, 405 mg/dL and 524 mg/dL, respectively) and were intubated for airway protection despite normal respiratory rates.7,10
The incongruence between the clinical findings (both the neurological examination and respiratory effects) and the ethanol concentration is difficult to explain. It may be due to age-related neurological immaturity or a limited ability to perform the required detailed neurological examinations in children. In particular, the relatively preserved level of consciousness, despite an otherwise coma-inducing ethanol concentration, is unique to infants. Accordingly, there should be a low threshold to check ethanol concentrations in infants presenting with apparent life-threatening events, altered mental status, decreased tone, or unexplained hypoglycemia or hypothermia.
What is the estimated time to sobriety in infants?
Ethanol is eliminated via a hepatic enzymatic oxidation pathway that becomes saturated at low serum levels. In nontolerant adults, this results in a zero-order kinetic elimination pattern with an ethanol elimination rate of approximately 20 mg/dL per hour. Anecdotally, it had been thought that children clear ethanol at roughly double this rate via unclear mechanisms. However, a review of published kinetic data suggests the actual rate of clearance may not differ substantially from adults (range, 19-34 mg/dL per hour).5-7,10,11
Case Conclusion
The patient was transferred to a tertiary care pediatric hospital for continued management, where the markedly elevated serum ethanol concentration was confirmed. She was maintained on a dextrose-containing IV fluid and observed overnight without development of any complications. Serial serum ethanol concentrations were performed and complete clearance was achieved approximately 20 hours postingestion, suggesting a metabolic rate of 16 mg/dL per hour. The infant was discharged home with supervision by child protective services.
Dr Boroughf is a toxicology fellow, department of emergency medicine, Albert Einstein Medical Center, Philadelphia, Pennsylvania. Dr Nelson, editor of “Case Studies in Toxicology,” is a professor in the department of emergency medicine and director of the medical toxicology fellowship program at the New York University School of Medicine and the New York City Poison Control Center. He is also associate editor, toxicology, of the EMERGENCY MEDICINE editorial board. Dr Henretig is an attending toxicologist, department of emergency medicine, Children’s Hospital of Philadelphia, Pennsylvania.
References
Mowry JB, Spyker DA, Cantilena LR Jr, Bailey JE, Ford M. 2012 Annual Report of the American Association of Poison Control Centers’ National Poison Data System (NPDS): 30th Annual Report. Clin Toxicol (Phila). 2013;51(10):949-1229.
Wood JN, Pecker LH, Russo ME, Henretig F, Christian CW. Evaluation and referral for child maltreatment in pediatric poisoning victims. Child Abuse Negl. 2012;36(4):362-369.
Lamminpää A. Alcohol intoxication in childhood and adolescence. Alcohol Alcohol. 1995;30(1):5-12.
Malouf R, Brust JC. Hypoglycemia: causes, neurological manifestations, and outcome. Ann Neurol.1985;17(5):421-430.
Chikava K, Lower DR, Frangiskakis SH, Sepulveda JL, Virji MA, Rao KN. Acute ethanol intoxication in a 7-month old-infant. Pediatr Dev Pathol. 2004;7(4):400-402.
Ford JB, Wayment MT, Albertson TE, Owen KP, Radke JB, Sutter ME. Elimination kinetics of ethanol in a 5-week-old infant and a literature review of infant ethanol pharmacokinetics. Case Rep Med. 2013;2013:250716. doi:10.1155/2013/250716
McCormick T, Levine M, Knox O, Claudius I. Ethanol ingestion in two infants under 2 months old: a previously unreported cause of ALTE. Pediatrics. 2013;131(2);e604-e607.
Fong HF, Muller AA. An unexpected clinical course in a 29-day-old infant with ethanol exposure. Pediatr Emerg Care. 2014;30(2):111-113.
Iyer SS, Haupt A, Henretig FM. Pick your poison: straight from the spring? Ped Emerg Care. 2009;25(3):194-196.
Edmunds SM, Ajizian SJ, Liguori A. Acute obtundation in a 9-month-old patient: ethanol ingestion. Pediatr Emerg Care. 2014;30(10):739-741.
Simon HK, Cox JM, Sucov A, Linakis JG. Serum ethanol clearance in intoxicated children and adolescents presenting to the ED. Acad Emerg Med. 1994;1(6):520-524.
A 4-month-old infant was brought to the ED by her father after a reported unintentional ethanol exposure.
A 4-month-old infant was brought to the ED by her father after a reported unintentional ethanol exposure.
Case
A previously healthy 4-month-old girl was brought into the ED for concerns of alcohol ingestion. Reportedly, the infant’s father reconstituted 4 ounces of powdered formula using what he thought was water from an unmarked bottle in his refrigerator. He later realized that the bottle contained rum, although he still let the child finish the 4 ounces of formula in the hopes that she would vomit—which did not occur.
Upon arrival to the ED, the infant’s vital signs were: blood pressure, 100/61 mm Hg; heart rate, 155 beats/minute; respiratory rate, 36 breaths/minute; and temperature, normal. Oxygen saturation was 98% on room air. A rapid bedside blood glucose test was 89 mg/dL. The infant’s physical examination was unremarkable. She appeared active but hungry, had a strong cry, and had a developmentally appropriate gross neurological examination.
How does ethanol exposure in children typically occur?
Recent reports from the American Association of Poison Control Centers’ National Poison Data System demonstrate that ethanol exposures comprise 1% to 3% of total exposures in children aged ≤5 years.
The most common sources are ethanol-containing beverages, mouthwash, and cologne/perfume.1 Ethanol can also be found as a solvent for certain pediatric liquid medications (eg, ranitidine) or in flavor extracts (eg, vanilla extract, orange extract). Any clear alcohol (eg, vodka, gin, rum) stored in an accessible site, such as a refrigerator, may be mistaken for water. In many reports, a caregiver unintentionally used the alcohol to reconstitute formula; however, intentional provision of alcohol to toddlers, usually as a sedative, is a recurring concern.2
What are the clinical concerns in children with ethanol intoxication?
An understanding of the pathways of ethanol metabolism frames the key issues surrounding ethanol exposure in small children. Ethanol is metabolized in the liver primarily through sequential oxidation by alcohol-dehydrogenase (ADH) and aldehyde-dehydrogenase (ALDH), which reduce nicotinamide adenine dinucleotide (NAD+) to NAD plus hydrogen (NADH) in each step. The final product of this pathway, acetate, is then converted to acetyl coenzyme A (acetyl-CoA), which enters into the Krebs cycle for thiamine-dependent metabolism to carbon dioxide and water (Figure). With substantial exposures to ethanol, the accumulation of NADH creates an imbalance in the body’s reducing potential, resulting in metabolic disturbances such as alcoholic ketoacidosis.
Under usual conditions, a normal serum glucose concentration is maintained from ingested carbohydrates and via glycogenolysis of hepatic glycogen stores. Such glycogen reserves can sustain normal blood glucose concentrations for several hours in adults but for a shorter period in children. Once glycogen is depleted, as is common after an overnight fast, glucose can be generated through gluconeogenesis.
However, in the presence of ethanol (Figure), the excessive reducing potential (ie, NADH) that results from ethanol metabolism shunts pyruvate away from the gluconeogenic pathway (toward lactate), inhibiting glucose production. Unlike adults, children and infants, who have relatively low glycogen reserves, are at significant risk for hypoglycemia following ethanol exposure. This represents the largest contributor to morbidity and mortality of children with ethanol intoxication.3 Patients with hypoglycemia can have a highly variable clinical presentation including agitation, seizures, focality, or coma.4
Case Continuation
Intravenous (IV) access was obtained, and the patient was placed on a dextrose-containing fluid at 1.5 times the maintenance flow rate. Pertinent laboratory studies revealed a serum glucose level of 90 mg/dL, normal electrolyte panel, and an initial blood alcohol concentration of 337 mg/dL (approximately 30 minutes postingestion).
How do children with ethanol intoxication present?
While there is some variation in clinical effects among nontolerant adults, acute ethanol intoxication with a serum concentration >250 mg/dL is frequently associated with stupor, respiratory depression, and hypotension. A concentration >400 mg/dL may be associated with coma or apnea. Although similar clinical effects are expected in adolescents and children, infants often have counterintuitive clinical findings.
To date, eight cases of significant infant ethanol exposure exist in the literature (age range, 29 days to 9 months; ethanol concentration, 183-524 mg/dL). Respiratory depression was absent in all cases.5-9 In all but two cases, the neurological examination revealed only subtle decreases in interaction or tone. The remaining two children were described as obtunded and flaccid (ethanol levels, 405 mg/dL and 524 mg/dL, respectively) and were intubated for airway protection despite normal respiratory rates.7,10
The incongruence between the clinical findings (both the neurological examination and respiratory effects) and the ethanol concentration is difficult to explain. It may be due to age-related neurological immaturity or a limited ability to perform the required detailed neurological examinations in children. In particular, the relatively preserved level of consciousness, despite an otherwise coma-inducing ethanol concentration, is unique to infants. Accordingly, there should be a low threshold to check ethanol concentrations in infants presenting with apparent life-threatening events, altered mental status, decreased tone, or unexplained hypoglycemia or hypothermia.
What is the estimated time to sobriety in infants?
Ethanol is eliminated via a hepatic enzymatic oxidation pathway that becomes saturated at low serum levels. In nontolerant adults, this results in a zero-order kinetic elimination pattern with an ethanol elimination rate of approximately 20 mg/dL per hour. Anecdotally, it had been thought that children clear ethanol at roughly double this rate via unclear mechanisms. However, a review of published kinetic data suggests the actual rate of clearance may not differ substantially from adults (range, 19-34 mg/dL per hour).5-7,10,11
Case Conclusion
The patient was transferred to a tertiary care pediatric hospital for continued management, where the markedly elevated serum ethanol concentration was confirmed. She was maintained on a dextrose-containing IV fluid and observed overnight without development of any complications. Serial serum ethanol concentrations were performed and complete clearance was achieved approximately 20 hours postingestion, suggesting a metabolic rate of 16 mg/dL per hour. The infant was discharged home with supervision by child protective services.
Dr Boroughf is a toxicology fellow, department of emergency medicine, Albert Einstein Medical Center, Philadelphia, Pennsylvania. Dr Nelson, editor of “Case Studies in Toxicology,” is a professor in the department of emergency medicine and director of the medical toxicology fellowship program at the New York University School of Medicine and the New York City Poison Control Center. He is also associate editor, toxicology, of the EMERGENCY MEDICINE editorial board. Dr Henretig is an attending toxicologist, department of emergency medicine, Children’s Hospital of Philadelphia, Pennsylvania.
References
Mowry JB, Spyker DA, Cantilena LR Jr, Bailey JE, Ford M. 2012 Annual Report of the American Association of Poison Control Centers’ National Poison Data System (NPDS): 30th Annual Report. Clin Toxicol (Phila). 2013;51(10):949-1229.
Wood JN, Pecker LH, Russo ME, Henretig F, Christian CW. Evaluation and referral for child maltreatment in pediatric poisoning victims. Child Abuse Negl. 2012;36(4):362-369.
Lamminpää A. Alcohol intoxication in childhood and adolescence. Alcohol Alcohol. 1995;30(1):5-12.
Malouf R, Brust JC. Hypoglycemia: causes, neurological manifestations, and outcome. Ann Neurol.1985;17(5):421-430.
Chikava K, Lower DR, Frangiskakis SH, Sepulveda JL, Virji MA, Rao KN. Acute ethanol intoxication in a 7-month old-infant. Pediatr Dev Pathol. 2004;7(4):400-402.
Ford JB, Wayment MT, Albertson TE, Owen KP, Radke JB, Sutter ME. Elimination kinetics of ethanol in a 5-week-old infant and a literature review of infant ethanol pharmacokinetics. Case Rep Med. 2013;2013:250716. doi:10.1155/2013/250716
McCormick T, Levine M, Knox O, Claudius I. Ethanol ingestion in two infants under 2 months old: a previously unreported cause of ALTE. Pediatrics. 2013;131(2);e604-e607.
Fong HF, Muller AA. An unexpected clinical course in a 29-day-old infant with ethanol exposure. Pediatr Emerg Care. 2014;30(2):111-113.
Iyer SS, Haupt A, Henretig FM. Pick your poison: straight from the spring? Ped Emerg Care. 2009;25(3):194-196.
Edmunds SM, Ajizian SJ, Liguori A. Acute obtundation in a 9-month-old patient: ethanol ingestion. Pediatr Emerg Care. 2014;30(10):739-741.
Simon HK, Cox JM, Sucov A, Linakis JG. Serum ethanol clearance in intoxicated children and adolescents presenting to the ED. Acad Emerg Med. 1994;1(6):520-524.
Figure 1.
When the ST segment is elevated on the electrocardiogram, our first concern is whether the patient is having an ST-segment elevation myocardial infarction (STEMI). However, a number of other conditions can cause ST elevation, and to complicate matters, some of these can coexist with STEMI.
Nevertheless, careful attention to the ST-T and QRS-complex configurations often allows diagnosis of the cause of ST elevation (Figure 1, Table 1). This paper discusses the differential diagnosis of ST elevation.
MEASURED AT THE J POINT OR LATER
ST-segment deviation is usually measured at its junction with the end of the QRS complex, ie, the J point, and is referenced against the TP or PR segment.1 Some authors prefer measuring the magnitude of the ST deviation 40 to 80 msec after the J point, when all myocardial fibers are expected to have reached the same level of membrane potential and to form an isoelectric ST segment.2,3
ST-SEGMENT ELEVATION MYOCARDIAL INFARCTION
A diagnosis of STEMI that mandates emergency reperfusion requires ST elevation equaling or exceeding the following cut-points, in at least two contiguous leads (using the standardization of 1.0 mV = 10 mm)4,5:
1 mm in all standard leads other than V2 and V3
2.5 mm in leads V2 and V3 in men younger than age 40, 2 mm in leads V2 and V3 in men age 40 and older, and 1.5 mm in these leads in women
0.5 mm in the posterior chest leads V7 to V9; ST elevation is attenuated in the posterior leads because of their greater distance from the heart, explaining the lower cut-point.6
While ST elevation that falls below these cut-points may be a normal variant, any ST elevation or depression (≥ 0.5 mm) may be abnormal and may necessitate further evaluation for ischemia, particularly when the clinical setting or the ST morphology suggests ischemia or when other signs of ischemia such as T-wave abnormalities, Q waves, or reciprocal ST-segment changes are also present on the electrocardiogram.
Conversely, ST elevation that exceeds these cut-points may not represent STEMI. In an analysis of patients with chest pain manifesting ST elevation, only 15% were eventually diagnosed with STEMI.7 In addition to size, careful attention to the morphology of the ST segment and the associated features is critical (Figure 1).
Other features of STEMI
Figure 2. Diffuse ST-segment elevation with ST-segment depression in lead aVR. This initially suggests pericarditis. PR depression in leads II, aVF, V5, and V6 further suggests pericarditis. But the presence of features of pericarditis does not necessarily rule out STEMI. The five STEMI features must be ruled out. In this case, the ST-segment morphology and the abnormally wide T wave are features of STEMI. The ST elevation has an upwardly convex shape with a wide and high T wave fused with the ST segment, typical of STEMI (leads V2–V4, arrows). Also, the size of the ST elevation (ie, > 5 mm in V2–V4 and larger than the QRS complex in V4, a feature called “tombstoning”) is more consistent with STEMI than with pericarditis. In this patient, the left anterior descending artery was found to be occluded on coronary arteriography.
In STEMI, the ST elevation is typically a convex or a straight oblique line, blending with a wide T wave to form a dome.8 But ST elevation may be concave in up to 40% of anterior STEMIs, especially in the early stage.3,9,10 The nonconcave morphology is highly specific but not sensitive for the diagnosis of anterior STEMI.3,8,9
Four other features characteristic of STEMI may be present (Figures 2 and 3):
Concomitant T-wave abnormalities (wide, ample, or inverted T waves)
Q waves
ST depression in the reciprocal leads. Reciprocal ST depression is seen in all inferior STEMIs and in 70% of anterior STEMIs.11,12 Diffuse ST elevation mimicking pericarditis may be seen with midvessel occlusion of a left anterior descending artery that wraps around the apex and supplies part of the inferior wall.
Figure 3. In a patient with lung cancer, sinus tachycardia is seen with diffuse ST-segment elevation, along with ST-segment depression in aVR. The QRS voltage is low, particularly when compared with the electrocardio-gram recorded a few days earlier (left lower panel). PR depression is seen in lead II. The combination of these findings may suggest pericarditis with a pericardial effusion. However, the ST-T morphology in lead V2, where the ST and T are blended to form one dome, is characteristic of STEMI (top arrow). Moreover, the ST elevation and T wave in leads V2–V4 are larger than the QRS, the QRS voltage is “shrinking” (arrowhead), and the R wave is pulled up by the ST segment (star); this is called “tombstoning.” All these features are characteristic of STEMI, wherein the R wave and the QRS complex shrink before forming a deep Q wave. In fact, an electrocardiogram recorded 1 hour later (right lower panel) shows a fully developed Q wave in lead V2 (bottom arrow).
ST or T-wave amplitude may approximate or exceed the QRS amplitude in at least one lead.3,13,14 This finding is characteristic of STEMI, in which the QRS “shrinks” as the infarcted area becomes electrically neutral, whereas the ST-T segments become ample.3,13 In fact, early STEMI may be characterized by a small R wave that seems to be “pulled up” by the elevated ST segment. A small or absent R wave along with an ample, convex ST segment that fuses with the T wave and exceeds the height of the remaining R wave is called “tombstoning” (Figure 3). Tombstoning is most commonly seen with anterior infarction and implies more extensive myocardial damage and a worse prognosis than STEMI without tombstoning.15
Note that ST elevation may not be acute STEMI but an old STEMI with a chronically dysfunctional myocardium (dyskinetic or aneurysmal myocardium). In fact, an old STEMI may manifest as a chronic, persistent ST elevation along with Q waves, and T waves may be inverted or upright, but not ample.14 A history of an old MI, old electrocardiograms, if available, and quick bedside echocardiography may allow the diagnosis. In the case of an old dyskinetic infarct, echocardiography shows a thin, bright (scarred), and possibly aneurysmal myocardium, whereas in acute STEMI, the myocardium is neither thin nor scarred yet. If the patient does not report a history of MI, if the T wave is ample (> 75% the size of QRS), or if the patient presents with atypical ongoing angina, presume it is acute STEMI.
EARLY REPOLARIZATION
Early repolarization is a normal variant of ST elevation that equals or exceeds 1 mm (measured at the J point). It is highly prevalent in people under age 40 and remains prevalent in middle-aged people.
Two distinct and sometimes coexistent forms of early repolarization have been described: (1) ST elevation in the anterior leads V1 to V3,16–19 and (2) ST elevation in the lateral leads (V4 to V6, I, aVL) or inferior leads.18–22 The prevalence of the first form—ie, ST elevation of 1 mm or more in any of the leads V1 through V3—is 60% to 90% in men age 45 and younger, 20% to 40% in men over age 45, and about 10% in women of any age.16 Thus, this form of early repolarization is called “normal male pattern.”
Even early repolarization that involves the lateral or inferior leads is common, with a prevalence of about 15% in people ages 30 to 40 and about 5% to 10% in those 40 to 65.20–23 It is two to four times more prevalent in men and three times more prevalent in African Americans. It is also highly prevalent in athletes younger than 25 (about 30% to 40%).22
Figure 4. Early repolarization with ST-segment elevation is seen in the inferior leads and in the anterolateral leads V2 to V6. ST elevation is most prominent in lead V4 and lead II, with a concavely upward ST morphology and a notch at the J point (arrows and left magnified image). In half of early repolarization cases, the J point is smooth but well demarcated (right magnified image). Note the slight PR depression in leads II and V5. Slight PR depression may be seen in normal individuals and corresponds to the normal atrial repolarization.
Either way, early repolarization closely resembles the ST elevation of pericarditis and has the following features (Figure 4):
The ST segment is concave upward, and the J point is well demarcated and may be notched or slurred (Figure 1).
ST elevation is usually no more than 3 mm.
ST elevation may be limited to the anterior leads or, in many instances, may extend to the inferior or lateral leads. Early repolarization is very rarely limited to the limb leads, and involvement of some precordial leads is the rule.18,19 The ST segment is depressed in lead aVR in 50% of patients.18,19
Figure 5. Early repolarization with a normal variant T-wave inversion in a 33-year-old black man. The ST segment is elevated with a notched J point in leads V2 to V5
The T wave is usually ample and may be more than 10 mm tallin the precordial leads in one-third of patients,17 but as opposed to the ample T wave of STEMI, it is not broad and remains smaller than the QRS complex. The ample T wave distinguishes early repolarization from pericarditis, and explains the low ST-T ratio in lead V6. In up to 10% of young black men, the T wave has a terminal inversion in leads V3 to V5, and occasionally in V1 and V2, mimicking infarction(Figure 5).24
The QRS complex tends to have prominent precordial voltage, in sharp contrast to STEMI, in which QRS shrinking occurs.3,17,22
The early repolarization pattern may be intermittent, may vary among serial electrocardiograms, may decrease with a rise in sympathetic tone, as observed during exercise, and may increase with a rise in vagal tone.18,19,25,26 Although it is usually a benign finding, the early repolarization pattern in leads other than V1 to V3 has been associated with an increased risk of sudden death, particularly when the ST elevation is horizontal-descending rather than upsloping and, possibly, when early repolarization involves the inferior leads with a J point that is notched or elevated 2 mm or more.20,22
PERICARDITIS
Figure 6. Diffuse ST-segment elevation in most leads, with ST depression in lead aVR and an isoelectric ST segment in V1. None of the STEMI features are present: ST elevation is concave upward, no reciprocal ST depression is seen except in lead aVR; the T wave is not wide, inverted, or ample (in relation to the QRS complex); and no Q wave is seen. Furthermore, ST elevation does not exceed 5 mm; ST and T heights are smaller than QRS height; and PR depression is present (circled areas). As opposed to early repolarization, the ratio of ST to T in leads V5 and V6 exceeds 25%. This is consistent with pericarditis, and the hospital course of this patient confirmed this diagnosis.
In pericarditis, ST elevation is concave upward and is widespread to more than one region without reciprocal ST depression, except for the frequent ST depression in leads aVR and V1 (64%)27; ST elevation is seldom greater than 4 to 5 mm (Figure 6).27,28 Since the subepicardial injury is diffuse in pericarditis, the axis of the ST segment follows the anatomic axis of the heart and is generally +45° in the frontal plane. Thus, ST depression is seen in leads aVR and V1; ST elevation is highest in leads II, V5, and V6 and is less in leads III and aVL, where the ST segment may occasionally be depressed.29
Transient PR depression greater than 1 mm is often seen, particularly in leads II, aVF, and V4 to V6, and represents atrial subepicardial injury. PR depression in those leads is always associated with PR elevation in lead aVR and sometimes V1. PR changes often coexist with ST changes but may be isolated and may precede ST changes.30 PR depression is characteristic of pericarditis but may be seen in early repolarization, where it is less marked than in pericarditis (< 0.8 mm) and implies early repolarization of the atrial tissue,31 and in MI, where it implies atrial infarction with atrial injury pattern.
Classically, it is said that in pericarditis, unlike in STEMI, the T wave does not invert until the ST elevation subsides. In reality, up to 40% of patients develop a notched or biphasic positive-negative T wave before full return of the ST segment to the baseline.27,32 And if T-wave inversion antedates pericarditis, concomitant ST elevation and T-wave inversion may be seen once pericarditis develops. However, the T wave inverts less deeply and less completely than in STEMI, and the corrected QT interval remains normal even when the T wave inverts.
Three criteria distinguish pericarditis from early repolarization (but not from STEMI):
PR depression greater than 1 mm
ST-segment depression in lead V1
A ratio of ST-segment height to T-wave height of at least 25% in lead V6, V5, V4, or I. This feature distinguishes pericarditis from early repolarization with a high sensitivity and specificity. In pericarditis, the T waves have normal or reduced amplitude, and the ST-T ratio is therefore high,33 whereas in early repolarization the T waves are tall, so the ST-T ratio is less than 25%.
Widespread ST elevation may be seen with both pericarditis and early repolarization. ST elevation limited to the anterior leads is more likely to be early repolarization than pericarditis.
LEFT BUNDLE BRANCH BLOCK
Figure 7. Supraventricular tachycardia with a typical left bundle branch block pattern in leads I and aVL. Concordant ST-segment elevation is seen in leads I and aVL, while concordant ST depression is seen in the inferior leads (arrows). The ST elevation in lead V2 is discordant but is disproportionately high in relation to the QRS (well above 25% of the QRS height). All these features are diagnostic of STEMI.
In left bundle branch block, a deep and wide S wave is seen in leads V1 to V3 and sometimes in the inferior leads, with ST elevation and T waves that are discordant with the QRS complex—ie, directed opposite to the QRS (Figures 7–9). The ST elevation is typically concave upward.8,34 Occasionally, ST elevation may be straight or convex, mimicking the dome of STEMI. In the lateral leads, the discordant ST segment is depressed, mimicking a reciprocal ST change.
The following findings imply MI:
Figure 8. Left bundle branch block with discordant ST-segment changes. However, the T wave is wide and fused with the ST segment in a domed morphology, and the T wave is larger than the QRS in leads V4, V5, and II (arrows). This implies the diagnosis of STEMI with hyperacute T waves. This patient had an occluded left anterior descending coronary artery.
ST elevation or depression that is concordant with the QRS complex. Moreover, since ST deviation is mandatory with left bundle branch block, a “normal-looking” ST segment implies ischemia.
Inverted T waves concordant with the QRS in more than one lead, or biphasic T waves in more than one lead (eg, V1 to V3). Across the precordial leads, T waves may transition from positive to negative one lead earlier or later than the QRS and ST transition. Therefore, even in the absence of ischemia, the T wave may be inverted in lead V3, in which the QRS is deeply negative and the ST is still elevated (negative T-wave concordance in one lead). Also, the T wave may be upright in leads V5, V6, and I where QRS is upright and the ST segment is depressed (positive T-wave concordance does not imply ischemia).
Figure 9. Left bundle branch block with abnormal T waves. Panels A and B show discordant ST-segment elevation in V1 to V3 but concordant T wave inversion (A) or biphasic T wave (B). This is consistent with an anterior injury pattern. Panel C shows concordant T-wave inversion in the inferior leads, consistent with inferior injury. Panel D shows a large concordant T wave in lead V6, larger than the QRS, consistent with injury.
In addition to concordance, a discordant ST segment or T wave that is very large may imply ischemia. For example, a discordant ST segment or T wave that is larger than the QRS height implies ischemia. A discordant ST elevation greater than 5 mm has been suggested by Sgarbossa et al35 as a diagnostic feature of STEMI; however, this feature is seen in 10% of control patients with left bundle branch block and no STEMI, and it is thus poorly specific and also poorly sensitive, frequently missing STEMI.35–37 Smith et al36 have suggested that a discordant ST elevation of at least 25% of the S-wave depth is a far more sensitive and accurate feature but one that may still be found in up to 10% of control patients.36
LEFT VENTRICULAR HYPERTROPHY
In left ventricular hypertrophy, a deep S wave is seen in leads V1 to V3, with ST elevation and T waves that are discordant with the QRS complex. Rarely, ST elevation may be straight or convex. The following findings imply MI:
ST elevation or depression that is concordant with the QRS.
Inverted T waves that are concordant with the QRS in more than one lead, or biphasic T waves in more than one lead (eg, V1 to V3).
A discordant ST segment or a T wave that is very large may imply ischemia. In left ventricular hypertrophy, ST elevation is usually less than 2.5 mm in leads V1 to V3 and is rarely seen in the inferior leads, where it would be less than 1 mm.34 When ST elevation is seen in leads V1 to V3 in left ventricular hypertrophy, an ST magnitude of 25% or more of the total QRS voltage has a 91% specificity for STEMI.34
On another note, right ventricular hypertrophy and right bundle branch block may lead to ST-segment depression and T-wave inversion, but not to ST elevation. Thus, ST elevation occurring with right ventricular hypertrophy or right bundle branch block implies STEMI. While only left bundle branch block poses a diagnostic challenge, both types of bundle branch block, if secondary to STEMI, represent equally high-risk categories.38
PREEXCITATION
Figure 10. At first glance, it seems there is ST-segment elevation in the inferior leads II, III, and aVF, with a wide Q wave. Moreover, there is a wide and tall R wave in lead V1 suggesting an associated posterior infarction. All this is consistent with acute inferoposterior STEMI. On further analysis, however, a slur is seen on the upslope of QRS in leads V1 to V6 (arrows), and the P wave is “riding” this slur. In the inferior leads, the P wave is riding the Q wave, which is in fact a negative delta wave. Thus, this electrocardiogram represents preexcitation. The ST deviations are secondary to the preexcitation and have an orientation opposite to the delta wave.
Preexcitation may be associated with negative delta waves that mimic Q waves, and with ST elevation in the leads where the negative delta waves are seen, ie, ST elevation discordant with the delta wave (Figure 10). The QRS morphology and the delta wave allow preexcitation to be distinguished from STEMI.
HYPERKALEMIA
Figure 11. There are ST-segment elevations in leads V1–V4, ST-segment depressions in the inferior leads, and peaked T waves in leads V3–V5. These T waves have a narrow base and seem to “pull” the ST segment, creating ST elevation in the anterior leads and ST depression in the inferior leads (arrows). This shape is consistent with hyperkalemia. In addition, the downsloping ST elevation seen in V1 and V2 is consistent with hyperkalemia (arrowhead). Occasionally, STEMI may have a similar ST-T shape. An rSR’ pattern is seen in V1–V2; this is consistent with STEMI but also with hyperkalemia, in which conduction blocks are common. The serum potassium level was 7.4 mmol/L (normal 3.5–5), and coronary angiography revealed normal coronary arteries.
The most common finding in hyperkalemia is a peaked, narrow-based T wave that is usually, but not necessarily, tall. ST elevation may be evident in leads V1 to V3 (Figure 11). In contrast with hyperkalemia, the T wave of STEMI is typically wide.
OTHER CAUSES OF ST-SEGMENT ELEVATION
Takotsubo cardiomyopathy
Takotsubo cardiomyopathy mimics all electrocardiographic features of anteroapical STEMI. ST elevation may extend to the inferior leads but cannot be isolated in the inferior leads.39 As in apical STEMI, reciprocal ST depression is uncommon. Within 24 to 48 hours, ST elevation evolves into deep anterior T-wave inversion and a prolonged QT interval. Transient Q waves may be seen.
Myocarditis
Myocarditis may have one of two electrocardiographic patterns: a pericarditis pattern, or a typical STEMI pattern with Q waves sometimes localized to one area.40
Atrial flutter waves
Figure 12. Atrial flutter that simulates ST-segment elevation. An “F” indicates the negative flutter wave; an asterisk indicates the upslope of the flutter wave that is superimposed on the ST segment, mimicking ST elevation.
Atrial flutter waves, particularly of 2:1 atrial flutter, may deform the ST segment so that it mimics an injury pattern on the electrocardiogram. Flutter waves may mimic ST elevation or ST depression (Figure 12).
Large pulmonary embolism
A large pulmonary embolism may be associated with T-wave inversion in the anterior leads or the inferior leads, or both, reflective of cor pulmonale. Less commonly, ST elevation in the anterior or inferior leads is seen. In fact, changes of both anterior and inferior ischemia should always suggest a pulmonary embolism.41,42
Brugada syndrome
Figure 13. Type 1 Brugada pattern in V1 and V1, with a downsloping ST-segment elevation that creates a pseudo-R’ wave (pseudo-right bundle branch block). The QRS does not have a right bundle branch block morphology in leads V5 and V6.
Brugada syndrome is characterized by ST elevation and a right bundle branch block or pseudo-right bundle branch block pattern in at least two of the leads V1 to V3. In pseudo-right bundle branch block, the QRS adopts an rSR morphology in the anterior leads but is normal in the lateral leads. Type 1 Brugada pattern, the pattern that is most specifically associated with sudden death, is characterized by a coved, downsloping ST elevation of 2 mm or more with T-wave inversion (Figure 13).43 The Brugada pattern can be transient, triggered by fever, cocaine, or class I antiarrhythmic drugs.
Hyperkalemia, Brugada syndrome, and sometimes pulmonary embolism are characterized by an ST elevation that slopes downward (Figures 11 and 13), which contrasts with the upsloping, convex ST elevation of STEMI.
References
Rautaharju PM, Surawicz B, Gettes LS, et al; American Heart Association Electrocardiography and Arrhythmias Committee, Council on Clinical Cardiology; American College of Cardiology Foundation; Heart Rhythm Society. AHA/ACCF/HRS recommendations for the standardization and interpretation of the electrocardiogram: part IV: the ST-segment, T and U waves, and the QT interval: a scientific statement from the American Heart Association Electrocardiography and Arrhythmias Committee, Council on Clinical Cardiology; the American College of Cardiology Foundation; and the Heart Rhythm Society. Endorsed by the International Society for Computerized Electrocardiology. J Am Coll Cardiol 2009; 53:982–991.
Surawicz B, Knilans TK. Chou’s Electrocardiography in Clinical Practice: Adult and Pediatric. 5th ed. Philadelphia, PA: WB Saunders; 2001:194–207.
Smith SW, Khalil A, Henry TD, et al. Electrocardiographic differentiation of early repolarization from subtle anterior ST-segment elevation myocardial infarction. Ann Emerg Med 2012; 60:45–56.e2.
American College of Emergency Physicians; Society for Cardiovascular Angiography and Interventions; O’Gara PT, Kushner FG, Ascheim DD, et al. 2013 ACCF/AHA guideline for the management of ST-elevation myocardial infarction: a report of the American College of Cardiology Foundation/American Heart Association Task Force on Practice Guidelines. J Am Coll Cardiol 2013; 61:e78–e140.
Thygesen K, Alpert JS, Jaffe AS, et al; Joint ESC/ACCF/AHA/WHF Task Force for the Universal Definition of Myocardial Infarction. Third universal definition of myocardial infarction. Circulation 2012; 126:2020–2035.
Matetzky S, Freimark D, Chouraqui P, et al. Significance of ST segment elevations in posterior chest leads (V7 to V9) in patients with acute inferior myocardial infarction: application for thrombolytic therapy. J Am Coll Cardiol 1998; 31:506–511.
Brady WJ, Perron AD, Martin ML, Beagle C, Aufderheide TP. Cause of ST-segment abnormality in ED chest pain patients. Am J Emerg Med 2001; 19:25–28.
Brady WJ, Syverud SA, Beagle C, et al. Electrocardiographic ST-segment elevation: the diagnosis of acute myocardial infarction by morphologic analysis of the ST segment. Acad Emerg Med 2001; 8:961–967.
Smith SW. Upwardly concave ST-segment morphology is common in acute left anterior descending coronary occlusion. J Emerg Med 2006; 31:69–77.
Kosuge M, Kimura K, Ishikawa T, et al. Value of ST-segment elevation pattern in predicting infarct size and left ventricular function at discharge in patients with reperfused acute anterior myocardial infarction. Am Heart J 1999; 137:522–527.
Birnbaum Y, Sclarovsky S, Mager A, Strasberg B, Rechavia E. ST segment depression in a VL: a sensitive marker for acute inferior myocardial infarction. Eur Heart J 1993; 14:4–7.
Engelen DJ, Gorgels AP, Cheriex EC, et al. Value of the electrocardiogram in localizing the occlusion site in the left anterior descending coronary artery in acute anterior myocardial infarction. J Am Coll Cardiol 1999; 34:389–395.
Collins MS, Carter JE, Dougherty JM, Majercik SM, Hodsden JE, Logue EE. Hyperacute T-wave criteria using computer ECG analysis. Ann Emerg Med 1990; 19:114–120.
Smith SW. T/QRS ratio best distinguishes ventricular aneurysm from anterior myocardial infarction. Am J Emerg Med 2005; 23:279–287.
Surawicz B, Parikh SR. Prevalence of male and female patterns of early ventricular repolarization in the normal ECG of males and females from childhood to old age. J Am Coll Cardiol 2002; 40:1870–1876.
Klatsky AL, Oehm R, Cooper RA, Udaltsova N, Armstrong MA. The early repolarization normal variant electrocardiogram: correlates and consequences. Am J Med 2003; 115:171–177.
Mehta M, Jain AC, Mehta A. Early repolarization. Clin Cardiol 1999; 22:59–65.
Mehta MC, Jain AC. Early repolarization on scalar electrocardiogram. Am J Med Sci 1995; 309:305–311.
Rollin A, Maury P, Bongard V, et al. Prevalence, prognosis, and identification of the malignant form of early repolarization pattern in a population-based study. Am J Cardiol 2012; 110:1302–1308.
Tikkanen JT, Anttonen O, Junttila MJ, et al. Long-term outcome associated with early repolarization on electrocardiography. N Engl J Med 2009; 361:2529–2537.
Tikkanen JT, Junttila MJ, Anttonen O, et al. Early repolarization: electrocardiographic phenotypes associated with favorable long-term outcome. Circulation 2011; 123:2666–2673.
Noseworthy PA, Tikkanen JT, Porthan K, et al. The early repolarization pattern in the general population: clinical correlates and heritability. J Am Coll Cardiol 2011; 57:2284–2289.
Wasserburger RH. Observations on the juvenile pattern of adult negro males. Am J Med 1955; 18:428–437.
Kralios FA, Martin L, Burgess MJ, Millar K. Local ventricular repolarization changes due to sympathetic nerve-branch stimulation. Am J Physiol 1975; 228:1621–1626.
Spratt KA, Borans SM, Michelson EL. Early repolarization: normalization of the electrocardiogram with exercise as a clinically useful diagnostic feature. J Invasive Cardiol 1995; 7:238–242.
Surawicz B, Lasseter KC. Electrocardiogram in pericarditis. Am J Cardiol 1970; 26:471–474.
Hull E. The electrocardiogram in pericarditis. Am J Cardiol 1961; 7:21–32.
Spodick DH. Diagnostic electrocardiographic sequences in acute pericarditis. Significance of PR segment and PR vector changes. Circulation 1973; 48:575–580.
Spodick DH. Acute pericarditis: current concepts and practice. JAMA 2003; 289:1150–1153.
Charles MA, Bensinger TA, Glasser SP. Atrial injury current in pericarditis. Arch Intern Med 1973; 131:657–662.
Noth PH, Barnes HR. Electrocardiographic changes associated with pericarditis. Arch Intern Med 1940; 65:291–320.
Ginzton LE, Laks MM. The differential diagnosis of acute pericarditis from the normal variant: new electrocardiographic criteria. Circulation 1982; 65:1004–1009.
Armstrong EJ, Kulkarni AR, Bhave PD, et al. Electrocardiographic criteria for ST-elevation myocardial infarction in patients with left ventricular hypertrophy. Am J Cardiol 2012; 110:977–983.
Sgarbossa EB, Pinski SL, Barbagelata A, et al. Electrocardiographic diagnosis of evolving acute myocardial infarction in the presence of left bundle-branch block. GUSTO-1 (Global Utilization of Streptokinase and Tissue Plasminogen Activator for Occluded Coronary Arteries) Investigators. N Engl J Med 1996; 334:481–487.
Smith SW, Dodd KW, Henry TD, Dvorak DM, Pearce LA. Diagnosis of ST-elevation myocardial infarction in the presence of left bundle branch block with the ST-elevation to S-wave ratio in a modified Sgarbossa rule. Ann Emerg Med 2012; 60:766–776.
Madias JE, Sinha A, Agarwal H, Ashtiani R. ST-segment elevation in leads V1-V3 in patients with LBBB. J Electrocardiol 2001; 34:87–88.
Sgarbossa EB, Pinski SL, Topol EJ, et al. Acute myocardial infarction and complete bundle branch block at hospital admission: clinical characteristics and outcome in the thrombolytic era. GUSTO-I Investigators. Global Utilization of Streptokinase and t-PA [tissue-type plasminogen activator] for Occluded Coronary Arteries. J Am Coll Cardiol 1998; 31:105–110.
Bybee KA, Kara T, Prasad A, et al. Systematic review: transient left ventricular apical ballooning: a syndrome that mimics ST-segment elevation myocardial infarction. Ann Intern Med 2004; 141:858–865.
Magnani JW, Dec GW. Myocarditis: current trends in diagnosis and treatment. Circulation 2006; 113:876–890.
Sreeram N, Cheriex EC, Smeets JL, Gorgels AP, Wellens HJ. Value of the 12-lead electrocardiogram at hospital admission in the diagnosis of pulmonary embolism. Am J Cardiol 1994; 73:298–303.
Glancy DL, Mikdadi GM. Syncope in a 67-year-old man. Proc (Bayl Univ Med Cent) 2005; 18:74–75.
Wilde AA, Antzelevitch C, Borggrefe M, et al; Study Group on the Molecular Basis of Arrhythmias of the European Society of Cardiology. Proposed diagnostic criteria for the Brugada syndrome: consensus report. Circulation 2002; 106:2514–2519.
Elias B. Hanna, MD Assistant Professor of Medicine, Department of Medicine, Cardiovascular Section, Louisiana State University Health Sciences Center, New Orleans
David Luke Glancy, MD Emeritus Professor of Medicine, Department of Medicine, Cardiovascular Section, Louisiana State University Health Sciences Center, New Orleans
Address: Elias B. Hanna, MD, Department of Medicine, Cardiovascular Section, Louisiana State University Health Sciences Center, 1542 Tulane Avenue, 3rd Floor, Room 323, New Orleans, LA, 70112; e-mail: ehanna@lsuhsc.edu
ST, ST segment, ST segment elevation, ST elevation myocardial infarction, STEMI, early repolarization, pericarditis, left bundle branch block, hyperkalemia, Elias Hanna, David Glancy
Elias B. Hanna, MD Assistant Professor of Medicine, Department of Medicine, Cardiovascular Section, Louisiana State University Health Sciences Center, New Orleans
David Luke Glancy, MD Emeritus Professor of Medicine, Department of Medicine, Cardiovascular Section, Louisiana State University Health Sciences Center, New Orleans
Address: Elias B. Hanna, MD, Department of Medicine, Cardiovascular Section, Louisiana State University Health Sciences Center, 1542 Tulane Avenue, 3rd Floor, Room 323, New Orleans, LA, 70112; e-mail: ehanna@lsuhsc.edu
Author and Disclosure Information
Elias B. Hanna, MD Assistant Professor of Medicine, Department of Medicine, Cardiovascular Section, Louisiana State University Health Sciences Center, New Orleans
David Luke Glancy, MD Emeritus Professor of Medicine, Department of Medicine, Cardiovascular Section, Louisiana State University Health Sciences Center, New Orleans
Address: Elias B. Hanna, MD, Department of Medicine, Cardiovascular Section, Louisiana State University Health Sciences Center, 1542 Tulane Avenue, 3rd Floor, Room 323, New Orleans, LA, 70112; e-mail: ehanna@lsuhsc.edu
Figure 1.
When the ST segment is elevated on the electrocardiogram, our first concern is whether the patient is having an ST-segment elevation myocardial infarction (STEMI). However, a number of other conditions can cause ST elevation, and to complicate matters, some of these can coexist with STEMI.
Nevertheless, careful attention to the ST-T and QRS-complex configurations often allows diagnosis of the cause of ST elevation (Figure 1, Table 1). This paper discusses the differential diagnosis of ST elevation.
MEASURED AT THE J POINT OR LATER
ST-segment deviation is usually measured at its junction with the end of the QRS complex, ie, the J point, and is referenced against the TP or PR segment.1 Some authors prefer measuring the magnitude of the ST deviation 40 to 80 msec after the J point, when all myocardial fibers are expected to have reached the same level of membrane potential and to form an isoelectric ST segment.2,3
ST-SEGMENT ELEVATION MYOCARDIAL INFARCTION
A diagnosis of STEMI that mandates emergency reperfusion requires ST elevation equaling or exceeding the following cut-points, in at least two contiguous leads (using the standardization of 1.0 mV = 10 mm)4,5:
1 mm in all standard leads other than V2 and V3
2.5 mm in leads V2 and V3 in men younger than age 40, 2 mm in leads V2 and V3 in men age 40 and older, and 1.5 mm in these leads in women
0.5 mm in the posterior chest leads V7 to V9; ST elevation is attenuated in the posterior leads because of their greater distance from the heart, explaining the lower cut-point.6
While ST elevation that falls below these cut-points may be a normal variant, any ST elevation or depression (≥ 0.5 mm) may be abnormal and may necessitate further evaluation for ischemia, particularly when the clinical setting or the ST morphology suggests ischemia or when other signs of ischemia such as T-wave abnormalities, Q waves, or reciprocal ST-segment changes are also present on the electrocardiogram.
Conversely, ST elevation that exceeds these cut-points may not represent STEMI. In an analysis of patients with chest pain manifesting ST elevation, only 15% were eventually diagnosed with STEMI.7 In addition to size, careful attention to the morphology of the ST segment and the associated features is critical (Figure 1).
Other features of STEMI
Figure 2. Diffuse ST-segment elevation with ST-segment depression in lead aVR. This initially suggests pericarditis. PR depression in leads II, aVF, V5, and V6 further suggests pericarditis. But the presence of features of pericarditis does not necessarily rule out STEMI. The five STEMI features must be ruled out. In this case, the ST-segment morphology and the abnormally wide T wave are features of STEMI. The ST elevation has an upwardly convex shape with a wide and high T wave fused with the ST segment, typical of STEMI (leads V2–V4, arrows). Also, the size of the ST elevation (ie, > 5 mm in V2–V4 and larger than the QRS complex in V4, a feature called “tombstoning”) is more consistent with STEMI than with pericarditis. In this patient, the left anterior descending artery was found to be occluded on coronary arteriography.
In STEMI, the ST elevation is typically a convex or a straight oblique line, blending with a wide T wave to form a dome.8 But ST elevation may be concave in up to 40% of anterior STEMIs, especially in the early stage.3,9,10 The nonconcave morphology is highly specific but not sensitive for the diagnosis of anterior STEMI.3,8,9
Four other features characteristic of STEMI may be present (Figures 2 and 3):
Concomitant T-wave abnormalities (wide, ample, or inverted T waves)
Q waves
ST depression in the reciprocal leads. Reciprocal ST depression is seen in all inferior STEMIs and in 70% of anterior STEMIs.11,12 Diffuse ST elevation mimicking pericarditis may be seen with midvessel occlusion of a left anterior descending artery that wraps around the apex and supplies part of the inferior wall.
Figure 3. In a patient with lung cancer, sinus tachycardia is seen with diffuse ST-segment elevation, along with ST-segment depression in aVR. The QRS voltage is low, particularly when compared with the electrocardio-gram recorded a few days earlier (left lower panel). PR depression is seen in lead II. The combination of these findings may suggest pericarditis with a pericardial effusion. However, the ST-T morphology in lead V2, where the ST and T are blended to form one dome, is characteristic of STEMI (top arrow). Moreover, the ST elevation and T wave in leads V2–V4 are larger than the QRS, the QRS voltage is “shrinking” (arrowhead), and the R wave is pulled up by the ST segment (star); this is called “tombstoning.” All these features are characteristic of STEMI, wherein the R wave and the QRS complex shrink before forming a deep Q wave. In fact, an electrocardiogram recorded 1 hour later (right lower panel) shows a fully developed Q wave in lead V2 (bottom arrow).
ST or T-wave amplitude may approximate or exceed the QRS amplitude in at least one lead.3,13,14 This finding is characteristic of STEMI, in which the QRS “shrinks” as the infarcted area becomes electrically neutral, whereas the ST-T segments become ample.3,13 In fact, early STEMI may be characterized by a small R wave that seems to be “pulled up” by the elevated ST segment. A small or absent R wave along with an ample, convex ST segment that fuses with the T wave and exceeds the height of the remaining R wave is called “tombstoning” (Figure 3). Tombstoning is most commonly seen with anterior infarction and implies more extensive myocardial damage and a worse prognosis than STEMI without tombstoning.15
Note that ST elevation may not be acute STEMI but an old STEMI with a chronically dysfunctional myocardium (dyskinetic or aneurysmal myocardium). In fact, an old STEMI may manifest as a chronic, persistent ST elevation along with Q waves, and T waves may be inverted or upright, but not ample.14 A history of an old MI, old electrocardiograms, if available, and quick bedside echocardiography may allow the diagnosis. In the case of an old dyskinetic infarct, echocardiography shows a thin, bright (scarred), and possibly aneurysmal myocardium, whereas in acute STEMI, the myocardium is neither thin nor scarred yet. If the patient does not report a history of MI, if the T wave is ample (> 75% the size of QRS), or if the patient presents with atypical ongoing angina, presume it is acute STEMI.
EARLY REPOLARIZATION
Early repolarization is a normal variant of ST elevation that equals or exceeds 1 mm (measured at the J point). It is highly prevalent in people under age 40 and remains prevalent in middle-aged people.
Two distinct and sometimes coexistent forms of early repolarization have been described: (1) ST elevation in the anterior leads V1 to V3,16–19 and (2) ST elevation in the lateral leads (V4 to V6, I, aVL) or inferior leads.18–22 The prevalence of the first form—ie, ST elevation of 1 mm or more in any of the leads V1 through V3—is 60% to 90% in men age 45 and younger, 20% to 40% in men over age 45, and about 10% in women of any age.16 Thus, this form of early repolarization is called “normal male pattern.”
Even early repolarization that involves the lateral or inferior leads is common, with a prevalence of about 15% in people ages 30 to 40 and about 5% to 10% in those 40 to 65.20–23 It is two to four times more prevalent in men and three times more prevalent in African Americans. It is also highly prevalent in athletes younger than 25 (about 30% to 40%).22
Figure 4. Early repolarization with ST-segment elevation is seen in the inferior leads and in the anterolateral leads V2 to V6. ST elevation is most prominent in lead V4 and lead II, with a concavely upward ST morphology and a notch at the J point (arrows and left magnified image). In half of early repolarization cases, the J point is smooth but well demarcated (right magnified image). Note the slight PR depression in leads II and V5. Slight PR depression may be seen in normal individuals and corresponds to the normal atrial repolarization.
Either way, early repolarization closely resembles the ST elevation of pericarditis and has the following features (Figure 4):
The ST segment is concave upward, and the J point is well demarcated and may be notched or slurred (Figure 1).
ST elevation is usually no more than 3 mm.
ST elevation may be limited to the anterior leads or, in many instances, may extend to the inferior or lateral leads. Early repolarization is very rarely limited to the limb leads, and involvement of some precordial leads is the rule.18,19 The ST segment is depressed in lead aVR in 50% of patients.18,19
Figure 5. Early repolarization with a normal variant T-wave inversion in a 33-year-old black man. The ST segment is elevated with a notched J point in leads V2 to V5
The T wave is usually ample and may be more than 10 mm tallin the precordial leads in one-third of patients,17 but as opposed to the ample T wave of STEMI, it is not broad and remains smaller than the QRS complex. The ample T wave distinguishes early repolarization from pericarditis, and explains the low ST-T ratio in lead V6. In up to 10% of young black men, the T wave has a terminal inversion in leads V3 to V5, and occasionally in V1 and V2, mimicking infarction(Figure 5).24
The QRS complex tends to have prominent precordial voltage, in sharp contrast to STEMI, in which QRS shrinking occurs.3,17,22
The early repolarization pattern may be intermittent, may vary among serial electrocardiograms, may decrease with a rise in sympathetic tone, as observed during exercise, and may increase with a rise in vagal tone.18,19,25,26 Although it is usually a benign finding, the early repolarization pattern in leads other than V1 to V3 has been associated with an increased risk of sudden death, particularly when the ST elevation is horizontal-descending rather than upsloping and, possibly, when early repolarization involves the inferior leads with a J point that is notched or elevated 2 mm or more.20,22
PERICARDITIS
Figure 6. Diffuse ST-segment elevation in most leads, with ST depression in lead aVR and an isoelectric ST segment in V1. None of the STEMI features are present: ST elevation is concave upward, no reciprocal ST depression is seen except in lead aVR; the T wave is not wide, inverted, or ample (in relation to the QRS complex); and no Q wave is seen. Furthermore, ST elevation does not exceed 5 mm; ST and T heights are smaller than QRS height; and PR depression is present (circled areas). As opposed to early repolarization, the ratio of ST to T in leads V5 and V6 exceeds 25%. This is consistent with pericarditis, and the hospital course of this patient confirmed this diagnosis.
In pericarditis, ST elevation is concave upward and is widespread to more than one region without reciprocal ST depression, except for the frequent ST depression in leads aVR and V1 (64%)27; ST elevation is seldom greater than 4 to 5 mm (Figure 6).27,28 Since the subepicardial injury is diffuse in pericarditis, the axis of the ST segment follows the anatomic axis of the heart and is generally +45° in the frontal plane. Thus, ST depression is seen in leads aVR and V1; ST elevation is highest in leads II, V5, and V6 and is less in leads III and aVL, where the ST segment may occasionally be depressed.29
Transient PR depression greater than 1 mm is often seen, particularly in leads II, aVF, and V4 to V6, and represents atrial subepicardial injury. PR depression in those leads is always associated with PR elevation in lead aVR and sometimes V1. PR changes often coexist with ST changes but may be isolated and may precede ST changes.30 PR depression is characteristic of pericarditis but may be seen in early repolarization, where it is less marked than in pericarditis (< 0.8 mm) and implies early repolarization of the atrial tissue,31 and in MI, where it implies atrial infarction with atrial injury pattern.
Classically, it is said that in pericarditis, unlike in STEMI, the T wave does not invert until the ST elevation subsides. In reality, up to 40% of patients develop a notched or biphasic positive-negative T wave before full return of the ST segment to the baseline.27,32 And if T-wave inversion antedates pericarditis, concomitant ST elevation and T-wave inversion may be seen once pericarditis develops. However, the T wave inverts less deeply and less completely than in STEMI, and the corrected QT interval remains normal even when the T wave inverts.
Three criteria distinguish pericarditis from early repolarization (but not from STEMI):
PR depression greater than 1 mm
ST-segment depression in lead V1
A ratio of ST-segment height to T-wave height of at least 25% in lead V6, V5, V4, or I. This feature distinguishes pericarditis from early repolarization with a high sensitivity and specificity. In pericarditis, the T waves have normal or reduced amplitude, and the ST-T ratio is therefore high,33 whereas in early repolarization the T waves are tall, so the ST-T ratio is less than 25%.
Widespread ST elevation may be seen with both pericarditis and early repolarization. ST elevation limited to the anterior leads is more likely to be early repolarization than pericarditis.
LEFT BUNDLE BRANCH BLOCK
Figure 7. Supraventricular tachycardia with a typical left bundle branch block pattern in leads I and aVL. Concordant ST-segment elevation is seen in leads I and aVL, while concordant ST depression is seen in the inferior leads (arrows). The ST elevation in lead V2 is discordant but is disproportionately high in relation to the QRS (well above 25% of the QRS height). All these features are diagnostic of STEMI.
In left bundle branch block, a deep and wide S wave is seen in leads V1 to V3 and sometimes in the inferior leads, with ST elevation and T waves that are discordant with the QRS complex—ie, directed opposite to the QRS (Figures 7–9). The ST elevation is typically concave upward.8,34 Occasionally, ST elevation may be straight or convex, mimicking the dome of STEMI. In the lateral leads, the discordant ST segment is depressed, mimicking a reciprocal ST change.
The following findings imply MI:
Figure 8. Left bundle branch block with discordant ST-segment changes. However, the T wave is wide and fused with the ST segment in a domed morphology, and the T wave is larger than the QRS in leads V4, V5, and II (arrows). This implies the diagnosis of STEMI with hyperacute T waves. This patient had an occluded left anterior descending coronary artery.
ST elevation or depression that is concordant with the QRS complex. Moreover, since ST deviation is mandatory with left bundle branch block, a “normal-looking” ST segment implies ischemia.
Inverted T waves concordant with the QRS in more than one lead, or biphasic T waves in more than one lead (eg, V1 to V3). Across the precordial leads, T waves may transition from positive to negative one lead earlier or later than the QRS and ST transition. Therefore, even in the absence of ischemia, the T wave may be inverted in lead V3, in which the QRS is deeply negative and the ST is still elevated (negative T-wave concordance in one lead). Also, the T wave may be upright in leads V5, V6, and I where QRS is upright and the ST segment is depressed (positive T-wave concordance does not imply ischemia).
Figure 9. Left bundle branch block with abnormal T waves. Panels A and B show discordant ST-segment elevation in V1 to V3 but concordant T wave inversion (A) or biphasic T wave (B). This is consistent with an anterior injury pattern. Panel C shows concordant T-wave inversion in the inferior leads, consistent with inferior injury. Panel D shows a large concordant T wave in lead V6, larger than the QRS, consistent with injury.
In addition to concordance, a discordant ST segment or T wave that is very large may imply ischemia. For example, a discordant ST segment or T wave that is larger than the QRS height implies ischemia. A discordant ST elevation greater than 5 mm has been suggested by Sgarbossa et al35 as a diagnostic feature of STEMI; however, this feature is seen in 10% of control patients with left bundle branch block and no STEMI, and it is thus poorly specific and also poorly sensitive, frequently missing STEMI.35–37 Smith et al36 have suggested that a discordant ST elevation of at least 25% of the S-wave depth is a far more sensitive and accurate feature but one that may still be found in up to 10% of control patients.36
LEFT VENTRICULAR HYPERTROPHY
In left ventricular hypertrophy, a deep S wave is seen in leads V1 to V3, with ST elevation and T waves that are discordant with the QRS complex. Rarely, ST elevation may be straight or convex. The following findings imply MI:
ST elevation or depression that is concordant with the QRS.
Inverted T waves that are concordant with the QRS in more than one lead, or biphasic T waves in more than one lead (eg, V1 to V3).
A discordant ST segment or a T wave that is very large may imply ischemia. In left ventricular hypertrophy, ST elevation is usually less than 2.5 mm in leads V1 to V3 and is rarely seen in the inferior leads, where it would be less than 1 mm.34 When ST elevation is seen in leads V1 to V3 in left ventricular hypertrophy, an ST magnitude of 25% or more of the total QRS voltage has a 91% specificity for STEMI.34
On another note, right ventricular hypertrophy and right bundle branch block may lead to ST-segment depression and T-wave inversion, but not to ST elevation. Thus, ST elevation occurring with right ventricular hypertrophy or right bundle branch block implies STEMI. While only left bundle branch block poses a diagnostic challenge, both types of bundle branch block, if secondary to STEMI, represent equally high-risk categories.38
PREEXCITATION
Figure 10. At first glance, it seems there is ST-segment elevation in the inferior leads II, III, and aVF, with a wide Q wave. Moreover, there is a wide and tall R wave in lead V1 suggesting an associated posterior infarction. All this is consistent with acute inferoposterior STEMI. On further analysis, however, a slur is seen on the upslope of QRS in leads V1 to V6 (arrows), and the P wave is “riding” this slur. In the inferior leads, the P wave is riding the Q wave, which is in fact a negative delta wave. Thus, this electrocardiogram represents preexcitation. The ST deviations are secondary to the preexcitation and have an orientation opposite to the delta wave.
Preexcitation may be associated with negative delta waves that mimic Q waves, and with ST elevation in the leads where the negative delta waves are seen, ie, ST elevation discordant with the delta wave (Figure 10). The QRS morphology and the delta wave allow preexcitation to be distinguished from STEMI.
HYPERKALEMIA
Figure 11. There are ST-segment elevations in leads V1–V4, ST-segment depressions in the inferior leads, and peaked T waves in leads V3–V5. These T waves have a narrow base and seem to “pull” the ST segment, creating ST elevation in the anterior leads and ST depression in the inferior leads (arrows). This shape is consistent with hyperkalemia. In addition, the downsloping ST elevation seen in V1 and V2 is consistent with hyperkalemia (arrowhead). Occasionally, STEMI may have a similar ST-T shape. An rSR’ pattern is seen in V1–V2; this is consistent with STEMI but also with hyperkalemia, in which conduction blocks are common. The serum potassium level was 7.4 mmol/L (normal 3.5–5), and coronary angiography revealed normal coronary arteries.
The most common finding in hyperkalemia is a peaked, narrow-based T wave that is usually, but not necessarily, tall. ST elevation may be evident in leads V1 to V3 (Figure 11). In contrast with hyperkalemia, the T wave of STEMI is typically wide.
OTHER CAUSES OF ST-SEGMENT ELEVATION
Takotsubo cardiomyopathy
Takotsubo cardiomyopathy mimics all electrocardiographic features of anteroapical STEMI. ST elevation may extend to the inferior leads but cannot be isolated in the inferior leads.39 As in apical STEMI, reciprocal ST depression is uncommon. Within 24 to 48 hours, ST elevation evolves into deep anterior T-wave inversion and a prolonged QT interval. Transient Q waves may be seen.
Myocarditis
Myocarditis may have one of two electrocardiographic patterns: a pericarditis pattern, or a typical STEMI pattern with Q waves sometimes localized to one area.40
Atrial flutter waves
Figure 12. Atrial flutter that simulates ST-segment elevation. An “F” indicates the negative flutter wave; an asterisk indicates the upslope of the flutter wave that is superimposed on the ST segment, mimicking ST elevation.
Atrial flutter waves, particularly of 2:1 atrial flutter, may deform the ST segment so that it mimics an injury pattern on the electrocardiogram. Flutter waves may mimic ST elevation or ST depression (Figure 12).
Large pulmonary embolism
A large pulmonary embolism may be associated with T-wave inversion in the anterior leads or the inferior leads, or both, reflective of cor pulmonale. Less commonly, ST elevation in the anterior or inferior leads is seen. In fact, changes of both anterior and inferior ischemia should always suggest a pulmonary embolism.41,42
Brugada syndrome
Figure 13. Type 1 Brugada pattern in V1 and V1, with a downsloping ST-segment elevation that creates a pseudo-R’ wave (pseudo-right bundle branch block). The QRS does not have a right bundle branch block morphology in leads V5 and V6.
Brugada syndrome is characterized by ST elevation and a right bundle branch block or pseudo-right bundle branch block pattern in at least two of the leads V1 to V3. In pseudo-right bundle branch block, the QRS adopts an rSR morphology in the anterior leads but is normal in the lateral leads. Type 1 Brugada pattern, the pattern that is most specifically associated with sudden death, is characterized by a coved, downsloping ST elevation of 2 mm or more with T-wave inversion (Figure 13).43 The Brugada pattern can be transient, triggered by fever, cocaine, or class I antiarrhythmic drugs.
Hyperkalemia, Brugada syndrome, and sometimes pulmonary embolism are characterized by an ST elevation that slopes downward (Figures 11 and 13), which contrasts with the upsloping, convex ST elevation of STEMI.
References
Rautaharju PM, Surawicz B, Gettes LS, et al; American Heart Association Electrocardiography and Arrhythmias Committee, Council on Clinical Cardiology; American College of Cardiology Foundation; Heart Rhythm Society. AHA/ACCF/HRS recommendations for the standardization and interpretation of the electrocardiogram: part IV: the ST-segment, T and U waves, and the QT interval: a scientific statement from the American Heart Association Electrocardiography and Arrhythmias Committee, Council on Clinical Cardiology; the American College of Cardiology Foundation; and the Heart Rhythm Society. Endorsed by the International Society for Computerized Electrocardiology. J Am Coll Cardiol 2009; 53:982–991.
Surawicz B, Knilans TK. Chou’s Electrocardiography in Clinical Practice: Adult and Pediatric. 5th ed. Philadelphia, PA: WB Saunders; 2001:194–207.
Smith SW, Khalil A, Henry TD, et al. Electrocardiographic differentiation of early repolarization from subtle anterior ST-segment elevation myocardial infarction. Ann Emerg Med 2012; 60:45–56.e2.
American College of Emergency Physicians; Society for Cardiovascular Angiography and Interventions; O’Gara PT, Kushner FG, Ascheim DD, et al. 2013 ACCF/AHA guideline for the management of ST-elevation myocardial infarction: a report of the American College of Cardiology Foundation/American Heart Association Task Force on Practice Guidelines. J Am Coll Cardiol 2013; 61:e78–e140.
Thygesen K, Alpert JS, Jaffe AS, et al; Joint ESC/ACCF/AHA/WHF Task Force for the Universal Definition of Myocardial Infarction. Third universal definition of myocardial infarction. Circulation 2012; 126:2020–2035.
Matetzky S, Freimark D, Chouraqui P, et al. Significance of ST segment elevations in posterior chest leads (V7 to V9) in patients with acute inferior myocardial infarction: application for thrombolytic therapy. J Am Coll Cardiol 1998; 31:506–511.
Brady WJ, Perron AD, Martin ML, Beagle C, Aufderheide TP. Cause of ST-segment abnormality in ED chest pain patients. Am J Emerg Med 2001; 19:25–28.
Brady WJ, Syverud SA, Beagle C, et al. Electrocardiographic ST-segment elevation: the diagnosis of acute myocardial infarction by morphologic analysis of the ST segment. Acad Emerg Med 2001; 8:961–967.
Smith SW. Upwardly concave ST-segment morphology is common in acute left anterior descending coronary occlusion. J Emerg Med 2006; 31:69–77.
Kosuge M, Kimura K, Ishikawa T, et al. Value of ST-segment elevation pattern in predicting infarct size and left ventricular function at discharge in patients with reperfused acute anterior myocardial infarction. Am Heart J 1999; 137:522–527.
Birnbaum Y, Sclarovsky S, Mager A, Strasberg B, Rechavia E. ST segment depression in a VL: a sensitive marker for acute inferior myocardial infarction. Eur Heart J 1993; 14:4–7.
Engelen DJ, Gorgels AP, Cheriex EC, et al. Value of the electrocardiogram in localizing the occlusion site in the left anterior descending coronary artery in acute anterior myocardial infarction. J Am Coll Cardiol 1999; 34:389–395.
Collins MS, Carter JE, Dougherty JM, Majercik SM, Hodsden JE, Logue EE. Hyperacute T-wave criteria using computer ECG analysis. Ann Emerg Med 1990; 19:114–120.
Smith SW. T/QRS ratio best distinguishes ventricular aneurysm from anterior myocardial infarction. Am J Emerg Med 2005; 23:279–287.
Surawicz B, Parikh SR. Prevalence of male and female patterns of early ventricular repolarization in the normal ECG of males and females from childhood to old age. J Am Coll Cardiol 2002; 40:1870–1876.
Klatsky AL, Oehm R, Cooper RA, Udaltsova N, Armstrong MA. The early repolarization normal variant electrocardiogram: correlates and consequences. Am J Med 2003; 115:171–177.
Mehta M, Jain AC, Mehta A. Early repolarization. Clin Cardiol 1999; 22:59–65.
Mehta MC, Jain AC. Early repolarization on scalar electrocardiogram. Am J Med Sci 1995; 309:305–311.
Rollin A, Maury P, Bongard V, et al. Prevalence, prognosis, and identification of the malignant form of early repolarization pattern in a population-based study. Am J Cardiol 2012; 110:1302–1308.
Tikkanen JT, Anttonen O, Junttila MJ, et al. Long-term outcome associated with early repolarization on electrocardiography. N Engl J Med 2009; 361:2529–2537.
Tikkanen JT, Junttila MJ, Anttonen O, et al. Early repolarization: electrocardiographic phenotypes associated with favorable long-term outcome. Circulation 2011; 123:2666–2673.
Noseworthy PA, Tikkanen JT, Porthan K, et al. The early repolarization pattern in the general population: clinical correlates and heritability. J Am Coll Cardiol 2011; 57:2284–2289.
Wasserburger RH. Observations on the juvenile pattern of adult negro males. Am J Med 1955; 18:428–437.
Kralios FA, Martin L, Burgess MJ, Millar K. Local ventricular repolarization changes due to sympathetic nerve-branch stimulation. Am J Physiol 1975; 228:1621–1626.
Spratt KA, Borans SM, Michelson EL. Early repolarization: normalization of the electrocardiogram with exercise as a clinically useful diagnostic feature. J Invasive Cardiol 1995; 7:238–242.
Surawicz B, Lasseter KC. Electrocardiogram in pericarditis. Am J Cardiol 1970; 26:471–474.
Hull E. The electrocardiogram in pericarditis. Am J Cardiol 1961; 7:21–32.
Spodick DH. Diagnostic electrocardiographic sequences in acute pericarditis. Significance of PR segment and PR vector changes. Circulation 1973; 48:575–580.
Spodick DH. Acute pericarditis: current concepts and practice. JAMA 2003; 289:1150–1153.
Charles MA, Bensinger TA, Glasser SP. Atrial injury current in pericarditis. Arch Intern Med 1973; 131:657–662.
Noth PH, Barnes HR. Electrocardiographic changes associated with pericarditis. Arch Intern Med 1940; 65:291–320.
Ginzton LE, Laks MM. The differential diagnosis of acute pericarditis from the normal variant: new electrocardiographic criteria. Circulation 1982; 65:1004–1009.
Armstrong EJ, Kulkarni AR, Bhave PD, et al. Electrocardiographic criteria for ST-elevation myocardial infarction in patients with left ventricular hypertrophy. Am J Cardiol 2012; 110:977–983.
Sgarbossa EB, Pinski SL, Barbagelata A, et al. Electrocardiographic diagnosis of evolving acute myocardial infarction in the presence of left bundle-branch block. GUSTO-1 (Global Utilization of Streptokinase and Tissue Plasminogen Activator for Occluded Coronary Arteries) Investigators. N Engl J Med 1996; 334:481–487.
Smith SW, Dodd KW, Henry TD, Dvorak DM, Pearce LA. Diagnosis of ST-elevation myocardial infarction in the presence of left bundle branch block with the ST-elevation to S-wave ratio in a modified Sgarbossa rule. Ann Emerg Med 2012; 60:766–776.
Madias JE, Sinha A, Agarwal H, Ashtiani R. ST-segment elevation in leads V1-V3 in patients with LBBB. J Electrocardiol 2001; 34:87–88.
Sgarbossa EB, Pinski SL, Topol EJ, et al. Acute myocardial infarction and complete bundle branch block at hospital admission: clinical characteristics and outcome in the thrombolytic era. GUSTO-I Investigators. Global Utilization of Streptokinase and t-PA [tissue-type plasminogen activator] for Occluded Coronary Arteries. J Am Coll Cardiol 1998; 31:105–110.
Bybee KA, Kara T, Prasad A, et al. Systematic review: transient left ventricular apical ballooning: a syndrome that mimics ST-segment elevation myocardial infarction. Ann Intern Med 2004; 141:858–865.
Magnani JW, Dec GW. Myocarditis: current trends in diagnosis and treatment. Circulation 2006; 113:876–890.
Sreeram N, Cheriex EC, Smeets JL, Gorgels AP, Wellens HJ. Value of the 12-lead electrocardiogram at hospital admission in the diagnosis of pulmonary embolism. Am J Cardiol 1994; 73:298–303.
Glancy DL, Mikdadi GM. Syncope in a 67-year-old man. Proc (Bayl Univ Med Cent) 2005; 18:74–75.
Wilde AA, Antzelevitch C, Borggrefe M, et al; Study Group on the Molecular Basis of Arrhythmias of the European Society of Cardiology. Proposed diagnostic criteria for the Brugada syndrome: consensus report. Circulation 2002; 106:2514–2519.
ST, ST segment, ST segment elevation, ST elevation myocardial infarction, STEMI, early repolarization, pericarditis, left bundle branch block, hyperkalemia, Elias Hanna, David Glancy
Legacy Keywords
ST, ST segment, ST segment elevation, ST elevation myocardial infarction, STEMI, early repolarization, pericarditis, left bundle branch block, hyperkalemia, Elias Hanna, David Glancy
Features of STEMI: (1) ST elevation that is straight or convex upward and blends with T to form a dome; (2) wide upright T or inverted T waves; (3) Q waves; (4) ST elevation or T waves that may approximate or exceed QRS height; and (5) reciprocal ST depression.
Features of early repolarization include a notched J point and ST elevation not exceeding 3 mm.
Features of pericarditis include PR depression greater than 1 mm and ST elevation less than 5 mm.
Features of left bundle branch block, left ventricular hypertrophy, and preexcitation: both ST and T are discordant to QRS; ST elevation is less than 25% of QRS height (and less than 2.5 mm in left ventricular hypertrophy); and delta waves, short PR, and pseudo-Q waves are seen in preexcitation.
Features of hyperkalemia include narrow-based, peaked T waves “pulling” the ST segment.
Disallow All Ads
Alternative CME
Consolidated Pubs: Do Not Show Source Publication Logo
Since 1963, when Starzl et al performed the first successful liver transplantation,1 outcomes of this life-saving procedure have continued to improve. Long-term survival rates have increased markedly: the current 5-year rate is 73.8% and the 10-year rate is 60%.2
This success means that internists will be caring for a greater number of liver transplant recipients and managing their long-term problems, such as hypertension, diabetes mellitus, dyslipidemia, obesity, metabolic syndrome, cardiovascular disease, renal insufficiency, osteoporosis, cancer, and gout.
This review will discuss these complications, focusing on the role the primary care physician assumes beyond the first year after transplantation.
ROLE OF THE PRIMARY CARE PHYSICIAN
Hepatologists, primary care physicians, and surgeons share the care of transplant recipients. The first several weeks after transplantation require close follow-up by the hepatologist and transplantation team, with particular attention paid to the patient’s overall health and well-being, medication compliance, and biochemical and immunosuppression monitoring.
After the first year, the primary care physician assumes a greater role, becoming the main provider of the patient’s care.3,4 Good communication between the transplant center and the primary care physician should lead to a smooth transition.4 Although the hepatologist continues to manage immunosuppressive drugs, allograft rejections, and biliary complications, the primary care physician manages most of the long-term complications and thus needs to be aware of the common ones and feel comfortable managing them. Aims during visits are to screen for and detect common complications and manage them appropriately, in addition to performing annual physical examinations and routine health care. A reasonable interval for liver transplant recipients to visit their primary care physician is every 6 months.
IMMUNOSUPPRESSANT MEDICATIONS
Multiple agents are used for immunosuppression after liver transplantation:
Calcineurin inhibitors (cyclosporine and tacrolimus)
Antimetabolites (mycophenolate mofetil, azathioprine, and mycophenolate sodium)
Mammalian target of rapamycin (mTOR) inhibitors (sirolimus and everolimus)
Corticosteroids.
Table 1 lists their common side effects.
Most centers use a combination of two to four immunosuppressants as induction therapy in the immediate posttransplant period, then taper the doses and eliminate all but a calcineurin inhibitor and an antimetabolite. For example, some start with a combination of tacrolimus, mycophenolate mofetil, and a corticosteroid. The choice in the immediate posttransplant period is frequently made by the transplant center in cooperation with the hepatologist. By the time primary care physicians see these patients, they usually are on a calcineurin inhibitor alone or a calcineurin inhibitor plus mycophenolate mofetil.
Calcineurin inhibitors
Cyclosporine is metabolized by the cytochrome CYP3A4 pathway. With an average half-life of 15 hours, it is given orally, usually every 12 hours.
The dosage is adjusted according to the trough level. Higher levels are needed in the initial posttransplant period to prevent graft rejection, whereas lower levels are preferred later to decrease the occurrence and severity of adverse effects. Typical long-term trough levels are 50 to 100 ng/mL. Levels should be checked more often if an acute illness develops or the patient starts taking a potentially interfering drug.
Of importance: the dosage should be based on trough levels and not on random levels. Levels are often falsely high if blood samples are not drawn at the trough level. Repeating the measurement and making sure the sample is drawn at the trough level,ie, 12 hours after the last dose, is advised in this condition.
Cyclosporine causes widespread vasoconstriction resulting in decreased renal blood flow and systemic hypertension, often within a few days of starting it. Other important adverse effects include renal insufficiency, dyslipidemia, neurotoxicity (headache, tremor, seizure), and diabetes.
Tacrolimus is superior to cyclosporine in terms of survival, graft loss, acute rejection, and steroid-resistant rejection in the first year.5 Currently, it is the agent used most often for maintenance immunosuppression after liver transplantation.
Like cyclosporine, tacrolimus is metabolized in the liver by CYP3A4. Satisfactory troughlevels after 1 year are 4 to 6 ng/mL.
The adverse effects of tacrolimus are similar to those of cyclosporine, but diabetes mellitus is more common with tacrolimus. Bone marrow suppression may occur more often with tacrolimus as well.
Antimetabolites
Antimetabolites are generally not potent enough to be used alone.
Mycophenolate mofetil causes adverse effects that include bone marrow suppression and gastrointestinal symptoms such as gastritis, diarrhea, and abdominal pain.
Azathioprine, infrequently used in transplantation in the United States, is nevertheless sometimes substituted for mycophenolate mofetil in pregnant women, as it seems safer for use in pregnancy.
Serum levels of azathioprine and mycophenolate mofetil are not routinely monitored.
mTOR inhibitors
Sirolimus and everolimus are mTOR inhibitors, inhibiting proliferation of lymphocytes.6,7
Unlike calcineurin inhibitors, mTOR inhibitors are not associated with nephrotoxicity, neurotoxicity, renal dysfunction, hypertension, or diabetes. Sirolimus is considered an alternative to calcineurin inhibitors or, in some instances, used as add-on-therapy to lower the dose of the calcineurin inhibitor.
Sirolimus carries a black-box warning about hepatic artery thrombosis
However, sirolimus carries a potential risk of hepatic artery thrombosis, a life-threatening complication.8 This has led the US Food and Drug Administration (FDA) to require sirolimus to carry a black-box warning, and most transplant centers avoid using it in the first 30 days after transplantation.
Dyslipidemia is perhaps the most common adverse effect of sirolimus. Others include dose-related cytopenia and wound dehiscence.9
Everolimus has yet to be established for use in liver transplantation, although safety trials have been published.10,11 The FDA currently recommends against using it in the first 30 days after liver transplantation.
Both sirolimus and everolimus are metabolized by CYP3A4, which is the same metabolic pathway used by cyclosporine and tacrolimus. Hence, drugs that inhibit CYP3A4 may significantly impair clearance of both sirolimus and everolimus.
Corticosteroids
Corticosteroids have been the cornerstone of immunosuppression and remain the first line of treatment for acute allograft rejection. High intravenous doses of corticosteroids are usually started in the peritransplant period and are then switched to oral doses, which are tapered and continued with a fixed dose such as 20 mg of prednisone daily for 3 to 6 months after transplantation. However, some transplant centers keep patients on prednisone 5 mg/day indefinitely.
Adverse effects of corticosteroids include diabetes, salt and fluid retention, hypertension, hyperlipidemia, cosmetic changes (acne, cervical fat pad or “buffalo hump”), delayed wound healing, susceptibility to infection, cataracts, osteopenia, and potential adrenal suppression.12 There is concern that the use of these drugs may increase hepatitis C virus replication in patients who received a liver transplant for hepatitis C cirrhosis. Randomized trials have yielded conflicting results.13–15
Drug interactions
Certain drugs can affect the metabolism of calcineurin inhibitors and mTOR inhibitors by inducing CYP3A4, which results in decreasing the levels of the immunosuppressive drugs, or by inhibiting CYP3A4, which has the opposite effect.
Medications that can decrease the levels of calcineurin inhibitors and mTOR inhibitors:
Selected antibiotics are generally well tolerated, such as penicillins, cephalosporins, quinolones, sulfonamides, and topical antifungal agents.
LONG-TERM COMPLICATIONS
Figure 1.
Figure 1 summarizes the common long-term complications of liver transplantation.
Hypertension
The prevalence of hypertension after liver transplantation is 40% to 85%, which is markedly higher than in patients with chronic liver disease before liver transplantation.17,18
One of the factors contributing to this increase is the use of immunosuppressive medications. Of these drugs, cyclosporine seems to be the one that most often causes an increase in both the incidence and the severity of hypertension, as it produces widespread vasoconstriction.19 Corticosteroids cause hypertension through their mineralocorticoid effects.
The diagnostic cutoffs for hypertension (ie, 140/90 mm Hg) and the treatment goals in posttransplant patients are similar to those in the general population. However, at our institution we target a blood pressure of less than 130/80 mm Hg in transplant patients because they have a high prevalence of other cardiovascular risk factors such as diabetes, obesity, and renal insufficiency.20
Dihydropyridine calcium channel blockers such as amlodipine and nifedipine are considered the best first-line agents because they dilate renal afferent arterioles, an effect that may counteract the vasoconstriction mediated by calcineurin inhibitors. Nondihydropyridine calcium channel blockers such as diltiazem and verapamil tend to have more marked negative inotropic effects and are not recommended in liver transplant recipients because they increase the levels of calcineurin inhibitors.21
Diuretics (eg, furosemide) might be the second-line agents, especially in patients with peripheral edema.16 One should be vigilant for hyperuricemia if thiazide agents are used.
Angiotensin-converting-enzyme (ACE) inhibitors and angiotensin II receptor blockers (ARBs) are typically avoided in the early posttransplant period, but they can be started later and have additional benefits in patients with diabetes and congestive heart failure. Starting ACE inhibitors is acceptable in these patients unless there is a contraindication such as allergy to ACE inhibitors, hypotension, history of bilateral renal artery stenosis, significant hyperkalemia, or acute kidney injury. Monitor the serum potassium level closely for hyperkalemia in patients concurrently using calcineurin inhibitors.
Alpha-blockers and beta-blockers can be used as add-on therapy in patients with uncontrolled hypertension with the exception of carvedilol, because it increases the levels of calcineurin inhibitors.22
Blood pressure monitoring by the primary care physician is recommended every 6 months after the early posttransplant period, or more frequently when changes in treatment are being considered.
If hypertension continues to be inadequately controlled despite treatment, changing the immunosuppressive drugs or decreasing the doses can be considered, but the transplant hepatologist must be involved in this decision.23,24
Diabetes mellitus
The prevalence of diabetes mellitus is higher in liver transplant recipients than in the general population, reaching 30% to 40%.17,25 In addition to preexisting diabetes, 15% of liver transplant recipients develop new-onset diabetes.26,27
Risk factors for developing diabetes after liver transplantation include African American or Hispanic ethnicity, obesity, family history, pretransplant diabetes, hepatitis C virus infection, use of corticosteroids, and use of calcineurin inhibitors (tacrolimus more than cyclosporine) and sirolimus.26
In addition to increasing the risk of cardiovascular disease and other diseases, diabetes decreases both patient and graft survival after liver transplantation.28
The management of diabetes and the treatment target after transplantation should follow the American Diabetes Association guidelines for the treatment of type 2 diabetes mellitus.29 Lifestyle modifications, diet, and exercise are as important for transplant patients as for the nontransplant population. Insulin therapy is usually needed in the early posttransplant period to control blood glucose levels well, especially with the high doses of corticosteroids used during the first few weeks. No trials to date have compared oral agents in posttransplant patients. Therefore, the choice of oral hypoglycemic agents should be individualized on the basis of the patient’s characteristics and comorbidities.
Screen all liver transplant recipients for diabetes regardless of their pretransplant status
We recommend that primary care providers screen all liver transplant recipients for diabetes regardless of their pretransplant status. This can be done by obtaining regular fasting blood glucose levels or a hemoglobin A1c level every 6 months. Additionally, liver transplant recipients diagnosed with diabetes require annual eye examinations to look for cataracts and diabetes-related changes.30
Dyslipidemia
On November 12, 2013, the American College of Cardiology and the American Heart Association (ACC/AHA) released new clinical practice guidelines for treating blood cholesterol levels.31,32 According to these new guidelines, there are four groups of patients for whom treatment with statins is clearly indicated:
Patients with cardiovascular disease
Patients with low-density lipoprotein cholesterol (LDL-C) levels ≥ 190 mg/dL
Patients 40 to 75 years old with type 2 diabetes
Patients 40 to 75 years old with an estimated 10-year risk of cardiovascular disease of 7.5% or greater.
Liver transplant recipients should be evaluated on an individual basis to see if they fit in any of the four groups and if statin treatment therefore needs to be initiated.
A few things need to be kept in mind. First, the incidence of dyslipidemia after liver transplantation is estimated to be 45% to 69%. Risk factors include obesity, diabetes mellitus, cholestatic liver disease, and immunosuppressant medications.33 Sirolimus has a significant and well-documented association with dyslipidemia. Cyclosporine and corticosteroids are also strongly associated with dyslipidemia. Tacrolimus has a minor effect, and mycophenolate mofetil and azathioprine have no significant effects on serum lipid levels.16
Second, of the seven currently marketed statins, pravastatin and fluvastatin are preferred in liver transplant recipients because they are not metabolized by the same cytochrome CYP3A4 pathway that metabolizes calcineurin inhibitors and sirolimus.34 The doses of 40 to 80 mg daily of pravastatin or 40 mg twice daily of fluvastatin lower low-density lipoprotein cholesterol (LDL-C) levels by approximately 30% to 35%. However, these two agents are considered “moderate-intensity” statins according to the new ACC/AHA guidelines. The only two “high-intensity” statins are atorvastatin (40–80 mg) and rosuvastatin (20–40 mg), but they are both metabolized by CYP3A4. Therefore it is prudent to avoid them with the concurrent use of a calcineurin inhibitor or tacrolimus.
Gemfibrozil does not lower LDL-C and should not be used concomitantly with statins due to unacceptable risk of rhabdomyolysis and myopathy. Fenofibrates are usually avoided due to potential nephrotoxicity in patients receiving cyclosporine. Bile acid sequestrants (cholestyramine, colestipol, colesevelam) can decrease plasma mycophenolate mofetil levels by 35%.16,35 Thus, these agents should be avoided if mycophenolate mofetil is used.
It is reasonable to screen all liver transplant recipients with a fasting lipid profile at 3, 6, and 12 months after transplantation and annually thereafter. Creatine kinase should be measured if the patient complains of severe muscle pain or weakness but not on a routine basis.
Obesity
Approximately one-third of patients who are of normal weight at the time of transplantation will become obese afterward.18,25 Corticosteroid use is an important risk factor for posttransplant obesity, and tapering these drugs helps reduce weight.36 Patients treated with cyclosporine are more likely to gain weight than those who receive tacrolimus.37
Of importance: nonalcoholic fatty liver disease, currently the most common cause of chronic liver disease in adults, is rapidly increasing as an indication for liver transplantation. In fact, the proportion of liver transplantation procedures for nonalcoholic steatohepatitis-related cirrhosis increased from 1.2% in 2001 to 9.7% in 2009, and nonalcoholic steatohepatitis is expected to become the leading indication for liver transplantation in the next 20 years. And because nonalcoholic fatty liver disease is directly linked to obesity, the prevalence of obesity as a complication of liver transplantation will most likely increase in the near future.
Overweight liver transplant recipients may have great difficulty losing weight. Treatment starts with patient education on caloric restriction and exercise. If traditional measures fail to result in adequate weight loss, additional options include switching from cyclosporine to tacrolimus.23
Bariatric surgery may become an option for posttransplant patients. In a recent case series from the University of Minnesota, Al-Nowaylati et al38 reported their experience with seven patients who underwent orthotopic liver transplantation and then open Roux-en-Y gastric bypass. After bariatric surgery, the patients’ mean body mass index declined significantly, and glycemic control and high-density lipoprotein cholesterol (HDL-C) levels improved. However, one patient died of multiple organ failure, to which the bariatric surgery might have contributed.38
Heimbach et al39 conducted a study in patients referred for liver transplantation for whom a rigorous noninvasive weight-loss program before transplantation had failed. The researchers performed combined liver transplantation and sleeve gastrectomy in seven carefully selected patients who had failed to achieve weight loss to a body mass index less than 35 kg/m2 before transplantation. All seven patients lost weight, decreasing their mean body mass index from 49 kg/m2 before the procedure to 29 kg/m2 at last follow-up, and none of them developed posttransplant diabetes or steatosis.
At this time, there is not enough evidence to recommend concurrent orthotopic liver transplantation plus bariatric surgery, or combined orthotopic liver transplantation and sleeve gastrectomy. More study is needed to further evaluate these advanced approaches.
Posttransplant metabolic syndrome
Metabolic syndrome is common after liver transplantation and is strongly associated with increased morbidity in this patient population.40,41 The general definition of metabolic syndrome includes a combination of at least three of the following: hypertension, insulin resistance, hypertriglyceridemia, low HDL-C, and obesity.
The prevalence of metabolic syndrome is higher in patients after liver transplantation than in nontransplant patients. In a review of 252 liver transplant recipients, 52% were diagnosed with posttransplant metabolic syndrome, but only 5% had had it pretransplant.42
Careful screening for posttransplant metabolic syndrome and early recognition of risk factors are important. Nevertheless, the treatment of this condition depends on treating its components according to recommended guidelines.41
Cardiovascular disease
The incidence of cardiovascular morbidity and death is increased after liver transplantation.24 In addition, after liver transplantation, cardiovascular disease is a major cause of death unrelated to liver disease. It accounts for 12% to 16% of deaths and is the third most common cause of late mortality after liver transplantation.43 Of note, a recent study by our group demonstrated that patients undergoing liver transplantation for nonalcoholic steatohepatitis had a significantly higher risk of a cardiovascular event during the 3 years after transplantation than patients undergoing liver transplantation for cholestatic liver disease.44
Risk factors for cardiovascular disease after liver transplantation include older age at transplantation, male sex, posttransplant diabetes, posttransplant hypertension, and the use of mycophenolate mofetil.44 Modifying the risk factors is essential in decreasing the risk of cardiovascular events.
It is reasonable to perform dobutamine stress testing every 3 to 5 years in patients with multiple risk factors for cardiovascular disease, or more frequently in those with preexisting coronary artery disease.45,46
Malignancy
The risk of several malignancies increases after liver transplantation. Liver transplant recipients have an incidence of cancer 2.1 to 4.3 times greater than age- and sex-matched controls.24,47–49
Skin cancers are the most common and account for almost 40% of malignancies in organ transplant recipients.50 Whereas basal cell carcinoma is more common in the general population, squamous cell carcinoma is equally common in liver transplant recipients.
Multiple clinical studies have linked calcineurin inhibitors and azathioprine to the development of skin cancer. Annual skin examinations in addition to avoiding other risk factors such as smoking and sun exposure are generally recommended. Changing the immunosuppressants to sirolimus in high-risk patients may lower their chance of developing skin cancer.51,52
Patients with ulcerative colitis who undergo liver transplantation because of sclerosing cholangitis are at higher risk of colon cancer and require annual colonoscopy with surveillance biopsies. Patients who undergo transplantation for alcoholic liver disease seem to have a higher risk of pulmonary and oropharyngeal cancers.53,54
It is important that transplant patients adhere to recommended cancer screening guidelines, in view of their increased risk. Studies have shown improved overall survival in liver transplant recipients who underwent intensive cancer surveillance.55
Renal insufficiency
Renal insufficiency is a well-recognized complication of liver transplantation and is associated with an increased long-term death rate.56,57
The incidence of renal insufficiency increases dramatically over time. Ojo et al,57 in a study of almost 37,000 liver transplant recipients, found that the incidence of chronic kidney disease (defined as an estimated glomerular filtration rate < 30 mL/min/1.73 m2) was 13.9% at 3 years, 18% at 5 years, and approximately 26% at 10 years.
Risk factors include the use of calcineurin inhibitors (both cyclosporine and tacrolimus), older age, female sex, lower pretransplant glomerular filtration rate, postoperative acute renal failure, diabetes, hypertension, hepatitis C virus infection, and transplantation before 1998.58,59 Replacing a calcineurin inhibitor with mycophenolate mofetil or sirolimus may be considered with communication with the transplant center, as mycophenolate mofetil or sirolimus are associated with a lower risk of renal injury.60–64
All liver transplant recipients should avoid nonsteroidal anti-inflammatory drugs and nephrotoxic medications
Starting 1 year after liver transplantation, primary care providers should screen for renal dysfunction by obtaining kidney function tests every 6 months, including urinalysis and microalbuminuria assessment. Equations for estimating the glomerular filtration rate used in practice, such as the Modification of Diet in Renal Disease Study equation, rely mainly on serum creatinine, which may lead to overestimating renal function in some circumstances. Therefore, other equations can be used to confirm the estimated glomerular filtration rate measured by creatinine clearance, and to more accurately evaluate kidney function. Calculators are available at www.kidney.org/professionals/kdoqi/gfr_calculator.
All liver transplant recipients should avoid nonsteroidal anti-inflammatory drugs and nephrotoxic medications, and should have their hypertension and diabetes adequately controlled.
Bone diseases
Osteopenia is another major complication of liver transplantation. One-third of liver transplant recipients have a bone mineral density below the fracture threshold.65
Multiple factors contribute to increased bone loss after transplantation, including use of corticosteroids, use of calcineurin inhibitors (cyclosporine, tacrolimus), poor nutrition, vitamin D deficiency, immobility, sarcopenia (reduced muscle mass), hypogonadism, smoking, and alcohol abuse.66 Even at low doses of less than 7.5 mg per day, corticosteroids inhibit osteoblast activity and increase bone resorption.
Studies have reported rapid bone loss at around 6 months after transplantation.67–69 However, long-term follow-up of bone mineral density up to 15 years after transplantation revealed an improvement mainly in the 2nd postoperative year, with no deterioration afterward.65
High-risk patients need to be identified early with appropriate screening and evaluation. Evaluation includes dual-energy x-ray absorptiometry and serum levels of calcium, phosphorous, parathyroid hormone, testosterone (men), estradiol (women), and alpha-25-hydroxyvitamin D. These tests are typically done before transplantation and then every other year afterward.
We recommend a daily dose of calcitriol and a calcium supplement to all our liver transplant patients.70 If osteoporosis (a T-score 2.5 or more standard deviations below the mean) or a fragility fracture occurs, then the patient may benefit from an oral bisphosphonate. Calcitonin has also been shown to improve bone mineral density in patients with osteoporosis after liver transplantation.71
Hyperuricemia and gout
Although hyperuricemia is common in liver transplant recipients (reported in approximately 47%), the development of clinical gout is less common (6%).72 Asymptomatic hyperuricemia requires observation only and is not usually treated in liver transplant recipients.
Acute attacks of gout are typically managed with colchicine 0.6 mg every 2 hours, up to five doses. Prednisone can be considered if symptoms persist despite treatment with colchicine. Allopurinol in an initial dose of 100 mg daily is used as maintenance therapy to reduce production of uric acid.73 However, because of the potential for drug interactions, the combination of azathioprine and allopurinol should be avoided.
Psychiatric complications and quality of life
Depression is common in liver transplant recipients, significantly more so in patients who received a transplant because of hepatitis C.74 The type of immunosuppressant is not associated with the incidence of depression. When indicated, the internist may start the patient on a selective serotonin reuptake inhibitor such as citalopram 20 mg daily, as these medications are usually effective and well tolerated in liver transplant patients.73
Liver transplantation has a major positive effect on quality of life. Most patients with end-stage liver disease have poor quality of life before transplantation, but this seems to improve notably afterward. A meta-analysis showed significant improvement in posttransplant physical health, sexual functioning, daily activities, and social functioning compared with before transplantation.75
Alcohol abuse and smoking
Patients who underwent liver transplantation because of alcoholic liver disease should be advised to abstain from alcohol.19 Patients who underwent the procedure for a different indication are advised to avoid excessive alcohol intake, as it is proven to lower the survival rate.20 Alcohol recidivism and smoking (including marijuana) are major problems, and internists are best positioned to address these issues and treat them.
Vaccinations
All liver transplant recipients should be vaccinated against influenza, pneumococcal infection, and tetanus. Hepatitis A and B vaccines are typically given before transplantation. In general, live vaccines such as measles-mumps-rubella and varicella are not recommended after any solid organ transplant.76
A study in Germany showed that immunization rates were too low in solid-organ transplant recipients, and almost 90% of patients were not adequately informed about immunizations.77 Hence, there may be room for improvement, and primary care providers should take the lead toward better outcomes in this regard.
Recurrence of the primary liver disease after transplantation
Different primary liver diseases recur with different frequencies.
Hepatitis C has the highest rate of recurrence of the liver diseases.78,79 Reinfection with hepatitis C virus after liver transplantation is almost universal and can follow different patterns. One of the most aggressive patterns is fibrosing cholestatic hepatitis, which frequently leads to graft failure and death, and hence necessitates urgent detection and treatment.
Hepatocellular carcinoma also has a high recurrence rate.80 Surveillance with liver ultrasonography or computed tomography is required every 6 months for the first 5 years after liver transplantation.
Other liver diseases. Nonalcoholic steatohepatitis, primary biliary cirrhosis, primary sclerosing cholangitis, autoimmune hepatitis, and hepatitis B infection also tend to recur after liver transplantation.46,81 On the other hand, alpha-1 antitrypsin deficiency, Wilson disease, hemochromatosis, and metabolic disorders are “cured” after liver transplantation.
It is important to detect any increase in liver enzymes above baseline. An elevation of 1.5 times the upper limit of normal or more should trigger further investigation.
Allograft dysfunction
A number of complications can develop in the liver allograft and result in abnormal liver function tests and, if not treated, graft failure. The most common causes of late graft dysfunction include recurrence of primary liver disease, biliary complications, and chronic rejection.46
Vascular complications include hepatic artery thrombosis and stenosis and are usually evaluated by liver ultrasonography and Doppler scan of the hepatic artery and venous structures.24
Biliary strictures give a cholestatic picture, with elevated bilirubin and greater elevation of alkaline phosphatase than of alanine aminotransferase and aspartate aminotransferase. Strictures are usually treated by endoscopic dilation and stenting, but they may eventually require surgery.
Late acute cellular rejections occur in 10% to 20% of cases and are a risk factor for chronic rejection. Liver biopsy is needed to make the diagnosis, and pulsed doses of corticosteroids remain the backbone of treatment therapy.
Chronic rejection is not common, occurring in 3% to 4% of liver transplant recipients.46 Treatment is based on increasing immunosuppression and ensuring compliance with prescribed medications. However, chronic rejection may not respond well, and repeat transplantation may be the last resort for some patients.
WHEN TO REFER TO THE HEPATOLOGIST
Some situations require referral to the hepatologist or the transplant center. In general, the following are best managed by a hepatologist: adjustment of immunosuppressive drugs and dosages, allograft dysfunction, vascular and biliary complications, progressing renal dysfunction, and recurrence of primary liver disease. Early communication with a hepatologist and the transplant center is recommended in these cases.
References
Starzl TE, Marchioro TL, Vonkaulla KN, Hermann G, Brittain RS, Waddell WR. Homotransplantation of the liver in humans. Surg Gynecol Obstet 1963; 117:659–676.
Matas AJ, Smith JM, Skeans MA, et al. OPTN/SRTR 2011 annual data report: kidney. Am J Transplant 2013; 13(suppl 1):11–46.
McCashland TM. Posttransplantation care: role of the primary care physician versus transplant center. Liver Transpl 2001; 7(suppl 1):S2–S12.
Heller JC, Prochazka AV, Everson GT, Forman LM. Long-term management after liver transplantation: primary care physician versus hepatologist. Liver Transpl 2009; 15:1330–1335.
McAlister VC, Haddad E, Renouf E, Malthaner RA, Kjaer MS, Gluud LL. Cyclosporin versus tacrolimus as primary immunosuppressant after liver transplantation: a meta-analysis. Am J Transplant 2006; 6:1578–1585.
Neuhaus P, Klupp J, Langrehr JM. mTOR inhibitors: an overview. Liver Transpl 2001; 7:473–484.
Sehgal SN. Rapamune (RAPA, rapamycin, sirolimus): mechanism of action immunosuppressive effect results from blockade of signal transduction and inhibition of cell cycle progression. Clin Biochem 1998; 31:335–340.
Asrani SK, Wiesner RH, Trotter JF, et al. De novo sirolimus and reduced-dose tacrolimus versus standard-dose tacrolimus after liver transplantation: the 2000-2003 phase II prospective randomized trial. Am J Transplant 2014; 14:356–366.
Montalbano M, Neff GW, Yamashiki N, et al. A retrospective review of liver transplant patients treated with sirolimus from a single center: an analysis of sirolimus-related complications. Transplantation 2004; 78:264–268.
Everson GT. Everolimus and mTOR inhibitors in liver transplantation: opening the “box.” Liver Transpl 2006; 12:1571–1573.
Levy G, Schmidli H, Punch J, et al. Safety, tolerability, and efficacy of everolimus in de novo liver transplant recipients: 12- and 36-month results. Liver Transpl 2006; 12:1640–1648.
Toniutto P, Fabris C, Fumolo E, et al. Prevalence and risk factors for delayed adrenal insufficiency after liver transplantation. Liver Transpl 2008; 14:1014–1019.
Klintmalm GB, Davis GL, Teperman L, et al. A randomized, multicenter study comparing steroid-free immunosuppression and standard immunosuppression for liver transplant recipients with chronic hepatitis C. Liver Transpl 2011; 17:1394–1403.
Llado L, Fabregat J, Castellote J, et al. Impact of immunosuppression without steroids on rejection and hepatitis C virus evolution after liver transplantation: results of a prospective randomized study. Liver Transpl 2008; 14:1752–1760.
Lake JR. Immunosuppression and outcomes of patients transplanted for hepatitis C. J Hepatol 2006; 44:627–629.
Sohn AJ, Jeon H, Ahn J. Primary care of the liver transplant recipient. Prim Care 2011; 38:499–514.
Laish I, Braun M, Mor E, Sulkes J, Harif Y, Ben Ari Z. Metabolic syndrome in liver transplant recipients: prevalence, risk factors, and association with cardiovascular events. Liver Transpl 2011; 17:15–22.
Stegall MD, Everson G, Schroter G, Bilir B, Karrer F, Kam I. Metabolic complications after liver transplantation. Diabetes, hypercholesterolemia, hypertension, and obesity. Transplantation 1995; 60:1057–1060.
Textor SC, Canzanello VJ, Taler SJ, et al. Cyclosporine-induced hypertension after transplantation. Mayo Clin Proc 1994; 69:1182–1193.
Prevention, detection, evaluation, and treatment of hypertension. The Sixth Report of the Joint National Committee. National Institutes of Health-National Heart, Lung, and Blood Institute. National High Blood Pressure Education Programme. Indian Heart J 1999; 51:381–396.
Frishman WH. Calcium channel blockers: differences between subclasses. Am J Cardiovasc Drugs 2007; 7(suppl 1):17–23.
Galioto A, Semplicini A, Zanus G, et al. Nifedipine versus carvedilol in the treatment of de novo arterial hypertension after liver transplantation: results of a controlled clinical trial. Liver Transpl 2008; 14:1020–1028.
Neal DA, Gimson AE, Gibbs P, Alexander GJ. Beneficial effects of converting liver transplant recipients from cyclosporine to tacrolimus on blood pressure, serum lipids, and weight. Liver Transpl 2001; 7:533–539.
Singh S, Watt KD. Long-term medical management of the liver transplant recipient: what the primary care physician needs to know. Mayo Clin Proc 2012; 87:779–790.
Bianchi G, Marchesini G, Marzocchi R, Pinna AD, Zoli M. Metabolic syndrome in liver transplantation: relation to etiology and immunosuppression. Liver Transpl 2008; 14:1648–1654.
Lane JT, Dagogo-Jack S. Approach to the patient with new-onset diabetes after transplant (NODAT). J Clin Endocrinol Metab 2011; 96:3289–3297.
Wilkinson A, Davidson J, Dotta F, et al. Guidelines for the treatment and management of new-onset diabetes after transplantation. Clin Transplant 2005; 19:291–298.
Moon JI, Barbeito R, Faradji RN, Gaynor JJ, Tzakis AG. Negative impact of new-onset diabetes mellitus on patient and graft survival after liver transplantation: long-term follow up. Transplantation 2006; 82:1625–1628.
American Diabetes Association. Standards of medical care in diabetes—2012. Diabetes Care 2012; 35(suppl 1):S11–S63.
Marchetti P. New-onset diabetes after liver transplantation: from pathogenesis to management. Liver Transpl 2005; 11:612–620.
Stone NJ, Robinson J, Lichtenstein AH, et al; American College of Cardiology/American Heart Association Task Force on Practice Guidelines. 2013 ACC/AHA guideline on the treatment of blood cholesterol to reduce atherosclerotic cardiovascular risk in adults: a report of the American College of Cardiology/American Heart Association Task Force on Practice Guidelines. Circulation 2014; 129(suppl 2):S1–S45.
National Cholesterol Education Program (NCEP) Expert Panel on Detection, Evaluation, and Treatment of High Blood Cholesterol in Adults (Adult Treatment Panel III). Third Report of the National Cholesterol Education Program (NCEP) Expert Panel on Detection, Evaluation, and Treatment of High Blood Cholesterol in Adults (Adult Treatment Panel III) final report. Circulation 2002; 106:3143–3421.
Gisbert C, Prieto M, Berenguer M, et al. Hyperlipidemia in liver transplant recipients: prevalence and risk factors. Liver Transpl Surg 1997; 3:416–422.
Asberg A. Interactions between cyclosporin and lipid-lowering drugs: implications for organ transplant recipients. Drugs 2003; 63:367–378.
Bullingham RE, Nicholls AJ, Kamm BR. Clinical pharmacokinetics of mycophenolate mofetil. Clin Pharmacokinet 1998; 34:429–455.
Everhart JE, Lombardero M, Lake JR, Wiesner RH, Zetterman RK, Hoofnagle JH. Weight change and obesity after liver transplantation: incidence and risk factors. Liver Transpl Surg 1998; 4:285–296.
Canzanello VJ, Schwartz L, Taler SJ, et al. Evolution of cardiovascular risk after liver transplantation: a comparison of cyclosporine A and tacrolimus (FK506). Liver Transpl Surg 1997; 3:1–9.
Al-Nowaylati AR, Al-Haddad BJ, Dorman RB, et al. Gastric bypass after liver transplantation. Liver Transpl 2013; 19:1324–1329.
Heimbach JK, Watt KD, Poterucha JJ, et al. Combined liver transplantation and gastric sleeve resection for patients with medically complicated obesity and end-stage liver disease. Am J Transplant 2013; 13:363–368.
Watt KD, Charlton MR. Metabolic syndrome and liver transplantation: a review and guide to management. J Hepatol 2010; 53:199–206.
Pagadala M, Dasarathy S, Eghtesad B, McCullough AJ. Posttransplant metabolic syndrome: an epidemic waiting to happen. Liver Transpl 2009; 15:1662–1670.
Alberti KG, Eckel RH, Grundy SM, et al. Harmonizing the metabolic syndrome: a joint interim statement of the International Diabetes Federation Task Force on Epidemiology and Prevention; National Heart, Lung, and Blood Institute; American Heart Association; World Heart Federation; International Atherosclerosis Society; and International Association for the Study of Obesity. Circulation 2009; 120:1640–1645.
Watt KD, Pedersen RA, Kremers WK, Heimbach JK, Charlton MR. Evolution of causes and risk factors for mortality post-liver transplant: results of the NIDDK long-term follow-up study. Am J Transplant 2010; 10:1420–1427.
Albeldawi M, Aggarwal A, Madhwal S, et al. Cumulative risk of cardiovascular events after orthotopic liver transplantation. Liver Transpl 2012; 18:370–375.
Gibbons RJ, Balady GJ, Bricker JT, et al. ACC/AHA 2002 guideline update for exercise testing: summary article: a report of the American College of Cardiology/American Heart Association Task Force on Practice Guidelines (Committee to Update the 1997 Exercise Testing Guidelines). Circulation 2002; 106:1883–1892.
Aberg F, Isoniemi H, Höckerstedt K. Long-term results of liver transplantation. Scand J Surg 2011; 100:14–21.
Aberg F, Pukkala E, Höckerstedt K, Sankila R, Isoniemi H. Risk of malignant neoplasms after liver transplantation: a population-based study. Liver Transpl 2008; 14:1428–1436.
Mells G, Neuberger J. Long-term care of the liver allograft recipient. Semin Liver Dis 2009; 29:102–120.
Herrero JI. De novo malignancies following liver transplantation: impact and recommendations. Liver Transpl 2009; 15(suppl 2):S90–S94.
Euvrard S, Kanitakis J, Claudy A. Skin cancers after organ transplantation. N Engl J Med 2003; 348:1681–1691.
Euvrard S, Morelon E, Rostaing L, et al; TUMORAPA Study Group. Sirolimus and secondary skin-cancer prevention in kidney transplantation. N Engl J Med 2012; 367:329–339.
Salgo R, Gossmann J, Schofer H, et al. Switch to a sirolimus-based immunosuppression in long-term renal transplant recipients: reduced rate of (pre-)malignancies and nonmelanoma skin cancer in a prospective, randomized, assessor-blinded, controlled clinical trial. Am J Transplant 2010; 10:1385–1393.
Narumi S, Roberts JP, Emond JC, Lake J, Ascher NL. Liver transplantation for sclerosing cholangitis. Hepatology 1995; 22:451–457.
Knechtle SJ, D’Alessandro AM, Harms BA, Pirsch JD, Belzer FO, Kalayoglu M. Relationships between sclerosing cholangitis, inflammatory bowel disease, and cancer in patients undergoing liver transplantation. Surgery 1995; 118:615–620.
Finkenstedt A, Graziadei IW, Oberaigner W, et al. Extensive surveillance promotes early diagnosis and improved survival of de novo malignancies in liver transplant recipients. Am J Transplant 2009; 9:2355–2361.
Fisher NC, Nightingale PG, Gunson BK, Lipkin GW, Neuberger JM. Chronic renal failure following liver transplantation: a retrospective analysis. Transplantation 1998; 66:59–66.
Ojo AO, Held PJ, Port FK, et al. Chronic renal failure after transplantation of a nonrenal organ. N Engl J Med 2003; 349:931–940.
Klintmalm GB, Gonwa TA. Nephrotoxicity associated with cyclosporine and FK506. Liver Transpl Surg 1995; 1:11–19.
A comparison of tacrolimus (FK506) and cyclosporine for immunosuppression in liver transplantation. The US Multicenter FK506 Liver Study Group. N Engl J Med 1994; 331:1110–1115.
Neff GW, Montalbano M, Slapak-Green G, et al. Sirolimus therapy in orthotopic liver transplant recipients with calcineurin inhibitor related chronic renal insufficiency. Transplant Proc 2003; 35:3029–3031.
Cotterell AH, Fisher RA, King AL, et al. Calcineurin inhibitor-induced chronic nephrotoxicity in liver transplant patients is reversible using rapamycin as the primary immunosuppressive agent. Clin Transplant 2002; 16(suppl 7):49–51.
Manzia TM, De Liguori Carino N, Orlando G, et al. Use of mycophenolate mofetil in liver transplantation: a literature review. Transplant Proc 2005; 37:2616–2617.
Schlitt HJ, Barkmann A, Boker KH, et al. Replacement of calcineurin inhibitors with mycophenolate mofetil in liver-transplant patients with renal dysfunction: a randomised controlled study. Lancet 2001; 357:587–591.
Hodge EE, Reich DJ, Clavien PA, Kim-Schluger L. Use of mycophenolate mofetil in liver transplant recipients experiencing renal dysfunction on cyclosporine or tacrolimus-randomized, prospective, multicenter study results. Transplant Proc 2002; 34:1546–1547.
Hamburg SM, Piers DA, van den Berg AP, Slooff MJ, Haagsma EB. Bone mineral density in the long term after liver transplantation. Osteoporos Int 2000; 11:600–606.
Maalouf NM, Shane E. Osteoporosis after solid organ transplantation. J Clin Endocrinol Metab 2005; 90:2456–2465.
Crosbie OM, Freaney R, McKenna MJ, Curry MP, Hegarty JE. Predicting bone loss following orthotopic liver transplantation. Gut 1999; 44:430–434.
Giannini S, Nobile M, Ciuffreda M, et al. Long-term persistence of low bone density in orthotopic liver transplantation. Osteoporos Int 2000; 11:417–424.
Monegal A, Navasa M, Guanabens N, et al. Bone disease after liver transplantation: a long-term prospective study of bone mass changes, hormonal status and histomorphometric characteristics. Osteoporos Int 2001; 12:484–492.
Neuhaus R, Lohmann R, Platz KP, et al. Treatment of osteoporosis after liver transplantation. Transplant Proc 1995; 27:1226–1227.
Valero MA, Loinaz C, Larrodera L, Leon M, Moreno E, Hawkins F. Calcitonin and bisphosphonates treatment in bone loss after liver transplantation. Calcif Tissue Int 1995; 57:15–19.
Neal DA, Tom BD, Gimson AE, Gibbs P, Alexander GJ. Hyperuricemia, gout, and renal function after liver transplantation. Transplantation 2001; 72:1689–1691.
Schiff ER, Sorrell MF, Maddrey WC, editors. Schiff’s Diseases of the Liver. 10th ed. Philadephia, PA: Lippincott Williams & Wilkins; 2007.
Tombazzi CR, Waters B, Shokouh-Amiri MH, Vera SR, Riely CA. Neuropsychiatric complications after liver transplantation: role of immunosuppression and hepatitis C. Dig Dis Sci 2006; 51:1079–1081.
Bravata DM, Olkin I, Barnato AE, Keeffe EB, Owens DK. Health-related quality of life after liver transplantation: a meta-analysis. Liver Transpl Surg 1999; 5:318–331.
Danziger-Isakov L, Kumar D; AST Infectious Diseases Community of Practice. Vaccination in solid organ transplantation. Am J Transplant 2013; 13(suppl 4):311–317.
Chesi C, Gunther M, Huzly D, et al. Immunization of liver and renal transplant recipients: a seroepidemiological and sociodemographic survey. Transpl Infect Dis 2009; 11:507–512.
Berenguer M, Lopez-Labrador FX, Wright TL. Hepatitis C and liver transplantation. J Hepatol 2001; 35:666–678.
Forman LM, Lewis JD, Berlin JA, Feldman HI, Lucey MR. The association between hepatitis C infection and survival after orthotopic liver transplantation. Gastroenterology 2002; 122:889–896.
Benten D, Staufer K, Sterneck M. Orthotopic liver transplantation and what to do during follow-up: recommendations for the practitioner. Nat Clin Pract Gastroenterol Hepatol 2009; 6:23–36.
Kotlyar DS, Campbell MS, Reddy KR. Recurrence of diseases following orthotopic liver transplantation. Am J Gastroenterol 2006; 101:1370–1378.
Since 1963, when Starzl et al performed the first successful liver transplantation,1 outcomes of this life-saving procedure have continued to improve. Long-term survival rates have increased markedly: the current 5-year rate is 73.8% and the 10-year rate is 60%.2
This success means that internists will be caring for a greater number of liver transplant recipients and managing their long-term problems, such as hypertension, diabetes mellitus, dyslipidemia, obesity, metabolic syndrome, cardiovascular disease, renal insufficiency, osteoporosis, cancer, and gout.
This review will discuss these complications, focusing on the role the primary care physician assumes beyond the first year after transplantation.
ROLE OF THE PRIMARY CARE PHYSICIAN
Hepatologists, primary care physicians, and surgeons share the care of transplant recipients. The first several weeks after transplantation require close follow-up by the hepatologist and transplantation team, with particular attention paid to the patient’s overall health and well-being, medication compliance, and biochemical and immunosuppression monitoring.
After the first year, the primary care physician assumes a greater role, becoming the main provider of the patient’s care.3,4 Good communication between the transplant center and the primary care physician should lead to a smooth transition.4 Although the hepatologist continues to manage immunosuppressive drugs, allograft rejections, and biliary complications, the primary care physician manages most of the long-term complications and thus needs to be aware of the common ones and feel comfortable managing them. Aims during visits are to screen for and detect common complications and manage them appropriately, in addition to performing annual physical examinations and routine health care. A reasonable interval for liver transplant recipients to visit their primary care physician is every 6 months.
IMMUNOSUPPRESSANT MEDICATIONS
Multiple agents are used for immunosuppression after liver transplantation:
Calcineurin inhibitors (cyclosporine and tacrolimus)
Antimetabolites (mycophenolate mofetil, azathioprine, and mycophenolate sodium)
Mammalian target of rapamycin (mTOR) inhibitors (sirolimus and everolimus)
Corticosteroids.
Table 1 lists their common side effects.
Most centers use a combination of two to four immunosuppressants as induction therapy in the immediate posttransplant period, then taper the doses and eliminate all but a calcineurin inhibitor and an antimetabolite. For example, some start with a combination of tacrolimus, mycophenolate mofetil, and a corticosteroid. The choice in the immediate posttransplant period is frequently made by the transplant center in cooperation with the hepatologist. By the time primary care physicians see these patients, they usually are on a calcineurin inhibitor alone or a calcineurin inhibitor plus mycophenolate mofetil.
Calcineurin inhibitors
Cyclosporine is metabolized by the cytochrome CYP3A4 pathway. With an average half-life of 15 hours, it is given orally, usually every 12 hours.
The dosage is adjusted according to the trough level. Higher levels are needed in the initial posttransplant period to prevent graft rejection, whereas lower levels are preferred later to decrease the occurrence and severity of adverse effects. Typical long-term trough levels are 50 to 100 ng/mL. Levels should be checked more often if an acute illness develops or the patient starts taking a potentially interfering drug.
Of importance: the dosage should be based on trough levels and not on random levels. Levels are often falsely high if blood samples are not drawn at the trough level. Repeating the measurement and making sure the sample is drawn at the trough level,ie, 12 hours after the last dose, is advised in this condition.
Cyclosporine causes widespread vasoconstriction resulting in decreased renal blood flow and systemic hypertension, often within a few days of starting it. Other important adverse effects include renal insufficiency, dyslipidemia, neurotoxicity (headache, tremor, seizure), and diabetes.
Tacrolimus is superior to cyclosporine in terms of survival, graft loss, acute rejection, and steroid-resistant rejection in the first year.5 Currently, it is the agent used most often for maintenance immunosuppression after liver transplantation.
Like cyclosporine, tacrolimus is metabolized in the liver by CYP3A4. Satisfactory troughlevels after 1 year are 4 to 6 ng/mL.
The adverse effects of tacrolimus are similar to those of cyclosporine, but diabetes mellitus is more common with tacrolimus. Bone marrow suppression may occur more often with tacrolimus as well.
Antimetabolites
Antimetabolites are generally not potent enough to be used alone.
Mycophenolate mofetil causes adverse effects that include bone marrow suppression and gastrointestinal symptoms such as gastritis, diarrhea, and abdominal pain.
Azathioprine, infrequently used in transplantation in the United States, is nevertheless sometimes substituted for mycophenolate mofetil in pregnant women, as it seems safer for use in pregnancy.
Serum levels of azathioprine and mycophenolate mofetil are not routinely monitored.
mTOR inhibitors
Sirolimus and everolimus are mTOR inhibitors, inhibiting proliferation of lymphocytes.6,7
Unlike calcineurin inhibitors, mTOR inhibitors are not associated with nephrotoxicity, neurotoxicity, renal dysfunction, hypertension, or diabetes. Sirolimus is considered an alternative to calcineurin inhibitors or, in some instances, used as add-on-therapy to lower the dose of the calcineurin inhibitor.
Sirolimus carries a black-box warning about hepatic artery thrombosis
However, sirolimus carries a potential risk of hepatic artery thrombosis, a life-threatening complication.8 This has led the US Food and Drug Administration (FDA) to require sirolimus to carry a black-box warning, and most transplant centers avoid using it in the first 30 days after transplantation.
Dyslipidemia is perhaps the most common adverse effect of sirolimus. Others include dose-related cytopenia and wound dehiscence.9
Everolimus has yet to be established for use in liver transplantation, although safety trials have been published.10,11 The FDA currently recommends against using it in the first 30 days after liver transplantation.
Both sirolimus and everolimus are metabolized by CYP3A4, which is the same metabolic pathway used by cyclosporine and tacrolimus. Hence, drugs that inhibit CYP3A4 may significantly impair clearance of both sirolimus and everolimus.
Corticosteroids
Corticosteroids have been the cornerstone of immunosuppression and remain the first line of treatment for acute allograft rejection. High intravenous doses of corticosteroids are usually started in the peritransplant period and are then switched to oral doses, which are tapered and continued with a fixed dose such as 20 mg of prednisone daily for 3 to 6 months after transplantation. However, some transplant centers keep patients on prednisone 5 mg/day indefinitely.
Adverse effects of corticosteroids include diabetes, salt and fluid retention, hypertension, hyperlipidemia, cosmetic changes (acne, cervical fat pad or “buffalo hump”), delayed wound healing, susceptibility to infection, cataracts, osteopenia, and potential adrenal suppression.12 There is concern that the use of these drugs may increase hepatitis C virus replication in patients who received a liver transplant for hepatitis C cirrhosis. Randomized trials have yielded conflicting results.13–15
Drug interactions
Certain drugs can affect the metabolism of calcineurin inhibitors and mTOR inhibitors by inducing CYP3A4, which results in decreasing the levels of the immunosuppressive drugs, or by inhibiting CYP3A4, which has the opposite effect.
Medications that can decrease the levels of calcineurin inhibitors and mTOR inhibitors:
Selected antibiotics are generally well tolerated, such as penicillins, cephalosporins, quinolones, sulfonamides, and topical antifungal agents.
LONG-TERM COMPLICATIONS
Figure 1.
Figure 1 summarizes the common long-term complications of liver transplantation.
Hypertension
The prevalence of hypertension after liver transplantation is 40% to 85%, which is markedly higher than in patients with chronic liver disease before liver transplantation.17,18
One of the factors contributing to this increase is the use of immunosuppressive medications. Of these drugs, cyclosporine seems to be the one that most often causes an increase in both the incidence and the severity of hypertension, as it produces widespread vasoconstriction.19 Corticosteroids cause hypertension through their mineralocorticoid effects.
The diagnostic cutoffs for hypertension (ie, 140/90 mm Hg) and the treatment goals in posttransplant patients are similar to those in the general population. However, at our institution we target a blood pressure of less than 130/80 mm Hg in transplant patients because they have a high prevalence of other cardiovascular risk factors such as diabetes, obesity, and renal insufficiency.20
Dihydropyridine calcium channel blockers such as amlodipine and nifedipine are considered the best first-line agents because they dilate renal afferent arterioles, an effect that may counteract the vasoconstriction mediated by calcineurin inhibitors. Nondihydropyridine calcium channel blockers such as diltiazem and verapamil tend to have more marked negative inotropic effects and are not recommended in liver transplant recipients because they increase the levels of calcineurin inhibitors.21
Diuretics (eg, furosemide) might be the second-line agents, especially in patients with peripheral edema.16 One should be vigilant for hyperuricemia if thiazide agents are used.
Angiotensin-converting-enzyme (ACE) inhibitors and angiotensin II receptor blockers (ARBs) are typically avoided in the early posttransplant period, but they can be started later and have additional benefits in patients with diabetes and congestive heart failure. Starting ACE inhibitors is acceptable in these patients unless there is a contraindication such as allergy to ACE inhibitors, hypotension, history of bilateral renal artery stenosis, significant hyperkalemia, or acute kidney injury. Monitor the serum potassium level closely for hyperkalemia in patients concurrently using calcineurin inhibitors.
Alpha-blockers and beta-blockers can be used as add-on therapy in patients with uncontrolled hypertension with the exception of carvedilol, because it increases the levels of calcineurin inhibitors.22
Blood pressure monitoring by the primary care physician is recommended every 6 months after the early posttransplant period, or more frequently when changes in treatment are being considered.
If hypertension continues to be inadequately controlled despite treatment, changing the immunosuppressive drugs or decreasing the doses can be considered, but the transplant hepatologist must be involved in this decision.23,24
Diabetes mellitus
The prevalence of diabetes mellitus is higher in liver transplant recipients than in the general population, reaching 30% to 40%.17,25 In addition to preexisting diabetes, 15% of liver transplant recipients develop new-onset diabetes.26,27
Risk factors for developing diabetes after liver transplantation include African American or Hispanic ethnicity, obesity, family history, pretransplant diabetes, hepatitis C virus infection, use of corticosteroids, and use of calcineurin inhibitors (tacrolimus more than cyclosporine) and sirolimus.26
In addition to increasing the risk of cardiovascular disease and other diseases, diabetes decreases both patient and graft survival after liver transplantation.28
The management of diabetes and the treatment target after transplantation should follow the American Diabetes Association guidelines for the treatment of type 2 diabetes mellitus.29 Lifestyle modifications, diet, and exercise are as important for transplant patients as for the nontransplant population. Insulin therapy is usually needed in the early posttransplant period to control blood glucose levels well, especially with the high doses of corticosteroids used during the first few weeks. No trials to date have compared oral agents in posttransplant patients. Therefore, the choice of oral hypoglycemic agents should be individualized on the basis of the patient’s characteristics and comorbidities.
Screen all liver transplant recipients for diabetes regardless of their pretransplant status
We recommend that primary care providers screen all liver transplant recipients for diabetes regardless of their pretransplant status. This can be done by obtaining regular fasting blood glucose levels or a hemoglobin A1c level every 6 months. Additionally, liver transplant recipients diagnosed with diabetes require annual eye examinations to look for cataracts and diabetes-related changes.30
Dyslipidemia
On November 12, 2013, the American College of Cardiology and the American Heart Association (ACC/AHA) released new clinical practice guidelines for treating blood cholesterol levels.31,32 According to these new guidelines, there are four groups of patients for whom treatment with statins is clearly indicated:
Patients with cardiovascular disease
Patients with low-density lipoprotein cholesterol (LDL-C) levels ≥ 190 mg/dL
Patients 40 to 75 years old with type 2 diabetes
Patients 40 to 75 years old with an estimated 10-year risk of cardiovascular disease of 7.5% or greater.
Liver transplant recipients should be evaluated on an individual basis to see if they fit in any of the four groups and if statin treatment therefore needs to be initiated.
A few things need to be kept in mind. First, the incidence of dyslipidemia after liver transplantation is estimated to be 45% to 69%. Risk factors include obesity, diabetes mellitus, cholestatic liver disease, and immunosuppressant medications.33 Sirolimus has a significant and well-documented association with dyslipidemia. Cyclosporine and corticosteroids are also strongly associated with dyslipidemia. Tacrolimus has a minor effect, and mycophenolate mofetil and azathioprine have no significant effects on serum lipid levels.16
Second, of the seven currently marketed statins, pravastatin and fluvastatin are preferred in liver transplant recipients because they are not metabolized by the same cytochrome CYP3A4 pathway that metabolizes calcineurin inhibitors and sirolimus.34 The doses of 40 to 80 mg daily of pravastatin or 40 mg twice daily of fluvastatin lower low-density lipoprotein cholesterol (LDL-C) levels by approximately 30% to 35%. However, these two agents are considered “moderate-intensity” statins according to the new ACC/AHA guidelines. The only two “high-intensity” statins are atorvastatin (40–80 mg) and rosuvastatin (20–40 mg), but they are both metabolized by CYP3A4. Therefore it is prudent to avoid them with the concurrent use of a calcineurin inhibitor or tacrolimus.
Gemfibrozil does not lower LDL-C and should not be used concomitantly with statins due to unacceptable risk of rhabdomyolysis and myopathy. Fenofibrates are usually avoided due to potential nephrotoxicity in patients receiving cyclosporine. Bile acid sequestrants (cholestyramine, colestipol, colesevelam) can decrease plasma mycophenolate mofetil levels by 35%.16,35 Thus, these agents should be avoided if mycophenolate mofetil is used.
It is reasonable to screen all liver transplant recipients with a fasting lipid profile at 3, 6, and 12 months after transplantation and annually thereafter. Creatine kinase should be measured if the patient complains of severe muscle pain or weakness but not on a routine basis.
Obesity
Approximately one-third of patients who are of normal weight at the time of transplantation will become obese afterward.18,25 Corticosteroid use is an important risk factor for posttransplant obesity, and tapering these drugs helps reduce weight.36 Patients treated with cyclosporine are more likely to gain weight than those who receive tacrolimus.37
Of importance: nonalcoholic fatty liver disease, currently the most common cause of chronic liver disease in adults, is rapidly increasing as an indication for liver transplantation. In fact, the proportion of liver transplantation procedures for nonalcoholic steatohepatitis-related cirrhosis increased from 1.2% in 2001 to 9.7% in 2009, and nonalcoholic steatohepatitis is expected to become the leading indication for liver transplantation in the next 20 years. And because nonalcoholic fatty liver disease is directly linked to obesity, the prevalence of obesity as a complication of liver transplantation will most likely increase in the near future.
Overweight liver transplant recipients may have great difficulty losing weight. Treatment starts with patient education on caloric restriction and exercise. If traditional measures fail to result in adequate weight loss, additional options include switching from cyclosporine to tacrolimus.23
Bariatric surgery may become an option for posttransplant patients. In a recent case series from the University of Minnesota, Al-Nowaylati et al38 reported their experience with seven patients who underwent orthotopic liver transplantation and then open Roux-en-Y gastric bypass. After bariatric surgery, the patients’ mean body mass index declined significantly, and glycemic control and high-density lipoprotein cholesterol (HDL-C) levels improved. However, one patient died of multiple organ failure, to which the bariatric surgery might have contributed.38
Heimbach et al39 conducted a study in patients referred for liver transplantation for whom a rigorous noninvasive weight-loss program before transplantation had failed. The researchers performed combined liver transplantation and sleeve gastrectomy in seven carefully selected patients who had failed to achieve weight loss to a body mass index less than 35 kg/m2 before transplantation. All seven patients lost weight, decreasing their mean body mass index from 49 kg/m2 before the procedure to 29 kg/m2 at last follow-up, and none of them developed posttransplant diabetes or steatosis.
At this time, there is not enough evidence to recommend concurrent orthotopic liver transplantation plus bariatric surgery, or combined orthotopic liver transplantation and sleeve gastrectomy. More study is needed to further evaluate these advanced approaches.
Posttransplant metabolic syndrome
Metabolic syndrome is common after liver transplantation and is strongly associated with increased morbidity in this patient population.40,41 The general definition of metabolic syndrome includes a combination of at least three of the following: hypertension, insulin resistance, hypertriglyceridemia, low HDL-C, and obesity.
The prevalence of metabolic syndrome is higher in patients after liver transplantation than in nontransplant patients. In a review of 252 liver transplant recipients, 52% were diagnosed with posttransplant metabolic syndrome, but only 5% had had it pretransplant.42
Careful screening for posttransplant metabolic syndrome and early recognition of risk factors are important. Nevertheless, the treatment of this condition depends on treating its components according to recommended guidelines.41
Cardiovascular disease
The incidence of cardiovascular morbidity and death is increased after liver transplantation.24 In addition, after liver transplantation, cardiovascular disease is a major cause of death unrelated to liver disease. It accounts for 12% to 16% of deaths and is the third most common cause of late mortality after liver transplantation.43 Of note, a recent study by our group demonstrated that patients undergoing liver transplantation for nonalcoholic steatohepatitis had a significantly higher risk of a cardiovascular event during the 3 years after transplantation than patients undergoing liver transplantation for cholestatic liver disease.44
Risk factors for cardiovascular disease after liver transplantation include older age at transplantation, male sex, posttransplant diabetes, posttransplant hypertension, and the use of mycophenolate mofetil.44 Modifying the risk factors is essential in decreasing the risk of cardiovascular events.
It is reasonable to perform dobutamine stress testing every 3 to 5 years in patients with multiple risk factors for cardiovascular disease, or more frequently in those with preexisting coronary artery disease.45,46
Malignancy
The risk of several malignancies increases after liver transplantation. Liver transplant recipients have an incidence of cancer 2.1 to 4.3 times greater than age- and sex-matched controls.24,47–49
Skin cancers are the most common and account for almost 40% of malignancies in organ transplant recipients.50 Whereas basal cell carcinoma is more common in the general population, squamous cell carcinoma is equally common in liver transplant recipients.
Multiple clinical studies have linked calcineurin inhibitors and azathioprine to the development of skin cancer. Annual skin examinations in addition to avoiding other risk factors such as smoking and sun exposure are generally recommended. Changing the immunosuppressants to sirolimus in high-risk patients may lower their chance of developing skin cancer.51,52
Patients with ulcerative colitis who undergo liver transplantation because of sclerosing cholangitis are at higher risk of colon cancer and require annual colonoscopy with surveillance biopsies. Patients who undergo transplantation for alcoholic liver disease seem to have a higher risk of pulmonary and oropharyngeal cancers.53,54
It is important that transplant patients adhere to recommended cancer screening guidelines, in view of their increased risk. Studies have shown improved overall survival in liver transplant recipients who underwent intensive cancer surveillance.55
Renal insufficiency
Renal insufficiency is a well-recognized complication of liver transplantation and is associated with an increased long-term death rate.56,57
The incidence of renal insufficiency increases dramatically over time. Ojo et al,57 in a study of almost 37,000 liver transplant recipients, found that the incidence of chronic kidney disease (defined as an estimated glomerular filtration rate < 30 mL/min/1.73 m2) was 13.9% at 3 years, 18% at 5 years, and approximately 26% at 10 years.
Risk factors include the use of calcineurin inhibitors (both cyclosporine and tacrolimus), older age, female sex, lower pretransplant glomerular filtration rate, postoperative acute renal failure, diabetes, hypertension, hepatitis C virus infection, and transplantation before 1998.58,59 Replacing a calcineurin inhibitor with mycophenolate mofetil or sirolimus may be considered with communication with the transplant center, as mycophenolate mofetil or sirolimus are associated with a lower risk of renal injury.60–64
All liver transplant recipients should avoid nonsteroidal anti-inflammatory drugs and nephrotoxic medications
Starting 1 year after liver transplantation, primary care providers should screen for renal dysfunction by obtaining kidney function tests every 6 months, including urinalysis and microalbuminuria assessment. Equations for estimating the glomerular filtration rate used in practice, such as the Modification of Diet in Renal Disease Study equation, rely mainly on serum creatinine, which may lead to overestimating renal function in some circumstances. Therefore, other equations can be used to confirm the estimated glomerular filtration rate measured by creatinine clearance, and to more accurately evaluate kidney function. Calculators are available at www.kidney.org/professionals/kdoqi/gfr_calculator.
All liver transplant recipients should avoid nonsteroidal anti-inflammatory drugs and nephrotoxic medications, and should have their hypertension and diabetes adequately controlled.
Bone diseases
Osteopenia is another major complication of liver transplantation. One-third of liver transplant recipients have a bone mineral density below the fracture threshold.65
Multiple factors contribute to increased bone loss after transplantation, including use of corticosteroids, use of calcineurin inhibitors (cyclosporine, tacrolimus), poor nutrition, vitamin D deficiency, immobility, sarcopenia (reduced muscle mass), hypogonadism, smoking, and alcohol abuse.66 Even at low doses of less than 7.5 mg per day, corticosteroids inhibit osteoblast activity and increase bone resorption.
Studies have reported rapid bone loss at around 6 months after transplantation.67–69 However, long-term follow-up of bone mineral density up to 15 years after transplantation revealed an improvement mainly in the 2nd postoperative year, with no deterioration afterward.65
High-risk patients need to be identified early with appropriate screening and evaluation. Evaluation includes dual-energy x-ray absorptiometry and serum levels of calcium, phosphorous, parathyroid hormone, testosterone (men), estradiol (women), and alpha-25-hydroxyvitamin D. These tests are typically done before transplantation and then every other year afterward.
We recommend a daily dose of calcitriol and a calcium supplement to all our liver transplant patients.70 If osteoporosis (a T-score 2.5 or more standard deviations below the mean) or a fragility fracture occurs, then the patient may benefit from an oral bisphosphonate. Calcitonin has also been shown to improve bone mineral density in patients with osteoporosis after liver transplantation.71
Hyperuricemia and gout
Although hyperuricemia is common in liver transplant recipients (reported in approximately 47%), the development of clinical gout is less common (6%).72 Asymptomatic hyperuricemia requires observation only and is not usually treated in liver transplant recipients.
Acute attacks of gout are typically managed with colchicine 0.6 mg every 2 hours, up to five doses. Prednisone can be considered if symptoms persist despite treatment with colchicine. Allopurinol in an initial dose of 100 mg daily is used as maintenance therapy to reduce production of uric acid.73 However, because of the potential for drug interactions, the combination of azathioprine and allopurinol should be avoided.
Psychiatric complications and quality of life
Depression is common in liver transplant recipients, significantly more so in patients who received a transplant because of hepatitis C.74 The type of immunosuppressant is not associated with the incidence of depression. When indicated, the internist may start the patient on a selective serotonin reuptake inhibitor such as citalopram 20 mg daily, as these medications are usually effective and well tolerated in liver transplant patients.73
Liver transplantation has a major positive effect on quality of life. Most patients with end-stage liver disease have poor quality of life before transplantation, but this seems to improve notably afterward. A meta-analysis showed significant improvement in posttransplant physical health, sexual functioning, daily activities, and social functioning compared with before transplantation.75
Alcohol abuse and smoking
Patients who underwent liver transplantation because of alcoholic liver disease should be advised to abstain from alcohol.19 Patients who underwent the procedure for a different indication are advised to avoid excessive alcohol intake, as it is proven to lower the survival rate.20 Alcohol recidivism and smoking (including marijuana) are major problems, and internists are best positioned to address these issues and treat them.
Vaccinations
All liver transplant recipients should be vaccinated against influenza, pneumococcal infection, and tetanus. Hepatitis A and B vaccines are typically given before transplantation. In general, live vaccines such as measles-mumps-rubella and varicella are not recommended after any solid organ transplant.76
A study in Germany showed that immunization rates were too low in solid-organ transplant recipients, and almost 90% of patients were not adequately informed about immunizations.77 Hence, there may be room for improvement, and primary care providers should take the lead toward better outcomes in this regard.
Recurrence of the primary liver disease after transplantation
Different primary liver diseases recur with different frequencies.
Hepatitis C has the highest rate of recurrence of the liver diseases.78,79 Reinfection with hepatitis C virus after liver transplantation is almost universal and can follow different patterns. One of the most aggressive patterns is fibrosing cholestatic hepatitis, which frequently leads to graft failure and death, and hence necessitates urgent detection and treatment.
Hepatocellular carcinoma also has a high recurrence rate.80 Surveillance with liver ultrasonography or computed tomography is required every 6 months for the first 5 years after liver transplantation.
Other liver diseases. Nonalcoholic steatohepatitis, primary biliary cirrhosis, primary sclerosing cholangitis, autoimmune hepatitis, and hepatitis B infection also tend to recur after liver transplantation.46,81 On the other hand, alpha-1 antitrypsin deficiency, Wilson disease, hemochromatosis, and metabolic disorders are “cured” after liver transplantation.
It is important to detect any increase in liver enzymes above baseline. An elevation of 1.5 times the upper limit of normal or more should trigger further investigation.
Allograft dysfunction
A number of complications can develop in the liver allograft and result in abnormal liver function tests and, if not treated, graft failure. The most common causes of late graft dysfunction include recurrence of primary liver disease, biliary complications, and chronic rejection.46
Vascular complications include hepatic artery thrombosis and stenosis and are usually evaluated by liver ultrasonography and Doppler scan of the hepatic artery and venous structures.24
Biliary strictures give a cholestatic picture, with elevated bilirubin and greater elevation of alkaline phosphatase than of alanine aminotransferase and aspartate aminotransferase. Strictures are usually treated by endoscopic dilation and stenting, but they may eventually require surgery.
Late acute cellular rejections occur in 10% to 20% of cases and are a risk factor for chronic rejection. Liver biopsy is needed to make the diagnosis, and pulsed doses of corticosteroids remain the backbone of treatment therapy.
Chronic rejection is not common, occurring in 3% to 4% of liver transplant recipients.46 Treatment is based on increasing immunosuppression and ensuring compliance with prescribed medications. However, chronic rejection may not respond well, and repeat transplantation may be the last resort for some patients.
WHEN TO REFER TO THE HEPATOLOGIST
Some situations require referral to the hepatologist or the transplant center. In general, the following are best managed by a hepatologist: adjustment of immunosuppressive drugs and dosages, allograft dysfunction, vascular and biliary complications, progressing renal dysfunction, and recurrence of primary liver disease. Early communication with a hepatologist and the transplant center is recommended in these cases.
References
Starzl TE, Marchioro TL, Vonkaulla KN, Hermann G, Brittain RS, Waddell WR. Homotransplantation of the liver in humans. Surg Gynecol Obstet 1963; 117:659–676.
Matas AJ, Smith JM, Skeans MA, et al. OPTN/SRTR 2011 annual data report: kidney. Am J Transplant 2013; 13(suppl 1):11–46.
McCashland TM. Posttransplantation care: role of the primary care physician versus transplant center. Liver Transpl 2001; 7(suppl 1):S2–S12.
Heller JC, Prochazka AV, Everson GT, Forman LM. Long-term management after liver transplantation: primary care physician versus hepatologist. Liver Transpl 2009; 15:1330–1335.
McAlister VC, Haddad E, Renouf E, Malthaner RA, Kjaer MS, Gluud LL. Cyclosporin versus tacrolimus as primary immunosuppressant after liver transplantation: a meta-analysis. Am J Transplant 2006; 6:1578–1585.
Neuhaus P, Klupp J, Langrehr JM. mTOR inhibitors: an overview. Liver Transpl 2001; 7:473–484.
Sehgal SN. Rapamune (RAPA, rapamycin, sirolimus): mechanism of action immunosuppressive effect results from blockade of signal transduction and inhibition of cell cycle progression. Clin Biochem 1998; 31:335–340.
Asrani SK, Wiesner RH, Trotter JF, et al. De novo sirolimus and reduced-dose tacrolimus versus standard-dose tacrolimus after liver transplantation: the 2000-2003 phase II prospective randomized trial. Am J Transplant 2014; 14:356–366.
Montalbano M, Neff GW, Yamashiki N, et al. A retrospective review of liver transplant patients treated with sirolimus from a single center: an analysis of sirolimus-related complications. Transplantation 2004; 78:264–268.
Everson GT. Everolimus and mTOR inhibitors in liver transplantation: opening the “box.” Liver Transpl 2006; 12:1571–1573.
Levy G, Schmidli H, Punch J, et al. Safety, tolerability, and efficacy of everolimus in de novo liver transplant recipients: 12- and 36-month results. Liver Transpl 2006; 12:1640–1648.
Toniutto P, Fabris C, Fumolo E, et al. Prevalence and risk factors for delayed adrenal insufficiency after liver transplantation. Liver Transpl 2008; 14:1014–1019.
Klintmalm GB, Davis GL, Teperman L, et al. A randomized, multicenter study comparing steroid-free immunosuppression and standard immunosuppression for liver transplant recipients with chronic hepatitis C. Liver Transpl 2011; 17:1394–1403.
Llado L, Fabregat J, Castellote J, et al. Impact of immunosuppression without steroids on rejection and hepatitis C virus evolution after liver transplantation: results of a prospective randomized study. Liver Transpl 2008; 14:1752–1760.
Lake JR. Immunosuppression and outcomes of patients transplanted for hepatitis C. J Hepatol 2006; 44:627–629.
Sohn AJ, Jeon H, Ahn J. Primary care of the liver transplant recipient. Prim Care 2011; 38:499–514.
Laish I, Braun M, Mor E, Sulkes J, Harif Y, Ben Ari Z. Metabolic syndrome in liver transplant recipients: prevalence, risk factors, and association with cardiovascular events. Liver Transpl 2011; 17:15–22.
Stegall MD, Everson G, Schroter G, Bilir B, Karrer F, Kam I. Metabolic complications after liver transplantation. Diabetes, hypercholesterolemia, hypertension, and obesity. Transplantation 1995; 60:1057–1060.
Textor SC, Canzanello VJ, Taler SJ, et al. Cyclosporine-induced hypertension after transplantation. Mayo Clin Proc 1994; 69:1182–1193.
Prevention, detection, evaluation, and treatment of hypertension. The Sixth Report of the Joint National Committee. National Institutes of Health-National Heart, Lung, and Blood Institute. National High Blood Pressure Education Programme. Indian Heart J 1999; 51:381–396.
Frishman WH. Calcium channel blockers: differences between subclasses. Am J Cardiovasc Drugs 2007; 7(suppl 1):17–23.
Galioto A, Semplicini A, Zanus G, et al. Nifedipine versus carvedilol in the treatment of de novo arterial hypertension after liver transplantation: results of a controlled clinical trial. Liver Transpl 2008; 14:1020–1028.
Neal DA, Gimson AE, Gibbs P, Alexander GJ. Beneficial effects of converting liver transplant recipients from cyclosporine to tacrolimus on blood pressure, serum lipids, and weight. Liver Transpl 2001; 7:533–539.
Singh S, Watt KD. Long-term medical management of the liver transplant recipient: what the primary care physician needs to know. Mayo Clin Proc 2012; 87:779–790.
Bianchi G, Marchesini G, Marzocchi R, Pinna AD, Zoli M. Metabolic syndrome in liver transplantation: relation to etiology and immunosuppression. Liver Transpl 2008; 14:1648–1654.
Lane JT, Dagogo-Jack S. Approach to the patient with new-onset diabetes after transplant (NODAT). J Clin Endocrinol Metab 2011; 96:3289–3297.
Wilkinson A, Davidson J, Dotta F, et al. Guidelines for the treatment and management of new-onset diabetes after transplantation. Clin Transplant 2005; 19:291–298.
Moon JI, Barbeito R, Faradji RN, Gaynor JJ, Tzakis AG. Negative impact of new-onset diabetes mellitus on patient and graft survival after liver transplantation: long-term follow up. Transplantation 2006; 82:1625–1628.
American Diabetes Association. Standards of medical care in diabetes—2012. Diabetes Care 2012; 35(suppl 1):S11–S63.
Marchetti P. New-onset diabetes after liver transplantation: from pathogenesis to management. Liver Transpl 2005; 11:612–620.
Stone NJ, Robinson J, Lichtenstein AH, et al; American College of Cardiology/American Heart Association Task Force on Practice Guidelines. 2013 ACC/AHA guideline on the treatment of blood cholesterol to reduce atherosclerotic cardiovascular risk in adults: a report of the American College of Cardiology/American Heart Association Task Force on Practice Guidelines. Circulation 2014; 129(suppl 2):S1–S45.
National Cholesterol Education Program (NCEP) Expert Panel on Detection, Evaluation, and Treatment of High Blood Cholesterol in Adults (Adult Treatment Panel III). Third Report of the National Cholesterol Education Program (NCEP) Expert Panel on Detection, Evaluation, and Treatment of High Blood Cholesterol in Adults (Adult Treatment Panel III) final report. Circulation 2002; 106:3143–3421.
Gisbert C, Prieto M, Berenguer M, et al. Hyperlipidemia in liver transplant recipients: prevalence and risk factors. Liver Transpl Surg 1997; 3:416–422.
Asberg A. Interactions between cyclosporin and lipid-lowering drugs: implications for organ transplant recipients. Drugs 2003; 63:367–378.
Bullingham RE, Nicholls AJ, Kamm BR. Clinical pharmacokinetics of mycophenolate mofetil. Clin Pharmacokinet 1998; 34:429–455.
Everhart JE, Lombardero M, Lake JR, Wiesner RH, Zetterman RK, Hoofnagle JH. Weight change and obesity after liver transplantation: incidence and risk factors. Liver Transpl Surg 1998; 4:285–296.
Canzanello VJ, Schwartz L, Taler SJ, et al. Evolution of cardiovascular risk after liver transplantation: a comparison of cyclosporine A and tacrolimus (FK506). Liver Transpl Surg 1997; 3:1–9.
Al-Nowaylati AR, Al-Haddad BJ, Dorman RB, et al. Gastric bypass after liver transplantation. Liver Transpl 2013; 19:1324–1329.
Heimbach JK, Watt KD, Poterucha JJ, et al. Combined liver transplantation and gastric sleeve resection for patients with medically complicated obesity and end-stage liver disease. Am J Transplant 2013; 13:363–368.
Watt KD, Charlton MR. Metabolic syndrome and liver transplantation: a review and guide to management. J Hepatol 2010; 53:199–206.
Pagadala M, Dasarathy S, Eghtesad B, McCullough AJ. Posttransplant metabolic syndrome: an epidemic waiting to happen. Liver Transpl 2009; 15:1662–1670.
Alberti KG, Eckel RH, Grundy SM, et al. Harmonizing the metabolic syndrome: a joint interim statement of the International Diabetes Federation Task Force on Epidemiology and Prevention; National Heart, Lung, and Blood Institute; American Heart Association; World Heart Federation; International Atherosclerosis Society; and International Association for the Study of Obesity. Circulation 2009; 120:1640–1645.
Watt KD, Pedersen RA, Kremers WK, Heimbach JK, Charlton MR. Evolution of causes and risk factors for mortality post-liver transplant: results of the NIDDK long-term follow-up study. Am J Transplant 2010; 10:1420–1427.
Albeldawi M, Aggarwal A, Madhwal S, et al. Cumulative risk of cardiovascular events after orthotopic liver transplantation. Liver Transpl 2012; 18:370–375.
Gibbons RJ, Balady GJ, Bricker JT, et al. ACC/AHA 2002 guideline update for exercise testing: summary article: a report of the American College of Cardiology/American Heart Association Task Force on Practice Guidelines (Committee to Update the 1997 Exercise Testing Guidelines). Circulation 2002; 106:1883–1892.
Aberg F, Isoniemi H, Höckerstedt K. Long-term results of liver transplantation. Scand J Surg 2011; 100:14–21.
Aberg F, Pukkala E, Höckerstedt K, Sankila R, Isoniemi H. Risk of malignant neoplasms after liver transplantation: a population-based study. Liver Transpl 2008; 14:1428–1436.
Mells G, Neuberger J. Long-term care of the liver allograft recipient. Semin Liver Dis 2009; 29:102–120.
Herrero JI. De novo malignancies following liver transplantation: impact and recommendations. Liver Transpl 2009; 15(suppl 2):S90–S94.
Euvrard S, Kanitakis J, Claudy A. Skin cancers after organ transplantation. N Engl J Med 2003; 348:1681–1691.
Euvrard S, Morelon E, Rostaing L, et al; TUMORAPA Study Group. Sirolimus and secondary skin-cancer prevention in kidney transplantation. N Engl J Med 2012; 367:329–339.
Salgo R, Gossmann J, Schofer H, et al. Switch to a sirolimus-based immunosuppression in long-term renal transplant recipients: reduced rate of (pre-)malignancies and nonmelanoma skin cancer in a prospective, randomized, assessor-blinded, controlled clinical trial. Am J Transplant 2010; 10:1385–1393.
Narumi S, Roberts JP, Emond JC, Lake J, Ascher NL. Liver transplantation for sclerosing cholangitis. Hepatology 1995; 22:451–457.
Knechtle SJ, D’Alessandro AM, Harms BA, Pirsch JD, Belzer FO, Kalayoglu M. Relationships between sclerosing cholangitis, inflammatory bowel disease, and cancer in patients undergoing liver transplantation. Surgery 1995; 118:615–620.
Finkenstedt A, Graziadei IW, Oberaigner W, et al. Extensive surveillance promotes early diagnosis and improved survival of de novo malignancies in liver transplant recipients. Am J Transplant 2009; 9:2355–2361.
Fisher NC, Nightingale PG, Gunson BK, Lipkin GW, Neuberger JM. Chronic renal failure following liver transplantation: a retrospective analysis. Transplantation 1998; 66:59–66.
Ojo AO, Held PJ, Port FK, et al. Chronic renal failure after transplantation of a nonrenal organ. N Engl J Med 2003; 349:931–940.
Klintmalm GB, Gonwa TA. Nephrotoxicity associated with cyclosporine and FK506. Liver Transpl Surg 1995; 1:11–19.
A comparison of tacrolimus (FK506) and cyclosporine for immunosuppression in liver transplantation. The US Multicenter FK506 Liver Study Group. N Engl J Med 1994; 331:1110–1115.
Neff GW, Montalbano M, Slapak-Green G, et al. Sirolimus therapy in orthotopic liver transplant recipients with calcineurin inhibitor related chronic renal insufficiency. Transplant Proc 2003; 35:3029–3031.
Cotterell AH, Fisher RA, King AL, et al. Calcineurin inhibitor-induced chronic nephrotoxicity in liver transplant patients is reversible using rapamycin as the primary immunosuppressive agent. Clin Transplant 2002; 16(suppl 7):49–51.
Manzia TM, De Liguori Carino N, Orlando G, et al. Use of mycophenolate mofetil in liver transplantation: a literature review. Transplant Proc 2005; 37:2616–2617.
Schlitt HJ, Barkmann A, Boker KH, et al. Replacement of calcineurin inhibitors with mycophenolate mofetil in liver-transplant patients with renal dysfunction: a randomised controlled study. Lancet 2001; 357:587–591.
Hodge EE, Reich DJ, Clavien PA, Kim-Schluger L. Use of mycophenolate mofetil in liver transplant recipients experiencing renal dysfunction on cyclosporine or tacrolimus-randomized, prospective, multicenter study results. Transplant Proc 2002; 34:1546–1547.
Hamburg SM, Piers DA, van den Berg AP, Slooff MJ, Haagsma EB. Bone mineral density in the long term after liver transplantation. Osteoporos Int 2000; 11:600–606.
Maalouf NM, Shane E. Osteoporosis after solid organ transplantation. J Clin Endocrinol Metab 2005; 90:2456–2465.
Crosbie OM, Freaney R, McKenna MJ, Curry MP, Hegarty JE. Predicting bone loss following orthotopic liver transplantation. Gut 1999; 44:430–434.
Giannini S, Nobile M, Ciuffreda M, et al. Long-term persistence of low bone density in orthotopic liver transplantation. Osteoporos Int 2000; 11:417–424.
Monegal A, Navasa M, Guanabens N, et al. Bone disease after liver transplantation: a long-term prospective study of bone mass changes, hormonal status and histomorphometric characteristics. Osteoporos Int 2001; 12:484–492.
Neuhaus R, Lohmann R, Platz KP, et al. Treatment of osteoporosis after liver transplantation. Transplant Proc 1995; 27:1226–1227.
Valero MA, Loinaz C, Larrodera L, Leon M, Moreno E, Hawkins F. Calcitonin and bisphosphonates treatment in bone loss after liver transplantation. Calcif Tissue Int 1995; 57:15–19.
Neal DA, Tom BD, Gimson AE, Gibbs P, Alexander GJ. Hyperuricemia, gout, and renal function after liver transplantation. Transplantation 2001; 72:1689–1691.
Schiff ER, Sorrell MF, Maddrey WC, editors. Schiff’s Diseases of the Liver. 10th ed. Philadephia, PA: Lippincott Williams & Wilkins; 2007.
Tombazzi CR, Waters B, Shokouh-Amiri MH, Vera SR, Riely CA. Neuropsychiatric complications after liver transplantation: role of immunosuppression and hepatitis C. Dig Dis Sci 2006; 51:1079–1081.
Bravata DM, Olkin I, Barnato AE, Keeffe EB, Owens DK. Health-related quality of life after liver transplantation: a meta-analysis. Liver Transpl Surg 1999; 5:318–331.
Danziger-Isakov L, Kumar D; AST Infectious Diseases Community of Practice. Vaccination in solid organ transplantation. Am J Transplant 2013; 13(suppl 4):311–317.
Chesi C, Gunther M, Huzly D, et al. Immunization of liver and renal transplant recipients: a seroepidemiological and sociodemographic survey. Transpl Infect Dis 2009; 11:507–512.
Berenguer M, Lopez-Labrador FX, Wright TL. Hepatitis C and liver transplantation. J Hepatol 2001; 35:666–678.
Forman LM, Lewis JD, Berlin JA, Feldman HI, Lucey MR. The association between hepatitis C infection and survival after orthotopic liver transplantation. Gastroenterology 2002; 122:889–896.
Benten D, Staufer K, Sterneck M. Orthotopic liver transplantation and what to do during follow-up: recommendations for the practitioner. Nat Clin Pract Gastroenterol Hepatol 2009; 6:23–36.
Kotlyar DS, Campbell MS, Reddy KR. Recurrence of diseases following orthotopic liver transplantation. Am J Gastroenterol 2006; 101:1370–1378.
Tacrolimus and cyclosporine are the most commonly used immunosuppressive agents in liver transplant recipients. Adverse effects include hypertension, hypercholesterolemia, diabetes (more common with tacrolimus), renal insufficiency, and osteoporosis.
Hypertension affects 40% to 85% of liver transplant patients. Dihydropyridine calcium channel blockers (eg, amlodipine, nifedipine) are the first-line agents.
Cardiovascular disease is the third most common cause of death after liver transplantation. Modifying risk factors is essential.
Skin cancers account for 40% of all cancers after liver transplantation. Intensive screening is required and has been proven to lower the risk of death.
A 40-year-old man with end-stage renal disease on intermittent hemodialysis presented to the emergency department with a 1-week history of pain affecting his left lower back, left flank, and left lower abdomen, diagnosed as zoster prodrome.
Figure 1. Marked corneal opacification, noted in both eyes, was most severe in the limbus.
Of note, both corneas were cloudy, most severely in the limbus (Figure 1). His visual acuity and findings on funduscopic examination were normal.
CORNEAL OPACITY
The finding of corneal opacity should prompt an immediate ophthalmologic evaluation by the internist as well as an ophthalmologist. The initial examination should include visual acuity testing; gross examination with the naked eye; penlight examination of the pupil, conjunctiva, and anteriorchamber; funduscopic examination to at least confirm a red reflex; and fluorescein examination of the cornea. Fluorescein testing is done last, as the dye may interfere with the other initial tests.1
A number of causes of opacity
A number of conditions can cause corneal opacity. Several genetic conditions can cause developmental anomalies of the cornea, leading to corneal defects present at birth.2 Causes of secondary corneal opacity in early infancy include infections such as herpes, iatrogenic injury during amniocentesis or forceps delivery, and infantile congenital glaucoma.2
Later in life, causes of corneal opacity include cataract, glaucoma, chemical exposure, foreign body injury, irradiation, infection (eg, syphilis, herpes, chlamydia), endophthalmitis, and metabolic genetic disorders such as Fabry disease, trisomy 18 syndrome, and lecithin-cholesterol acyltransferase (LCAT) deficiency.3
LCAT DEFICIENCY
LCAT is a key protein in reverse transport of cholesterol from the systemic circulation to the liver for excretion into the bile. Its deficiency results in low serum concentrations of high-density lipoprotein cholesterol (HDL-C).4 About 80 different mutations in the LCAT gene have been linked to LCAT deficiency.5
LCAT deficiency varies in severity. Patients with complete deficiency can have nearly undetectable levels of HDL-C, eruptive xanthoma, hepatosplenomegaly, and premature coronary artery disease (ie, by age 40).5,6 Features of coronary atherosclerosis can be lacking in patients with partial deficiency.
Regardless of the degree of LCAT deficiency, most patients have corneal opacification that is most severe near the limbus (thus, the term “fish eye syndrome”) and anemia.7 Although corneal opacification presents early in life and persists, it does not seem to affect vision.5 The anemia is associated with enhanced fractional clearance of red blood cells secondary to hypersplenism.8
LCAT deficiency and the kidneys
LCAT deficiency has its most devastating effect on the kidney. Renal disease begins early in life with mild proteinuria and microscopic hematuria. With increasing age, renal function deteriorates and proteinuria and hematuria worsen.9
Renal biopsy study may reveal foam cells in the glomerular tufts, arterioles with thickened intima and narrowed lumens, and subendothelial deposits of lipids in the renal arteries and arterioles.10 Some studies have suggested that kidney disease is most likely initiated by lipid deposition or cellular uptake of lipoproteins in the glomerular basement membrane, mesangium, and capillary subendothelium.
Treatment
There are few treatment options for patients with LCAT deficiency. Control of hypertension, if present, may halt or slow renal deterioration.5 Many patients eventually require dialysis, and some undergo renal transplantation, but the renal disease can recur.
OUR PATIENT
Our patient had a known diagnosis of LCAT deficiency. Five years before this presentation at our emergency department, he developed malignant hypertension, followed shortly by renal disease. Over the next 4 years, his kidney function deteriorated, culminating in the need for dialysis; his corneal opacities manifested and gradually worsened; and after extensive studies including kidney biopsies, he was finally diagnosed with LCAT deficiency.
He also exhibited a chronically low level of HDL-C (2 to 5 mg/dL) and significant coronary artery disease. Although unrelated, his zoster pain was treated with renally dosed acyclovir and gabapentin. He never demonstrated the characteristic rash, and his pain improved significantly within 5 days of treatment.
References
Knox KA, McIntee J. Nurse management of corneal abrasion. Br J Nurs 1995; 4:440–460.
Nischal KK. Congenital corneal opacities—a surgical approach to nomenclature and classification. Eye (Lond) 2007; 21:1326–1337.
Chiapella AP, Rosenthal AR. One year in an eye casualty clinic. Br J Ophthalmol 1985; 69:865–870.
Rosenson RS, Brewer HB Jr, Davidson WS, et al. Cholesterol efflux and atheroprotection: advancing the concept of reverse cholesterol transport. Circulation 2012; 125:1905–1919.
Roshan B, Ganda OP, Desilva R, et al. Homozygous lecithin:cholesterol acyltransferase (LCAT) deficiency due to a new loss of function mutation and review of the literature. J Clin Lipidol 2011; 5:493–499.
Kuivenhoven JA, van Voorst tot Voorst EJ, Wiebusch H, et al. A unique genetic and biochemical presentation of fish-eye disease. J Clin Invest 1995; 96:2783–2791.
Palmiero PM, Sbeity Z, Liebmann J, Ritch R. In vivo imaging of the cornea in a patient with lecithin-cholesterol acyltransferase deficiency. Cornea 2009; 28:1061–1064.
Norum KR, Gjone E. Familial serum-cholesterol esterification failure. A new inborn error of metabolism. Biochim Biophys Acta 1967; 144:698–700.
Gjone E, Norum KR. Familial serum cholesterol ester deficiency. Clinical study of a patient with a new syndrome. Acta Med Scand 1968; 183:107–112.
Lager DJ, Rosenberg BF, Shapiro H, Bernstein J. Lecithin cholesterol acyltransferase deficiency: ultrastructural examination of sequential renal biopsies. Mod Pathol 1991; 4:331–335.
Omer Ibrahim, MD Department of Dermatology, Cleveland Clinic
Linda Amah, MD Department of Internal Medicine, Cleveland Clinic
Sharon E. Mace, MD, FACEP, FAAP Professor of Medicine, Cleveland Clinic Lerner College of Medicine of Case Western University, Cleveland, OH; Director of Research and Director of Observation Unit, Emergency Services Institute, Cleveland Clinic; Faculty, Emergency Medicine Residency Program, MetroHealth Medical Center/Cleveland Clinic, Cleveland, OH
Address: Omer Ibrahim, MD, Department of Dermatology, A61, Cleveland Clinic, 9500 Euclid Avenue, Cleveland, OH 44195; e-mail: ibrahio@ccf.org
Author and Disclosure Information
Omer Ibrahim, MD Department of Dermatology, Cleveland Clinic
Linda Amah, MD Department of Internal Medicine, Cleveland Clinic
Sharon E. Mace, MD, FACEP, FAAP Professor of Medicine, Cleveland Clinic Lerner College of Medicine of Case Western University, Cleveland, OH; Director of Research and Director of Observation Unit, Emergency Services Institute, Cleveland Clinic; Faculty, Emergency Medicine Residency Program, MetroHealth Medical Center/Cleveland Clinic, Cleveland, OH
Address: Omer Ibrahim, MD, Department of Dermatology, A61, Cleveland Clinic, 9500 Euclid Avenue, Cleveland, OH 44195; e-mail: ibrahio@ccf.org
A 40-year-old man with end-stage renal disease on intermittent hemodialysis presented to the emergency department with a 1-week history of pain affecting his left lower back, left flank, and left lower abdomen, diagnosed as zoster prodrome.
Figure 1. Marked corneal opacification, noted in both eyes, was most severe in the limbus.
Of note, both corneas were cloudy, most severely in the limbus (Figure 1). His visual acuity and findings on funduscopic examination were normal.
CORNEAL OPACITY
The finding of corneal opacity should prompt an immediate ophthalmologic evaluation by the internist as well as an ophthalmologist. The initial examination should include visual acuity testing; gross examination with the naked eye; penlight examination of the pupil, conjunctiva, and anteriorchamber; funduscopic examination to at least confirm a red reflex; and fluorescein examination of the cornea. Fluorescein testing is done last, as the dye may interfere with the other initial tests.1
A number of causes of opacity
A number of conditions can cause corneal opacity. Several genetic conditions can cause developmental anomalies of the cornea, leading to corneal defects present at birth.2 Causes of secondary corneal opacity in early infancy include infections such as herpes, iatrogenic injury during amniocentesis or forceps delivery, and infantile congenital glaucoma.2
Later in life, causes of corneal opacity include cataract, glaucoma, chemical exposure, foreign body injury, irradiation, infection (eg, syphilis, herpes, chlamydia), endophthalmitis, and metabolic genetic disorders such as Fabry disease, trisomy 18 syndrome, and lecithin-cholesterol acyltransferase (LCAT) deficiency.3
LCAT DEFICIENCY
LCAT is a key protein in reverse transport of cholesterol from the systemic circulation to the liver for excretion into the bile. Its deficiency results in low serum concentrations of high-density lipoprotein cholesterol (HDL-C).4 About 80 different mutations in the LCAT gene have been linked to LCAT deficiency.5
LCAT deficiency varies in severity. Patients with complete deficiency can have nearly undetectable levels of HDL-C, eruptive xanthoma, hepatosplenomegaly, and premature coronary artery disease (ie, by age 40).5,6 Features of coronary atherosclerosis can be lacking in patients with partial deficiency.
Regardless of the degree of LCAT deficiency, most patients have corneal opacification that is most severe near the limbus (thus, the term “fish eye syndrome”) and anemia.7 Although corneal opacification presents early in life and persists, it does not seem to affect vision.5 The anemia is associated with enhanced fractional clearance of red blood cells secondary to hypersplenism.8
LCAT deficiency and the kidneys
LCAT deficiency has its most devastating effect on the kidney. Renal disease begins early in life with mild proteinuria and microscopic hematuria. With increasing age, renal function deteriorates and proteinuria and hematuria worsen.9
Renal biopsy study may reveal foam cells in the glomerular tufts, arterioles with thickened intima and narrowed lumens, and subendothelial deposits of lipids in the renal arteries and arterioles.10 Some studies have suggested that kidney disease is most likely initiated by lipid deposition or cellular uptake of lipoproteins in the glomerular basement membrane, mesangium, and capillary subendothelium.
Treatment
There are few treatment options for patients with LCAT deficiency. Control of hypertension, if present, may halt or slow renal deterioration.5 Many patients eventually require dialysis, and some undergo renal transplantation, but the renal disease can recur.
OUR PATIENT
Our patient had a known diagnosis of LCAT deficiency. Five years before this presentation at our emergency department, he developed malignant hypertension, followed shortly by renal disease. Over the next 4 years, his kidney function deteriorated, culminating in the need for dialysis; his corneal opacities manifested and gradually worsened; and after extensive studies including kidney biopsies, he was finally diagnosed with LCAT deficiency.
He also exhibited a chronically low level of HDL-C (2 to 5 mg/dL) and significant coronary artery disease. Although unrelated, his zoster pain was treated with renally dosed acyclovir and gabapentin. He never demonstrated the characteristic rash, and his pain improved significantly within 5 days of treatment.
References
Knox KA, McIntee J. Nurse management of corneal abrasion. Br J Nurs 1995; 4:440–460.
Nischal KK. Congenital corneal opacities—a surgical approach to nomenclature and classification. Eye (Lond) 2007; 21:1326–1337.
Chiapella AP, Rosenthal AR. One year in an eye casualty clinic. Br J Ophthalmol 1985; 69:865–870.
Rosenson RS, Brewer HB Jr, Davidson WS, et al. Cholesterol efflux and atheroprotection: advancing the concept of reverse cholesterol transport. Circulation 2012; 125:1905–1919.
Roshan B, Ganda OP, Desilva R, et al. Homozygous lecithin:cholesterol acyltransferase (LCAT) deficiency due to a new loss of function mutation and review of the literature. J Clin Lipidol 2011; 5:493–499.
Kuivenhoven JA, van Voorst tot Voorst EJ, Wiebusch H, et al. A unique genetic and biochemical presentation of fish-eye disease. J Clin Invest 1995; 96:2783–2791.
Palmiero PM, Sbeity Z, Liebmann J, Ritch R. In vivo imaging of the cornea in a patient with lecithin-cholesterol acyltransferase deficiency. Cornea 2009; 28:1061–1064.
Norum KR, Gjone E. Familial serum-cholesterol esterification failure. A new inborn error of metabolism. Biochim Biophys Acta 1967; 144:698–700.
Gjone E, Norum KR. Familial serum cholesterol ester deficiency. Clinical study of a patient with a new syndrome. Acta Med Scand 1968; 183:107–112.
Lager DJ, Rosenberg BF, Shapiro H, Bernstein J. Lecithin cholesterol acyltransferase deficiency: ultrastructural examination of sequential renal biopsies. Mod Pathol 1991; 4:331–335.
A 24-year-old woman from northern India came to our medical center because of lower back pain for the past 2 years. The pain was initially a dull, continuous ache and did not radiate. She had no fever, night sweats, weight loss, or other constitutional symptoms.
In addition, she had seen her local practitioner 1 year earlier because of burning during urination and occasional frequency. She had been found to have an 8-mm calculus in the lower calyx of the left kidney, for which she underwent two sessions of shock-wave lithotripsy, but she did not pass any stone fragments. Because her back pain continued, she sought medical treatment at our center.
On evaluation at our facility, she was found to have paraspinal muscle spasm and scoliosis. Her gait was antalgic. Sensations were normal over both lower limbs in all dermatomes. Power was grade 5 throughout, and deep tendon reflexes were normal. The straight-leg-raising test was positive for reproducible pain in the lower back and sciatic pain radiating down the back of both legs.
Laboratory testing showed that her hemoglobin was low at 9.7 g/dL (reference range 11.5–15.5), but the rest of the complete blood cell count was within normal limits. C-reactive protein was elevated at 70.7 mg/L (reference range < 6 mg/L). An enzyme-linked immunosorbent assay was negative for human immunodeficiency virus (HIV).
Figure 1. Noncontrast computed tomography shows bilateral large psoas abscesses (red arrows) and destruction of the vertebral plate.
Nonenhanced computed tomography of the abdomen revealed destruction of vertebral body end plates and disks from the L2 lower end plate to the L5 superior end plate. The left transverse processes of the L3, L4, and L5 vertebral bodies were also destroyed. The scan also revealed bilateral psoas abscesses larger than 10 by 10 cm (Figure 1), with the right side larger than the left, and confirmed a stone in the left lower renal calyx (Figure 2).
Figure 2. A coronal reconstructed tomographic image shows involve-ment of multiple vertebral bodies (red arrows), as well as an 8-mmcalculus in the lower left renal calyx (yellow arrow).
She underwent bilateral ultrasonographically guided drainage of the abscesses. Culture of the thick pus that was aspirated grew Mycobacterium tuberculosis. Tuberculosis therapy was started with isoniazid, rifampicin, pyrazinamide, and ethambutol. Her condition improved rapidly over the next 2 to 3 months. She completed 18 months of tuberculosis therapy.
Because her spine was stable, with no collapse of vertebrae, she did not require orthopedic intervention.
SPINAL TUBERCULOSIS
Spinal tuberculosis, or Pott disease, is still a common cause of back pain in areas where the infection is rampant, such as northern India.1Mycobacterium infections continue to be a problem, especially coexisting with HIV infection.2,3 In fact, the World Health Organization and the United States Agency for International Development have referred to this as a twin epidemic.4
Early diagnosis and prompt treatment can prevent or minimize spinal deformity and permanent neurologic disability.5 Rapidly progressive and significant neurologic involvement requires surgical management. On the other hand, Patil et al6 reported a series of 50 cases in which early radiologic evidence of spinal cord compression from tuberculosis was managed nonoperatively.
When evaluating back pain, symptoms that should ring the alarm include weight loss, constitutional symptoms, no change in pain status after 6 weeks of treatment with a nonsteroidal anti-inflammatory drug, pain at night or at rest, and neurologic symptoms. Our patient had no relief of pain and thus sought treatment.
An important take-home message is that small, nonobstructive renal calculi almost never cause back pain, and when incidentally detected, as in this patient, should not be considered the cause of back pain.
References
McLain RF, Isada C. Spinal tuberculosis deserves a place on the radar screen. Cleve Clin J Med 2004; 71:537–549.
Vermund SH, Yamamoto N. Co-infection with human immunodeficiency virus and tuberculosis in Asia. Tuberculosis (Edinb) 2007; 87(suppl 1):S18–S25.
Candy S, Chang G, Andronikou S. Acute myelopathy or cauda equina syndrome in HIV-positive adults in a tuberculosis endemic setting: MRI, clinical, and pathologic findings. AJNR Am J Neuroradiol 2014; 35:1634–1641.
Jain AK. Tuberculosis of the spine: a fresh look at an old disease. J Bone Joint Surg Br 2010; 92:905–913.
Patil SS, Mohite S, Varma R, Bhojraj SY, Nene AM. Non-surgical management of cord compression in tuberculosis: a series of surprises. Asian Spine J 2014; 8:315–321.
John Samuel Banerji, MS (General Surgery), MCh (Urology), DNB (Urology) Associate Professor, Department of Urology, Christian Medical College, Vellore, India; Fellow in Urologic Oncology, Section of Urology and Renal Transplantation, Virginia Mason Medical Center, Seattle, WA
Address: John Samuel Banerji, MS (General Surgery), MCh (Urology), DNB (Urology), Associate Professor, Department of Urology, Christian Medical College, Vellore, Ida Scudder Road, Tamil Nadu 632004, India; e-mail: johnsbanerji@cmcvellore.ac.in
Author and Disclosure Information
John Samuel Banerji, MS (General Surgery), MCh (Urology), DNB (Urology) Associate Professor, Department of Urology, Christian Medical College, Vellore, India; Fellow in Urologic Oncology, Section of Urology and Renal Transplantation, Virginia Mason Medical Center, Seattle, WA
Address: John Samuel Banerji, MS (General Surgery), MCh (Urology), DNB (Urology), Associate Professor, Department of Urology, Christian Medical College, Vellore, Ida Scudder Road, Tamil Nadu 632004, India; e-mail: johnsbanerji@cmcvellore.ac.in
A 24-year-old woman from northern India came to our medical center because of lower back pain for the past 2 years. The pain was initially a dull, continuous ache and did not radiate. She had no fever, night sweats, weight loss, or other constitutional symptoms.
In addition, she had seen her local practitioner 1 year earlier because of burning during urination and occasional frequency. She had been found to have an 8-mm calculus in the lower calyx of the left kidney, for which she underwent two sessions of shock-wave lithotripsy, but she did not pass any stone fragments. Because her back pain continued, she sought medical treatment at our center.
On evaluation at our facility, she was found to have paraspinal muscle spasm and scoliosis. Her gait was antalgic. Sensations were normal over both lower limbs in all dermatomes. Power was grade 5 throughout, and deep tendon reflexes were normal. The straight-leg-raising test was positive for reproducible pain in the lower back and sciatic pain radiating down the back of both legs.
Laboratory testing showed that her hemoglobin was low at 9.7 g/dL (reference range 11.5–15.5), but the rest of the complete blood cell count was within normal limits. C-reactive protein was elevated at 70.7 mg/L (reference range < 6 mg/L). An enzyme-linked immunosorbent assay was negative for human immunodeficiency virus (HIV).
Figure 1. Noncontrast computed tomography shows bilateral large psoas abscesses (red arrows) and destruction of the vertebral plate.
Nonenhanced computed tomography of the abdomen revealed destruction of vertebral body end plates and disks from the L2 lower end plate to the L5 superior end plate. The left transverse processes of the L3, L4, and L5 vertebral bodies were also destroyed. The scan also revealed bilateral psoas abscesses larger than 10 by 10 cm (Figure 1), with the right side larger than the left, and confirmed a stone in the left lower renal calyx (Figure 2).
Figure 2. A coronal reconstructed tomographic image shows involve-ment of multiple vertebral bodies (red arrows), as well as an 8-mmcalculus in the lower left renal calyx (yellow arrow).
She underwent bilateral ultrasonographically guided drainage of the abscesses. Culture of the thick pus that was aspirated grew Mycobacterium tuberculosis. Tuberculosis therapy was started with isoniazid, rifampicin, pyrazinamide, and ethambutol. Her condition improved rapidly over the next 2 to 3 months. She completed 18 months of tuberculosis therapy.
Because her spine was stable, with no collapse of vertebrae, she did not require orthopedic intervention.
SPINAL TUBERCULOSIS
Spinal tuberculosis, or Pott disease, is still a common cause of back pain in areas where the infection is rampant, such as northern India.1Mycobacterium infections continue to be a problem, especially coexisting with HIV infection.2,3 In fact, the World Health Organization and the United States Agency for International Development have referred to this as a twin epidemic.4
Early diagnosis and prompt treatment can prevent or minimize spinal deformity and permanent neurologic disability.5 Rapidly progressive and significant neurologic involvement requires surgical management. On the other hand, Patil et al6 reported a series of 50 cases in which early radiologic evidence of spinal cord compression from tuberculosis was managed nonoperatively.
When evaluating back pain, symptoms that should ring the alarm include weight loss, constitutional symptoms, no change in pain status after 6 weeks of treatment with a nonsteroidal anti-inflammatory drug, pain at night or at rest, and neurologic symptoms. Our patient had no relief of pain and thus sought treatment.
An important take-home message is that small, nonobstructive renal calculi almost never cause back pain, and when incidentally detected, as in this patient, should not be considered the cause of back pain.
References
McLain RF, Isada C. Spinal tuberculosis deserves a place on the radar screen. Cleve Clin J Med 2004; 71:537–549.
Vermund SH, Yamamoto N. Co-infection with human immunodeficiency virus and tuberculosis in Asia. Tuberculosis (Edinb) 2007; 87(suppl 1):S18–S25.
Candy S, Chang G, Andronikou S. Acute myelopathy or cauda equina syndrome in HIV-positive adults in a tuberculosis endemic setting: MRI, clinical, and pathologic findings. AJNR Am J Neuroradiol 2014; 35:1634–1641.
Jain AK. Tuberculosis of the spine: a fresh look at an old disease. J Bone Joint Surg Br 2010; 92:905–913.
Patil SS, Mohite S, Varma R, Bhojraj SY, Nene AM. Non-surgical management of cord compression in tuberculosis: a series of surprises. Asian Spine J 2014; 8:315–321.
Any time patients enter or leave the hospital, they risk being harmed by errors in their medications.1 Adverse events from medication errors during transitions of care are common but often preventable. One key approach is to systematically review every patient’s medication list on admission and discharge and resolve any discrepancies. These transitions are also an opportunity to address other medication-related problems, such as adherence, drug interactions, and clinical appropriateness.
This article summarizes the types and prevalence of medication problems that occur during hospital-based transitions of care, and suggests strategies to decrease the risk of medication errors, focusing on medication reconciliation and related interventions that clinicians can use at the bedside to improve medication safety.
DEFINING TERMS
A medication discrepancy is any variance noted in a patient’s documented medication regimen across different medication lists or sites of care. While some differences reflect intentional and clinically appropriate changes to the regimen, others are unintentional and reflect inaccurate or incomplete information. These unintentional discrepancies are medication errors.
Depending on the clinical circumstances and medications involved, such errors may lead to an adverse drug event (ADE), defined as actual harm or injury resulting from a medication. Sometimes a medication error does not cause harm immediately but could if left uncorrected; this is called a potential ADE.
An important goal during transitions of care is to reduce unintentional medication discrepancies, thereby reducing potential and actual ADEs.
ERRORS ARISE AT DISCHARGE—AND EVEN MORE AT ADMISSION
Hospital discharge is a widely recognized transition in which patient harm occurs. As many as 70% of patients may have an unintentional medication discrepancy at hospital discharge, with many of those discrepancies having potential for harm.2 Indeed, during the first few weeks after discharge, 50% of patients have a clinically important medication error,3 and 20% experience an adverse event, most commonly an ADE.4 ADEs are associated with excess health care utilization,5–7 and many are preventable through strategies such as medication reconciliation.5,8
Importantly, more errors arise at hospital admission than at other times.9,10
Errors in medication histories are the most common source of discrepancies, affecting up to two-thirds of admitted patients.11,12 More than one-quarter of hospital prescribing errors can be attributed to incomplete medication histories at the time of admission,13 and nearly three times as many clinically important medication discrepancies are related to history-taking errors on admission rather than reconciliation errors at discharge.9
Most discrepancies occurring at the time of admission have the potential to cause harm, particularly if the errors persist beyond discharge.14 Therefore, taking a complete and accurate medication history on hospital admission is critical to ensuring safe care transitions.
MEDICATION RECONCILIATION: BARRIERS AND FACILITATORS
Medication reconciliation is a strategy for reducing medication discrepancies in patients moving across care settings. Simply put, it is the process by which a patient’s medication list is obtained, compared, and clarified across different sites of care.15 It has consistently been shown to decrease medication errors compared with usual care,16 and it is strongly supported by national and international organizations.17–21
In clinical practice, many physicians and institutions have found medication reconciliation difficult to implement, owing to barriers at the level of the patient, provider, and system (Table 1). In response to these challenges, two initiatives have synthesized best practices and offer toolkits that hospitals and clinicians can use: the Medications at Transitions and Clinical Handoffs (MATCH) program22 and the Multi-Center Medication Reconciliation Quality Improvement Study (MARQUIS).23
Lack of resources is a widely acknowledged challenge. Thus, the MARQUIS investigators23 suggested focusing on the admission history, where most errors occur, and applying the most resource-intensive interventions in patients at highest risk of ADEs, ie, those who are elderly, have multiple comorbid conditions, or take numerous medications.16
Although the risk of an ADE increases with the number of medications a patient takes,4 the exact number of drugs that defines high risk has not been well established. Targeting patients who take 10 or more maintenance medications is a reasonable initial approach,24 but institutions should tailor risk stratification to their patient populations and available resources. Patients taking high-risk medications such as anticoagulants and insulin could also be prioritized for review, since these medications are more likely to cause serious patient harm when used without appropriate clinical oversight.7
Using pharmacy staff to perform medication history-taking, reconciliation, and patient counseling has been shown to produce favorable patient outcomes, particularly for higher-risk patients.16,23
The MARQUIS investigators found they could boost the chances of success by sharing stories of patient harm to foster “buy-in” among frontline staff, providing formal training to clinicians on how to take a medication history, and obtaining the support of nursing leaders to champion improvement efforts.23
Additionally, patients should be empowered to maintain an accurate medication list. We address strategies for improving patient engagement and adherence in a later section.
BEST PRACTICES FOR IMPROVING MEDICATION SAFETY
Medication reconciliation is one of several measures necessary to optimize medication safety during transitions of care. It typically includes the following actions:
Interview the patient or caregiver to determine the list of medications the patient is currently taking (or supposed to be taking); consult other sources if needed.
List medications that are being ordered during the clinical encounter.
Compare these two lists, making note of medications that are stopped, changed, or newly prescribed.
Resolve any discrepancies.
Communicate the reconciled list to the patient, appropriate caregivers, and providers of follow-up care.
At a rudimentary level, medication reconciliation encompasses medication list management along the continuum of care. However, we recommend leveraging medication reconciliation as an opportunity to further enhance medication safety by reviewing the appropriateness of each medication, seizing opportunities to streamline or simplify the regimen, assessing patient and caregiver understanding of medication instructions and potential ADEs, and delivering appropriate counseling to enhance medication use. Table 2 outlines our framework for medication management during hospital-based transitions.
STEP 1: OBTAIN A COMPLETE PREADMISSION MEDICATION LIST
The “best-possible medication history” is obtained in a systematic process of interviewing the patient or caregiver plus reviewing at least one other reliable source.23 The resulting list should include all medications the patient is taking (prescription and nonprescription), doses, directions for use, formulations if applicable, indications, start and stop dates, and medication allergies and reactions.
Review existing information. Before eliciting a history from the patient, review his or her recorded medical history and existing medication lists (eg, prior discharge summaries, records from other facilities, records from outpatient visits, pharmacy fill data). This will provide context about the regimen and help identify issues and questions that can be addressed during the history-taking.
Ask open-ended questions. Instead of just asking the patient to confirm the accuracy of the existing medication list, we recommend actively obtaining the full medication list from the patient or caregiver. The conversation should begin with an open-ended question such as, “What medications do you take at home?” This approach will also allow the clinician to gauge the patient’s level of understanding of each medication’s indication and dosing instructions. Using a series of prompts such as those recommended in Table 3 will elicit a best-possible medical history, while verifying all of the medications on the existing list.
Clarify discrepancies. Resolve differences between the existing medication lists and the patient’s or caregiver’s report during the preadmission interview. Examples include errors of omission (a medication is missing), errors of commission (an additional medication is present), and discrepancies in the strength, formulation, dosing instructions, and indications for the drugs. If necessary, other sources of information should be consulted, such as the patient’s medication bottles, pharmacy or pharmacies, primary care physician, and a family member or caregiver.
Assess adherence. The extent to which patients take their medications as directed is an important component of the history, but is often left out. Medication nonadherence rates in the United States are 40% to 70%,25 contributing to poor patient outcomes and imposing extraordinary costs on the health care system.26
Asking open-ended, nonjudgmental questions at the time of hospital admission will help to uncover medication-taking behaviors as well as barriers to adherence (Table 3). The patient’s responses should be taken into account when determining the treatment plan.
Document your findings. After completing the medication history and clarifying discrepancies, document the preadmission list in the medical record. All members of the health care team should have access to view and update the same list, as new information about the preadmission medications may be uncovered after the initial history.
Make clinical decisions. Complete the admission medication reconciliation by deciding whether each medication on the list should be continued, changed, held, or discontinued on the basis of the patient’s clinical condition. Well-designed information technology applications enable the provider to document each action and the rationale for it, as well as carry that information into the order-entry system. Medications marked as held or discontinued on admission should be revisited as the patient’s clinical condition changes and at discharge.
STEP 2: AVOID RECONCILIATION ERRORS
Reconciliation errors reflect discrepancies between the medication history and the medications that are ordered after admission.
Reconciliation errors are less common than medication history errors, accounting for approximately one-third of potentially harmful medication errors in hospitalized medical patients.9 These include errors of omission (a medication is omitted from the orders), errors of commission (a medication is prescribed with no indication for continuation), and therapeutic duplication.
Preventing errors of omission
Medications are often held at transition points for appropriate clinical reasons. Examples include holding anticoagulants and antiplatelet agents in patients who have gastrointestinal bleeding or an upcoming procedure, antihypertensives in patients with hemodynamic instability, and other chronic medications in patients with an acute illness.
Poor documentation and communication of these decisions can lead to a failure to resume the medications—an error of omission—at hospital discharge.
Hospitalized patients are at risk of unintentional discontinuation of their chronic medications, including antiplatelet drugs, anticoagulants, statins, and thyroid replacement, particularly if admitted to the intensive care unit.12 These errors can be minimized by a standardized medication reconciliation process at each transition and clear documentation of the medication plan.
Communication among providers can be improved if the admitting clinician documents clearly whether each preadmission medication is being continued, changed, or stopped, along with the reason for doing so, and makes this information available throughout the hospital stay. Upon transfer to another unit and at discharge, the physician should review each; preadmission medication that was held and the patient’s current clinical status and, based on that information, decide whether medications that were held should be resumed. If a medication will be restarted later, specific instructions should be documented and communicated to the patient and the physicians who are taking over his or her care.
Preventing errors of commission
Failure to perform a complete reconciliation at each transition of care and match each medication with an appropriate indication can lead to errors of commission.
One study showed that 44% of patients were prescribed at least one unnecessary drug at hospital discharge, one-fourth of which were started during the hospitalization.27 Commonly prescribed unnecessarily were gastrointestinal agents, central nervous system drugs, nutrients, and supplements.
It is critical to assess each medication’s ongoing need, appropriateness, and risk-benefit ratio at every transition. Medications no longer indicated should be discontinued in order to simplify the regimen, avoid unnecessary drug exposure, and prevent ADEs.
For example, proton pump inhibitors or histamine 2 receptor blockers are often started in the hospital for stress ulcer prophylaxis. One-third of patients are then discharged home on the medication, and 6 months later half of those patients are still taking the unnecessary drug.28 This situation can be avoided by limiting use of these medications to appropriate circumstances, clearly marking the indication as stress ulcer prophylaxis (as opposed to an ongoing condition that will require continuing it after discharge), and discontinuing the agent when appropriate.
All drugs, even common and seemingly benign ones, carry some risk and should be discontinued when no longer needed. Thus, medications added during the hospitalization to control acute symptoms should also be reviewed at each transition to prevent inappropriate continuation when symptoms have resolved.
One study, for example, found that many patients were discharged with inappropriate prescriptions for atypical antipsychotics after receiving them in the intensive care unit, likely for delirium.29 Documenting that an acute issue such as delirium has resolved should prompt the discontinuation of therapy.
Preventing therapeutic duplication
Therapeutic duplication occurs in about 8% of discharges.1 These errors often result from formulary substitutions or altering the dosage form in the acute setting. For example, patients who receive a prescription for the substituted agent at discharge and also resume their prehospitalization medications end up with duplicate therapy.
Therapeutic substitution is common at the time of admission to the hospital as a result of formulary restrictions. Drug classes that are frequently substituted include statins, antihypertensives, urinary antispasmodics, and proton pump inhibitors. Physicians should be familiar with the preferred agents on the hospital formulary and make careful note when a substitution occurs. Furthermore, hospital systems should be developed to remind the physician to switch back to the outpatient medication at discharge.
Similar problems occur when home medications are replaced with different dosage forms with different pharmacokinetic properties. For example, a long-acting medication may be temporarily replaced with an intravenous solution or immediate-release tablet for several reasons, including nothing-by-mouth status, unstable clinical condition, need for titration, and need to crush the tablet to give the drug per tube. The differing formulations must be reconciled throughout the patient’s hospital course and at discharge to avoid therapeutic duplication and serious medication errors. Deliberate changes to the dosage form should be clearly communicated in the discharge medication list so that patients and other clinicians are aware.
Hospital systems should also have the capability to identify duplications in the medication list and to warn prescribers of these errors. The ability to group medications by drug class or sort the medication list alphabetically by generic name can help uncover duplication errors.
STEP 3: REVIEW THE LIST IN VIEW OF THE CLINICAL PICTURE
Transitions of care should prompt providers to review the medication list for possible drug-disease interactions, confirm compliance with evidence-based guidelines, and evaluate the risks and benefits of each medication in the context of the patient’s age and acute and chronic medical issues. This is also an opportunity to screen the full list for potentially inappropriate medications and high-alert drugs such as insulin or anticoagulants, which are more likely than other drugs to cause severe harm when used in error.
Acute kidney injury. New drug-disease interactions can arise during a hospitalization and can affect dosing and the choice of drug. The onset of acute kidney injury, for example, often necessitates adjusting or discontinuing nephrotoxic and renally excreted medications. ADEs or potential ADEs have been reported in 43% of hospitalized patients with acute kidney injury.30
Because acute kidney injury is often transient, medications may need to be held or adjusted several times until renal function stabilizes. This can be challenging across the continuum of care and requires close monitoring of the serum creatinine level and associated drug doses and levels, if applicable. Well-designed clinical decision support tools can integrate laboratory data and alert the prescriber to a clinically important increase or decrease in serum creatinine that may warrant a change in therapy. Modifications to the regimen and a plan for timely follow-up of the serum creatinine level should be clearly documented in the discharge plan.
Liver disease. Similar attention should be given to drugs that are hepatically metabolized if a patient has acute or chronic liver impairment.
Geriatric patients, particularly those who present with altered mental status, falls, or urinary retention, should have their medication list reviewed for potentially inappropriate medications, which are drugs that pose increased risk of poor outcomes in older adults.31,32 Patients and providers may have been willing to accept the risk of medications such as anticholinergics or sedative-hypnotics when the drugs were initiated, but circumstances can change over time, especially in this patient population. Hospitalization is a prime opportunity to screen for medications that meet the Beers criteria31 for agents to avoid or use with caution in older adults.
As-needed medications. Medications prescribed on an as-needed basis in the hospital should be reviewed for continuation or discontinuation at discharge. How often the medication was given can inform this decision.
For example, if as-needed opioids were used frequently, failure to develop a plan of care for pain can lead to persistent symptoms and, possibly, to readmission.33,34 Similar scenarios occur with use of as-needed blood pressure medications, laxatives, and correction-dose insulin.
If an as-needed medication was used consistently during hospitalization, the physician should consider whether a regularly scheduled medication is needed. Conversely, if the medication was not used during the inpatient admission, it can likely be discontinued.
STEP 4: PREPARE THE PATIENT AND FOLLOW-UP PROVIDER
Once a clinician has performed medication reconciliation, including obtaining a best-possible medical history and carefully reviewing the medication list and orders for errors and clinical appropriateness, the next steps are to ensure the patient understands what he or she needs to do and to confirm that suitable follow-up plans are in place. These measures should be taken at all transitions of care but are critically important at hospital discharge.
Preparing the patient and caregiver
An accurate, reconciled medication list should be given to the patient, caregiver, or both, and should be reviewed before discharge.17
Approximately one-third of Americans have low health literacy skills, so medication lists and associated materials should be easy to understand.35 Medication lists should be written in plain language and formatted for optimal readability (Table 4), clearly stating which medications to continue, change, hold temporarily, and stop.
Patients recall and comprehend about half of the information provided during a medical encounter.36 Thus, medication teaching should focus on key points including changes or additions to the regimen, specific instructions for follow-up and monitoring, and how to handle common and serious side effects.
To confirm patient understanding, clinicians should use “teach-back,” ie, provide the patient with information and then ask him or her to repeat back key points.37,38 The patient and family should also be encouraged to ask questions before discharge.
If not already addressed during the hospital stay, barriers to medication adherence and ability to obtain the medications should be attended to at this time (Table 5). Also, the plan to pick up the medications should be verified with the patient and caregiver. Verify that there is transportation to a particular pharmacy that is open at the time of discharge, and that the patient can afford the medications.
Ensuring appropriate follow-up
Studies have shown that timely in-home or telephone follow-up after discharge can decrease adverse events and postdischarge health care utilization.39,40 Telephone follow-up that includes thorough medication reconciliation can help detect and resolve medication issues early after discharge and can close gaps related to monitoring and follow-up.
Medication reconciliation by telephone can be time-consuming. Depending on the number of medications that need to be reviewed, calls can take between 10 and 60 minutes. Postdischarge phone calls should be performed by clinical personnel who are able to identify medication-related problems. A pharmacist should be an available resource to assist with complex regimens, to help resolve medication discrepancies, and to address patient concerns. Table 6 provides tips for conducting follow-up phone calls.
Resolving discrepancies identified during follow-up calls can be difficult, as changes to the medication regimen are often not communicated effectively to other members of the care team. Physicians should document the complete medication list and plan in the discharge summary, and there should be a method for the caller to record updates to the medication list in the medical record so that they are apparent at the outpatient follow-up visit.
An additional challenge is that it is frequently unclear which physician “owns” which medications. Therefore, designating a contact person for each medication until follow-up can be very valuable. At a minimum, a “physician owner” for high-alert medications such as insulin, anticoagulants, and diuretics should be identified to provide close follow-up, titration, and monitoring.
There should also be a plan for the patient to obtain refills of essential long-term medications, such as antiplatelet agents following stent placement.
SUMMARY AND RECOMMENDATIONS
Medication-related problems during hospital admission and discharge are common and range from minor discrepancies in the medication list to errors in history-taking, prescribing, and reconciliation that can lead to potential or actual patient harm. Putting systems in place to facilitate medication reconciliation can decrease the occurrence of medication discrepancies and ADEs, thereby improving patient safety during these critical transitions between care settings and providers. Institutional medication reconciliation programs should focus resources on the admission history-taking step, target the highest-risk patients for the most intensive interventions, and involve pharmacy personnel when possible.
On an individual level, clinicians can incorporate additional interventions into their workflows to optimize medication safety for hospitalized patients. Using a structured approach to obtain a complete and accurate medication list at the time of hospital admission will help providers identify medication-related problems and prevent the propagation of errors throughout the hospital stay and at discharge. Focusing additional time and effort on a comprehensive review of the medication list for errors of omission and commission, patient-specific needs, and high-alert drugs will further decrease the risk of medication errors. Finally, providing discharge counseling targeting patient barriers to adherence and ensuring a proper handover of medication information and rationale for medication changes to outpatient providers will improve the chances of a safe transition.
References
Coleman EA, Smith JD, Raha D, Min SJ. Posthospital medication discrepancies: prevalence and contributing factors. Arch Intern Med 2005; 165:1842–1847.
Wong JD, Bajcar JM, Wong GG, et al. Medication reconciliation at hospital discharge: evaluating discrepancies. Ann Pharmacother 2008; 42:1373–1379.
Kripalani S, Roumie CL, Dalal AK, et al; PILL-CVD (Pharmacist Intervention for Low Literacy in Cardiovascular Disease) Study Group. Effect of a pharmacist intervention on clinically important medication errors after hospital discharge: a randomized trial. Ann Intern Med 2012; 157:1-10.
Forster AJ, Murff HJ, Peterson JF, Gandhi TK, Bates DW. The incidence and severity of adverse events affecting patients after discharge from the hospital. Ann Intern Med 2003; 138:161–167.
Forster AJ, Murff HJ, Peterson JF, Gandhi TK, Bates DW. Adverse drug events occurring following hospital discharge. J Gen Intern Med 2005; 20:317–323.
Johnson JA, Bootman JL. Drug-related morbidity and mortality. A cost-of-illness model. Arch Intern Med 1995; 155:1949–1956.
Budnitz DS, Lovegrove MC, Shehab N, Richards CL. Emergency hospitalizations for adverse drug events in older Americans. N Engl J Med 2011; 365:2002–2012.
Bates DW, Boyle DL, Vander Vliet MB, Schneider J, Leape L. Relationship between medication errors and adverse drug events. J Gen Intern Med 1995;10:199–205.
Pippins JR, Gandhi TK, Hamann C, et al. Classifying and predicting errors of inpatient medication reconciliation. J Gen Intern Med 2008; 23:1414–1422.
Lau HS, Florax C, Porsius AJ, De Boer A.The completeness of medication histories in hospital medical records of patients admitted to general internal medicine wards. Br J Clin Pharmacol 2000; 49:597–603.
Tam VC, Knowles SR, Cornish PL, Fine N, Marchesano R, Etchells EE. Frequency, type and clinical importance of medication history errors at admission to hospital: a systematic review. CMAJ 2005; 173:510–515.
Bell CM, Brener SS, Gunraj N, et al. Association of ICU or hospital admission with unintentional discontinuation of medications for chronic diseases. JAMA 2011; 306:840–847.
Dobranski S, Hammond I, Khan G, Holdsworth H. The nature of hospital prescribing errors. Br J Clin Governance 2002; 7:187–193.
Gleason KM, Groszek JM, Sullivan C, Rooney D, Barnard C, Noskin GA. Reconciliation of discrepancies in medication histories and admission orders of newly hospitalized patients. Am J Health Syst Pharm 2004; 61:1689–1695.
Rozich JD, Resar KR. Medication safety: one organization’s approach to the challenge. J Clin Outcomes Manage 2001; 8:27–34.
Mueller SK, Sponsler KC, Kripalani S, Schnipper JL. Hospital-based medication reconciliation practices: a systematic review. Arch Intern Med 2012; 172:1057–1069.
Greenwald JL, Halasyamani L, Greene J, et al. Making inpatient medication reconciliation patient centered, clinically relevant and implementable: a consensus statement on key principles and necessary first steps. J Hosp Med 2010; 5:477–485.
Berwick DM, Calkins DR, McCannon CJ, Hackbarth AD. The 100,000 lives campaign: setting a goal and a deadline for improving health care quality. JAMA 2006; 295:324–327.
McCannon CJ, Hackbarth AD, Griffin FA. Miles to go: an introduction to the 5 Million Lives Campaign. Jt Comm J Qual Patient Saf 2007; 33:477–484.
Leotsakos A, Caisley L, Karga M, Kelly E, O’Leary D, Timmons K. High 5s: addressing excellence in patient safety. World Hosp Health Serv 2009; 45:19–22.
Mueller SK, Kripalani S, Stein J, et al. A toolkit to disseminate best practices in inpatient medication reconciliation: multi-center medication reconciliation quality improvement study (MARQUIS). Jt Comm J Qual Patient Saf 2013; 39:371–382.
Pal A, Babbott S, Wilkinson ST. Can the targeted use of a discharge pharmacist significantly decrease 30-day readmissions? Hosp Pharm 2013; 48:380–388.
Claxton AJ, Cramer J, Pierce C. A systematic review of the associations between dose regimens and medication compliance. Clin Ther 2001; 23:1296–1310.
Osterberg L, Blaschke T. Adherence to medication. N Engl J Med 2005; 353:487–497.
Hajjar ER, Hanlon JT, Sloane RJ, et al. Unnecessary drug use in frail older people at hospital discharge. J Am Geriatr Soc 2005; 53:1518–1523.
Zink DA, Pohlman M, Barnes M, Cannon ME. Long-term use of acid suppression started inappropriately during hospitalization. Aliment Pharmacol Ther 2005; 21:1203–1209.
Morandi A, Vasilevskis E, Pandharipande PP, et al. Inappropriate medication prescriptions in elderly adults surviving an intensive care unit hospitalization. J Am Geriatr Soc 2013; 61:1128–1134.
Cox ZL, McCoy AB, Matheny ME, et al. Adverse drug events during AKI and its recovery. Clin J Am Soc Nephrol 2013; 8:1070–1078.
American Geriatrics Society 2012 Beers Criteria Update Expert Panel. American Geriatrics Society updated Beers Criteria for potentially inappropriate medication use in older adults. J Am Geriatr Soc 2012; 60:616–631.
Gallagher P, O’Mahony D. STOPP (Screening Tool of Older Persons’ potentially inappropriate Prescriptions): application to acutely ill elderly patients and comparison with Beers’ criteria. Age Ageing 2008; 37:673–679.
Tjia J, Bonner A, Briesacher BA, McGee S, Terrill E, Miller K. Medication discrepancies upon hospital to skilled nursing facility transitions. J Gen Intern Med 2009; 24:630–635.
Boockvar K, Fishman E, Kyriacou CK, Monias A, Gavi S, Cortes T. Adverse events due to discontinuations in drug use and dose changes in patients transferred between acute and long-term care facilities. Arch Intern Med 2004; 164:545–550.
Kutner M, Greenberg E, Jin Y, Paulsen C. The Health Literacy of America’s Adults: Results From the 2003 National Assessment of Adult Literacy. http://nces.ed.gov/pubs2006/2006483_1.pdf. Accessed March 31, 2015.
Crane JA. Patient comprehension of doctor-patient communication on discharge from the emergency department. J Emerg Med 1997; 15:1–7.
Schillinger D, Piette J, Grumbach K, et al. Closing the loop: physician communication with diabetic patients who have low health literacy. Arch Intern Med 2003; 163:83–90.
Coleman EA, Parry C, Chalmers S, Min SJ. The care transitions intervention: results of a randomized controlled trial. Arch Intern Med 2006; 166:1822–1828.
Jack BW, Chetty VK, Anthony D, et al. A reengineered hospital discharge program to decrease rehospitalization: a randomized trial. Ann Intern Med 2009; 150:178–187.
Kelly C. Sponsler, MD Assistant Professor, Section of Hospital Medicine, Division of General Internal Medicine and Public Health, Department of Medicine, Vanderbilt University, Nashville, TN; Staff Physician, VA Tennessee Valley Medical Center, Nashville, TN
Erin B. Neal, PharmD Clinical Pharmacist, Department of Pharmaceutical Services, Vanderbilt University; Vanderbilt Health Affiliated Network, Nashville, TN
Sunil Kripalani, MD, MSc Associate Professor, Section of Hospital Medicine, Division of General Internal Medicine and Public Health, Department of Medicine, Vanderbilt University, Nashville, TN; Center for Clinical Quality and Implementation Research; Center for Effective Health Communication, Nashville, TN
Address: Kelly C. Sponsler, MD, Assistant Professor, Section of Hospital Medicine, Department of Medicine, Vanderbilt University, 1215 21st Avenue South, Suite 6000 Medical Center East, North Tower, Nashville, TN 37232; e-mail: kelly.e.cunningham@Vanderbilt.Edu
Author and Disclosure Information
Kelly C. Sponsler, MD Assistant Professor, Section of Hospital Medicine, Division of General Internal Medicine and Public Health, Department of Medicine, Vanderbilt University, Nashville, TN; Staff Physician, VA Tennessee Valley Medical Center, Nashville, TN
Erin B. Neal, PharmD Clinical Pharmacist, Department of Pharmaceutical Services, Vanderbilt University; Vanderbilt Health Affiliated Network, Nashville, TN
Sunil Kripalani, MD, MSc Associate Professor, Section of Hospital Medicine, Division of General Internal Medicine and Public Health, Department of Medicine, Vanderbilt University, Nashville, TN; Center for Clinical Quality and Implementation Research; Center for Effective Health Communication, Nashville, TN
Address: Kelly C. Sponsler, MD, Assistant Professor, Section of Hospital Medicine, Department of Medicine, Vanderbilt University, 1215 21st Avenue South, Suite 6000 Medical Center East, North Tower, Nashville, TN 37232; e-mail: kelly.e.cunningham@Vanderbilt.Edu
Any time patients enter or leave the hospital, they risk being harmed by errors in their medications.1 Adverse events from medication errors during transitions of care are common but often preventable. One key approach is to systematically review every patient’s medication list on admission and discharge and resolve any discrepancies. These transitions are also an opportunity to address other medication-related problems, such as adherence, drug interactions, and clinical appropriateness.
This article summarizes the types and prevalence of medication problems that occur during hospital-based transitions of care, and suggests strategies to decrease the risk of medication errors, focusing on medication reconciliation and related interventions that clinicians can use at the bedside to improve medication safety.
DEFINING TERMS
A medication discrepancy is any variance noted in a patient’s documented medication regimen across different medication lists or sites of care. While some differences reflect intentional and clinically appropriate changes to the regimen, others are unintentional and reflect inaccurate or incomplete information. These unintentional discrepancies are medication errors.
Depending on the clinical circumstances and medications involved, such errors may lead to an adverse drug event (ADE), defined as actual harm or injury resulting from a medication. Sometimes a medication error does not cause harm immediately but could if left uncorrected; this is called a potential ADE.
An important goal during transitions of care is to reduce unintentional medication discrepancies, thereby reducing potential and actual ADEs.
ERRORS ARISE AT DISCHARGE—AND EVEN MORE AT ADMISSION
Hospital discharge is a widely recognized transition in which patient harm occurs. As many as 70% of patients may have an unintentional medication discrepancy at hospital discharge, with many of those discrepancies having potential for harm.2 Indeed, during the first few weeks after discharge, 50% of patients have a clinically important medication error,3 and 20% experience an adverse event, most commonly an ADE.4 ADEs are associated with excess health care utilization,5–7 and many are preventable through strategies such as medication reconciliation.5,8
Importantly, more errors arise at hospital admission than at other times.9,10
Errors in medication histories are the most common source of discrepancies, affecting up to two-thirds of admitted patients.11,12 More than one-quarter of hospital prescribing errors can be attributed to incomplete medication histories at the time of admission,13 and nearly three times as many clinically important medication discrepancies are related to history-taking errors on admission rather than reconciliation errors at discharge.9
Most discrepancies occurring at the time of admission have the potential to cause harm, particularly if the errors persist beyond discharge.14 Therefore, taking a complete and accurate medication history on hospital admission is critical to ensuring safe care transitions.
MEDICATION RECONCILIATION: BARRIERS AND FACILITATORS
Medication reconciliation is a strategy for reducing medication discrepancies in patients moving across care settings. Simply put, it is the process by which a patient’s medication list is obtained, compared, and clarified across different sites of care.15 It has consistently been shown to decrease medication errors compared with usual care,16 and it is strongly supported by national and international organizations.17–21
In clinical practice, many physicians and institutions have found medication reconciliation difficult to implement, owing to barriers at the level of the patient, provider, and system (Table 1). In response to these challenges, two initiatives have synthesized best practices and offer toolkits that hospitals and clinicians can use: the Medications at Transitions and Clinical Handoffs (MATCH) program22 and the Multi-Center Medication Reconciliation Quality Improvement Study (MARQUIS).23
Lack of resources is a widely acknowledged challenge. Thus, the MARQUIS investigators23 suggested focusing on the admission history, where most errors occur, and applying the most resource-intensive interventions in patients at highest risk of ADEs, ie, those who are elderly, have multiple comorbid conditions, or take numerous medications.16
Although the risk of an ADE increases with the number of medications a patient takes,4 the exact number of drugs that defines high risk has not been well established. Targeting patients who take 10 or more maintenance medications is a reasonable initial approach,24 but institutions should tailor risk stratification to their patient populations and available resources. Patients taking high-risk medications such as anticoagulants and insulin could also be prioritized for review, since these medications are more likely to cause serious patient harm when used without appropriate clinical oversight.7
Using pharmacy staff to perform medication history-taking, reconciliation, and patient counseling has been shown to produce favorable patient outcomes, particularly for higher-risk patients.16,23
The MARQUIS investigators found they could boost the chances of success by sharing stories of patient harm to foster “buy-in” among frontline staff, providing formal training to clinicians on how to take a medication history, and obtaining the support of nursing leaders to champion improvement efforts.23
Additionally, patients should be empowered to maintain an accurate medication list. We address strategies for improving patient engagement and adherence in a later section.
BEST PRACTICES FOR IMPROVING MEDICATION SAFETY
Medication reconciliation is one of several measures necessary to optimize medication safety during transitions of care. It typically includes the following actions:
Interview the patient or caregiver to determine the list of medications the patient is currently taking (or supposed to be taking); consult other sources if needed.
List medications that are being ordered during the clinical encounter.
Compare these two lists, making note of medications that are stopped, changed, or newly prescribed.
Resolve any discrepancies.
Communicate the reconciled list to the patient, appropriate caregivers, and providers of follow-up care.
At a rudimentary level, medication reconciliation encompasses medication list management along the continuum of care. However, we recommend leveraging medication reconciliation as an opportunity to further enhance medication safety by reviewing the appropriateness of each medication, seizing opportunities to streamline or simplify the regimen, assessing patient and caregiver understanding of medication instructions and potential ADEs, and delivering appropriate counseling to enhance medication use. Table 2 outlines our framework for medication management during hospital-based transitions.
STEP 1: OBTAIN A COMPLETE PREADMISSION MEDICATION LIST
The “best-possible medication history” is obtained in a systematic process of interviewing the patient or caregiver plus reviewing at least one other reliable source.23 The resulting list should include all medications the patient is taking (prescription and nonprescription), doses, directions for use, formulations if applicable, indications, start and stop dates, and medication allergies and reactions.
Review existing information. Before eliciting a history from the patient, review his or her recorded medical history and existing medication lists (eg, prior discharge summaries, records from other facilities, records from outpatient visits, pharmacy fill data). This will provide context about the regimen and help identify issues and questions that can be addressed during the history-taking.
Ask open-ended questions. Instead of just asking the patient to confirm the accuracy of the existing medication list, we recommend actively obtaining the full medication list from the patient or caregiver. The conversation should begin with an open-ended question such as, “What medications do you take at home?” This approach will also allow the clinician to gauge the patient’s level of understanding of each medication’s indication and dosing instructions. Using a series of prompts such as those recommended in Table 3 will elicit a best-possible medical history, while verifying all of the medications on the existing list.
Clarify discrepancies. Resolve differences between the existing medication lists and the patient’s or caregiver’s report during the preadmission interview. Examples include errors of omission (a medication is missing), errors of commission (an additional medication is present), and discrepancies in the strength, formulation, dosing instructions, and indications for the drugs. If necessary, other sources of information should be consulted, such as the patient’s medication bottles, pharmacy or pharmacies, primary care physician, and a family member or caregiver.
Assess adherence. The extent to which patients take their medications as directed is an important component of the history, but is often left out. Medication nonadherence rates in the United States are 40% to 70%,25 contributing to poor patient outcomes and imposing extraordinary costs on the health care system.26
Asking open-ended, nonjudgmental questions at the time of hospital admission will help to uncover medication-taking behaviors as well as barriers to adherence (Table 3). The patient’s responses should be taken into account when determining the treatment plan.
Document your findings. After completing the medication history and clarifying discrepancies, document the preadmission list in the medical record. All members of the health care team should have access to view and update the same list, as new information about the preadmission medications may be uncovered after the initial history.
Make clinical decisions. Complete the admission medication reconciliation by deciding whether each medication on the list should be continued, changed, held, or discontinued on the basis of the patient’s clinical condition. Well-designed information technology applications enable the provider to document each action and the rationale for it, as well as carry that information into the order-entry system. Medications marked as held or discontinued on admission should be revisited as the patient’s clinical condition changes and at discharge.
STEP 2: AVOID RECONCILIATION ERRORS
Reconciliation errors reflect discrepancies between the medication history and the medications that are ordered after admission.
Reconciliation errors are less common than medication history errors, accounting for approximately one-third of potentially harmful medication errors in hospitalized medical patients.9 These include errors of omission (a medication is omitted from the orders), errors of commission (a medication is prescribed with no indication for continuation), and therapeutic duplication.
Preventing errors of omission
Medications are often held at transition points for appropriate clinical reasons. Examples include holding anticoagulants and antiplatelet agents in patients who have gastrointestinal bleeding or an upcoming procedure, antihypertensives in patients with hemodynamic instability, and other chronic medications in patients with an acute illness.
Poor documentation and communication of these decisions can lead to a failure to resume the medications—an error of omission—at hospital discharge.
Hospitalized patients are at risk of unintentional discontinuation of their chronic medications, including antiplatelet drugs, anticoagulants, statins, and thyroid replacement, particularly if admitted to the intensive care unit.12 These errors can be minimized by a standardized medication reconciliation process at each transition and clear documentation of the medication plan.
Communication among providers can be improved if the admitting clinician documents clearly whether each preadmission medication is being continued, changed, or stopped, along with the reason for doing so, and makes this information available throughout the hospital stay. Upon transfer to another unit and at discharge, the physician should review each; preadmission medication that was held and the patient’s current clinical status and, based on that information, decide whether medications that were held should be resumed. If a medication will be restarted later, specific instructions should be documented and communicated to the patient and the physicians who are taking over his or her care.
Preventing errors of commission
Failure to perform a complete reconciliation at each transition of care and match each medication with an appropriate indication can lead to errors of commission.
One study showed that 44% of patients were prescribed at least one unnecessary drug at hospital discharge, one-fourth of which were started during the hospitalization.27 Commonly prescribed unnecessarily were gastrointestinal agents, central nervous system drugs, nutrients, and supplements.
It is critical to assess each medication’s ongoing need, appropriateness, and risk-benefit ratio at every transition. Medications no longer indicated should be discontinued in order to simplify the regimen, avoid unnecessary drug exposure, and prevent ADEs.
For example, proton pump inhibitors or histamine 2 receptor blockers are often started in the hospital for stress ulcer prophylaxis. One-third of patients are then discharged home on the medication, and 6 months later half of those patients are still taking the unnecessary drug.28 This situation can be avoided by limiting use of these medications to appropriate circumstances, clearly marking the indication as stress ulcer prophylaxis (as opposed to an ongoing condition that will require continuing it after discharge), and discontinuing the agent when appropriate.
All drugs, even common and seemingly benign ones, carry some risk and should be discontinued when no longer needed. Thus, medications added during the hospitalization to control acute symptoms should also be reviewed at each transition to prevent inappropriate continuation when symptoms have resolved.
One study, for example, found that many patients were discharged with inappropriate prescriptions for atypical antipsychotics after receiving them in the intensive care unit, likely for delirium.29 Documenting that an acute issue such as delirium has resolved should prompt the discontinuation of therapy.
Preventing therapeutic duplication
Therapeutic duplication occurs in about 8% of discharges.1 These errors often result from formulary substitutions or altering the dosage form in the acute setting. For example, patients who receive a prescription for the substituted agent at discharge and also resume their prehospitalization medications end up with duplicate therapy.
Therapeutic substitution is common at the time of admission to the hospital as a result of formulary restrictions. Drug classes that are frequently substituted include statins, antihypertensives, urinary antispasmodics, and proton pump inhibitors. Physicians should be familiar with the preferred agents on the hospital formulary and make careful note when a substitution occurs. Furthermore, hospital systems should be developed to remind the physician to switch back to the outpatient medication at discharge.
Similar problems occur when home medications are replaced with different dosage forms with different pharmacokinetic properties. For example, a long-acting medication may be temporarily replaced with an intravenous solution or immediate-release tablet for several reasons, including nothing-by-mouth status, unstable clinical condition, need for titration, and need to crush the tablet to give the drug per tube. The differing formulations must be reconciled throughout the patient’s hospital course and at discharge to avoid therapeutic duplication and serious medication errors. Deliberate changes to the dosage form should be clearly communicated in the discharge medication list so that patients and other clinicians are aware.
Hospital systems should also have the capability to identify duplications in the medication list and to warn prescribers of these errors. The ability to group medications by drug class or sort the medication list alphabetically by generic name can help uncover duplication errors.
STEP 3: REVIEW THE LIST IN VIEW OF THE CLINICAL PICTURE
Transitions of care should prompt providers to review the medication list for possible drug-disease interactions, confirm compliance with evidence-based guidelines, and evaluate the risks and benefits of each medication in the context of the patient’s age and acute and chronic medical issues. This is also an opportunity to screen the full list for potentially inappropriate medications and high-alert drugs such as insulin or anticoagulants, which are more likely than other drugs to cause severe harm when used in error.
Acute kidney injury. New drug-disease interactions can arise during a hospitalization and can affect dosing and the choice of drug. The onset of acute kidney injury, for example, often necessitates adjusting or discontinuing nephrotoxic and renally excreted medications. ADEs or potential ADEs have been reported in 43% of hospitalized patients with acute kidney injury.30
Because acute kidney injury is often transient, medications may need to be held or adjusted several times until renal function stabilizes. This can be challenging across the continuum of care and requires close monitoring of the serum creatinine level and associated drug doses and levels, if applicable. Well-designed clinical decision support tools can integrate laboratory data and alert the prescriber to a clinically important increase or decrease in serum creatinine that may warrant a change in therapy. Modifications to the regimen and a plan for timely follow-up of the serum creatinine level should be clearly documented in the discharge plan.
Liver disease. Similar attention should be given to drugs that are hepatically metabolized if a patient has acute or chronic liver impairment.
Geriatric patients, particularly those who present with altered mental status, falls, or urinary retention, should have their medication list reviewed for potentially inappropriate medications, which are drugs that pose increased risk of poor outcomes in older adults.31,32 Patients and providers may have been willing to accept the risk of medications such as anticholinergics or sedative-hypnotics when the drugs were initiated, but circumstances can change over time, especially in this patient population. Hospitalization is a prime opportunity to screen for medications that meet the Beers criteria31 for agents to avoid or use with caution in older adults.
As-needed medications. Medications prescribed on an as-needed basis in the hospital should be reviewed for continuation or discontinuation at discharge. How often the medication was given can inform this decision.
For example, if as-needed opioids were used frequently, failure to develop a plan of care for pain can lead to persistent symptoms and, possibly, to readmission.33,34 Similar scenarios occur with use of as-needed blood pressure medications, laxatives, and correction-dose insulin.
If an as-needed medication was used consistently during hospitalization, the physician should consider whether a regularly scheduled medication is needed. Conversely, if the medication was not used during the inpatient admission, it can likely be discontinued.
STEP 4: PREPARE THE PATIENT AND FOLLOW-UP PROVIDER
Once a clinician has performed medication reconciliation, including obtaining a best-possible medical history and carefully reviewing the medication list and orders for errors and clinical appropriateness, the next steps are to ensure the patient understands what he or she needs to do and to confirm that suitable follow-up plans are in place. These measures should be taken at all transitions of care but are critically important at hospital discharge.
Preparing the patient and caregiver
An accurate, reconciled medication list should be given to the patient, caregiver, or both, and should be reviewed before discharge.17
Approximately one-third of Americans have low health literacy skills, so medication lists and associated materials should be easy to understand.35 Medication lists should be written in plain language and formatted for optimal readability (Table 4), clearly stating which medications to continue, change, hold temporarily, and stop.
Patients recall and comprehend about half of the information provided during a medical encounter.36 Thus, medication teaching should focus on key points including changes or additions to the regimen, specific instructions for follow-up and monitoring, and how to handle common and serious side effects.
To confirm patient understanding, clinicians should use “teach-back,” ie, provide the patient with information and then ask him or her to repeat back key points.37,38 The patient and family should also be encouraged to ask questions before discharge.
If not already addressed during the hospital stay, barriers to medication adherence and ability to obtain the medications should be attended to at this time (Table 5). Also, the plan to pick up the medications should be verified with the patient and caregiver. Verify that there is transportation to a particular pharmacy that is open at the time of discharge, and that the patient can afford the medications.
Ensuring appropriate follow-up
Studies have shown that timely in-home or telephone follow-up after discharge can decrease adverse events and postdischarge health care utilization.39,40 Telephone follow-up that includes thorough medication reconciliation can help detect and resolve medication issues early after discharge and can close gaps related to monitoring and follow-up.
Medication reconciliation by telephone can be time-consuming. Depending on the number of medications that need to be reviewed, calls can take between 10 and 60 minutes. Postdischarge phone calls should be performed by clinical personnel who are able to identify medication-related problems. A pharmacist should be an available resource to assist with complex regimens, to help resolve medication discrepancies, and to address patient concerns. Table 6 provides tips for conducting follow-up phone calls.
Resolving discrepancies identified during follow-up calls can be difficult, as changes to the medication regimen are often not communicated effectively to other members of the care team. Physicians should document the complete medication list and plan in the discharge summary, and there should be a method for the caller to record updates to the medication list in the medical record so that they are apparent at the outpatient follow-up visit.
An additional challenge is that it is frequently unclear which physician “owns” which medications. Therefore, designating a contact person for each medication until follow-up can be very valuable. At a minimum, a “physician owner” for high-alert medications such as insulin, anticoagulants, and diuretics should be identified to provide close follow-up, titration, and monitoring.
There should also be a plan for the patient to obtain refills of essential long-term medications, such as antiplatelet agents following stent placement.
SUMMARY AND RECOMMENDATIONS
Medication-related problems during hospital admission and discharge are common and range from minor discrepancies in the medication list to errors in history-taking, prescribing, and reconciliation that can lead to potential or actual patient harm. Putting systems in place to facilitate medication reconciliation can decrease the occurrence of medication discrepancies and ADEs, thereby improving patient safety during these critical transitions between care settings and providers. Institutional medication reconciliation programs should focus resources on the admission history-taking step, target the highest-risk patients for the most intensive interventions, and involve pharmacy personnel when possible.
On an individual level, clinicians can incorporate additional interventions into their workflows to optimize medication safety for hospitalized patients. Using a structured approach to obtain a complete and accurate medication list at the time of hospital admission will help providers identify medication-related problems and prevent the propagation of errors throughout the hospital stay and at discharge. Focusing additional time and effort on a comprehensive review of the medication list for errors of omission and commission, patient-specific needs, and high-alert drugs will further decrease the risk of medication errors. Finally, providing discharge counseling targeting patient barriers to adherence and ensuring a proper handover of medication information and rationale for medication changes to outpatient providers will improve the chances of a safe transition.
References
Coleman EA, Smith JD, Raha D, Min SJ. Posthospital medication discrepancies: prevalence and contributing factors. Arch Intern Med 2005; 165:1842–1847.
Wong JD, Bajcar JM, Wong GG, et al. Medication reconciliation at hospital discharge: evaluating discrepancies. Ann Pharmacother 2008; 42:1373–1379.
Kripalani S, Roumie CL, Dalal AK, et al; PILL-CVD (Pharmacist Intervention for Low Literacy in Cardiovascular Disease) Study Group. Effect of a pharmacist intervention on clinically important medication errors after hospital discharge: a randomized trial. Ann Intern Med 2012; 157:1-10.
Forster AJ, Murff HJ, Peterson JF, Gandhi TK, Bates DW. The incidence and severity of adverse events affecting patients after discharge from the hospital. Ann Intern Med 2003; 138:161–167.
Forster AJ, Murff HJ, Peterson JF, Gandhi TK, Bates DW. Adverse drug events occurring following hospital discharge. J Gen Intern Med 2005; 20:317–323.
Johnson JA, Bootman JL. Drug-related morbidity and mortality. A cost-of-illness model. Arch Intern Med 1995; 155:1949–1956.
Budnitz DS, Lovegrove MC, Shehab N, Richards CL. Emergency hospitalizations for adverse drug events in older Americans. N Engl J Med 2011; 365:2002–2012.
Bates DW, Boyle DL, Vander Vliet MB, Schneider J, Leape L. Relationship between medication errors and adverse drug events. J Gen Intern Med 1995;10:199–205.
Pippins JR, Gandhi TK, Hamann C, et al. Classifying and predicting errors of inpatient medication reconciliation. J Gen Intern Med 2008; 23:1414–1422.
Lau HS, Florax C, Porsius AJ, De Boer A.The completeness of medication histories in hospital medical records of patients admitted to general internal medicine wards. Br J Clin Pharmacol 2000; 49:597–603.
Tam VC, Knowles SR, Cornish PL, Fine N, Marchesano R, Etchells EE. Frequency, type and clinical importance of medication history errors at admission to hospital: a systematic review. CMAJ 2005; 173:510–515.
Bell CM, Brener SS, Gunraj N, et al. Association of ICU or hospital admission with unintentional discontinuation of medications for chronic diseases. JAMA 2011; 306:840–847.
Dobranski S, Hammond I, Khan G, Holdsworth H. The nature of hospital prescribing errors. Br J Clin Governance 2002; 7:187–193.
Gleason KM, Groszek JM, Sullivan C, Rooney D, Barnard C, Noskin GA. Reconciliation of discrepancies in medication histories and admission orders of newly hospitalized patients. Am J Health Syst Pharm 2004; 61:1689–1695.
Rozich JD, Resar KR. Medication safety: one organization’s approach to the challenge. J Clin Outcomes Manage 2001; 8:27–34.
Mueller SK, Sponsler KC, Kripalani S, Schnipper JL. Hospital-based medication reconciliation practices: a systematic review. Arch Intern Med 2012; 172:1057–1069.
Greenwald JL, Halasyamani L, Greene J, et al. Making inpatient medication reconciliation patient centered, clinically relevant and implementable: a consensus statement on key principles and necessary first steps. J Hosp Med 2010; 5:477–485.
Berwick DM, Calkins DR, McCannon CJ, Hackbarth AD. The 100,000 lives campaign: setting a goal and a deadline for improving health care quality. JAMA 2006; 295:324–327.
McCannon CJ, Hackbarth AD, Griffin FA. Miles to go: an introduction to the 5 Million Lives Campaign. Jt Comm J Qual Patient Saf 2007; 33:477–484.
Leotsakos A, Caisley L, Karga M, Kelly E, O’Leary D, Timmons K. High 5s: addressing excellence in patient safety. World Hosp Health Serv 2009; 45:19–22.
Mueller SK, Kripalani S, Stein J, et al. A toolkit to disseminate best practices in inpatient medication reconciliation: multi-center medication reconciliation quality improvement study (MARQUIS). Jt Comm J Qual Patient Saf 2013; 39:371–382.
Pal A, Babbott S, Wilkinson ST. Can the targeted use of a discharge pharmacist significantly decrease 30-day readmissions? Hosp Pharm 2013; 48:380–388.
Claxton AJ, Cramer J, Pierce C. A systematic review of the associations between dose regimens and medication compliance. Clin Ther 2001; 23:1296–1310.
Osterberg L, Blaschke T. Adherence to medication. N Engl J Med 2005; 353:487–497.
Hajjar ER, Hanlon JT, Sloane RJ, et al. Unnecessary drug use in frail older people at hospital discharge. J Am Geriatr Soc 2005; 53:1518–1523.
Zink DA, Pohlman M, Barnes M, Cannon ME. Long-term use of acid suppression started inappropriately during hospitalization. Aliment Pharmacol Ther 2005; 21:1203–1209.
Morandi A, Vasilevskis E, Pandharipande PP, et al. Inappropriate medication prescriptions in elderly adults surviving an intensive care unit hospitalization. J Am Geriatr Soc 2013; 61:1128–1134.
Cox ZL, McCoy AB, Matheny ME, et al. Adverse drug events during AKI and its recovery. Clin J Am Soc Nephrol 2013; 8:1070–1078.
American Geriatrics Society 2012 Beers Criteria Update Expert Panel. American Geriatrics Society updated Beers Criteria for potentially inappropriate medication use in older adults. J Am Geriatr Soc 2012; 60:616–631.
Gallagher P, O’Mahony D. STOPP (Screening Tool of Older Persons’ potentially inappropriate Prescriptions): application to acutely ill elderly patients and comparison with Beers’ criteria. Age Ageing 2008; 37:673–679.
Tjia J, Bonner A, Briesacher BA, McGee S, Terrill E, Miller K. Medication discrepancies upon hospital to skilled nursing facility transitions. J Gen Intern Med 2009; 24:630–635.
Boockvar K, Fishman E, Kyriacou CK, Monias A, Gavi S, Cortes T. Adverse events due to discontinuations in drug use and dose changes in patients transferred between acute and long-term care facilities. Arch Intern Med 2004; 164:545–550.
Kutner M, Greenberg E, Jin Y, Paulsen C. The Health Literacy of America’s Adults: Results From the 2003 National Assessment of Adult Literacy. http://nces.ed.gov/pubs2006/2006483_1.pdf. Accessed March 31, 2015.
Crane JA. Patient comprehension of doctor-patient communication on discharge from the emergency department. J Emerg Med 1997; 15:1–7.
Schillinger D, Piette J, Grumbach K, et al. Closing the loop: physician communication with diabetic patients who have low health literacy. Arch Intern Med 2003; 163:83–90.
Coleman EA, Parry C, Chalmers S, Min SJ. The care transitions intervention: results of a randomized controlled trial. Arch Intern Med 2006; 166:1822–1828.
Jack BW, Chetty VK, Anthony D, et al. A reengineered hospital discharge program to decrease rehospitalization: a randomized trial. Ann Intern Med 2009; 150:178–187.
Institutional medication reconciliation programs should include taking a best-possible medication history at admission, intervening when patients are at high risk, and involving pharmacy staff when possible.
Clinicians can incorporate additional interventions into their workflows to optimize medication safety for hospitalized patients.
Reviewing the medication list for errors of omission and commission, patient-specific needs, and “high-alert” drugs further decreases the risk of medication errors.
At discharge, patients should receive counseling to ensure understanding of medications and follow-up plans. Hospital physicians should communicate with outpatient providers about medications and rationales for medication changes.