User login
Documenting quantity of care rather than quality
Pneumonia shot? Check. Flu shot? Got it.
What do asking about these two immunizations mean in a neurology history? Absolutely nothing, for most cases.
But that doesn’t stop me and other neurologists from asking about them. Why? Because they’re part of the Physician Quality Reporting System (PQRS) measures, of course! None of us want to be penalized by Medicare for failing to document them. Along with medications (Measure 130: drug, dose, and route of administration), counseling for women of childbearing potential with epilepsy (Measure 268), tobacco status (Measure 226), and blood pressure at visit (Measure 317).

My colleagues in orthopedics tell me they’re now documenting a female patient’s most recent mammogram for the same reasons. While it’s unlikely to affect why they need a new knee, it’s what they have to do to avoid penalties.
How much time does this take? About 30-60 seconds per Medicare patient in my practice. That’s not a huge amount of time, but when you see about 1,000 Medicare visits per year, that adds up to 8-16 hours spent on extraneous documentation.
Do I do it to improve patient care? No. Checking off boxes that have no relation to the case at hand makes no difference at all. I doubt you’ll find a practicing physician who believes otherwise. It simply comes down to playing by the rules, no matter how irrelevant they are.
That’s part of the problem in health care today. In documentation, quantity has replaced quality as a measure of care. The concise, pointed, summary has been eclipsed by long notes that document a large amount of unimportant data. Attaching the PQRS data (a 2-page form in my office) to the bill I submit, and noting it in my chart, only wastes time and paper.
Obviously, documenting blood pressure, tobacco status, and medications are important ... but I’ve always done those. I don’t know any neurologist who doesn’t check those things regularly, since they can directly affect our care.
But the rest is just fluff, which, sadly, seems to be more important these days than actually doing something to help the patient, at least in the eyes of Medicare.
Dr. Block has a solo neurology practice in Scottsdale, Ariz.
Pneumonia shot? Check. Flu shot? Got it.
What do asking about these two immunizations mean in a neurology history? Absolutely nothing, for most cases.
But that doesn’t stop me and other neurologists from asking about them. Why? Because they’re part of the Physician Quality Reporting System (PQRS) measures, of course! None of us want to be penalized by Medicare for failing to document them. Along with medications (Measure 130: drug, dose, and route of administration), counseling for women of childbearing potential with epilepsy (Measure 268), tobacco status (Measure 226), and blood pressure at visit (Measure 317).
My colleagues in orthopedics tell me they’re now documenting a female patient’s most recent mammogram for the same reasons. While it’s unlikely to affect why they need a new knee, it’s what they have to do to avoid penalties.
How much time does this take? About 30-60 seconds per Medicare patient in my practice. That’s not a huge amount of time, but when you see about 1,000 Medicare visits per year, that adds up to 8-16 hours spent on extraneous documentation.
Do I do it to improve patient care? No. Checking off boxes that have no relation to the case at hand makes no difference at all. I doubt you’ll find a practicing physician who believes otherwise. It simply comes down to playing by the rules, no matter how irrelevant they are.
That’s part of the problem in health care today. In documentation, quantity has replaced quality as a measure of care. The concise, pointed, summary has been eclipsed by long notes that document a large amount of unimportant data. Attaching the PQRS data (a 2-page form in my office) to the bill I submit, and noting it in my chart, only wastes time and paper.
Obviously, documenting blood pressure, tobacco status, and medications are important ... but I’ve always done those. I don’t know any neurologist who doesn’t check those things regularly, since they can directly affect our care.
But the rest is just fluff, which, sadly, seems to be more important these days than actually doing something to help the patient, at least in the eyes of Medicare.
Dr. Block has a solo neurology practice in Scottsdale, Ariz.

ObGyn salaries continue gradual improvement
The mean income for ObGyns rose by 2% in 2014 over 2013 to $249,000, according to the 2015 Medscape Compensation Report.1 This slight rise continues a gradual increase over the past few years ($242,000 in 2012; $220,000 in 2011).1–4 The 2015 report took into account survey responses from 19,657 physicians across 26 specialties, 5% (982) of whom were ObGyns.
The highest earners among all physician specialties were orthopedists ($421,000), cardiologists, and gastroenterologists. The lowest earners were pediatricians, family physicians, endocrinologists, and internists ($196,000). The highest ObGyn earners lived in the Northwest ($289,000) and Great Lakes ($268,000) regions; the lowest earners lived in the Mid-Atlantic ($230,000) and Northeast ($235,000) areas.1
Survey findings
Career satisfaction for ObGyns is dipping
In 2011, 69%, 53%, and 48% of ObGyns indicated they would choose a career in medicine again, select the same specialty, and pick the same practice setting, respectively.4 In the 2015 survey, 67% of ObGyns reported that they would still choose medicine; however, only 40% would pick obstetrics and gynecology as their specialty, and only 22% would select the same practice setting.1
Employment over private practice: Who feels best compensated?
Overall, 63% of all physicians are now employed, with only 23% reporting to be in private practice. Employment appears to be more popular for women: 59% of men and 72% of women responded that they work for a salary. Slightly more than a third (36%) of men and about a quarter (23%) of women are self-employed.5
The gender picture. Half of all ObGyns are women, and almost half of medical school graduates are women, yet male ObGyns continue to make more money than their female counterparts.1,5,6 The 9% difference between compensation rates for self-employed male and female ObGyns ($265,000 vs $242,000, respectively) is less than the 14% difference between their employed colleagues ($266,000 vs $229,000, respectively).1 Women tend to work shorter hours, fewer weeks, and see fewer patients than men, which could account for the lower compensation rate for female ObGyns. Studies suggest that greater schedule flexibility and fewer hours are key factors that improve satisfaction rates for female physicians.5
Male and female ObGyns tend to agree on their income satisfaction: less than half are satisfied (male, 44%; female, 46%). Many more employed ObGyns (55%) than self-employed ObGyns (31%) believe that they are fairly compensated.1

Which practice settings pay better?
Compensation rates for ObGyns in 2015 are greatest for those in office-based multispecialty group practice ($280,000), followed by those who work in1:
- health care organizations ($269,000)
- office-based single-specialty group practices ($266,000)
- outpatient clinics ($223,000)
- academic settings (nonhospital), research, military, and government ($219,000).
The lowest paid practice settings are office-based solo practices ($218,000) and hospital-employed ObGyns ($209,000).
In 2013, ObGyns who earned the most worked for health care organizations ($273,000); those who earned the least worked for outpatient clinics ($207,000).1
Do you take insurance, Medicare, Medicaid?
More employed (82%) than self-employed (53%) ObGyns will continue to take new and current Medicare or Medicaid patients, which is a rise from data published in the 2014 report (employed, 72%; self-employed, 46%).1
More than half (58%) of all physicians received less than $100 from private insurers for a new-patient office visit in 2014. Among ObGyns, 26% said they would drop insurers that pay poorly; 29% replied that they would not drop an insurer because they need all payers.1
The rate of participation in Accountable Care Organizations (ACOs) has increased from 25% in 2013 to 35% in 2014, with 8% more expecting to join an ACO in 2015. Concierge practice (2%) and cash-only practice (5%) were reportedly not significant payment models for ObGyns in 2014.1
Only 26% of ObGyns are planning to participate in health insurance exchanges; 23% said they are not participating, and 51% are not sure whether they will participate. Close to half (41%) of ObGyns believe their income will decrease because of health insurance exchanges, whereas 54% do not anticipate a change in income.1
Do you offer ancillary services?
When asked, 11% of employed ObGyns and 28% of self-employed ObGyns revealed that they have offered new ancillary services within the past 3 years. These ancillary services can include mammography, bone density testing, ultrasound, in-house laboratory services, bioidentical hormone replacement therapy, and weight management.1
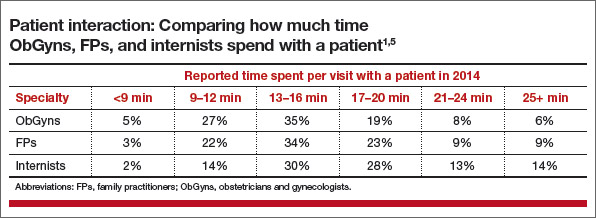
How much time do you spend with patients?
In 2014, 62% of ObGyns reported spending 9 to 16 minutes with a patient during a visit. This is compared to 56% of family physicians and 44% of internists (TABLE).1,5
More than one-half (52%) of ObGynsspend 30 to 45 hours per week seeing patients. Fewer (38%) spend more than 45 hours per week, and 9% spend less than 30 hours per week with patients. This decline may be due to the increasing proportion of women and older physicians who tend to work shorter hours and fewer weeks.1
In the general physician population, 24% of women and 13% of men work part time, whereas 16% of both male and female ObGyns work part time. ObGyns aged 65 years or older constitute 35% of part-timers; 9% of those aged 35 to 49 years, and 11% of those aged 50 to 64 years, work part time. Only 2% of those younger than age 35 work part time.1
Would you select a career in obstetrics and gynecology all over again?
If given a second chance, would you rather choose orthopedic surgery as your specialty, or even choose medicine as a career again? OBG Management recently asked readers to weigh in, through its Quick Poll posted at obgmanagement.com, on whether or not they would choose ObGyn all over again. Ninety-one readers answered “yes” and 70 answered “no,” for a total of 161 respondents.
When this same question was posed to OBG Management’s Virtual Board of Editors (VBE), the perspectives were as split as the Quick Poll results:
- “No, no, no, I would not choose ObGyn all over again.”
- “Yes, I still love what I do.”
- “Yes, it is still the most unique specialty in medicine because it involves both surgery and primary care.”
- “Yes, for all the reasons I first loved the specialty: every week’s schedule, and every day is different. There is a mix of office care, surgery, and call.”
- “No! There is constant concern of litigation for complications, poor reimbursement, and compromised lifestyle.”
“There are much easier ways to make a living,” said one respondent, and another replied, “Work is very tough right now and the payment is too low.”
“The specialty has changed,” said Mary Vanko, MD, who practices in the suburbs of “blue collar Indiana.” “The public has very little idea of the breadth of our knowledge. The ObGyn generalist has the ability to serve as a woman’s doctor throughout her lifetime, not just perform the deliveries and surgeries. All of a sudden we are excluded from primary care status and people have to fight to see us. The newbies will never experience what it used to be as an ObGyn, the woman’s primary. Now we are the doctors to see when someone wants an IUD or is bleeding or pregnant. Big difference.”
Wesley Hambright, MD, practices in a small community hospital, but feels that “a larger hospital with more specialties may offer more flexibility and support in dealing with external pressures.” Tameka O’Neal, MD, is currently hospital employed but feels “as though I have little say in my practice.” Shaukat Ashai, MD, who is retired after 35 years in practice, says he would have preferred an academic setting on a full-time basis, citing long hours and poor compensation.
Robert del Rosario, MD, is in a large single-specialty suburban practice and would choose this practice setting again, although he would not choose a career as an ObGyn again. “The work demands have taken away too much from family,” he says. In addition, “as a male ObGyn, I am regularly faced with patients who choose their doctors based on gender rather than on skill. Our colleagues are no better. Early in my career and until the present, I hear people say, ‘Oh, I can’t hire Dr. X because we’re looking to hire a female.’”
Joe Walsh, MD, of Philadelphia, Pennsylvania, expresses similar discontent as a male ObGyn practicing in today’s female-populated specialty. In a letter to the editor in response to Editor in Chief Robert L. Barbieri, MD’s Editorial in the May 2015 issue, “Why is obstetrics and gynecology a popular choice for medical students?” Dr. Walsh states: “The unaddressed question is why is it unpopular for half of medical students? Ninety-three percent of resident graduates in the field are women, while women account for half of medical student graduates. Men rarely go into the field today. Perhaps job advertisements touting physician opportunities in ‘all female groups’ discourage men. Perhaps hospitals’ ‘Women’s Health Centers’ with such slogans as ‘Women taking care of women’ discourage men. Perhaps receptionists’ asking patients whether they prefer a male or female physician discourages male ObGyns.”
Many VBE members express some frustrations—with their practice setting, compensation, and longer work hours—but say that the patient relationships are the most rewarding aspect of their jobs. After 29 years in practice, Patrick Pevoto, MD, says the most rewarding aspect of his job is “being part of the legacy in people’s lives.”
Others say what keeps them engaged is:
- Enjoying “good outcomes.”
- “The patient contact. It’s fun having someone come up to me in the grocery store and introduce me to a teenager that I delivered 15 years ago.”
- “Surgery.”
- “Helping patients and teaching fellows.”
- “Knowing that I am making a difference in people’s lives.”
What is most rewarding?
When given several choices to select as the most rewarding aspect of their jobs, more female ObGyns (47%) than males (41%) reported that their physician-patient relationships are the major source of satisfaction. More men (10%) than women (7%) cite that making good money at a job they like is most gratifying. Only 3% of men and 2% of women reported no reward to being an ObGyn.1
Survey methodology
Medscape reports that the recruitment period for the 2015 Physician Compensation Report was from December 30, 2014, through March 11, 2015. Data were collected via a third-party online survey collection site. The margin of error for the survey was ±0.69%.1
Share your thoughts on this article! Send your Letter to the Editor to rbarbieri@frontlinemedcom.com. Please include your name and the city and state in which you practice.
1. Peckham C. Medscape OB/GYN Compensation Report 2015. Medscape Web site. http://www.medscape.com/features/slideshow/compensation/2015/womenshealth. Published April 21, 2015. Accessed May 13, 2015.
2. Peckham C. Medscape OB/GYN Compensation Report 2014. Medscape Web site. http://www.medscape.com/features/slideshow/compensation/2014/womenshealth. Published April 15, 2014. Accessed June 2, 2014.
3. Medscape News. Ob/Gyn Compensation Report 2013. Medscape Web site. http://www.medscape.com/features/slideshow/compensation/2013/womenshealth. Accessed June 30, 2013.
4. Reale D. Mean income for ObGyns increased in 2012. OBG Manag. 2013;25(8):34–36.
5. Peckham C. Medscape Physician Compensation Report 2015. Medscape Web site. http://www.medscape.com/features/slideshow/compensation/2015/public/overview. Published April 21, 2015. Accessed May 13, 2015.
6. Distribution of medical school graduates by gender. Henry Kaiser Family Foundation Web site. http://kff.org/other/state-indicator/medical-school-graduates-by-gender/. Accessed May 13, 2015.
The mean income for ObGyns rose by 2% in 2014 over 2013 to $249,000, according to the 2015 Medscape Compensation Report.1 This slight rise continues a gradual increase over the past few years ($242,000 in 2012; $220,000 in 2011).1–4 The 2015 report took into account survey responses from 19,657 physicians across 26 specialties, 5% (982) of whom were ObGyns.
The highest earners among all physician specialties were orthopedists ($421,000), cardiologists, and gastroenterologists. The lowest earners were pediatricians, family physicians, endocrinologists, and internists ($196,000). The highest ObGyn earners lived in the Northwest ($289,000) and Great Lakes ($268,000) regions; the lowest earners lived in the Mid-Atlantic ($230,000) and Northeast ($235,000) areas.1
Survey findings
Career satisfaction for ObGyns is dipping
In 2011, 69%, 53%, and 48% of ObGyns indicated they would choose a career in medicine again, select the same specialty, and pick the same practice setting, respectively.4 In the 2015 survey, 67% of ObGyns reported that they would still choose medicine; however, only 40% would pick obstetrics and gynecology as their specialty, and only 22% would select the same practice setting.1
Employment over private practice: Who feels best compensated?
Overall, 63% of all physicians are now employed, with only 23% reporting to be in private practice. Employment appears to be more popular for women: 59% of men and 72% of women responded that they work for a salary. Slightly more than a third (36%) of men and about a quarter (23%) of women are self-employed.5
The gender picture. Half of all ObGyns are women, and almost half of medical school graduates are women, yet male ObGyns continue to make more money than their female counterparts.1,5,6 The 9% difference between compensation rates for self-employed male and female ObGyns ($265,000 vs $242,000, respectively) is less than the 14% difference between their employed colleagues ($266,000 vs $229,000, respectively).1 Women tend to work shorter hours, fewer weeks, and see fewer patients than men, which could account for the lower compensation rate for female ObGyns. Studies suggest that greater schedule flexibility and fewer hours are key factors that improve satisfaction rates for female physicians.5
Male and female ObGyns tend to agree on their income satisfaction: less than half are satisfied (male, 44%; female, 46%). Many more employed ObGyns (55%) than self-employed ObGyns (31%) believe that they are fairly compensated.1
Which practice settings pay better?
Compensation rates for ObGyns in 2015 are greatest for those in office-based multispecialty group practice ($280,000), followed by those who work in1:
- health care organizations ($269,000)
- office-based single-specialty group practices ($266,000)
- outpatient clinics ($223,000)
- academic settings (nonhospital), research, military, and government ($219,000).
The lowest paid practice settings are office-based solo practices ($218,000) and hospital-employed ObGyns ($209,000).
In 2013, ObGyns who earned the most worked for health care organizations ($273,000); those who earned the least worked for outpatient clinics ($207,000).1
Do you take insurance, Medicare, Medicaid?
More employed (82%) than self-employed (53%) ObGyns will continue to take new and current Medicare or Medicaid patients, which is a rise from data published in the 2014 report (employed, 72%; self-employed, 46%).1
More than half (58%) of all physicians received less than $100 from private insurers for a new-patient office visit in 2014. Among ObGyns, 26% said they would drop insurers that pay poorly; 29% replied that they would not drop an insurer because they need all payers.1
The rate of participation in Accountable Care Organizations (ACOs) has increased from 25% in 2013 to 35% in 2014, with 8% more expecting to join an ACO in 2015. Concierge practice (2%) and cash-only practice (5%) were reportedly not significant payment models for ObGyns in 2014.1
Only 26% of ObGyns are planning to participate in health insurance exchanges; 23% said they are not participating, and 51% are not sure whether they will participate. Close to half (41%) of ObGyns believe their income will decrease because of health insurance exchanges, whereas 54% do not anticipate a change in income.1
Do you offer ancillary services?
When asked, 11% of employed ObGyns and 28% of self-employed ObGyns revealed that they have offered new ancillary services within the past 3 years. These ancillary services can include mammography, bone density testing, ultrasound, in-house laboratory services, bioidentical hormone replacement therapy, and weight management.1
How much time do you spend with patients?
In 2014, 62% of ObGyns reported spending 9 to 16 minutes with a patient during a visit. This is compared to 56% of family physicians and 44% of internists (TABLE).1,5
More than one-half (52%) of ObGynsspend 30 to 45 hours per week seeing patients. Fewer (38%) spend more than 45 hours per week, and 9% spend less than 30 hours per week with patients. This decline may be due to the increasing proportion of women and older physicians who tend to work shorter hours and fewer weeks.1
In the general physician population, 24% of women and 13% of men work part time, whereas 16% of both male and female ObGyns work part time. ObGyns aged 65 years or older constitute 35% of part-timers; 9% of those aged 35 to 49 years, and 11% of those aged 50 to 64 years, work part time. Only 2% of those younger than age 35 work part time.1
Would you select a career in obstetrics and gynecology all over again?
If given a second chance, would you rather choose orthopedic surgery as your specialty, or even choose medicine as a career again? OBG Management recently asked readers to weigh in, through its Quick Poll posted at obgmanagement.com, on whether or not they would choose ObGyn all over again. Ninety-one readers answered “yes” and 70 answered “no,” for a total of 161 respondents.
When this same question was posed to OBG Management’s Virtual Board of Editors (VBE), the perspectives were as split as the Quick Poll results:
- “No, no, no, I would not choose ObGyn all over again.”
- “Yes, I still love what I do.”
- “Yes, it is still the most unique specialty in medicine because it involves both surgery and primary care.”
- “Yes, for all the reasons I first loved the specialty: every week’s schedule, and every day is different. There is a mix of office care, surgery, and call.”
- “No! There is constant concern of litigation for complications, poor reimbursement, and compromised lifestyle.”
“There are much easier ways to make a living,” said one respondent, and another replied, “Work is very tough right now and the payment is too low.”
“The specialty has changed,” said Mary Vanko, MD, who practices in the suburbs of “blue collar Indiana.” “The public has very little idea of the breadth of our knowledge. The ObGyn generalist has the ability to serve as a woman’s doctor throughout her lifetime, not just perform the deliveries and surgeries. All of a sudden we are excluded from primary care status and people have to fight to see us. The newbies will never experience what it used to be as an ObGyn, the woman’s primary. Now we are the doctors to see when someone wants an IUD or is bleeding or pregnant. Big difference.”
Wesley Hambright, MD, practices in a small community hospital, but feels that “a larger hospital with more specialties may offer more flexibility and support in dealing with external pressures.” Tameka O’Neal, MD, is currently hospital employed but feels “as though I have little say in my practice.” Shaukat Ashai, MD, who is retired after 35 years in practice, says he would have preferred an academic setting on a full-time basis, citing long hours and poor compensation.
Robert del Rosario, MD, is in a large single-specialty suburban practice and would choose this practice setting again, although he would not choose a career as an ObGyn again. “The work demands have taken away too much from family,” he says. In addition, “as a male ObGyn, I am regularly faced with patients who choose their doctors based on gender rather than on skill. Our colleagues are no better. Early in my career and until the present, I hear people say, ‘Oh, I can’t hire Dr. X because we’re looking to hire a female.’”
Joe Walsh, MD, of Philadelphia, Pennsylvania, expresses similar discontent as a male ObGyn practicing in today’s female-populated specialty. In a letter to the editor in response to Editor in Chief Robert L. Barbieri, MD’s Editorial in the May 2015 issue, “Why is obstetrics and gynecology a popular choice for medical students?” Dr. Walsh states: “The unaddressed question is why is it unpopular for half of medical students? Ninety-three percent of resident graduates in the field are women, while women account for half of medical student graduates. Men rarely go into the field today. Perhaps job advertisements touting physician opportunities in ‘all female groups’ discourage men. Perhaps hospitals’ ‘Women’s Health Centers’ with such slogans as ‘Women taking care of women’ discourage men. Perhaps receptionists’ asking patients whether they prefer a male or female physician discourages male ObGyns.”
Many VBE members express some frustrations—with their practice setting, compensation, and longer work hours—but say that the patient relationships are the most rewarding aspect of their jobs. After 29 years in practice, Patrick Pevoto, MD, says the most rewarding aspect of his job is “being part of the legacy in people’s lives.”
Others say what keeps them engaged is:
- Enjoying “good outcomes.”
- “The patient contact. It’s fun having someone come up to me in the grocery store and introduce me to a teenager that I delivered 15 years ago.”
- “Surgery.”
- “Helping patients and teaching fellows.”
- “Knowing that I am making a difference in people’s lives.”
What is most rewarding?
When given several choices to select as the most rewarding aspect of their jobs, more female ObGyns (47%) than males (41%) reported that their physician-patient relationships are the major source of satisfaction. More men (10%) than women (7%) cite that making good money at a job they like is most gratifying. Only 3% of men and 2% of women reported no reward to being an ObGyn.1
Survey methodology
Medscape reports that the recruitment period for the 2015 Physician Compensation Report was from December 30, 2014, through March 11, 2015. Data were collected via a third-party online survey collection site. The margin of error for the survey was ±0.69%.1
Share your thoughts on this article! Send your Letter to the Editor to rbarbieri@frontlinemedcom.com. Please include your name and the city and state in which you practice.
1. Peckham C. Medscape OB/GYN Compensation Report 2015. Medscape Web site. http://www.medscape.com/features/slideshow/compensation/2015/womenshealth. Published April 21, 2015. Accessed May 13, 2015.
2. Peckham C. Medscape OB/GYN Compensation Report 2014. Medscape Web site. http://www.medscape.com/features/slideshow/compensation/2014/womenshealth. Published April 15, 2014. Accessed June 2, 2014.
3. Medscape News. Ob/Gyn Compensation Report 2013. Medscape Web site. http://www.medscape.com/features/slideshow/compensation/2013/womenshealth. Accessed June 30, 2013.
4. Reale D. Mean income for ObGyns increased in 2012. OBG Manag. 2013;25(8):34–36.
5. Peckham C. Medscape Physician Compensation Report 2015. Medscape Web site. http://www.medscape.com/features/slideshow/compensation/2015/public/overview. Published April 21, 2015. Accessed May 13, 2015.
6. Distribution of medical school graduates by gender. Henry Kaiser Family Foundation Web site. http://kff.org/other/state-indicator/medical-school-graduates-by-gender/. Accessed May 13, 2015.
In this article
- Which practice settings pay better?
- Would you select a career in ObGyn again?
- Comparing time spent with patients

Head CT in Kids with Minor Head Injury Down After Quality-Improvement Effort
NEW YORK (Reuters Health) - Following a quality-improvement effort at the Boston Children's Hospital emergency department, the number of head CT scans for children with blunt head trauma has dropped without missing any significant injuries, researchers say.
"A combination of an evidence-based guideline and individual provider feedback was associated with a reduction in cranial CT rates," Dr. Lise Nigrovic from Boston Children's told Reuters Health by email. "Clinicians successfully identified all children with head injuries requiring acute intervention."
The evidence-based guideline was based on the PECARN TBI clinical prediction rules, Dr. Nigrovic and her colleagues explain in a report in Pediatrics, online June 22. Immediate CT is recommended for children with either a single high-risk or at least three of the other PECARN TBI predictors.
A period of observation before deciding on CT is recommended for children with one or two predictors, and no CT is recommended for children without PECARN TBI predictors.
The goal of individual provider feedback was to improve awareness, acceptance, adoption and adherence to head trauma guideline recommendations. Each fall, ED providers receive a confidential report of annual cranial CT rates for ED patients with minor blunt head trauma for the previous year. Providers also get information on median overall division CT rate for the previous year, with the goal of reducing variability between providers while further decreasing overall CT rate.
Dr. Nigrovic's team analyzed more than 6,800 ED visits for minor head injuries, of which 62% occurred after implementation of the initiative.
From a baseline head CT rate of 21%, they observed a significant reduction of 6 percentage points in cranial CT rate after initial guideline implementation, and an additional drop of 6 percentage points after initiation of individual provider feedback, the researchers report.
"No children discharged from the ED required admission within 72 hours of initial evaluation," they note.
"Importantly," they add, the decline in the head CT rate has been sustained for two years so far after implementation, "which supports the sustainability of the QI (quality improvement) interventions."
"We believe that these changes are generalizable," Dr. Nigrovic told Reuters Health. "In fact, we have described our QI intervention in detail to help with adoption by other centers."
The study had no commercial funding and the authors have disclosed no potential conflicts of interest.
—Reuters Health
Team endorses intensified chemo for PET-positive HL

Photo by Rhoda Baer
LUGANO—Long-awaited results of the Intergroup H10 trial in PET-positive Hodgkin lymphoma (HL) patients have shown that intensifying chemotherapy significantly increases 5-year progression-free survival (PFS) and produces a non-significant increase in overall survival (OS).
Switching patients who are PET-positive after 2 cycles of ABVD to escalated BEACOPP and involved-node radiotherapy increased 5-year PFS to 91% and 5-year OS to 96%.
The trial was a cooperative effort of the European Organisation for Research and Treatment of Cancer (EORTC), Lymphoma Study Association (LYSA), and Fondazione Italiana Linfomi (FIL).
The investigators already knew that early FDG-PET scans have prognostic impact. Patients with a negative PET scan after 2 cycles of chemotherapy have very good outcomes, while those with PET-positive interim scans have poor outcomes.
So the team designed the H10 trial to learn whether they could reduce long-term toxicity in the majority of patients and improve outcomes in the unfavorable subgroups.
Results of the primary endpoint—whether chemotherapy alone is as effective as, but less toxic than, combined-modality treatment in PET-negative patients after 2 cycles of ABVD—were published in the Journal of Clinical Oncology.
The secondary endpoint was an improvement in PFS with an early change from ABVD to escalated BEACOPP in stage I or II HL patients who are PET-positive after 2 cycles of ABVD.
John M. M. Raemaekers, MD, PhD, of Radboud University Medical Center in The Netherlands, presented details on the trial’s secondary endpoint at the 13th International Congress on Malignant Lymphoma (no abstract available).
H10 trial design
The investigators enrolled patients with favorable and unfavorable prognostic characteristics.
Unfavorable characteristics consisted of age 50 or older, more than 3 nodal areas, mediastinal-to-thorax ratio of 0.35 or higher, erythrocyte sedimentation rate of 50 mm or greater without B symptoms, or erythrocyte sedimentation rate of 30 mm or greater with B symptoms.
In the standard treatment arm, patients with favorable or unfavorable characteristics were treated similarly. After 2 cycles of ABVD, a PET scan was performed, and, irrespective of the result, patients received combined-modality treatment of ABVD followed by involved-node radiotherapy.
In the experimental arm, patients who were PET-negative had chemotherapy alone without involved-node radiotherapy. PET-negative patients were not discussed further in this presentation.
For the PET-positive patients in the experimental arm, the treatment for those with favorable and unfavorable characteristics was identical.
Patients who were PET-positive after 2 cycles were switched to 2 escalated BEACOPP cycles plus involved-node radiotherapy. Patients were considered PET-positive if they had a Deauville score of 3, 4, or 5.
Randomization
The first patient was enrolled in November 2006 and the last in June 2011. Investigators randomized 1950 patients, 754 with favorable and 1196 with unfavorable characteristics. All patients had untreated, supradiaphragmatic, clinical stage I or II HL.
Nine hundred fifty-four patients were enrolled in the standard arm, 371 with favorable characteristics and 583 with unfavorable. Nine hundred seventy-one patients entered the experimental arm, 376 with favorable and 595 with unfavorable characteristics.
Twenty-five patients were excluded because they did not complete the first 2 cycles of ABVD or did not have a PET scan.
After 2 cycles of ABVD, 361 patients were PET-positive, 192 in the ABVD arm (54 favorable, 138 unfavorable), and 169 in the escalated BEACOPP arm (43 favorable, 126 unfavorable).
The median age was 30 years in both arms (range, 15 to 70), and the investigators followed patients for a median of 4.5 years.
Results
The only grade 3-4 toxicities were hematologic events and infection.
“As expected, the neutropenia, thrombocytopenia, and anemia, grade 3-4, were more frequent in the experimental BEACOPP arm,” Dr Raemaekers said.
The incidence of grade 3-4 neutropenia was 30.3% (ABVD) and 53.5% (BEACOPP), thrombocytopenia was 0% (ABVD) and 19.7% (BEACOPP), and anemia was 0% (ABVD) and 4.9% (BEACOPP).
The incidence of grade 3-4 febrile neutropenia was 1.1% (ABVD) and 23.9% (BEACOPP), and infection without neutropenia was 1.1% (ABVD) and 11.2% (BEACOPP).
Progression or relapse occurred in 18.8% of patients in the ABVD arm and 7.7% in the BEACOPP arm.
There were 18 deaths in the ABVD arm and 7 deaths in the BEACOPP arm. Eleven deaths in the ABVD arm and 3 in the BEACOPP arm were due to progressive disease or relapse.
The investigators also tallied up the number of patients who progressed, relapsed, or died, whichever occurred first. Forty-one patients in the ABVD arm fulfilled one of these criteria, compared to 16 in the BEACOPP arm.
“Progression and relapse had to be established by conventional restaging, including physical exam, chest X-ray, and CT scan,” Dr Raemaekers pointed out. “And it was based on any new lesion or increase by 50% or more in size of previously involved sites.”
Patients in the BEACOPP arm experienced a significantly better PFS than the ABVD arm, with a hazard ratio of 0.42 (P=0.002). The 5-year PFS was 91% in the BEACOPP arm and 77% in the ABVD arm.
The 5-year OS was 89% in the ABVD arm and 96% in the BEACOPP arm, a difference that was not statistically significant.
“But [the trial] was also not powered for overall survival,” Dr Raemaekers said. “[T]here is a hint, at least, that, even in overall survival, the BEACOPP arm is superior to the ABVD arm.”
Based on these findings, the investigators concluded that, despite increased toxicity, physicians should consider intensifying chemotherapy in early PET-positive patients with stage I/II HL in the combined-modality setting. ![]()
Who was responsible for excessive oxytocin doses? $18.2M verdict
Who was responsible for excessive oxytocin doses? $18.2M verdict
Early in the morning, a woman at 40 weeks’ gestation presented to the hospital for induction of labor managed by her ObGyn. Labor was lengthy, and the mother was given increasing doses of 22, 24, and 26 mIU/min of oxytocin to stimulate labor. The baby was delivered in the evening. The child suffered a hypoxic birth injury and has cerebral palsy.
Parents’ claim Excessive oxytocin was administered, causing uterine hyperstimulation and excessive contractions. Nurses failed to inform the ObGyn of an abnormal fetal heart rate during the afternoon.
Defendants’ defense The parties disputed the oxytocin orders. The ObGyn claimed she has a standing order against oxytocin doses over 20 mIU/min. The nurses claimed that the dosage was based on the ObGyn’s verbal orders, which the ObGyn denied. The ObGyn denied negligence and maintained that if she’d known of the oxytocin administration greater than 20 mIU/min and the abnormal fetal heart rate, she immediately would have called for cesarean delivery. The hospital denied negligence and maintained that the oxytocin was administered 10 hours before delivery and played no role in fetal distress.
Verdict At trial, the ObGyn did not call expert witnesses and, in closing arguments, the physician’s attorney asked for exoneration of the ObGyn and a finding of fault solely against the hospital. An $18.2 million Washington verdict was returned against the hospital.
What caused the child’s Erb’s palsy?
A mother presented to the hospital for induction of labor. Oxytocin was administered and the first stage of labor progressed normally. When the mother began pushing, the ObGyn noted a turtle sign at crowning and called for assistance. The ObGyn attempted to deliver the fetus with downward guidance of the fetal head but encountered shoulder dystocia and a nuchal cord. He unwrapped the cord and instructed the nursing staff to place the mother in the McRobert’s position to help dislodge the right shoulder. When that did not work, the ObGyn performed a first-degree episiotomy and completed delivery. The child was found to have Erb’s palsy of the right arm. She underwent decompression and neurolysis of the brachial plexus using sural nerve grafts but still has reduced use of her right arm.
Parents’ claim Shoulder dystocia was improperly managed, causing the brachial plexus injury.
Defendants’ defense The ObGyn and hospital system denied negligence. The child’s injury occurred in utero due to natural forces of the mother’s uterine contractions.
Verdict An Ohio defense verdict was returned.
Woman claims lack of proper consent
A 47-year-old woman underwent endometrial ablation performed by her ObGyn. During the procedure, the uterus was perforated and the ObGyn performed a hysterectomy. Six days later, the patient was found to have peritonitis and underwent bowel repair surgery. The patient developed untreatable bowel adhesions that cause chronic pain.
Patient’s claim There were less expensive and invasive alternatives to the ablation that the ObGyn did not offer. The patient claimed lack of informed consent for the ablation and hysterectomy and negligence in perforating the bowel. The ObGyn was also negligent in failing to recognize the perforation and to diagnose peritonitis in a timely manner.
Texas state law requires consent for hysterectomies without documented evidence of immediate danger to life. Her husband did not have the authority to consent on her behalf.
Physician’s defense The husband gave informed consent. Failure to recognize the perforation was not negligent; it is a known risk of the surgery. The patient’s care was transferred to another physician after the second postoperative day.
Verdict A $200,000 Texas settlement was reached.
Bowel obstruction in pregnant woman
A 29-year-old woman at 27 weeks’ gestation had abdominal pain. She went to a community hospital where a hospitalist was assigned to her care. After a day, the patient was found to have a small bowel obstruction and necrosis of the bowel. The baby was delivered preterm. The mother underwent 12 operations; half of her intestines were resected. The mother is being treated for posttraumatic stress syndrome. The child is autistic.
Parents’ claim The hospitalist did not diagnose the mother’s intestinal blockage in a timely manner and did not obtain an obstetric consult or notify the patient’s ObGyn. The hospital staff did not follow protocol to notify the mother’s ObGyn. The child’s autism is a result of preterm delivery.
Defendants’ defense The hospital denied any duty to notify the ObGyn if the patient was admitted to the hospital for nonobstetric reasons. The case was settled during trial.
Verdict A $4.2 million Washington settlement was reached including $3 million from the hospital.
Fourth-degree perineal tear and continuing pain after delivery
A woman in her 30s went to the hospital for induction of labor. After many hours, the ObGyn used vacuum extraction due to maternal fatigue. The baby emerged in compound presentation, with her hand at the side of her head. She weighed 9 lb 12 oz at birth. A fourth-degree perineal tear occurred at birth. Postpartum, a rectovaginal fistula developed that required several repair operations. The mother is unable to have intercourse due to continuing vaginal pain and discomfort.
Patient’s Claim Knowing that the father’s head was overly large, the ObGyn should have better estimated the fetus’ size, and should have performed cesarean delivery.
Physician’s defense The ObGyn admitted that he knew the baby was large but maintained that a large fetus does not mandate a cesarean delivery. There were no indications that the baby’s head or body was too large to fit through the mother’s pelvis, so a vaginal delivery was appropriate. A perineal tear is a known complication of childbirth and could not be prevented. The patient’s current pain is unrelated to the perineal tear.
Verdict A Pennsylvania defense verdict was returned.
Breast cancer missed in woman with dense breasts
In 2003, a 44-year-old woman was told she had dense fibrocystic breasts. From 2003 through 2009 she regularly saw a breast surgeon due to concern that breast cancer might be difficult to detect.
In August 2009, her ObGyn identified a questionable mass in her left breast after ultrasonography and mammography. The patient saw the surgeon in late September 2009; no further imaging was ordered and she was told to return in a year.
The patient, concerned about the mass, returned to the surgeon in May 2010. Testing revealed cancer, and she underwent radical mastectomy and other treatment.
Patient’s claim Because the mass had not been treated in a timely manner, her 5-year survival rate in May 2010 was less than 50%. The surgeon was negligent in failing to order additional testing in September 2009. Magnetic resonance imaging (MRI) would have detected the cancer at a time when her survival rate could have been 80%.
Physician’s defense The cancer was diagnosed in a timely manner. An earlier diagnosis would not have changed the outcome.
Verdict A Tennessee defense verdict was returned.
Child stillborn, mother injured after vacuum extraction
When the mother’s labor slowed at a birthing center, she received several medications including castor oil, blue cohosh, and black cohosh to induce labor. The mother was later transferred by ambulance to a hospital. Ninety minutes after admission, the ObGyn used vacuum extraction to deliver a stillborn child. The mother sustained damage to her rectum, uterus, and vagina, had repair surgery, and has been unable to get pregnant again.
Parents’ claim While in labor at the birthing center, the castor oil, blue cohosh, and black cohosh caused the patient’s uterus to contract excessively and contributed to fetal death. The patient should have been transferred to the hospital earlier. Cesarean delivery should have been performed immediately upon her arrival at the hospital but the ObGyn did not arrive at the hospital for an hour after the patient’s admission.
Defendants’ defense The head midwife at the birthing center conceded negligence. The hospital claimed that the fetus was already dead before the mother arrived. The ObGyn denied negligence, arguing that he had no supervisory role or ownership in the birthing center and was not present during the mother’s labor. He also claimed that the fetus was dead in utero 12 or more hours before delivery and that an infectious process had developed in the mother during the 17 hours that she was at the birthing center.
Verdict A $4,095,000 Florida verdict was returned against the ObGyn. A directed verdict was granted for the hospital.
Patient still in pain after labia reduction
A 44-year-old woman underwent surgical reduction of her labia minora performed by a gynecologist. The procedure was intended to relieve discomfort during sexual activity. The patient continues to have pain.
Patient’s claim An excessive amount of the right labia minora was removed because proper presurgical demarcation of the operative area was not performed. Her pain during intercourse has worsened and she cannot properly urinate.
Physician’s defense Presurgical demarcation was correctly completed using clamps. Surgery was properly performed. The asymmetry is due to poor healing of the surgical wound. The patient’s clitoris was not scarred. The patient never reported complications related to urination to her gynecologist. Her ongoing pain is due to an estrogen deficiency.
Verdict A New York defense verdict was returned.
Uterine rupture after version for breech presentation: $7M
A woman went to the hospital for delivery of her baby. The fetus was in breech position, but the mother requested vaginal delivery. When the ObGyn attempted an external cephalic version to turn the baby, the uterus ruptured and the placenta was damaged. The baby sustained hypoxic-ischemic encephalopathy resulting in cerebral palsy (CP). He requires constant nursing care.
Parents’ claim The ObGyn failed to recognize fetal distress during the breech version. The ObGyn improperly performed the version, causing the uterine rupture. There was lack of informed consent for the version.
Defendants’ defense The case was settled during trial.
Verdict A $7 million New Jersey settlement was reached.
Sepsis following hysterectomy
An ObGyn performed total abdominal hysterectomy to treat uterine fibroids in a 26-year-old woman. Despite reporting abdominal pain, the patient was discharged on postsurgical day 4.
Three days later, she went to a different hospital with moderate diffuse abdominal pain, constipation, nausea, emesis, tachycardia, and low-grade fever. An abdominal radiograph was taken, the patient was given morphine and ketorolac, and she was sent home.
She returned to the first hospital 3 days later reporting fever, nausea, emesis, diarrhea, and severe abdominal pain. After an abdominal computed tomography (CT) scan revealed numerous fluid- and gas-filled collections, indicative of abscess, intravenous antibiotics were ordered and administered.
Six days later, an infectious disease physician was consulted. He made a diagnosis of sepsis secondary to abdominal infection.
The next day, an abdominal CT scan revealed enlargement of multiple abdominal and pelvic fluid collections.
At exploratory laparotomy, purulent fluid was found in the anterior fascial compartment, with gross pus in the abdomen. The entire bowel was dilated, inflamed, and matted. Necrotic rind and infection were noted on multiple surfaces of the colon and small intestine and the transverse colon was gangrenous and sealed to the right lower quadrant. The patient’s intestines were resected and an ileostomy was placed, which was reversed several months later.
Patient’s claim The ObGyn did not offer an alternative to hysterectomy. The ObGyn was negligent in injuring the small intestine during surgery and failing to recognize and treat it intraoperatively. The patient should not have been discharged based on her reported symptoms. Failure to recognize and treat the injury led to sepsis with severe complications and months of recuperation.
Physician’s defense There was no negligence; small bowel injury is a known risk of hysterectomy. Other caregivers at both hospitals were at fault for not properly diagnosing and treating the infection.
Verdict A $901,420 Nevada verdict was returned; the ObGyn was found 85% at fault and other parties 15% at fault. The court granted the physician’s motion to reduce the verdict to $436,954, which included $371,411 from the ObGyn.
These cases were selected by the editors of OBG Management from Medical Malpractice Verdicts, Settlements, & Experts, with permission of the editor, Lewis Laska (www.verdictslaska.com). The information available to the editors about the cases presented here is sometimes incomplete. Moreover, the cases may or may not have merit. Nevertheless, these cases represent the types of clinical situations that typically result in litigation and are meant to illustrate nationwide variation in jury verdicts and awards.
Share your thoughts! Send your Letter to the Editor to rbarbieri@frontlinemedcom.com. Please include your name and the city and state in which you practice.
In this article
- What caused the child’s Erb’s palsy?
- Woman claims lack of proper consent
- Bowel obstruction in pregnant woman
- Fourth-degree perineal tear and continuing pain after delivery
- Breast cancer missed in woman with dense breasts
- Child stillborn, mother injured after vacuum extraction
- Patient still in pain after labia reduction
- Uterine rupture after version for breech presentation: $7M
- Sepsis following hysterectomy

Anticoagulant antidote effective in healthy volunteers

TORONTO—An antidote to factor Xa inhibitors can safely reverse the anticoagulant effect of apixaban in healthy volunteers, results of the ANNEXA-A study suggest.
The first part of this study showed that a bolus of the antidote, andexanet alfa, was effective. And none of the volunteers had serious adverse events, thrombotic events, or antibodies to factor X or Xa.
In the second part of the study, researchers tested a bolus and a 2-hour infusion of andexanet alfa.
The drug normalized coagulation parameters immediately post-bolus, and this effect was sustained during the infusion. The reversal of anti-factor Xa activity lasted 1 to 2 hours post-infusion.
As in part 1, there were no serious adverse events or thrombotic events, and none of the subjects developed antibodies to factor X or Xa.
Mark Crowther, MD, of McMaster University in Hamilton, Ontario, Canada, presented details on part 2 of ANNEXA-A at the ISTH 2015 Congress (abstract LB004). The trial was sponsored by Portola Pharmaceuticals, Inc., the company developing andexanet alfa.
The goal of the randomized, double-blind ANNEXA-A study was to evaluate the safety and efficacy of andexanet alfa in reversing apixaban-induced anticoagulation in healthy volunteers ages 50 to 75.
In part 1, 33 healthy volunteers received apixaban at 5 mg twice daily for 4 days and were then randomized in a 3:1 ratio to andexanet alfa administered as a 400 mg intravenous bolus (n=24) or to placebo (n=9). Results from this part of the study were presented at the American Heart Association 2014 Scientific Sessions.
In the second part of the study, 32 healthy volunteers received apixaban at 5 mg twice daily for 4 days and were then randomized in a 3:1 ratio to andexanet alfa administered as a 400 mg intravenous bolus followed by a continuous infusion of 4 mg/min for 120 minutes (n=24) or to placebo (n=8).
Safety
One subject in the andexanet alfa arm discontinued treatment during the infusion due to mild hives. The subject did not have any other allergic
manifestations or cardiorespiratory effects.
Six subjects had mild infusion-related reactions, 4 (16.7%) in the andexanet alfa arm and 2 (25%) in the placebo arm.
None of the subjects had an increase in D-dimer (more than 2 times the upper limit of normal) on more than 1 day.
The majority of andexanet-alfa-treated subjects had transient elevation of F1 and F2, but, in all cases, levels returned to less than or equal to 2 times the upper limit of normal by the fourth day.
Efficacy
Twenty-three subjects in the andexanet alfa arm and all 8 subjects in the placebo arm were evaluable for efficacy.
All evaluable subjects in the andexanet alfa arm had an 80% or greater reduction in anti-factor Xa activity post-infusion nadir, compared to none of the subjects on placebo (P<0.0001).
The mean percent change in anti-factor Xa activity from baseline to post-infusion nadir was 92% in the andexanet alfa arm (P<0.0001 vs placebo). And the mean percent change from baseline to post-bolus nadir was 93% (P<0.0001 vs placebo).
The mean change in free apixaban concentration from baseline to post-infusion nadir was 1.39 ng/mL in the andexanet alfa arm (P=0.0002 vs placebo).
Thrombin generation was restored to the day 1, pre-apixaban baseline range in all 23 subjects on andexanet alfa (P<0.0001). And there was no long-term effect on thrombin generation.
The researchers said andexanet alfa demonstrated rapid onset and offset of action. Furthermore, it seems that either a bolus dose alone or a bolus plus infusion can reverse apixaban’s anticoagulant activity, which could provide flexibility for bleeding patients.
Andexanet alfa is also under investigation as an antidote to rivaroxaban, edoxaban, enoxaparin, and betrixaban. ![]()
‘Radically different’ PI3Kδ inhibitor lacks hepatotoxicity

Photo by Larry Young
LUGANO—Updated phase 1 results with TGR-1202 suggest this next-generation PI3kδ inhibitor lacks the hepatotoxicity associated with other PI3Kδ inhibitors.
Investigators also confirmed that no case of colitis has been reported to date with TGR-1202, and only 2% of evaluable patients on this trial have experienced grade 3-4 diarrhea.
The study is an ongoing, first-in-human trial in patients with relapsed or refractory hematologic malignancies.
Owen O’Connor, MD, PhD, of Columbia University Medical Center in New York, New York, shared results from this trial at the 13th International Congress on Malignant Lymphoma (abstract 038*). The trial is sponsored by TG Therapeutics, Inc., the company developing TGR-1202.
“TGR-1202 is a radically different sort of PI3kδ inhibitor,” Dr O’Connor said. “[I]t’s really a unique chemical entity that is different from the previous 2 structures [idelalisib and duvelisib] that you’ve probably heard something about.”
Study design
This ongoing trial of TGR-1202 is open to patients with hematologic malignancies who relapsed after or were refractory to at least 1 prior treatment regimen. Patients are eligible if they have an ECOG performance status of 2 or less with adequate organ system function, including absolute neutrophil count of 750/μL or greater and platelets of 50,000/μL or greater.
TGR-1202 is dosed orally, once a day in continuous, 28-day cycles. The original dose-escalation portion of the study was a classic 3+3 design, starting at 50 mg and increasing to 1800 mg. Patients who received prior therapy with a PI3K and/or mTOR inhibitor were excluded from the dose-escalation cohorts but were allowed in the expansion cohorts.
Dr O’Connor pointed out that, through cohort 5, TGR-1202 was taken in the fasting state. However, pharmacokinetic studies performed in the fed state revealed that the area under the curve (AUC) and Cmax could be doubled by taking the drug with food. So the expansions in the ongoing 800 mg and 1200 mg cohorts are being conducted in the fed state.
Dr O’Connor also noted that a subsequent, micronized version of TGR-1202 was developed. The micronization “essentially increases the surface area of the formulation, allowing for better bioavailability and markedly increases the AUC and Cmax exposure,” he said.
So the investigators conducted a second escalation with the micronized formulation, starting at 200 mg and increasing to 800 mg. At present, they are enrolling patients to the 800 mg and 1200 mg cohorts conducted in the fed state with the micronized formulation.
Demographics
Dr O’Connor presented data on 66 patients who were evaluable for safety and 51 for efficacy. The patients’ median age was 66 (range, 22–85), and 46 were male.
In all, there were 20 patients with chronic lymphocytic leukemia (CLL), 17 with follicular lymphoma, 10 with diffuse large B-cell lymphoma, 9 with Hodgkin lymphoma, 5 with mantle cell lymphoma, 3 with marginal zone lymphoma, 1 with Waldenström’s macroglobulinemia, and 1 with hairy cell leukemia.
Patients had received a median of 3 prior therapies (range, 1–14), and 36 (55%) had 3 or more prior therapies. Thirty-four patients (52%) were refractory to their prior therapy.
Efficacy
Dr O’Connor reported that higher doses of TGR-1202—1200 mg of the initial formulation and 600 mg or more of the micronized version—demonstrated rapid and profound responses in CLL, follicular lymphoma, and marginal zone lymphoma.
Responses have been limited in diffuse large B-cell lymphoma, Hodgkin lymphoma, and mantle cell lymphoma.
Eighty-eight percent of CLL patients achieved a nodal partial remission, and 63% achieved a response according to iwCLL criteria (Hallek 2008).
Safety and tolerability
Adverse events occurring in more than 10% of patients included nausea (41%), diarrhea (32%), fatigue (32%), headache (23%), vomiting (23%), cough (21%), decreased appetite (17%), rash (17%), constipation (14%), hypokalemia (14%), anemia, dizziness, dyspnea, neutropenia, and pyrexia (12% each), and abdominal pain (11%).
The most common grade 3-4 toxicity was neutropenia, occurring in 11% of patients.
“But other than that, the bulk of the toxicities in terms of grade 3-4 events were relatively modest,” Dr O’Connor said. “[I]t’s worth pointing out that diarrhea grade 3-4 only occurred in about 2% of patients in the population.”
Approximately 50% of patients (n=31) have been on study for more than 6 months, and approximately 30% taking a higher dose level have been on study for 6 months or more. Twenty-five of 37 patients exposed to 800 mg or more of the micronized formulation currently remain on study.
“So this gives you a sense that it is a very well-tolerated drug, with patients staying on for extended periods of time,” Dr O’Connor said.
He added that time on study becomes relevant in assessing some of the gastrointestinal toxicities seen with other PI3Kδ inhibitors, where it seems the median time to gastrointestinal toxicity is beyond 6 months.
“So far, and I’m willing to concede it’s early, but with half the patients being treated for over 6 months, [diarrhea/colitis] seems to be much lower than the experience with the other PI3 kinase inhibitors,” Dr O’Connor said.
“I think one of the more important features of [TGR-1202], and one that allows me to think we might be able to integrate this drug a little more readily into various combination regimens, are the discontinuations due to other adverse events.”
“Only 4% treated with [TGR-1202] had discontinuations secondary to adverse events. [A]nd it looks like the efficacy is in line with what we’d expect with some of the other drugs, but this [study] is actively accruing still.” ![]()
*Information in the abstract differs from that presented at the meeting.
Cord milking better than delayed clamping for some preterm infants
Photo courtesy of Meutia
Chaerani & Indradi Soemardjan
Umbilical cord milking may be more beneficial than delayed cord clamping for preterm infants delivered by Cesarean section, according to new research.
The study showed that cord milking produced greater blood circulation, higher hemoglobin levels, and higher blood pressure, but only in preterm infants delivered by Cesarean.
For preterm infants delivered vaginally, there was no significant difference between the milking and delayed clamping groups.
Anup C. Katheria, MD, of the Neonatal Research Institute at the Sharp Mary Birch Hospital in San Diego, California, and his colleagues reported these findings in Pediatrics.
The researchers noted that, in 2012, the American College of Obstetricians and Gynecologists recommended a 30- to 60-second delay before clamping the umbilical cord in all preterm deliveries.
This is thought to allow sufficient time for blood from the umbilical cord to fill the blood vessels in the infant’s lungs and to protect infants from intraventricular hemorrhage. However, some previous studies failed to find a reduction in intraventricular hemorrhage from delayed cord clamping among preterm infants delivered by Cesarean.
Dr Katheria and his colleagues theorized that the use of an anesthetic in Cesarean delivery reduces uterine contractions and therefore hinders the exodus of blood from the umbilical cord.
They reasoned that cord milking—encircling the cord with thumb and forefingers, gently squeezing, and slowly pushing the blood through the cord to the infant’s abdomen—might compensate for diminished blood flow through the umbilical cord and increase the amount of blood available to the infant.
To test this theory, the researchers enrolled 197 infants in a prospective study. Mothers went into labor at or before the 32nd week of pregnancy.
Of the 154 infants delivered by Cesarean, 75 were randomized to the umbilical cord milking (UCM) group and 79 to the delayed cord clamping (DCC) group.
Infants in the UCM group had significantly higher blood flow in the superior vena cava than those in the DCC group—93 ± 24 mL/kg per min vs 81 ± 29 mL/kg per min (P<0.05)—and a significantly higher output of blood from the right ventricle—261 ± 80 mL/kg per min vs 216 ±73 mL/kg per min (P<0.001).
These measures, taken together, are an indication of blood circulation in the brain and body.
Infants in the UCM group had significantly higher hemoglobin levels at birth than infants in the DCC group—16.3 ± 2.4 g/dL vs 15.6 ± 2.2 g/dL (P<0.05). And mean arterial pressure in the first 15 hours of life was significantly higher in the UCM group than the DCC group (P=0.02).
Among the 43 infants who were delivered vaginally, the researchers found no significant differences in outcomes between infants randomized to UCM or DCC. ![]()
SCAMP Tool for an Old Problem
The traditional tools of observation, retrospective studies, registries, clinical practice guidelines (CPGs), prospective studies, and randomized control trials have all contributed to much of the progress of modern medicine to date. However, each of these tools has inherent tensions, strengths, and weaknesses: prospective versus retrospective, standardization versus personalization, and the art versus the science of medicine. As the field of medicine continually evolves, so too should our tools and methods. We review the Standardized Clinical Assessment and Management Plan (SCAMP) as a complementary tool to facilitate learning and discovery.
WHAT IS A SCAMP?
The methodology and major components of a SCAMP have been described in detail.[1, 2, 3] The goals of SCAMPs are to (1) reduce practice variation, (2) improve patient outcomes, and to (3) identify unnecessary resource utilization. SCAMPs leverage concepts from CPGs and prospective trials and infuse the iterative Plan, Do, Study, Act Cycle quality‐improvement techniques. Like most novel initiatives, SCAMPs methodology itself has matured over time and with experience. Briefly, creating a SCAMP has the following steps. Step 1 is to summarize the available data and expert opinions on a topic of interest. This is a critical first step, as it identifies gaps in our knowledge base and can help focus areas for the SCAMP to explore. Occasionally, retrospective studies are needed to provide data regarding local practices, procedures, and outcome metrics. These data can be used as a historical benchmark to compare SCAMP data with. Step 2 is to convene a group of clinicians who are engaged by the topic to define the patients to be included and to create a standardized care algorithm. Decision points and recommendations made within these algorithms should be precise and concrete, knowing that they can be changed or improved after data analysis and review. Figure 1 is a partial snapshot of the algorithm from the Hypertrophic Cardiomyopathy SCAMP describing the follow‐up in adults with known hypertrophic cardiomyopathy. Creation of the algorithm is often done in parallel with step 3, which is the generation of a set of targeted data statements (TDSs). TDSs are driven by the main objectives of the SCAMP, focus on areas of high uncertainty and variation in care, and frame the SCAMP to keep the amount of data collected in scope. A good TDS is concrete, measurable, and clearly relates to the recommendations in the algorithm. Here is an example of a TDS from the adult Congestive Heart Failure SCAMP: Greater than 75% of patients will be discharged on at least their admission doses of ‐blockers, angiotensin‐converting enzyme inhibitors, and angiotensin receptor blockers.

The last step for SCAMP creation involves developing online or paper data forms that allow for efficient data capture at the point of care. The key to these data forms is limiting the data capture to only what is needed to answer the TDS and documenting the reasons why clinicians chose not to follow SCAMP recommendations. Figure 2 is a partial data form from the adult Distal Radius Fracture SCAMP. Implementation of a SCAMP is a key component to a SCAMP's success but is outside the scope of this review.
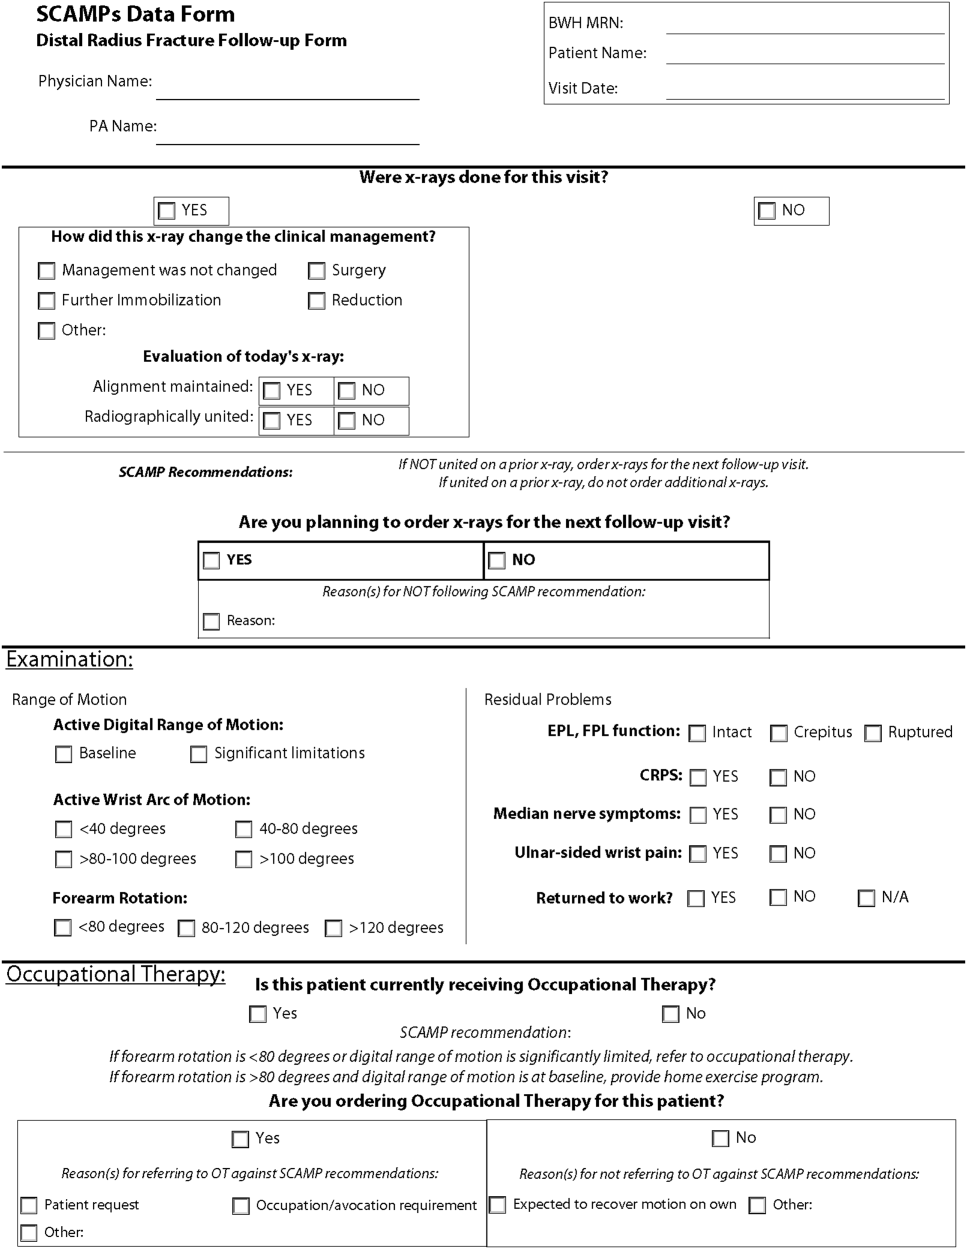
One of the hallmark features of SCAMPs is iterative, rapid data analysis, which is meant to inform and help change the SCAMP algorithm. For example, the Congestive Heart Failure TDS example above was based on the assumption that patients should be discharged home on equal or higher doses of their home medications. However, analysis of SCAMP patients showed that, in fact, clinicians were discharging a large number of patients on lower doses despite algorithm recommendations. The SCAMP algorithm was changed to explore and better understand the associations between neurohormonal medication dose changes and patients' renal function, blood pressures, and overall hemodynamic stability. This type of data capture, analysis, and algorithm change to improve the SCAMP itself can occur in relatively rapid fashion (typically in 6‐ to 12‐month cycles).
WHAT MAKES A GOOD SCAMP TOPIC?
A good SCAMP topic typically involves high stakes. The subject matter or the anticipated impact must be substantial enough to warrant the time and resource investments. These interests often parallel the overall goals of the SCAMP. The best SCAMPs target areas where the stakes are high in terms of the costs of practice variation, the importance of patient outcomes, and the waste of unnecessary resource utilization. We have shown that SCAMPs can apply to the spectrum of clinical care (inpatient, outpatient, procedures, adult, pediatric, long‐ or short‐range episodes of care) and to both common and rare diagnoses in medicine. To date, there have been 47 SCAMPs created and implemented across a network of 11 centers and societies. A full list of available adult and pediatric SCAMPs can be found at
WHAT MAKES A SCAMP DIFFERENT?
More Than a Clinical Practice Guideline
The initial process of developing a SCAMP is very similar to developing a CPG. There is reliance on available published data and expert opinion to create the TDS and algorithms. However, in contrast to CPGs, there is a fundamental tenet to the SCAMPs methodology that, within a given knowledge base on a particular subject, there are considerable holes where definitive truth is not known. There are errors in our data and understanding, but we do not know exactly which assumptions are correct or misguided. Acknowledging the limitations of our knowledge base gives the freedom to make recommendations in the algorithm that are, essentially, educated guesses. Within a short time period, the authors will get informed data and the opportunity to make adjustments, as necessary, to the algorithm. This type of prospective data collection and rapid analyses are generally not part of CPGs.
The Role of Diversions
No CPG, prospective study, randomized trial, or SCAMP algorithm will perfectly fit every patient, every time. The bedside clinician will occasionally have insights into that particular patient's care that justify not following an algorithm, regardless if it comes from a CPG, trial, or SCAMP. SCAMPs encourage these diversions, as they are a rich set of data that can be used to highlight deficiencies in the algorithms, especially when numerous providers identify similar concerns. In a CPG, these diversions are typically chalked up to noncompliance, whereas in a SCAMP, the decision, as well as the rationale behind the decision making, is captured. The key to diversions is capturing the logic and rationale of the decision making for that patient. These critical clinical decision‐making data are often lost or buried within an electronic medical record, in a form (e.g. free text) that cannot easily be identified or analyzed. During the analysis, the data regarding diversions are reviewed, looking for similar patterns of why clinicians did not follow the SCAMP algorithm. For example, in the adult Inpatient Chest Pain SCAMP, there was a high rate of diversions regarding the amount of inpatient testing being done for the evaluation of patients at low or intermediate risk for acute coronary syndrome. In analysis of the diversions, it seems that many of these patients did not have a primary cardiologist or lived far away. The SCAMP algorithm was modified to have different recommendations based on where the patient lived and if they had a cardiologist. In the next analysis, this subgroup can be compared against patients who live closer and had a primary cardiologist to see if additional inpatient testing did or did not affect outcomes.
Little Data Instead of Big Data
There has been a lot of focus across hospital systems on the analysis of big data. Over the last several years, there has been an explosion in the availability of large, often unstructured, datasets. In many ways, big data analytics look to find meaning across very large datasets because the critical data (e.g. clinical decision making) is not captured in a discrete analyzable fashion. In electronic health records, much of the decision making as to why the clinician chose the red pill instead of the blue pill is lost in the free text abyss of clinic and inpatient notes. Through the use of TDSs, the SCAMP authors are asked to identify the critical data elements needed to say which patient should get what pill. By doing this, the clinical decision making is codified in a way that will facilitate future analysis and SCAMP modifications. Decisions made by clinicians and how they got to those decisions (either via the SCAMP algorithm or by diversion) are captured in an easily analyzable form. This approach, choosing only critical and targeted little data, also reduces the data collection burden and increases clinician compliance.
A Grassroots Effort
Many CPGs are created by panels of international experts in the field/subject matter. The origins of most SCAMPs tend to start more locally, often by frustrated clinicians who struggle with the data and knowledge gaps. They are often motivated to improve their care delivery, not necessarily on a national level, but in their clinic or inpatient setting. The data they get back in the interim analyses are about their patientstheir data. This empowers them to expand and grow the SCAMP. The flexibility of allowing diversions increases this engagement. SCAMPs are created and authored by clinicians on the front lines. This more grassroots approach feels more palatable compared to the top down verdicts that come from CPGs.
SCAMPs are a novel, complementary, but alternative tool to help deliver better care. By focusing on targeted little data collection, allowing diversions, and performing rapid analysis to iteratively improve the algorithm, SCAMPs blend the strengths of many of our traditional tools of good change to affect better change. By choosing topics with high stakes, they allow the frontline clinicians to shape and improve how they delivery care.
Disclosure: Nothing to report.
- , , , et al. A novel approach to gathering and acting on relevant clinical information: SCAMPs. Congenit Heart Dis. 2010;5:343–353.
- , , , et al. Standardized clinical assessment and management plans (SCAMPs) provide a better alternative to clinical practice guidelines. Health Aff (Millwood). 2013;32:911–920.
- , , , Gathering and learning from relevant clinical data: a new framework. Acad Med. 2015;90(2):143–148.
The traditional tools of observation, retrospective studies, registries, clinical practice guidelines (CPGs), prospective studies, and randomized control trials have all contributed to much of the progress of modern medicine to date. However, each of these tools has inherent tensions, strengths, and weaknesses: prospective versus retrospective, standardization versus personalization, and the art versus the science of medicine. As the field of medicine continually evolves, so too should our tools and methods. We review the Standardized Clinical Assessment and Management Plan (SCAMP) as a complementary tool to facilitate learning and discovery.
WHAT IS A SCAMP?
The methodology and major components of a SCAMP have been described in detail.[1, 2, 3] The goals of SCAMPs are to (1) reduce practice variation, (2) improve patient outcomes, and to (3) identify unnecessary resource utilization. SCAMPs leverage concepts from CPGs and prospective trials and infuse the iterative Plan, Do, Study, Act Cycle quality‐improvement techniques. Like most novel initiatives, SCAMPs methodology itself has matured over time and with experience. Briefly, creating a SCAMP has the following steps. Step 1 is to summarize the available data and expert opinions on a topic of interest. This is a critical first step, as it identifies gaps in our knowledge base and can help focus areas for the SCAMP to explore. Occasionally, retrospective studies are needed to provide data regarding local practices, procedures, and outcome metrics. These data can be used as a historical benchmark to compare SCAMP data with. Step 2 is to convene a group of clinicians who are engaged by the topic to define the patients to be included and to create a standardized care algorithm. Decision points and recommendations made within these algorithms should be precise and concrete, knowing that they can be changed or improved after data analysis and review. Figure 1 is a partial snapshot of the algorithm from the Hypertrophic Cardiomyopathy SCAMP describing the follow‐up in adults with known hypertrophic cardiomyopathy. Creation of the algorithm is often done in parallel with step 3, which is the generation of a set of targeted data statements (TDSs). TDSs are driven by the main objectives of the SCAMP, focus on areas of high uncertainty and variation in care, and frame the SCAMP to keep the amount of data collected in scope. A good TDS is concrete, measurable, and clearly relates to the recommendations in the algorithm. Here is an example of a TDS from the adult Congestive Heart Failure SCAMP: Greater than 75% of patients will be discharged on at least their admission doses of ‐blockers, angiotensin‐converting enzyme inhibitors, and angiotensin receptor blockers.
The last step for SCAMP creation involves developing online or paper data forms that allow for efficient data capture at the point of care. The key to these data forms is limiting the data capture to only what is needed to answer the TDS and documenting the reasons why clinicians chose not to follow SCAMP recommendations. Figure 2 is a partial data form from the adult Distal Radius Fracture SCAMP. Implementation of a SCAMP is a key component to a SCAMP's success but is outside the scope of this review.
One of the hallmark features of SCAMPs is iterative, rapid data analysis, which is meant to inform and help change the SCAMP algorithm. For example, the Congestive Heart Failure TDS example above was based on the assumption that patients should be discharged home on equal or higher doses of their home medications. However, analysis of SCAMP patients showed that, in fact, clinicians were discharging a large number of patients on lower doses despite algorithm recommendations. The SCAMP algorithm was changed to explore and better understand the associations between neurohormonal medication dose changes and patients' renal function, blood pressures, and overall hemodynamic stability. This type of data capture, analysis, and algorithm change to improve the SCAMP itself can occur in relatively rapid fashion (typically in 6‐ to 12‐month cycles).
WHAT MAKES A GOOD SCAMP TOPIC?
A good SCAMP topic typically involves high stakes. The subject matter or the anticipated impact must be substantial enough to warrant the time and resource investments. These interests often parallel the overall goals of the SCAMP. The best SCAMPs target areas where the stakes are high in terms of the costs of practice variation, the importance of patient outcomes, and the waste of unnecessary resource utilization. We have shown that SCAMPs can apply to the spectrum of clinical care (inpatient, outpatient, procedures, adult, pediatric, long‐ or short‐range episodes of care) and to both common and rare diagnoses in medicine. To date, there have been 47 SCAMPs created and implemented across a network of 11 centers and societies. A full list of available adult and pediatric SCAMPs can be found at
WHAT MAKES A SCAMP DIFFERENT?
More Than a Clinical Practice Guideline
The initial process of developing a SCAMP is very similar to developing a CPG. There is reliance on available published data and expert opinion to create the TDS and algorithms. However, in contrast to CPGs, there is a fundamental tenet to the SCAMPs methodology that, within a given knowledge base on a particular subject, there are considerable holes where definitive truth is not known. There are errors in our data and understanding, but we do not know exactly which assumptions are correct or misguided. Acknowledging the limitations of our knowledge base gives the freedom to make recommendations in the algorithm that are, essentially, educated guesses. Within a short time period, the authors will get informed data and the opportunity to make adjustments, as necessary, to the algorithm. This type of prospective data collection and rapid analyses are generally not part of CPGs.
The Role of Diversions
No CPG, prospective study, randomized trial, or SCAMP algorithm will perfectly fit every patient, every time. The bedside clinician will occasionally have insights into that particular patient's care that justify not following an algorithm, regardless if it comes from a CPG, trial, or SCAMP. SCAMPs encourage these diversions, as they are a rich set of data that can be used to highlight deficiencies in the algorithms, especially when numerous providers identify similar concerns. In a CPG, these diversions are typically chalked up to noncompliance, whereas in a SCAMP, the decision, as well as the rationale behind the decision making, is captured. The key to diversions is capturing the logic and rationale of the decision making for that patient. These critical clinical decision‐making data are often lost or buried within an electronic medical record, in a form (e.g. free text) that cannot easily be identified or analyzed. During the analysis, the data regarding diversions are reviewed, looking for similar patterns of why clinicians did not follow the SCAMP algorithm. For example, in the adult Inpatient Chest Pain SCAMP, there was a high rate of diversions regarding the amount of inpatient testing being done for the evaluation of patients at low or intermediate risk for acute coronary syndrome. In analysis of the diversions, it seems that many of these patients did not have a primary cardiologist or lived far away. The SCAMP algorithm was modified to have different recommendations based on where the patient lived and if they had a cardiologist. In the next analysis, this subgroup can be compared against patients who live closer and had a primary cardiologist to see if additional inpatient testing did or did not affect outcomes.
Little Data Instead of Big Data
There has been a lot of focus across hospital systems on the analysis of big data. Over the last several years, there has been an explosion in the availability of large, often unstructured, datasets. In many ways, big data analytics look to find meaning across very large datasets because the critical data (e.g. clinical decision making) is not captured in a discrete analyzable fashion. In electronic health records, much of the decision making as to why the clinician chose the red pill instead of the blue pill is lost in the free text abyss of clinic and inpatient notes. Through the use of TDSs, the SCAMP authors are asked to identify the critical data elements needed to say which patient should get what pill. By doing this, the clinical decision making is codified in a way that will facilitate future analysis and SCAMP modifications. Decisions made by clinicians and how they got to those decisions (either via the SCAMP algorithm or by diversion) are captured in an easily analyzable form. This approach, choosing only critical and targeted little data, also reduces the data collection burden and increases clinician compliance.
A Grassroots Effort
Many CPGs are created by panels of international experts in the field/subject matter. The origins of most SCAMPs tend to start more locally, often by frustrated clinicians who struggle with the data and knowledge gaps. They are often motivated to improve their care delivery, not necessarily on a national level, but in their clinic or inpatient setting. The data they get back in the interim analyses are about their patientstheir data. This empowers them to expand and grow the SCAMP. The flexibility of allowing diversions increases this engagement. SCAMPs are created and authored by clinicians on the front lines. This more grassroots approach feels more palatable compared to the top down verdicts that come from CPGs.
SCAMPs are a novel, complementary, but alternative tool to help deliver better care. By focusing on targeted little data collection, allowing diversions, and performing rapid analysis to iteratively improve the algorithm, SCAMPs blend the strengths of many of our traditional tools of good change to affect better change. By choosing topics with high stakes, they allow the frontline clinicians to shape and improve how they delivery care.
Disclosure: Nothing to report.
- , , , et al. A novel approach to gathering and acting on relevant clinical information: SCAMPs. Congenit Heart Dis. 2010;5:343–353.
- , , , et al. Standardized clinical assessment and management plans (SCAMPs) provide a better alternative to clinical practice guidelines. Health Aff (Millwood). 2013;32:911–920.
- , , , Gathering and learning from relevant clinical data: a new framework. Acad Med. 2015;90(2):143–148.
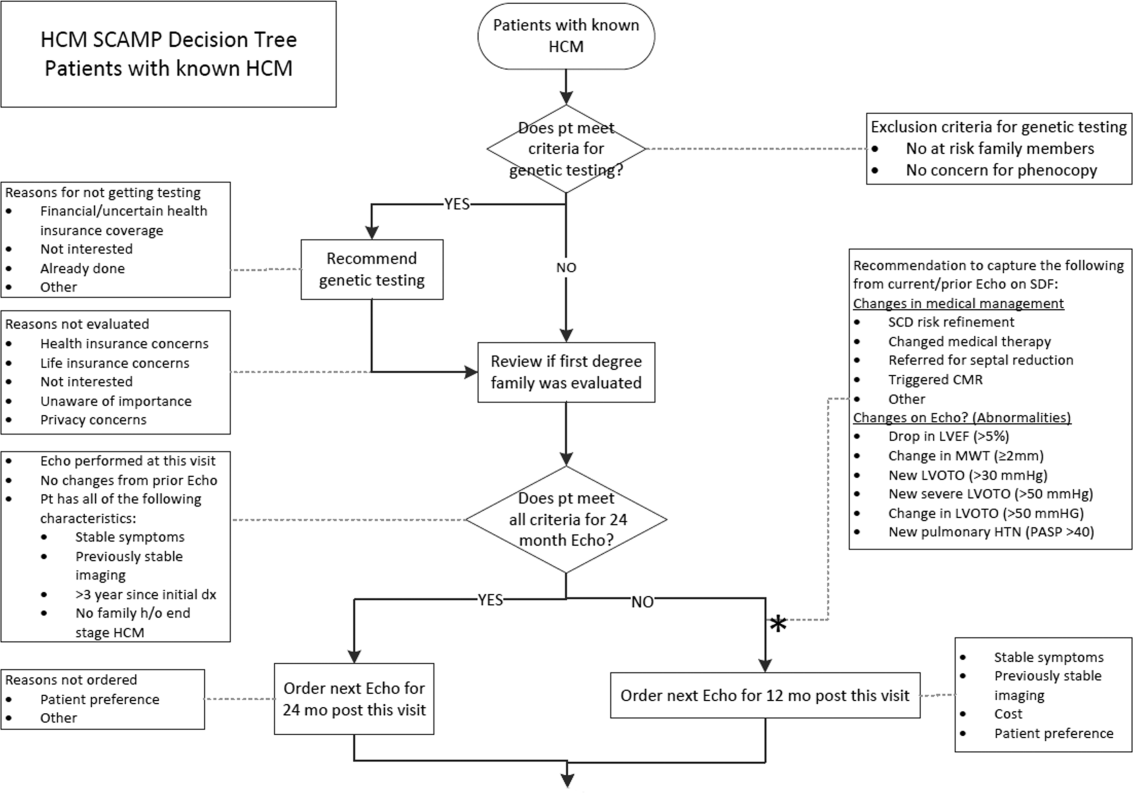
Hospital Deaths Among HIV Patients
Successfully treated human immunodeficiency virus (HIV)‐infected individuals in the United States currently have life expectancy and mortality rates that are similar to the general population.[1, 2, 3, 4] A large multinational study found that the excess mortality rate among HIV‐positive individuals decreased from 40.8 to 6.1 per 1000 person‐years from pre‐1995 to 2006.1 This is largely due to improved access to comprehensive HIV care, in particular widespread antiretroviral (ART) use. However, the proportion of deaths that are not classically considered acquired immunodeficiency syndrome (AIDS)‐related such as liver disease, cardiovascular disease, and non‐AIDS malignancy has increased,[1, 5, 6, 7] particularly among patients with higher CD4 T‐cell counts.[5, 8] Additionally, despite overall decline in mortality, there is evidence of racial and gender differences, with increased mortality risk associated with female gender and black race.[9, 10]
In the current ART era, HIV care has shifted focus from inpatient to outpatient care, with more emphasis on chronic disease management. However, hospitalization rates among HIV‐positive persons remain higher than that of the general population.[11, 12] A cross‐sectional study of HIV‐infected persons in the United States estimated a hospitalization rate of 26.6 per 100 persons in 2009,[13] compared to a rate of 11.9 for the general population during the same year.[14] Possible reasons for higher hospitalization rates include complications of aging or other chronic comorbidities, and consequences of behavioral risk factors such tobacco use and substance abuse.
Characterizing deaths among inpatient HIV‐infected individuals in the ART era is important to developing targeted interventions to further reduce mortality. Prior studies examining in‐hospital deaths of HIV‐positive patients evaluated more limited time periods,[15, 16, 17, 18] and thus did not necessarily assess the full spectrum of changes in mortality that have occurred with the introduction of ART. Furthermore, these studies described causes of death, but did not consistently identify factors associated with non‐AIDS deaths. We examined the trends in in‐hospital deaths among HIV‐infected patients from 1995 to 2011 and identified contributing factors to mortality. As the HIV population is aging, we hypothesized that HIV‐infected patients are more likely to die from nonAIDS‐related death in the late ART era due to factors related to cardiovascular and liver disease, compared to the early ART era.
METHODS
The study was performed at YaleNew Haven Hospital, an urban tertiary care academic teaching hospital with 1008 beds and the state of Connecticut's largest ambulatory HIV clinic. Connecticut ranks seventh nationally (10/100,000) in HIV prevalence; New Haven is second among Connecticut cities in the number of people living with HIV/AIDS.[19] We reviewed all patients with an International Classification of Diseases, Ninth Revision (ICD‐9) code of HIV or AIDS (ICD‐9 codes V08 and 042) who died during hospitalization between January 1, 1995 to December 31, 2011. The Yale Human Investigation Committee granted ethical approval to conduct the study.
A standardized data collection tool was used to abstract demographic characteristics (ie, age, gender, and race), medical comorbidities (ie, diabetes, chronic kidney disease, chronic hepatitis B or C, liver cirrhosis, hypertension, coronary artery disease, congestive heart failure, chronic obstructive lung disease, alcohol and substance abuse), ART use (yes or no), HIV viral load (VL), CD4 cell count, and causes of death. Comorbidities were defined using the Coding of Death in HIV Project protocol, a multinational endeavor to standardize data collection in studies of HIV‐positive patients.[20] Chronic kidney disease included individuals with National Kidney Foundation stage I to V disease. Chronic hepatitis B or C infection was identified in patients who had serologic testing indicative of prior infection. Alcohol and substance abuse were identified when source documents mentioned any history of current alcohol or illicit drug abuse or dependence. ART use was defined as documentation of ART on admission or prescription during hospitalization. This included individuals who were on 2 or more ART agents. The last HIV VL and CD4 cell count available within 1 year and closest to death were recorded. HIV VL suppression was defined as <400 copies/mL.
Two clinicians independently classified the cause of death as AIDS related or non‐AIDS related in accordance with published definitions.[21, 22] Cause of death was determined by review of the medical record, discharge diagnosis, and autopsy report when available. Official death certificates were not available for review. There was discordance in assigning 23 of the 400 causes of death. In these cases, the medical record was reviewed and determined by consensus between the 2 clinicians.
AIDS‐related deaths were categorized as nonspecified AIDS, AIDS infection, and AIDS malignancy. AIDS‐related deaths were defined as those caused by conditions meeting the Centers for Disease Control and Prevention AIDS case definition.[22] Non‐specified AIDS deaths were those occurring in patients with a CD4 count 50 cells/mm3 or with an AIDS‐defining illness, who died from a condition that was not clearly AIDS related. This included septic shock of unclear etiology, first known episode of pneumonia, a gastrointestinal bleed of unclear etiology, and altered mental status of unclear etiology when cerebrospinal fluid analysis or imaging of the brain was not available.
Non‐AIDS deaths included non‐AIDS infection in patients with a CD4 count >50 cells/mm3, cardiovascular disease, liver disease, non‐AIDS malignancy, and renal disease (Table 1). Deaths classified as other incorporated the deaths that did not fall into these categories. Chronic obstructive pulmonary disease (COPD) exacerbation and status asthmaticus were included in this category, because there was only 1 death from each of these causes.
| |
| Non‐AIDS infection | Infectious etiology not on the list of AIDS‐defining conditions, such as Clostridium difficile colitis, endocarditis, bacteremia, nonrecurrent bacterial pneumonia, or septic shock of unclear cause without a CD4 count of less than 50 cells/mm3 or a documented opportunistic infection |
| Cardiovascular disease | Cardiac arrest without clear cause, ischemic or hemorrhagic stroke, congestive heart failure (respiratory failure most likely due to pulmonary edema in the setting of known systolic or diastolic heart failure), myocardial infarction, and cardiac arrhythmia |
| Liver disease | Complications of cirrhosis such as variceal bleed, hepatic encephalopathy, hepatorenal syndrome, and acute liver failure |
| Renal disease | Complications of acute renal failure such as hyperkalemia leading to cardiac arrest. Complications of end‐stage renal disease such as stopping hemodialysis or calciphylaxis |
| Non‐AIDS malignancy | Malignancies not on the AIDS indicator diagnostic list |
| Other causes | Drug overdose, trauma, suicide, Stevens‐Johnson syndrome, macrophage activation syndrome, hemorrhagic pancreatitis, status asthmaticus, COPD exacerbation, status epilepticus of unclear cause, complications of idiopathic thrombocytopenic purpura, and diabetic ketoacidosis |
The early ART era was defined as 1995 to 2001 and the late ART era from 2002 to 2011. During the early period, combination ART was introduced and significantly impacted overall mortality.[23, 24] The late ART era better reflected current in‐hospital deaths and was compared to the early era to evaluate trends over time.[15, 25]
2 analysis and parametric (t test and analysis of variance) methods compared categorical and continuous variables, respectively. Bivariate analysis was used to determine associations with AIDS versus non‐AIDS deaths in the entire study cohort. Multivariable logistic regression was used to identify correlates of non‐AIDS deaths in the (1) complete 17‐year period and (2) late ART era. For all analyses, a P value <0.05 was considered statistically significant. All statistical analysis was performed using SAS 9.3 (SAS Institute, Cary, NC).
RESULTS
Among 12,183 hospital discharges of HIV‐infected patients from 1995 to 2011, 406 (3.3%) died. Six medical records were missing or incomplete; 400 were available for review. The proportion of hospitalized HIV‐infected patients who died declined from 6.2% in 1995 to 1.5% in 2011 (P<0.0001).
Table 2 summarizes all 400 patients' demographic and clinical characteristics, and cause of death. The majority were male (65.5%), nonwhite (73.3%), and taking ART (65.9%), though only one‐third achieved a VL <400 copies/mL on the most recent measurement available in the year prior to death. The majority (56.3%) died due to nonAIDS‐related causes.
| Total, n=400 | Early Era, n=207 | Late Era, n=193 | P Value | |
|---|---|---|---|---|
| ||||
| Median age, y (IQR) | 45 (3852) | 41 (3547) | 49 (4357) | <0.0001 |
| Male gender, no. (%) | 262 (65.5) | 141 (68.1) | 121 (62.7) | 0.25 |
| Race, no. (%) | ||||
| Black | 238 (59.5) | 124 (59.9) | 114 (59.1) | 0.87 |
| White | 105 (26.3) | 55 (26.6) | 50 (25.9) | 0.88 |
| Hispanic | 55 (13.8) | 27 (13.0) | 28 (14.5) | 0.67 |
| Median CD4 cells/mm3 (IQR)a | 90 (12248) | 50 (10150) | 153 (22399) | <0.0001 |
| HIV VL 400 copies/mL, no. (%)b | 77 (31.3) | 12 (13.3) | 65 (41.7) | <0.0001 |
| On ART, no. (%) | 257 (65.9) | 120 (58.3) | 137 (74.5) | 0.0008 |
| Cause of death, no. (%) | ||||
| AIDS‐related, no. (%) | 175 (43.8) | 118 (57.0) | 57 (29.5) | <0.0001 |
| AIDS infection | 85 (21.3) | 58 (28.0) | 27 (14.0) | 0.82 |
| Nonspecified AIDS | 73 (18.3) | 46 (22.2) | 27 (14.0) | 0.99 |
| AIDS malignancy | 17 (4.3) | 14 (6.8) | 3 (1.6) | 0.17 |
| Non‐AIDS‐related, no. (%) | 225 (56.3) | 89 (43.0) | 136 (70.5) | <0.0001 |
| Non‐AIDS infection | 81 (20.3) | 32 (15.5) | 49 (25.4) | 0.99 |
| Cardiovascular | 45 (11.3) | 16 (7.7) | 29 (15.0) | 0.54 |
| Liver related | 34 (8.5) | 18 (8.7) | 16 (8.3) | 0.08 |
| Malignancy | 31 (7.8) | 6 (2.9) | 25 (13.0) | 0.01 |
| Renal failure | 18 (4.5) | 8 (3.9) | 10 (5.2) | 0.66 |
| Other, no. (%) | 16 (4.1) | 9 (4.5) | 7 (3.6) | 0.16 |
Among all AIDS‐related deaths from 1995 to 2011 (Table 2), AIDS‐defining infection was the most common cause (21.3%), followed by nonspecified AIDS (18.3%), and AIDS malignancy (4.3%). The proportion of nonAIDS‐related deaths increased significantly over time (Figure 1). The most common cause of nonAIDS‐related deaths was non‐AIDS infection (20.3%), followed by cardiovascular disease (11.3%), liver disease (8.5%), malignancy (7.8%), and renal failure (4.5%). The most common non‐AIDS infection was sepsis in 43 patients (60.6%), followed by nonrecurrent bacterial pneumonia in 24 patients (33.8%) and Clostridium difficile infection in 4 patients (5.6%). NonAIDS‐related malignancy was the only category to significantly increase from the early ART to late ART era (P=0.01).

Compared to those dying of AIDS‐related causes over the 17‐year period (Table 3), patients dying of nonAIDS‐related causes were older (P<0.0001), less likely to have a CD4 count 200 cells/mm3 (P<0.0001), and more likely to be on ART and virologically suppressed (P<0.0001). Patients who died from nonAIDS‐related causes were also more likely to have diabetes mellitus (P=0.01), chronic kidney disease (P<0.0001), hepatitis C (P<0.0001), liver cirrhosis (P<0.0001), hypertension (P=0.0002), coronary artery disease (P=0.004), and COPD (P=0.04). Of note, there was no statistically significant difference in gender, race, or substance abuse between AIDS‐related and nonAIDS‐related deaths.
| AIDS, n=175 | Non‐AIDS, n=225 | P Value | |
|---|---|---|---|
| |||
| Median age, y (IQR) | 40 (3548) | 48 (4255) | <0.0001 |
| Male gender, no. (%) | 115 (43.9) | 147 (56.1) | 0.94 |
| Race, no. (%) | |||
| Black | 105 (60.3) | 133 (59.4) | 0.84 |
| White | 41 (23.6) | 64 (28.6) | 0.26 |
| Hispanic | 28 (16.1) | 27 (12.1) | 0.25 |
| On ART, no. (%) | 97 (55.8) | 160 (74.1) | 0.0001 |
| CD4 <200 cells/mm3, no. (%)a | 167 (97.1) | 95 (47.2) | <0.0001 |
| HIV VL 400 copies/mL, no. (%)b | 2 (4.1) | 75 (38.1) | <0.0001 |
| Comorbidities, no. (%) | |||
| Diabetes | 13 (7.4) | 35 (15.6) | 0.01 |
| Renal disease | |||
| CKD | 21 (12) | 73 (32.4) | <0.0001 |
| On dialysis | 9 (5.1) | 47 (20.9) | <0.0001 |
| Liver disease | |||
| Hepatitis C | 38 (21.7) | 130 (57.8) | <0.0001 |
| Cirrhosis | 14 (8) | 67 (29.8) | <0.0001 |
| Cardiovascular disease | |||
| Hypertension | 18 (10.3) | 56 (24.9) | 0.0002 |
| CAD | 2 (1.1) | 16 (7.1) | 0.004 |
| CHF | 13 (7.4) | 29 (12.9) | 0.08 |
| COPD | 5 (2.9) | 17 (7.6) | 0.04 |
| Alcohol abuse | 9 (5.1) | 18 (8.0) | 0.26 |
| Polysubstance abuse | 10 (5.7) | 22 (9.8) | 0.14 |
Associations With Non‐AIDS Deaths
Among all clinical factors associated with non‐AIDS deaths (Table 4), only the last CD4 within the year prior to death >200 cells/mm3, VL 400 copies/mL in the year prior to death, and liver and cardiovascular comorbidities were independently associated with non‐AIDS deaths. The last CD4 count >200 cells/mm3 in the year prior to death was the strongest correlate (odds ratio [OR]: 16.5; 95% CI: 5.351.4) of non‐AIDS deaths, whereas gender and race were not significant.
| Overall (19952011) | Early Era (19952001) | Late Era (20022011) | ||||
|---|---|---|---|---|---|---|
| Deaths | 400 | 207 | 193 | |||
| Non‐AIDS | 225 | 89 | 136 | |||
| AIDS | 175 | 118 | 57 | |||
| Odds Ratio (95% CI)a | Adjusted Odds Ratio (95% CI)b | Odds Ratio (95% CI)a | Adjusted Odds Ratiob (95% CI) | Odds Ratio (95% CI)a | Adjusted Odds Ratio (95% CI)b | |
| ||||||
| Clinical factors | ||||||
| Age (per year) | 1.06 (1.04‐1.08) | c | 1.03 (1.01‐1.06) | c | 1.07 (1.03‐1.1) | c |
| Male gender | 0.98 (0.6‐1.5) | c | 1.04 (0.6‐1.9) | c | 1.1 (0.6‐2.0) | c |
| White race (vs nonwhite) | 0.8 (0.5‐1.2) | c | 1.2 (0.6‐2.2) | c | 0.4 (0.2‐0.8) | c |
| CD4 >200 cells/mm3d | 37.6 (14.895.5) | 16.5 (5.351.4) | 24.4 (7.183.2) | 17.4 (3.488.3) | 45.4 (10.5195.5) | 25.9 (5.0134.5) |
| HIV VL 400 copies/mL‖ | 13.6 (5.235.3) | 7.5 (2.324.4) | 9.4 (1.276.6) | c | 15.6 (5.246.4) | 10.9 (2.448.8) |
| On ART | 2.3 (1.5‐3.5) | c | 1.6 (0.9‐2.8) | c | 2.7 (1.35.3) | c |
| Comorbidities | ||||||
| Lung diseasee | 1.9 (1.013.5) | c | 2.4 (1.025.5) | c | 1.5 (0.6‐3.9) | c |
| Kidney diseasee | 3.5 (2.16.0) | c | 3.5 (1.7‐7.3) | 4.9 (1.417.8) | 3.1 (1.47.2) | c |
| Depression | 1.6 (0.8‐ 3.2) | c | 2.5 (0.9‐6.6) | c | 0.95 (0.4‐2.5) | c |
| Substance abusee | 1.9 (1.13.6) | c | 3.7 (1.59.5) | c | 0.9 (0.4‐2.1) | c |
| Diabetes | 2.3 (1.24.5) | c | 2.0 (0.7‐5.5) | c | 1.9 (0.7‐5.0) | c |
| Liver diseasee | 3.6 (2.45.4) | 4.5 (2.29.3) | 2.4 (1.4‐4.3) | 4.4 (1.512.7) | 4.3 (2.28.3) | 7.5 (2.423.4) |
| Cardiovascular diseasee | 2.9 (1.8‐4.6) | 4.2 (1.89.9) | 1.8 (0.9‐3.5) | 4.6 (2.010.3) | 6.8 (1.924.0) | |
In the early ART era (19952001), only CD4 count, renal disease, and cardiovascular disease were independently associated with non‐AIDS deaths; the last CD4 count <200 cells/mm3 in the year prior to death was associated most strongly (OR: 17.4; 95% CI: 3.488.3) with non‐AIDS death, whereas again, gender and race were not significant correlates of non‐AIDS death.
In the late ART era (20022011), similar to those for the entire 17‐year time period, independent correlates of non‐AIDS deaths included last CD4 <200 cells/mm3 in the year prior to death, VL 400 copies/mL in the last year prior to death, and liver and cardiovascular disease. Last CD4 count >200 cells/mm3 in the year prior to death (OR: 25.9; 95% CI: 5134.5) was most strongly correlated with non‐AIDS deaths in the late ART era. Nonwhite patients had a lower likelihood of nonAIDS‐related death (OR: 0.4; 95% CI: 0.2‐0.8), but this was not significant on multivariable regression analysis. Gender difference was not statistically significant.
DISCUSSION
Our study demonstrated changes in the causes of death among HIV‐infected hospitalized patients from 1995 to 2011. To our knowledge, this is the longest duration retrospective analysis of in‐hospital deaths among HIV‐infected patients during the ART era. Knowledge of the changes in comorbidities and causes of death among hospitalized HIV‐infected patients during the ART era could help inpatient providers focus diagnostic and therapeutic efforts and improve overall care. Our findings emphasize that HIV‐infected patients remain at high risk for complications from non‐AIDS infections, even when their immune system has been restored as measured by the CD4 cell count, and at increased risk of cardiovascular and liver disease, which highlights the need to carefully monitor HIV‐positive patients admitted with these conditions.
Comparison of AIDS‐related and nonAIDS‐related deaths in 2 time periods has revealed important findings. First, inpatient deaths of HIV‐infected patients have decreased dramatically (from 6.2% to 1.5%, P<0.0001), and the mortality due to nonAIDS‐related causes has increased significantly over time. Second, we defined demographic and clinical characteristics independently associated with HIV‐infected inpatient mortality. Third, a substantial proportion of in‐hospital deaths were caused by potentially preventable non‐AIDS as well as AIDS‐related diseases.
The striking decline in hospital deaths over time is likely the result of expanded ART use resulting in improved immunologic profiles. NonAIDS‐related causes were responsible for almost three‐quarters of deaths in this large inpatient HIV‐positive population during the late ART era. Similar findings have been reported from other settings in industrialized countries.[5, 7, 16, 17, 18, 26, 27] In our urban population, although cardiovascular disease, liver disease, renal failure, and malignancy were frequent causes of non‐AIDS death, the most common cause was non‐AIDS infection. Further, the proportion of deaths due to non‐AIDS infections did not decrease significantly over time.
A similar study of HIV‐positive inpatients in New York City also found that the majority of non‐AIDS deaths were due to non‐AIDS infections in the ART era.[17] The most common causes of non‐AIDS infection identified in the study were identical to ours: unspecified sepsis followed by nonrecurrent bacterial pneumonia and Clostridium difficile infection. Evidence suggests that individuals with HIV infection have multiple immunological defects that not only lead to increased susceptibility to bacterial infection but also to an unregulated inflammatory response, even in patients who are on ART and virologically suppressed.[28, 29] This highlights the need for hospital physicians to evaluate an HIV‐infected patient's risk for more routine infections that are not commonly considered AIDS related in addition to traditional opportunistic infections. It also implies that inpatient providers should carefully monitor HIV‐positive patients admitted for bacterial infections, as they remain at higher risk for the development of septic shock.
Cardiovascular and liver disease represented the next most common causes of death, which is similar to the New York City study and is consistent with other studies from the ART era.[15, 16, 17, 18] Although deaths due directly to cardiovascular and liver disease did not significantly change over time, these represented the major comorbidities associated with non‐AIDS mortality and, along with renal disease, increased significantly over the study period. There are accumulating studies indicating that HIV infection is associated with accelerated coronary artery disease due to the immune and inflammatory response to the viral replication.[30] Additionally, ART side effects such as hyperlipidemia, metabolic syndrome, and insulin resistance contribute to an increased cardiovascular risk profile.[31] Our findings emphasize the importance of assessing comorbidities not classically considered HIV related. For example, acute coronary syndrome should be in the differential diagnosis for HIV‐infected patients admitted with chest pain regardless of age. Furthermore, HIV‐infected patients are at increased risk for hepatitis B and C coinfection due to related behavioral risk, and coinfection is associated with rapid progression to liver cirrhosis[32, 33, 34] and increased risk for oncogenesis over time rapidly expanding therapeutic options will benefit patients with chronic liver disease.[35, 36, 37]
Although the numbers are relatively small, non‐AIDS malignancy deaths more than quadrupled from the early to the late ART eras. This finding likely underestimates the proportion of overall hospital deaths due to non‐AIDS malignancies given the increased use of hospice facilities and community‐based care,[38] though it is consistent with increasing trends noted in other studies.[39] Doubling of malignancy as a cause of death among AIDS patients from 2000 to 2010 was reported in a French study, as well as in a large multicohort study from 1999 to 2011, consistent with our findings.[16, 40] Developing and implementing screening guidelines for non‐AIDS malignancy among those with HIV at the primary care level may potentially reduce this upward trend.[41] Inpatient providers need to be aware of this trend and consider undiagnosed non‐AIDS malignancy as part of their differential diagnosis when evaluating HIV‐positive patients.
Although emphasis has been placed on non‐AIDS causes, nearly one‐half of all deaths for the entire period, and almost one‐third of deaths in the late ART era were still due to AIDS‐related causes. This is similar to a study of 40,000 patients in Europe and North America from 1996 to 2006, where AIDS deaths comprised almost half of all deaths,[7] as well as a French national study,[16] and remains characteristic of resource‐limited settings.[42] This indicates the need for continued vigilance toward earlier HIV case detection and retention in care to prevent disease progression and AIDS‐related mortality. Primary care and hospital physicians should assess risk for HIV infection in all patients and institute universal HIV testing in both the inpatient and outpatient settings.
Although the majority of our sample was nonwhite and male, there was sufficient demographic diversity to determine that race and gender differences were not statistically significant contributors to mortality. In contrast, hospital‐based and population‐based studies reporting racial and gender disparities in HIV‐associated mortality have attributed this to poor access to health care.[9, 17, 43, 44, 45, 46] Compared to the New York City study, patients in our study had comparable median age and CD4 cell count, but also had greater ART use and better virologic control.[17] We speculate that in our smaller urban area, characterized by strong community and clinical HIV programs, patients may have had improved access to care without regard to race and gender.
Our study strengths include a large sample size, a diverse population with a relatively high proportion of women, and varied age and race, as well as data acquired in a standardized fashion over a prolonged period of ART availability. Further, 2 clinicians classified causes of death independently, utilizing validated definitions to minimize bias. Our late ART era evaluation is consistent with other HIV cohort studies,[25] though we utilized multivariate analysis to uncover independent correlates of mortality, a feature not employed in other studies.[16, 17]
We also recognize several limitations in our study. Our study design was associated with the recognized limitations of retrospective research, including missing data. We examined in‐hospital deaths at a single urban hospital in the Northeastern United States only, affecting the generalizability of our findings. The study did not include a control group of hospitalized HIV‐infected patients who survived or hospitalized HIV‐negative patients who died, which might have further strengthened our findings. Despite these limitations, this study provides important observations that can inform strategies to impact HIV‐associated mortality in the inpatient setting.
In conclusion, the mortality profile of hospitalized HIV‐infected patients has evolved with the epidemic. Caring for the hospitalized HIV‐infected patient has become increasingly complex because patients are more likely to suffer from multiple comorbidities, especially cardiovascular and liver diseases, and to die from non‐AIDS causes. Inpatient providers need to understand the changing trends in chronic HIV disease management as patients are living longer with antiretroviral therapy and are increasingly likely to succumb to nonAIDS‐related causes of death. Clinicians can no longer remain focused on AIDS‐defining opportunistic infections and need to recognize the emerging importance of chronic comorbidities when developing a differential diagnosis, and the higher risk of death due to non‐AIDS infectious causes. Physicians caring for hospitalized patients should appreciate the current trends in the HIV epidemic to provide comprehensive and appropriate interventions that can reduce mortality for HIV‐infected inpatients.
Disclosures: This research was supported by the National Institute of Allergy and Infectious Diseases (S.S.; 1K23AI089260). The authors report no conflicts of interest.
- , , , et al. Changes in the risk of death after HIV seroconversion compared with mortality in the general population. JAMA. 2008;300:51–59.
- , , . Improvement in the health of HIV‐infected persons in care: reducing disparities. Clin Infect Dis. 2012;55:1242–1251.
- , , , et al. Mortality in well controlled HIV in the continuous antiretroviral therapy arms of the SMART and ESPRIT trials compared with the general population. AIDS. 2013;27:973–979.
- , , , et al. Mortality of HIV‐infected patients starting potent antiretroviral therapy: comparison with the general population in nine industrialized countries. Int J Epidemiol. 2009;38:1624–1633.
- , , , et al. Mortality in the highly active antiretroviral therapy era: changing causes of death and disease in the HIV outpatient study. J Acquir Immune Defic Syndr. 2006;43:27–34.
- , , , et al. Risk, predictors, and mortality associated with non‐AIDS events in newly diagnosed HIV‐infected patients: role of antiretroviral therapy. AIDS. 2013;27:181–189.
- Antiretroviral Therapy Cohort Collaboration. Causes of death in HIV‐1‐infected patients treated with antiretroviral therapy, 1996–2006: collaborative analysis of 13 HIV cohort studies. Clin Infect Dis. 2010;50:1387–1396.
- , , , et al. Risk of all‐cause mortality associated with nonfatal AIDS and serious non‐AIDS events among adults infected with HIV. AIDS. 2010;24:697–706.
- , , , et al. Race and sex differences in antiretroviral therapy use and mortality among HIV‐infected persons in care. J Infect Dis. 2009;199:991–998.
- , , , . The influence of sex, race/ethnicity, and educational attainment on human immunodeficiency virus death rates among adults, 1993–2007. Arch Intern Med. 2012;172:1591–1598.
- , , , et al. Rates of hospitalizations and associated diagnoses in a large multisite cohort of HIV patients in the United States, 1994–2005. AIDS. 2008;22:1345–1354.
- , , , et al. Trends and causes of hospitalizations among HIV‐infected persons during the late HAART era: what is the impact of CD4 counts and HAART use? J Acquir Immune Defic Syndr. 2010;54:248–257.
- , . Hospitalization rates of people living with HIV in the United States, 2009. Public Health Rep. 2014;129:178–186.
- Agency for Healthcare Research and Quality. 2009 National Healthcare Quality Report. Available at: http://archive.ahrq.gov/research/findings/nhqrdr/nhqr09. Accessed May 8, 2015.
- , , , et al. Comparisons of causes of death and mortality rates among HIV‐infected persons: analysis of the pre‐, early, and late HAART (Highly Active Antiretroviral Therapy) Eras. J Acquir Immune Defic Syndr. 2006;41:194–200.
- , , , et al. Causes of death among HIV‐infected patients in France in 2010 (national survey): trends since 2000. AIDS. 2014;28:1181–1191.
- , , , , , . All‐cause mortality in hospitalized HIV‐infected patients at an acute tertiary care hospital with a comprehensive outpatient HIV care program in New York City in the era of highly active antiretroviral therapy (HAART). Infection. 2013;41:545–551.
- , , , . Causes of death among persons with AIDS in the era of highly active antiretroviral therapy: New York City. Ann Intern Med. 2006;145:397–406.
- Connecticut Department of Public Health. TB, HIV, STD 12:109–117.
- , , , et al. 1993 revised classification system for HIV infection and expanded surveillance case definition for AIDS among adolescents and adults. MMWR Recomm Rep. 1992;41:1–19.
- , , , et al. Patterns of the hazard of death after AIDS through the evolution of antiretroviral therapy: 1984–2004. AIDS. 2005;19:2009–2018.
- , , , et al. Continued improvement in survival among HIV‐infected individuals with newer forms of highly active antiretroviral therapy. AIDS. 2007;21:685–692.
- , , , et al. Predictive accuracy of the Veterans Aging Cohort Study index for mortality with HIV infection: a North American cross cohort analysis. J Acquir Immune Defic Syndr. 2013;62:149–163.
- , , , et al. Non‐AIDS‐defining deaths and immunodeficiency in the era of combination antiretroviral therapy. AIDS. 2009;23:1743–1753.
- , , , et al. Causes of death in HIV‐infected patients from the Cologne‐Bonn cohort. Infection. 2014;42:135–140.
- , , , et al. Invasive pneumococcal disease in patients infected with HIV: still a threat in the era of highly active antiretroviral therapy. Clin Infect Dis. 2004;38:1623–1628.
- , , . The effect of HIV infection on the host response to bacterial sepsis. Lancet Infect Dis. 2015;15:95–108.
- , , , et al. HIV infection and the risk of acute myocardial infarction. JAMA Intern Med. 2013;173:614–622.
- . Epidemiology of coronary heart disease in patients with human immunodeficiency virus. Rev Cardiovasc Med. 2014;15(suppl 1):S1–S8.
- , . Impact of human immunodeficiency virus infection on the prevalence and severity of steatosis in patients with chronic hepatitis C virus infection. J Hepatol. 2006;44:1026–1032.
- , , , et al. Influence of human immunodeficiency virus infection on the course of hepatitis C virus infection: a meta‐analysis. Clin Infect Dis. 2001;33:562–569.
- , . Coinfection with HIV‐1 and HCV–a one‐two punch. Gastroenterology. 2009;137:795–814.
- , , , et al. Hepatocellular carcinoma in HIV‐infected patients: epidemiological features, clinical presentation and outcome. AIDS. 2004;18:2285–2293.
- , , , et al. Presentation and outcome of hepatocellular carcinoma in HIV‐infected patients: a U.S.‐Canadian multicenter study. J Hepatol. 2007;47:527–537.
- , , , et al. Ledipasvir and sofosbuvir for 8 or 12 weeks for chronic HCV without cirrhosis. N Engl J Med. 2014;370:1879–1888.
- , , , et al. HIV as a chronic disease: implications for long‐term care at an AIDS‐dedicated skilled nursing facility. J Urban Health. 2000;77:187–203.
- , , , , , . Causes of death in HIV patients and the evolution of an AIDS hospice: 1988–2008. AIDS Res Treat. 2012;2012:390406.
- , , , et al. Trends in underlying causes of death in people with HIV from 1999 to 2011 (D:A:D): a multicohort collaboration. Lancet. 2014;384:241–248.
- , . Screening guidelines for non‐AIDS defining cancers in HIV‐infected individuals. Curr Opin Oncol. 2013;25:518–525.
- , , , et al. Disease patterns and causes of death of hospitalized HIV‐positive adults in West Africa: a multicountry survey in the antiretroviral treatment era. J Int AIDS Soc. 2014;17:18797.
- , , , . Recent trends in hospital utilization and mortality for HIV infection: 2000–2005. J Natl Med Assoc. 2010;102:1131–1138.
- , . Differences in HIV‐related hospitalization among white, black, and Hispanic men and women of Florida. Women Health. 2008;47:1–18.
- , , , . Effect of race and/or ethnicity in use of antiretrovirals and prophylaxis for opportunistic infection: a review of the literature. Public Health Rep. 2002;117:233–251; discussion 1–2.
- . HIV/AIDS in women and racial/ethnic minorities in the U.S. Curr Infect Dis Rep. 2012;14:53–60.
- , , , . Management of human immunodeficiency virus infection in advanced age. JAMA. 2013;309:1397–1405.
Successfully treated human immunodeficiency virus (HIV)‐infected individuals in the United States currently have life expectancy and mortality rates that are similar to the general population.[1, 2, 3, 4] A large multinational study found that the excess mortality rate among HIV‐positive individuals decreased from 40.8 to 6.1 per 1000 person‐years from pre‐1995 to 2006.1 This is largely due to improved access to comprehensive HIV care, in particular widespread antiretroviral (ART) use. However, the proportion of deaths that are not classically considered acquired immunodeficiency syndrome (AIDS)‐related such as liver disease, cardiovascular disease, and non‐AIDS malignancy has increased,[1, 5, 6, 7] particularly among patients with higher CD4 T‐cell counts.[5, 8] Additionally, despite overall decline in mortality, there is evidence of racial and gender differences, with increased mortality risk associated with female gender and black race.[9, 10]
In the current ART era, HIV care has shifted focus from inpatient to outpatient care, with more emphasis on chronic disease management. However, hospitalization rates among HIV‐positive persons remain higher than that of the general population.[11, 12] A cross‐sectional study of HIV‐infected persons in the United States estimated a hospitalization rate of 26.6 per 100 persons in 2009,[13] compared to a rate of 11.9 for the general population during the same year.[14] Possible reasons for higher hospitalization rates include complications of aging or other chronic comorbidities, and consequences of behavioral risk factors such tobacco use and substance abuse.
Characterizing deaths among inpatient HIV‐infected individuals in the ART era is important to developing targeted interventions to further reduce mortality. Prior studies examining in‐hospital deaths of HIV‐positive patients evaluated more limited time periods,[15, 16, 17, 18] and thus did not necessarily assess the full spectrum of changes in mortality that have occurred with the introduction of ART. Furthermore, these studies described causes of death, but did not consistently identify factors associated with non‐AIDS deaths. We examined the trends in in‐hospital deaths among HIV‐infected patients from 1995 to 2011 and identified contributing factors to mortality. As the HIV population is aging, we hypothesized that HIV‐infected patients are more likely to die from nonAIDS‐related death in the late ART era due to factors related to cardiovascular and liver disease, compared to the early ART era.
METHODS
The study was performed at YaleNew Haven Hospital, an urban tertiary care academic teaching hospital with 1008 beds and the state of Connecticut's largest ambulatory HIV clinic. Connecticut ranks seventh nationally (10/100,000) in HIV prevalence; New Haven is second among Connecticut cities in the number of people living with HIV/AIDS.[19] We reviewed all patients with an International Classification of Diseases, Ninth Revision (ICD‐9) code of HIV or AIDS (ICD‐9 codes V08 and 042) who died during hospitalization between January 1, 1995 to December 31, 2011. The Yale Human Investigation Committee granted ethical approval to conduct the study.
A standardized data collection tool was used to abstract demographic characteristics (ie, age, gender, and race), medical comorbidities (ie, diabetes, chronic kidney disease, chronic hepatitis B or C, liver cirrhosis, hypertension, coronary artery disease, congestive heart failure, chronic obstructive lung disease, alcohol and substance abuse), ART use (yes or no), HIV viral load (VL), CD4 cell count, and causes of death. Comorbidities were defined using the Coding of Death in HIV Project protocol, a multinational endeavor to standardize data collection in studies of HIV‐positive patients.[20] Chronic kidney disease included individuals with National Kidney Foundation stage I to V disease. Chronic hepatitis B or C infection was identified in patients who had serologic testing indicative of prior infection. Alcohol and substance abuse were identified when source documents mentioned any history of current alcohol or illicit drug abuse or dependence. ART use was defined as documentation of ART on admission or prescription during hospitalization. This included individuals who were on 2 or more ART agents. The last HIV VL and CD4 cell count available within 1 year and closest to death were recorded. HIV VL suppression was defined as <400 copies/mL.
Two clinicians independently classified the cause of death as AIDS related or non‐AIDS related in accordance with published definitions.[21, 22] Cause of death was determined by review of the medical record, discharge diagnosis, and autopsy report when available. Official death certificates were not available for review. There was discordance in assigning 23 of the 400 causes of death. In these cases, the medical record was reviewed and determined by consensus between the 2 clinicians.
AIDS‐related deaths were categorized as nonspecified AIDS, AIDS infection, and AIDS malignancy. AIDS‐related deaths were defined as those caused by conditions meeting the Centers for Disease Control and Prevention AIDS case definition.[22] Non‐specified AIDS deaths were those occurring in patients with a CD4 count 50 cells/mm3 or with an AIDS‐defining illness, who died from a condition that was not clearly AIDS related. This included septic shock of unclear etiology, first known episode of pneumonia, a gastrointestinal bleed of unclear etiology, and altered mental status of unclear etiology when cerebrospinal fluid analysis or imaging of the brain was not available.
Non‐AIDS deaths included non‐AIDS infection in patients with a CD4 count >50 cells/mm3, cardiovascular disease, liver disease, non‐AIDS malignancy, and renal disease (Table 1). Deaths classified as other incorporated the deaths that did not fall into these categories. Chronic obstructive pulmonary disease (COPD) exacerbation and status asthmaticus were included in this category, because there was only 1 death from each of these causes.
| |
| Non‐AIDS infection | Infectious etiology not on the list of AIDS‐defining conditions, such as Clostridium difficile colitis, endocarditis, bacteremia, nonrecurrent bacterial pneumonia, or septic shock of unclear cause without a CD4 count of less than 50 cells/mm3 or a documented opportunistic infection |
| Cardiovascular disease | Cardiac arrest without clear cause, ischemic or hemorrhagic stroke, congestive heart failure (respiratory failure most likely due to pulmonary edema in the setting of known systolic or diastolic heart failure), myocardial infarction, and cardiac arrhythmia |
| Liver disease | Complications of cirrhosis such as variceal bleed, hepatic encephalopathy, hepatorenal syndrome, and acute liver failure |
| Renal disease | Complications of acute renal failure such as hyperkalemia leading to cardiac arrest. Complications of end‐stage renal disease such as stopping hemodialysis or calciphylaxis |
| Non‐AIDS malignancy | Malignancies not on the AIDS indicator diagnostic list |
| Other causes | Drug overdose, trauma, suicide, Stevens‐Johnson syndrome, macrophage activation syndrome, hemorrhagic pancreatitis, status asthmaticus, COPD exacerbation, status epilepticus of unclear cause, complications of idiopathic thrombocytopenic purpura, and diabetic ketoacidosis |
The early ART era was defined as 1995 to 2001 and the late ART era from 2002 to 2011. During the early period, combination ART was introduced and significantly impacted overall mortality.[23, 24] The late ART era better reflected current in‐hospital deaths and was compared to the early era to evaluate trends over time.[15, 25]
2 analysis and parametric (t test and analysis of variance) methods compared categorical and continuous variables, respectively. Bivariate analysis was used to determine associations with AIDS versus non‐AIDS deaths in the entire study cohort. Multivariable logistic regression was used to identify correlates of non‐AIDS deaths in the (1) complete 17‐year period and (2) late ART era. For all analyses, a P value <0.05 was considered statistically significant. All statistical analysis was performed using SAS 9.3 (SAS Institute, Cary, NC).
RESULTS
Among 12,183 hospital discharges of HIV‐infected patients from 1995 to 2011, 406 (3.3%) died. Six medical records were missing or incomplete; 400 were available for review. The proportion of hospitalized HIV‐infected patients who died declined from 6.2% in 1995 to 1.5% in 2011 (P<0.0001).
Table 2 summarizes all 400 patients' demographic and clinical characteristics, and cause of death. The majority were male (65.5%), nonwhite (73.3%), and taking ART (65.9%), though only one‐third achieved a VL <400 copies/mL on the most recent measurement available in the year prior to death. The majority (56.3%) died due to nonAIDS‐related causes.
| Total, n=400 | Early Era, n=207 | Late Era, n=193 | P Value | |
|---|---|---|---|---|
| ||||
| Median age, y (IQR) | 45 (3852) | 41 (3547) | 49 (4357) | <0.0001 |
| Male gender, no. (%) | 262 (65.5) | 141 (68.1) | 121 (62.7) | 0.25 |
| Race, no. (%) | ||||
| Black | 238 (59.5) | 124 (59.9) | 114 (59.1) | 0.87 |
| White | 105 (26.3) | 55 (26.6) | 50 (25.9) | 0.88 |
| Hispanic | 55 (13.8) | 27 (13.0) | 28 (14.5) | 0.67 |
| Median CD4 cells/mm3 (IQR)a | 90 (12248) | 50 (10150) | 153 (22399) | <0.0001 |
| HIV VL 400 copies/mL, no. (%)b | 77 (31.3) | 12 (13.3) | 65 (41.7) | <0.0001 |
| On ART, no. (%) | 257 (65.9) | 120 (58.3) | 137 (74.5) | 0.0008 |
| Cause of death, no. (%) | ||||
| AIDS‐related, no. (%) | 175 (43.8) | 118 (57.0) | 57 (29.5) | <0.0001 |
| AIDS infection | 85 (21.3) | 58 (28.0) | 27 (14.0) | 0.82 |
| Nonspecified AIDS | 73 (18.3) | 46 (22.2) | 27 (14.0) | 0.99 |
| AIDS malignancy | 17 (4.3) | 14 (6.8) | 3 (1.6) | 0.17 |
| Non‐AIDS‐related, no. (%) | 225 (56.3) | 89 (43.0) | 136 (70.5) | <0.0001 |
| Non‐AIDS infection | 81 (20.3) | 32 (15.5) | 49 (25.4) | 0.99 |
| Cardiovascular | 45 (11.3) | 16 (7.7) | 29 (15.0) | 0.54 |
| Liver related | 34 (8.5) | 18 (8.7) | 16 (8.3) | 0.08 |
| Malignancy | 31 (7.8) | 6 (2.9) | 25 (13.0) | 0.01 |
| Renal failure | 18 (4.5) | 8 (3.9) | 10 (5.2) | 0.66 |
| Other, no. (%) | 16 (4.1) | 9 (4.5) | 7 (3.6) | 0.16 |
Among all AIDS‐related deaths from 1995 to 2011 (Table 2), AIDS‐defining infection was the most common cause (21.3%), followed by nonspecified AIDS (18.3%), and AIDS malignancy (4.3%). The proportion of nonAIDS‐related deaths increased significantly over time (Figure 1). The most common cause of nonAIDS‐related deaths was non‐AIDS infection (20.3%), followed by cardiovascular disease (11.3%), liver disease (8.5%), malignancy (7.8%), and renal failure (4.5%). The most common non‐AIDS infection was sepsis in 43 patients (60.6%), followed by nonrecurrent bacterial pneumonia in 24 patients (33.8%) and Clostridium difficile infection in 4 patients (5.6%). NonAIDS‐related malignancy was the only category to significantly increase from the early ART to late ART era (P=0.01).
Compared to those dying of AIDS‐related causes over the 17‐year period (Table 3), patients dying of nonAIDS‐related causes were older (P<0.0001), less likely to have a CD4 count 200 cells/mm3 (P<0.0001), and more likely to be on ART and virologically suppressed (P<0.0001). Patients who died from nonAIDS‐related causes were also more likely to have diabetes mellitus (P=0.01), chronic kidney disease (P<0.0001), hepatitis C (P<0.0001), liver cirrhosis (P<0.0001), hypertension (P=0.0002), coronary artery disease (P=0.004), and COPD (P=0.04). Of note, there was no statistically significant difference in gender, race, or substance abuse between AIDS‐related and nonAIDS‐related deaths.
| AIDS, n=175 | Non‐AIDS, n=225 | P Value | |
|---|---|---|---|
| |||
| Median age, y (IQR) | 40 (3548) | 48 (4255) | <0.0001 |
| Male gender, no. (%) | 115 (43.9) | 147 (56.1) | 0.94 |
| Race, no. (%) | |||
| Black | 105 (60.3) | 133 (59.4) | 0.84 |
| White | 41 (23.6) | 64 (28.6) | 0.26 |
| Hispanic | 28 (16.1) | 27 (12.1) | 0.25 |
| On ART, no. (%) | 97 (55.8) | 160 (74.1) | 0.0001 |
| CD4 <200 cells/mm3, no. (%)a | 167 (97.1) | 95 (47.2) | <0.0001 |
| HIV VL 400 copies/mL, no. (%)b | 2 (4.1) | 75 (38.1) | <0.0001 |
| Comorbidities, no. (%) | |||
| Diabetes | 13 (7.4) | 35 (15.6) | 0.01 |
| Renal disease | |||
| CKD | 21 (12) | 73 (32.4) | <0.0001 |
| On dialysis | 9 (5.1) | 47 (20.9) | <0.0001 |
| Liver disease | |||
| Hepatitis C | 38 (21.7) | 130 (57.8) | <0.0001 |
| Cirrhosis | 14 (8) | 67 (29.8) | <0.0001 |
| Cardiovascular disease | |||
| Hypertension | 18 (10.3) | 56 (24.9) | 0.0002 |
| CAD | 2 (1.1) | 16 (7.1) | 0.004 |
| CHF | 13 (7.4) | 29 (12.9) | 0.08 |
| COPD | 5 (2.9) | 17 (7.6) | 0.04 |
| Alcohol abuse | 9 (5.1) | 18 (8.0) | 0.26 |
| Polysubstance abuse | 10 (5.7) | 22 (9.8) | 0.14 |
Associations With Non‐AIDS Deaths
Among all clinical factors associated with non‐AIDS deaths (Table 4), only the last CD4 within the year prior to death >200 cells/mm3, VL 400 copies/mL in the year prior to death, and liver and cardiovascular comorbidities were independently associated with non‐AIDS deaths. The last CD4 count >200 cells/mm3 in the year prior to death was the strongest correlate (odds ratio [OR]: 16.5; 95% CI: 5.351.4) of non‐AIDS deaths, whereas gender and race were not significant.
| Overall (19952011) | Early Era (19952001) | Late Era (20022011) | ||||
|---|---|---|---|---|---|---|
| Deaths | 400 | 207 | 193 | |||
| Non‐AIDS | 225 | 89 | 136 | |||
| AIDS | 175 | 118 | 57 | |||
| Odds Ratio (95% CI)a | Adjusted Odds Ratio (95% CI)b | Odds Ratio (95% CI)a | Adjusted Odds Ratiob (95% CI) | Odds Ratio (95% CI)a | Adjusted Odds Ratio (95% CI)b | |
| ||||||
| Clinical factors | ||||||
| Age (per year) | 1.06 (1.04‐1.08) | c | 1.03 (1.01‐1.06) | c | 1.07 (1.03‐1.1) | c |
| Male gender | 0.98 (0.6‐1.5) | c | 1.04 (0.6‐1.9) | c | 1.1 (0.6‐2.0) | c |
| White race (vs nonwhite) | 0.8 (0.5‐1.2) | c | 1.2 (0.6‐2.2) | c | 0.4 (0.2‐0.8) | c |
| CD4 >200 cells/mm3d | 37.6 (14.895.5) | 16.5 (5.351.4) | 24.4 (7.183.2) | 17.4 (3.488.3) | 45.4 (10.5195.5) | 25.9 (5.0134.5) |
| HIV VL 400 copies/mL‖ | 13.6 (5.235.3) | 7.5 (2.324.4) | 9.4 (1.276.6) | c | 15.6 (5.246.4) | 10.9 (2.448.8) |
| On ART | 2.3 (1.5‐3.5) | c | 1.6 (0.9‐2.8) | c | 2.7 (1.35.3) | c |
| Comorbidities | ||||||
| Lung diseasee | 1.9 (1.013.5) | c | 2.4 (1.025.5) | c | 1.5 (0.6‐3.9) | c |
| Kidney diseasee | 3.5 (2.16.0) | c | 3.5 (1.7‐7.3) | 4.9 (1.417.8) | 3.1 (1.47.2) | c |
| Depression | 1.6 (0.8‐ 3.2) | c | 2.5 (0.9‐6.6) | c | 0.95 (0.4‐2.5) | c |
| Substance abusee | 1.9 (1.13.6) | c | 3.7 (1.59.5) | c | 0.9 (0.4‐2.1) | c |
| Diabetes | 2.3 (1.24.5) | c | 2.0 (0.7‐5.5) | c | 1.9 (0.7‐5.0) | c |
| Liver diseasee | 3.6 (2.45.4) | 4.5 (2.29.3) | 2.4 (1.4‐4.3) | 4.4 (1.512.7) | 4.3 (2.28.3) | 7.5 (2.423.4) |
| Cardiovascular diseasee | 2.9 (1.8‐4.6) | 4.2 (1.89.9) | 1.8 (0.9‐3.5) | 4.6 (2.010.3) | 6.8 (1.924.0) | |
In the early ART era (19952001), only CD4 count, renal disease, and cardiovascular disease were independently associated with non‐AIDS deaths; the last CD4 count <200 cells/mm3 in the year prior to death was associated most strongly (OR: 17.4; 95% CI: 3.488.3) with non‐AIDS death, whereas again, gender and race were not significant correlates of non‐AIDS death.
In the late ART era (20022011), similar to those for the entire 17‐year time period, independent correlates of non‐AIDS deaths included last CD4 <200 cells/mm3 in the year prior to death, VL 400 copies/mL in the last year prior to death, and liver and cardiovascular disease. Last CD4 count >200 cells/mm3 in the year prior to death (OR: 25.9; 95% CI: 5134.5) was most strongly correlated with non‐AIDS deaths in the late ART era. Nonwhite patients had a lower likelihood of nonAIDS‐related death (OR: 0.4; 95% CI: 0.2‐0.8), but this was not significant on multivariable regression analysis. Gender difference was not statistically significant.
DISCUSSION
Our study demonstrated changes in the causes of death among HIV‐infected hospitalized patients from 1995 to 2011. To our knowledge, this is the longest duration retrospective analysis of in‐hospital deaths among HIV‐infected patients during the ART era. Knowledge of the changes in comorbidities and causes of death among hospitalized HIV‐infected patients during the ART era could help inpatient providers focus diagnostic and therapeutic efforts and improve overall care. Our findings emphasize that HIV‐infected patients remain at high risk for complications from non‐AIDS infections, even when their immune system has been restored as measured by the CD4 cell count, and at increased risk of cardiovascular and liver disease, which highlights the need to carefully monitor HIV‐positive patients admitted with these conditions.
Comparison of AIDS‐related and nonAIDS‐related deaths in 2 time periods has revealed important findings. First, inpatient deaths of HIV‐infected patients have decreased dramatically (from 6.2% to 1.5%, P<0.0001), and the mortality due to nonAIDS‐related causes has increased significantly over time. Second, we defined demographic and clinical characteristics independently associated with HIV‐infected inpatient mortality. Third, a substantial proportion of in‐hospital deaths were caused by potentially preventable non‐AIDS as well as AIDS‐related diseases.
The striking decline in hospital deaths over time is likely the result of expanded ART use resulting in improved immunologic profiles. NonAIDS‐related causes were responsible for almost three‐quarters of deaths in this large inpatient HIV‐positive population during the late ART era. Similar findings have been reported from other settings in industrialized countries.[5, 7, 16, 17, 18, 26, 27] In our urban population, although cardiovascular disease, liver disease, renal failure, and malignancy were frequent causes of non‐AIDS death, the most common cause was non‐AIDS infection. Further, the proportion of deaths due to non‐AIDS infections did not decrease significantly over time.
A similar study of HIV‐positive inpatients in New York City also found that the majority of non‐AIDS deaths were due to non‐AIDS infections in the ART era.[17] The most common causes of non‐AIDS infection identified in the study were identical to ours: unspecified sepsis followed by nonrecurrent bacterial pneumonia and Clostridium difficile infection. Evidence suggests that individuals with HIV infection have multiple immunological defects that not only lead to increased susceptibility to bacterial infection but also to an unregulated inflammatory response, even in patients who are on ART and virologically suppressed.[28, 29] This highlights the need for hospital physicians to evaluate an HIV‐infected patient's risk for more routine infections that are not commonly considered AIDS related in addition to traditional opportunistic infections. It also implies that inpatient providers should carefully monitor HIV‐positive patients admitted for bacterial infections, as they remain at higher risk for the development of septic shock.
Cardiovascular and liver disease represented the next most common causes of death, which is similar to the New York City study and is consistent with other studies from the ART era.[15, 16, 17, 18] Although deaths due directly to cardiovascular and liver disease did not significantly change over time, these represented the major comorbidities associated with non‐AIDS mortality and, along with renal disease, increased significantly over the study period. There are accumulating studies indicating that HIV infection is associated with accelerated coronary artery disease due to the immune and inflammatory response to the viral replication.[30] Additionally, ART side effects such as hyperlipidemia, metabolic syndrome, and insulin resistance contribute to an increased cardiovascular risk profile.[31] Our findings emphasize the importance of assessing comorbidities not classically considered HIV related. For example, acute coronary syndrome should be in the differential diagnosis for HIV‐infected patients admitted with chest pain regardless of age. Furthermore, HIV‐infected patients are at increased risk for hepatitis B and C coinfection due to related behavioral risk, and coinfection is associated with rapid progression to liver cirrhosis[32, 33, 34] and increased risk for oncogenesis over time rapidly expanding therapeutic options will benefit patients with chronic liver disease.[35, 36, 37]
Although the numbers are relatively small, non‐AIDS malignancy deaths more than quadrupled from the early to the late ART eras. This finding likely underestimates the proportion of overall hospital deaths due to non‐AIDS malignancies given the increased use of hospice facilities and community‐based care,[38] though it is consistent with increasing trends noted in other studies.[39] Doubling of malignancy as a cause of death among AIDS patients from 2000 to 2010 was reported in a French study, as well as in a large multicohort study from 1999 to 2011, consistent with our findings.[16, 40] Developing and implementing screening guidelines for non‐AIDS malignancy among those with HIV at the primary care level may potentially reduce this upward trend.[41] Inpatient providers need to be aware of this trend and consider undiagnosed non‐AIDS malignancy as part of their differential diagnosis when evaluating HIV‐positive patients.
Although emphasis has been placed on non‐AIDS causes, nearly one‐half of all deaths for the entire period, and almost one‐third of deaths in the late ART era were still due to AIDS‐related causes. This is similar to a study of 40,000 patients in Europe and North America from 1996 to 2006, where AIDS deaths comprised almost half of all deaths,[7] as well as a French national study,[16] and remains characteristic of resource‐limited settings.[42] This indicates the need for continued vigilance toward earlier HIV case detection and retention in care to prevent disease progression and AIDS‐related mortality. Primary care and hospital physicians should assess risk for HIV infection in all patients and institute universal HIV testing in both the inpatient and outpatient settings.
Although the majority of our sample was nonwhite and male, there was sufficient demographic diversity to determine that race and gender differences were not statistically significant contributors to mortality. In contrast, hospital‐based and population‐based studies reporting racial and gender disparities in HIV‐associated mortality have attributed this to poor access to health care.[9, 17, 43, 44, 45, 46] Compared to the New York City study, patients in our study had comparable median age and CD4 cell count, but also had greater ART use and better virologic control.[17] We speculate that in our smaller urban area, characterized by strong community and clinical HIV programs, patients may have had improved access to care without regard to race and gender.
Our study strengths include a large sample size, a diverse population with a relatively high proportion of women, and varied age and race, as well as data acquired in a standardized fashion over a prolonged period of ART availability. Further, 2 clinicians classified causes of death independently, utilizing validated definitions to minimize bias. Our late ART era evaluation is consistent with other HIV cohort studies,[25] though we utilized multivariate analysis to uncover independent correlates of mortality, a feature not employed in other studies.[16, 17]
We also recognize several limitations in our study. Our study design was associated with the recognized limitations of retrospective research, including missing data. We examined in‐hospital deaths at a single urban hospital in the Northeastern United States only, affecting the generalizability of our findings. The study did not include a control group of hospitalized HIV‐infected patients who survived or hospitalized HIV‐negative patients who died, which might have further strengthened our findings. Despite these limitations, this study provides important observations that can inform strategies to impact HIV‐associated mortality in the inpatient setting.
In conclusion, the mortality profile of hospitalized HIV‐infected patients has evolved with the epidemic. Caring for the hospitalized HIV‐infected patient has become increasingly complex because patients are more likely to suffer from multiple comorbidities, especially cardiovascular and liver diseases, and to die from non‐AIDS causes. Inpatient providers need to understand the changing trends in chronic HIV disease management as patients are living longer with antiretroviral therapy and are increasingly likely to succumb to nonAIDS‐related causes of death. Clinicians can no longer remain focused on AIDS‐defining opportunistic infections and need to recognize the emerging importance of chronic comorbidities when developing a differential diagnosis, and the higher risk of death due to non‐AIDS infectious causes. Physicians caring for hospitalized patients should appreciate the current trends in the HIV epidemic to provide comprehensive and appropriate interventions that can reduce mortality for HIV‐infected inpatients.
Disclosures: This research was supported by the National Institute of Allergy and Infectious Diseases (S.S.; 1K23AI089260). The authors report no conflicts of interest.
- , , , et al. Changes in the risk of death after HIV seroconversion compared with mortality in the general population. JAMA. 2008;300:51–59.
- , , . Improvement in the health of HIV‐infected persons in care: reducing disparities. Clin Infect Dis. 2012;55:1242–1251.
- , , , et al. Mortality in well controlled HIV in the continuous antiretroviral therapy arms of the SMART and ESPRIT trials compared with the general population. AIDS. 2013;27:973–979.
- , , , et al. Mortality of HIV‐infected patients starting potent antiretroviral therapy: comparison with the general population in nine industrialized countries. Int J Epidemiol. 2009;38:1624–1633.
- , , , et al. Mortality in the highly active antiretroviral therapy era: changing causes of death and disease in the HIV outpatient study. J Acquir Immune Defic Syndr. 2006;43:27–34.
- , , , et al. Risk, predictors, and mortality associated with non‐AIDS events in newly diagnosed HIV‐infected patients: role of antiretroviral therapy. AIDS. 2013;27:181–189.
- Antiretroviral Therapy Cohort Collaboration. Causes of death in HIV‐1‐infected patients treated with antiretroviral therapy, 1996–2006: collaborative analysis of 13 HIV cohort studies. Clin Infect Dis. 2010;50:1387–1396.
- , , , et al. Risk of all‐cause mortality associated with nonfatal AIDS and serious non‐AIDS events among adults infected with HIV. AIDS. 2010;24:697–706.
- , , , et al. Race and sex differences in antiretroviral therapy use and mortality among HIV‐infected persons in care. J Infect Dis. 2009;199:991–998.
- , , , . The influence of sex, race/ethnicity, and educational attainment on human immunodeficiency virus death rates among adults, 1993–2007. Arch Intern Med. 2012;172:1591–1598.
- , , , et al. Rates of hospitalizations and associated diagnoses in a large multisite cohort of HIV patients in the United States, 1994–2005. AIDS. 2008;22:1345–1354.
- , , , et al. Trends and causes of hospitalizations among HIV‐infected persons during the late HAART era: what is the impact of CD4 counts and HAART use? J Acquir Immune Defic Syndr. 2010;54:248–257.
- , . Hospitalization rates of people living with HIV in the United States, 2009. Public Health Rep. 2014;129:178–186.
- Agency for Healthcare Research and Quality. 2009 National Healthcare Quality Report. Available at: http://archive.ahrq.gov/research/findings/nhqrdr/nhqr09. Accessed May 8, 2015.
- , , , et al. Comparisons of causes of death and mortality rates among HIV‐infected persons: analysis of the pre‐, early, and late HAART (Highly Active Antiretroviral Therapy) Eras. J Acquir Immune Defic Syndr. 2006;41:194–200.
- , , , et al. Causes of death among HIV‐infected patients in France in 2010 (national survey): trends since 2000. AIDS. 2014;28:1181–1191.
- , , , , , . All‐cause mortality in hospitalized HIV‐infected patients at an acute tertiary care hospital with a comprehensive outpatient HIV care program in New York City in the era of highly active antiretroviral therapy (HAART). Infection. 2013;41:545–551.
- , , , . Causes of death among persons with AIDS in the era of highly active antiretroviral therapy: New York City. Ann Intern Med. 2006;145:397–406.
- Connecticut Department of Public Health. TB, HIV, STD 12:109–117.
- , , , et al. 1993 revised classification system for HIV infection and expanded surveillance case definition for AIDS among adolescents and adults. MMWR Recomm Rep. 1992;41:1–19.
- , , , et al. Patterns of the hazard of death after AIDS through the evolution of antiretroviral therapy: 1984–2004. AIDS. 2005;19:2009–2018.
- , , , et al. Continued improvement in survival among HIV‐infected individuals with newer forms of highly active antiretroviral therapy. AIDS. 2007;21:685–692.
- , , , et al. Predictive accuracy of the Veterans Aging Cohort Study index for mortality with HIV infection: a North American cross cohort analysis. J Acquir Immune Defic Syndr. 2013;62:149–163.
- , , , et al. Non‐AIDS‐defining deaths and immunodeficiency in the era of combination antiretroviral therapy. AIDS. 2009;23:1743–1753.
- , , , et al. Causes of death in HIV‐infected patients from the Cologne‐Bonn cohort. Infection. 2014;42:135–140.
- , , , et al. Invasive pneumococcal disease in patients infected with HIV: still a threat in the era of highly active antiretroviral therapy. Clin Infect Dis. 2004;38:1623–1628.
- , , . The effect of HIV infection on the host response to bacterial sepsis. Lancet Infect Dis. 2015;15:95–108.
- , , , et al. HIV infection and the risk of acute myocardial infarction. JAMA Intern Med. 2013;173:614–622.
- . Epidemiology of coronary heart disease in patients with human immunodeficiency virus. Rev Cardiovasc Med. 2014;15(suppl 1):S1–S8.
- , . Impact of human immunodeficiency virus infection on the prevalence and severity of steatosis in patients with chronic hepatitis C virus infection. J Hepatol. 2006;44:1026–1032.
- , , , et al. Influence of human immunodeficiency virus infection on the course of hepatitis C virus infection: a meta‐analysis. Clin Infect Dis. 2001;33:562–569.
- , . Coinfection with HIV‐1 and HCV–a one‐two punch. Gastroenterology. 2009;137:795–814.
- , , , et al. Hepatocellular carcinoma in HIV‐infected patients: epidemiological features, clinical presentation and outcome. AIDS. 2004;18:2285–2293.
- , , , et al. Presentation and outcome of hepatocellular carcinoma in HIV‐infected patients: a U.S.‐Canadian multicenter study. J Hepatol. 2007;47:527–537.
- , , , et al. Ledipasvir and sofosbuvir for 8 or 12 weeks for chronic HCV without cirrhosis. N Engl J Med. 2014;370:1879–1888.
- , , , et al. HIV as a chronic disease: implications for long‐term care at an AIDS‐dedicated skilled nursing facility. J Urban Health. 2000;77:187–203.
- , , , , , . Causes of death in HIV patients and the evolution of an AIDS hospice: 1988–2008. AIDS Res Treat. 2012;2012:390406.
- , , , et al. Trends in underlying causes of death in people with HIV from 1999 to 2011 (D:A:D): a multicohort collaboration. Lancet. 2014;384:241–248.
- , . Screening guidelines for non‐AIDS defining cancers in HIV‐infected individuals. Curr Opin Oncol. 2013;25:518–525.
- , , , et al. Disease patterns and causes of death of hospitalized HIV‐positive adults in West Africa: a multicountry survey in the antiretroviral treatment era. J Int AIDS Soc. 2014;17:18797.
- , , , . Recent trends in hospital utilization and mortality for HIV infection: 2000–2005. J Natl Med Assoc. 2010;102:1131–1138.
- , . Differences in HIV‐related hospitalization among white, black, and Hispanic men and women of Florida. Women Health. 2008;47:1–18.
- , , , . Effect of race and/or ethnicity in use of antiretrovirals and prophylaxis for opportunistic infection: a review of the literature. Public Health Rep. 2002;117:233–251; discussion 1–2.
- . HIV/AIDS in women and racial/ethnic minorities in the U.S. Curr Infect Dis Rep. 2012;14:53–60.
- , , , . Management of human immunodeficiency virus infection in advanced age. JAMA. 2013;309:1397–1405.
© 2015 Society of Hospital Medicine
