User login
8 tips to help patients cope with insomnia
Patients who struggle with insomnia may be better able to cope with their condition if they follow some of the tips listed in this patient handout from Neurology Reviews. Resisting naps, exercising earlier in the day, and avoiding the use of certain electronic devices before bedtime are among the tips offered at: http://cdn4.imng.com/fileadmin/qhi/nr/pdfs/53_TIPS_Insomnia_1115.pdf.
Patients who struggle with insomnia may be better able to cope with their condition if they follow some of the tips listed in this patient handout from Neurology Reviews. Resisting naps, exercising earlier in the day, and avoiding the use of certain electronic devices before bedtime are among the tips offered at: http://cdn4.imng.com/fileadmin/qhi/nr/pdfs/53_TIPS_Insomnia_1115.pdf.
Patients who struggle with insomnia may be better able to cope with their condition if they follow some of the tips listed in this patient handout from Neurology Reviews. Resisting naps, exercising earlier in the day, and avoiding the use of certain electronic devices before bedtime are among the tips offered at: http://cdn4.imng.com/fileadmin/qhi/nr/pdfs/53_TIPS_Insomnia_1115.pdf.
Proportion of HCV patients with cirrhosis is climbing
Despite a decline in the overall prevalence of hepatitis C virus (HCV) in the United States, the number of HCV patients with cirrhosis has risen significantly. Researchers report that the estimated prevalence of cirrhosis in HCV-infected patients has climbed from 6.6% in the early 1990s to more than 17% in the present era. Read more about this study, including the factors contributing to this increase, at Family Practice News. http://www.familypracticenews.com/specialty-focus/infectious-diseases/single-article-page/proportion-of-hcv-patients-in-us-with-cirrhosis-climbing/0a460b7fef6d035236f12b94f8aafc32.html
Despite a decline in the overall prevalence of hepatitis C virus (HCV) in the United States, the number of HCV patients with cirrhosis has risen significantly. Researchers report that the estimated prevalence of cirrhosis in HCV-infected patients has climbed from 6.6% in the early 1990s to more than 17% in the present era. Read more about this study, including the factors contributing to this increase, at Family Practice News. http://www.familypracticenews.com/specialty-focus/infectious-diseases/single-article-page/proportion-of-hcv-patients-in-us-with-cirrhosis-climbing/0a460b7fef6d035236f12b94f8aafc32.html
Despite a decline in the overall prevalence of hepatitis C virus (HCV) in the United States, the number of HCV patients with cirrhosis has risen significantly. Researchers report that the estimated prevalence of cirrhosis in HCV-infected patients has climbed from 6.6% in the early 1990s to more than 17% in the present era. Read more about this study, including the factors contributing to this increase, at Family Practice News. http://www.familypracticenews.com/specialty-focus/infectious-diseases/single-article-page/proportion-of-hcv-patients-in-us-with-cirrhosis-climbing/0a460b7fef6d035236f12b94f8aafc32.html
High-dose vitamin D increases fall risk in study of 200 patients
Older adults treated with high-dose vitamin D as part of a double-blind, randomized clinical trial achieved target 25-hydroxyvitamin D levels at 6 and 12 months, but did not achieve the primary endpoint of improved lower extremity function.
In fact, the highest dose used in the study – 60,000 IU of vitamin D3 monthly – was associated with an increased risk of falls, according to Dr. Heike A. Bischoff-Ferrari of University Hospital Zurich, and her colleagues.
In the 200 home-dwelling adults aged older than 70 years who participated in the 1-year study, monthly doses of 60,000 IU of vitamin D3 and 24,000 IU of vitamin D3 plus 300 mcg of calcifediol were significantly more likely than a 24,000 IU dose of vitamin D3 alone to result in 25-hydroxyvitamin D levels of at least 30 ng/mL at 6 and 12 months, but lower extremity function did not differ among the groups, the investigators reported in a study published online Jan. 4 in JAMA Internal Medicine.
For example, the adjusted changes in Short Physical Performance Battery scores – a measure of walking speed, successive chair stands, and balance – were 0.17, 0.16, and 0.16 at 6 months in the 24,000 IU, 60,000 IU, and 24,000 IU plus calcifediol groups, respectively, and 0.38, 0.10, and 0.11 at 12 months (JAMA Intern Med. 2016 Jan 4. doi: 10.1001/jamainternmed.2015.7148).

However, the incidence of falls was 66.9%, 66.1%, and 47.9% in the groups, respectively, and the mean number of falls was higher in the 60,000 IU group (1.47) and 24,000 IU plus calcifediol group (1.24) than in the 24,000 IU group (0.94), they said, noting that a similar pattern was observed during study months 0-6 and months 7-12.
Study subjects had a mean age of 78 years, 58% were vitamin D deficient with levels of less than 20 ng/mL at baseline, and 13% were severely deficient (levels less than 10 ng/mL). All had experienced a low-trauma fall in the previous 12 months and were thus considered a high-risk group for vitamin D deficiency and functional decline. Vitamin D supplementation was given via one 5-mL drink solution each month that provided 24,000 IU of vitamin D3 – equivalent to the current recommendation of 800 IU/day – plus three placebo capsules; a 5-mL drink solution that provided 60,000 IU of vitamin D3 – the equivalent of 2,000 IU/day – plus three placebo capsules; or a 5-mL placebo drink, two capsules containing 12,000 IU of vitamin D3 each, and one capsule containing 300 mcg of calcifediol, which is a potent liver metabolite of vitamin D.
Although vitamin D supplementation has been proposed as a possible strategy for delaying functional decline because of its effects on muscle strength, the current findings, which are consistent with some prior studies, suggest that high-doses of vitamin D confer no benefit with respect to function decline, compared with a standard-of-care dose of 24,000 IU of D3, and that high doses may increase falls in those with a prior fall event. Further research is needed to confirm the findings for daily dosing regimens, as well as to explore the physiology behind a possible detrimental effect of a high monthly bolus dose of vitamin D on muscle function and falls, they concluded.
This study was funded by the Swiss National Science Foundation and the VELUX Foundations, as well as by investigator-initiated funds from Merck Sharp & Dohme AG, WILD, and DSM Nutritional Products. Dr. Bischoff-Ferrari reported receiving speaker fees from and serving on advisory boards for Merck Sharp & Dohme AG, Amgen, WILD, DSM Nutritional Products, Roche Diagnostics, Nestle, Pfizer, and Sanofi.
The vitamin D storyline may be similar to that of antioxidant vitamins, Dr. Steven R. Cummings and his colleagues wrote in an editorial.
“Enthusiasm for the health benefits of vitamin supplements is coupled with the belief that ‘vitamins’ are inherently safe and reinforced by observational studies showing, essentially, that healthy people have higher vitamin levels. Then [randomized, controlled trials] and meta-analyses proved that the supplements in fact increase mortality (beta carotene, vitamin E), or have no health benefits (vitamin A, vitamin C),” they wrote (JAMA Intern Med. 2016 Jan 4. doi: 10.1001/jamainternmed.2015.7568).
The strategy of supplementation with vitamin D to achieve serum levels of at least 30 ng/mL to reduce the risk of falls and fractures has not been established, and according to the findings by Bischoff-Ferrari et al., it may increase the risk of falling.
“Until that approach is supported by randomized trials with updated meta-analyses, it would be prudent to follow recommendation from the Institute of Medicine (IOM) that people 70 years or older have a total daily intake of 800 IU of vitamin D without routine measurement of serum 25(OH)D levels,” they wrote, adding that recommended intakes are best achieved through a balanced diet.
Dr. Cummings is with the California Pacific Medical Center Research Institute, San Francisco, and the University of California, San Francisco. He and his coauthors reported having no disclosures.
Older adults treated with high-dose vitamin D as part of a double-blind, randomized clinical trial achieved target 25-hydroxyvitamin D levels at 6 and 12 months, but did not achieve the primary endpoint of improved lower extremity function.
In fact, the highest dose used in the study – 60,000 IU of vitamin D3 monthly – was associated with an increased risk of falls, according to Dr. Heike A. Bischoff-Ferrari of University Hospital Zurich, and her colleagues.
In the 200 home-dwelling adults aged older than 70 years who participated in the 1-year study, monthly doses of 60,000 IU of vitamin D3 and 24,000 IU of vitamin D3 plus 300 mcg of calcifediol were significantly more likely than a 24,000 IU dose of vitamin D3 alone to result in 25-hydroxyvitamin D levels of at least 30 ng/mL at 6 and 12 months, but lower extremity function did not differ among the groups, the investigators reported in a study published online Jan. 4 in JAMA Internal Medicine.
For example, the adjusted changes in Short Physical Performance Battery scores – a measure of walking speed, successive chair stands, and balance – were 0.17, 0.16, and 0.16 at 6 months in the 24,000 IU, 60,000 IU, and 24,000 IU plus calcifediol groups, respectively, and 0.38, 0.10, and 0.11 at 12 months (JAMA Intern Med. 2016 Jan 4. doi: 10.1001/jamainternmed.2015.7148).
However, the incidence of falls was 66.9%, 66.1%, and 47.9% in the groups, respectively, and the mean number of falls was higher in the 60,000 IU group (1.47) and 24,000 IU plus calcifediol group (1.24) than in the 24,000 IU group (0.94), they said, noting that a similar pattern was observed during study months 0-6 and months 7-12.
Study subjects had a mean age of 78 years, 58% were vitamin D deficient with levels of less than 20 ng/mL at baseline, and 13% were severely deficient (levels less than 10 ng/mL). All had experienced a low-trauma fall in the previous 12 months and were thus considered a high-risk group for vitamin D deficiency and functional decline. Vitamin D supplementation was given via one 5-mL drink solution each month that provided 24,000 IU of vitamin D3 – equivalent to the current recommendation of 800 IU/day – plus three placebo capsules; a 5-mL drink solution that provided 60,000 IU of vitamin D3 – the equivalent of 2,000 IU/day – plus three placebo capsules; or a 5-mL placebo drink, two capsules containing 12,000 IU of vitamin D3 each, and one capsule containing 300 mcg of calcifediol, which is a potent liver metabolite of vitamin D.
Although vitamin D supplementation has been proposed as a possible strategy for delaying functional decline because of its effects on muscle strength, the current findings, which are consistent with some prior studies, suggest that high-doses of vitamin D confer no benefit with respect to function decline, compared with a standard-of-care dose of 24,000 IU of D3, and that high doses may increase falls in those with a prior fall event. Further research is needed to confirm the findings for daily dosing regimens, as well as to explore the physiology behind a possible detrimental effect of a high monthly bolus dose of vitamin D on muscle function and falls, they concluded.
This study was funded by the Swiss National Science Foundation and the VELUX Foundations, as well as by investigator-initiated funds from Merck Sharp & Dohme AG, WILD, and DSM Nutritional Products. Dr. Bischoff-Ferrari reported receiving speaker fees from and serving on advisory boards for Merck Sharp & Dohme AG, Amgen, WILD, DSM Nutritional Products, Roche Diagnostics, Nestle, Pfizer, and Sanofi.
FROM JAMA INTERNAL MEDICINE
Key clinical point: Older adults treated with high-dose vitamin D as part of a double-blind, randomized clinical trial achieved target 25-hydroxyvitamin D levels at 6 and 12 months, but did not achieve the primary endpoint of improved lower extremity function.
Major finding: Fall incidence was 66.9%, 66.1%, and 47.9% with vitamin D3 at doses of 24,000 IU, 60,000 IU, and 24,000 IU, respectively, plus 300 mcg calcifediol.
Data source: A double-blind, randomized trial involving 200 patients.
Disclosures: This study was funded by the Swiss National Science Foundation and the VELUX Foundations, as well as by investigator-initiated funds from Merck Sharp & Dohme AG, WILD, and DSM Nutritional Products. Dr. Bischoff-Ferrari disclosed ties with Merck Sharp & Dohme AG, Amgen, WILD, DSM Nutritional Products, Roche Diagnostics, Nestle, Pfizer, and Sanofi.

Cancer drug discovery database goes 3D

Photo by Rhoda Baer
Researchers have updated the canSAR database, a tool designed to aid cancer drug discovery, by adding 3D structures of faulty proteins and maps of cancer’s communication networks.
The canSAR database brings together biological, chemical, and pharmacological data.
The goal of the database is to make these data accessible to researchers worldwide to help with hypothesis generation and support drug discovery decisions.
Users can search canSAR using text queries, protein/gene name searches, any keyword searches, chemical structure searches, and sequence similarity searches. Users can also explore and filter chemical compound sets, view experimental data, and produce summary plots.
The canSAR database was launched in 2011 with the goal of using Big Data approaches to build a detailed picture of how the majority of known human molecules behave.
The database has already collated billions of experimental measurements, mapping the actions of 1 million drugs and chemicals on human proteins, and it has combined these data with genetic information and results from clinical trials.
The updated version of canSAR uses artificial intelligence to identify nooks and crannies on the surface of faulty cancer-causing molecules as a key step in designing new drugs to block them. It also allows researchers to identify communication lines that can be intercepted within tumor cells, opening up potential new approaches for cancer treatment.
The growing database now holds the 3D structures of almost 3 million cavities on the surface of nearly 110,000 molecules.
“Our database is constantly growing with information and is the largest of its kind, with more than 140,000 users from over 175 countries,” said Bissan Al-Lazikani, PhD, of The Institute of Cancer Research in London, UK.
“And we regularly develop new artificial intelligence technologies that help scientists make predictions and design experiments. Our aim is that cancer scientists will be armed with the data they need to carry out life-saving research into the most exciting drugs of the future.”
“Scientists need to find all the information there is about a faulty gene or protein to understand whether a new drug might work. These data are vast and scattered, but the canSAR database brings them together and adds value by identifying hidden links and presenting the key information easily.”
Details on the updates to canSAR have been published in Nucleic Acid Research. The database is available online at https://cansar.icr.ac.uk/. ![]()
Nonalcoholic fatty liver disease will keep rising ‘in near term’
Nonalcoholic fatty liver disease (NAFLD) almost tripled among United States veterans in a recent 9-year period, investigators reported in the February issue of Clinical Gastroenterology and Hepatology.
The trend “was evident in all racial groups, across all age groups, and in both genders,” said Dr. Fasiha Kanwal of the Michael E. DeBakey Veterans Affairs Medical Center and Baylor College of Medicine, both in Houston, and her associates. The increasing prevalence of NAFLD “is likely generalizable to nonveterans,” and will probably persist because of a “fairly steady” 2%-3% overall annual incidence and a steeper rise among younger individuals, they added. “Nonalcoholic fatty liver disease will continue to remain a major public health problem in the United States, at least in the near and intermediate future.”

Although NAFLD is the leading cause of chronic liver failure in the United States, few studies have examined its incidence or prevalence over time, which are key to predicting future disease burden. Therefore, the investigators analyzed data for more than 9.78 million patients who visited the VA at least once between 2003 and 2011. They defined NAFLD as at least two elevated alanine aminotransferase (ALT) values (greater than 40 IU/mL) separated by at least 6 months, with no history of positive serology for hepatitis B surface antigen or hepatitis C virus RNA, and no alcohol-related ICD-9 codes or positive AUDIT-C scores within a year of elevated ALT levels (Clin Gastroenterol Hepatol. 2015 Aug 7. doi: 10.1016/j.cgh.2015.08.010).
During the study period, more than 1.3 million patients, or 13.6%, met the definition of NAFLD, said the researchers. Age-adjusted incidence rates dropped slightly from 3.16% in 2003 to 2.5% in 2011, ranging between 2.3% and 2.7% in most years. Prevalence, however, rose from 6.3% in 2003 (95% confidence interval, 6.26%-6.3%) to 17.6% in 2011 (95% CI, 17.58%-17.65%), a 2.8-fold increase. Moreover, about one in five patients with NAFLD who visited the VA in 2011 was at risk for advanced fibrosis.
Among individuals who were younger than 45 years, the incidence of NAFLD rose from 2.3 to 4.3 cases per 100 persons (annual percentage change, 7.4%; 95% CI, 5.7% to 9.2%), the researchers also found. “Although recent studies show that the rate of increase in both obesity and diabetes, which are both major risk factors for NAFLD, may be slowing down in the U.S., this may not be the case in the VA, where the prevalence of obesity and diabetes is in fact higher than in the U.S. population,” they said.
In general, the findings mirror a recent analysis of the National Health and Nutrition Examination Survey (Aliment Pharmacol Ther. 2015 Jan;41[1]:65-76), according to the investigators. “The VA is the largest integrated health care system in the United States,” they added. “We believe that the sheer size of the veteran cohort, combined with a complete dearth of information regarding the burden of NAFLD in the VA, renders our findings highly significant. Furthermore, the VA is in a unique position to test and implement systemic changes in medical care delivery to improve the health care of NAFLD patients.”
The study was partially supported by the Michael E. DeBakey Veterans Affairs Medical Center. The researchers had no disclosures.
Kanwal and colleagues present an interesting study assessing the trends in the incidence and prevalence of NAFLD in the United States. Findings suggest that the annual incidence of NAFLD has generally been stable (2.2%-3.2%), while the prevalence of NAFLD has increased by 2.8-fold (6.3%-17.6%). These findings are consistent with the literature and provide additional evidence supporting the increasing burden of NAFLD. Although an important study, there are some limitations to the study design. First, the diagnosis of NAFLD was solely based on elevated liver enzymes, which can underestimate the true incidence and prevalence of NAFLD. In fact, in a recent meta-analysis, NAFLD prevalence based on liver enzymes was 13%, while NAFLD prevalence based on radiologic diagnosis was 25% (Hepatology. 2015 Dec 28. doi: 10.1002/hep.28431. [Epub ahead of print]). Second, the study subjects came from the VA system, which may not be representative of the U.S. population (Patrick AFB, FL: Defense Equal Opportunity Management Institute, 2010). This is important because sex-specific differences in the prevalence of NAFLD have been reported (Hepatology. 2015 Dec 28. doi: 10.1002/hep.28431. [Epub ahead of print]). Nevertheless, these limitations do not minimize the important contribution of this study. There appears to be an alarming increase in the burden of NAFLD within all the racial and age groups in the U.S. Further, this increase in the incidence and prevalence of NAFLD is especially significant among the younger age groups (less than 45 years). This finding is in contrast to others who have reported a higher prevalence in older subjects (Presented at AASLD 2015. San Francisco. Abstract #534). If confirmed, this younger cohort of patients with NAFLD can fuel the future burden of liver disease for the next few decades (JAMA. 2012;307:491-7). Given the current lack of an effective treatment for NAFLD, a national strategy to deal with this important and rising cause of chronic liver disease is urgently needed.
Dr. Zobair M. Younossi, MPH, FACG, AGAF, FAASLD, is chairman, department of medicine, Inova Fairfax Hospital; vice president for research, Inova Health System; professor of medicine, VCU-Inova Campus and Beatty Center for Integrated Research, Falls Church, Va. He has consulted for Gilead, AbbVie, Intercept, BMS, and GSK.
Nonalcoholic fatty liver disease (NAFLD) almost tripled among United States veterans in a recent 9-year period, investigators reported in the February issue of Clinical Gastroenterology and Hepatology.
The trend “was evident in all racial groups, across all age groups, and in both genders,” said Dr. Fasiha Kanwal of the Michael E. DeBakey Veterans Affairs Medical Center and Baylor College of Medicine, both in Houston, and her associates. The increasing prevalence of NAFLD “is likely generalizable to nonveterans,” and will probably persist because of a “fairly steady” 2%-3% overall annual incidence and a steeper rise among younger individuals, they added. “Nonalcoholic fatty liver disease will continue to remain a major public health problem in the United States, at least in the near and intermediate future.”
Although NAFLD is the leading cause of chronic liver failure in the United States, few studies have examined its incidence or prevalence over time, which are key to predicting future disease burden. Therefore, the investigators analyzed data for more than 9.78 million patients who visited the VA at least once between 2003 and 2011. They defined NAFLD as at least two elevated alanine aminotransferase (ALT) values (greater than 40 IU/mL) separated by at least 6 months, with no history of positive serology for hepatitis B surface antigen or hepatitis C virus RNA, and no alcohol-related ICD-9 codes or positive AUDIT-C scores within a year of elevated ALT levels (Clin Gastroenterol Hepatol. 2015 Aug 7. doi: 10.1016/j.cgh.2015.08.010).
During the study period, more than 1.3 million patients, or 13.6%, met the definition of NAFLD, said the researchers. Age-adjusted incidence rates dropped slightly from 3.16% in 2003 to 2.5% in 2011, ranging between 2.3% and 2.7% in most years. Prevalence, however, rose from 6.3% in 2003 (95% confidence interval, 6.26%-6.3%) to 17.6% in 2011 (95% CI, 17.58%-17.65%), a 2.8-fold increase. Moreover, about one in five patients with NAFLD who visited the VA in 2011 was at risk for advanced fibrosis.
Among individuals who were younger than 45 years, the incidence of NAFLD rose from 2.3 to 4.3 cases per 100 persons (annual percentage change, 7.4%; 95% CI, 5.7% to 9.2%), the researchers also found. “Although recent studies show that the rate of increase in both obesity and diabetes, which are both major risk factors for NAFLD, may be slowing down in the U.S., this may not be the case in the VA, where the prevalence of obesity and diabetes is in fact higher than in the U.S. population,” they said.
In general, the findings mirror a recent analysis of the National Health and Nutrition Examination Survey (Aliment Pharmacol Ther. 2015 Jan;41[1]:65-76), according to the investigators. “The VA is the largest integrated health care system in the United States,” they added. “We believe that the sheer size of the veteran cohort, combined with a complete dearth of information regarding the burden of NAFLD in the VA, renders our findings highly significant. Furthermore, the VA is in a unique position to test and implement systemic changes in medical care delivery to improve the health care of NAFLD patients.”
The study was partially supported by the Michael E. DeBakey Veterans Affairs Medical Center. The researchers had no disclosures.
FROM CLINICAL GASTROENTEROLOGY AND HEPATOLOGY
Key clinical point: The prevalence of nonalcoholic fatty liver disease has risen substantially since 2003, and will probably keep increasing in the near term.
Major finding: Prevalence among veterans rose about 2.8 times between 2003 and 2011, mirroring trends reported in the general population.
Data source: An analysis of data from 9.78 million Veterans Affairs patients.
Disclosures: The study was partially supported by the Michael E. DeBakey Veterans Affairs Medical Center. The researchers had no disclosures.

Is there an increased risk of GI bleeds with SSRIs?
Yes. Selective serotonin reuptake inhibitors (SSRIs) are likely associated with a moderate increased risk of upper gastrointestinal (UGI) bleeding. Use of a nonsteroidal anti-inflammatory drug (NSAID) in combination with the SSRI appears to amplify the risk (strength of recommendation [SOR]: B, meta-analysis of cohort and case control studies).
The increased risk from SSRIs occurs within the first 7 to 28 days after exposure (SOR: B, retrospective study).
SSRIs raise bleeding risk; concurrent NSAIDs raise it more
A 2014 systematic review and meta-analysis of 19 case-control and cohort studies with a total of 446,949 patients investigated the risk of UGI bleeding in patients using SSRIs and NSAIDs.1 The studies, which included both inpatients and outpatients, were done in Europe and North America. Patients were at least 16 years old, but pooled demographics were not reported. Investigators compared SSRI use with or without concurrent NSAID use to placebo or no treatment.
SSRI use was associated with an increased risk of UGI bleeding in 15 case-control studies (393,268 patients; odds ratio [OR]=1.7; 95% confidence interval [CI], 1.4-1.9) and 4 cohort studies (53,681 patients; OR=1.7; 95% CI, 1.1-2.5). The simultaneous use of SSRIs and NSAIDs compared to nonuse of both medications was associated with a larger increase in bleeding risk (10 case-control studies, 223,336 patients; OR=4.3; 95% CI, 2.8-6.4).
The meta-analysis is limited by statistically significant heterogeneity in all of the pooled results and high risk of bias in 9 of the case-control studies and all of the cohort studies. There was no evidence of publication bias, however.
Bleeding risk rises 7 to 28 days after SSRI exposure
A 2014 case-crossover study of 5377 inpatients in Taiwan with a psychiatric diagnosis evaluated the risk of UGI bleeding within the first 28 days after SSRI exposure (SSRI-mediated inhibition of platelets occurs within the first 7 to 14 days).2 The average age of the patients was 58 years and 75% of the study population was male. Each patient served as his or her own control.
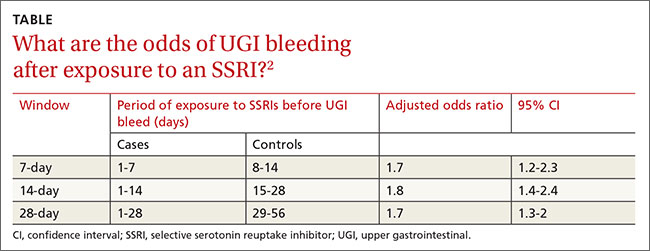
ORs were calculated to compare patients who were exposed to SSRIs only during 7-, 14-, and 21-day windows immediately before a UGI bleed to controls exposed to SSRIs only during the control periods before the 7-, 14-, and 21-day windows. The ORs were adjusted through multivariate analysis to account for 7 potential confounding factors.
SSRI use was associated with an increased risk of UGI bleeding in 7-, 14-, and 21-day windows before the index event (TABLE2). An increased bleeding risk in the 14 days after SSRI initiation was observed in men (OR=2.4; 95% CI, 1.8-3.4) but not women (OR=1.0; 95% CI, 0.6-1.6). Increased bleeding risk in the 14 days after SSRI initiation was also observed in patients younger than 55 years (OR=2.1; 95% CI, 1.5-3.1), patients with a history of upper GI disease (OR=3.1; 95% CI, 1.7-6.0), and patients with no previous exposure to SSRIs (OR=2.6; 95% CI, 1.6-4.2).
This study didn’t account for SSRI indication as a potential confounder, and the study’s inclusion of inpatients, whose illnesses are typically more severe, may limit generalizability.
1. Anglin R, Yuan Y, Moayyedi P, et al. Risk of upper gastrointestinal bleeding with selective serotonin reuptake inhibitors with or without concurrent nonsteroidal anti-inflammatory use: a systematic review and meta-analysis. Am J Gastroenterol. 2014;109:811-819.
2. Wang YP, Chen YT, Tsai C, et al. Short-term use of serotonin reuptake inhibitors and risk of upper gastrointestinal bleeding. Am J Psychiatry. 2014;171:54-61.
Yes. Selective serotonin reuptake inhibitors (SSRIs) are likely associated with a moderate increased risk of upper gastrointestinal (UGI) bleeding. Use of a nonsteroidal anti-inflammatory drug (NSAID) in combination with the SSRI appears to amplify the risk (strength of recommendation [SOR]: B, meta-analysis of cohort and case control studies).
The increased risk from SSRIs occurs within the first 7 to 28 days after exposure (SOR: B, retrospective study).
SSRIs raise bleeding risk; concurrent NSAIDs raise it more
A 2014 systematic review and meta-analysis of 19 case-control and cohort studies with a total of 446,949 patients investigated the risk of UGI bleeding in patients using SSRIs and NSAIDs.1 The studies, which included both inpatients and outpatients, were done in Europe and North America. Patients were at least 16 years old, but pooled demographics were not reported. Investigators compared SSRI use with or without concurrent NSAID use to placebo or no treatment.
SSRI use was associated with an increased risk of UGI bleeding in 15 case-control studies (393,268 patients; odds ratio [OR]=1.7; 95% confidence interval [CI], 1.4-1.9) and 4 cohort studies (53,681 patients; OR=1.7; 95% CI, 1.1-2.5). The simultaneous use of SSRIs and NSAIDs compared to nonuse of both medications was associated with a larger increase in bleeding risk (10 case-control studies, 223,336 patients; OR=4.3; 95% CI, 2.8-6.4).
The meta-analysis is limited by statistically significant heterogeneity in all of the pooled results and high risk of bias in 9 of the case-control studies and all of the cohort studies. There was no evidence of publication bias, however.
Bleeding risk rises 7 to 28 days after SSRI exposure
A 2014 case-crossover study of 5377 inpatients in Taiwan with a psychiatric diagnosis evaluated the risk of UGI bleeding within the first 28 days after SSRI exposure (SSRI-mediated inhibition of platelets occurs within the first 7 to 14 days).2 The average age of the patients was 58 years and 75% of the study population was male. Each patient served as his or her own control.
ORs were calculated to compare patients who were exposed to SSRIs only during 7-, 14-, and 21-day windows immediately before a UGI bleed to controls exposed to SSRIs only during the control periods before the 7-, 14-, and 21-day windows. The ORs were adjusted through multivariate analysis to account for 7 potential confounding factors.
SSRI use was associated with an increased risk of UGI bleeding in 7-, 14-, and 21-day windows before the index event (TABLE2). An increased bleeding risk in the 14 days after SSRI initiation was observed in men (OR=2.4; 95% CI, 1.8-3.4) but not women (OR=1.0; 95% CI, 0.6-1.6). Increased bleeding risk in the 14 days after SSRI initiation was also observed in patients younger than 55 years (OR=2.1; 95% CI, 1.5-3.1), patients with a history of upper GI disease (OR=3.1; 95% CI, 1.7-6.0), and patients with no previous exposure to SSRIs (OR=2.6; 95% CI, 1.6-4.2).
This study didn’t account for SSRI indication as a potential confounder, and the study’s inclusion of inpatients, whose illnesses are typically more severe, may limit generalizability.
1. Anglin R, Yuan Y, Moayyedi P, et al. Risk of upper gastrointestinal bleeding with selective serotonin reuptake inhibitors with or without concurrent nonsteroidal anti-inflammatory use: a systematic review and meta-analysis. Am J Gastroenterol. 2014;109:811-819.
2. Wang YP, Chen YT, Tsai C, et al. Short-term use of serotonin reuptake inhibitors and risk of upper gastrointestinal bleeding. Am J Psychiatry. 2014;171:54-61.
Evidence-based answers from the Family Physicians Inquiries Network
A new standard of care for rel/ref MM?

Photo courtesy of ASH
ORLANDO, FL—Adding the oral proteasome inhibitor ixazomib to treatment with lenalidomide and dexamethasone can prolong progression-free survival (PFS) in patients with relapsed and/or refractory multiple myeloma (MM), according to interim results of the phase 3 TOURMALINE-MM1 trial.
It is not yet clear if the 3-drug combination can prolong overall survival when compared to treatment with lenalidomide and dexamethasone.
However, researchers believe the triplet shows promise and could become a new standard of care for relapsed/refractory MM.
Philippe Moreau, MD, of the University of Nantes in France, discussed this possibility while presenting results from TOURMALINE-MM1 at the 2015 ASH Annual Meeting (abstract 727*). The study was sponsored by Millennium Pharmaceuticals, Inc.
The trial included 722 MM patients enrolled at 147 centers in 26 countries. Patients were randomized to receive ixazomib, lenalidomide, and dexamethasone (IRd, n=360) or placebo, lenalidomide, and dexamethasone (Rd, n=362).
Baseline patient characteristics were similar between the arms. The median age was 66 in both arms (overall range, 30-91), and nearly 60% of patients in both arms were male.
Fifty percent of patients in the IRd arm and 47% in the Rd arm had an ECOG performance status of 0. Forty-three percent and 45%, respectively, had a status of 1, and 5% and 7%, respectively, had a status of 2.
Eighty-seven percent and 88%, respectively, had an ISS stage of I or II. Fifty-five percent of patients in the IRd arm had standard-risk cytogenetics, as did 60% in the Rd arm.
Fifty-nine percent of patients in both arms had received 1 prior line of therapy, and 41% in both arms had 2 or 3 prior lines.
Response and survival
“Ixazomib, when combined with len-dex . . . , was associated with a significant and meaningful improvement in progression-free survival, improved time to progression, and [higher] response rate as well,” Dr Moreau said.
At a median follow-up of about 15 months, the median PFS was 20.6 months in the IRd arm and 14.7 months in the Rd arm. The hazard ratio was 0.742 (P=0.012).
Dr Moreau said the PFS benefit was consistent across pre-specified subgroups. So the benefit was present regardless of age, ISS stage, cytogenetic risk, number of prior therapies, prior exposure to a proteasome inhibitor, prior immunomodulatory therapy, whether the patient was refractory to his last therapy, and whether the patient had relapsed or refractory disease.
Dr Moreau also pointed out that, in the IRd arm, the median PFS in high-risk patients was similar to that in the overall patient population and in patients with standard-risk cytogenetics. This suggests ixazomib may overcome the negative impact of cytogenetic alterations.
Whether IRd confers an overall survival benefit is not clear, as those data are not yet mature. At a median follow-up of about 23 months, the median overall survival was not reached in either treatment arm.
The researchers conducted a non-inferential PFS analysis at the same time point (23 months) and found the median PFS was 20 months in the IRd arm and 15.9 months in the Rd arm. The hazard ratio was 0.82.
As for other efficacy endpoints, the overall response rate was 78.3% in the IRd arm and 71.5% in the Rd arm (P=0.035). The rates of complete response were 11.7% and 6.6%, respectively (P=0.019). And the rates of very good partial response or greater were 48.1% and 39%, respectively (P=0.014).
The median time to response was 1.1 months in the IRd arm and 1.9 months in the Rd arm. The median duration of response was 20.5 months and 15 months, respectively. And the median time to progression was 21.4 months and 15.7 months, respectively.
Adverse events
At a median follow-up of about 23 months, patients had received a median of 17 cycles of IRd and a median of 15 cycles of Rd.
The incidence of any adverse event (AE) was 98% in the IRd arm and 99% in the Rd arm. The incidence of grade 3 or higher AEs was 74% and 69%, respectively. The incidence of serious AEs was 47% and 49%, respectively.
The incidence of AEs resulting in discontinuation was 17% and 14%, respectively. And the incidence of on-study deaths (occurring within 30 days of the last dose) was 4% and 6%, respectively.
Common AEs in the IRd and Rd arms, respectively, were diarrhea (45% vs 39%), constipation (35% vs 26%), nausea (29% vs 22%), vomiting (23% vs 12%), rash (36% vs 23%), back pain (24% vs 17%), upper respiratory tract infection (23% vs 19%), thrombocytopenia (31% vs 16%), peripheral neuropathy (27% vs 22%), peripheral edema (28% vs 20%), thromboembolism (8% vs 11%), and neutropenia (33% vs 31%).
“Ixazomib is adding limited toxicity to lenalidomide and dex, with a very low rate of peripheral neuropathy and no cardiovascular or renal adverse signals,” Dr Moreau said.
“This all-oral triplet regimen may become one of the new standards of care in the relapsed setting. [It has] a very safe profile, [is] a very effective combination, [and is] simple and convenient.” ![]()
*Data in the abstract differ from the presentation.
Disease Education
Q) The billing consultant who came to our office said we can increase our reimbursements if we also provide education to our patients with chronic kidney disease (CKD). Is she right?
In 2010, under an omnibus bill, kidney disease education (KDE) classes were added as a Medicare benefit. These are for patients with stage 4 CKD (glomerular filtration rate, 15-30 mL/min) and are to be taught by a qualified instructor (MD, PA, NP, or CNS).
The classes can be taught on the same day as an evaluation/management visit (ie, a regular office visit) and are compensated by the hour. (Side note: Medicare defines an hour as 31 minutes—yes, 31 minutes; Medicare takes for granted that you will also need time to chart!) You can teach two classes in the same day. Thus, if you wanted to, you could have a patient arrive for an office visit, then teach two 31-minute classes, and bill all three for the same day. The entire visit could be 75 minutes (although this may be exhausting for this population).
You can conduct the classes in a number of settings, including nursing homes, hospitals, skilled nursing facilities, the office, or even the patient’s home. Many PAs and NPs have taught these classes to hospitalized patients who have lost kidney function due to an acute insult (ie, medications, dehydration, contrast).
Each Medicare recipient has a lifetime benefit of six KDE classes. The CPT billing code is G0420 for an individual class and G0421 for a group class. You must make sure you also code for the stage 4 CKD diagnosis (code: 585.4).
Congress stipulated KDE classes must include information on causes, symptoms, and treatments and comprise a posttest at a specific health literacy level. To make it simple, the National Kidney Foundation Council of Advanced Practitioners (NKF-CAP) has developed two free Power-Point slide decks for clinicians to use in KDE classes (available at www.kidney.org/professionals/CAP/sub_resources#kde). References and updated peer-reviewed guidelines are included. You can print the slides for your patients and/or share the program with your colleagues.
Many nephrology practitioners teach the two slide sets over and over, because patients only retain one-third of the info we provide them on a given day. So if you teach each slide set three times, you have six lifetime classes—and hopefully the patient will have retained everything.
One caveat: Before you initiate KDE classes for a specific patient, check with the patient’s nephrology group (we hope at stage 4 the patient has a nephrologist) to see if they are providing the education. —KZ and JD
Kim Zuber, PA-C, MSPS, DFAAPA
American Academy of Nephrology PAs
Jane S. Davis, CRNP, DNP
Division of Nephrology at the University of Alabama
National Kidney Foundation's Council of Advanced Practitioners
| Clinician Reviews in partnership with |
Renal Consult is edited by Jane S. Davis, CRNP, DNP, a member of the Clinician Reviews editorial board, who is a nurse practitioner in the Division of Nephrology at the University of Alabama at Birmingham and is the communications chairperson for the National Kidney Foundation’s Council of Advanced Practitioners (NKF-CAP); and Kim Zuber, PA-C, MSPS, DFAAPA, a retired physician assistant who works with the American Academy of Nephrology PAs and is also past chair of the NKF-CAP. This month’s responses were authored by Della Connor, PhD, RN, FNP-BC, who is an Assistant Professor at Stephen F. Austin State University in Nacogdoches, Texas, and practices at East Texas Nephrology Associates in Lufkin, and the department editors.
Q) The billing consultant who came to our office said we can increase our reimbursements if we also provide education to our patients with chronic kidney disease (CKD). Is she right?
In 2010, under an omnibus bill, kidney disease education (KDE) classes were added as a Medicare benefit. These are for patients with stage 4 CKD (glomerular filtration rate, 15-30 mL/min) and are to be taught by a qualified instructor (MD, PA, NP, or CNS).
The classes can be taught on the same day as an evaluation/management visit (ie, a regular office visit) and are compensated by the hour. (Side note: Medicare defines an hour as 31 minutes—yes, 31 minutes; Medicare takes for granted that you will also need time to chart!) You can teach two classes in the same day. Thus, if you wanted to, you could have a patient arrive for an office visit, then teach two 31-minute classes, and bill all three for the same day. The entire visit could be 75 minutes (although this may be exhausting for this population).
You can conduct the classes in a number of settings, including nursing homes, hospitals, skilled nursing facilities, the office, or even the patient’s home. Many PAs and NPs have taught these classes to hospitalized patients who have lost kidney function due to an acute insult (ie, medications, dehydration, contrast).
Each Medicare recipient has a lifetime benefit of six KDE classes. The CPT billing code is G0420 for an individual class and G0421 for a group class. You must make sure you also code for the stage 4 CKD diagnosis (code: 585.4).
Congress stipulated KDE classes must include information on causes, symptoms, and treatments and comprise a posttest at a specific health literacy level. To make it simple, the National Kidney Foundation Council of Advanced Practitioners (NKF-CAP) has developed two free Power-Point slide decks for clinicians to use in KDE classes (available at www.kidney.org/professionals/CAP/sub_resources#kde). References and updated peer-reviewed guidelines are included. You can print the slides for your patients and/or share the program with your colleagues.
Many nephrology practitioners teach the two slide sets over and over, because patients only retain one-third of the info we provide them on a given day. So if you teach each slide set three times, you have six lifetime classes—and hopefully the patient will have retained everything.
One caveat: Before you initiate KDE classes for a specific patient, check with the patient’s nephrology group (we hope at stage 4 the patient has a nephrologist) to see if they are providing the education. —KZ and JD
Kim Zuber, PA-C, MSPS, DFAAPA
American Academy of Nephrology PAs
Jane S. Davis, CRNP, DNP
Division of Nephrology at the University of Alabama
National Kidney Foundation's Council of Advanced Practitioners
Advances in Hematology and Oncology (May 2014)

High-risk B-ALL subgroup has ‘outstanding outcomes’

Photo courtesy of ASH
ORLANDO, FL—A subgroup of young patients with high-risk B-cell acute lymphoblastic leukemia (B-ALL) can have “outstanding outcomes” with contemporary therapy, according to researchers.
Results of a large study suggested that patients ages 1 to 30 who have high-risk B-ALL according to National Cancer Institute (NCI) classification can have high rates of event-free survival (EFS) and overall survival (OS) if they have favorable cytogenetic features, have no evidence of CNS disease, and have rapid minimal residual disease (MRD) responses.
The research suggested these patients will not benefit from further chemotherapy intensification.
Elizabeth Raetz, MD, of the University of Utah in Salt Lake City, presented these results at the 2015 ASH Annual Meeting (abstract 807).
She and her colleagues analyzed patients enrolled on the Children’s Oncology Group (COG) AALL03B1 classification study at the time of B-ALL diagnosis. From December 2003 to September 2011, there were 11,144 eligible patients enrolled on this trial.
Eighty-nine percent of these patients were also enrolled on a frontline ALL therapeutic trial, and 96% of these patients were evaluable for post-induction treatment assignment. Sixty-five percent of these patients were treated on a trial for NCI standard-risk B-ALL (COG-AALL0331), and 35% were treated on a trial for high-risk B-ALL (COG-AALL0232).
At the end of induction therapy, patients were classified into low-risk (29%), standard-risk (33%), high-risk (34%), and very-high-risk (4%) groups for further treatment allocation. The variables used for risk classification were age, initial white blood cell count, extramedullary disease status, blast cytogenetics, and early treatment response based on bone marrow morphology and day 29 MRD.
Patients with very-high-risk features (BCR-ABL1, hypodiploidy, induction failure, or poor response at day 43) did not continue on AALL0232/AALL0331 post-induction but did have outcome data captured for analysis.
Response and survival
Rapid early response was defined as M1 (<5% blasts) bone marrow by day 15 plus flow cytometry-based MRD <0.1% on day 29 of induction. Patients with either M2/M3 (≥5% blasts) day 15 marrow or MRD ≥0.1% at day 29 were deemed slow early responders.
Eighty-four percent of patients had a rapid early response to induction, and 16% had a slow early response.
For rapid early responders, the 5-year EFS was 89.3%, and the 5-year OS was 95.2%. For slow early responders, the EFS and OS rates were 67.9% and 84.3%, respectively (P<0.0001 for both EFS and OS comparisons).
Survival according to cytogenetics
Having favorable cytogenetic abnormalities (triple trisomies of chromosomes 4, 10, and 17 or ETV6-RUNX1 fusion) was associated with significantly better EFS and OS than having unfavorable cytogenetics (hypodiploidy [DNA index <0.81 or chromosomes < 44], MLL rearrangements, BCR-ABL1, or iAMP21).
And Dr Raetz pointed out that the 5-year OS exceeded 98% for patients with either standard- or high-risk disease who had favorable cytogenetics.
For patients who were ETV6-RUNX1-positive, the EFS was 93.2% and the OS was 98.3%. For patients who were ETV6-RUNX1 negative, the rates were 83.5% and 92%, respectively (P<0.0001).
For patients with triple trisomy, EFS was 94.7% and OS was 98.7%. For those without triple trisomy, the rates were 83.6% and 92.2%, respectively (P<0.0001).
For patients with MLL rearrangement, the EFS was 73.9% and the OS was 83.1%. For patients without MLL rearrangement, the rates were 85.9% and 93.6%, respectively (P<0.0001).
For patients who were positive for iAMP21, the EFS was 69.5% and the OS was 90.1%. For iAMP21-negative patients, the rates were 86.1% and 93.4%, respectively (P<0.0001 for PFS comparison and P=0.0026 for OS comparison).
Survival according to risk group and MRD
The researchers also assessed EFS and OS among patients with favorable cytogenetics according to NCI risk group and MRD at days 8 and 29.
“One thing to point out is that, regardless of having favorable cytogenetics, those individuals who had end-induction MRD values of greater than 0.01% had inferior outcomes, so that was still a prognostic marker,” Dr Raetz said.
“And one thing that we were pleasantly surprised to see was that, among the NCI high-risk patients, those who had very rapid MRD responses—so less than 1% at day 8 in the blood and less than 0.01% in the marrow on day 29—had a 94.9% 5-year event-free survival and 98.1% overall survival.”
The researchers also divided this group according to age—patients younger than 10 and those 10 years or older. There was no significant difference in EFS or OS between the age groups (P=0.126 and P=0.411).
Standard-risk group
Among patients with <1% MRD on day 8 and <0.01% MRD on day 29, the EFS was 95.7% and the OS was 99.1%.
Among patients with ≥1% MRD on day 8 and <0.01% MRD on day 29, the EFS was 91.7% and the OS was 99.4%.
Among patients with any MRD on day 8 and ≥0.01% MRD on day 29, the EFS was 88.1% and the OS was 96.8%.
High-risk group
Among patients with <1% MRD on day 8 and <0.01% MRD on day 29, the EFS was 94.9% and the OS was 98.1%.
Among patients with ≥1% MRD on day 8 and <0.01% MRD on day 29, the EFS was 93.6% and the OS was 95.5%.
Among patients with any MRD on day 8 and ≥0.01% MRD on day 29, the EFS was 75.4% and the OS was 90.4%.
In closing, Dr Raetz said this study showed that real‐time classification incorporating clinical features, blast cytogenetics, and early response was feasible in a large group of patients enrolled on COG ALL trials and identified patients with varying outcomes for risk‐based treatment allocation.
She noted that early response by marrow morphology was not prognostic when MRD response was used and is therefore no longer used in COG studies.
And although favorable cytogenetic features were not prognostic in NCI high-risk B‐ALL patients in prior COG studies, the current study indicates that these patients can have “excellent outcomes” if they have no evidence of CNS leukemia and are rapid MRD responders. So these patients will not benefit from further chemotherapy intensification. ![]()