User login
Nonadherence and Visit-to-Visit Variability of Blood Pressure
Study Overview
Objective. To determine the association between antihypertensive medication adherence and visit-to-visit variability of blood pressure (BP).
Design. Post hoc analysis of ALLHAT, a randomized, double-blind, multicenter trial to determine whether treatment with calcium-channel blockers, angiotensin-converting enzyme inhibitors, or α-adrenergic blockers, all newer antihypertensive classes at the time of the study, was superior to treatment with a thiazide diuretic for lowering risk for fatal coronary heart disease (CHD) or nonfatal myocardial infarction (MI) (primary outcomes), with secondary outcomes including all-cause mortality, stroke, and combined cardiovascular disease (CHD death, nonfatal MI, stroke, angina, coronary revascularization, congestive heart failure, and peripheral arterial disease).
Setting and participants. Participants who had BP and medication adherence data from at least 5 of the 7 study visits conducted 6 to 28 months after randomization. Only patients who had no outcome events within the 28 months were included in the analysis (ie, no fatal CHD or nonfatal MI, stroke, all-cause mortality, or heart failure). In a secondary analysis, participants who had data from 5 of the 7 study visits between 32 to 56 months after randomization were included.
Measures. Adherence to medication was assessed at each visit by a study clinician using the Adherence Survival Kit developed for ALLHAT. Participants were asked whether they had taken at least 80% of their assigned study drug since the last follow-up visit. For primary analyses, participants were categorized as nonadherent if they reported having taken < 80% of their assigned antihypertensive medication at ≥ 1 visits during the 6- to 28-month time period after randomization. For secondary analyses, participants were categorized as nonadherent if they reported having taken < 80% of their assigned medication at ≥ 1 visits during the 32 to 56 months after randomization. In a sensitivity analysis, participants were categorized as nonadherent if they reported taking < 80% of the prescribed antihypertensive medication at ≥ 2 visits during the 6 to 28 months post-randomization time period. Visit-to-visit variability of BP was calculated using 3 metrics based on each ALLHAT participants’ BP measurements: standard deviation independent of mean (SDIM), SD, and average real variability. The BP used for these calculations was the mean of 2 measurements taken during each follow-up study visit according to a standardized BP measurement protocol. Participants were followed from the end of the visit-to-visit variability of BP assessment period to the date of each outcome, their date of death, or end of active ALLHAT follow-up.
Results. Of 33,357 participants randomized, 19,970 participants met eligibility criteria for primary analyses. Of these, 2912 participants (15%) were considered nonadherent. Compared with adherent participants, nonadherent participants were slightly older and more likely to be Hispanic or black. Nonadherent participants were more likely to have evidence of end-organ damage as signified by major ST segment depression or T wave inversion or left ventricular hypertrophy on electrocardiogram but were less likely to have a history of MI, stroke, or coronary revascularization. Nonadherent participants were also less likely to have used BP medications before randomization and less likely to use statins during follow-up. Nonadherent participants were more likely to have changes in BP medication classes during follow-up, were more likely to have uncontrolled BP between 6 and 28 months after randomization, and had higher mean systolic blood pressure (SBP) and diastolic blood pressure (DBP) at the visits. The association between nonadherence and higher BP remained statistically significant in adjusted analyses.
SDIM of SBP was higher among those who were nonadherent (11.4 ± 4.9 versus 10.5 ± 4.5; P < 0.001). After full adjustment, nonadherent participants had 0.8 (95% CI, 0.7–1.0; P < 0.001) higher SDIM of SBP than adherent participants. In addition, compared with adherent participants, nonadherent participants had higher SD and average real variability of SBP. Researcher found the same pattern when the sample was restricted to 11,290 participants without antihypertensive medication changes. The association between adherence status and visit-to-visit variability of SBP was consistent across antihypertensive drug randomization assignment for interaction term for all definitions of visit-to-visit variability of SBP (P > 0.8). Nonadherent participants also had higher visit-to-visit variability of DBP.
Overall, 4.6% of participants had ≥ 2 visits with < 80% adherence. SDIM of SBP was higher among nonadherent participants versus adherent participants according to this more stringent categorization of nonadherence (11.0 ± 4.6 vs. 10.6 ± 4.6; P = 0.01). After full multivariable adjustment, SDIM of SBP was 0.5 (95% CI, 0.2–0.9; P = 0.001) higher among nonadherent than among adherent participants. Participants who were nonadherent in both the early and late study periods had higher SDIMs of SBP than those who were adherent in both study periods. Minimal changes were found in the SDIM of SBP between the early and late study periods for participants who were adherent in both study periods and nonadherent in both study periods. However, a significant number of participants, had a change in adherence between the early and late study period, with 6.5% switching from adherent to nonadherent and 10.0% switching from nonadherent to adherent. Compared with participants who were adherent in both time periods, participants who changed from adherent to non-adherent had an increase in SDIM of SBP (0.9; 95% CI, 0.5–1.3; P < 0.001), whereas participants who changed from nonadherent to adherent had a decrease in SDIM of SBP (−0.7; 95% CI, −1.0 to −0.3; P < 0.001). Among participants in the primary analysis without a cardiovascular event before the 28-month visit (n = 18 442), being in the highest versus lowest quintile of SDIM of SBP was associated with increased risk of fatal CHD or nonfatal MI, stroke, heart failure, and all-cause mortality after multivariable adjustment. In a mediation analysis, further adjustment for adherence status did not explain the association between SDIM of SBP and any of our cardiovascular or mortality outcomes.
Conclusion. The study provided significant evidence that medication adherence reduces visit-to-visit variability of BP. However, visit-to-visit variability of BP is associated with cardiovascular outcomes independent of medication adherence. Further work is needed to examine both the mechanisms underlying the association between visit-to-visit variability of BP and cardiovascular outcomes and whether decreasing visit-to-visit variability of BP can improve health outcomes.
Commentary
Hypertension remains one of the most important preventable contributors to disease and death [1]. Health care providers continue to reinforce the importance of adherence to medication treatment in conjunction with the adoption of healthy lifestyle habits, which have been shown to be effective interventions [2]. Low adherence to antihypertensive medication has been hypothesized to increase visit-to-visit variability of BP. Literature has shown that visit-to-visit variability of BP is associated with increased risk for stroke, CHD, and mortality [3]. In this post hoc analysis of ALLHAT, the researchers found that nonadherence was associated with increased visit-to-visit variability of BP. The study extended the findings of only a few studies that have tested this association.
Efforts to improve adherence could impact the occurrence of visit-to-visit variability of BP. Current methods of improving medication adherence for chronic health problems are mostly complex and not very effective. Awareness and commitment are essential to promote and ensure adherence in the treatment of disease [4]. Advances in this field of research are needed, including improved design of feasible long-term interventions, objective adherence measures, and sufficient study power to detect improvements outcomes that patients care about [4].
However, in this study, medication nonadherence did not explain the association between visit-to-visit variability of BP levels and cardiovascular risk. The researchers posit that in light of this, improving adherence is unlikely to offset the increased risk associated with visit-to-visit variability of BP found in treated patients with hypertension.
Limitations of this study include the use of self-report for adherence measurement, use of a summary measure for adherence, and the exclusion of a substantial number of participants who had < 5 visits in which adherence was assessed.
Applications for Clinical Practice
Although nonadherence to medication treatment contributed to visit-to-visit variability of BP, nonadherence did not explain why individuals with higher visit-to-visit of BP were at increased cardiovascular risk. Additional research is suggested in order to better understand how visit-to-visit variability of BP levels influences prognosis of hypertension.
—Paloma Cesar de Sales, BS, RN, MS
1. James PA, Oparil S, Carter BL, et al. 2014 evidence-based guideline for the management of high blood pressure in adults: report from the panel members appointed to the Eighth Joint National Committee (JNC 8). JAMA 2014;311:
507–20.
2. Brook RD, Appel LJ, Rubenfire M, et al; American Heart Association Professional Education Committee of the Council for High Blood Pressure Research, Council on Cardiovascular and Stroke Nursing, Council on Epidemiology and Prevention, and Council on Nutrition, Physical Activity. Beyond medications and diet: alternative approaches to lowering blood pressure: a scientific statement from the American Heart Association. Hypertension 2013;61:1360–83.
3. Muntner P, Whittle J, Lynch AI, et al. Visit-to-visit variability of blood pressure and coronary heart disease, stroke, heart failure, and mortality: a cohort study. Ann Intern Med 2015;163:329–38.
4. Nieuwlaat R, Wilczynski N, Navarro T, et al. Interventions for enhancing medication adherence. Cochrane Database Syst Rev 2014;(11):CD000011.
Study Overview
Objective. To determine the association between antihypertensive medication adherence and visit-to-visit variability of blood pressure (BP).
Design. Post hoc analysis of ALLHAT, a randomized, double-blind, multicenter trial to determine whether treatment with calcium-channel blockers, angiotensin-converting enzyme inhibitors, or α-adrenergic blockers, all newer antihypertensive classes at the time of the study, was superior to treatment with a thiazide diuretic for lowering risk for fatal coronary heart disease (CHD) or nonfatal myocardial infarction (MI) (primary outcomes), with secondary outcomes including all-cause mortality, stroke, and combined cardiovascular disease (CHD death, nonfatal MI, stroke, angina, coronary revascularization, congestive heart failure, and peripheral arterial disease).
Setting and participants. Participants who had BP and medication adherence data from at least 5 of the 7 study visits conducted 6 to 28 months after randomization. Only patients who had no outcome events within the 28 months were included in the analysis (ie, no fatal CHD or nonfatal MI, stroke, all-cause mortality, or heart failure). In a secondary analysis, participants who had data from 5 of the 7 study visits between 32 to 56 months after randomization were included.
Measures. Adherence to medication was assessed at each visit by a study clinician using the Adherence Survival Kit developed for ALLHAT. Participants were asked whether they had taken at least 80% of their assigned study drug since the last follow-up visit. For primary analyses, participants were categorized as nonadherent if they reported having taken < 80% of their assigned antihypertensive medication at ≥ 1 visits during the 6- to 28-month time period after randomization. For secondary analyses, participants were categorized as nonadherent if they reported having taken < 80% of their assigned medication at ≥ 1 visits during the 32 to 56 months after randomization. In a sensitivity analysis, participants were categorized as nonadherent if they reported taking < 80% of the prescribed antihypertensive medication at ≥ 2 visits during the 6 to 28 months post-randomization time period. Visit-to-visit variability of BP was calculated using 3 metrics based on each ALLHAT participants’ BP measurements: standard deviation independent of mean (SDIM), SD, and average real variability. The BP used for these calculations was the mean of 2 measurements taken during each follow-up study visit according to a standardized BP measurement protocol. Participants were followed from the end of the visit-to-visit variability of BP assessment period to the date of each outcome, their date of death, or end of active ALLHAT follow-up.
Results. Of 33,357 participants randomized, 19,970 participants met eligibility criteria for primary analyses. Of these, 2912 participants (15%) were considered nonadherent. Compared with adherent participants, nonadherent participants were slightly older and more likely to be Hispanic or black. Nonadherent participants were more likely to have evidence of end-organ damage as signified by major ST segment depression or T wave inversion or left ventricular hypertrophy on electrocardiogram but were less likely to have a history of MI, stroke, or coronary revascularization. Nonadherent participants were also less likely to have used BP medications before randomization and less likely to use statins during follow-up. Nonadherent participants were more likely to have changes in BP medication classes during follow-up, were more likely to have uncontrolled BP between 6 and 28 months after randomization, and had higher mean systolic blood pressure (SBP) and diastolic blood pressure (DBP) at the visits. The association between nonadherence and higher BP remained statistically significant in adjusted analyses.
SDIM of SBP was higher among those who were nonadherent (11.4 ± 4.9 versus 10.5 ± 4.5; P < 0.001). After full adjustment, nonadherent participants had 0.8 (95% CI, 0.7–1.0; P < 0.001) higher SDIM of SBP than adherent participants. In addition, compared with adherent participants, nonadherent participants had higher SD and average real variability of SBP. Researcher found the same pattern when the sample was restricted to 11,290 participants without antihypertensive medication changes. The association between adherence status and visit-to-visit variability of SBP was consistent across antihypertensive drug randomization assignment for interaction term for all definitions of visit-to-visit variability of SBP (P > 0.8). Nonadherent participants also had higher visit-to-visit variability of DBP.
Overall, 4.6% of participants had ≥ 2 visits with < 80% adherence. SDIM of SBP was higher among nonadherent participants versus adherent participants according to this more stringent categorization of nonadherence (11.0 ± 4.6 vs. 10.6 ± 4.6; P = 0.01). After full multivariable adjustment, SDIM of SBP was 0.5 (95% CI, 0.2–0.9; P = 0.001) higher among nonadherent than among adherent participants. Participants who were nonadherent in both the early and late study periods had higher SDIMs of SBP than those who were adherent in both study periods. Minimal changes were found in the SDIM of SBP between the early and late study periods for participants who were adherent in both study periods and nonadherent in both study periods. However, a significant number of participants, had a change in adherence between the early and late study period, with 6.5% switching from adherent to nonadherent and 10.0% switching from nonadherent to adherent. Compared with participants who were adherent in both time periods, participants who changed from adherent to non-adherent had an increase in SDIM of SBP (0.9; 95% CI, 0.5–1.3; P < 0.001), whereas participants who changed from nonadherent to adherent had a decrease in SDIM of SBP (−0.7; 95% CI, −1.0 to −0.3; P < 0.001). Among participants in the primary analysis without a cardiovascular event before the 28-month visit (n = 18 442), being in the highest versus lowest quintile of SDIM of SBP was associated with increased risk of fatal CHD or nonfatal MI, stroke, heart failure, and all-cause mortality after multivariable adjustment. In a mediation analysis, further adjustment for adherence status did not explain the association between SDIM of SBP and any of our cardiovascular or mortality outcomes.
Conclusion. The study provided significant evidence that medication adherence reduces visit-to-visit variability of BP. However, visit-to-visit variability of BP is associated with cardiovascular outcomes independent of medication adherence. Further work is needed to examine both the mechanisms underlying the association between visit-to-visit variability of BP and cardiovascular outcomes and whether decreasing visit-to-visit variability of BP can improve health outcomes.
Commentary
Hypertension remains one of the most important preventable contributors to disease and death [1]. Health care providers continue to reinforce the importance of adherence to medication treatment in conjunction with the adoption of healthy lifestyle habits, which have been shown to be effective interventions [2]. Low adherence to antihypertensive medication has been hypothesized to increase visit-to-visit variability of BP. Literature has shown that visit-to-visit variability of BP is associated with increased risk for stroke, CHD, and mortality [3]. In this post hoc analysis of ALLHAT, the researchers found that nonadherence was associated with increased visit-to-visit variability of BP. The study extended the findings of only a few studies that have tested this association.
Efforts to improve adherence could impact the occurrence of visit-to-visit variability of BP. Current methods of improving medication adherence for chronic health problems are mostly complex and not very effective. Awareness and commitment are essential to promote and ensure adherence in the treatment of disease [4]. Advances in this field of research are needed, including improved design of feasible long-term interventions, objective adherence measures, and sufficient study power to detect improvements outcomes that patients care about [4].
However, in this study, medication nonadherence did not explain the association between visit-to-visit variability of BP levels and cardiovascular risk. The researchers posit that in light of this, improving adherence is unlikely to offset the increased risk associated with visit-to-visit variability of BP found in treated patients with hypertension.
Limitations of this study include the use of self-report for adherence measurement, use of a summary measure for adherence, and the exclusion of a substantial number of participants who had < 5 visits in which adherence was assessed.
Applications for Clinical Practice
Although nonadherence to medication treatment contributed to visit-to-visit variability of BP, nonadherence did not explain why individuals with higher visit-to-visit of BP were at increased cardiovascular risk. Additional research is suggested in order to better understand how visit-to-visit variability of BP levels influences prognosis of hypertension.
—Paloma Cesar de Sales, BS, RN, MS
1. James PA, Oparil S, Carter BL, et al. 2014 evidence-based guideline for the management of high blood pressure in adults: report from the panel members appointed to the Eighth Joint National Committee (JNC 8). JAMA 2014;311:
507–20.
2. Brook RD, Appel LJ, Rubenfire M, et al; American Heart Association Professional Education Committee of the Council for High Blood Pressure Research, Council on Cardiovascular and Stroke Nursing, Council on Epidemiology and Prevention, and Council on Nutrition, Physical Activity. Beyond medications and diet: alternative approaches to lowering blood pressure: a scientific statement from the American Heart Association. Hypertension 2013;61:1360–83.
3. Muntner P, Whittle J, Lynch AI, et al. Visit-to-visit variability of blood pressure and coronary heart disease, stroke, heart failure, and mortality: a cohort study. Ann Intern Med 2015;163:329–38.
4. Nieuwlaat R, Wilczynski N, Navarro T, et al. Interventions for enhancing medication adherence. Cochrane Database Syst Rev 2014;(11):CD000011.
Quality Measure Attainment After Add-on Therapy of Both Saxagliptin and Dapagliflozin to Metformin Versus Single Add-On of Saxagliptin or Dapagliflozin
From the Ochsner Diabetes Clinical Research Unit, Frank Riddick Diabetes Institute, Department of Endocrinology, Ochsner Medical Center, New Orleans, LA (Dr. Blonde), and AstraZeneca, Gaithersburg, MD (Drs. Sheehan, Barrett, and Garcia-Sanchez).
Abstract
- Objective: To evaluate diabetes care quality measure attainment, specifically, blood glucose and blood pressure (BP) control, with saxagliptin, a dipeptidyl peptidase-4 inhibitor, and dapagliflozin, a sodium-glucose cotransporter-2 inhibitor, added singly or as dual add-on therapy in patients with type 2 diabetes inadequately controlled with metformin alone.
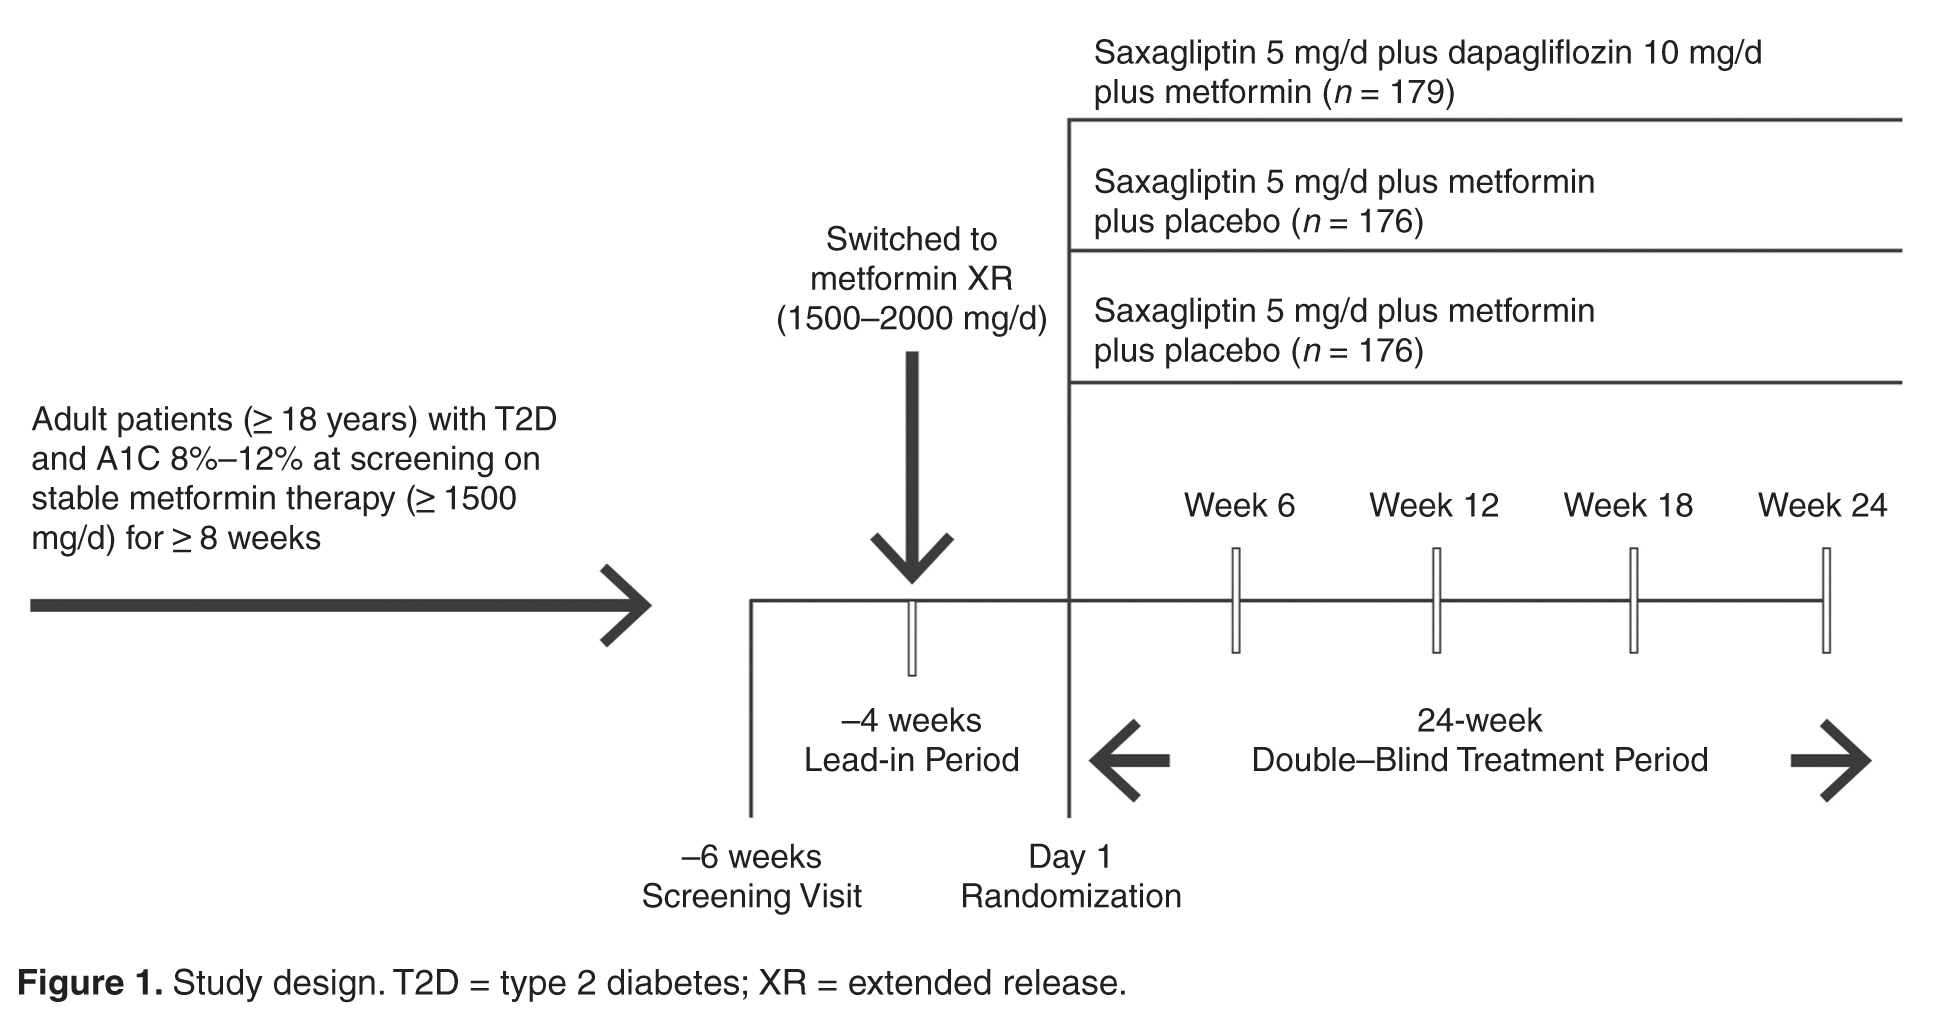
- Methods: Analysis of a phase 3, randomized, double-blind, active-controlled, parallel-group trial was conducted. Patients were randomized 1:1:1 to receive saxagliptin 5 mg/d plus dapagliflozin 10 mg/d, saxagliptin 5 mg/d, or dapagliflozin 10 mg/d as add-on to metformin 1500 to 2000 mg/d. Assessments included attainment of individual and composite glycated hemoglobin (A1C) and BP measures at 24 weeks of treatment.
- Results: Compared with single add-on saxagliptin or dapagliflozin, dual add-on saxagliptin plus dapagliflozin to metformin was associated with significantly more patients attaining the individual quality measures of A1C < 7% and A1C < 8%. Similarly, dual add-on saxagliptin plus dapagliflozin was associated with significantly more patients attaining the composite quality measures A1C < 7% and BP < 140/90 mm Hg and A1C < 8% and BP < 140/90 mmHg (vs saxagliptin plus metformin).
- Conclusion: Dual add-on saxagliptin plus dapagliflozin to metformin was associated with a higher proportion of patients achieving glycemic and BP quality measures compared with single add-on saxagliptin or dapagliflozin.
Assessment of performance is a focus of many health care organizations as a means to evaluate and improve the quality of health care. Standardized performance measures have been developed to improve quality of care as well as to allow for comparative assessment of health plans and to support pay for performance models [1]. A widely used set of performance measures is the Healthcare Effectiveness Data and Information Set or HEDIS [2,3], measures that are maintained by the National Committee for Quality Assurance [4,5] and used by most US health plans [6].
Type 2 diabetes (T2D) is a focus of quality measure assessment and performance improvement because of its high prevalence, substantial personal and economic impact on society, high morbidity and mortality, and because it is a condition that requires coordinated care. Important outcome measures for diabetes include blood glucose control and blood pressure (BP) control. HEDIS measures for T2D include a glycated hemoglobin (A1C) > 9%, indicating poor glucose control, < 8%, indicating good control, and < 7%, a more stringent measure of good glycemic control. The HEDIS measure for BP in T2D is < 140/90 mm Hg, which is considered good BP control. All of these HEDIS measures are currently or were previously (A1C < 7%) endorsed by the National Quality Forum [1,7–10]. Endorsement of a quality measure by the NQF indicates that the measure has been thoroughly evaluated, meets specific criteria, and is based on recognized standards of care grounded in evidence-based medicine [1].
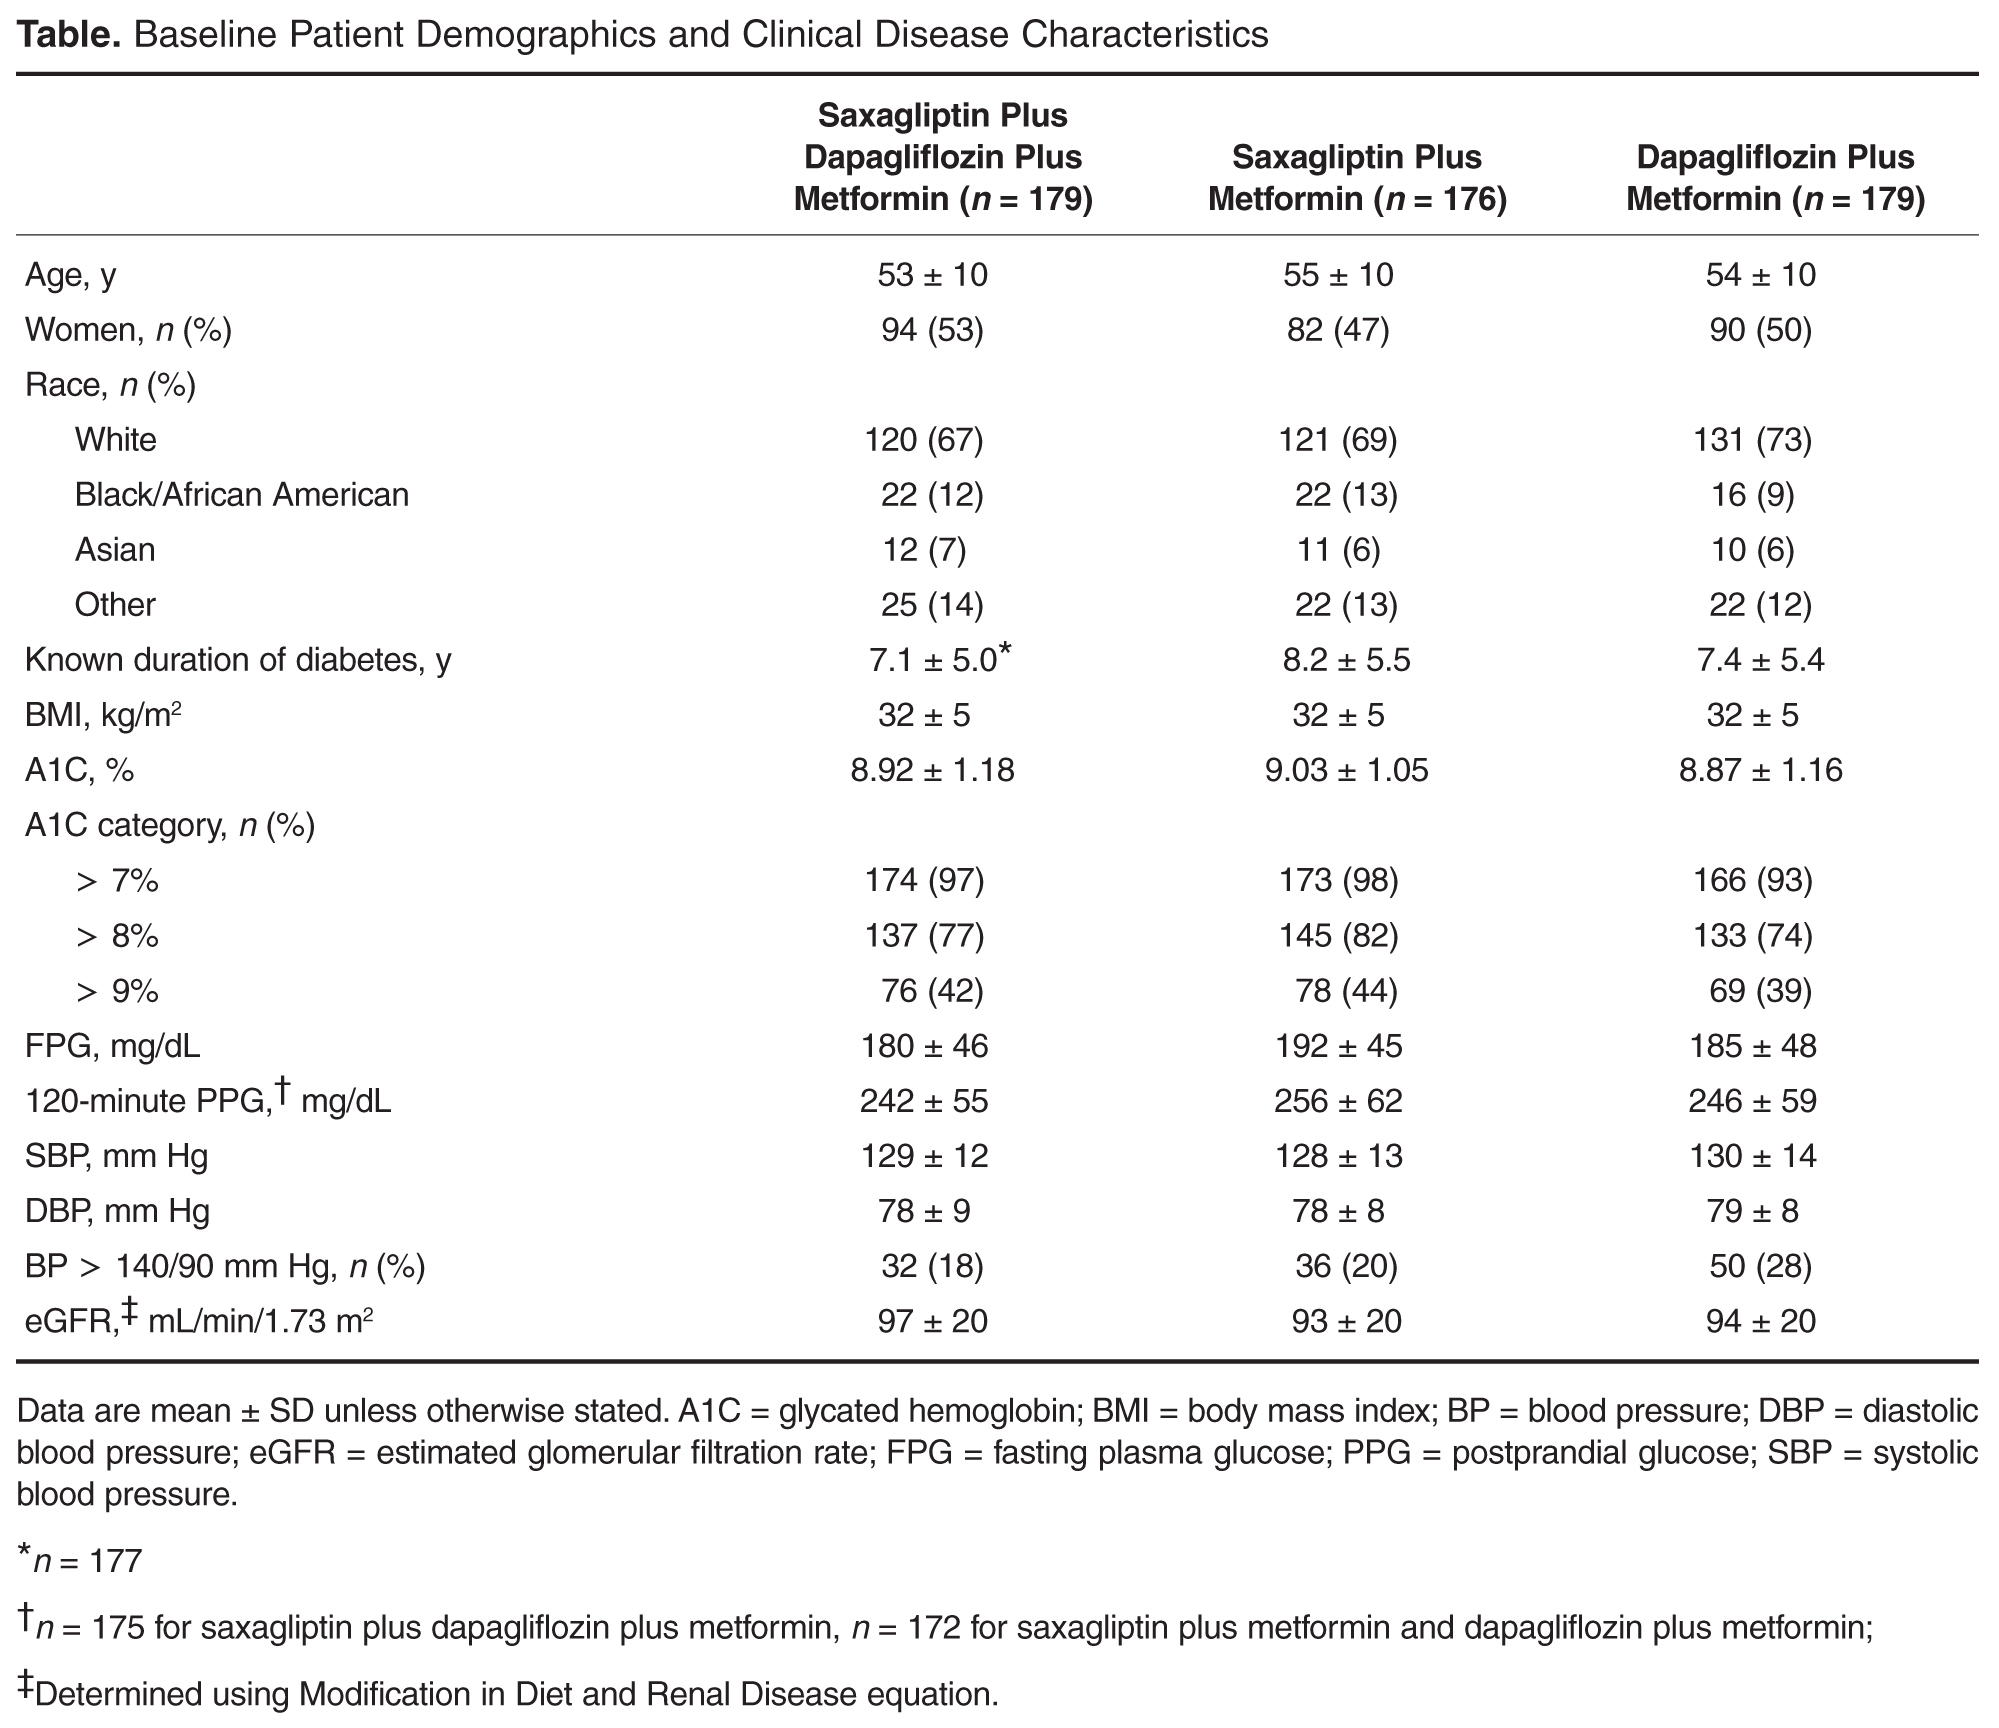
A number of oral agents are utilized in the treatment of diabetes. Saxagliptin, an oral dipeptidyl peptidase-4 (DPP-4) inhibitor, and dapagliflozin, an oral sodium-glucose cotransporter-2 (SGLT-2) inhibitor, are indicated as adjuncts to diet and exercise in adults with T2D [11,12]. Saxagliptin inhibits DPP-4, and thereby reduces fasting and postprandial glucose concentrations by preventing degradation of the incretin hormones, glucagon-like peptide-1 and glucose-dependent insulinotropic polypeptide [13]. Dapagliflozin reduces blood glucose concentrations by inhibiting glucose reabsorption in the proximal tubule of the kidney, which results in enhanced urinary glucose excretion [14]. Because their mechanisms of action are glucose-dependent, both saxagliptin and dapagliflozin have a low intrinsic potential to cause hypoglycemia [13,14]. In a randomized, double-blind study of patients with T2D inadequately controlled with metformin, Rosenstock et al assessed the efficacy and safety of dual add-on of saxagliptin plus dapagliflozin versus saxagliptin and dapagliflozin added on alone (ClinicalTrials.gov identifier, NCT01606007) [15]. The dual add-on therapy resulted in a greater adjusted mean reduction from baseline in A1C at week 24 (–1.47%) compared with either saxagliptin (–0.88%) or dapagliflozin (–1.20%) alone added to metformin; the difference for dual add-on saxagliptin plus dapagliflozin to metformin vs. single add-on saxagliptin and single add-on dapagliflozin was –0.59% (P < 0.001) and –0.27% (P = 0.0166), respectively. The incidence of adverse events was similar across the 3 treatment groups, and hypo-glycemia was infrequent (1%), with no reports of severe hypoglycemia events (symptomatic events with glucose ≤ 54 mg/dL requiring assistance).
In this paper, we assess the attainment of diabetes quality measures among patients in this study, specifically, measures of glycemic and BP control.
Methods
Study Design and Patients
Quality Measure Assessment
Individual measures assessed included the proportion of patients with A1C < 7%, A1C < 8%, A1C > 9%, and BP < 140/90 mm Hg. Composite measures assessed includedthe proportion of patients with A1C < 7% and BP < 140/90 mm Hg and the proportion of patients with A1C < 8% and BP < 140/90 mm Hg.
Antihypertensive or cholesterol-lowering medication use was not controlled for in this study. Patients were maintained on their prescribed dosing regimen for antihypertensive and cholesterol-lowering medications, with adjustments as needed per the standard of care for their diagnosis. Treatment outcomes for A1C < 7%, < 8%, or > 9% were prespecified. The BP treatment outcome was also prespecified per the statistical analysis plan; however, a change to the HEDIS quality measure treatment outcome for BP during the clinical study resulted in this analysis being no longer relevant. Therefore, analyses of the currently endorsed quality measures for BP were conducted post hoc. Quality measure assessments for A1C and BP treatment outcomes were conducted using data from the 24-week, double-blind treatment period.
Statistical Analysis
P values for the differences in proportion of patients with individual treatment outcomes and composite treatment outcomes with saxagliptin plus dapagliflozin plus metformin versus saxagliptin plus metformin or dapagliflozin plus metformin were calculated using Fisher’s exact test. The numerator and denominator for each percentage are the number of responders and the number of patients with non-missing values in the treatment group at the corresponding baseline category, respectively, and are not corrected for baseline A1C. Because some patients experienced improvement in A1C during the lead-in period and could have already been at treatment goal at baseline, a sensitivity analysis excluding these patients was completed. Results are presented for the total number of patients with non-missing values in the treatment group, as well as patients with non-missing values in the treatment group who did not meet quality measure criteria at baseline. The number needed to treat (NNT) was calculated for all comparisons reaching statistical significance.
Results
Patients
Individual Quality Measures
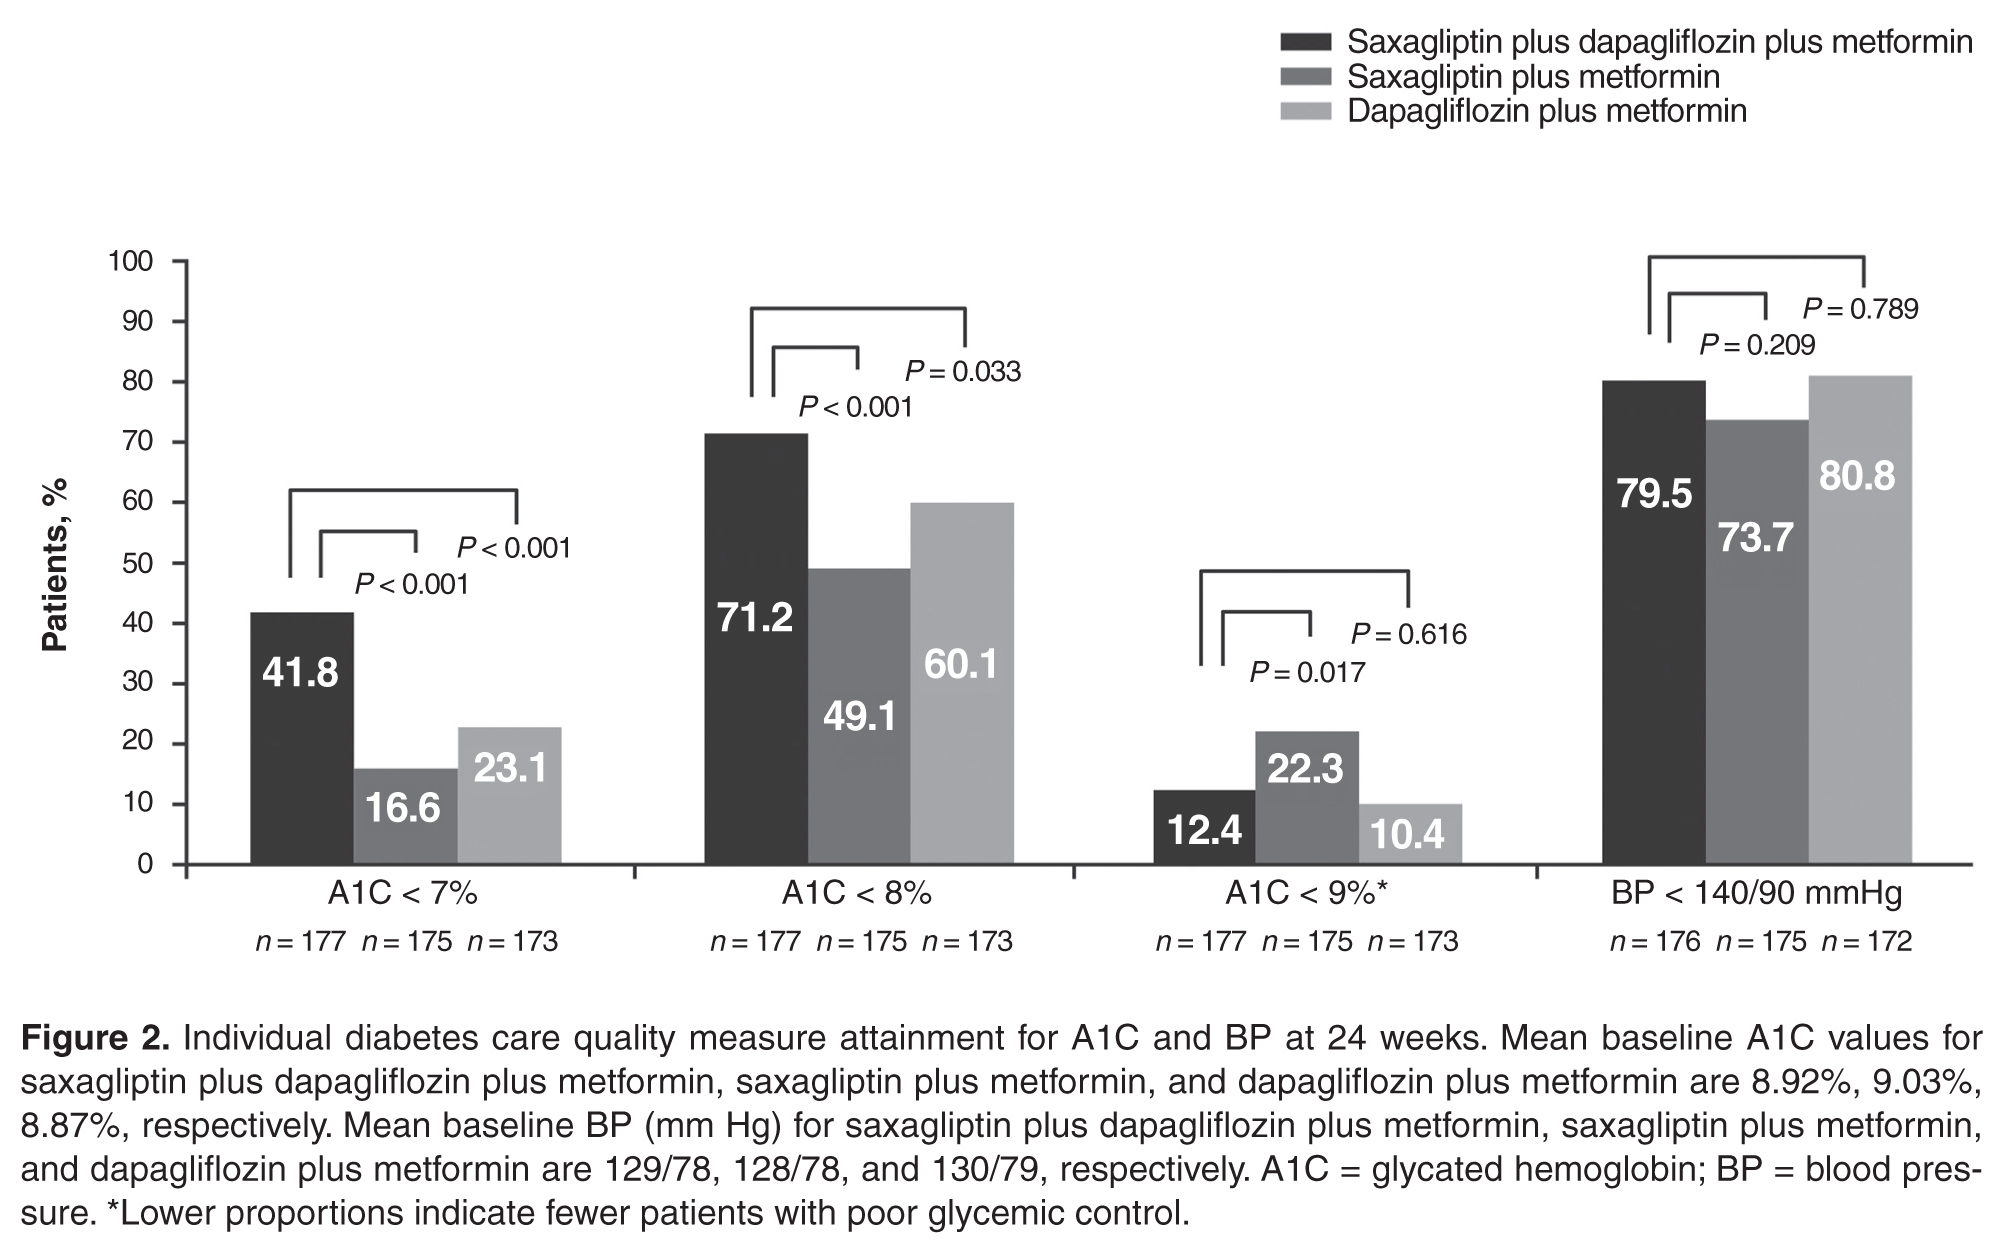
The dual addition of saxagliptin plus dapagliflozin to metformin resulted in a significantly greater proportion of patients achieving A1C < 8.0% compared with saxagliptin plus metformin (71.2% vs 49.1%; P < 0.001; NNT 5 [95% CI 3–8]) or dapagliflozin plus metformin (60.1%; P = 0.033; NNT 9 [95% CI 5–85]; Figure 2). Similar results (proportions of patients: 66.4% vs 40.0% vs 51.9%; P ≤ 0.02; NNTs 4 [95% CI 3–7]) and 7 [95% CI 4–34]) were attained when the analysis excluded patients with baseline A1C < 8.0%.
Significantly fewer patients had A1C > 9% (a measure of poor glycemic control) with saxagliptin plus dapagliflozin plus metformin (12.4%) compared with saxagliptin plus metformin (22.3%; P = 0.017; NNT –10 [95% CI –50 to –6]; Figure 2). The proportion of patients with A1C > 9% was similar for both regimens that included dapagliflozin (12.4% vs 10.4%; P = 0.616).
No significant difference was observed among treatment groups in the proportion of patients with BP < 140/90 mm Hg (Figure 2). However, most patients had BP < 140/90 mm Hg (72%–82%) at baseline, which was generally maintained at week 24.
Composite Quality Measures
Discussion
This post hoc analysis evaluated attainment of glycemic and BP quality measures for diabetes. A significantly greater proportion of patients achieved the individual quality measures of A1C < 7% and A1C < 8% with dual add-on saxagliptin plus dapagliflozin to metformin compared with single add-on saxagliptin or dapagliflozin to metformin after 24 weeks. Similar results were seen when the analysis excluded patients with A1C < 7% and < 8% at baseline. All measures of good glycemic control had clinically relevant NNTs ≤ 10 after 24 weeks with saxagliptin plus dapagliflozin plus metformin compared with saxagliptin or dapagliflozin plus metformin, regardless of baseline status. Very few patients experienced lackof improvement in glycemic control, evidenced by small proportions of patients with A1C > 9%.
There was little difference in BP between dual add-on saxagliptin plus dapagliflozin or single add-on saxagliptin or dapagliflozin to metformin. The proportion of patients who attained the BP quality measure of BP < 140/90 mm Hg was similar across the 3 treatments, as might be expected because most patients already met this target at baseline. However, as might be expected based on the mild diuretic effect and weight loss associated with SGLT-2 inhibitors [16,17], trends in BP favored groups treated with dapagliflozin.
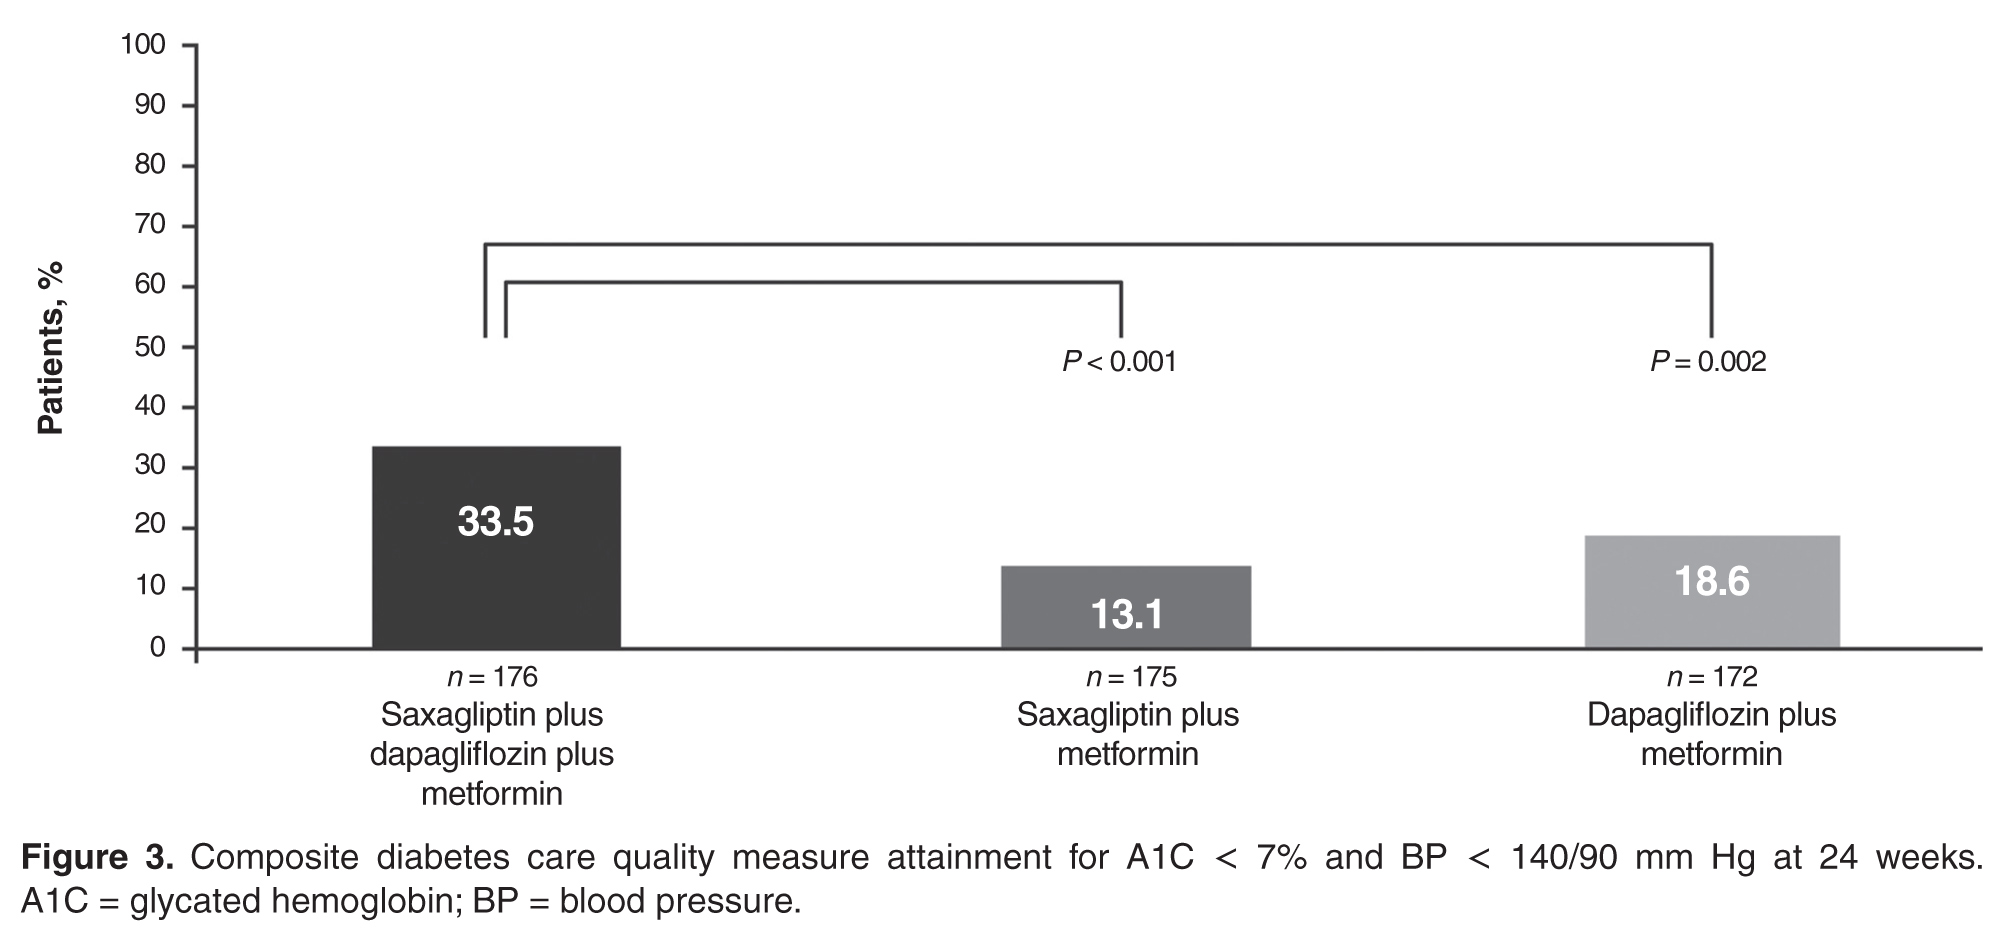
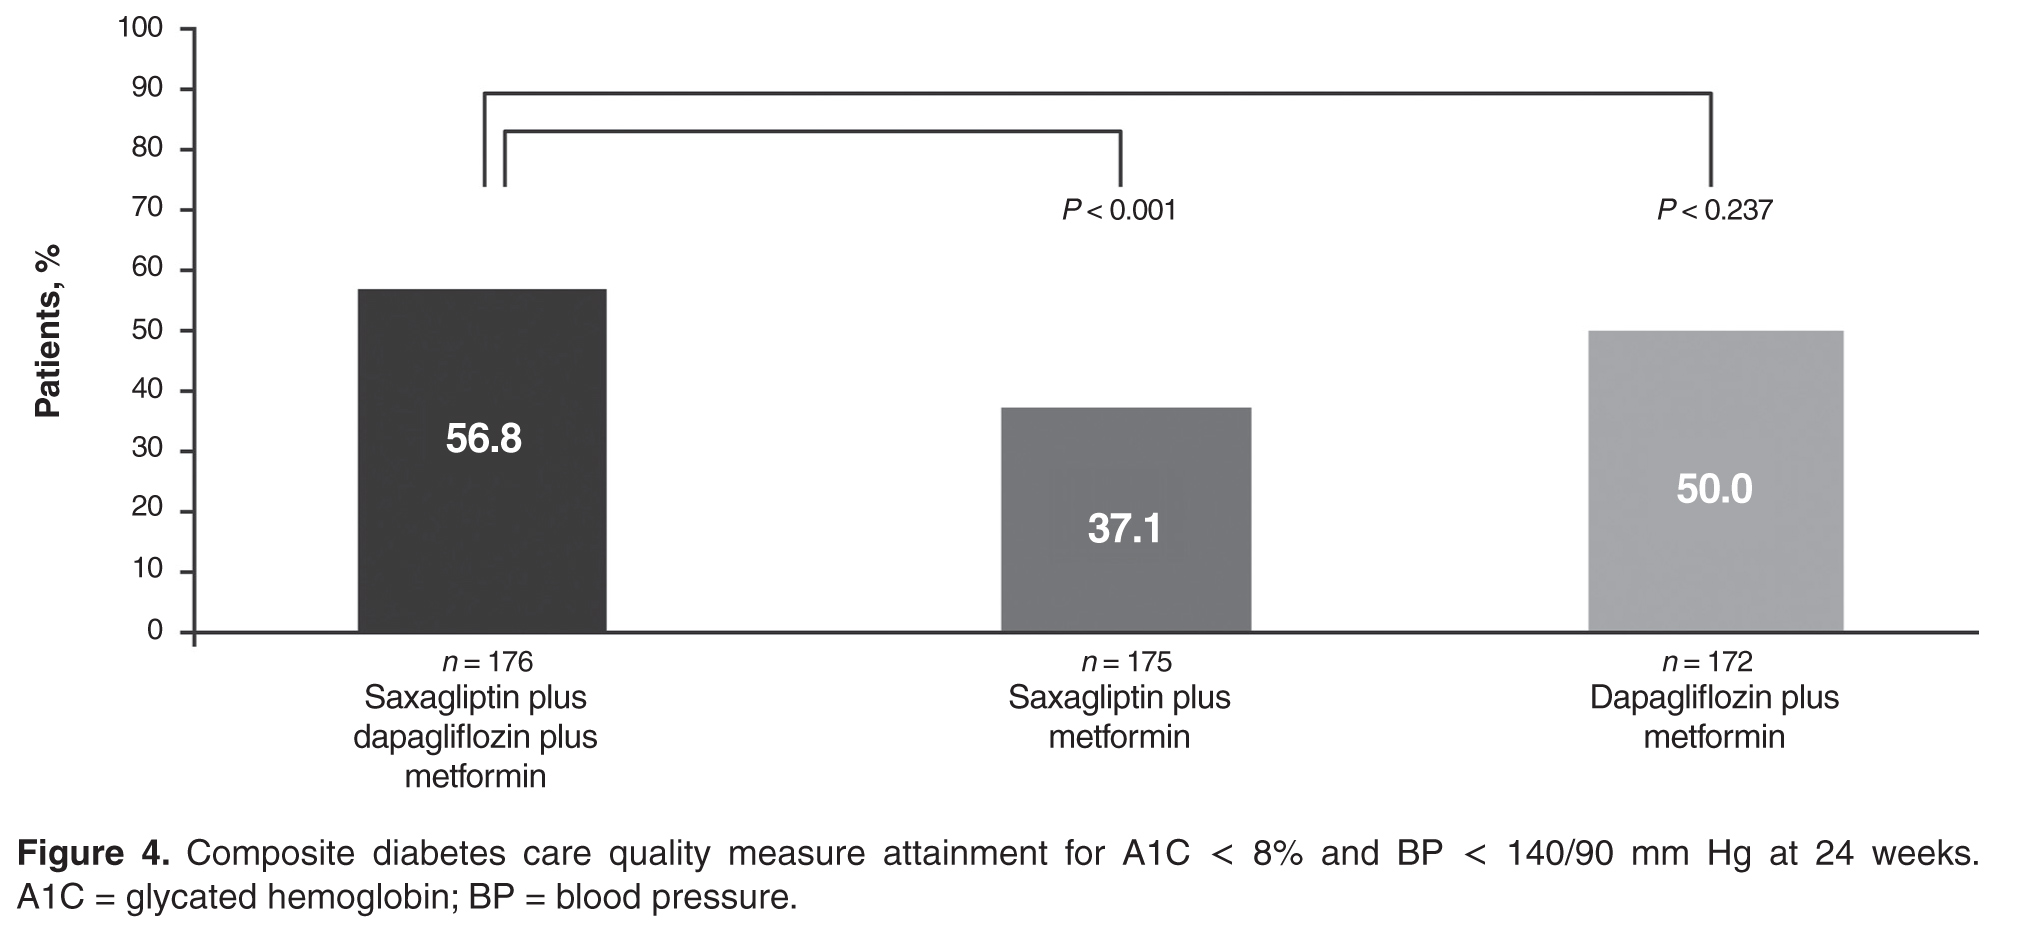
Attainment of multiple treatment targets is desirable in reducing complications of diabetes. A significantly greater proportion of patients achieved both A1C < 7% and BP < 140/90 mm Hg when both saxagliptin and dapagliflozin were added to metformin compared with single-agent addition of either saxagliptin or dapagliflozin plus metformin. Similarly, a significantly greater proportion of patients achieved both A1C < 8% and BP < 140/90 mm Hg with dual addition of saxagliptin and dapagliflozin plus metformin compared with saxagliptin plus metformin. There was also a numerically greater number of patients who achieved both of these goals with triple therapy compared with dapagliflozin plus metformin, but this finding did not reach statistical significance. Clinically relevant NNT values ≤ 10 were observed for both composite outcomes for saxagliptin plus dapagliflozin plus metformin compared with saxagliptin plus metformin or dapagliflozin plus metformin after 24 weeks.
Despite advances in the medical management of T2D, a report published in 2013 showed that between 2007 and 2010, only 53% of patients achieved an A1C < 7.0% and only 19% simultaneously achieved all 3 American Diabetes Association (ADA) goals recommended for most patients at that time: A1C < 7.0%, BP < 130/80 mm Hg, and low-density lipoprotein cholesterol LDL-C < 100 mg/dL [18]. These data highlight a need for new approaches to help patients attain glycemic, BP, and cholesterol goals. Our results demonstrated that a higher proportion of patients attained glycemic and BP quality measures with dual add-on saxagliptin plus dapagliflozin compared with single add-on saxagliptin or dapagliflozin to metformin. As a result of recent updates for cholesterol management from the American College of Cardiology and the American Heart Association [19], attainment of a cholesterol level was retired as a diabetes quality measure and replaced with a recommendation for statin therapy use [20,21]. Although the current analysis did not include assessment of LDL, DPP-4 inhibitors have demonstrated neutral effects on lipids [22,23], and SGLT-2 inhibitors have demonstrated generally modest increases in LDL-C (placebo-adjusted change from baseline: 4.5%–8.0% for canagliflozin 100 and 300 mg/d, 3.9% for dapagliflozin 10 mg, and 2.3%–4.2% for empagliflozin 10 and 25 mg/d) [12,24,25], as well as increases in high-density lipoprotein cholesterol and reductions in triglycerides [26].
Current ADA guidelines recommend an individualized, stepwise approach to treatment with sequential addition of single oral antihyperglycemic agents for patients who do not achieve their glycemic goal in 3 months [27]. Although T2D may progress at different rates in different patients, T2D does generally progress over time [28], and the ADA and American Association of Clinical Endocrinologists treatment guidelines recommend initial dual add-on therapy for individuals with higher A1C, which is suggestive of more advanced disease [27,29]. For individuals requiring initial combination therapy, guidelines note that antihyperglycemic agents that have a low risk of hypoglycemia and low potential for weight gain should be preferentially selected [29]. Attainment of A1C ≤ 7%, the guideline recommendation considered appropriate for many patients, is associated with reductions in microvascular disease and, if attained soon after diagnosis of diabetes, studies have shown reductions in macrovascular disease with long-term follow-up [27,30,31]. However, it may be challenging to achieve A1C < 7% with the addition of single oral antihyperglycemic agents, especially in patients with higher A1C [32]. Less stringent A1C goals (eg, A1C < 8%) may be appropriate in individuals with a long duration of diabetes that is difficult to control, history of severe hypoglycemia, limited life expectancy, numerous comorbidities, and extensive complications or comorbidities, especially cardiovascular disease [27]. Given the shift toward individualized treatment plans with patient-specific treatment goals, it is valuable to understand how different treatment strategies effect attainment of guideline-recommended less stringent and more stringent glycemic targets that may be appropriate for certain patients.
In addition to quality measures that assess glucose lowering with pharmacotherapy, it is important to consider measures that assess other aspects of diabetes care. For example, quality measures related to hypoglycemia and hyperglycemia may help avoid potentially adverse glucose levels, and quality measures related to weight may provide insight on treatment and lifestyle efforts directed at weight loss and management. NQF-endorsed measures of hypoglycemia and hyperglycemia are currently moving through annual review and are paired measures, intended to be interpreted with respect to one another to ensure balanced outcomes [33,34]. This underscores the value of efficacious antihyperglycemic agents with low intrinsic potential for hypoglycemia. Although this analysis did not include quality measures related to hypoglycemia or weight, future studies evaluating these aspects of diabetes care will likely further contribute to a more comprehensive and holistic treatment approach.
In addition to assessing a broad range of quality measures, an important aspect of care to consider is patient affordability. Affordability for an individual patient will depend on access in the patient’s individual plan, the financial resources of the patient, and the potential for medical cost offsets from improved control of the patient’s disease. For example, fixed-dose combination products are associated with increased patient adherence and may increase pharmacy costs but decrease medical costs [35].
Limitations of this study include the post hoc design and that quality measure attainment was assessed over a shorter duration of time (24 weeks) than is commonly assessed in the real-world/community setting (~12 months).
Dual add-on therapy with oral antihyperglycemic agents that have complementary mechanisms of action should lead to enhanced reductions in A1C. The results reported here and from the primary study, in which saxagliptin and dapagliflozin added to metformin significantly reduced mean A1C from baseline to week 24 compared with single add-on saxagliptin or dapagliflozin [15], showed that greater reductions in A1C were attained with the coadministration of saxagliptin and dapagliflozin. The glucuretic effect of SGLT-2 inhibitors has been associated with increased plasma glucagon concentrations and increased endogenous glucose production, which may impair the full glucose-lowering potential of SGLT-2 inhibitors [36,37]. Administering saxagliptin with dapagliflozin as dual therapy was shown to blunt the rise in plasma glucagon caused by dapagliflozin [38], and this may have contributed to the greater glucose control achieved with dual add-on of these 2 antihyperglycemic drugs [15].
By targeting multiple aspects of the underlying pathophysiology in T2D, greater improvements in A1C can be achieved. Dual add-on saxagliptin plus dapagliflozin to metformin resulted in a greater proportion of patients achieving NQF-endorsed HEDIS quality measures, as well as A1C < 7% (no longer an NQF-endorsed measure). As health care shifts to a more value-based payment structure, measuring quality outcomes will assume a greater role in guiding decision making and influence the care that patients receive. Understanding how antihyperglycemic medication regimens affect quality measures can help clinicians make informed decisions.
Corresponding author: Lawrence Blonde, MD, Ochsner Diabetes Clinical Research Unit, Frank Riddick Diabetes Institute, Department of Endocrinology, Ochsner Medical Center, New Orleans, LA.
Funding/support: This study was supported by AstraZeneca. Medical writing support for the preparation of this manuscript was provided by Lauren D’Angelo, PhD, and Janet Matsuura, PhD, from Complete Healthcare Communications, LLC (Chadds Ford, PA), with funding from AstraZeneca.
Financial disclosures: Dr. Blonde has received grant and research support from AstraZeneca, Jansen Pharmaceuticals, Lexicon Pharmaceuticals, Merck, Novo Nordisk, and Sanofi-Aventis and has received honoraria for participating as a speaker from AstraZeneca, Janssen Pharmaceuticals, Merck, Novo Nordisk, and Sanofi-Aventis as well as honoraria for consultant work from AstraZeneca, GlaxoSmithKline, Intarcia Therapeutics, Janssen Pharmaceuticals, Merck, Novo Nordisk, and Sanofi-Aventis. R. Garcia-Sanchez is an employee of AstraZeneca. J. Sheehan and Y. C. Barrett were employees of AstraZeneca at the time of this research.
1. National Quality Forum. ABCs of measurement. Accessed 11 Mar 2016 at www.qualityforum.org/Measuring_Performance/ABCs_of_Measurement.aspx.
2. National Committee for Quality Assurance. HEDIS measure development process. Accessed 14 Mar 2016 at www.ncqa.org/tabid/414/Default.aspx.
3. National Committee for Quality Assurance. HEDIS measures. Accessed 11 Mar 2016 at www.ncqa.org/HEDISQualityMeasurement/HEDISMeasures.aspx.
4. National Committee for Quality Assurance. About NCQA: overview. Accessed 14 Mar 2016 at www.ncqa.org/AboutNCQA.aspx.
5. National Committee for Quality Assurance. Health care program evaluations. Accessed 11 Mar 2016 at www.ncqa.org/Programs.aspx.
6. National Committee for Quality Assurance. HEDIS and Performance Measurement. Accessed 14 Mar 2016 at www.ncqa.org/HEDISQualityMeasurement.aspx.
7. National Committee for Quality Assurance. HEDIS 2015 technical specifications for ACO measurement. Washington, DC: National Committee for Quality Assurance; 2014.
8. National Quality Forum. Comprehensive diabetes care: hemoglobin A1c (HbA1c) poor control (> 9.0%). NQF identifier: 0059. Accessed 14 Mar 2016 at www.qualityforum.org/ProjectMeasures.aspx?projectID=73652.
9. National Quality Forum. Comprehensive diabetes care: hemoglobin A1c (HbA1c) control (< 8.0%). NQF identifier: 0575. Accessed 14 Mar 2016 at www.qualityforum.org/ProjectMeasures.aspx?projectID=73652.
10. National Quality Forum. Comprehensive diabetes care: blood pressure control (< 140/90 mm Hg). NQF identifier: 0061. Accessed 14 Mar 2016 at www.qualityforum.org/ProjectMeasures.aspx?projectID=73652.
11. Onglyza(saxagliptin). Full prescribing information. AstraZeneca, Wilmington, DE; 2014.
12. Farxiga (dapagliflozin). Full prescribing information. AstraZeneca, Wilmington, DE; March 2015.
13. Deacon CF, Holst JJ. Saxagliptin: a new dipeptidyl peptidase-4 inhibitor for the treatment of type 2 diabetes. Adv Ther 2009;26:488–99.
14. Kasichayanula S, Liu X, Lacreta F, et al. Clinical pharmacokinetics and pharmacodynamics of dapagliflozin, a selective inhibitor of sodium-glucose co-transporter type 2. Clin Pharmacokinet 2014;53:17–27.
15. Rosenstock J, Hansen L, Zee P, et al. Dual add-on therapy in type 2 diabetes poorly controlled with metformin monotherapy: a randomized double-blind trial of saxagliptin plus dapagliflozin addition versus single addition of saxagliptin or dapagliflozin to metformin. Diabetes Care 2014;38:376–83.
16. Bailey CJ. SGLT2 inhibitors: glucuretic treatment for type 2 diabetes. British Journal of Diabetes & Vascular Disease 2010;10:193-9.
17. Maliha G, Townsend RR. SGLT2 inhibitors: their potential reduction in blood pressure. J Am Soc Hypertens 2015;9:48–53.
18. Stark Casagrande S, Fradkin JE, Saydah SH, et al. The prevalence of meeting A1C, blood pressure, and LDL goals among people with diabetes, 1988-2010. Diabetes Care 2013;36:2271–9.
19. Stone NJ, Robinson JG, Lichtenstein AH, et al. 2013 ACC/AHA guideline on the treatment of blood cholesterol to reduce atherosclerotic cardiovascular risk in adults: a report of the American College of Cardiology/American Heart Association Task Force on Practice Guidelines. Circulation 2014;129:S1–45.
20. National Quality Forum. Comprehensive diabetes care (composite). NQF identifier: #0731. Accessed 11 Mar 2016 at www.qualityforum.org/QPS/QPSTool.aspx.
21. National Quality Forum. Optimal diabetes care (composite measure). NQF identifier: 0729. Accessed 14 Mar 2016 at www.qualityforum.org/ProjectMeasures.aspx?projectID=73652.
22. Amori RE, Lau J, Pittas AG. Efficacy and safety of incretin therapy in type 2 diabetes: systematic review and meta-analysis. JAMA 2007;298:194–206.
23. Monami M, Lamanna C, Desideri CM, Mannucci E. DPP-4 inhibitors and lipids: systematic review and meta-analysis. Adv Ther 2012;29:14–25.
24. Invokana(canagliflzoin). Full prescribing information. Janssen Pharmaceuticals, Titusville, NJ; 2013.
25. Jardiance(empagliflozin). Full prescribing information. Boehringer Ingelheim Pharmaceuticals and Eli Lilly, Ingelheim, Germany and Indianapolis, IN; 2014.
26. Inzucchi SE, Zinman B, Wanner C, et al. SGLT-2 inhibitors and cardiovascular risk: Proposed pathways and review of ongoing outcome trials. Diab Vasc Dis Res 2015;12:90–100.
27. American Diabetes Association. Standards of medical care in diabetes-2016. Diabetes Care 2016;39:S1–S119.
28. Fonseca VA. Defining and characterizing the progression of type 2 diabetes. Diabetes Care 2009;32:S151–S6.
29. Garber AJ, Abrahamson MJ, Barzilay JI, et al. Consensus statement by the American Association of Clinical Endocrinologists and American College of Endocrinology on the comprehensive type 2 diabetes management algorithm -- 2016 executive summary. Endocr Pract 2016;22:84–113.
30. Holman RR, Paul SK, Bethel MA, et al. 10-year follow-up of intensive glucose control in type 2 diabetes. N Engl J Med 2008;359:1577–89.
31. Nathan DM, Cleary PA, Backlund JY, et al. Intensive diabetes treatment and cardiovascular disease in patients with type 1 diabetes. N Engl J Med 2005;353:2643–53.
32. Bosi E, Camisasca RP, Collober C, et al. Effects of vildagliptin on glucose control over 24 weeks in patients with type 2 diabetes inadequately controlled with metformin. Diabetes Care 2007;30:890–5.
33. National Quality Forum. Glycemic control: hypoglycemia. NQF identifier: 2363. Accessed 29 Oct 2015 at www.qualityforum.org/QPS/QPSTool.aspx.
34. National Quality Forum. Glycemic control: hyperglycemia. NQF identifier: 2362. Accessed 11 Mar 2016 at www.qualityforum.org/QPS/QPSTool.aspx.
35. Bailey CJ, Day C. Fixed-dose single tablet antidiabetic combinations. Diabetes Obes Metab 2009;11:527–33.
36. Ferrannini E, Muscelli E, Frascerra S, et al. Metabolic response to sodium-glucose cotransporter 2 inhibition in type 2 diabetic patients. J Clin Invest 2014;124:499–508.
37. Merovci A, Solis-Herrera C, Daniele G, et al. Dapagliflozin improves muscle insulin sensitivity but enhances endogenous glucose production. J Clin Invest 2014;124:509–14.
38. Hansen L, Iqbal N, Ekholm E, et al. Postprandial dynamics of plasma glucose, insulin, and glucagon in patients with type 2 diabetes treated with saxagliptin plus dapagliflozin add-on to metformin therapy. Endocr Pract 2014;20:1187–97.
From the Ochsner Diabetes Clinical Research Unit, Frank Riddick Diabetes Institute, Department of Endocrinology, Ochsner Medical Center, New Orleans, LA (Dr. Blonde), and AstraZeneca, Gaithersburg, MD (Drs. Sheehan, Barrett, and Garcia-Sanchez).
Abstract
- Objective: To evaluate diabetes care quality measure attainment, specifically, blood glucose and blood pressure (BP) control, with saxagliptin, a dipeptidyl peptidase-4 inhibitor, and dapagliflozin, a sodium-glucose cotransporter-2 inhibitor, added singly or as dual add-on therapy in patients with type 2 diabetes inadequately controlled with metformin alone.
- Methods: Analysis of a phase 3, randomized, double-blind, active-controlled, parallel-group trial was conducted. Patients were randomized 1:1:1 to receive saxagliptin 5 mg/d plus dapagliflozin 10 mg/d, saxagliptin 5 mg/d, or dapagliflozin 10 mg/d as add-on to metformin 1500 to 2000 mg/d. Assessments included attainment of individual and composite glycated hemoglobin (A1C) and BP measures at 24 weeks of treatment.
- Results: Compared with single add-on saxagliptin or dapagliflozin, dual add-on saxagliptin plus dapagliflozin to metformin was associated with significantly more patients attaining the individual quality measures of A1C < 7% and A1C < 8%. Similarly, dual add-on saxagliptin plus dapagliflozin was associated with significantly more patients attaining the composite quality measures A1C < 7% and BP < 140/90 mm Hg and A1C < 8% and BP < 140/90 mmHg (vs saxagliptin plus metformin).
- Conclusion: Dual add-on saxagliptin plus dapagliflozin to metformin was associated with a higher proportion of patients achieving glycemic and BP quality measures compared with single add-on saxagliptin or dapagliflozin.
Assessment of performance is a focus of many health care organizations as a means to evaluate and improve the quality of health care. Standardized performance measures have been developed to improve quality of care as well as to allow for comparative assessment of health plans and to support pay for performance models [1]. A widely used set of performance measures is the Healthcare Effectiveness Data and Information Set or HEDIS [2,3], measures that are maintained by the National Committee for Quality Assurance [4,5] and used by most US health plans [6].
Type 2 diabetes (T2D) is a focus of quality measure assessment and performance improvement because of its high prevalence, substantial personal and economic impact on society, high morbidity and mortality, and because it is a condition that requires coordinated care. Important outcome measures for diabetes include blood glucose control and blood pressure (BP) control. HEDIS measures for T2D include a glycated hemoglobin (A1C) > 9%, indicating poor glucose control, < 8%, indicating good control, and < 7%, a more stringent measure of good glycemic control. The HEDIS measure for BP in T2D is < 140/90 mm Hg, which is considered good BP control. All of these HEDIS measures are currently or were previously (A1C < 7%) endorsed by the National Quality Forum [1,7–10]. Endorsement of a quality measure by the NQF indicates that the measure has been thoroughly evaluated, meets specific criteria, and is based on recognized standards of care grounded in evidence-based medicine [1].
A number of oral agents are utilized in the treatment of diabetes. Saxagliptin, an oral dipeptidyl peptidase-4 (DPP-4) inhibitor, and dapagliflozin, an oral sodium-glucose cotransporter-2 (SGLT-2) inhibitor, are indicated as adjuncts to diet and exercise in adults with T2D [11,12]. Saxagliptin inhibits DPP-4, and thereby reduces fasting and postprandial glucose concentrations by preventing degradation of the incretin hormones, glucagon-like peptide-1 and glucose-dependent insulinotropic polypeptide [13]. Dapagliflozin reduces blood glucose concentrations by inhibiting glucose reabsorption in the proximal tubule of the kidney, which results in enhanced urinary glucose excretion [14]. Because their mechanisms of action are glucose-dependent, both saxagliptin and dapagliflozin have a low intrinsic potential to cause hypoglycemia [13,14]. In a randomized, double-blind study of patients with T2D inadequately controlled with metformin, Rosenstock et al assessed the efficacy and safety of dual add-on of saxagliptin plus dapagliflozin versus saxagliptin and dapagliflozin added on alone (ClinicalTrials.gov identifier, NCT01606007) [15]. The dual add-on therapy resulted in a greater adjusted mean reduction from baseline in A1C at week 24 (–1.47%) compared with either saxagliptin (–0.88%) or dapagliflozin (–1.20%) alone added to metformin; the difference for dual add-on saxagliptin plus dapagliflozin to metformin vs. single add-on saxagliptin and single add-on dapagliflozin was –0.59% (P < 0.001) and –0.27% (P = 0.0166), respectively. The incidence of adverse events was similar across the 3 treatment groups, and hypo-glycemia was infrequent (1%), with no reports of severe hypoglycemia events (symptomatic events with glucose ≤ 54 mg/dL requiring assistance).
In this paper, we assess the attainment of diabetes quality measures among patients in this study, specifically, measures of glycemic and BP control.
Methods
Study Design and Patients
Quality Measure Assessment
Individual measures assessed included the proportion of patients with A1C < 7%, A1C < 8%, A1C > 9%, and BP < 140/90 mm Hg. Composite measures assessed includedthe proportion of patients with A1C < 7% and BP < 140/90 mm Hg and the proportion of patients with A1C < 8% and BP < 140/90 mm Hg.
Antihypertensive or cholesterol-lowering medication use was not controlled for in this study. Patients were maintained on their prescribed dosing regimen for antihypertensive and cholesterol-lowering medications, with adjustments as needed per the standard of care for their diagnosis. Treatment outcomes for A1C < 7%, < 8%, or > 9% were prespecified. The BP treatment outcome was also prespecified per the statistical analysis plan; however, a change to the HEDIS quality measure treatment outcome for BP during the clinical study resulted in this analysis being no longer relevant. Therefore, analyses of the currently endorsed quality measures for BP were conducted post hoc. Quality measure assessments for A1C and BP treatment outcomes were conducted using data from the 24-week, double-blind treatment period.
Statistical Analysis
P values for the differences in proportion of patients with individual treatment outcomes and composite treatment outcomes with saxagliptin plus dapagliflozin plus metformin versus saxagliptin plus metformin or dapagliflozin plus metformin were calculated using Fisher’s exact test. The numerator and denominator for each percentage are the number of responders and the number of patients with non-missing values in the treatment group at the corresponding baseline category, respectively, and are not corrected for baseline A1C. Because some patients experienced improvement in A1C during the lead-in period and could have already been at treatment goal at baseline, a sensitivity analysis excluding these patients was completed. Results are presented for the total number of patients with non-missing values in the treatment group, as well as patients with non-missing values in the treatment group who did not meet quality measure criteria at baseline. The number needed to treat (NNT) was calculated for all comparisons reaching statistical significance.
Results
Patients
Individual Quality Measures
The dual addition of saxagliptin plus dapagliflozin to metformin resulted in a significantly greater proportion of patients achieving A1C < 8.0% compared with saxagliptin plus metformin (71.2% vs 49.1%; P < 0.001; NNT 5 [95% CI 3–8]) or dapagliflozin plus metformin (60.1%; P = 0.033; NNT 9 [95% CI 5–85]; Figure 2). Similar results (proportions of patients: 66.4% vs 40.0% vs 51.9%; P ≤ 0.02; NNTs 4 [95% CI 3–7]) and 7 [95% CI 4–34]) were attained when the analysis excluded patients with baseline A1C < 8.0%.
Significantly fewer patients had A1C > 9% (a measure of poor glycemic control) with saxagliptin plus dapagliflozin plus metformin (12.4%) compared with saxagliptin plus metformin (22.3%; P = 0.017; NNT –10 [95% CI –50 to –6]; Figure 2). The proportion of patients with A1C > 9% was similar for both regimens that included dapagliflozin (12.4% vs 10.4%; P = 0.616).
No significant difference was observed among treatment groups in the proportion of patients with BP < 140/90 mm Hg (Figure 2). However, most patients had BP < 140/90 mm Hg (72%–82%) at baseline, which was generally maintained at week 24.
Composite Quality Measures
Discussion
This post hoc analysis evaluated attainment of glycemic and BP quality measures for diabetes. A significantly greater proportion of patients achieved the individual quality measures of A1C < 7% and A1C < 8% with dual add-on saxagliptin plus dapagliflozin to metformin compared with single add-on saxagliptin or dapagliflozin to metformin after 24 weeks. Similar results were seen when the analysis excluded patients with A1C < 7% and < 8% at baseline. All measures of good glycemic control had clinically relevant NNTs ≤ 10 after 24 weeks with saxagliptin plus dapagliflozin plus metformin compared with saxagliptin or dapagliflozin plus metformin, regardless of baseline status. Very few patients experienced lackof improvement in glycemic control, evidenced by small proportions of patients with A1C > 9%.
There was little difference in BP between dual add-on saxagliptin plus dapagliflozin or single add-on saxagliptin or dapagliflozin to metformin. The proportion of patients who attained the BP quality measure of BP < 140/90 mm Hg was similar across the 3 treatments, as might be expected because most patients already met this target at baseline. However, as might be expected based on the mild diuretic effect and weight loss associated with SGLT-2 inhibitors [16,17], trends in BP favored groups treated with dapagliflozin.
Attainment of multiple treatment targets is desirable in reducing complications of diabetes. A significantly greater proportion of patients achieved both A1C < 7% and BP < 140/90 mm Hg when both saxagliptin and dapagliflozin were added to metformin compared with single-agent addition of either saxagliptin or dapagliflozin plus metformin. Similarly, a significantly greater proportion of patients achieved both A1C < 8% and BP < 140/90 mm Hg with dual addition of saxagliptin and dapagliflozin plus metformin compared with saxagliptin plus metformin. There was also a numerically greater number of patients who achieved both of these goals with triple therapy compared with dapagliflozin plus metformin, but this finding did not reach statistical significance. Clinically relevant NNT values ≤ 10 were observed for both composite outcomes for saxagliptin plus dapagliflozin plus metformin compared with saxagliptin plus metformin or dapagliflozin plus metformin after 24 weeks.
Despite advances in the medical management of T2D, a report published in 2013 showed that between 2007 and 2010, only 53% of patients achieved an A1C < 7.0% and only 19% simultaneously achieved all 3 American Diabetes Association (ADA) goals recommended for most patients at that time: A1C < 7.0%, BP < 130/80 mm Hg, and low-density lipoprotein cholesterol LDL-C < 100 mg/dL [18]. These data highlight a need for new approaches to help patients attain glycemic, BP, and cholesterol goals. Our results demonstrated that a higher proportion of patients attained glycemic and BP quality measures with dual add-on saxagliptin plus dapagliflozin compared with single add-on saxagliptin or dapagliflozin to metformin. As a result of recent updates for cholesterol management from the American College of Cardiology and the American Heart Association [19], attainment of a cholesterol level was retired as a diabetes quality measure and replaced with a recommendation for statin therapy use [20,21]. Although the current analysis did not include assessment of LDL, DPP-4 inhibitors have demonstrated neutral effects on lipids [22,23], and SGLT-2 inhibitors have demonstrated generally modest increases in LDL-C (placebo-adjusted change from baseline: 4.5%–8.0% for canagliflozin 100 and 300 mg/d, 3.9% for dapagliflozin 10 mg, and 2.3%–4.2% for empagliflozin 10 and 25 mg/d) [12,24,25], as well as increases in high-density lipoprotein cholesterol and reductions in triglycerides [26].
Current ADA guidelines recommend an individualized, stepwise approach to treatment with sequential addition of single oral antihyperglycemic agents for patients who do not achieve their glycemic goal in 3 months [27]. Although T2D may progress at different rates in different patients, T2D does generally progress over time [28], and the ADA and American Association of Clinical Endocrinologists treatment guidelines recommend initial dual add-on therapy for individuals with higher A1C, which is suggestive of more advanced disease [27,29]. For individuals requiring initial combination therapy, guidelines note that antihyperglycemic agents that have a low risk of hypoglycemia and low potential for weight gain should be preferentially selected [29]. Attainment of A1C ≤ 7%, the guideline recommendation considered appropriate for many patients, is associated with reductions in microvascular disease and, if attained soon after diagnosis of diabetes, studies have shown reductions in macrovascular disease with long-term follow-up [27,30,31]. However, it may be challenging to achieve A1C < 7% with the addition of single oral antihyperglycemic agents, especially in patients with higher A1C [32]. Less stringent A1C goals (eg, A1C < 8%) may be appropriate in individuals with a long duration of diabetes that is difficult to control, history of severe hypoglycemia, limited life expectancy, numerous comorbidities, and extensive complications or comorbidities, especially cardiovascular disease [27]. Given the shift toward individualized treatment plans with patient-specific treatment goals, it is valuable to understand how different treatment strategies effect attainment of guideline-recommended less stringent and more stringent glycemic targets that may be appropriate for certain patients.
In addition to quality measures that assess glucose lowering with pharmacotherapy, it is important to consider measures that assess other aspects of diabetes care. For example, quality measures related to hypoglycemia and hyperglycemia may help avoid potentially adverse glucose levels, and quality measures related to weight may provide insight on treatment and lifestyle efforts directed at weight loss and management. NQF-endorsed measures of hypoglycemia and hyperglycemia are currently moving through annual review and are paired measures, intended to be interpreted with respect to one another to ensure balanced outcomes [33,34]. This underscores the value of efficacious antihyperglycemic agents with low intrinsic potential for hypoglycemia. Although this analysis did not include quality measures related to hypoglycemia or weight, future studies evaluating these aspects of diabetes care will likely further contribute to a more comprehensive and holistic treatment approach.
In addition to assessing a broad range of quality measures, an important aspect of care to consider is patient affordability. Affordability for an individual patient will depend on access in the patient’s individual plan, the financial resources of the patient, and the potential for medical cost offsets from improved control of the patient’s disease. For example, fixed-dose combination products are associated with increased patient adherence and may increase pharmacy costs but decrease medical costs [35].
Limitations of this study include the post hoc design and that quality measure attainment was assessed over a shorter duration of time (24 weeks) than is commonly assessed in the real-world/community setting (~12 months).
Dual add-on therapy with oral antihyperglycemic agents that have complementary mechanisms of action should lead to enhanced reductions in A1C. The results reported here and from the primary study, in which saxagliptin and dapagliflozin added to metformin significantly reduced mean A1C from baseline to week 24 compared with single add-on saxagliptin or dapagliflozin [15], showed that greater reductions in A1C were attained with the coadministration of saxagliptin and dapagliflozin. The glucuretic effect of SGLT-2 inhibitors has been associated with increased plasma glucagon concentrations and increased endogenous glucose production, which may impair the full glucose-lowering potential of SGLT-2 inhibitors [36,37]. Administering saxagliptin with dapagliflozin as dual therapy was shown to blunt the rise in plasma glucagon caused by dapagliflozin [38], and this may have contributed to the greater glucose control achieved with dual add-on of these 2 antihyperglycemic drugs [15].
By targeting multiple aspects of the underlying pathophysiology in T2D, greater improvements in A1C can be achieved. Dual add-on saxagliptin plus dapagliflozin to metformin resulted in a greater proportion of patients achieving NQF-endorsed HEDIS quality measures, as well as A1C < 7% (no longer an NQF-endorsed measure). As health care shifts to a more value-based payment structure, measuring quality outcomes will assume a greater role in guiding decision making and influence the care that patients receive. Understanding how antihyperglycemic medication regimens affect quality measures can help clinicians make informed decisions.
Corresponding author: Lawrence Blonde, MD, Ochsner Diabetes Clinical Research Unit, Frank Riddick Diabetes Institute, Department of Endocrinology, Ochsner Medical Center, New Orleans, LA.
Funding/support: This study was supported by AstraZeneca. Medical writing support for the preparation of this manuscript was provided by Lauren D’Angelo, PhD, and Janet Matsuura, PhD, from Complete Healthcare Communications, LLC (Chadds Ford, PA), with funding from AstraZeneca.
Financial disclosures: Dr. Blonde has received grant and research support from AstraZeneca, Jansen Pharmaceuticals, Lexicon Pharmaceuticals, Merck, Novo Nordisk, and Sanofi-Aventis and has received honoraria for participating as a speaker from AstraZeneca, Janssen Pharmaceuticals, Merck, Novo Nordisk, and Sanofi-Aventis as well as honoraria for consultant work from AstraZeneca, GlaxoSmithKline, Intarcia Therapeutics, Janssen Pharmaceuticals, Merck, Novo Nordisk, and Sanofi-Aventis. R. Garcia-Sanchez is an employee of AstraZeneca. J. Sheehan and Y. C. Barrett were employees of AstraZeneca at the time of this research.
1. National Quality Forum. ABCs of measurement. Accessed 11 Mar 2016 at www.qualityforum.org/Measuring_Performance/ABCs_of_Measurement.aspx.
2. National Committee for Quality Assurance. HEDIS measure development process. Accessed 14 Mar 2016 at www.ncqa.org/tabid/414/Default.aspx.
3. National Committee for Quality Assurance. HEDIS measures. Accessed 11 Mar 2016 at www.ncqa.org/HEDISQualityMeasurement/HEDISMeasures.aspx.
4. National Committee for Quality Assurance. About NCQA: overview. Accessed 14 Mar 2016 at www.ncqa.org/AboutNCQA.aspx.
5. National Committee for Quality Assurance. Health care program evaluations. Accessed 11 Mar 2016 at www.ncqa.org/Programs.aspx.
6. National Committee for Quality Assurance. HEDIS and Performance Measurement. Accessed 14 Mar 2016 at www.ncqa.org/HEDISQualityMeasurement.aspx.
7. National Committee for Quality Assurance. HEDIS 2015 technical specifications for ACO measurement. Washington, DC: National Committee for Quality Assurance; 2014.
8. National Quality Forum. Comprehensive diabetes care: hemoglobin A1c (HbA1c) poor control (> 9.0%). NQF identifier: 0059. Accessed 14 Mar 2016 at www.qualityforum.org/ProjectMeasures.aspx?projectID=73652.
9. National Quality Forum. Comprehensive diabetes care: hemoglobin A1c (HbA1c) control (< 8.0%). NQF identifier: 0575. Accessed 14 Mar 2016 at www.qualityforum.org/ProjectMeasures.aspx?projectID=73652.
10. National Quality Forum. Comprehensive diabetes care: blood pressure control (< 140/90 mm Hg). NQF identifier: 0061. Accessed 14 Mar 2016 at www.qualityforum.org/ProjectMeasures.aspx?projectID=73652.
11. Onglyza(saxagliptin). Full prescribing information. AstraZeneca, Wilmington, DE; 2014.
12. Farxiga (dapagliflozin). Full prescribing information. AstraZeneca, Wilmington, DE; March 2015.
13. Deacon CF, Holst JJ. Saxagliptin: a new dipeptidyl peptidase-4 inhibitor for the treatment of type 2 diabetes. Adv Ther 2009;26:488–99.
14. Kasichayanula S, Liu X, Lacreta F, et al. Clinical pharmacokinetics and pharmacodynamics of dapagliflozin, a selective inhibitor of sodium-glucose co-transporter type 2. Clin Pharmacokinet 2014;53:17–27.
15. Rosenstock J, Hansen L, Zee P, et al. Dual add-on therapy in type 2 diabetes poorly controlled with metformin monotherapy: a randomized double-blind trial of saxagliptin plus dapagliflozin addition versus single addition of saxagliptin or dapagliflozin to metformin. Diabetes Care 2014;38:376–83.
16. Bailey CJ. SGLT2 inhibitors: glucuretic treatment for type 2 diabetes. British Journal of Diabetes & Vascular Disease 2010;10:193-9.
17. Maliha G, Townsend RR. SGLT2 inhibitors: their potential reduction in blood pressure. J Am Soc Hypertens 2015;9:48–53.
18. Stark Casagrande S, Fradkin JE, Saydah SH, et al. The prevalence of meeting A1C, blood pressure, and LDL goals among people with diabetes, 1988-2010. Diabetes Care 2013;36:2271–9.
19. Stone NJ, Robinson JG, Lichtenstein AH, et al. 2013 ACC/AHA guideline on the treatment of blood cholesterol to reduce atherosclerotic cardiovascular risk in adults: a report of the American College of Cardiology/American Heart Association Task Force on Practice Guidelines. Circulation 2014;129:S1–45.
20. National Quality Forum. Comprehensive diabetes care (composite). NQF identifier: #0731. Accessed 11 Mar 2016 at www.qualityforum.org/QPS/QPSTool.aspx.
21. National Quality Forum. Optimal diabetes care (composite measure). NQF identifier: 0729. Accessed 14 Mar 2016 at www.qualityforum.org/ProjectMeasures.aspx?projectID=73652.
22. Amori RE, Lau J, Pittas AG. Efficacy and safety of incretin therapy in type 2 diabetes: systematic review and meta-analysis. JAMA 2007;298:194–206.
23. Monami M, Lamanna C, Desideri CM, Mannucci E. DPP-4 inhibitors and lipids: systematic review and meta-analysis. Adv Ther 2012;29:14–25.
24. Invokana(canagliflzoin). Full prescribing information. Janssen Pharmaceuticals, Titusville, NJ; 2013.
25. Jardiance(empagliflozin). Full prescribing information. Boehringer Ingelheim Pharmaceuticals and Eli Lilly, Ingelheim, Germany and Indianapolis, IN; 2014.
26. Inzucchi SE, Zinman B, Wanner C, et al. SGLT-2 inhibitors and cardiovascular risk: Proposed pathways and review of ongoing outcome trials. Diab Vasc Dis Res 2015;12:90–100.
27. American Diabetes Association. Standards of medical care in diabetes-2016. Diabetes Care 2016;39:S1–S119.
28. Fonseca VA. Defining and characterizing the progression of type 2 diabetes. Diabetes Care 2009;32:S151–S6.
29. Garber AJ, Abrahamson MJ, Barzilay JI, et al. Consensus statement by the American Association of Clinical Endocrinologists and American College of Endocrinology on the comprehensive type 2 diabetes management algorithm -- 2016 executive summary. Endocr Pract 2016;22:84–113.
30. Holman RR, Paul SK, Bethel MA, et al. 10-year follow-up of intensive glucose control in type 2 diabetes. N Engl J Med 2008;359:1577–89.
31. Nathan DM, Cleary PA, Backlund JY, et al. Intensive diabetes treatment and cardiovascular disease in patients with type 1 diabetes. N Engl J Med 2005;353:2643–53.
32. Bosi E, Camisasca RP, Collober C, et al. Effects of vildagliptin on glucose control over 24 weeks in patients with type 2 diabetes inadequately controlled with metformin. Diabetes Care 2007;30:890–5.
33. National Quality Forum. Glycemic control: hypoglycemia. NQF identifier: 2363. Accessed 29 Oct 2015 at www.qualityforum.org/QPS/QPSTool.aspx.
34. National Quality Forum. Glycemic control: hyperglycemia. NQF identifier: 2362. Accessed 11 Mar 2016 at www.qualityforum.org/QPS/QPSTool.aspx.
35. Bailey CJ, Day C. Fixed-dose single tablet antidiabetic combinations. Diabetes Obes Metab 2009;11:527–33.
36. Ferrannini E, Muscelli E, Frascerra S, et al. Metabolic response to sodium-glucose cotransporter 2 inhibition in type 2 diabetic patients. J Clin Invest 2014;124:499–508.
37. Merovci A, Solis-Herrera C, Daniele G, et al. Dapagliflozin improves muscle insulin sensitivity but enhances endogenous glucose production. J Clin Invest 2014;124:509–14.
38. Hansen L, Iqbal N, Ekholm E, et al. Postprandial dynamics of plasma glucose, insulin, and glucagon in patients with type 2 diabetes treated with saxagliptin plus dapagliflozin add-on to metformin therapy. Endocr Pract 2014;20:1187–97.
Intensive Blood Pressure Control Improves Cardiovascular Outcomes Among Ambulatory Older Adults Aged 75 and Older
Study Overview
Objective. To determine the effects of intensive (≤ 120 mm Hg) compared with standard (< 140 mm Hg) systolic blood pressure (SBP) targets in adults aged 75 years and older with hypertension.
Design. Randomized controlled trial.
Setting and participants. Participants were a pre-specified subgroup of adults aged 75 years and older from the Systolic Blood Pressure Intervention Trial (SPRINT), an open-label trial conducted at 102 clinical sites in the United States [1]. Participants were included if they had a systolic blood pressure of 130–180 mm Hg and were at increased risk for cardiovascular disease, based on a history of clinical or subclinical cardiovascular disease, chronic kidney disease, or a 10-year Framingham general cardiovascular disease risk score ≥ 15%. Adults with type 2 diabetes, a history of stroke, symptomatic heart failure within the previous 6 months or reduced left ventricular ejection fraction of less than 35%, a clinical diagnosis of dementia, an expected survival of less than 3 years, unintentional weight loss greater than 10% of body weight in the previous 5 months, a systolic blood pressure < 110 mm Hg following 1 minute of standing, or residing in a nursing home were excluded.
Intervention. Participants were randomized to SBP targets of ≤ 120 mm Hg (intensive treatment group) or SBP targets of < 140 mm Hg (standard treatment group). After randomization, the baseline antihypertensive regimens were adjusted according to treatment algorithms used in the Action to Control Cardiovascular Risk in Diabetes (ACCORD) trial [2]. All major classes of antihypertensive agents were included in the formulary and were provided at no cost to the participants. Investigators could also prescribe other antihypertensive medications, which were not provided by the study. The protocol encouraged, but did not mandate, the use of drug classes with the strongest evidence for reduction in cardiovascular outcomes. Participants were seen monthly for the first 3 months and then every 3 months thereafter for measurement of their blood pressure to adjust medications to target SBP. The length of follow-up period was planned to be an average of 5 years.
Main outcome measures. The primary study outcome was a composite of non-fatal myocardial infarction, acute coronary syndrome, non-fatal stroke, non-fatal acute decompensated heart failure, and death from cardiovascular causes. Secondary outcomes included all-cause mortality and the composite of primary study outcomes and all-cause mortality. Study outcomes were adjudicated by investigators unaware of study group assignments. Because it is not clear from previous literature if the treatment effect may be modified by the frailty status of the study participants, the study included in its baseline measurements for participants frailty status and an exploratory analysis to examine if the treatment effect varied by frailty status.
Main results. Average age of participants was 80 years, 62% were men, and the baseline systolic blood pressure was 142 mm Hg on average. Overall 31% of participants were classified as frail. The mean SBP achieved in the intensive treatment group was 123 mm Hg during follow-up, and the mean SBP in the standard treatment group was 135 mm Hg. Participants in the intensive treatment group received on average 1 more medication to reach lower SBP. Participants in the intensive group had a lower incidence of the primary outcome, 2.59% per year compared to 3.85% per year in the standard treatment group with a hazard ratio of 0.66 (95% CI, 0.51–0.85). At 3.14 years, the number needed to treat (NNT) for the primary outcome was 27. For all-cause mortality, the intensive treatment group also had lower rates: 73 deaths compared to 107 deaths in the standard treatment group (NNT, 41). In the exploratory analysis, frailty status did not significantly modify the effect of intensive treatment (P = 0.84 for interaction). The rate of adverse events in the intensive treatment group was not statistically significantly different from the standard treatment group; the rate of orthostatic hypotension was also not different between the groups.
Conclusion. Treatment of hypertension to an SBP target of ≤ 120 mm Hg compared with an SBP target of < 140 mm Hg led to lower rates of cardiovascular events and mortality among ambulatory older adults aged 75 and older.
Commentary
Published in 2012, the largest randomized controlled trial on the treatment of hypertension in older adults—the Hypertension in the Very Elderly Trial (HYVET)—found that treatment of older adults aged 80 and older with an SBP of 160 mm Hg with a target of < 150 mm Hg led to a reduction in cardiovascular deaths, strokes, and death from any cause [3]. The current SPRINT study went a step further by lowering the target SBP to 120 mm Hg and found that when compared to a target of < 140 mm Hg, the more intensive control also yielded significant benefits in reducing rates of cardiovascular events and mortality among older adults. Although average SBP reached in the intensive group was higher than the targeted goal of 120 mm Hg (an average of 123 mm Hg during follow-up), it demonstrated the clinical benefits of reducing SBP by over 10 mm Hg when compared with standard treatment group by adding on average 1 antihypertensive medication. The study did not directly tackle the issue of diastolic blood pressure (DBP) levels, though noting that treatment goal should lower DBP to < 90 mm Hg. The intensive treatment group also did not have significantly higher rates of adverse events including orthostatic hypotension and injurious falls, alleviating some of the concerns of clinicians when considering intensifying treatment of hypertension in older adults.
Clinicians often hesitate to intensify hypertension treatment among older adults because previously there has been a lack of evidence that demonstrated conclusively that lowering blood pressure yields clinical benefits [4]. The older adult population is often underrepresented in previous trials of hypertension, and prior observational studies often failed to demonstrate that lower blood pressures associate with better clinical outcomes [5]. Coupled with the concern for the high prevalence of white coat hypertension, orthostatic hypotension, falls, and frailty in the older adult population, clinicians are often concerned that intensifying hypertension treatment may do more harm than good [4]. The current study took great care in tackling some of these issues by including a measurement of frailty, by allowing older adults with postural changes in blood pressure to be included (except for those with standing blood pressure in very low range of < 110 mm Hg), and by tracking adverse events including orthostatic hypotension and injurious falls. The results should help to provide the evidence to convince clinicians that there is substantial value in intensifying hypertension treatment among ambulatory older adults and dispel some of the concerns that clinicians may have regarding its potential harms. Of note, the study excluded older adults that perhaps represent the frailest group of the older adult population—those living in nursing homes, those with dementia, and those with life expectancy of less than 3 years. The study results should not extrapolate to these groups. The analysis examining if treatment effect is consistent among those who are frail should be considered exploratory in nature, as pointed out by the study authors and the editorial to the article [6]. Further studies are needed to examine this issue.
Applications for Clinical Practice
The current study provides strong evidence that intensifying antihypertensive treatment to SBP in the range of 120 mm Hg confers clinical benefits to older ambulatory adults aged 75 and older. The current guidelines published by the Eighth Joint National Committee (JNC 8) recommends that treatment in the general population aged ≥ 60 years should consist of initiating pharmacologic treatment at SBP ≥ 150 mm Hg and treat to a goal SBP < 150 mm Hg [7]. Given the findings from the current study, the guidelines should be revised to reflect the new evidence generated from the current study. Although cardiovascular events and mortality are important clinical outcomes, other outcomes important to the older adult population should also be examined such as quality of life and functional outcomes. The SPRINT study did include these outcomes in its protocol and we look forward to additional insights regarding treatment impact on these important outcomes.
—William W. Hung, MD, MPH
1. Wright JT Jr, Williamson JD, Whelton PK, et al; SPRINT Research Group. A randomized trial of intensive vs standard blood pressure control. N Engl J Med 2015;373:2103–16.
2. The ACCORD Study Group. Effects of intensive blood-pressure control in type 2 diabetes mellitus. N Engl J Med 2010;362:1575–85.
3. Beckett N, Peters R, Tuomilehto J et al. Immediate and late benefits of treating very elderly people with hypertension: results from active treatment extension to Hypertension in the Very Elderly randomised controlled trial. BMJ 2011;344:d7541.
4. Morley JE. Systolic hypertension should not be treated in persons aged 80 and older until blood pressure is greater than 160 mmHg. J Am Geriatr Soc 2013;61:1197–8.
5. Jacobs JM, Stessman J, Ein-Mor E, et al. Hypertension and 5-year mortality among 85-year-olds: The Jerusalem Longitudinal Study. J Am Med Dir Assoc 2012;13:759.e1–759.e6.
6. Chobanian AV. SPRINT results in older patients: How low to go? JAMA 2016;315:2669–70.
7. James PA, Oparil S, Carter BL, et al. 2014 evidence-based guideline for the management of high blood pressure in adults: report from the panel members appointed to the Eighth Joint National Committee (JNC 8). JAMA 2014;311:507–20.
Study Overview
Objective. To determine the effects of intensive (≤ 120 mm Hg) compared with standard (< 140 mm Hg) systolic blood pressure (SBP) targets in adults aged 75 years and older with hypertension.
Design. Randomized controlled trial.
Setting and participants. Participants were a pre-specified subgroup of adults aged 75 years and older from the Systolic Blood Pressure Intervention Trial (SPRINT), an open-label trial conducted at 102 clinical sites in the United States [1]. Participants were included if they had a systolic blood pressure of 130–180 mm Hg and were at increased risk for cardiovascular disease, based on a history of clinical or subclinical cardiovascular disease, chronic kidney disease, or a 10-year Framingham general cardiovascular disease risk score ≥ 15%. Adults with type 2 diabetes, a history of stroke, symptomatic heart failure within the previous 6 months or reduced left ventricular ejection fraction of less than 35%, a clinical diagnosis of dementia, an expected survival of less than 3 years, unintentional weight loss greater than 10% of body weight in the previous 5 months, a systolic blood pressure < 110 mm Hg following 1 minute of standing, or residing in a nursing home were excluded.
Intervention. Participants were randomized to SBP targets of ≤ 120 mm Hg (intensive treatment group) or SBP targets of < 140 mm Hg (standard treatment group). After randomization, the baseline antihypertensive regimens were adjusted according to treatment algorithms used in the Action to Control Cardiovascular Risk in Diabetes (ACCORD) trial [2]. All major classes of antihypertensive agents were included in the formulary and were provided at no cost to the participants. Investigators could also prescribe other antihypertensive medications, which were not provided by the study. The protocol encouraged, but did not mandate, the use of drug classes with the strongest evidence for reduction in cardiovascular outcomes. Participants were seen monthly for the first 3 months and then every 3 months thereafter for measurement of their blood pressure to adjust medications to target SBP. The length of follow-up period was planned to be an average of 5 years.
Main outcome measures. The primary study outcome was a composite of non-fatal myocardial infarction, acute coronary syndrome, non-fatal stroke, non-fatal acute decompensated heart failure, and death from cardiovascular causes. Secondary outcomes included all-cause mortality and the composite of primary study outcomes and all-cause mortality. Study outcomes were adjudicated by investigators unaware of study group assignments. Because it is not clear from previous literature if the treatment effect may be modified by the frailty status of the study participants, the study included in its baseline measurements for participants frailty status and an exploratory analysis to examine if the treatment effect varied by frailty status.
Main results. Average age of participants was 80 years, 62% were men, and the baseline systolic blood pressure was 142 mm Hg on average. Overall 31% of participants were classified as frail. The mean SBP achieved in the intensive treatment group was 123 mm Hg during follow-up, and the mean SBP in the standard treatment group was 135 mm Hg. Participants in the intensive treatment group received on average 1 more medication to reach lower SBP. Participants in the intensive group had a lower incidence of the primary outcome, 2.59% per year compared to 3.85% per year in the standard treatment group with a hazard ratio of 0.66 (95% CI, 0.51–0.85). At 3.14 years, the number needed to treat (NNT) for the primary outcome was 27. For all-cause mortality, the intensive treatment group also had lower rates: 73 deaths compared to 107 deaths in the standard treatment group (NNT, 41). In the exploratory analysis, frailty status did not significantly modify the effect of intensive treatment (P = 0.84 for interaction). The rate of adverse events in the intensive treatment group was not statistically significantly different from the standard treatment group; the rate of orthostatic hypotension was also not different between the groups.
Conclusion. Treatment of hypertension to an SBP target of ≤ 120 mm Hg compared with an SBP target of < 140 mm Hg led to lower rates of cardiovascular events and mortality among ambulatory older adults aged 75 and older.
Commentary
Published in 2012, the largest randomized controlled trial on the treatment of hypertension in older adults—the Hypertension in the Very Elderly Trial (HYVET)—found that treatment of older adults aged 80 and older with an SBP of 160 mm Hg with a target of < 150 mm Hg led to a reduction in cardiovascular deaths, strokes, and death from any cause [3]. The current SPRINT study went a step further by lowering the target SBP to 120 mm Hg and found that when compared to a target of < 140 mm Hg, the more intensive control also yielded significant benefits in reducing rates of cardiovascular events and mortality among older adults. Although average SBP reached in the intensive group was higher than the targeted goal of 120 mm Hg (an average of 123 mm Hg during follow-up), it demonstrated the clinical benefits of reducing SBP by over 10 mm Hg when compared with standard treatment group by adding on average 1 antihypertensive medication. The study did not directly tackle the issue of diastolic blood pressure (DBP) levels, though noting that treatment goal should lower DBP to < 90 mm Hg. The intensive treatment group also did not have significantly higher rates of adverse events including orthostatic hypotension and injurious falls, alleviating some of the concerns of clinicians when considering intensifying treatment of hypertension in older adults.
Clinicians often hesitate to intensify hypertension treatment among older adults because previously there has been a lack of evidence that demonstrated conclusively that lowering blood pressure yields clinical benefits [4]. The older adult population is often underrepresented in previous trials of hypertension, and prior observational studies often failed to demonstrate that lower blood pressures associate with better clinical outcomes [5]. Coupled with the concern for the high prevalence of white coat hypertension, orthostatic hypotension, falls, and frailty in the older adult population, clinicians are often concerned that intensifying hypertension treatment may do more harm than good [4]. The current study took great care in tackling some of these issues by including a measurement of frailty, by allowing older adults with postural changes in blood pressure to be included (except for those with standing blood pressure in very low range of < 110 mm Hg), and by tracking adverse events including orthostatic hypotension and injurious falls. The results should help to provide the evidence to convince clinicians that there is substantial value in intensifying hypertension treatment among ambulatory older adults and dispel some of the concerns that clinicians may have regarding its potential harms. Of note, the study excluded older adults that perhaps represent the frailest group of the older adult population—those living in nursing homes, those with dementia, and those with life expectancy of less than 3 years. The study results should not extrapolate to these groups. The analysis examining if treatment effect is consistent among those who are frail should be considered exploratory in nature, as pointed out by the study authors and the editorial to the article [6]. Further studies are needed to examine this issue.
Applications for Clinical Practice
The current study provides strong evidence that intensifying antihypertensive treatment to SBP in the range of 120 mm Hg confers clinical benefits to older ambulatory adults aged 75 and older. The current guidelines published by the Eighth Joint National Committee (JNC 8) recommends that treatment in the general population aged ≥ 60 years should consist of initiating pharmacologic treatment at SBP ≥ 150 mm Hg and treat to a goal SBP < 150 mm Hg [7]. Given the findings from the current study, the guidelines should be revised to reflect the new evidence generated from the current study. Although cardiovascular events and mortality are important clinical outcomes, other outcomes important to the older adult population should also be examined such as quality of life and functional outcomes. The SPRINT study did include these outcomes in its protocol and we look forward to additional insights regarding treatment impact on these important outcomes.
—William W. Hung, MD, MPH
1. Wright JT Jr, Williamson JD, Whelton PK, et al; SPRINT Research Group. A randomized trial of intensive vs standard blood pressure control. N Engl J Med 2015;373:2103–16.
2. The ACCORD Study Group. Effects of intensive blood-pressure control in type 2 diabetes mellitus. N Engl J Med 2010;362:1575–85.
3. Beckett N, Peters R, Tuomilehto J et al. Immediate and late benefits of treating very elderly people with hypertension: results from active treatment extension to Hypertension in the Very Elderly randomised controlled trial. BMJ 2011;344:d7541.
4. Morley JE. Systolic hypertension should not be treated in persons aged 80 and older until blood pressure is greater than 160 mmHg. J Am Geriatr Soc 2013;61:1197–8.
5. Jacobs JM, Stessman J, Ein-Mor E, et al. Hypertension and 5-year mortality among 85-year-olds: The Jerusalem Longitudinal Study. J Am Med Dir Assoc 2012;13:759.e1–759.e6.
6. Chobanian AV. SPRINT results in older patients: How low to go? JAMA 2016;315:2669–70.
7. James PA, Oparil S, Carter BL, et al. 2014 evidence-based guideline for the management of high blood pressure in adults: report from the panel members appointed to the Eighth Joint National Committee (JNC 8). JAMA 2014;311:507–20.
What Happens to Patients with “Metabolically Healthy” Obesity Over Time?
Study Overview
Objective. To understand the risk of diabetes, coronary heart disease (CHD), stroke, and death over time by comparing adults who were “metabolically healthy” but obese at baseline and those with baseline cardiometabolic abnormalities, and to understand the stability of metabolic health over time.
Design. Secondary analysis of data from 2 large prospective epidemiologic cohort studies of cardiovascular risk and outcomes.
Setting and participants. This study relied on data from the Atherosclerosis Risk in Communities (ARIC) study and the Coronary Artery Risk Development in Young Adults (CARDIA) study. ARIC includes adults who were recruited in late middle-age (45–64 years at baseline) from several clinical sites in the Southeastern and Midwestern United States and who have been followed over time with multiple examinations to assess cardiovascular risk factors and outcomes. CARDIA similarly assessed cardiovascular risk behaviors and events over time in a large cohort of American men and women, however, it recruited younger participants at baseline (18–30 years old). For the present study, the authors used data from all available ARIC and CARDIA participants who had complete information on body mass index (BMI) and cardiometabolic health status and who had not already developed one of the outcomes of interest at baseline, which led to a final sample of 4990 individuals from CARDIA and 14,685 from ARIC.
The independent variable of interest in this study was twofold, describing baseline status in terms of cardiometabolic risk markers and weight. Cardiometabolic risk was categorized as either “healthy,” “suboptimal,” or “unhealthy” based on the presence or absence of 3 risk factors: (1) elevated blood pressure (with untreated threshold of < 130/85 mm Hg considered negative); (2) elevated blood glucose (with untreated threshold of fasting < 100 mg/dL or hemoglobin A1c < 5.7% considered negative); and (3) dyslipidemia (with untreated total cholesterol < 240 mg/dL and HDL cholesterol > 40 for men or > 50 for women considered negative). Participants who were negative for all 3 risk factors were deemed metabolically healthy, those with 1 or 2 risk factors “suboptimal,” and those with all 3 risk factors “unhealthy.” Participants were then further characterized by baseline weight status as “lean” (BMI < 25), “overweight” (BMI 25–29.9), or “obese” (BMI ≥ 30). Combining a participant’s metabolic and weight status therefore yielded 9 possible exposure categories, ranging from healthy-lean to unhealthy-obesity. The group of greatest interest for this study was participants in the metabolic-ally healthy-obesity (MHO) category—those with a BMI ≥ 30 but with zero of the 3 cardiometabolic risk factors.
Main outcome measures. The investigators assessed both the stability of MHO over time, and the relative contribution of BMI status vs. cardiometabolic abnormalities to key health outcomes.
To assess the stability of MHO over time, the investigators used follow-up data from both studies to create descriptive statistics on the frequency with which patients (1) changed weight status or (2) changed metabolic status, over up to 10 years of follow-up in ARIC and up to 20 years of follow-up in CARDIA.
Among only ARIC participants (the older adults at baseline), risk of several health outcomes over up to 10 years of follow-up was compared across groups. The health outcomes of interest were incident diabetes, incident CHD (myocardial infarction or coronary death), incident stroke, or all-cause mortality. To visually represent incidence of these outcomes over time, the investigators constructed Kaplan-Meier survival curves. To determine whether the risk of an outcome differed significantly according to baseline exposure category, they used Cox proportional hazards modeling, adjusting for covariates including age, sex, race, income, education, and tobacco and alcohol use. All available follow-up time was used from baseline until an outcome of interest developed or a participant was censored. Reasons for censoring a participant were not outlined. Multivariable Cox models were separately conducted for the 4 outcomes of diabetes, CHD, stroke, and mortality across the 9 main exposure categories and across 15 categories in an additional analysis where “suboptimal cardiometabolic health” was split according to whether participants had 1 or 2 baseline risk factors. The reference group for all analyses was patients with MHO. A P value of < 0.05 was specified as statistically significant.
Results. Baseline characteristics were presented only for ARIC patients. Among that group (n = 14,685), just 2% (n = 260) were characterized as MHO at baseline. Just over one-quarter (27%) were obese at baseline, and the vast majority of patients with obesity at baseline (94%) had either suboptimal cardiometabolic risk (SO) or metabolically unhealthy obesity (MUO—all 3 risk factors present). Mean follow-up time for ARIC participants was 18.7 years.
Just under half of the ARIC sample were women (45%), 25% were black (the remaining were white), mean age was 54.3 years, and mean BMI was 27.7. Covariates such as education and income were not reported in the table of patient characteristics. No statistical testing was reported comparing exposure categories at baseline, however, within the “healthy”, “suboptimal,” and “unhealthy” categories, increasing weight status appeared to track with increasing blood pressure, fasting glucose, insulin resistance, and waist circumference.
With MHO participants as the reference group, there were no significant differences between baseline weight categories (lean, overweight, obese) of “healthy” (zero risk factors) participants for CHD, stroke, or mortality during follow-up. In other words, baseline weight status did not significantly impact the risk of these 3 outcomes, assuming someone started out metabolically healthy. However, significant differences did emerge among participants with 1 or more risk factor at baseline. For those in the “suboptimal” (SO) category (1 or 2 risk factors), all 3 weight subgroups (lean, overweight, and obese) had significantly higher risk of CHD and stroke during follow-up relative to the MHO participants (hazard ratios [HRs] for CHD: lean 2.3, overweight 2.5, obese 3.0; HRs for stroke: lean 2.6, overweight 2.7, obese 3.0), and mortality risk was higher among lean-SOs (HR 1.4) and obese-SOs (HR 1.7). For those in the unhealthy category at baseline, there was significantly higher risk of CHD, stroke, and mortality across all 3 baseline weight categories relative to participants who were MHO at baseline – that is, even “lean” at baseline patients who had 3 risk factors had significantly higher risk of all of these outcomes than “healthy obese” patients (CHD HR 3.6; stroke HR 2.9; mortality HR 1.9).
Diabetes results differed slightly. For this outcome, participants in the lean-healthy baseline category had about half the risk of developing diabetes during follow-up (HR 0.47) compared to the MHO participants. Those in the overweight-healthy and lean-suboptimal health categories had no difference in risk of diabetes compared to MHO. All other subgroups had higher risk of developing diabetes over time (eg, lean-unhealthy diabetes HR 2.3; obese-unhealthy diabetes HR 5.4) relative to MHO.
Data from both ARIC and CARDIA were used to evaluate the stability of weight and metabolic health during follow-up. Consistent with nationally observed trends in the U.S., many participants gained weight during follow-up, with 17.5% of initially lean and 67.3% of overweight CARDIA patients transitioning to obesity over time. For patients initially categorized as metabolically healthy, a large fraction developed 1 or 2 metabolic abnormalities in follow-up (52% in ARIC and 35% in CARDIA). Very few participants from either study transitioned from a healthy state of 0 risk factors to the unhealthy state of 3 risk factors during follow-up.
Conclusion. The authors conclude that patients with MHO have lower risk for diabetes, CHD, stroke, and mortality than unhealthy subjects regardless of weight status. They did note that obesity increased diabetes risk, even in the absence of detectable baseline abnormalities, relative to lean healthy individuals.
Commentary
Metabolically healthy obesity describes a state where a patient’s body mass index is above 30 kg/m2 yet the individual lacks traditional measures of cardiometabolic derangement often associated with excess adiposity. The definition of MHO varies between studies but often requires that a patient with obesity display less than 3 metabolic syndrome criteria, sometimes allowing for even fewer abnormalities (eg, 0 or 1) [1]. It is estimated that anywhere between 10% to one-third of adults with obesity may fall into this category of relative metabolic health despite an elevated BMI [1,2]. Some controversy surrounds how the MHO state should be viewed and its practical implications for clinical management. It is unclear whether patients with MHO are simply in a transient state (ie, “pre-metabolic,” akin to “pre-diabetic”) that will later convert to metabolically unhealthy obesity (MUO), or whether they are truly somehow genetically able to handle excess weight without ever developing the sequelae that are so commonly observed in most patients with obesity. This is an important distinction for clinicians, as it may have implications for how aggressively weight loss is pursued and how long-term risks of excess weight are framed for these individuals. Consider a 40-year-old female patient with a BMI of 32 who is otherwise healthy and active, on no BP medications, with an optimal lipid profile and no signs of insulin resistance. Should this patient be encouraged to lose weight? What health risks does she face in the next few decades if she does not?
In this secondary data analysis from 2 large cohort studies of cardiovascular risk, Guo and Garvey conclude that it is the cardiometabolic risk markers of elevated blood pressure, dyslipidemia, and elevated blood glucose that confer far more risk in terms of long-term cardiovascular outcomes than excess weight in and of itself. Their analyses make use of data from 2 large and rigorous cohort studies of cardiovascular outcomes, which lend credibility to the outcomes they aimed to study (ie, we can be confident that if someone is listed as having had a myocardial infarction in ARIC or CARDIA, they probably did) and provided them with the unique ability to study long-term outcomes on a large sample size. In short, this study would have been difficult to do with many other sources of data or methodologies. Their statistical methods for comparing the risk of the outcomes over long-term follow-up appear robust, particularly given the high event rates in some of the groups and therefore inevitable high levels of censoring over time. Importantly, they control for a number of potential confounders in their study, including tobacco use. On the other hand, they perform quite a large number of statistical comparisons, therefore it is possible they may have found fewer significant differences between groups with a more stringent cutoff for their P value (eg, with a Bonferroni correction).
Regarding the stability of the metabolically healthy state over time, it appears there was significant crossover of participants from “healthy” to “suboptimal,” and significant weight gain occurred during follow-up. It is not clear whether an individual’s baseline exposure category was permitted to change over time in the statistical models, which could have impacted their results. Clinically, it is not surprising that there was a lot of movement between categories over up to 20 years of follow-up. It underscores the notion that even if a patient is obese and metabolically healthy cross-sectionally, many of these individuals will not remain metabolically healthy over time. Additionally, although the study abstract describes using data from both ARIC and CARDIA, the health outcomes component relied solely on ARIC participants. These were a group of relatively older adults at baseline who had already made it through much of their adult lives without developing any of the outcomes of interest (diabetes, CHD, stroke or mortality), therefore could have represented a sample that is somehow more metabolically resilient than the general population. As stated by the authors in their limitation section, the assertion that MHO patients are not at increased risk of cardiovascular disease (CVD) outcomes should not be extrapolated to younger patients based on this cohort. This is particularly true because, again, the stability of metabolic health appears relatively low—over half of baseline “healthy” participants in ARIC and over one-third in CARDIA developed 1 or more risk factors in follow-up, and therefore presumably also developed greater risk of CVD than if they had remained “metabolically healthy.” The likelihood that young adults with MHO will go on to develop new risk factors over time is underscored by how rare the MHO state was in the ARIC sample—it represented only 2% of the overall population, and 6% of those with obesity.
Additionally, as the authors noted, while CVD appeared to be much more influenced by the risk factor trio than by obesity alone, obesity did increase diabetes risk even in the “metabolically healthy” group. This finding aligns with prior work suggesting that patients with MHO are at increased risk of diabetes but not CVD, compared with their normal weight metabolically healthy counterparts [3].
Applications for Clinical Practice
Regardless of weight status, patients with risk factors such as elevated blood pressure, glucose, or lipids would benefit from interventions to reduce their long-term cardiovascular risk and mortality. On the other hand, patients with obesity who lack traditional cardiometabolic risk factors represent a clinical population where it is more difficult to advise on some of the potential benefits of weight loss. Adults with MHO can be advised with confidence that weight loss may reduce their risk of developing diabetes, and they may have other important motivations for weight loss that can be supported as well. Importantly, young adults with MHO who are not interested in weight loss should not be assumed to be “in the clear” for cardiovascular risk; they should be monitored for development of new risk factors over time and for the ensuing need for increased intensity of weight loss recommendations and interventions.
—Kristina Lewis, MD, MPH
1. Roberson LL, Aneni EC, Maziak W, et al. Beyond BMI: The “metabolically healthy obese” phenotype and its association with clinical/subclinical cardiovascular disease and all-cause mortality -- a systematic review. BMC Public Health 2014;14:14.
2. Wildman RP, Muntner P, Reynolds K, et al. The obese without cardiometabolic risk factor clustering and the normal weight with cardiometabolic risk factor clustering: prevalence and correlates of 2 phenotypes among the US population (NHANES 1999-2004). Arch Intern Med 2008;168:1617–24.
3. Appleton SL, Seaborn CJ, Visvanathan R, et al. Diabetes and cardiovascular disease outcomes in the metabolically healthy obese phenotype: a cohort study. Diabetes Care 2013;36:2388–94.
Study Overview
Objective. To understand the risk of diabetes, coronary heart disease (CHD), stroke, and death over time by comparing adults who were “metabolically healthy” but obese at baseline and those with baseline cardiometabolic abnormalities, and to understand the stability of metabolic health over time.
Design. Secondary analysis of data from 2 large prospective epidemiologic cohort studies of cardiovascular risk and outcomes.
Setting and participants. This study relied on data from the Atherosclerosis Risk in Communities (ARIC) study and the Coronary Artery Risk Development in Young Adults (CARDIA) study. ARIC includes adults who were recruited in late middle-age (45–64 years at baseline) from several clinical sites in the Southeastern and Midwestern United States and who have been followed over time with multiple examinations to assess cardiovascular risk factors and outcomes. CARDIA similarly assessed cardiovascular risk behaviors and events over time in a large cohort of American men and women, however, it recruited younger participants at baseline (18–30 years old). For the present study, the authors used data from all available ARIC and CARDIA participants who had complete information on body mass index (BMI) and cardiometabolic health status and who had not already developed one of the outcomes of interest at baseline, which led to a final sample of 4990 individuals from CARDIA and 14,685 from ARIC.
The independent variable of interest in this study was twofold, describing baseline status in terms of cardiometabolic risk markers and weight. Cardiometabolic risk was categorized as either “healthy,” “suboptimal,” or “unhealthy” based on the presence or absence of 3 risk factors: (1) elevated blood pressure (with untreated threshold of < 130/85 mm Hg considered negative); (2) elevated blood glucose (with untreated threshold of fasting < 100 mg/dL or hemoglobin A1c < 5.7% considered negative); and (3) dyslipidemia (with untreated total cholesterol < 240 mg/dL and HDL cholesterol > 40 for men or > 50 for women considered negative). Participants who were negative for all 3 risk factors were deemed metabolically healthy, those with 1 or 2 risk factors “suboptimal,” and those with all 3 risk factors “unhealthy.” Participants were then further characterized by baseline weight status as “lean” (BMI < 25), “overweight” (BMI 25–29.9), or “obese” (BMI ≥ 30). Combining a participant’s metabolic and weight status therefore yielded 9 possible exposure categories, ranging from healthy-lean to unhealthy-obesity. The group of greatest interest for this study was participants in the metabolic-ally healthy-obesity (MHO) category—those with a BMI ≥ 30 but with zero of the 3 cardiometabolic risk factors.
Main outcome measures. The investigators assessed both the stability of MHO over time, and the relative contribution of BMI status vs. cardiometabolic abnormalities to key health outcomes.
To assess the stability of MHO over time, the investigators used follow-up data from both studies to create descriptive statistics on the frequency with which patients (1) changed weight status or (2) changed metabolic status, over up to 10 years of follow-up in ARIC and up to 20 years of follow-up in CARDIA.
Among only ARIC participants (the older adults at baseline), risk of several health outcomes over up to 10 years of follow-up was compared across groups. The health outcomes of interest were incident diabetes, incident CHD (myocardial infarction or coronary death), incident stroke, or all-cause mortality. To visually represent incidence of these outcomes over time, the investigators constructed Kaplan-Meier survival curves. To determine whether the risk of an outcome differed significantly according to baseline exposure category, they used Cox proportional hazards modeling, adjusting for covariates including age, sex, race, income, education, and tobacco and alcohol use. All available follow-up time was used from baseline until an outcome of interest developed or a participant was censored. Reasons for censoring a participant were not outlined. Multivariable Cox models were separately conducted for the 4 outcomes of diabetes, CHD, stroke, and mortality across the 9 main exposure categories and across 15 categories in an additional analysis where “suboptimal cardiometabolic health” was split according to whether participants had 1 or 2 baseline risk factors. The reference group for all analyses was patients with MHO. A P value of < 0.05 was specified as statistically significant.
Results. Baseline characteristics were presented only for ARIC patients. Among that group (n = 14,685), just 2% (n = 260) were characterized as MHO at baseline. Just over one-quarter (27%) were obese at baseline, and the vast majority of patients with obesity at baseline (94%) had either suboptimal cardiometabolic risk (SO) or metabolically unhealthy obesity (MUO—all 3 risk factors present). Mean follow-up time for ARIC participants was 18.7 years.
Just under half of the ARIC sample were women (45%), 25% were black (the remaining were white), mean age was 54.3 years, and mean BMI was 27.7. Covariates such as education and income were not reported in the table of patient characteristics. No statistical testing was reported comparing exposure categories at baseline, however, within the “healthy”, “suboptimal,” and “unhealthy” categories, increasing weight status appeared to track with increasing blood pressure, fasting glucose, insulin resistance, and waist circumference.
With MHO participants as the reference group, there were no significant differences between baseline weight categories (lean, overweight, obese) of “healthy” (zero risk factors) participants for CHD, stroke, or mortality during follow-up. In other words, baseline weight status did not significantly impact the risk of these 3 outcomes, assuming someone started out metabolically healthy. However, significant differences did emerge among participants with 1 or more risk factor at baseline. For those in the “suboptimal” (SO) category (1 or 2 risk factors), all 3 weight subgroups (lean, overweight, and obese) had significantly higher risk of CHD and stroke during follow-up relative to the MHO participants (hazard ratios [HRs] for CHD: lean 2.3, overweight 2.5, obese 3.0; HRs for stroke: lean 2.6, overweight 2.7, obese 3.0), and mortality risk was higher among lean-SOs (HR 1.4) and obese-SOs (HR 1.7). For those in the unhealthy category at baseline, there was significantly higher risk of CHD, stroke, and mortality across all 3 baseline weight categories relative to participants who were MHO at baseline – that is, even “lean” at baseline patients who had 3 risk factors had significantly higher risk of all of these outcomes than “healthy obese” patients (CHD HR 3.6; stroke HR 2.9; mortality HR 1.9).
Diabetes results differed slightly. For this outcome, participants in the lean-healthy baseline category had about half the risk of developing diabetes during follow-up (HR 0.47) compared to the MHO participants. Those in the overweight-healthy and lean-suboptimal health categories had no difference in risk of diabetes compared to MHO. All other subgroups had higher risk of developing diabetes over time (eg, lean-unhealthy diabetes HR 2.3; obese-unhealthy diabetes HR 5.4) relative to MHO.
Data from both ARIC and CARDIA were used to evaluate the stability of weight and metabolic health during follow-up. Consistent with nationally observed trends in the U.S., many participants gained weight during follow-up, with 17.5% of initially lean and 67.3% of overweight CARDIA patients transitioning to obesity over time. For patients initially categorized as metabolically healthy, a large fraction developed 1 or 2 metabolic abnormalities in follow-up (52% in ARIC and 35% in CARDIA). Very few participants from either study transitioned from a healthy state of 0 risk factors to the unhealthy state of 3 risk factors during follow-up.
Conclusion. The authors conclude that patients with MHO have lower risk for diabetes, CHD, stroke, and mortality than unhealthy subjects regardless of weight status. They did note that obesity increased diabetes risk, even in the absence of detectable baseline abnormalities, relative to lean healthy individuals.
Commentary
Metabolically healthy obesity describes a state where a patient’s body mass index is above 30 kg/m2 yet the individual lacks traditional measures of cardiometabolic derangement often associated with excess adiposity. The definition of MHO varies between studies but often requires that a patient with obesity display less than 3 metabolic syndrome criteria, sometimes allowing for even fewer abnormalities (eg, 0 or 1) [1]. It is estimated that anywhere between 10% to one-third of adults with obesity may fall into this category of relative metabolic health despite an elevated BMI [1,2]. Some controversy surrounds how the MHO state should be viewed and its practical implications for clinical management. It is unclear whether patients with MHO are simply in a transient state (ie, “pre-metabolic,” akin to “pre-diabetic”) that will later convert to metabolically unhealthy obesity (MUO), or whether they are truly somehow genetically able to handle excess weight without ever developing the sequelae that are so commonly observed in most patients with obesity. This is an important distinction for clinicians, as it may have implications for how aggressively weight loss is pursued and how long-term risks of excess weight are framed for these individuals. Consider a 40-year-old female patient with a BMI of 32 who is otherwise healthy and active, on no BP medications, with an optimal lipid profile and no signs of insulin resistance. Should this patient be encouraged to lose weight? What health risks does she face in the next few decades if she does not?
In this secondary data analysis from 2 large cohort studies of cardiovascular risk, Guo and Garvey conclude that it is the cardiometabolic risk markers of elevated blood pressure, dyslipidemia, and elevated blood glucose that confer far more risk in terms of long-term cardiovascular outcomes than excess weight in and of itself. Their analyses make use of data from 2 large and rigorous cohort studies of cardiovascular outcomes, which lend credibility to the outcomes they aimed to study (ie, we can be confident that if someone is listed as having had a myocardial infarction in ARIC or CARDIA, they probably did) and provided them with the unique ability to study long-term outcomes on a large sample size. In short, this study would have been difficult to do with many other sources of data or methodologies. Their statistical methods for comparing the risk of the outcomes over long-term follow-up appear robust, particularly given the high event rates in some of the groups and therefore inevitable high levels of censoring over time. Importantly, they control for a number of potential confounders in their study, including tobacco use. On the other hand, they perform quite a large number of statistical comparisons, therefore it is possible they may have found fewer significant differences between groups with a more stringent cutoff for their P value (eg, with a Bonferroni correction).
Regarding the stability of the metabolically healthy state over time, it appears there was significant crossover of participants from “healthy” to “suboptimal,” and significant weight gain occurred during follow-up. It is not clear whether an individual’s baseline exposure category was permitted to change over time in the statistical models, which could have impacted their results. Clinically, it is not surprising that there was a lot of movement between categories over up to 20 years of follow-up. It underscores the notion that even if a patient is obese and metabolically healthy cross-sectionally, many of these individuals will not remain metabolically healthy over time. Additionally, although the study abstract describes using data from both ARIC and CARDIA, the health outcomes component relied solely on ARIC participants. These were a group of relatively older adults at baseline who had already made it through much of their adult lives without developing any of the outcomes of interest (diabetes, CHD, stroke or mortality), therefore could have represented a sample that is somehow more metabolically resilient than the general population. As stated by the authors in their limitation section, the assertion that MHO patients are not at increased risk of cardiovascular disease (CVD) outcomes should not be extrapolated to younger patients based on this cohort. This is particularly true because, again, the stability of metabolic health appears relatively low—over half of baseline “healthy” participants in ARIC and over one-third in CARDIA developed 1 or more risk factors in follow-up, and therefore presumably also developed greater risk of CVD than if they had remained “metabolically healthy.” The likelihood that young adults with MHO will go on to develop new risk factors over time is underscored by how rare the MHO state was in the ARIC sample—it represented only 2% of the overall population, and 6% of those with obesity.
Additionally, as the authors noted, while CVD appeared to be much more influenced by the risk factor trio than by obesity alone, obesity did increase diabetes risk even in the “metabolically healthy” group. This finding aligns with prior work suggesting that patients with MHO are at increased risk of diabetes but not CVD, compared with their normal weight metabolically healthy counterparts [3].
Applications for Clinical Practice
Regardless of weight status, patients with risk factors such as elevated blood pressure, glucose, or lipids would benefit from interventions to reduce their long-term cardiovascular risk and mortality. On the other hand, patients with obesity who lack traditional cardiometabolic risk factors represent a clinical population where it is more difficult to advise on some of the potential benefits of weight loss. Adults with MHO can be advised with confidence that weight loss may reduce their risk of developing diabetes, and they may have other important motivations for weight loss that can be supported as well. Importantly, young adults with MHO who are not interested in weight loss should not be assumed to be “in the clear” for cardiovascular risk; they should be monitored for development of new risk factors over time and for the ensuing need for increased intensity of weight loss recommendations and interventions.
—Kristina Lewis, MD, MPH
1. Roberson LL, Aneni EC, Maziak W, et al. Beyond BMI: The “metabolically healthy obese” phenotype and its association with clinical/subclinical cardiovascular disease and all-cause mortality -- a systematic review. BMC Public Health 2014;14:14.
2. Wildman RP, Muntner P, Reynolds K, et al. The obese without cardiometabolic risk factor clustering and the normal weight with cardiometabolic risk factor clustering: prevalence and correlates of 2 phenotypes among the US population (NHANES 1999-2004). Arch Intern Med 2008;168:1617–24.
3. Appleton SL, Seaborn CJ, Visvanathan R, et al. Diabetes and cardiovascular disease outcomes in the metabolically healthy obese phenotype: a cohort study. Diabetes Care 2013;36:2388–94.
Does Imaging After Primary Treatment of Thyroid Cancer Improve Survival?
Study Overview
Objective. To determine whether the use of imaging tests following primary treatment of differentiated thyroid cancer is associated with an increase in treatment for recurrence and improved survival.
Design. Population-based retrospective cohort study.
Setting and participants. Participants were patients from the Surveillance, Epidemiology, and End Results (SEER) Medicare-linked cancer registry who were diagnosed with differentiated thyroid cancer between 1 January 1998 and 31 December 2011. The study cohort included 28,220 patients. Patient follow up continued to 2013.
Main outcome measures. The primary outcome measures were treatment of differentiated thyroid cancer and deaths due to differentiated thyroid cancer. Number of diagnoses, imaging tests (neck ultrasounds, radioiodine scans, and PET scans), treatments for recurrence (repeat neck surgery, further radioactive iodine treatment, and radiotherapy), and disease-specific deaths were obtained for each year between 1998 and 2011. Propensity score analyses were performed to assess the relation between imaging and treatment for recurrence (logistic model) and death (Cox proportional hazards model).
Main results. Between 1998 and 2011, there was a significant increase in incident thyroid cancer (rate ratio 1.05; 95% confidence interval [CI] 1.05 to 1.06), imaging (rate ratio 1.13; 95% CI 1.12 to 1.13), and treatment for recurrence (rate ratio 1.01, 95% CI 1.01 to 1.02), but the overall death rate from thyroid cancer did not change. 56.7% of patients underwent surveillance ultrasound, 23.9% radioiodine scan, and 14.9% PET scan. After controlling for patient and tumor characteristics, patients who under-went ultrasound were more likely to have additional surgery (odds ratio [OR] 2.3, 95% CI 2.05 to 2.58) and additional radioactive iodine treatment (OR 1.45, 95% CI 1.26 to 1.69) but not radiotherapy (OR 1.08; 95% CI 0.97 to 1.20). Patients who underwent radioiodine scans and PET scans were more likely to have surgery (OR 3.39, 95% CI 3.06 to 3.76 and OR 2.31, 95% CI 2.09 to 2.55), radioactive iodine treatment (OR 17.83, 95% CI 14.49 to 22.16 and OR 2.13, 95% CI 1.89 to 2.40), and radiotherapy (OR 1.89, 95% CI 1.71 to 2.10 and OR 4.98, 95% CI 4.52 to 5.49). Thyroid cancer was the cause of death in 4.1% of the cohort. Disease-specific survival was increased in patients who had radioiodine scans (hazard ratio [HR] 0.70, 95% CI 0.60 to 0.82) but not in those who underwent ultrasound (HR 1.14, 95% CI 0.98 to 1.27) or PET scans (HR 0.91, 95% CI 0.77 to 1.07).
Conclusion. Increased use of imaging after primary treatment of thyroid cancer is associated with increased treatment for recurrence but not with improved disease-specific survival, except for radioiodine scans in presumed iodine-avid disease.
Commentary
Thyroid cancer is the most rapidly increasing cancer in the United States. An estimated 64,000 new cases will be diagnosed in 2016, which represents a tripling in thyroid cancer incidenceover the past 30 years [1]. During this time, mortality from thyroid cancer has remained stable. Most of the increase incidence is attributable to enhanced detection and diagnosis of low-risk disease (ie, papillary tumors) [2]. Although long-term survival following treatment of low-risk thyroid cancer is excellent, with 10-year survival ranging from 96% to 100% [3], concern about risk for recurrence appears to be driving an increased use of imaging in post-treatment surveillance. It is not clear, however, if the benefits of more imaging outweigh its associated costs, which include increased patient anxiety and financial costs, radiation exposure, and the potential for harm from additional treatment.
This retrospective observational study by Banerjee et al evaluated how frequently imaging is used after patients undergo primary treatment of thyroid cancer and whether post-treatment surveillance imaging affects disease-specific survival. The authors used SEERS-Medicare data from 28,220 patients diagnosed with differentiated thyroid cancer. They found a high rate of imaging after primary treatment of thyroid cancer, and all 3 imaging modalities—ultrasound, radioiodine scans, and PET scan—were associated with a higher likelihood that patients would undergo treatment for recurrence. However, only use of radioiodine scans was associated with improved survival. Radioiodine scans are recommended only for persons who have had iodine-avid disease and have evidence of recurrence on biochemical testing. This form of testing may be associated with improved survival because radioactive iodine itself frequently is effective treatment for iodine-avid disease, and iodine-avid disease is usually well differentiated and has a good prognosis. The findings of this study suggest that more imaging following primary treatment is detecting more recurrences but without having a beneficial impact on patient survival.
This study has several limitations. The study’s retrospective, observational design allows it to demonstrate only associations between imaging and treatment for recurrence or survival without providing insight into causes. The SEER-Medicare database lacks data on patient-specific variables, such as iodine avidity, patient preference, and indications for imaging, which could provide alternative explanations for the observed associations. The median age of patients in this study was 65 years, which could limit the applicability of the findings to other populations.
Applications for Clinical Practice
The approach to surveillance following treatment of differentiated thyroid cancer continues to evolve, but evidence to guide the use of imaging in recurrence monitoring is lacking. This study provides an evidence base for strategies that reduce unnecessary testing and that base surveillance plans on individual patient risk. Future studies should explore the cost-effectiveness of imaging tests and the role of physicians and patients in determining when imaging is done. Randomized controlled trials that compare outcomes when small recurrences are followed rather than treated are also needed.
1. American Cancer Society. Cancer Statistics Center. Thyroid. Accessed 3 Aug 2016 at https://cancerstatisticscenter.cancer.org/#/cancer-site/Thyroid.
2. Davies L, Welch HG. Current thyroid cancer trends in the United States. JAMA Otolaryngol Head Neck Surg 2014;140:317–22.
3. Banerjee M, Muenz DG, Chang JT, et al. Tree-based model for thyroid cancer prognostication. J Clin Endocrinol Metabl 2014;99:3737–45.
Study Overview
Objective. To determine whether the use of imaging tests following primary treatment of differentiated thyroid cancer is associated with an increase in treatment for recurrence and improved survival.
Design. Population-based retrospective cohort study.
Setting and participants. Participants were patients from the Surveillance, Epidemiology, and End Results (SEER) Medicare-linked cancer registry who were diagnosed with differentiated thyroid cancer between 1 January 1998 and 31 December 2011. The study cohort included 28,220 patients. Patient follow up continued to 2013.
Main outcome measures. The primary outcome measures were treatment of differentiated thyroid cancer and deaths due to differentiated thyroid cancer. Number of diagnoses, imaging tests (neck ultrasounds, radioiodine scans, and PET scans), treatments for recurrence (repeat neck surgery, further radioactive iodine treatment, and radiotherapy), and disease-specific deaths were obtained for each year between 1998 and 2011. Propensity score analyses were performed to assess the relation between imaging and treatment for recurrence (logistic model) and death (Cox proportional hazards model).
Main results. Between 1998 and 2011, there was a significant increase in incident thyroid cancer (rate ratio 1.05; 95% confidence interval [CI] 1.05 to 1.06), imaging (rate ratio 1.13; 95% CI 1.12 to 1.13), and treatment for recurrence (rate ratio 1.01, 95% CI 1.01 to 1.02), but the overall death rate from thyroid cancer did not change. 56.7% of patients underwent surveillance ultrasound, 23.9% radioiodine scan, and 14.9% PET scan. After controlling for patient and tumor characteristics, patients who under-went ultrasound were more likely to have additional surgery (odds ratio [OR] 2.3, 95% CI 2.05 to 2.58) and additional radioactive iodine treatment (OR 1.45, 95% CI 1.26 to 1.69) but not radiotherapy (OR 1.08; 95% CI 0.97 to 1.20). Patients who underwent radioiodine scans and PET scans were more likely to have surgery (OR 3.39, 95% CI 3.06 to 3.76 and OR 2.31, 95% CI 2.09 to 2.55), radioactive iodine treatment (OR 17.83, 95% CI 14.49 to 22.16 and OR 2.13, 95% CI 1.89 to 2.40), and radiotherapy (OR 1.89, 95% CI 1.71 to 2.10 and OR 4.98, 95% CI 4.52 to 5.49). Thyroid cancer was the cause of death in 4.1% of the cohort. Disease-specific survival was increased in patients who had radioiodine scans (hazard ratio [HR] 0.70, 95% CI 0.60 to 0.82) but not in those who underwent ultrasound (HR 1.14, 95% CI 0.98 to 1.27) or PET scans (HR 0.91, 95% CI 0.77 to 1.07).
Conclusion. Increased use of imaging after primary treatment of thyroid cancer is associated with increased treatment for recurrence but not with improved disease-specific survival, except for radioiodine scans in presumed iodine-avid disease.
Commentary
Thyroid cancer is the most rapidly increasing cancer in the United States. An estimated 64,000 new cases will be diagnosed in 2016, which represents a tripling in thyroid cancer incidenceover the past 30 years [1]. During this time, mortality from thyroid cancer has remained stable. Most of the increase incidence is attributable to enhanced detection and diagnosis of low-risk disease (ie, papillary tumors) [2]. Although long-term survival following treatment of low-risk thyroid cancer is excellent, with 10-year survival ranging from 96% to 100% [3], concern about risk for recurrence appears to be driving an increased use of imaging in post-treatment surveillance. It is not clear, however, if the benefits of more imaging outweigh its associated costs, which include increased patient anxiety and financial costs, radiation exposure, and the potential for harm from additional treatment.
This retrospective observational study by Banerjee et al evaluated how frequently imaging is used after patients undergo primary treatment of thyroid cancer and whether post-treatment surveillance imaging affects disease-specific survival. The authors used SEERS-Medicare data from 28,220 patients diagnosed with differentiated thyroid cancer. They found a high rate of imaging after primary treatment of thyroid cancer, and all 3 imaging modalities—ultrasound, radioiodine scans, and PET scan—were associated with a higher likelihood that patients would undergo treatment for recurrence. However, only use of radioiodine scans was associated with improved survival. Radioiodine scans are recommended only for persons who have had iodine-avid disease and have evidence of recurrence on biochemical testing. This form of testing may be associated with improved survival because radioactive iodine itself frequently is effective treatment for iodine-avid disease, and iodine-avid disease is usually well differentiated and has a good prognosis. The findings of this study suggest that more imaging following primary treatment is detecting more recurrences but without having a beneficial impact on patient survival.
This study has several limitations. The study’s retrospective, observational design allows it to demonstrate only associations between imaging and treatment for recurrence or survival without providing insight into causes. The SEER-Medicare database lacks data on patient-specific variables, such as iodine avidity, patient preference, and indications for imaging, which could provide alternative explanations for the observed associations. The median age of patients in this study was 65 years, which could limit the applicability of the findings to other populations.
Applications for Clinical Practice
The approach to surveillance following treatment of differentiated thyroid cancer continues to evolve, but evidence to guide the use of imaging in recurrence monitoring is lacking. This study provides an evidence base for strategies that reduce unnecessary testing and that base surveillance plans on individual patient risk. Future studies should explore the cost-effectiveness of imaging tests and the role of physicians and patients in determining when imaging is done. Randomized controlled trials that compare outcomes when small recurrences are followed rather than treated are also needed.
1. American Cancer Society. Cancer Statistics Center. Thyroid. Accessed 3 Aug 2016 at https://cancerstatisticscenter.cancer.org/#/cancer-site/Thyroid.
2. Davies L, Welch HG. Current thyroid cancer trends in the United States. JAMA Otolaryngol Head Neck Surg 2014;140:317–22.
3. Banerjee M, Muenz DG, Chang JT, et al. Tree-based model for thyroid cancer prognostication. J Clin Endocrinol Metabl 2014;99:3737–45.
Opioids, Obesity among Topics in Newly Released AAP Clinical Reports
NEW YORK (Reuters Health) - The American Academy of Pediatrics (AAP) today released six clinical reports and one policy statement covering a range of timely topics relevant to the health and care of children. Here is a snapshot.
1) Evaluation and Management of Children and Adolescents With Acute Mental Health or Behavioral Problems. Part I: Common Clinical Challenges of Patients With Mental Health and/or Behavioral Emergencies.
This report focuses on the issues relevant to children and adolescents presenting to the emergency department (ED) or primary care clinic with a mental health condition or emergency and covers the following topics: medical clearance of pediatric psychiatric patients; suicidal ideation and suicide attempts; involuntary hospitalization; restraint of the agitated patient (verbal restraint, chemical restraint and physical restraint); coordination with the medical home.
2) Evaluation and Management of Children With Acute Mental Health or Behavioral Problems. Part II: Recognition of Clinically Challenging Mental Health Related Conditions Presenting With Medical or Uncertain Symptoms.
This clinical report focuses on the challenges a pediatrician may face when evaluating patients with a mental health condition, which may be contributing to or complicating a medical or indeterminate clinical presentation. Topics include somatic symptom and related disorders; adverse effects of psychiatric medications (antipsychotic adverse effects, neuroleptic malignant syndrome, serotonin syndrome); children with special needs in the ED (autism spectrum and developmental disorders); mental health screening in the ED.
Both reports are from the AAP Committee on Pediatric Emergency Medicine and the American College of Emergency Physicians Pediatric Emergency Medicine Committee and include an executive summary.
3) Mind-Body Therapies in Children and Youth
From the AAP Section on Integrative Medicine, this report notes that a "growing body of evidence supports the effectiveness and safety of mind-body therapies in pediatrics. This clinical report outlines popular mind-body therapies for children and youth and examines the best-available evidence for a variety of mind-body therapies and practices, including biofeedback, clinical hypnosis, guided imagery, meditation, and yoga. The report is intended to help health care professionals guide their patients to nonpharmacologic approaches to improve concentration, help decrease pain, control discomfort, or ease anxiety."
4) Preventing Obesity and Eating Disorders in Adolescents
This report, from the AAP Committee on Nutrition, Committee on Adolescence, Section on Obesity, notes that "messages from pediatricians addressing obesity and reviewing constructive ways to manage weight can be safely and supportively incorporated into health care visits. Avoiding certain weight-based language and using motivational interviewing (MI) techniques may improve communication and promote successful outcomes when providing weight-management counseling. This clinical report addresses the interaction between obesity prevention and eating disorders (EDs) in teenagers, provides the pediatrician with evidence-informed tools to identify behaviors that predispose to both obesity and EDs, and provides guidance about obesity and ED prevention messages. The focus should be on a healthy lifestyle rather than on weight. Evidence suggests that obesity prevention and treatment, if conducted correctly, do not predispose to EDs."
5) Parental Presence During Treatment of Ebola or Other Highly Consequential Infection
From the AAP Committee on Infectious Diseases, this report offers "guidance to health care providers and hospitals on options to consider regarding parental presence at the bedside while caring for a child with suspected or proven Ebola virus disease (Ebola) or other highly consequential infection. Options are presented to help meet the needs of the patient and the family while also posing the least risk to providers and health care organizations."
6) Safe Sleep and Skin-to-Skin Care in the Neonatal Period for Healthy Term Newborns
This report, from the Committee on Fetus and Newborn, Task Force on Sudden Infant Death Syndrome, notes that skin-to-skin care (SSC) and rooming-in are now common in the newborn period for healthy newborns with the implementation of maternity care practices that support breastfeeding as outlined in the World Health Organization's "Ten Steps to Successful Breastfeeding." The evidence indicates that implementation of these practices "increases overall and exclusive breastfeeding, safer and healthier transitions, and improved maternal-infant bonding. In some cases, however, the practice of SSC and rooming-in may pose safety concerns, particularly with regard to sleep. This clinical report is intended for birthing centers and delivery hospitals caring for healthy newborns to assist in the establishment of appropriate SSC and safe sleep policies."
The policy statement - Medication-Assisted Treatment of Adolescents With Opioid Use Disorders - is from the Committee on Substance Use and Prevention. It notes that opioid use disorder is "a leading cause of morbidity and mortality among US youth. Effective treatments, both medications and substance use disorder counseling, are available but underused, and access to developmentally appropriate treatment is severely restricted for adolescents and young adults. Resources to disseminate available therapies and to develop new treatments specifically for this age group are needed to save and improve lives of youth with opioid addiction."
"The AAP recommends that pediatricians consider offering medication-assisted treatment to their adolescent and young adult patients with severe opioid use disorders or discuss referrals to other providers for this service," the statement advises.
The six clinical reports and one policy statement are published in the September issue of Pediatrics and were released online August 22.
SOURCE: http://bit.ly/2bfNEj8
Pediatrics 2016.
(c) Copyright Thomson Reuters 2016.
Study reveals higher risk of injuries pre- and post-cancer diagnosis

Photo courtesy of the CDC
Cancer patients have a heightened risk of injuries 16 weeks before and after their diagnosis, according to a large study.
This includes injuries arising from medical complications and treatments, such as infections or bleeding after invasive treatment, and other types of injuries, such as bruising or fractures from self-harm and accidents.
Fang Fang, MD, PhD, of Karolinska Institutet in Stockholm, Sweden, and her colleagues reported these findings in The BMJ.
The researchers analyzed all injury-related hospital admissions in Swedish patients with cancer between 1990 and 2010. The team compared a diagnostic period—16 weeks before and after diagnosis—with a control period the year before diagnosis.
Among 720,901 patients, there were 7306 injuries from medical complications and drug treatments and 8331 injuries from accidents and self-harm that resulted in hospital admission during the diagnostic period.
Patients with central nervous system cancers had the highest risk of medical-related injuries—a 14.7-fold higher risk during the diagnostic period than the control period.
Patients with lymphatic or hematopoietic cancers had a 4-fold higher risk of such injuries during the diagnostic period than during the control period.
Patients who were younger, were cohabiting, had a higher socioeconomic status or education, and had no pre-existing psychiatric disorder had a higher risk of medical-related injuries during the diagnostic period than other groups of patients.
The risk of other types of injuries from self-harm and accidents was also higher during the diagnostic period. There was a 5.3-fold increased risk during the 2 weeks before diagnosis. The researchers said this suggests that psychological stress is high when patients are expecting a diagnosis.
Patients with lymphatic or hematopoietic cancers and patients with central nervous system cancers had the highest risk of self-harm and accidental injuries—a 2.8-fold increased risk during the diagnostic period compared to the control period (for both groups).
Older patients and those with lower socioeconomic status or education had slightly greater increases in the risk of self-harm and accidental injuries compared to other groups.
The researchers said the estimates of risk in this study are conservative because the team did not account for injuries that failed to result in a hospital admission or for those that were fatal.
Furthermore, this was an observational study, so no firm conclusions about cause and effect can be made.
Still, the researchers said this study sheds light on which patients might be at an increased risk of injuries, providing evidence for clinicians and policy makers to develop targeted prevention strategies. ![]()
Pre-op Evaluation of Prolonged PT/aPTT
This evaluation can be done expeditiously through Electronics-consults (E-consults).
Purpose: To expedite and ensure safety of surgical procedure for patients who have abnormal coagulation test.
Background: There are arguments about the usefulness of routine coagulation test in preventing bleeding during surgery. These test often cause unnecessary further testing and delays of surgery. However, the surgical services and urology department at the Atlanta VAMC routinely request screening PT/aPTT for pre-operative patients. There are multiple factors that could influence the PT and aPTT not limited to factors deficiencies, inhibitors, etc.
Methods: We reviewed 26 hematology E-consults for abnormal coagulation from Surgery and Urology department. 23 males patients undergoing surgical or urological procedure have prolong aPTT with normal PT. 3 males patients undergoing urological procedure have prolonged PT but normal aPTT.
Results: 92% of patients with prolong aPTT had normal workup test results. 8% with prolong aPTT had abnormal workup leading to the diagnosis of Hemophilia A and positive lupus anticoagulant. 100% with prolong PT had normal workup test result.
Implications: The vast majority of the results of these routine coagulation test are false positive. However, a very small percentage is diagnosed with mild bleeding disorder that in some case will require intervention to prevent bleeding at the time of the surgical procedure. In the case of the patient with mild Hemophilia A (33% of FVIII level) he was given recombinant factor VIII infusion on the day of the procedure. The patient with positive anticoagulant, did not have history of thromboembolic events, therefore no intervention was taken prior to the procedure. Hematology E-consults at the Atlanta VA are answered within 24 hrs; therefore, consultations for abnormal coagulation do not cause any delay in the surgical planning besides the waiting time for the test’s results to be available.
Is Nationwide Travel for Specialized Malignant Pleural Mesothelioma (MPM) Care Feasible Within VHA?
Objective: To assess feasibility and potential costs of transport and other barriers for new patients seeking specialized care for MPM at the Boston VA Healthcare System (VABHS).
Background: Malignant Pleural Mesothelioma (MPM) is a rare disease directly related to the exposure of asbestos fibers with a 20-50 year lag time from exposure to manifestation of symptoms. Veterans are disproportionately affected by MPM compared to the general population. Due to the lack of specialized care centers for MPM, Veterans must travel great distances from their homes to receive care. This travel burden manifests as a barrier to care for Veterans.
Methods: The Mesothelioma Program at VABHS was developed through a quality improvement initiative and pilot study of a national phone triage for specialized care within a centralized healthcare network. Patients with a diagnosis suspicious for MPM contacted a general thoracic surgeon at VABHS with specialty training in mesothelioma to review their medical history. After thorough evaluation Veterans are advised by the surgeon to travel to Boston for an on-site consultation or to continue local treatment if deemed appropriate.
Results: Between 2011 and May 2016, 93 patients contacted the VABHS Mesothelioma Program, of which 73 were actually Veterans. Of these Veterans, 43 (58.9%) eventually travelled an average of 1031 miles for further workup. For the Veterans that travelled: 20 came by plane, 20 by car, 2 by train and 1 by unknown mode of transportation. Veterans stay at government housing called Huntington House (HH) an average of 7 days. The average one-way plane fare in 2015 was $377 based on Department of Transportation data. Thus a roundtrip for 2 people would average $1,508 if coming by air. For Veterans that drove to VABHS, the average distance from the West Roxbury campus was 217 miles. Using this average, it costs an average of $41.00 round trip to Boston based on current gas prices. The hotel most often used for patients costs $89.00 per night for the least expensive room. Over 7 days, this would cost the Veteran with MPM $623.00.
Conclusion: Veterans are potentially able to deflect many costs of specialized surgical care for MPM. Further improvements in the travel offices need to be pursued in order to improve efficiency.
Malignant Pleural Mesothelioma (MPM): Analysis of Military Occupation Related to Asbestos Exposure and Subsequent VA Disability Entitlements in Veterans at the Boston VA (VABHS)
Objective: Retrospective review of Veterans diagnosed with MPM looking at history of exposure to asbestos, military occupation, active duty service branch, and compensation for disability or ‘service connection’ (SC).
Background: Malignant Pleural Mesothelioma (MPM) is a rare disease that disproportionately affects Veterans. Untreated, this is a rapidly fatal disease with a 6 month median survival. Traditionally, an association between Navy service and MPM in veterans is well established. The Veterans Healthcare Administration (VHA) rewards a full, 100%, compensatory benefit known as SC disability for pleural neoplasms in the setting of asbestos exposure during military service. In 2012, Kuschner et al. from the Palo Alto VA reported that 6% (1/16) of MPM patients at their VA were even told about the possibility of compensation.
Methods: We offer open access, in-network, advice and therapy for Veterans within VHA nationally. After initial phone triage or e-consult, qualified Veterans register at the VABHS. A multidisciplinary team, including experienced MPM thoracic surgeons, pathologists and radiologists, reviews each case and tailor individual treatment plans.
Results: Between 2011 and 2016, we phone-triaged 73 Veterans with suspected MPM. 56 had confirmed MPM and half (50%) served in the U.S. Navy. 39% (16 Army, 3 Marines, 3 Air Force) served in ground or air combat units. There were 2 Veterans from the Coast Guard (4%) and 4 Veterans with unknown service branches (7%). 43 Veterans travelled an average of 1,031 miles to VABHS. 38 of these Veterans have biopsy-proven MPM, which the VHA defines as a disease rewarded 100% SC disability compensation. 3 Veterans are currently being processed by the VHA. There are still significant numbers of Veterans with MPM without SC (see Table 1.)
Conclusion: The majority of Veterans evaluated at the VABHS served in the Navy or Coast Guard, however 39% served in branches not traditionally associated with MPM. Surprisingly, many did not serve in traditional military occupations associated with asbestos exposure. There is an opportunity for improvement in recognizing a ‘service connection’ for veterans with MPM.