User login
Man’s best friend, fatal in the end
A previously healthy 59-year-old woman with a remote history of splenectomy following a motor vehicle accident presented to the emergency department with a chief complaint of fever. She had been in her usual state of health until the day before, when she developed chills and fever, with temperatures as high as 39.4°C (102.9°F). She also began to have nausea, vomiting, and diffuse body weakness and had to be brought to the emergency department in a wheelchair. She denied upper-respiratory or urinary symptoms, headache, stiff neck, recent travel, or sick contacts.
She had sustained a minor dog bite on her right hand 2 days before, but she denied swelling, erythema, or exudate. The dog, a family pet, was up to date on all of its vaccinations, including rabies.
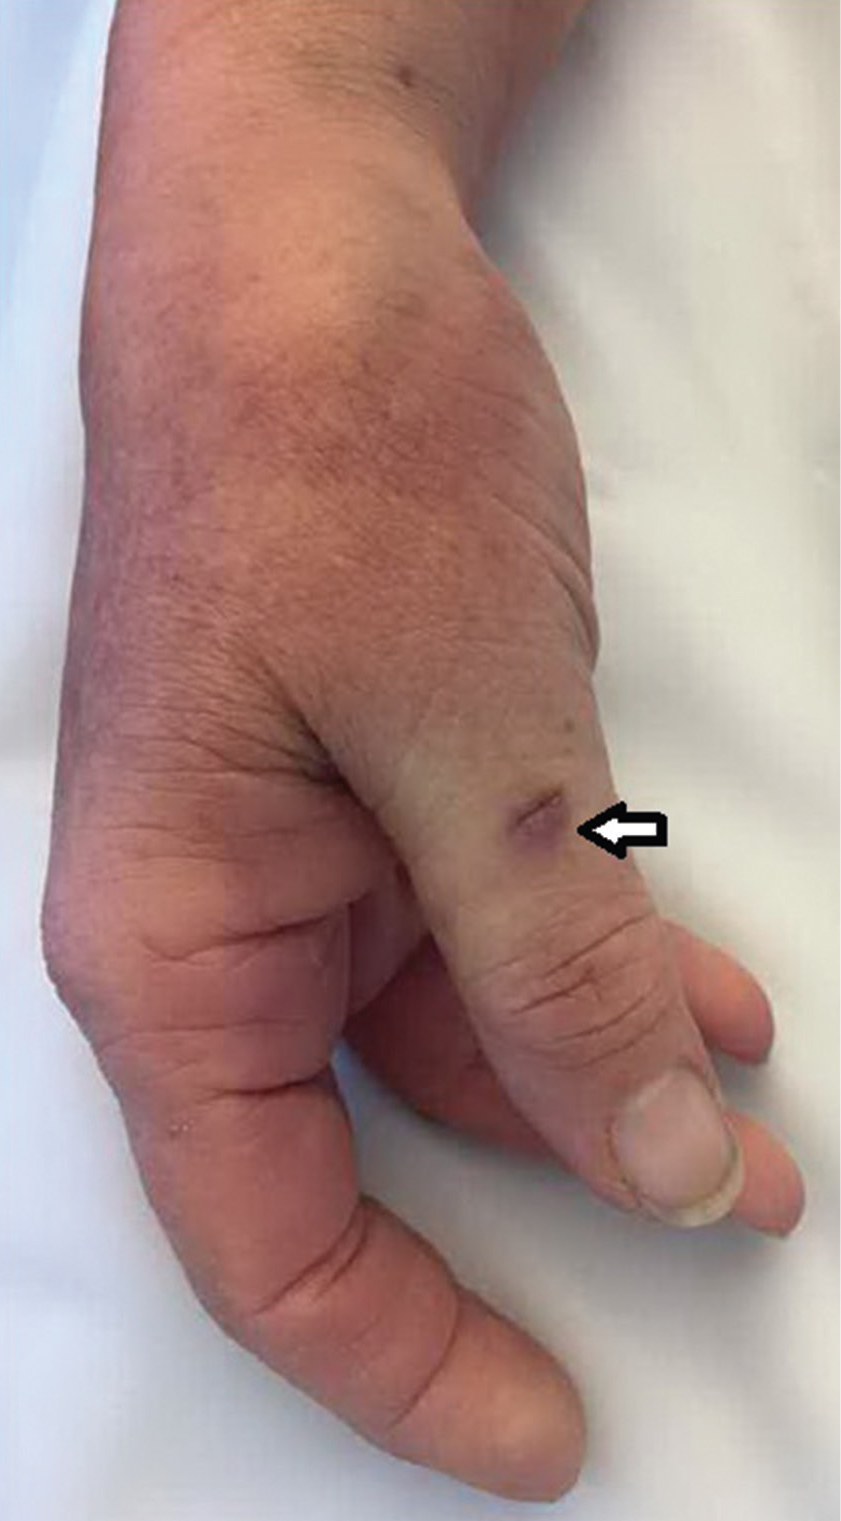
Her temperature was 39.3°C (102.7°F), heart rate 121 beats per minute, and blood pressure 113/71 mm Hg. She had a clean, nonerythematous, healing, 1-cm laceration on her right thumb (Figure 1).
Initial laboratory values (Table 1) and a radiograph of her right thumb were unremarkable.
FEVER IN ASPLENIC PATIENTS
1. What is the appropriate next step in this patient’s management?
- Discharge her from the emergency department and have her follow up with her primary care physician within 48 hours
- Admit her for observation and defer antibiotic therapy
- Admit her and start empiric antibiotic therapy
- Admit but wait for culture results to come back before starting antibiotic therapy
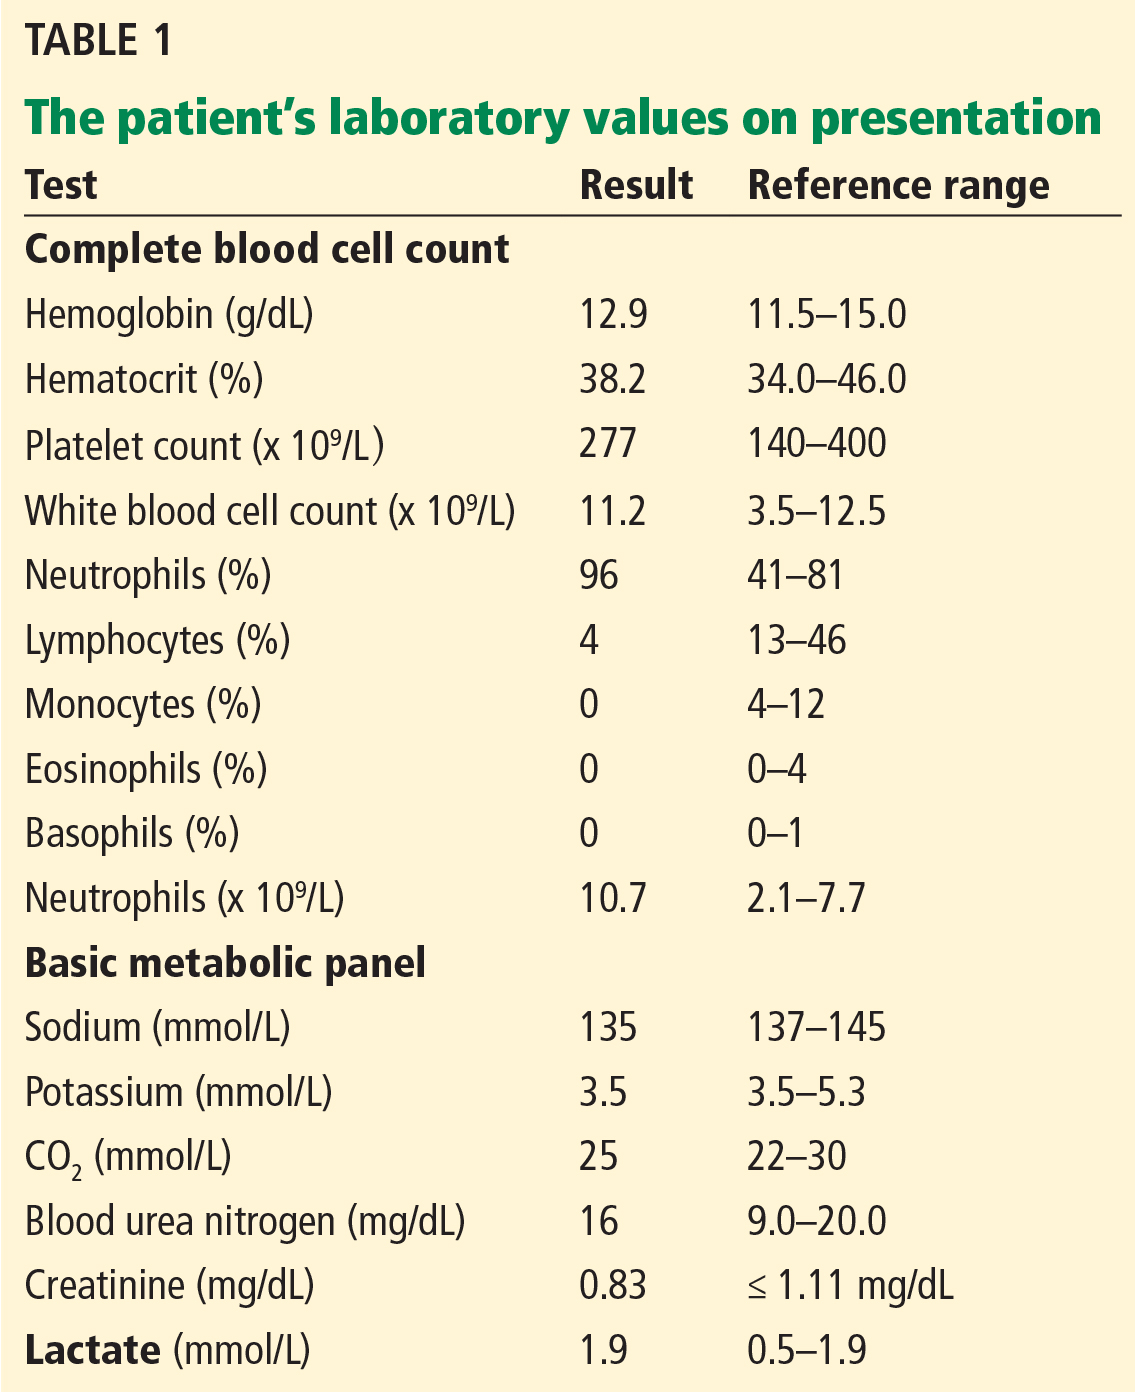
The patient’s history of splenectomy and presentation with fever raise the concern that she may be going into sepsis. In addition to fever, patients with sepsis may present with flulike symptoms such as myalgias, headache, vomiting, diarrhea, and abdominal pain.1
Sepsis in asplenic patients, also known as overwhelming postsplenectomy infection, can have a sudden onset and fulminant course, with a mortality rate as high as 50%.2 It is important to recognize those who are susceptible, including patients without a spleen from splenectomy or congenital asplenia, as well as those with functional asplenia from diseases such as sickle cell disease. Without the spleen, the immune system cannot clear immunoglobulin G-coated bacteria and encapsulated bacteria that are not opsonized by antibodies or complement.3
Any asplenic patient presenting with fever or other symptoms of systemic infection warrants immediate antibiotic treatment, without delay for cultures or further testing.1
CASE CONTINUED: RAPID DETERIORATION
With no clear source of infection, the patient’s clinical presentation was presumed to be due to a viral infection, and antibiotics were deferred. She was admitted to the hospital for observation.
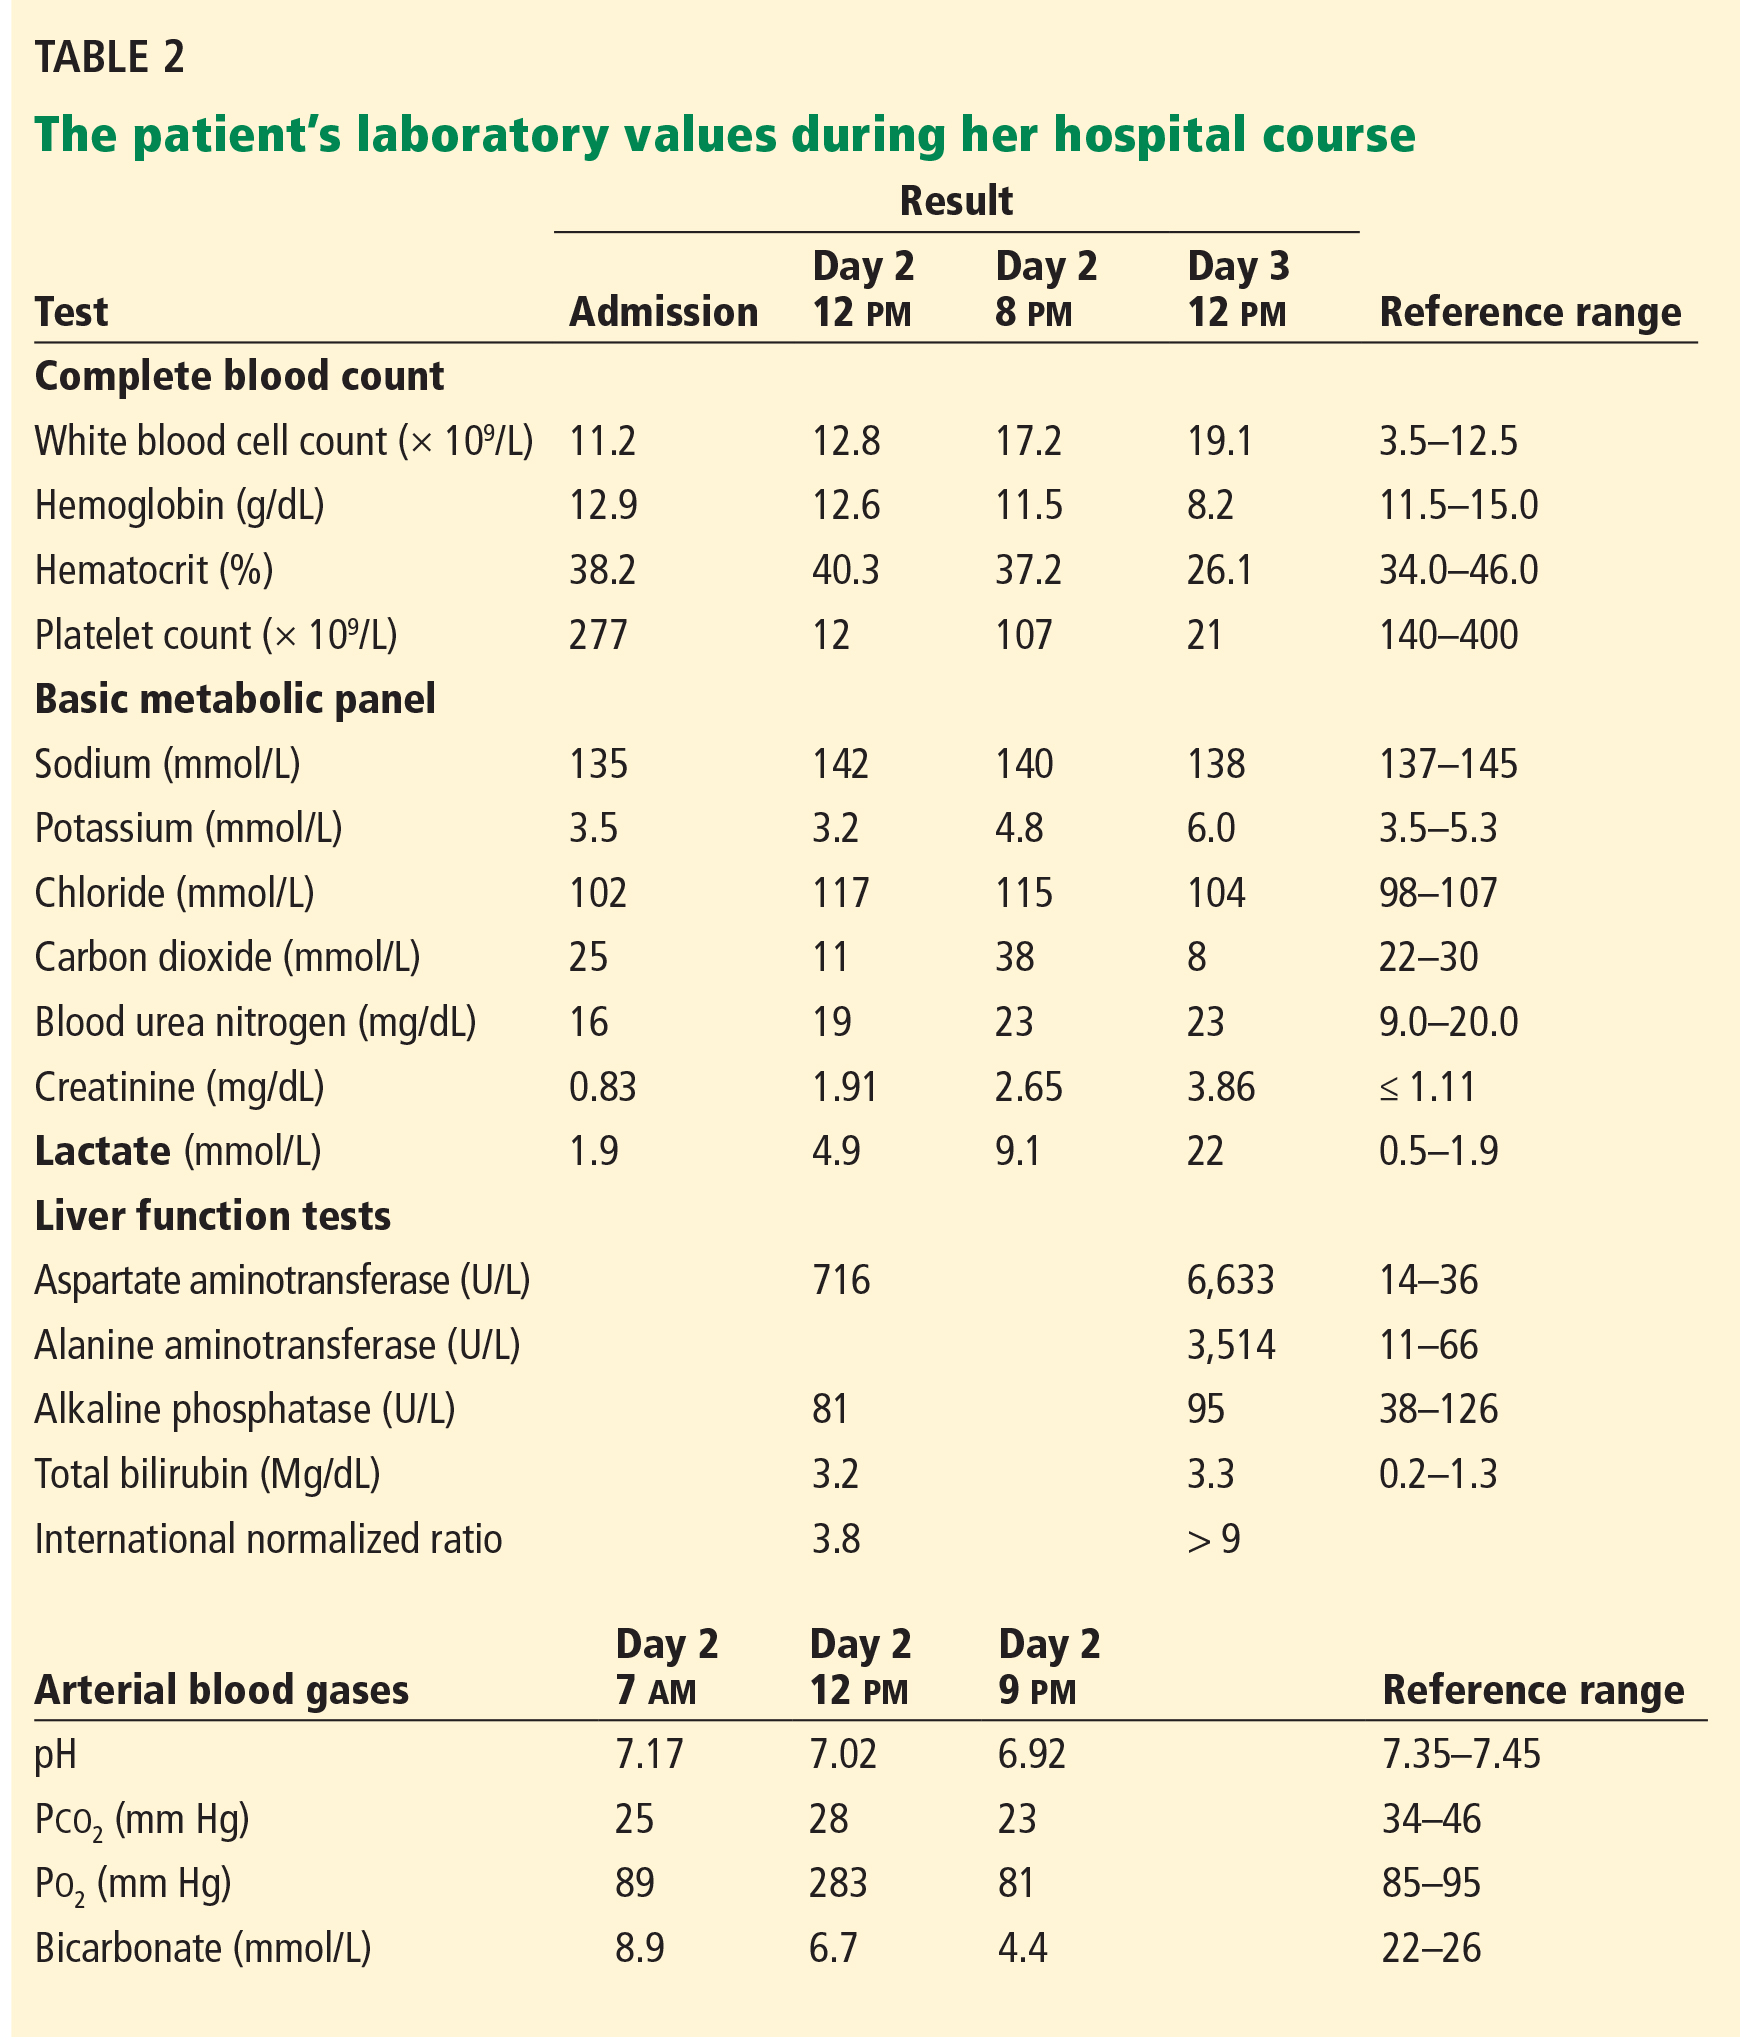
By the next morning, her mental status had declined. Her temperature at that time was 39.6°C (103.2°F), heart rate 115 per minute, and blood pressure 113/74 mm Hg. Her skin became mottled, and her lactate level increased from 1.9 mmol/L to 4.9 mmol/L (reference range 0.5–1.9 mmol/L) within 9 hours and continued to climb (Table 2).
EMPIRIC ANTIBIOTICS IN ASPLENIC SEPSIS
2. Which first-line antibiotics should have been started on initial presentation?
- Intravenous vancomycin and intravenous ceftriaxone
- Intravenous vancomycin and intravenous metronidazole
- Oral levofloxacin
- Oral amoxicillin
At initial presentation to the hospital, the most appropriate regimen for this patient would have been vancomycin and ceftriaxone or cefepime in meningitis-level (ie, high) doses.2,4
Due to impaired immunity, asplenic patients are highly susceptible to encapsulated gram-positive organisms such as Streptococcus pneumoniae and gram-negative organisms such as Haemophilus influenzae, Neisseria meningitidis, and Capnocytophaga canimorsus. These organisms are all susceptible to ceftriaxone, with the exception of methicillin-resistant S pneumoniae, which is best covered with vancomycin.1 Patients with beta-lactam hypersensitivity can be treated with moxifloxacin instead.4,5
Vancomycin and metronidazole alone would not be adequate. Oral levofloxacin or amoxicillin would be appropriate initial treatment if the patient did not have access to a hospital within 2 hours. Ideally, the patient would have had one of these medications on hand and taken it at the first sign of fever.4
CASE CONTINUED: TRANSFER TO ICU
The patient was empirically started on vancomycin and ceftriaxone and transferred to the intensive care unit. She required intubation for airway protection. She became hypotensive despite receiving intravenous fluids and multiple vasopressors. She continued to rapidly decline and developed lactic acidosis, which resulted in a severe anion gap metabolic acidosis with respiratory compensation. Her course was further complicated by disseminated intravascular coagulation, acute kidney failure, and ischemic hepatitis (“shock liver”) (Table 2).
CAUSES OF SEPSIS IN ASPLENIC PATIENTS
3. The patient’s septic shock is likely the result of which bacterial pathogen?
- S pneumoniae
- H influenzae
- C canimorsus
- N meningitidis
Encapsulated organisms including S pneumoniae, H influenzae, and N meningitidis account for almost 70% of infections in postsplenectomy patients, including those with overwhelming postsplenectomy infection.6 S pneumoniae is the most common culprit. However, the patient’s history of a recent dog bite suggests that the most likely cause was C canimorsus.
C canimorsus is a gram-negative bacillus commonly associated with exposure to dogs or cats through saliva, scratches, or bites.7,8 Even a seemingly small, benign-appearing wound, as seen in this case, can be a portal of entry for this organism. About 84 cases leading to fulminant sepsis were reported in the United States from 1990 to 2014.9 Patients infected with this organism can progress to fulminant sepsis with multiorgan failure with disseminated intravascular coagulation, anuria, and hypotension.10–12
CASE CONCLUDED
The patient died 40 hours after admission. Her blood cultures grew a slow-growing gram-negative rod within 2 days, subsequently identified as C canimorsus.
4. What is the best strategy for prevention of sepsis in an asplenic patient?
- Vaccinate against S pneumoniae (with PCV13 and PPSV23), H influenzae type b, and N meningitidis
- Prescribe antibiotics that the patient can take in case of fever
- Both of the above
- Prescribe lifelong daily antibiotic prophylaxis
- All of the above
Asplenic patients should receive pneumococcal, H influenzae type b, and meningococcal vaccines.13 Invasive bacterial infections, particularly with encapsulated organisms, occur 10 to 50 times more often in this population than in a healthy population and can be fatal.13 These vaccines have been shown to reduce the rate of life-threatening infections. Patients should receive the vaccines at least 2 weeks before an elective splenectomy or 2 weeks after a nonelective splenectomy.2
For the pneumococcal vaccines, PCV13 should be given first, followed by PPSV23 at least 8 weeks later. If the patient has already received PCV13, PPSV23 should be given at least 2 weeks after splenectomy. A second dose of PPSV23 should be given 5 years later.
The H influenzae type b vaccine should be administered if not already given.
For the meningococcal vaccine, the two-dose series should be administered with an interval of 8 to 12 weeks between doses. A booster meningococcal dose should be given every 5 years.
The patient should also receive the flu vaccine annually.2,14
Patients should also be given antibiotics (typically an antibiotic with activity against S pneumoniae, such as amoxicillin or levofloxacin) to carry with them. They should be told to take them if fever or chills develop and they cannot see a physician within 2 hours.2
Daily antibiotic prophylaxis with penicillin is typically given to patients younger than age 5, as studies have shown benefit in reducing pneumococcal sepsis. In adults, some experts recommend daily antibiotic prophylaxis for 1 year after splenectomy.2 However, there is a lack of data and expert consensus to recommend lifelong daily antibiotic prophylaxis for all asplenic patients. Thus, it is not recommended in adults unless the patient is immunocompromised or is a survivor of pneumococcal sepsis.4
KEY POINTS
- In an asplenic patient, fever can be an early sign of sepsis, which can have a rapid and fulminant course.
- Asplenic patients are particularly susceptible to infection by encapsulated organisms such as S pneumoniae, H influenzae, N meningitidis, and C canimorsus due to impaired immunity.
- If an asplenic patient has been exposed to a dog bite, scratch, or saliva, one should suspect C canimorsus.
- Asplenic patients who present with fever should be treated immediately with intravenous vancomycin and ceftriaxone without delay for laboratory tests or imaging.
- To help prevent fulminant sepsis, asplenic patients should receive vaccines (pneumococcal, meningococcal, and H influenzae type b) as well as a prescription for antibiotics (levofloxacin) to be used if they develop fever and cannot see a physician within 2 hours.
- Brigden ML. Detection, education and management of the asplenic or hyposplenic patient. Am Fam Physician 2001; 63:499–508.
- Rubin LG, Schaffner W. Clinical practice. Care of the asplenic patient. N Engl J Med 2014; 371:349–356.
- Di Sabatino A, Carsetti R, Corazza GR. Post-splenectomy and hyposplenic states. Lancet 2011; 378:86–97.
- Brigden ML, Pattullo AL. Prevention and management of overwhelming postsplenectomy infection—an update. Crit Care Med 1999; 27:836–842.
- Lynch AM, Kapila R. Overwhelming postsplenectomy infection. Infect Dis Clin North Am 1996; 10:693–707.
- Kuchar E, Miskiewicz K, Karlikowska M. A review of guidance on immunization in persons with defective or deficient splenic function. Br J Haematol 2015; 171:683–694.
- Le Moal G, Landron C, Grollier G, Robert R, Burucoa C. Meningitis due to Capnocytophaga canimorsus after receipt of a dog bite: case report and review of the literature. Clin Infect Dis 2003; 36:e42–e46.
- Lion C, Escande F, Burdin JC. Capnocytophaga canimorsus infections in human: review of the literature and cases report. Eur J Epidemiol 1996; 12:521–533.
- Butler T. Capnocytophaga canimorsus: an emerging cause of sepsis, meningitis, and post-splenectomy infection after dog bites. Eur J Clin Microbiol Infect Dis 2015; 34:1271–1280.
- Pers C, Gahrn-Hansen B, Frederiksen W. Capnocytophaga canimorsus septicemia in Denmark, 1982-1995: review of 39 cases. Clin Infect Dis 1996; 23:71–75.
- Chiappa V, Chang CY, Sellas MI, Pierce VM, Kradin RL. Case records of the Massachusetts General Hospital. Case 10-2014. A 45-year-old man with a rash. N Engl J Med 2014; 370:1238–1248.
- Martone WJ, Zuehl RW, Minson GE, Scheld WM. Postsplenectomy sepsis with DF-2: report of a case with isolation of the organism from the patient’s dog. Ann Intern Med 1980; 93:457–458.
- Centers for Disease Control and Prevention (CDC). Asplenia and adult vaccination. www.cdc.gov/vaccines/adults/rec-vac/health-conditions/asplenia.html. Accessed January 6, 2017.
- Rubin LG, Levin MJ, Ljungman P, et al; Infectious Diseases Society of America. 2013 IDSA clinical practice guideline for vaccination of the immunocompromised host. Clin Infect Dis 2014; 58:309–318.
A previously healthy 59-year-old woman with a remote history of splenectomy following a motor vehicle accident presented to the emergency department with a chief complaint of fever. She had been in her usual state of health until the day before, when she developed chills and fever, with temperatures as high as 39.4°C (102.9°F). She also began to have nausea, vomiting, and diffuse body weakness and had to be brought to the emergency department in a wheelchair. She denied upper-respiratory or urinary symptoms, headache, stiff neck, recent travel, or sick contacts.
She had sustained a minor dog bite on her right hand 2 days before, but she denied swelling, erythema, or exudate. The dog, a family pet, was up to date on all of its vaccinations, including rabies.
Her temperature was 39.3°C (102.7°F), heart rate 121 beats per minute, and blood pressure 113/71 mm Hg. She had a clean, nonerythematous, healing, 1-cm laceration on her right thumb (Figure 1).
Initial laboratory values (Table 1) and a radiograph of her right thumb were unremarkable.
FEVER IN ASPLENIC PATIENTS
1. What is the appropriate next step in this patient’s management?
- Discharge her from the emergency department and have her follow up with her primary care physician within 48 hours
- Admit her for observation and defer antibiotic therapy
- Admit her and start empiric antibiotic therapy
- Admit but wait for culture results to come back before starting antibiotic therapy
The patient’s history of splenectomy and presentation with fever raise the concern that she may be going into sepsis. In addition to fever, patients with sepsis may present with flulike symptoms such as myalgias, headache, vomiting, diarrhea, and abdominal pain.1
Sepsis in asplenic patients, also known as overwhelming postsplenectomy infection, can have a sudden onset and fulminant course, with a mortality rate as high as 50%.2 It is important to recognize those who are susceptible, including patients without a spleen from splenectomy or congenital asplenia, as well as those with functional asplenia from diseases such as sickle cell disease. Without the spleen, the immune system cannot clear immunoglobulin G-coated bacteria and encapsulated bacteria that are not opsonized by antibodies or complement.3
Any asplenic patient presenting with fever or other symptoms of systemic infection warrants immediate antibiotic treatment, without delay for cultures or further testing.1
CASE CONTINUED: RAPID DETERIORATION
With no clear source of infection, the patient’s clinical presentation was presumed to be due to a viral infection, and antibiotics were deferred. She was admitted to the hospital for observation.
By the next morning, her mental status had declined. Her temperature at that time was 39.6°C (103.2°F), heart rate 115 per minute, and blood pressure 113/74 mm Hg. Her skin became mottled, and her lactate level increased from 1.9 mmol/L to 4.9 mmol/L (reference range 0.5–1.9 mmol/L) within 9 hours and continued to climb (Table 2).
EMPIRIC ANTIBIOTICS IN ASPLENIC SEPSIS
2. Which first-line antibiotics should have been started on initial presentation?
- Intravenous vancomycin and intravenous ceftriaxone
- Intravenous vancomycin and intravenous metronidazole
- Oral levofloxacin
- Oral amoxicillin
At initial presentation to the hospital, the most appropriate regimen for this patient would have been vancomycin and ceftriaxone or cefepime in meningitis-level (ie, high) doses.2,4
Due to impaired immunity, asplenic patients are highly susceptible to encapsulated gram-positive organisms such as Streptococcus pneumoniae and gram-negative organisms such as Haemophilus influenzae, Neisseria meningitidis, and Capnocytophaga canimorsus. These organisms are all susceptible to ceftriaxone, with the exception of methicillin-resistant S pneumoniae, which is best covered with vancomycin.1 Patients with beta-lactam hypersensitivity can be treated with moxifloxacin instead.4,5
Vancomycin and metronidazole alone would not be adequate. Oral levofloxacin or amoxicillin would be appropriate initial treatment if the patient did not have access to a hospital within 2 hours. Ideally, the patient would have had one of these medications on hand and taken it at the first sign of fever.4
CASE CONTINUED: TRANSFER TO ICU
The patient was empirically started on vancomycin and ceftriaxone and transferred to the intensive care unit. She required intubation for airway protection. She became hypotensive despite receiving intravenous fluids and multiple vasopressors. She continued to rapidly decline and developed lactic acidosis, which resulted in a severe anion gap metabolic acidosis with respiratory compensation. Her course was further complicated by disseminated intravascular coagulation, acute kidney failure, and ischemic hepatitis (“shock liver”) (Table 2).
CAUSES OF SEPSIS IN ASPLENIC PATIENTS
3. The patient’s septic shock is likely the result of which bacterial pathogen?
- S pneumoniae
- H influenzae
- C canimorsus
- N meningitidis
Encapsulated organisms including S pneumoniae, H influenzae, and N meningitidis account for almost 70% of infections in postsplenectomy patients, including those with overwhelming postsplenectomy infection.6 S pneumoniae is the most common culprit. However, the patient’s history of a recent dog bite suggests that the most likely cause was C canimorsus.
C canimorsus is a gram-negative bacillus commonly associated with exposure to dogs or cats through saliva, scratches, or bites.7,8 Even a seemingly small, benign-appearing wound, as seen in this case, can be a portal of entry for this organism. About 84 cases leading to fulminant sepsis were reported in the United States from 1990 to 2014.9 Patients infected with this organism can progress to fulminant sepsis with multiorgan failure with disseminated intravascular coagulation, anuria, and hypotension.10–12
CASE CONCLUDED
The patient died 40 hours after admission. Her blood cultures grew a slow-growing gram-negative rod within 2 days, subsequently identified as C canimorsus.
4. What is the best strategy for prevention of sepsis in an asplenic patient?
- Vaccinate against S pneumoniae (with PCV13 and PPSV23), H influenzae type b, and N meningitidis
- Prescribe antibiotics that the patient can take in case of fever
- Both of the above
- Prescribe lifelong daily antibiotic prophylaxis
- All of the above
Asplenic patients should receive pneumococcal, H influenzae type b, and meningococcal vaccines.13 Invasive bacterial infections, particularly with encapsulated organisms, occur 10 to 50 times more often in this population than in a healthy population and can be fatal.13 These vaccines have been shown to reduce the rate of life-threatening infections. Patients should receive the vaccines at least 2 weeks before an elective splenectomy or 2 weeks after a nonelective splenectomy.2
For the pneumococcal vaccines, PCV13 should be given first, followed by PPSV23 at least 8 weeks later. If the patient has already received PCV13, PPSV23 should be given at least 2 weeks after splenectomy. A second dose of PPSV23 should be given 5 years later.
The H influenzae type b vaccine should be administered if not already given.
For the meningococcal vaccine, the two-dose series should be administered with an interval of 8 to 12 weeks between doses. A booster meningococcal dose should be given every 5 years.
The patient should also receive the flu vaccine annually.2,14
Patients should also be given antibiotics (typically an antibiotic with activity against S pneumoniae, such as amoxicillin or levofloxacin) to carry with them. They should be told to take them if fever or chills develop and they cannot see a physician within 2 hours.2
Daily antibiotic prophylaxis with penicillin is typically given to patients younger than age 5, as studies have shown benefit in reducing pneumococcal sepsis. In adults, some experts recommend daily antibiotic prophylaxis for 1 year after splenectomy.2 However, there is a lack of data and expert consensus to recommend lifelong daily antibiotic prophylaxis for all asplenic patients. Thus, it is not recommended in adults unless the patient is immunocompromised or is a survivor of pneumococcal sepsis.4
KEY POINTS
- In an asplenic patient, fever can be an early sign of sepsis, which can have a rapid and fulminant course.
- Asplenic patients are particularly susceptible to infection by encapsulated organisms such as S pneumoniae, H influenzae, N meningitidis, and C canimorsus due to impaired immunity.
- If an asplenic patient has been exposed to a dog bite, scratch, or saliva, one should suspect C canimorsus.
- Asplenic patients who present with fever should be treated immediately with intravenous vancomycin and ceftriaxone without delay for laboratory tests or imaging.
- To help prevent fulminant sepsis, asplenic patients should receive vaccines (pneumococcal, meningococcal, and H influenzae type b) as well as a prescription for antibiotics (levofloxacin) to be used if they develop fever and cannot see a physician within 2 hours.
A previously healthy 59-year-old woman with a remote history of splenectomy following a motor vehicle accident presented to the emergency department with a chief complaint of fever. She had been in her usual state of health until the day before, when she developed chills and fever, with temperatures as high as 39.4°C (102.9°F). She also began to have nausea, vomiting, and diffuse body weakness and had to be brought to the emergency department in a wheelchair. She denied upper-respiratory or urinary symptoms, headache, stiff neck, recent travel, or sick contacts.
She had sustained a minor dog bite on her right hand 2 days before, but she denied swelling, erythema, or exudate. The dog, a family pet, was up to date on all of its vaccinations, including rabies.
Her temperature was 39.3°C (102.7°F), heart rate 121 beats per minute, and blood pressure 113/71 mm Hg. She had a clean, nonerythematous, healing, 1-cm laceration on her right thumb (Figure 1).
Initial laboratory values (Table 1) and a radiograph of her right thumb were unremarkable.
FEVER IN ASPLENIC PATIENTS
1. What is the appropriate next step in this patient’s management?
- Discharge her from the emergency department and have her follow up with her primary care physician within 48 hours
- Admit her for observation and defer antibiotic therapy
- Admit her and start empiric antibiotic therapy
- Admit but wait for culture results to come back before starting antibiotic therapy
The patient’s history of splenectomy and presentation with fever raise the concern that she may be going into sepsis. In addition to fever, patients with sepsis may present with flulike symptoms such as myalgias, headache, vomiting, diarrhea, and abdominal pain.1
Sepsis in asplenic patients, also known as overwhelming postsplenectomy infection, can have a sudden onset and fulminant course, with a mortality rate as high as 50%.2 It is important to recognize those who are susceptible, including patients without a spleen from splenectomy or congenital asplenia, as well as those with functional asplenia from diseases such as sickle cell disease. Without the spleen, the immune system cannot clear immunoglobulin G-coated bacteria and encapsulated bacteria that are not opsonized by antibodies or complement.3
Any asplenic patient presenting with fever or other symptoms of systemic infection warrants immediate antibiotic treatment, without delay for cultures or further testing.1
CASE CONTINUED: RAPID DETERIORATION
With no clear source of infection, the patient’s clinical presentation was presumed to be due to a viral infection, and antibiotics were deferred. She was admitted to the hospital for observation.
By the next morning, her mental status had declined. Her temperature at that time was 39.6°C (103.2°F), heart rate 115 per minute, and blood pressure 113/74 mm Hg. Her skin became mottled, and her lactate level increased from 1.9 mmol/L to 4.9 mmol/L (reference range 0.5–1.9 mmol/L) within 9 hours and continued to climb (Table 2).
EMPIRIC ANTIBIOTICS IN ASPLENIC SEPSIS
2. Which first-line antibiotics should have been started on initial presentation?
- Intravenous vancomycin and intravenous ceftriaxone
- Intravenous vancomycin and intravenous metronidazole
- Oral levofloxacin
- Oral amoxicillin
At initial presentation to the hospital, the most appropriate regimen for this patient would have been vancomycin and ceftriaxone or cefepime in meningitis-level (ie, high) doses.2,4
Due to impaired immunity, asplenic patients are highly susceptible to encapsulated gram-positive organisms such as Streptococcus pneumoniae and gram-negative organisms such as Haemophilus influenzae, Neisseria meningitidis, and Capnocytophaga canimorsus. These organisms are all susceptible to ceftriaxone, with the exception of methicillin-resistant S pneumoniae, which is best covered with vancomycin.1 Patients with beta-lactam hypersensitivity can be treated with moxifloxacin instead.4,5
Vancomycin and metronidazole alone would not be adequate. Oral levofloxacin or amoxicillin would be appropriate initial treatment if the patient did not have access to a hospital within 2 hours. Ideally, the patient would have had one of these medications on hand and taken it at the first sign of fever.4
CASE CONTINUED: TRANSFER TO ICU
The patient was empirically started on vancomycin and ceftriaxone and transferred to the intensive care unit. She required intubation for airway protection. She became hypotensive despite receiving intravenous fluids and multiple vasopressors. She continued to rapidly decline and developed lactic acidosis, which resulted in a severe anion gap metabolic acidosis with respiratory compensation. Her course was further complicated by disseminated intravascular coagulation, acute kidney failure, and ischemic hepatitis (“shock liver”) (Table 2).
CAUSES OF SEPSIS IN ASPLENIC PATIENTS
3. The patient’s septic shock is likely the result of which bacterial pathogen?
- S pneumoniae
- H influenzae
- C canimorsus
- N meningitidis
Encapsulated organisms including S pneumoniae, H influenzae, and N meningitidis account for almost 70% of infections in postsplenectomy patients, including those with overwhelming postsplenectomy infection.6 S pneumoniae is the most common culprit. However, the patient’s history of a recent dog bite suggests that the most likely cause was C canimorsus.
C canimorsus is a gram-negative bacillus commonly associated with exposure to dogs or cats through saliva, scratches, or bites.7,8 Even a seemingly small, benign-appearing wound, as seen in this case, can be a portal of entry for this organism. About 84 cases leading to fulminant sepsis were reported in the United States from 1990 to 2014.9 Patients infected with this organism can progress to fulminant sepsis with multiorgan failure with disseminated intravascular coagulation, anuria, and hypotension.10–12
CASE CONCLUDED
The patient died 40 hours after admission. Her blood cultures grew a slow-growing gram-negative rod within 2 days, subsequently identified as C canimorsus.
4. What is the best strategy for prevention of sepsis in an asplenic patient?
- Vaccinate against S pneumoniae (with PCV13 and PPSV23), H influenzae type b, and N meningitidis
- Prescribe antibiotics that the patient can take in case of fever
- Both of the above
- Prescribe lifelong daily antibiotic prophylaxis
- All of the above
Asplenic patients should receive pneumococcal, H influenzae type b, and meningococcal vaccines.13 Invasive bacterial infections, particularly with encapsulated organisms, occur 10 to 50 times more often in this population than in a healthy population and can be fatal.13 These vaccines have been shown to reduce the rate of life-threatening infections. Patients should receive the vaccines at least 2 weeks before an elective splenectomy or 2 weeks after a nonelective splenectomy.2
For the pneumococcal vaccines, PCV13 should be given first, followed by PPSV23 at least 8 weeks later. If the patient has already received PCV13, PPSV23 should be given at least 2 weeks after splenectomy. A second dose of PPSV23 should be given 5 years later.
The H influenzae type b vaccine should be administered if not already given.
For the meningococcal vaccine, the two-dose series should be administered with an interval of 8 to 12 weeks between doses. A booster meningococcal dose should be given every 5 years.
The patient should also receive the flu vaccine annually.2,14
Patients should also be given antibiotics (typically an antibiotic with activity against S pneumoniae, such as amoxicillin or levofloxacin) to carry with them. They should be told to take them if fever or chills develop and they cannot see a physician within 2 hours.2
Daily antibiotic prophylaxis with penicillin is typically given to patients younger than age 5, as studies have shown benefit in reducing pneumococcal sepsis. In adults, some experts recommend daily antibiotic prophylaxis for 1 year after splenectomy.2 However, there is a lack of data and expert consensus to recommend lifelong daily antibiotic prophylaxis for all asplenic patients. Thus, it is not recommended in adults unless the patient is immunocompromised or is a survivor of pneumococcal sepsis.4
KEY POINTS
- In an asplenic patient, fever can be an early sign of sepsis, which can have a rapid and fulminant course.
- Asplenic patients are particularly susceptible to infection by encapsulated organisms such as S pneumoniae, H influenzae, N meningitidis, and C canimorsus due to impaired immunity.
- If an asplenic patient has been exposed to a dog bite, scratch, or saliva, one should suspect C canimorsus.
- Asplenic patients who present with fever should be treated immediately with intravenous vancomycin and ceftriaxone without delay for laboratory tests or imaging.
- To help prevent fulminant sepsis, asplenic patients should receive vaccines (pneumococcal, meningococcal, and H influenzae type b) as well as a prescription for antibiotics (levofloxacin) to be used if they develop fever and cannot see a physician within 2 hours.
- Brigden ML. Detection, education and management of the asplenic or hyposplenic patient. Am Fam Physician 2001; 63:499–508.
- Rubin LG, Schaffner W. Clinical practice. Care of the asplenic patient. N Engl J Med 2014; 371:349–356.
- Di Sabatino A, Carsetti R, Corazza GR. Post-splenectomy and hyposplenic states. Lancet 2011; 378:86–97.
- Brigden ML, Pattullo AL. Prevention and management of overwhelming postsplenectomy infection—an update. Crit Care Med 1999; 27:836–842.
- Lynch AM, Kapila R. Overwhelming postsplenectomy infection. Infect Dis Clin North Am 1996; 10:693–707.
- Kuchar E, Miskiewicz K, Karlikowska M. A review of guidance on immunization in persons with defective or deficient splenic function. Br J Haematol 2015; 171:683–694.
- Le Moal G, Landron C, Grollier G, Robert R, Burucoa C. Meningitis due to Capnocytophaga canimorsus after receipt of a dog bite: case report and review of the literature. Clin Infect Dis 2003; 36:e42–e46.
- Lion C, Escande F, Burdin JC. Capnocytophaga canimorsus infections in human: review of the literature and cases report. Eur J Epidemiol 1996; 12:521–533.
- Butler T. Capnocytophaga canimorsus: an emerging cause of sepsis, meningitis, and post-splenectomy infection after dog bites. Eur J Clin Microbiol Infect Dis 2015; 34:1271–1280.
- Pers C, Gahrn-Hansen B, Frederiksen W. Capnocytophaga canimorsus septicemia in Denmark, 1982-1995: review of 39 cases. Clin Infect Dis 1996; 23:71–75.
- Chiappa V, Chang CY, Sellas MI, Pierce VM, Kradin RL. Case records of the Massachusetts General Hospital. Case 10-2014. A 45-year-old man with a rash. N Engl J Med 2014; 370:1238–1248.
- Martone WJ, Zuehl RW, Minson GE, Scheld WM. Postsplenectomy sepsis with DF-2: report of a case with isolation of the organism from the patient’s dog. Ann Intern Med 1980; 93:457–458.
- Centers for Disease Control and Prevention (CDC). Asplenia and adult vaccination. www.cdc.gov/vaccines/adults/rec-vac/health-conditions/asplenia.html. Accessed January 6, 2017.
- Rubin LG, Levin MJ, Ljungman P, et al; Infectious Diseases Society of America. 2013 IDSA clinical practice guideline for vaccination of the immunocompromised host. Clin Infect Dis 2014; 58:309–318.
- Brigden ML. Detection, education and management of the asplenic or hyposplenic patient. Am Fam Physician 2001; 63:499–508.
- Rubin LG, Schaffner W. Clinical practice. Care of the asplenic patient. N Engl J Med 2014; 371:349–356.
- Di Sabatino A, Carsetti R, Corazza GR. Post-splenectomy and hyposplenic states. Lancet 2011; 378:86–97.
- Brigden ML, Pattullo AL. Prevention and management of overwhelming postsplenectomy infection—an update. Crit Care Med 1999; 27:836–842.
- Lynch AM, Kapila R. Overwhelming postsplenectomy infection. Infect Dis Clin North Am 1996; 10:693–707.
- Kuchar E, Miskiewicz K, Karlikowska M. A review of guidance on immunization in persons with defective or deficient splenic function. Br J Haematol 2015; 171:683–694.
- Le Moal G, Landron C, Grollier G, Robert R, Burucoa C. Meningitis due to Capnocytophaga canimorsus after receipt of a dog bite: case report and review of the literature. Clin Infect Dis 2003; 36:e42–e46.
- Lion C, Escande F, Burdin JC. Capnocytophaga canimorsus infections in human: review of the literature and cases report. Eur J Epidemiol 1996; 12:521–533.
- Butler T. Capnocytophaga canimorsus: an emerging cause of sepsis, meningitis, and post-splenectomy infection after dog bites. Eur J Clin Microbiol Infect Dis 2015; 34:1271–1280.
- Pers C, Gahrn-Hansen B, Frederiksen W. Capnocytophaga canimorsus septicemia in Denmark, 1982-1995: review of 39 cases. Clin Infect Dis 1996; 23:71–75.
- Chiappa V, Chang CY, Sellas MI, Pierce VM, Kradin RL. Case records of the Massachusetts General Hospital. Case 10-2014. A 45-year-old man with a rash. N Engl J Med 2014; 370:1238–1248.
- Martone WJ, Zuehl RW, Minson GE, Scheld WM. Postsplenectomy sepsis with DF-2: report of a case with isolation of the organism from the patient’s dog. Ann Intern Med 1980; 93:457–458.
- Centers for Disease Control and Prevention (CDC). Asplenia and adult vaccination. www.cdc.gov/vaccines/adults/rec-vac/health-conditions/asplenia.html. Accessed January 6, 2017.
- Rubin LG, Levin MJ, Ljungman P, et al; Infectious Diseases Society of America. 2013 IDSA clinical practice guideline for vaccination of the immunocompromised host. Clin Infect Dis 2014; 58:309–318.
When should brain imaging precede lumbar puncture in cases of suspected bacterial meningitis?
Brain imaging should precede lumbar puncture in patients with focal neurologic deficits or immunodeficiency, or with altered mental status or seizures during the previous week. However, lumbar puncture can be safely done in most patients without first obtaining brain imaging. Empiric antibiotic and corticosteroid therapy must not be delayed; they should be started immediately after the lumber puncture is done, without waiting for the results. If the lumbar puncture is going to be delayed, these treatments should be started immediately after obtaining blood samples for culture.
A MEDICAL EMERGENCY
Bacterial meningitis is a medical emergency and requires prompt recognition and treatment. It is associated with a nearly 15% death rate as well as neurologic effects such as deafness, seizures, and cognitive decline in about the same percentage of patients.1 Microbiologic information from lumbar puncture and cerebrospinal fluid analysis is an essential part of the initial workup, whenever possible. Lumbar puncture can be done safely at the bedside in most patients and so should not be delayed unless certain contraindications exist, as discussed below.2
INDICATIONS FOR BRAIN IMAGING BEFORE LUMBAR PUNCTURE
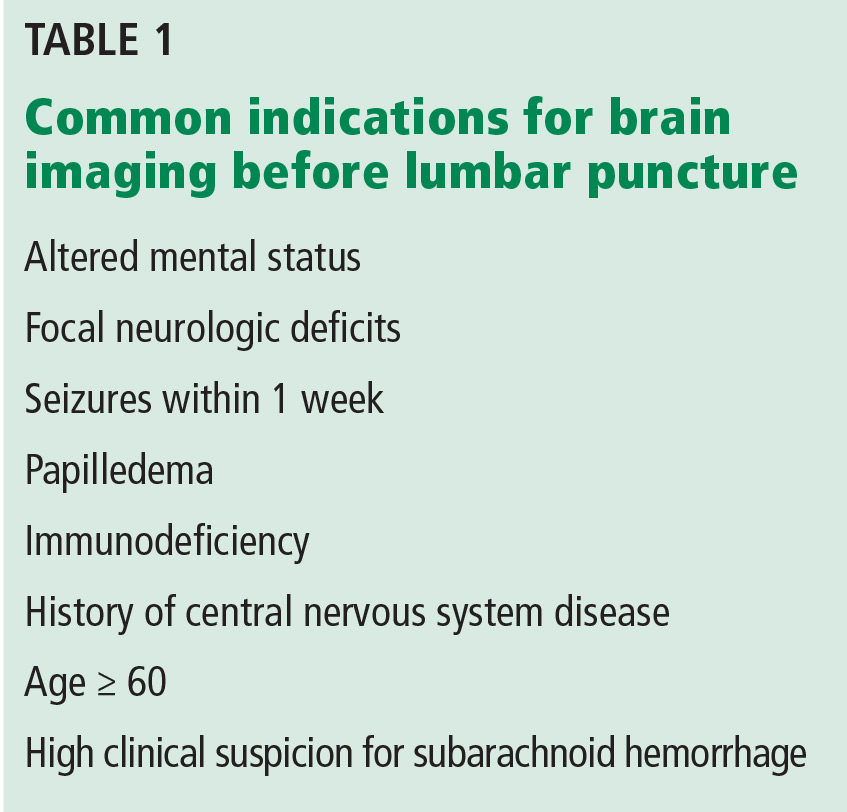
Table 1 lists common indications for brain imaging before lumbar puncture. However, there is a lack of good evidence to support them.
Current guidelines on acute bacterial meningitis from the Infectious Diseases Society of America recommend computed tomography (CT) of the brain before lumbar puncture in patients presenting with:
- Altered mental status
- A new focal neurologic deficit (eg, cranial nerve palsy, extremity weakness or drift, dysarthria, aphasia)
- Papilledema
- Seizure within the past week
- History of central nervous system disease (eg, stroke, tumor)
- Age 60 or older (likely because of the association with previous central nervous system disease)
- Immunocompromised state (due to human immunodeficiency virus infection, chemotherapy, or immunosuppressive drugs for transplant or rheumatologic disease)
- A high clinical suspicion for subarachnoid hemorrhage.3–5
However, a normal result on head CT does not rule out the possibility of increased intracranial pressure and the risk of brain herniation. Actually, patients with acute bacterial meningitis are inherently at higher risk of spontaneous brain herniation even without lumbar puncture, and some cases of brain herniation after lumbar puncture could have represented the natural course of disease. Importantly, lumbar puncture may not be independently associated with the risk of brain herniation in patients with altered mental status (Glasgow Coma Scale score ≤ 8).6 A prospective randomized study is needed to better understand when to order brain imaging before lumbar puncture and when it is safe to proceed directly to lumbar puncture.
CONTRAINDICATIONS TO LUMBAR PUNCTURE
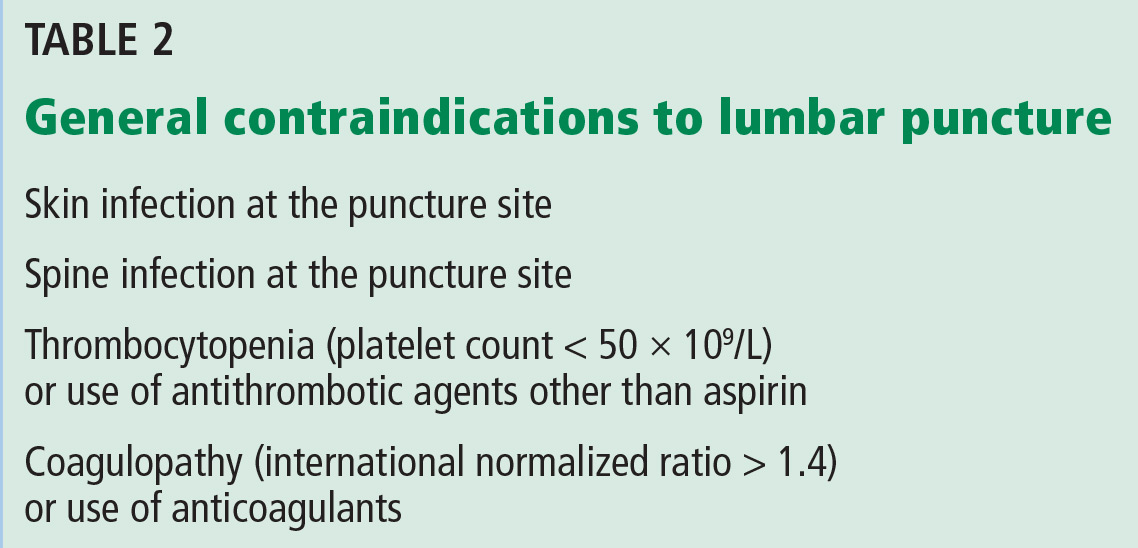
General contraindications to lumbar puncture are listed in Table 2.
Gopal et al3 analyzed clinical and radiographic data for 113 adults requiring urgent lumbar puncture and reported that altered mental status (likelihood ratio [LR] 2.2), focal neurologic deficit (LR 4.3), papilledema (LR 11.1), and clinical impression (LR 18.8) were associated with abnormalities on CT.
Hasbun et al4 prospectively analyzed whether clinical variables correlated with abnormal results of head CT that would preclude lumbar puncture in 301 patients requiring urgent lumbar puncture. They found that age 60 and older, immunodeficiency, a history of central nervous system disease, recent seizure (within 1 week), and neurologic deficits were associated with abnormal findings on head CT (eg, lesion with mass effect, midline shift). Importantly, absence of these characteristics had a 97% negative predictive value for abnormal findings on head CT. However, neither a normal head CT nor a normal clinical neurologic examination rules out increased intracranial pressure.4,7
CHIEF CONCERNS ABOUT LUMBAR PUNCTURE
Lumbar puncture is generally well tolerated. Major complications are rare2 and can be prevented by checking for contraindications and by using appropriate procedural hygiene and technique. Complications include pain at the puncture site, postprocedural headache, epidural hematoma, meningitis, osteomyelitis or discitis, bleeding, epidermoid tumor, and, most worrisome, brain herniation.
Brain herniation
Concern about causing brain herniation is the reason imaging may be ordered before lumbar puncture. Cerebral edema and increased intracranial pressure are common in patients with bacterial meningitis, as well as in other conditions such as bleeding, tumor, and abscess.1 If intracranial pressure is elevated, lumbar puncture can cause cerebral herniation with further neurologic compromise and possibly death. Herniation is believed to be due to a sudden decrease in pressure in the spinal cord caused by removal of cerebrospinal fluid. However, the only information we have about this complication comes from case reports and case series, so we don’t really know how often it happens.
On the other hand, ordering ancillary tests before lumbar puncture and starting empiric antibiotics in patients with suspected bacterial meningitis may delay treatment and lead to worse clinical outcomes and thus should be discouraged.8
Also important to note is the lack of good data regarding the safety of lumbar puncture in patients with potential hemostatic problems (thrombocytopenia, coagulopathy). The recommendation not to do lumbar puncture in these situations (Table 1) is taken from neuraxial anesthesia guidelines.9 Further, a small retrospective study of thrombocytopenic oncology patients requiring lumbar puncture did not demonstrate an increased risk of complications.10
ADDITIONAL CONSIDERATIONS
In a retrospective study in 2015, Glimåker et al6 demonstrated that lumbar puncture without prior brain CT was safe in patients with suspected acute bacterial meningitis with moderate to severe impairment of mental status, and that it led to a shorter “door-to-antibiotic time.” Lumbar puncture before imaging was also associated with a concomitant decrease in the risk of death, with no increase in the rate of complications.6
If brain imaging is to be done before lumbar puncture, then blood cultures (and cultures of other fluids, whenever appropriate) should be collected and the patient should be started on empiric management for central nervous system infection first. CT evidence of diffuse cerebral edema, focal lesions with mass effect, and ventriculomegaly should be viewed as further contraindications to lumbar puncture.1
Antibiotic therapy
When contraindications to lumbar puncture exist, the choice of antibiotic and the duration of therapy should be based on the patient’s history, demographics, risk factors, and microbiologic data from blood culture, urine culture, sputum culture, and detection of microbiological antigens.1 The choice of antibiotic is beyond the scope of this article. However, empiric antibiotic therapy with a third-generation cephalosporin (eg, ceftriaxone) and vancomycin and anti-inflammatory therapy (dexamethasone) should in most cases be started immediately after collecting samples for blood culture and must not be delayed by neuroimaging and lumbar puncture with cerebrospinal fluid sampling, given the high rates of mortality and morbidity if treatment is delayed.5,8
Consultation with the neurosurgery service regarding alternative brain ventricular fluid sampling should be considered.11
- Thigpen MC, Whitney CG, Messonnier NE, et al; Emerging Infections Programs Network. Bacterial meningitis in the United States, 1998–2007. N Engl J Med 2011; 364:2016–2025.
- Ellenby MS, Tegtmeyer K, Lai S, Braner DA. Videos in clinical medicine. Lumbar puncture. N Engl J Med 2006; 355: e12.
- Gopal AK, Whitehouse JD, Simel DL, Corey GR. Cranial computed tomography before lumbar puncture: a prospective clinical evaluation. Arch Intern Med 1999; 159:2681–2685.
- Hasbun R, Abrahams J, Jekel J, Quagliarello VJ. Computed tomography of the head before lumbar puncture in adults with suspected meningitis. N Engl J Med 2001; 345:1727–1733.
- Tunkel AR, Hartman BJ, Kaplan SL, et al. Practice guidelines for the management of bacterial meningitis. Clin Infect Dis 2004; 39:1267–1284.
- Glimåker M, Johansson B, Grindborg Ö, Bottai M, Lindquist L, Sjölin J. Adult bacterial meningitis: earlier treatment and improved outcome following guideline revision promoting prompt lumbar puncture. Clin Infect Dis 2015; 60:1162–1169.
- Baraff LJ, Byyny RL, Probst MA, Salamon N, Linetsky M, Mower WR. Prevalence of herniation and intracranial shift on cranial tomography in patients with subarachnoid hemorrhage and a normal neurologic examination. Acad Emerg Med 2010; 17:423–428.
- Proulx N, Fréchette D, Toye B, Chan J, Kravcik S. Delays in the administration of antibiotics are associated with mortality from adult acute bacterial meningitis. QJM 2005; 98:291–298.
- Horlocker TT, Wedel DJ, Rowlingson JC, et al. Regional anesthesia in the patient receiving antithrombotic or thrombolytic therapy: American Society of Regional Anesthesia and Pain Medicine Evidence-Based Guidelines (Third Edition). Reg Anesth Pain Med 2010; 35:64–101.
- Ning S, Kerbel B, Callum J, Lin Y. Safety of lumbar punctures in patients with thrombocytopenia. Vox Sang 2016; 110:393–400.
- Joffe AR. Lumbar puncture and brain herniation in acute bacterial meningitis: a review. J Intensive Care Med 2007; 22:194–207.
Brain imaging should precede lumbar puncture in patients with focal neurologic deficits or immunodeficiency, or with altered mental status or seizures during the previous week. However, lumbar puncture can be safely done in most patients without first obtaining brain imaging. Empiric antibiotic and corticosteroid therapy must not be delayed; they should be started immediately after the lumber puncture is done, without waiting for the results. If the lumbar puncture is going to be delayed, these treatments should be started immediately after obtaining blood samples for culture.
A MEDICAL EMERGENCY
Bacterial meningitis is a medical emergency and requires prompt recognition and treatment. It is associated with a nearly 15% death rate as well as neurologic effects such as deafness, seizures, and cognitive decline in about the same percentage of patients.1 Microbiologic information from lumbar puncture and cerebrospinal fluid analysis is an essential part of the initial workup, whenever possible. Lumbar puncture can be done safely at the bedside in most patients and so should not be delayed unless certain contraindications exist, as discussed below.2
INDICATIONS FOR BRAIN IMAGING BEFORE LUMBAR PUNCTURE
Table 1 lists common indications for brain imaging before lumbar puncture. However, there is a lack of good evidence to support them.
Current guidelines on acute bacterial meningitis from the Infectious Diseases Society of America recommend computed tomography (CT) of the brain before lumbar puncture in patients presenting with:
- Altered mental status
- A new focal neurologic deficit (eg, cranial nerve palsy, extremity weakness or drift, dysarthria, aphasia)
- Papilledema
- Seizure within the past week
- History of central nervous system disease (eg, stroke, tumor)
- Age 60 or older (likely because of the association with previous central nervous system disease)
- Immunocompromised state (due to human immunodeficiency virus infection, chemotherapy, or immunosuppressive drugs for transplant or rheumatologic disease)
- A high clinical suspicion for subarachnoid hemorrhage.3–5
However, a normal result on head CT does not rule out the possibility of increased intracranial pressure and the risk of brain herniation. Actually, patients with acute bacterial meningitis are inherently at higher risk of spontaneous brain herniation even without lumbar puncture, and some cases of brain herniation after lumbar puncture could have represented the natural course of disease. Importantly, lumbar puncture may not be independently associated with the risk of brain herniation in patients with altered mental status (Glasgow Coma Scale score ≤ 8).6 A prospective randomized study is needed to better understand when to order brain imaging before lumbar puncture and when it is safe to proceed directly to lumbar puncture.
CONTRAINDICATIONS TO LUMBAR PUNCTURE
General contraindications to lumbar puncture are listed in Table 2.
Gopal et al3 analyzed clinical and radiographic data for 113 adults requiring urgent lumbar puncture and reported that altered mental status (likelihood ratio [LR] 2.2), focal neurologic deficit (LR 4.3), papilledema (LR 11.1), and clinical impression (LR 18.8) were associated with abnormalities on CT.
Hasbun et al4 prospectively analyzed whether clinical variables correlated with abnormal results of head CT that would preclude lumbar puncture in 301 patients requiring urgent lumbar puncture. They found that age 60 and older, immunodeficiency, a history of central nervous system disease, recent seizure (within 1 week), and neurologic deficits were associated with abnormal findings on head CT (eg, lesion with mass effect, midline shift). Importantly, absence of these characteristics had a 97% negative predictive value for abnormal findings on head CT. However, neither a normal head CT nor a normal clinical neurologic examination rules out increased intracranial pressure.4,7
CHIEF CONCERNS ABOUT LUMBAR PUNCTURE
Lumbar puncture is generally well tolerated. Major complications are rare2 and can be prevented by checking for contraindications and by using appropriate procedural hygiene and technique. Complications include pain at the puncture site, postprocedural headache, epidural hematoma, meningitis, osteomyelitis or discitis, bleeding, epidermoid tumor, and, most worrisome, brain herniation.
Brain herniation
Concern about causing brain herniation is the reason imaging may be ordered before lumbar puncture. Cerebral edema and increased intracranial pressure are common in patients with bacterial meningitis, as well as in other conditions such as bleeding, tumor, and abscess.1 If intracranial pressure is elevated, lumbar puncture can cause cerebral herniation with further neurologic compromise and possibly death. Herniation is believed to be due to a sudden decrease in pressure in the spinal cord caused by removal of cerebrospinal fluid. However, the only information we have about this complication comes from case reports and case series, so we don’t really know how often it happens.
On the other hand, ordering ancillary tests before lumbar puncture and starting empiric antibiotics in patients with suspected bacterial meningitis may delay treatment and lead to worse clinical outcomes and thus should be discouraged.8
Also important to note is the lack of good data regarding the safety of lumbar puncture in patients with potential hemostatic problems (thrombocytopenia, coagulopathy). The recommendation not to do lumbar puncture in these situations (Table 1) is taken from neuraxial anesthesia guidelines.9 Further, a small retrospective study of thrombocytopenic oncology patients requiring lumbar puncture did not demonstrate an increased risk of complications.10
ADDITIONAL CONSIDERATIONS
In a retrospective study in 2015, Glimåker et al6 demonstrated that lumbar puncture without prior brain CT was safe in patients with suspected acute bacterial meningitis with moderate to severe impairment of mental status, and that it led to a shorter “door-to-antibiotic time.” Lumbar puncture before imaging was also associated with a concomitant decrease in the risk of death, with no increase in the rate of complications.6
If brain imaging is to be done before lumbar puncture, then blood cultures (and cultures of other fluids, whenever appropriate) should be collected and the patient should be started on empiric management for central nervous system infection first. CT evidence of diffuse cerebral edema, focal lesions with mass effect, and ventriculomegaly should be viewed as further contraindications to lumbar puncture.1
Antibiotic therapy
When contraindications to lumbar puncture exist, the choice of antibiotic and the duration of therapy should be based on the patient’s history, demographics, risk factors, and microbiologic data from blood culture, urine culture, sputum culture, and detection of microbiological antigens.1 The choice of antibiotic is beyond the scope of this article. However, empiric antibiotic therapy with a third-generation cephalosporin (eg, ceftriaxone) and vancomycin and anti-inflammatory therapy (dexamethasone) should in most cases be started immediately after collecting samples for blood culture and must not be delayed by neuroimaging and lumbar puncture with cerebrospinal fluid sampling, given the high rates of mortality and morbidity if treatment is delayed.5,8
Consultation with the neurosurgery service regarding alternative brain ventricular fluid sampling should be considered.11
Brain imaging should precede lumbar puncture in patients with focal neurologic deficits or immunodeficiency, or with altered mental status or seizures during the previous week. However, lumbar puncture can be safely done in most patients without first obtaining brain imaging. Empiric antibiotic and corticosteroid therapy must not be delayed; they should be started immediately after the lumber puncture is done, without waiting for the results. If the lumbar puncture is going to be delayed, these treatments should be started immediately after obtaining blood samples for culture.
A MEDICAL EMERGENCY
Bacterial meningitis is a medical emergency and requires prompt recognition and treatment. It is associated with a nearly 15% death rate as well as neurologic effects such as deafness, seizures, and cognitive decline in about the same percentage of patients.1 Microbiologic information from lumbar puncture and cerebrospinal fluid analysis is an essential part of the initial workup, whenever possible. Lumbar puncture can be done safely at the bedside in most patients and so should not be delayed unless certain contraindications exist, as discussed below.2
INDICATIONS FOR BRAIN IMAGING BEFORE LUMBAR PUNCTURE
Table 1 lists common indications for brain imaging before lumbar puncture. However, there is a lack of good evidence to support them.
Current guidelines on acute bacterial meningitis from the Infectious Diseases Society of America recommend computed tomography (CT) of the brain before lumbar puncture in patients presenting with:
- Altered mental status
- A new focal neurologic deficit (eg, cranial nerve palsy, extremity weakness or drift, dysarthria, aphasia)
- Papilledema
- Seizure within the past week
- History of central nervous system disease (eg, stroke, tumor)
- Age 60 or older (likely because of the association with previous central nervous system disease)
- Immunocompromised state (due to human immunodeficiency virus infection, chemotherapy, or immunosuppressive drugs for transplant or rheumatologic disease)
- A high clinical suspicion for subarachnoid hemorrhage.3–5
However, a normal result on head CT does not rule out the possibility of increased intracranial pressure and the risk of brain herniation. Actually, patients with acute bacterial meningitis are inherently at higher risk of spontaneous brain herniation even without lumbar puncture, and some cases of brain herniation after lumbar puncture could have represented the natural course of disease. Importantly, lumbar puncture may not be independently associated with the risk of brain herniation in patients with altered mental status (Glasgow Coma Scale score ≤ 8).6 A prospective randomized study is needed to better understand when to order brain imaging before lumbar puncture and when it is safe to proceed directly to lumbar puncture.
CONTRAINDICATIONS TO LUMBAR PUNCTURE
General contraindications to lumbar puncture are listed in Table 2.
Gopal et al3 analyzed clinical and radiographic data for 113 adults requiring urgent lumbar puncture and reported that altered mental status (likelihood ratio [LR] 2.2), focal neurologic deficit (LR 4.3), papilledema (LR 11.1), and clinical impression (LR 18.8) were associated with abnormalities on CT.
Hasbun et al4 prospectively analyzed whether clinical variables correlated with abnormal results of head CT that would preclude lumbar puncture in 301 patients requiring urgent lumbar puncture. They found that age 60 and older, immunodeficiency, a history of central nervous system disease, recent seizure (within 1 week), and neurologic deficits were associated with abnormal findings on head CT (eg, lesion with mass effect, midline shift). Importantly, absence of these characteristics had a 97% negative predictive value for abnormal findings on head CT. However, neither a normal head CT nor a normal clinical neurologic examination rules out increased intracranial pressure.4,7
CHIEF CONCERNS ABOUT LUMBAR PUNCTURE
Lumbar puncture is generally well tolerated. Major complications are rare2 and can be prevented by checking for contraindications and by using appropriate procedural hygiene and technique. Complications include pain at the puncture site, postprocedural headache, epidural hematoma, meningitis, osteomyelitis or discitis, bleeding, epidermoid tumor, and, most worrisome, brain herniation.
Brain herniation
Concern about causing brain herniation is the reason imaging may be ordered before lumbar puncture. Cerebral edema and increased intracranial pressure are common in patients with bacterial meningitis, as well as in other conditions such as bleeding, tumor, and abscess.1 If intracranial pressure is elevated, lumbar puncture can cause cerebral herniation with further neurologic compromise and possibly death. Herniation is believed to be due to a sudden decrease in pressure in the spinal cord caused by removal of cerebrospinal fluid. However, the only information we have about this complication comes from case reports and case series, so we don’t really know how often it happens.
On the other hand, ordering ancillary tests before lumbar puncture and starting empiric antibiotics in patients with suspected bacterial meningitis may delay treatment and lead to worse clinical outcomes and thus should be discouraged.8
Also important to note is the lack of good data regarding the safety of lumbar puncture in patients with potential hemostatic problems (thrombocytopenia, coagulopathy). The recommendation not to do lumbar puncture in these situations (Table 1) is taken from neuraxial anesthesia guidelines.9 Further, a small retrospective study of thrombocytopenic oncology patients requiring lumbar puncture did not demonstrate an increased risk of complications.10
ADDITIONAL CONSIDERATIONS
In a retrospective study in 2015, Glimåker et al6 demonstrated that lumbar puncture without prior brain CT was safe in patients with suspected acute bacterial meningitis with moderate to severe impairment of mental status, and that it led to a shorter “door-to-antibiotic time.” Lumbar puncture before imaging was also associated with a concomitant decrease in the risk of death, with no increase in the rate of complications.6
If brain imaging is to be done before lumbar puncture, then blood cultures (and cultures of other fluids, whenever appropriate) should be collected and the patient should be started on empiric management for central nervous system infection first. CT evidence of diffuse cerebral edema, focal lesions with mass effect, and ventriculomegaly should be viewed as further contraindications to lumbar puncture.1
Antibiotic therapy
When contraindications to lumbar puncture exist, the choice of antibiotic and the duration of therapy should be based on the patient’s history, demographics, risk factors, and microbiologic data from blood culture, urine culture, sputum culture, and detection of microbiological antigens.1 The choice of antibiotic is beyond the scope of this article. However, empiric antibiotic therapy with a third-generation cephalosporin (eg, ceftriaxone) and vancomycin and anti-inflammatory therapy (dexamethasone) should in most cases be started immediately after collecting samples for blood culture and must not be delayed by neuroimaging and lumbar puncture with cerebrospinal fluid sampling, given the high rates of mortality and morbidity if treatment is delayed.5,8
Consultation with the neurosurgery service regarding alternative brain ventricular fluid sampling should be considered.11
- Thigpen MC, Whitney CG, Messonnier NE, et al; Emerging Infections Programs Network. Bacterial meningitis in the United States, 1998–2007. N Engl J Med 2011; 364:2016–2025.
- Ellenby MS, Tegtmeyer K, Lai S, Braner DA. Videos in clinical medicine. Lumbar puncture. N Engl J Med 2006; 355: e12.
- Gopal AK, Whitehouse JD, Simel DL, Corey GR. Cranial computed tomography before lumbar puncture: a prospective clinical evaluation. Arch Intern Med 1999; 159:2681–2685.
- Hasbun R, Abrahams J, Jekel J, Quagliarello VJ. Computed tomography of the head before lumbar puncture in adults with suspected meningitis. N Engl J Med 2001; 345:1727–1733.
- Tunkel AR, Hartman BJ, Kaplan SL, et al. Practice guidelines for the management of bacterial meningitis. Clin Infect Dis 2004; 39:1267–1284.
- Glimåker M, Johansson B, Grindborg Ö, Bottai M, Lindquist L, Sjölin J. Adult bacterial meningitis: earlier treatment and improved outcome following guideline revision promoting prompt lumbar puncture. Clin Infect Dis 2015; 60:1162–1169.
- Baraff LJ, Byyny RL, Probst MA, Salamon N, Linetsky M, Mower WR. Prevalence of herniation and intracranial shift on cranial tomography in patients with subarachnoid hemorrhage and a normal neurologic examination. Acad Emerg Med 2010; 17:423–428.
- Proulx N, Fréchette D, Toye B, Chan J, Kravcik S. Delays in the administration of antibiotics are associated with mortality from adult acute bacterial meningitis. QJM 2005; 98:291–298.
- Horlocker TT, Wedel DJ, Rowlingson JC, et al. Regional anesthesia in the patient receiving antithrombotic or thrombolytic therapy: American Society of Regional Anesthesia and Pain Medicine Evidence-Based Guidelines (Third Edition). Reg Anesth Pain Med 2010; 35:64–101.
- Ning S, Kerbel B, Callum J, Lin Y. Safety of lumbar punctures in patients with thrombocytopenia. Vox Sang 2016; 110:393–400.
- Joffe AR. Lumbar puncture and brain herniation in acute bacterial meningitis: a review. J Intensive Care Med 2007; 22:194–207.
- Thigpen MC, Whitney CG, Messonnier NE, et al; Emerging Infections Programs Network. Bacterial meningitis in the United States, 1998–2007. N Engl J Med 2011; 364:2016–2025.
- Ellenby MS, Tegtmeyer K, Lai S, Braner DA. Videos in clinical medicine. Lumbar puncture. N Engl J Med 2006; 355: e12.
- Gopal AK, Whitehouse JD, Simel DL, Corey GR. Cranial computed tomography before lumbar puncture: a prospective clinical evaluation. Arch Intern Med 1999; 159:2681–2685.
- Hasbun R, Abrahams J, Jekel J, Quagliarello VJ. Computed tomography of the head before lumbar puncture in adults with suspected meningitis. N Engl J Med 2001; 345:1727–1733.
- Tunkel AR, Hartman BJ, Kaplan SL, et al. Practice guidelines for the management of bacterial meningitis. Clin Infect Dis 2004; 39:1267–1284.
- Glimåker M, Johansson B, Grindborg Ö, Bottai M, Lindquist L, Sjölin J. Adult bacterial meningitis: earlier treatment and improved outcome following guideline revision promoting prompt lumbar puncture. Clin Infect Dis 2015; 60:1162–1169.
- Baraff LJ, Byyny RL, Probst MA, Salamon N, Linetsky M, Mower WR. Prevalence of herniation and intracranial shift on cranial tomography in patients with subarachnoid hemorrhage and a normal neurologic examination. Acad Emerg Med 2010; 17:423–428.
- Proulx N, Fréchette D, Toye B, Chan J, Kravcik S. Delays in the administration of antibiotics are associated with mortality from adult acute bacterial meningitis. QJM 2005; 98:291–298.
- Horlocker TT, Wedel DJ, Rowlingson JC, et al. Regional anesthesia in the patient receiving antithrombotic or thrombolytic therapy: American Society of Regional Anesthesia and Pain Medicine Evidence-Based Guidelines (Third Edition). Reg Anesth Pain Med 2010; 35:64–101.
- Ning S, Kerbel B, Callum J, Lin Y. Safety of lumbar punctures in patients with thrombocytopenia. Vox Sang 2016; 110:393–400.
- Joffe AR. Lumbar puncture and brain herniation in acute bacterial meningitis: a review. J Intensive Care Med 2007; 22:194–207.
Severely frail elderly patients do not need lipid-lowering drugs
Frail elderly patients are at high risk of adverse clinical outcomes, including those due to polypharmacy. Several groups tackle “deprescribing” by developing lists of medications that are potentially inappropriate for the elderly, such as the Beers or STOPP/START criteria.1–4
See related editorialIn contrast, our group (the Palliative and Therapeutic Harmonization [PATH] program and the Dalhousie Academic Detailing Service) has developed evidence-based, frailty-specific guidelines for treating hypertension5 and diabetes,6 in which we advocate less-stringent treatment targets and tapering or discontinuing medications, as needed.
The PATH program7 is a clinical approach that prioritizes the consideration of frailty when making treatment decisions. The Dalhousie Academic Detailing Service collaborates with the Nova Scotia Health Authority to research and develop evidence-informed educational messages about the treatment of common medical conditions.
Here, we address lipid-lowering therapy in this population.
CONSIDERING FRAILTY
Frailty is defined in several ways. The Fried model8,9 identifies frailty when 3 of the following characteristics are present: unintentional weight loss, exhaustion, muscle weakness, slow walking speed, or low levels of activity. The Clinical Frailty Scale10,11 and the Frailty Assessment for Care-planning Tool (FACT)5 use deficits in cognition, function, and mobility to define frailty. According to these scales, people are considered severely frail when they require assistance with basic activities of daily living (such as bathing or dressing), owing to cognitive or physical deficits from any cause.
In reviewing the evidence, we consider five questions:
- What is the quality of the evidence? (Up to 48% of clinical practice guideline recommendations may be based on low-level evidence or expert opinion.12)
- How did the study population compare with the frail?
- Are study outcomes and potential benefits clinically relevant to those who are frail?
- How long did it take for the clinical benefit of a treatment to become apparent, and are the frail elderly likely to live that long?
- Have the harms of treatment been sufficiently considered?
WHAT IS THE QUALITY OF THE EVIDENCE?
We found no studies that specifically evaluated the benefit of lipid-lowering for severely frail older adults. Therefore, we examined randomized controlled trials that enrolled non-frail older adults,13–28 subgroup analyses of randomized controlled trials,29,30 meta-analyses that analyzed subgroups of elderly populations,31,32 and publications describing the study designs of randomized controlled trials.33–37
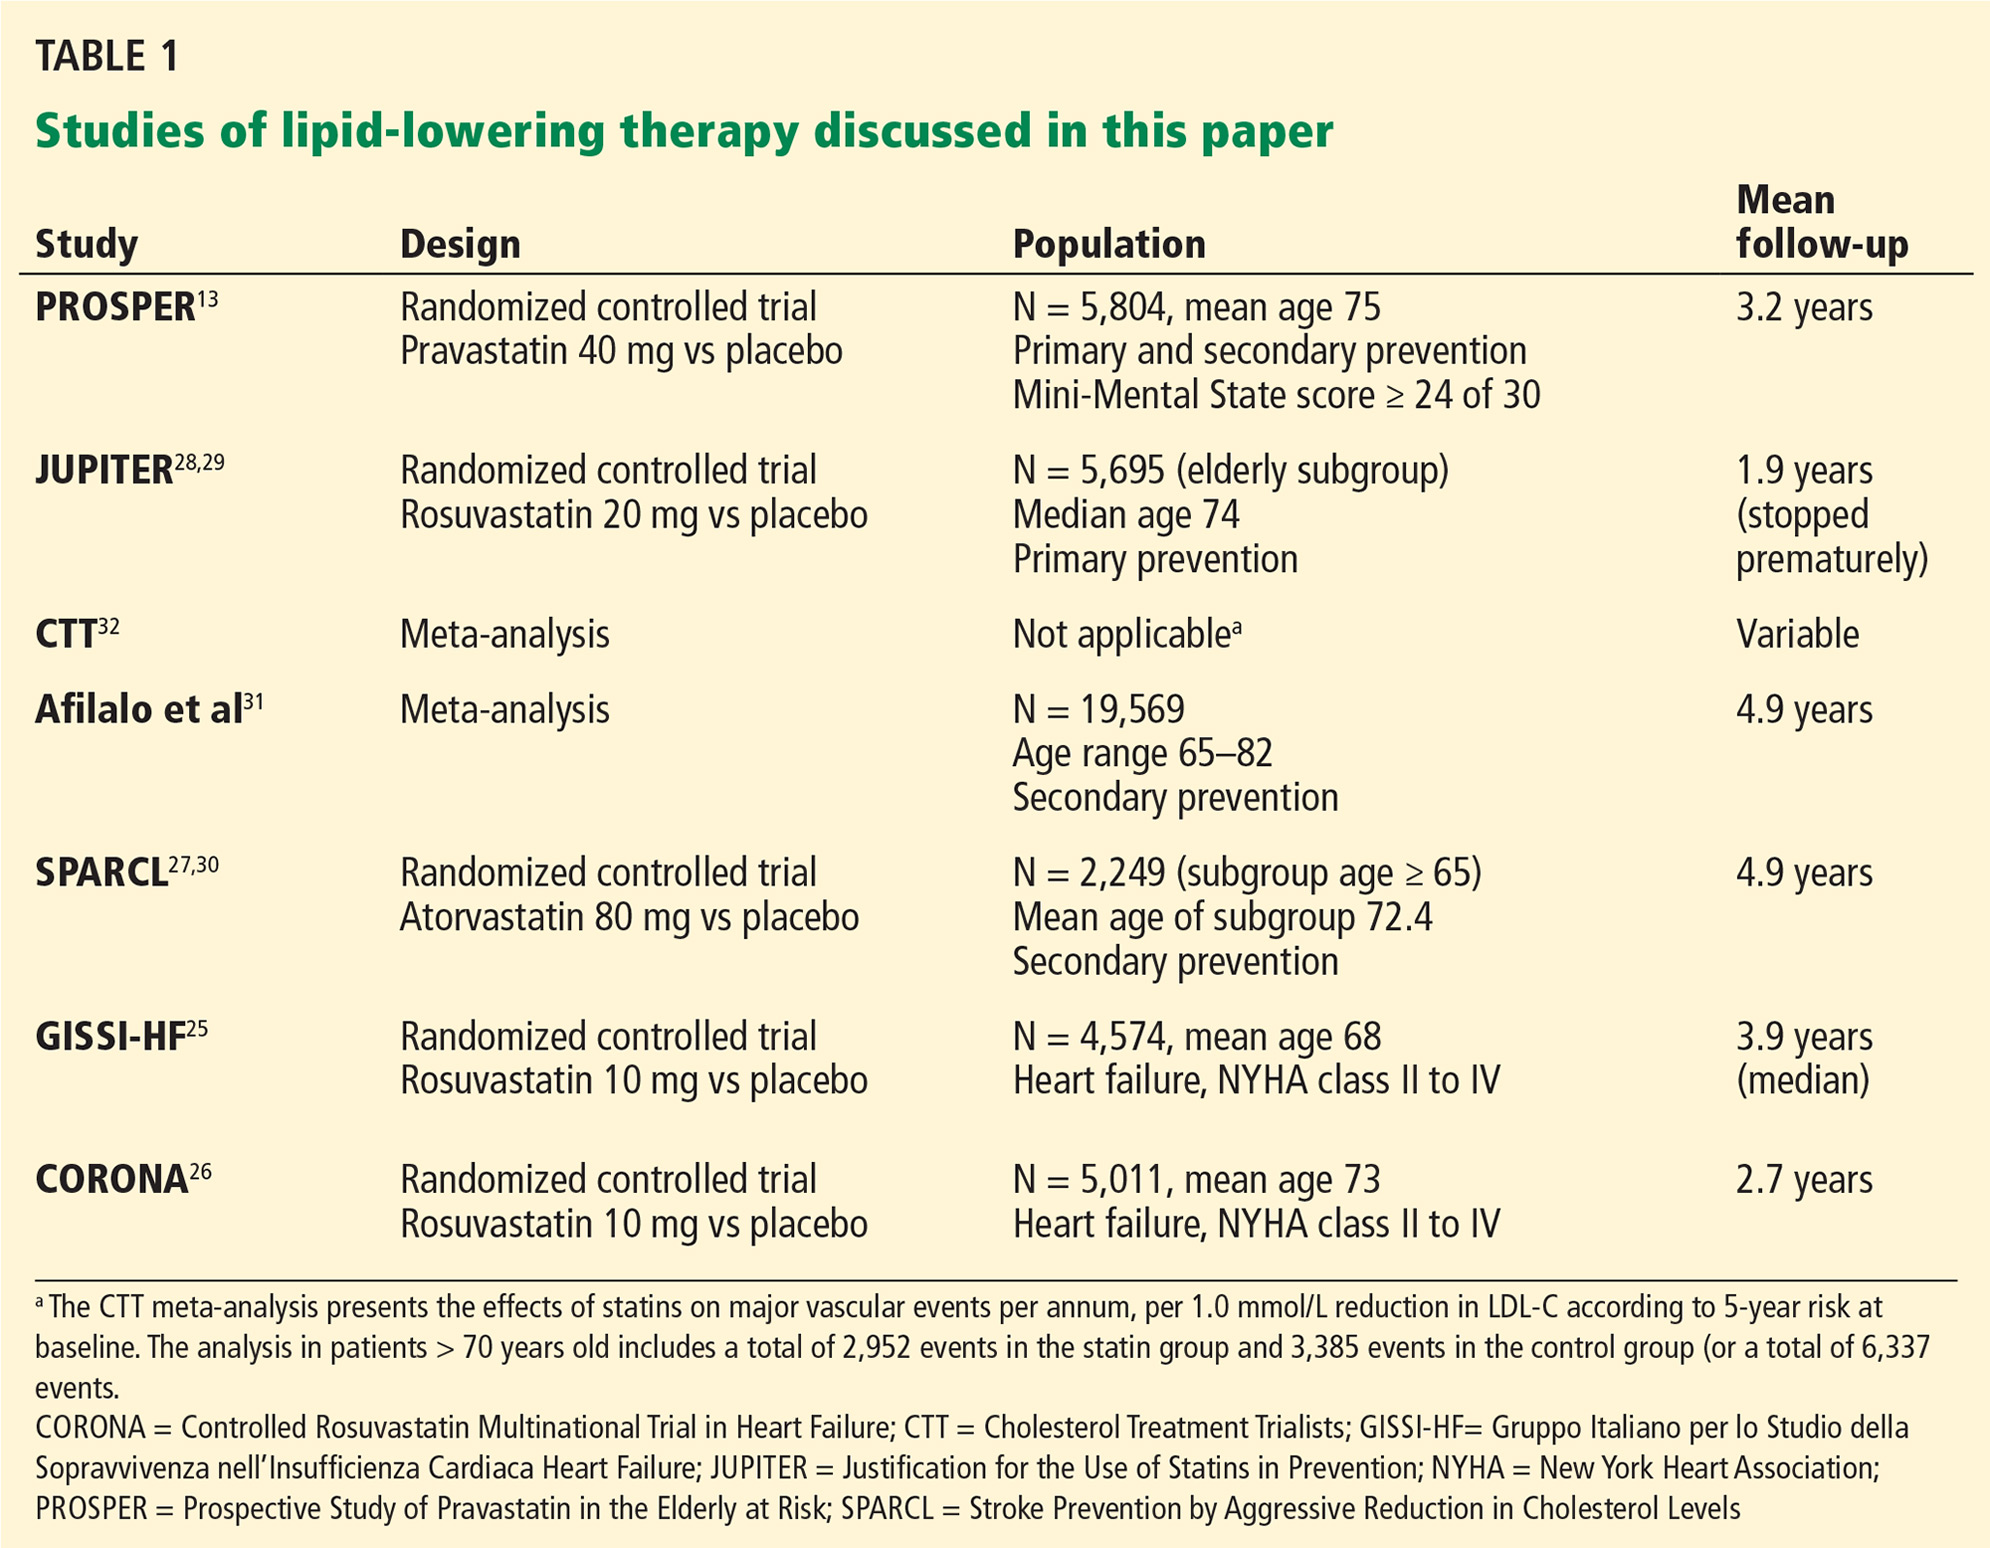
Most of the evidence comes from post hoc subgroup analyses of elderly populations. Although meta-analysis is commonly used to compare subgroups, the Cochrane handbook and others consider subgroup comparisons observational by nature.38,39 (See Table 1 for lipid-lowering studies discussed in this article.)
Studies of statins for primary prevention of cardiovascular disease
For evidence of benefit from lipid-lowering for primary prevention (ie, to reduce the risk of cardiovascular events in patients with no known cardiovascular disease at baseline but at increased risk), we reviewed the meta-analysis conducted by the Cholesterol Treatment Trialists’ (CTT) Collaborators.32 Since this meta-analysis included the major trials that enrolled elderly patients, individual publications of post hoc, elderly subgroups were, for the most part, not examined individually. The exception to this approach was a decision to report on the PROSPER13 and JUPITER28 trials separately, because PROSPER is the most representative of the elderly population and JUPITER reached the lowest LDL-C of primary prevention trials published to date and included a large elderly subgroup (n = 5,695).
Savarese et al40 evaluated the benefits of statins for older adults who did not have established cardiovascular disease. We did not report on this meta-analysis, as not all of the subjects that populated the meta-analysis were representative of a typical prevention population. For instance, in the Anglo-Scandinavian Cardiac Outcomes Trial lipid-lowering arm,41 14% of the subjects had had a previous stroke or transient ischemic attack. In the Antihypertensive and Lipid-Lowering Treatment Trial,42 16% of the population had a family history of premature coronary heart disease.
In addition, all the trials in the Savarese meta-analysis were also included in the CTT meta-analysis.32 The CTT reports on baseline risk using patient-level data stratified by age and risk, which may be more relevant to the question of primary prevention for older adults, as highlighted in our review.
PROSPER (Prospective Study of Pravastatin in the Elderly at Risk),13 a well-conducted, double-blind, randomized controlled trial with low probability of bias, compared pravastatin 40 mg and placebo. It was the only study that specifically enrolled older adults, with prespecified analysis of primary and secondary prevention subgroups. The primary prevention subgroup accounted for 56% of the 5,084 participants.
JUPITER (Justification for the Use of Statins in Prevention)28 compared rosuvastatin 20 mg and placebo in 17,802 participants. All had low-density lipoprotein cholesterol (LDL-C) levels below 3.4 mmol/L (130 mg/dL) and elevated levels of the inflammatory biomarker high-sensitivity C-reactive protein (hsCRP), ie, 2 mg/L or higher. Subsequently, Glynn et al performed a post hoc, exploratory subgroup analysis of elderly participants (N = 5,695).29
The JUPITER trial had several limitations.43,44 The planned follow-up period was 5 years, but the trial was stopped early at 1.9 years, after a statistically significant difference was detected in the primary composite outcome of reduction in all vascular events. Studies that are stopped early may exaggerate positive findings.45
Further, JUPITER’s patients were a select group, with normal LDL-C levels, elevated hsCRP values, and without diabetes. Of 90,000 patients screened, 72,000 (80%) did not meet the inclusion criteria and were not enrolled. This high rate of exclusion limits the generalizability of study findings beyond the shortcomings of post hoc subgroup analysis.
The meta-analysis performed by the CTT Collaborators32 used individual participant data from large-scale randomized trials of lipid-modifying treatment. This analysis was specific to people at low risk of vascular disease. In a supplementary appendix, the authors described the reduction in major vascular events for each 1.0 mmol/L decrease in LDL-C in three age categories: under age 60, ages 61 to 70, and over age 70.
The authors also stratified the results by risk category and provided information about those with a risk of major vascular events of less than 20%, which would be more representative of a purer primary prevention population.
For the elderly subgroup at low risk, the CTT Collaborators32 only reported a composite of major vascular events (coronary death, nonfatal myocardial infarction [MI], ischemic stroke, or revascularization) and did not describe individual outcomes, such as prevention of coronary heart disease.
Study results are based on postrandomization findings and therefore may be observational, not experimental.46
Studies of statins for secondary prevention of cardiovascular disease
The aim of secondary prevention is to reduce the risk of recurrent cardiovascular events in patients who already have cardiovascular disease.
To address the question of whether statins reduce cardiovascular risk, we reviewed:
PROSPER,13 which included a preplanned analysis of the secondary prevention population.
Afilalo et al,31,47 who performed a meta-analysis of the elderly subgroups of nine major secondary prevention studies (19,569 patients) using published and unpublished data.
To address the question of whether statins benefit individuals with heart failure, we found two relevant studies:
GISSI-HF (Gruppo Italiano per lo Studio della Sopravvivenza nell’Insufficienza Cardiaca Heart Failure)25 and CORONA (Controlled Rosuvastatin Multinational Trial in Heart Failure),26 which were large, international, well-conducted randomized controlled trials that examined statin use in heart failure.
To answer the question of whether statins benefit individuals after a stroke or transient ischemic attack, we found one relevant study:
SPARCL (Stroke Prevention by Aggressive Reduction in Cholesterol Levels),27 which evaluated the benefit of statins in older adults with a history of stroke or transient ischemic attack. It was a prospective, double-blind, placebo-controlled, international trial conducted at 205 centers. One to 6 months after their cerebrovascular event, patients were randomized to receive either atorvastatin 80 mg or placebo. Given the young age of patients in this trial (mean age 63), we also reviewed a post hoc subgroup analysis of the elderly patients in SPARCL (age > 65).30
HOW DID THE STUDY POPULATION COMPARE WITH THOSE WHO ARE FRAIL?
Frail older adults are almost always excluded from large-scale clinical trials,48 leading to uncertainty about whether the conclusions can be applied to those with advanced frailty.
Although age is an imperfect proxy measure of frailty,49 we consider the age of the study population as well as their comorbidities.
Participants in the studies we reviewed were generally younger and healthier than those who are frail, with mean ages of about 75 or less (Table 1).
PROSPER was the most representative study, as it specifically enrolled older adults, albeit without frailty,13 and excluded people with poor cognitive function as defined by a Mini Mental State Examination score less than 24.
JUPITER enrolled a select population, as described above. The median age in the elderly subgroup was 74 (interquartile range 72–78).29
The Afilalo et al31 meta-analysis primarily included studies of young-elderly patients, with a mean age of less than 70. PROSPER13 was an exception.
The GISSI-HF study,25 which examined the benefit of statins in heart failure, described their study population as frail, although the mean age was only 68. Compared with those in GISSI-HF, the CORONA patients26 with heart failure were older (mean age 73) and had more severe heart failure. Accordingly, it is possible that many of the CORONA participants were frail.
ARE STUDY OUTCOMES CLINICALLY RELEVANT TO THOSE WHO ARE FRAIL?
Because baseline cardiovascular risk increases with age, the elderly should, in theory, experience greater absolute benefit from lipid-lowering. However, there is uncertainty about whether this is true in practice.
Some, but not all, epidemiologic studies show a weaker relationship between cholesterol levels and cardiovascular morbidity and mortality rates in older compared to younger adults.50,51 This may be because those with high cholesterol levels die before they get old (time-related bias), or because those with life-threatening illness may have lower cholesterol levels.50 In addition, classic risk factors such as age, sex, systolic blood pressure, cholesterol values, diabetes, smoking, and left ventricular hypertrophy on electrocardiography may have less power to predict cardiovascular risk among older patients.52
The goal of treatment in frailty is to prevent further disability or improve quality of life. Therefore, meaningful outcomes for lipid-lowering therapy should include symptomatic nonfatal MI and its associated morbidity (eg, heart failure and persistent angina) or symptomatic nonfatal stroke leading to disability. Outcomes without sustained clinical impact, such as transient ischemic attack, nondisabling stroke, or silent MI, while potentially important in other populations, are less relevant in severe frailty. Notably, in many statin studies, outcomes include asymptomatic heart disease (eg, silent MI and “suspected events”) and nondisabling stroke (eg, mild stroke, transient ischemic attack). When symptomatic outcomes are not reported separately, the impact of the reported benefit on quality of life and function is uncertain.
The outcome of all-cause mortality is generally recognized as a gold standard for determining treatment benefit. However, since advanced frailty is characterized by multiple competing causes for mortality, a reduction in all-cause mortality that is achieved by addressing a single issue in nonfrail populations may not extend to the frail.
To more fully understand the impact of lipid-lowering therapy on quality of life and function, we examined the following questions:
Do statins as primary prevention reduce symptomatic heart disease?
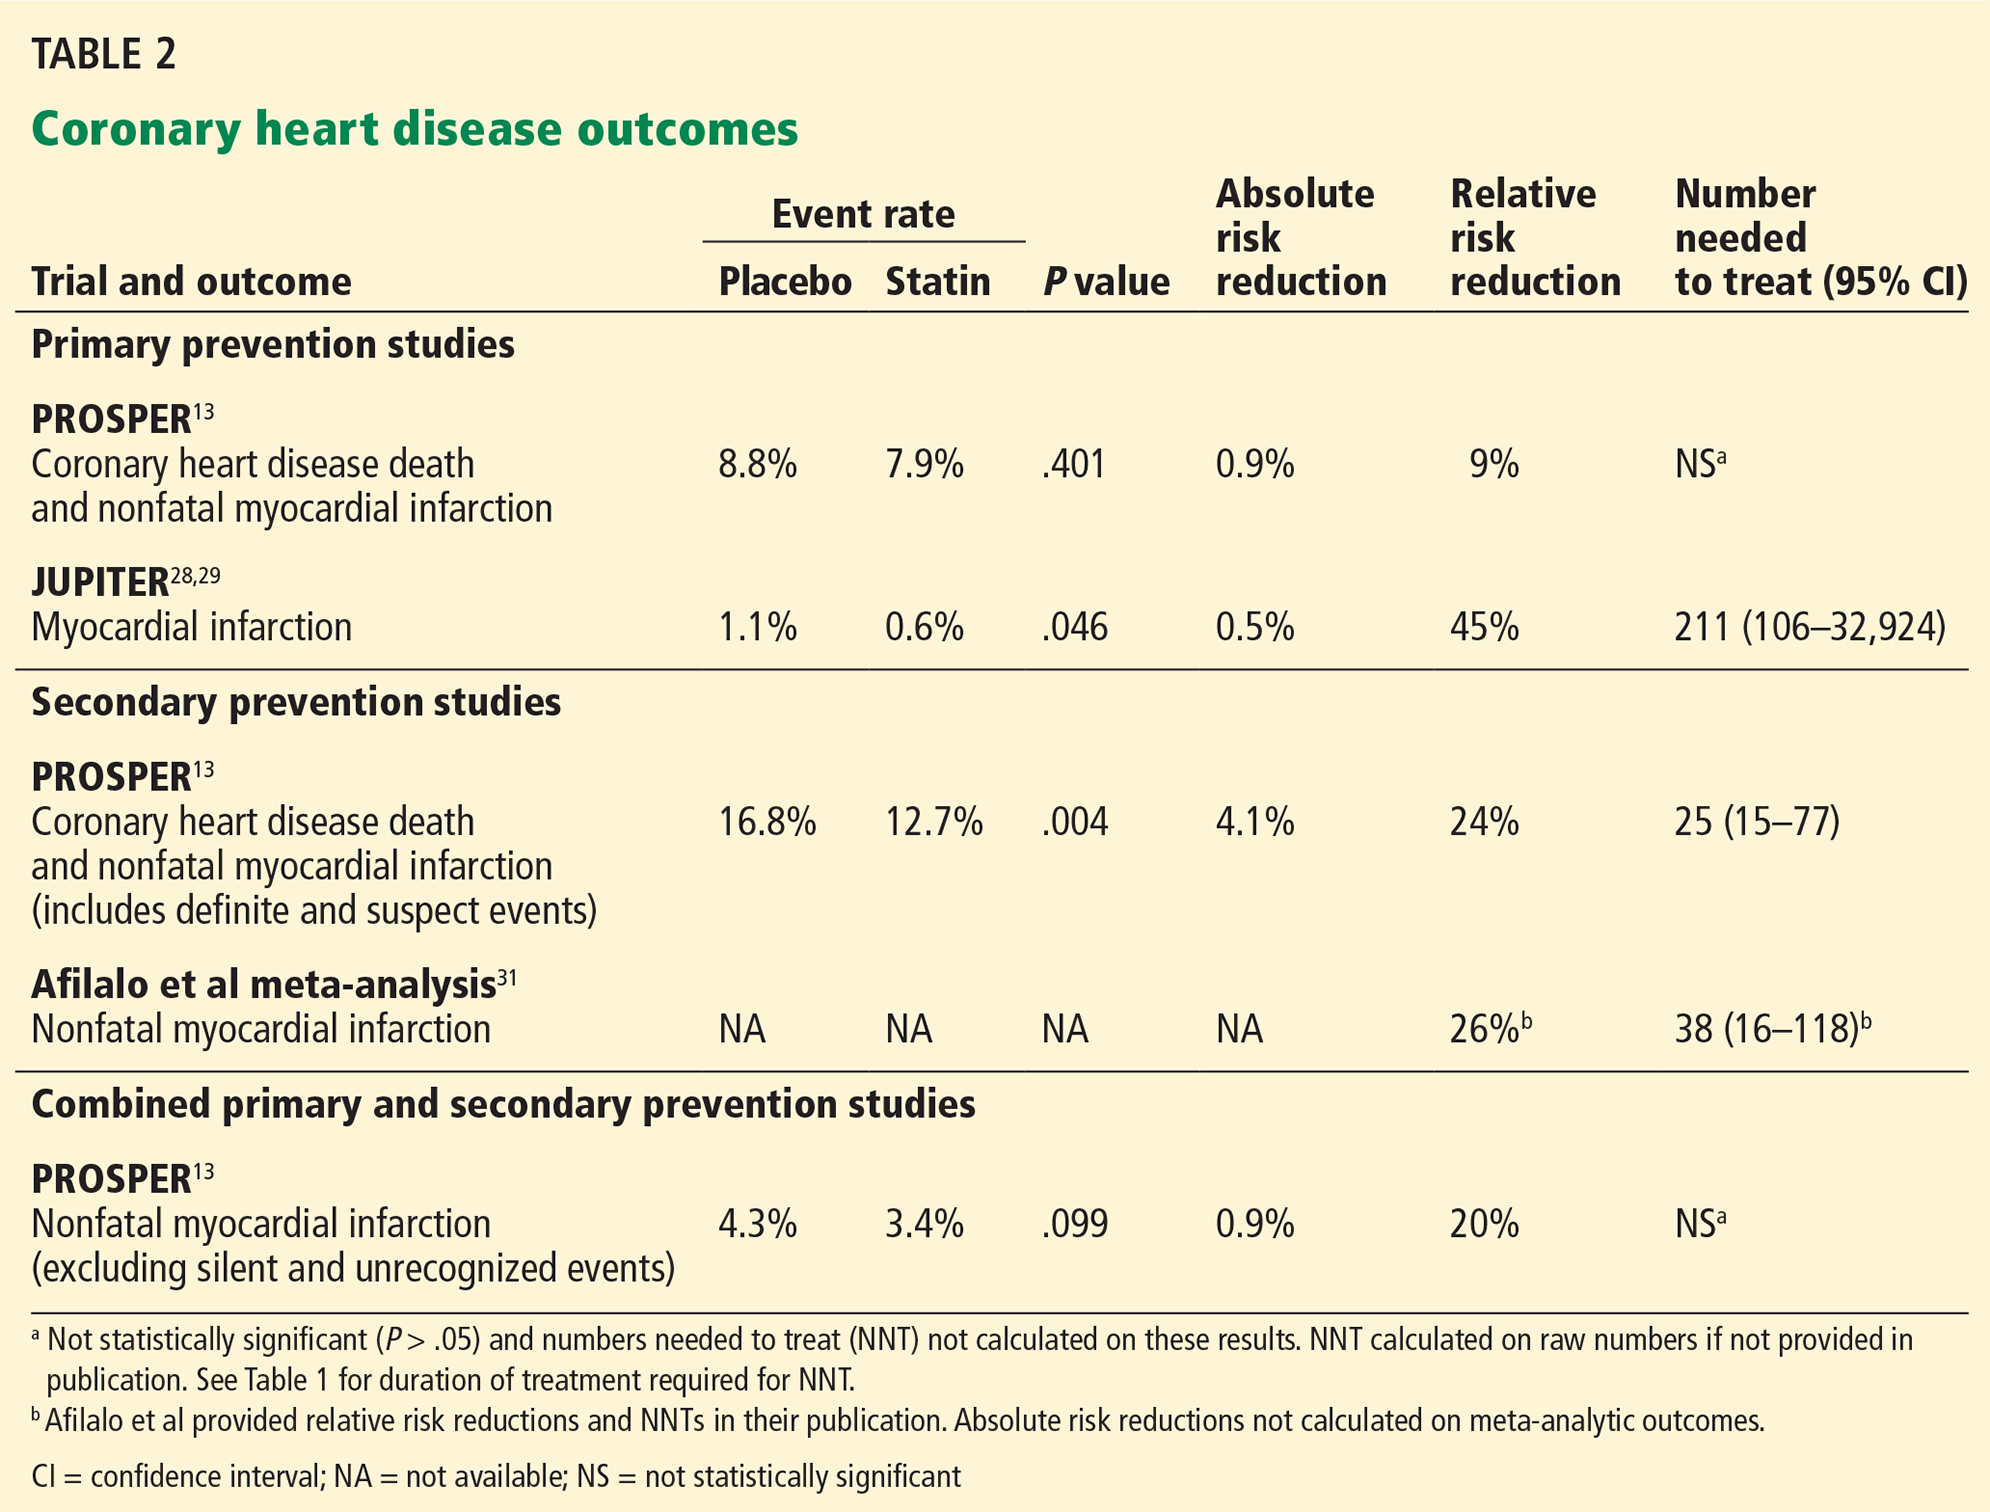
Outcomes for coronary heart disease from PROSPER and JUPITER are summarized in Table 2.
PROSPER. In the PROSPER primary prevention group,13 statin therapy did not reduce the combined outcome of coronary heart disease death and nonfatal MI.
The JUPITER trial demonstrated a statistically significant benefit for preventing MI in the elderly subpopulation (ages 70–97),29 but the number needed to treat was high (211 for 2 years), with a wide confidence interval (CI) (95% CI 106–32,924). The trial did not adequately differentiate between symptomatic and asymptomatic events, making it difficult to determine outcome relevance. Also, due to the methodologic limitations of JUPITER as described above, its results should be interpreted with caution.43,44
The CTT Collaborators32 did not report individual outcomes (eg, coronary heart disease) for the elderly low-risk subgroup and, therefore, this meta-analysis does not answer the question of whether statins reduce symptomatic heart disease in primary prevention populations.
Taken together, these findings do not provide convincing evidence that statin therapy as primary prevention reduces the incidence of symptomatic heart disease for severely frail older adults.
Do statins as secondary prevention reduce symptomatic heart disease?
Most studies defined secondary prevention narrowly as treatment for patients with established coronary artery disease. For instance, in the Afilalo et al meta-analysis,31 the small number of studies that included individuals with other forms of vascular disease (such as peripheral vascular disease) enrolled few participants with noncardiac conditions (eg, 29% in PROSPER13 and 13% in the Heart Protection Study20).
Therefore, any evidence of benefit for secondary prevention demonstrated in these studies is most applicable to patients with coronary heart disease, with less certainty for those with other forms of cardiovascular disease.
In PROSPER,13 the secondary prevention group experienced benefit in the combined outcome of coronary heart disease death or nonfatal MI. In the treatment group, 12.7% experienced this outcome compared with 16.8% with placebo, an absolute risk reduction of 4.1% in 3 years (P = .004, number needed to treat 25, 95% CI 15–77). This measure includes coronary heart disease death, an outcome that may not be generalizable to those who are frail. In addition, the outcome of nonfatal MI includes both symptomatic and suspected events. As such, there is uncertainty whether the realized benefit is clinically relevant to frail older adults.
The Afilalo et al meta-analysis31 showed that the number needed to treat to prevent one nonfatal MI was 38 (95% CI 16–118) over 5 years (Table 2). However, this outcome included both symptomatic and asymptomatic (silent) events.
Based on the available data, we conclude that it is not possible to determine whether statins reduce symptomatic heart disease as secondary prevention for older adults who are frail.
Do statins reduce heart disease in combined populations?
In the combined primary and secondary population from PROSPER,13 pravastatin decreased the risk of nonfatal symptomatic MI from 4.3% in the placebo group to 3.4%, a relatively small reduction in absolute risk (0.9%) and not statistically significant by our chi-square calculation (P = .099).
Do statins prevent a first symptomatic stroke in people with or without preexisting cardiovascular disease?
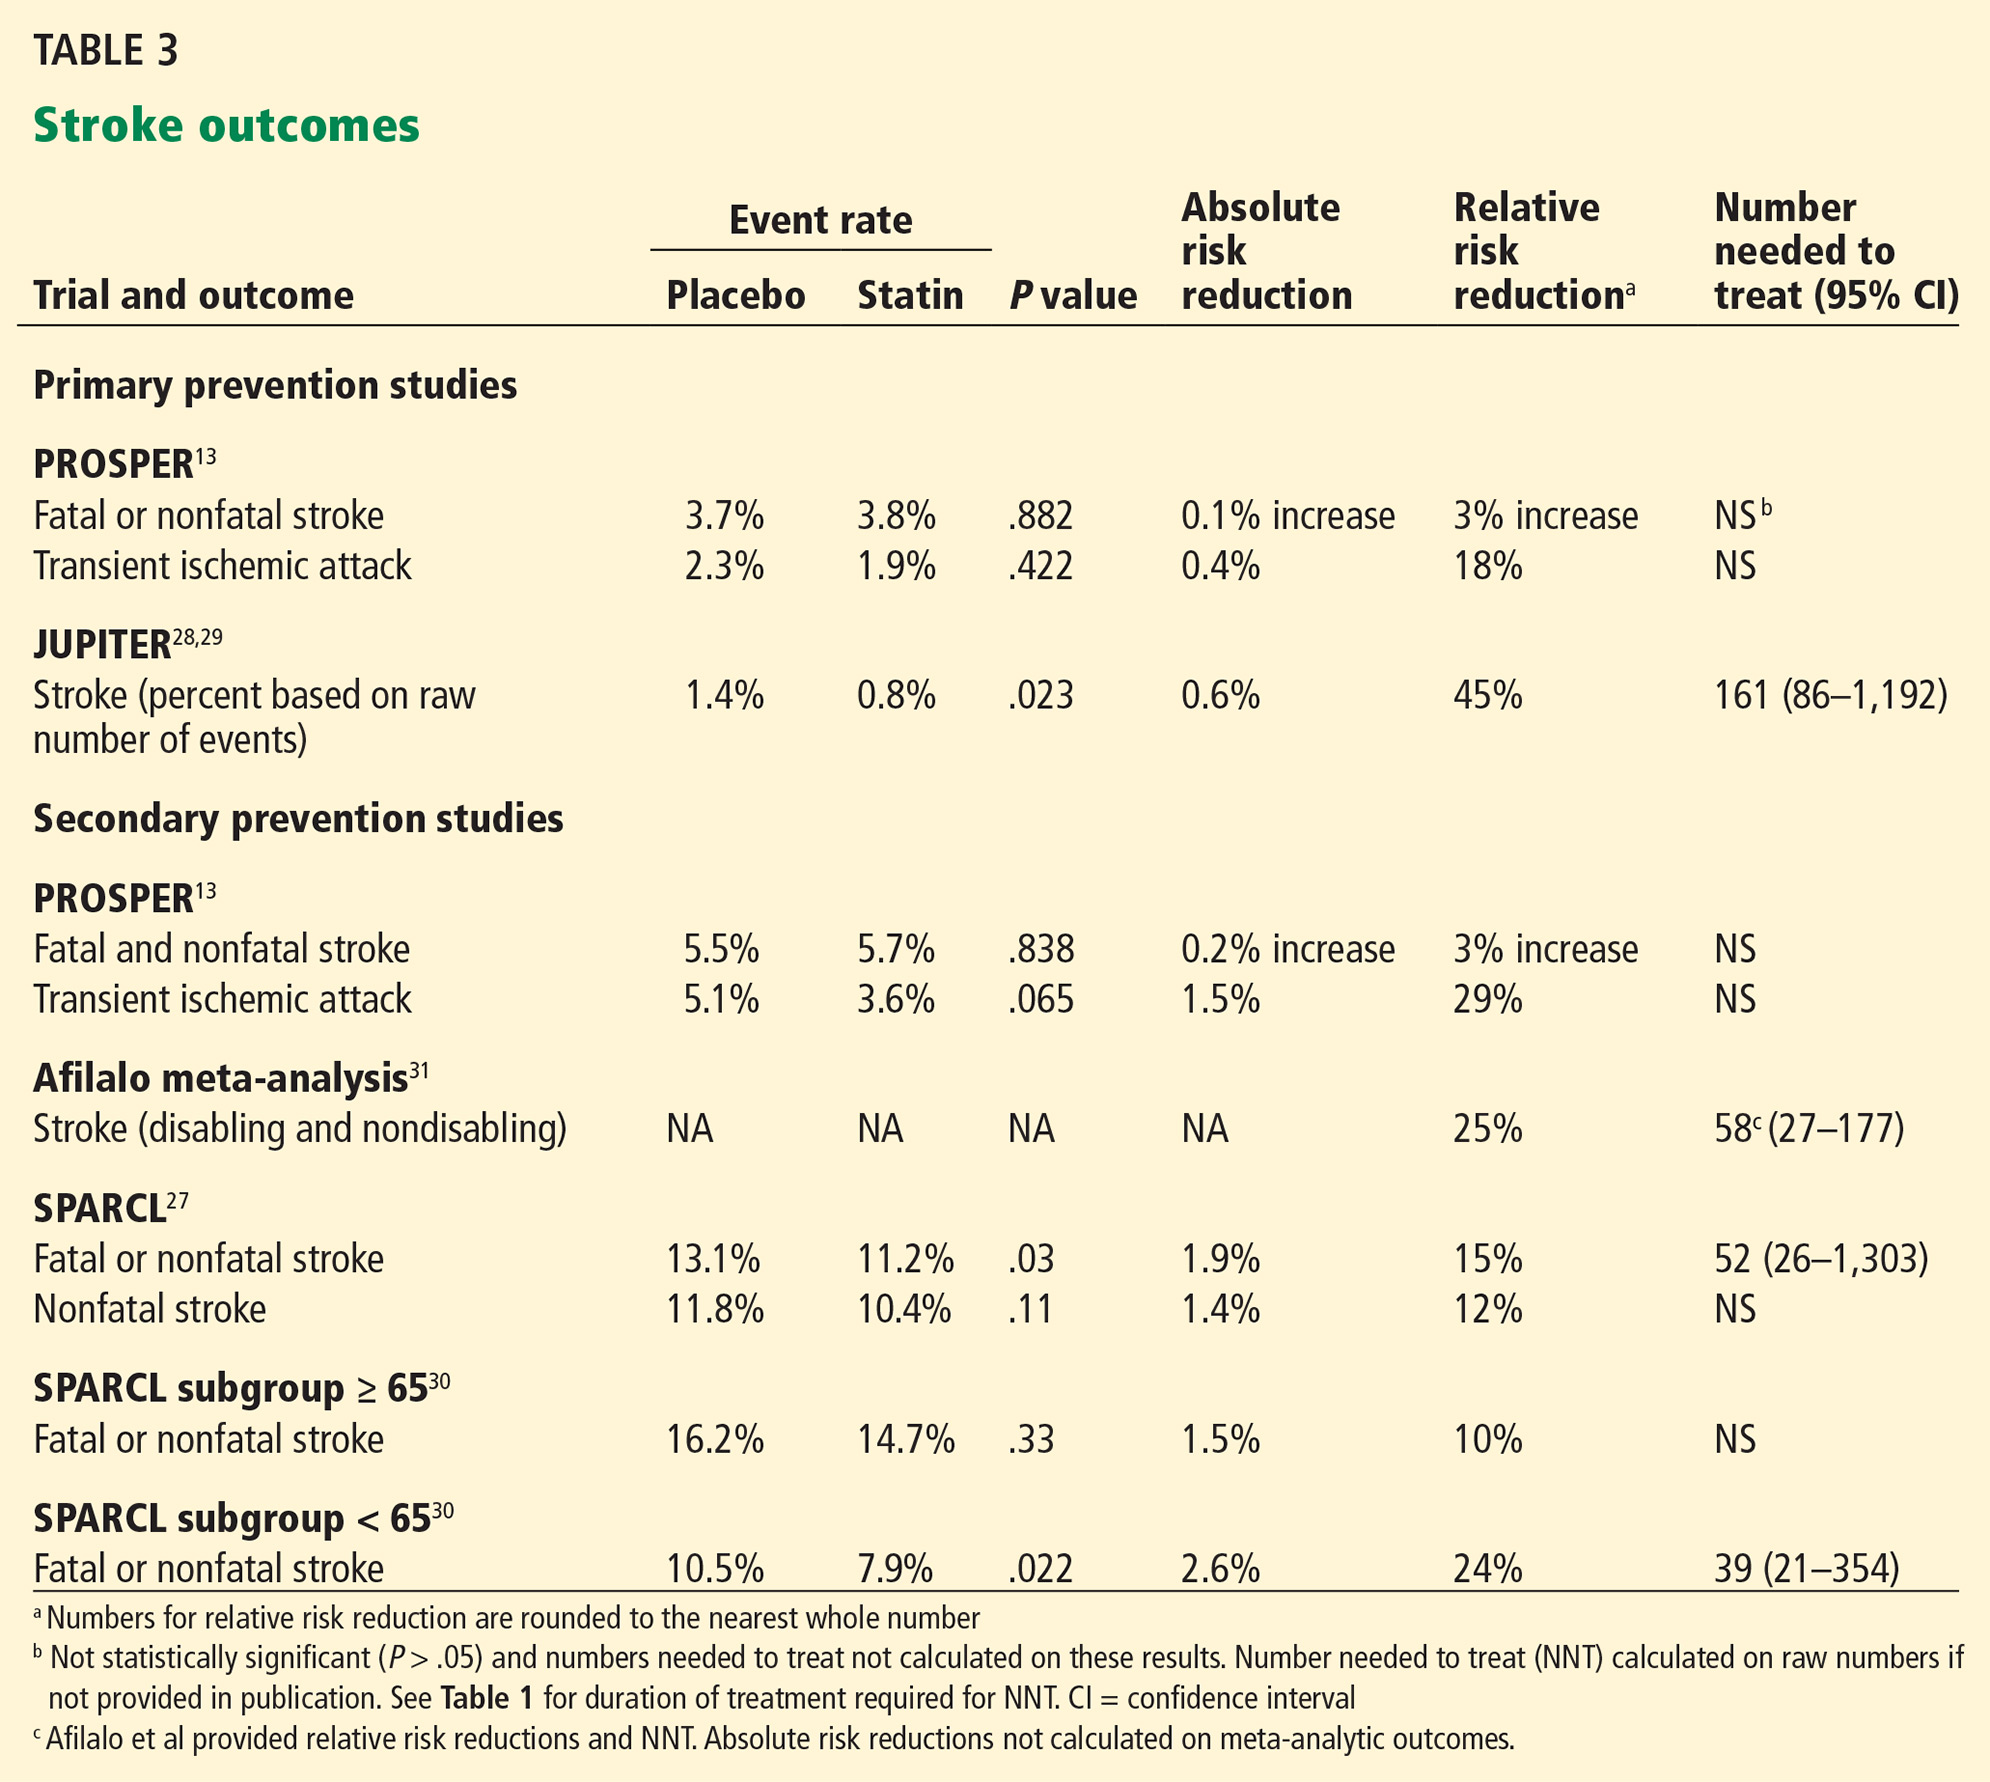
Preventing strokes that cause functional decline is an important outcome for the frail elderly. Stroke outcomes from PROSPER,13 JUPITER,29 and the Afilalo et al meta-analysis31 are summarized in Table 3.
For primary prevention:
In PROSPER (primary prevention),13 there was no statistically significant benefit in the combined outcome of fatal and nonfatal stroke or the single outcome of transient ischemic attack after 3.2 years.
JUPITER,29 in contrast, found that rosuvastatin 20 mg reduced strokes in primary prevention, but the absolute benefit was small. In 2 years, 0.8% of the treatment group had strokes, compared with 1.4% with placebo, an absolute risk reduction of 0.6% (P = .023, number needed to treat 161, 95% CI 86–1,192).
Neither PROSPER nor JUPITER differentiated between disabling and nondisabling strokes.
For secondary prevention:
In PROSPER (secondary prevention),13 there was no statistically significant benefit in the combined outcome of fatal and nonfatal stroke or the single outcome of transient ischemic attack after 3.2 years.
The Afilalo et al secondary prevention meta-analysis demonstrated a 25% relative reduction in stroke (relative risk 0.75, 95% CI 0.56–0.94, number needed to treat 58, 95% CI 27–177).31
Notably, the stroke outcome in Afilalo included both disabling and nondisabling strokes. For example, in the Heart Protection Study,20 the largest study in the Afilalo et al meta-analysis, approximately 50% of nonfatal, classifiable strokes in the overall study population (ie, both younger and older patients) were not disabling. Including disabling and nondisabling strokes in a composite outcome confounds the clinical meaningfulness of these findings in frailty, as the number needed to treat to prevent one disabling stroke cannot be calculated from the data provided.
Do statins prevent a second (symptomatic) stroke in people with a previous stroke?
SPARCL27 (Table 3) examined the question of whether statins decrease the risk of recurrent ischemic stroke for patients with a prior history of stroke or transient ischemic attack. There was a statistically significant reduction in the primary composite outcome of fatal and nonfatal stroke, with 11.2% of the treatment group and 13.1% of the placebo group experiencing this outcome, an absolute risk reduction of 1.9% at 5 years (P = .03; number needed to treat 52, 95% CI 26–1,303). However, the difference in nonfatal stroke, which is the outcome of interest for frailty (since mortality has uncertain relevance), was not statistically significant (10.4% with treatment vs 11.8% with placebo, P =.11).
An exploratory subgroup analysis of SPARCL patients based on age30 showed a smaller, nonsignificant reduction in the primary end point of fatal and nonfatal stroke in the group over age 65 (relative risk 0.90, 95% confidence interval 0.73–1.11, P = .33) compared with the younger group (age < 65) (relative risk 0.74, 95% CI 0.57–0.96, P = .02).
The applicability of these results to the frail elderly is uncertain, since the subgroup analysis was not powered to determine outcomes based on age stratification and there were differences between groups in characteristics such as blood pressure and smoking status. In addition, the outcome of interest, nonfatal stroke, is not provided for the elderly subgroup.
In conclusion, in both primary and secondary prevention populations, the evidence that statins reduce nonfatal, symptomatic stroke rates for older adults is uncertain.
Do statins decrease all-cause mortality for primary or secondary prevention?
Due to competing risks for death, the outcome of mortality may not be relevant to those who are frail; however, studies showed the following:
For primary prevention, there was no decrease in mortality in PROSPER13 or in the elderly subgroup of JUPITER.29
For secondary prevention, an analysis of PROSPER trial data by Afilalo et al31 showed a significant 18% decrease in all-cause mortality (relative risk 0.82, 95% CI 0.69–0.98) using pravastatin 40 mg.
A decrease in all-cause mortality with statins was also reported in the pooled result of the Afilalo et al meta-analysis.31
What are the reported composite outcomes for primary and secondary prevention?
While we were most interested in the symptomatic outcomes described above, we recognize that the small numbers of events make it difficult to draw firm conclusions. Therefore, we also considered composite primary outcomes, even though most included multiple measures that have varying associations with disability and relevancy to frail older adults.
For primary prevention, in the PROSPER preplanned subgroup analysis,13 there was no statistical benefit for any outcome, including the primary composite measure. In contrast, the elderly subpopulation in the JUPITER trial28 showed a treatment benefit with rosuvastatin 20 mg compared with placebo for the primary composite outcome of MI, stroke, cardiovascular death, hospitalization for unstable angina, or revascularization. The number needed to treat for 2 years was 62 (95% CI 39–148).
In the CTT meta-analysis,32 patients at all levels of baseline risk showed benefit up to age 70. However, there was no statistically significant benefit in the composite primary outcome of coronary deaths, nonfatal myocardial infarction, ischemic stroke, or revascularization in the population most representative of elderly primary prevention—those who were more than 70 years old with a 5-year baseline risk of less than 20%.
For secondary prevention, in PROSPER,13 the subpopulation of patients treated for secondary prevention experienced benefit in the primary composite outcome of coronary heart disease death, nonfatal MI, or fatal or nonfatal stroke, achieving a 4% absolute risk reduction with a number needed to treat of 23 (95% CI 14–81) over 3 years.
Do statins decrease disability?
PROSPER was the only study that reported on disability. Compared with placebo, pravastatin did not decrease disability in the total population as measured by basic and instrumental activities of daily living scales.
Do statins help patients with heart failure?
Neither GISSI-HF25 nor CORONA26 found significant benefit from rosuvastatin 10 mg, despite LDL-C lowering of 27% in GISSI-HF and 45% in CORONA.
Do ezetimibe or other nonstatin lipid-lowering agents improve outcomes?
There is no definitive evidence that ezetimibe provides clinically meaningful benefit as a single agent.
For combination therapy, the IMPROVE-IT (Improved Reduction of Outcomes: Vytorin Efficacy International Trial)53 showed that adding ezetimibe 10 mg to simvastatin 40 mg after an acute coronary syndrome reduced the risk of nonfatal myocardial infarction compared with simvastatin monotherapy (event rate 12.8% vs 14.4%; hazard ratio 0.87, 95% CI 0.80–0.95; P = .002) for a population with a mean age of 64. The risk of any stroke was also reduced; strokes occurred in 4.2% of those receiving combination therapy vs 4.8% with monotherapy (hazard ratio 0.86, 95% CI 0.73–1.00, P = .05). After a median of 6 years, 42% of patients in each group had discontinued treatment. Given the very specific clinical scenario of acute coronary syndrome and the young age of the patients in this trial, we do not think that this study justifies the use of ezetimibe for severely frail older adults.
There is no evidence that other combinations (ie, a statin plus another lipid-lowering drug) improve clinical outcomes for either primary or secondary prevention in any population.54
WILL FRAIL PATIENTS LIVE LONG ENOUGH TO BENEFIT?
It is often difficult to determine the number of years that are needed to achieve benefit, as most trials do not provide a statistical analysis of varying time frames.
The PROSPER trial13 lasted 3.2 years. From the Kaplan-Meier curves in PROSPER, we estimate that it took about 1.5 years to achieve a 1% absolute risk reduction and 2.5 years for a 2% absolute risk reduction in coronary heart disease death and nonfatal MI in the combined primary and secondary groups.
JUPITER28 was stopped early at 1.9 years. The Afilalo et al meta-analysis31 was based on follow-up over 4.9 years.
IMPROVE-IT53 reported event rates at 7 years. The authors note that benefit in the primary composite outcome appeared to emerge at 1 year, although no statistical support is given for this statement and divergence in the Kaplan-Meier curves is not visually apparent.
The duration of other studies ranged between 2.7 and 4.9 years (Table 1).26–28
It has been suggested that statins should be considered for elderly patients who have a life expectancy of at least 5 years.3 However, many older adults have already been taking statins for many years, which makes it difficult to interpret the available timeframe evidence.
In a multicenter, unblinded, randomized trial,55 statins were either stopped or continued in older adults who had a short life expectancy and a median survival of approximately 7 months. Causes of death were evenly divided between cancer and noncancer diagnoses, and 22% of the patients were cognitively impaired. Discontinuing statin therapy did not increase mortality or cardiovascular events within 60 days. Nevertheless, stopping statin therapy did not achieve noninferiority for the primary end point, the proportion of participants who died within 60 days. Statin discontinuation was associated with improved quality of life, although the study was not blinded, which could have influenced results.
HAVE THE HARMS BEEN SUFFICIENTLY CONSIDERED?
Frail older adults commonly take multiple medications and are more vulnerable to adverse events.56
Many statins require dose reduction with severe renal impairment (creatinine clearance < 30 mL/min/1.73 m2), which would be a common consideration in severely frail older adults.
Myopathy
Myopathy, which includes myalgias and muscle weakness, is a statin-related adverse event that can impair quality of life. Myopathy typically develops within the first 6 months but can occur at any time during statin treatment.57 When muscle-related adverse effects occur, they may affect the elderly more significantly, particularly their ability to perform activities of daily living, rise from a chair, or mobilize independently. Another concern is that older adults with dementia may not be able to accurately report muscle-related symptoms.
It is difficult to ascertain the true prevalence of myopathy, especially in advanced age and frailty. Randomized controlled trials report incidence rates of 1.5% to 5%, which is comparable to placebo.57,58 However, inconsistent definitions of myopathy and exclusion of subjects with previous statin intolerance or adverse effects during run-in periods limit interpretability.57 Clinical experience suggests that muscle complaints may be relatively common.59–61
Advanced age, female sex, low body mass index, and multisystem disease are all associated with frailty and have also been described as risk factors for statin-associated muscle syndromes.61 Physiologic changes associated with frailty, such as reduced muscle strength, decreased lean body mass, impaired functional mobility, decreased reserve capacity, and altered drug metabolism may increase the risk and severity of myopathy.62
Adverse cognitive events
Meta-analyses of randomized clinical trials and narrative reviews find no definitive relationship between statin therapy and adverse cognitive events.63–67 Nevertheless, there have been case reports of memory loss associated with the use of statins, and the US Food and Drug Administration has issued a warning that statins have been associated with memory loss and confusion.68
It may be difficult to determine whether a statin is causing or aggravating cognitive symptoms among individuals with dementia without a trial withdrawal of the drug.
OUR RECOMMENDATIONS
The recommendations below are intended for adults with severe or very severe frailty (ie, a score of 7 or 8 on the Clinical Frailty Scale11 or FACT5 and therefore apply to most older adults living in long-term care facilities.
Primary prevention
There is no reason to prescribe or continue statins for primary prevention, as it is unlikely that they would provide benefit for outcomes that are relevant in this population.
Secondary prevention
Statin treatment is probably not necessary for secondary prevention in those with severe frailty, although there may be extenuating circumstances that justify statin use.
Heart failure
There is no reason to start or continue statins for heart failure, as there is insufficient evidence that they are effective for this indication in any population.
Ezetimibe
There is no evidence that ezetimibe reduces cardiovascular events in any population when used as monotherapy. For a select population with acute coronary syndromes, ezetimibe has a modest effect. Given the very specific clinical scenario of acute coronary syndrome, we do not think that the available evidence justifies the use of ezetimibe for severely frail older adults.
Agents other than ezetimibe combined with statins
There is no reason to start or continue other lipid-lowering drugs in conjunction with statins.
Statin dosing
As statin adverse effects have the potential to increase with advancing age and frailty, lower doses may be appropriate.68
Adverse events
Consider stopping statins on a trial basis if there is concern regarding myopathy, drug interactions, or other adverse effects.
BOTTOM LINE: DO STATINS IMPROVE QUALITY OF LIFE OR FUNCTION?
In primary prevention for older adults, there is doubt that statins prevent cardiovascular disease and stroke-related events because the main study involving the elderly did not show a benefit in the primary prevention subgroup.13 Additionally, there is no conclusive evidence that statin treatment decreases mortality in primary prevention.13,29
There is insufficient information to determine whether the frail elderly should receive statins for secondary prevention. Although there is evidence that treatment decreases measures of coronary heart disease and stroke, it is unclear whether it improves quality of life or function for those who are frail. To answer this question, we need more information about whether reported outcomes (such as stroke and MI) are associated with disability, which is not provided in many of the studies we reviewed. When disability was specifically considered in the PROSPER trial for the combined population of primary and secondary prevention, treatment with statins had no impact on basic and instrumental activities of daily living.
Some experts may not agree with our interpretation of the complex evidence presented in this article. Others may ask, “What is the harm in using statins, even if there is no definitive benefit?” However, the harms associated with statin therapy for the frail are poorly defined. In the face of these uncertainties and in the absence of definitive improvement in quality of life, we believe that “less is more” in the context of severe frailty.69
The cost of medications should also be considered, especially in long-term care facilities, where there is an added expense of drug administration that diverts human resources away from interactions that are more congruent with respecting the lifestage of frailty.
Careful review of evidence before applying clinical practice guidelines to those who are frail should become the norm. When considering treatment of frail patients, the five questions described in this review shed light on the applicability of clinical trial evidence. Therapies that are highly effective in healthier populations may be less effective when individuals are severely frail. Accordingly, we propose that medications should only be used if they improve quality of life or function.
- Ontario Pharmacy Research Collaboration. Deprescribing guidelines for the elderly. www.open-pharmacy-research.ca/research-projects/emerging-services/deprescribing-guidelines. Accessed December 28, 2016.
- Scott IA, Hilmer SN, Reeve E, et al. Reducing inappropriate polypharmacy: the process of deprescribing. JAMA Intern Med 2015; 175:827–834.
- O’Mahony D, O’Sullivan D, Byrne S, O’Connor MN, Ryan C, Gallagher P. STOPP/START criteria for potentially inappropriate prescribing in older people: version 2. Age Ageing 2015; 44:213–218.
- American Geriatrics Society 2012 Beers Criteria Update Expert Panel. American Geriatrics Society updated Beers Criteria for potentially inappropriate medication use in older adults. J Am Geriatr Soc 2012; 60:616–631.
- Mallery LH, Allen M, Fleming I, et al. Promoting higher blood pressure targets for frail older adults: a consensus guideline from Canada. Cleve Clin J Med 2014; 81:427–437.
- Mallery LH, Ransom T, Steeves B, Cook B, Dunbar P, Moorhouse P. Evidence-informed guidelines for treating frail older adults with type 2 diabetes: from the Diabetes Care Program of Nova Scotia (DCPNS) and the Palliative and Therapeutic Harmonization (PATH) program. J Am Med Dir Assoc 2013; 14:801–808.
- Moorhouse P, Mallery L. Palliative and therapeutic harmonization: a model for appropriate decision-making in frail older adults. J Am Geriatr Soc 2012; 60:2326–2332.
- Fried LP, Tangen CM, Walston J, et al; Cardiovascular Health Study Collaborative Research Group. Frailty in older adults: evidence for a phenotype. J Gerontol A Biol Sci Med Sci 2001; 56:M146–M156.
- Morley JE, Malmstrom TK, Miller DK. A simple frailty questionnaire (FRAIL) predicts outcomes in middle aged African Americans. J Nutr Health Aging 2012; 16:601–608.
- Rockwood K, Song Z, MacKnight C, et al. A global clinical measure of fitness and frailty in elderly people. CMAJ 2005; 173:489–495.
- Morley JE, Vellas B, van Kan GA, et al. Frailty consensus: a call to action. J Am Med Dir Assoc 2013; 14:392–397.
- Tricoci P, Allen JM, Kramer JM, Califf RM, Smith SC Jr. Scientific evidence underlying the ACC/AHA clinical practice guidelines. JAMA 2009; 301:831–841.
- Shepherd J, Blauw GJ, Murphy MB, et al; PROSPER study group. PROspective Study of Pravastatin in the Elderly at Risk. Pravastatin in elderly individuals at risk of vascular disease (PROSPER): a randomised controlled trial. Lancet 2002; 360:1623–1630.
- Randomised trial of cholesterol lowering in 4444 patients with coronary heart disease: the Scandinavian Simvastatin Survival Study (4S). Lancet 1994; 344:1383–1389.
- Miettien TA, Pyorala K, Olsson AG, et al. Cholesterol-lowering therapy in women and elderly patients with myocardial infarction or angina pectoris: findings from the Scandinavian Simvastatin Study Group (4S). Circulation 1997; 96:4211–4218.
- Lewis SJ, Moye LA, Sacks FM, et al. Effect of pravastatin on cardiovascular events in older patients with myocardial infarction and cholesterol levels in the average range. Results of the Cholesterol and Recurrent Events (CARE) trial. Ann Intern Med 1998; 129:681–689.
- Hunt D, Young P, Simes J, et al. Benefits of pravastatin on cardiovascular events and mortality in older patients with coronary heart disease are equal to or exceed those seen in younger patients: results from the LIPID trial. Ann Intern Med 2001; 134:931–940.
- Prevention of cardiovascular events and death with pravastatin in patients with coronary heart disease and a broad range of initial cholesterol levels. The Long-Term Intervention with Pravastatin in Ischaemic Disease (LIPID) Study Group. N Engl J Med 1998; 339:1349–1357.
- Heart Protection Study Collaborative Group. The effects of cholesterol lowering with simvastatin on cause-specific mortality and on cancer incidence in 20,536 high-risk people: a randomized placebo-controlled trial. BMC Med 2005; 3:6.
- Heart Protection Study Collaborative Group. MRC/BHF Heart Protection Study of cholesterol lowering with simvastatin in 20,536 high-risk individuals: a randomized placebo-controlled trial. Lancet 2002; 360:7–22.
- Pitt B, Mancini GB, Ellis SG, Rosman HS, Park JS, McGovern ME. Pravastatin limitation of atherosclerosis in the coronary arteries (PLAC 1): reduction in atherosclerosis progression and clinical events. PLAC 1 investigation. J Am Coll Cardiol 1995; 26:1133–1139.
- Jukema JW, Bruschke AV, van Boven AJ, et al. Effects of lipid lowering by pravastatin on progression and regression of coronary artery disease in symptomatic men with normal to moderately elevated serum cholesterol levels. The Regression Growth Evaluation Statin Study (REGRESS). Circulation 1995; 91:2528–2540.
- Serruys PW, Foley DP, Jackson G, et al. A randomized placebo-controlled trial of fluvastatin for prevention of restenosis after successful coronary balloon angioplasty; final results of the fluvastatin angiographic restenosis (FLARE) trial. Eur Heart J 1999; 20:58–69.
- Serruys PW, de Feyter P, Macaya C, et al; Lescol Intervention Prevention Study (LIPS) Investigators. Fluvastatin for prevention of cardiac events following successful first percutaneous coronary intervention: a randomized controlled trial. JAMA 2002; 287:3215–3222.
- Tavazzi L, Maggioni AP, Marchioli R, et al; Gissi-HF Investigators. Effect of rosuvastatin in patients with chronic heart failure (the GISSI-HF trial): a randomized, double-blind, placebo-controlled trial. Lancet 2008; 372:1231–1239.
- Kjekshus J, Apatrei E, Barrios V, et al; CORONA Group. Rosuvastatin in older patients with systolic heart failure. N Engl J Med 2007; 357:2248–2261.
- Amarenco P, Bogousslavsky J, Callahan A, et al; Stroke Prevention by Aggressive Reduction in Cholesterol Levels (SPARCL) Investigators. High-dose atorvastatin after stroke or transient ischemic attack. N Engl J Med 2006; 355:549–559.
- Ridker PM, Danielson E, Fonseca FA, et al; JUPITER Study Group. Rosuvastatin to prevent vascular events in men and women with elevated C-reactive protein. N Engl J Med 2008; 359:2195–2207.
- Glynn RJ, Koenig W, Nordestgaard BG, Shepherd J, Ridker PM. Rosuvastatin for primary prevention in older persons with elevated C-reactive protein and low to average low-density lipoprotein cholesterol levels: exploratory analysis of a randomized trial. Ann Intern Med 2010; 152:488–496, W174.
- Chaturvedi S, Zivin J, Breazna A, et al; SPARCL Investigators. Effect of atorvastatin in elderly patients with a recent stroke or transient ischemic attack. Neurology 2009; 72:688–694.
- Afilalo J, Duque G, Steele R, Jukema JW, de Craen AJ, Eisenberg MJ. Statins for secondary prevention in elderly patients: a hierarchical bayesian meta-analysis. J Am Coll Cardiol 2008; 51:37–45.
- Cholesterol Treatment Trialists’ (CTT) Collaborators; Mihaylova B, Emberson J, Blackwell L, et al. The effects of lowering LDL cholesterol with statin therapy in people at low risk of vascular disease: meta-analysis of individual data from 27 randomised trials. Lancet 2012; 380:581– 590.
- Sacks FM, Pfeffer MA, Moye L, et al. Rationale and design of a secondary prevention trial of lowering normal plasma cholesterol levels after acute myocardial infarction: the Cholesterol and Recurrent Events (CARE). Am J Cardiol 1991; 68:1436–1446.
- Armitage J, Collins R. Need for large scale randomised evidence about lowering LDL cholesterol in people with diabetes mellitus: MRC/BHF Heart Protection Study and other major trials. Heart 2000; 84:357–360.
- Design features and baseline characteristics of the LIPID (Long-Term Intervention with Pravastatin in Ischemic Disease) study: a randomized trial in patients with previous acute myocardial infarction and/or unstable angina pectoris. Am J Cardiol 1995; 76:474–479.
- Shepherd J, Blauw GJ, Murphy MB, et al. The design of a prospective study of Pravastatin in the Elderly at Risk (PROSPER). Am J Cardiol 1999; 84:1192–1197.
- Amarenco P, Bogousslavsky J, Callahan AS, et al; SPARCL Investigators. Design and baseline characteristics of the stroke prevention by aggressive reduction in cholesterol levels (SPARCL) study. Cerebrovasc Dis 2003; 16:389–395.
- Interpretation of subgroup analyses and meta-regressions. In: Higgins JPT, Green S, editors. Cochrane Handbook for Systematic Reviews of Interventions Version 5.1.0. The Cochrane Collaboration, 2011. http://handbook.cochrane.org/chapter_9/9_6_6_interpretation_of_subgroup_analyses_and_meta_regressions.htm. Accessed December 5, 2016.
- Borenstein M, Higgins JP. Meta-analysis and subgroups. Prev Sci 2013; 14:134–143.
- Savarese G, Gotto AM Jr, Paolillo S, et al. Benefits of statins in elderly subjects without established cardiovascular disease: a meta-analysis. J Am Coll Cardiol 2013; 62:2090–2099.
- Sever PS, Dahlof B, Poulter NR, et al. Prevention of coronary and stroke events with atorvastatin in hypertensive patients who have average or lower-than-average cholesterol concentrations, in the Anglo-Scandinavian Cardiac Outcomes Trial—Lipid Lowering Arm (ASCOT-LLA): a multicentre randomised controlled trial. Lancet 2003; 361:1149–1158.
- The Antihypertensive and Lipid-Lowering Treatment to Prevent Heart Attack Trial. Major outcomes in moderately hypercholesterolemic, hypertensive patients randomized to pravastatin vs usual care: The Antihypertensive and Lipid-Lowering Treatment to Prevent Heart Attack Trial (ALLHAT-LLT). JAMA 2002; 288:2998–3007.
- de Longeril M, Salen P, Abramson J, et al. Cholesterol lowering, cardiovascular diseases, and the rosuvastatin-JUPITER controversy: a critical reappraisal. Arch Intern Med 2010; 170:1032–1036.
- Yusuf S, Lonn E, Bosch J. Lipid lowering for primary prevention. Lancet 2009: 373:1152–1155.
- Briel M, Bassler D, Wang AT, Guyatt GH, Montori VM. The dangers of stopping a trial too early. J Bone Joint Surg Am 2012; 94(suppl 1):56–60.
- Hayward RA, Krumholz HM. Three reasons to abandon low-density lipoprotein targets: an open letter to the Adult Treatment Panel IV of the National Institutes of Health. Circ Cardiovasc Qual Outcomes 2012; 5:2–5.
- Afilalo J, Duque G, Steele R, Jukema JW, de Craen AJ, Eisenberg MJ. Statins for secondary prevention in elderly patients: a hierarchical Bayesian meta-analysis. www.ncbi.nlm.nih.gov/pubmedhealth/PMH0026417. Accessed December 5, 2016.
- Holmes HM, Hayley DC, Alexander GC, Sachs GA. Reconsidering medication appropriateness for patients late in life. Arch Intern Med 2006; 166:605–609.
- Rockwood K, Mitnitski A. Frailty defined by deficit accumulation and geriatric medicine defined by frailty. Clin Geriatr Med 2011; 27:17–26.
- Petersen LK, Christensen K, Kragstrup J. Lipid-lowering treatment to the end? A review of observational studies and RCTs on cholesterol and mortality in 80+-year olds. Age Ageing 2010; 39:674–680.
- Psaty BM, Anderson M, Kronmal RA, et al. The association between lipid levels and the risks of incident myocardial infarction, stroke, and total mortality: the Cardiovascular Health Study. J Am Geriatr Soc 2004; 52:1639–1647.
- de Ruijter W, Westendorp RG, Assendelft WJ, et al. Use of Framingham risk score and new biomarkers to predict cardiovascular mortality in older people: population based observational cohort study. BMJ 2009; 338:a3083.
- Canon CP, Blazing MA, Giugliano RP, et al; IMPROVE-IT Investigators. Ezetimibe added to statin therapy after acute coronary syndromes. N Engl J Med 2015; 372:2387–2397.
- Anderson TJ, Gregoire J, Hegele RA, et al. 2012 update of the Canadian Cardiovascular Society guidelines for the diagnosis and treatment of dyslipidemia for the prevention of cardiovascular disease in the adult. Can J Cardiol 2013; 29:151–167.
- Kutner JS, Blatchford PJ, Taylor DH, et al. Safety and benefit of discontinuing statin therapy in the setting of advanced, life-limiting illness: a randomized clinical trial. JAMA Intern Med 2015; 175:691–700.
- Tinetti ME, Bogardus ST Jr, Agostini JV. Potential pitfalls of disease-specific guidelines for patients with multiple conditions. N Engl J Med 2004; 351:2870–2874.
- Rosenson RS. Current overview of statin-induced myopathy. Am J Med 2004; 116:408–416.
- Mancini GB, Baker S, Bergeron J, et al. Diagnosis, prevention, and management of statin adverse effects and intolerance: proceedings of a Canadian Working Group Consensus Conference. Can J Cardiol 2011; 27:635–662.
- Cohen JD, Brinton EA, Ito MK, Jacobson TA. Understanding Statin Use in America and Gaps in Patient Education (USAGE): an internet-based survey of 10,138 current and former statin users. J Clin Lipidol 2012; 6:208–215.
- Joy TR, Hegele RA. Narrative review: statin-related myopathy. Ann Intern Med 2009; 150:858–868.
- Talbert RL. Safety issues with statin therapy. J Am Pharm Assoc (2003) 2006; 46:479–490.
- Sewright KA, Clarkson PM, Thompson PD. Statin myopathy: incidence, risk factors, and pathophysiology. Curr Atheroscler Rep 2007; 9:389–396.
- Ott BR, Daiello LA, Dahabreh IJ, et al. Do statins impair cognition? A systematic review and meta-analysis of randomized controlled trials. J Gen Intern Med 2015; 30:348–358.
- Mancini GB, Tashakkor AY, Baker S, et al. Diagnosis, prevention and management of statin adverse effects and intolerance: Canadian Working Group Consensus update. Can J Cardiol 2013: 29:1553–1568.
- Rojas-Fernandez CH, Cameron JC. Is statin-associated cognitive impairment clinically relevant? A narrative review and clinical recommendations. Ann Pharmacother 2012; 46:549–557.
- McGuinness B, O’Hare J, Craig D, Bullock R, Malouf R, Passmore P. Cochrane review on ‘Statins for the treatment of dementia’. Int J Geriatr Psychiatry 2013; 28:119–126.
- Pandey RD, Gupta PP, Jha D, Kumar S. Role of statins in Alzheimer’s disease: a retrospective meta-analysis for commonly investigated clinical parameters in RCTs. Int J Neurosci 2013; 123:521–525.
- Food and Drug Administration (FDA). FDA drug safety communication: important safety label changes to cholesterol-lowering statin drugs. www.fda.gov/drugs/ drugsafety/ucm293101.htm. Accessed December 5, 2016.
- Garfinkel D, Mangin D. Feasibility study of a systematic approach for discontinuation of multiple medications in older adults: addressing polypharmacy. Arch Intern Med 2010; 170:1648–1654.
Frail elderly patients are at high risk of adverse clinical outcomes, including those due to polypharmacy. Several groups tackle “deprescribing” by developing lists of medications that are potentially inappropriate for the elderly, such as the Beers or STOPP/START criteria.1–4
See related editorialIn contrast, our group (the Palliative and Therapeutic Harmonization [PATH] program and the Dalhousie Academic Detailing Service) has developed evidence-based, frailty-specific guidelines for treating hypertension5 and diabetes,6 in which we advocate less-stringent treatment targets and tapering or discontinuing medications, as needed.
The PATH program7 is a clinical approach that prioritizes the consideration of frailty when making treatment decisions. The Dalhousie Academic Detailing Service collaborates with the Nova Scotia Health Authority to research and develop evidence-informed educational messages about the treatment of common medical conditions.
Here, we address lipid-lowering therapy in this population.
CONSIDERING FRAILTY
Frailty is defined in several ways. The Fried model8,9 identifies frailty when 3 of the following characteristics are present: unintentional weight loss, exhaustion, muscle weakness, slow walking speed, or low levels of activity. The Clinical Frailty Scale10,11 and the Frailty Assessment for Care-planning Tool (FACT)5 use deficits in cognition, function, and mobility to define frailty. According to these scales, people are considered severely frail when they require assistance with basic activities of daily living (such as bathing or dressing), owing to cognitive or physical deficits from any cause.
In reviewing the evidence, we consider five questions:
- What is the quality of the evidence? (Up to 48% of clinical practice guideline recommendations may be based on low-level evidence or expert opinion.12)
- How did the study population compare with the frail?
- Are study outcomes and potential benefits clinically relevant to those who are frail?
- How long did it take for the clinical benefit of a treatment to become apparent, and are the frail elderly likely to live that long?
- Have the harms of treatment been sufficiently considered?
WHAT IS THE QUALITY OF THE EVIDENCE?
We found no studies that specifically evaluated the benefit of lipid-lowering for severely frail older adults. Therefore, we examined randomized controlled trials that enrolled non-frail older adults,13–28 subgroup analyses of randomized controlled trials,29,30 meta-analyses that analyzed subgroups of elderly populations,31,32 and publications describing the study designs of randomized controlled trials.33–37
Most of the evidence comes from post hoc subgroup analyses of elderly populations. Although meta-analysis is commonly used to compare subgroups, the Cochrane handbook and others consider subgroup comparisons observational by nature.38,39 (See Table 1 for lipid-lowering studies discussed in this article.)
Studies of statins for primary prevention of cardiovascular disease
For evidence of benefit from lipid-lowering for primary prevention (ie, to reduce the risk of cardiovascular events in patients with no known cardiovascular disease at baseline but at increased risk), we reviewed the meta-analysis conducted by the Cholesterol Treatment Trialists’ (CTT) Collaborators.32 Since this meta-analysis included the major trials that enrolled elderly patients, individual publications of post hoc, elderly subgroups were, for the most part, not examined individually. The exception to this approach was a decision to report on the PROSPER13 and JUPITER28 trials separately, because PROSPER is the most representative of the elderly population and JUPITER reached the lowest LDL-C of primary prevention trials published to date and included a large elderly subgroup (n = 5,695).
Savarese et al40 evaluated the benefits of statins for older adults who did not have established cardiovascular disease. We did not report on this meta-analysis, as not all of the subjects that populated the meta-analysis were representative of a typical prevention population. For instance, in the Anglo-Scandinavian Cardiac Outcomes Trial lipid-lowering arm,41 14% of the subjects had had a previous stroke or transient ischemic attack. In the Antihypertensive and Lipid-Lowering Treatment Trial,42 16% of the population had a family history of premature coronary heart disease.
In addition, all the trials in the Savarese meta-analysis were also included in the CTT meta-analysis.32 The CTT reports on baseline risk using patient-level data stratified by age and risk, which may be more relevant to the question of primary prevention for older adults, as highlighted in our review.
PROSPER (Prospective Study of Pravastatin in the Elderly at Risk),13 a well-conducted, double-blind, randomized controlled trial with low probability of bias, compared pravastatin 40 mg and placebo. It was the only study that specifically enrolled older adults, with prespecified analysis of primary and secondary prevention subgroups. The primary prevention subgroup accounted for 56% of the 5,084 participants.
JUPITER (Justification for the Use of Statins in Prevention)28 compared rosuvastatin 20 mg and placebo in 17,802 participants. All had low-density lipoprotein cholesterol (LDL-C) levels below 3.4 mmol/L (130 mg/dL) and elevated levels of the inflammatory biomarker high-sensitivity C-reactive protein (hsCRP), ie, 2 mg/L or higher. Subsequently, Glynn et al performed a post hoc, exploratory subgroup analysis of elderly participants (N = 5,695).29
The JUPITER trial had several limitations.43,44 The planned follow-up period was 5 years, but the trial was stopped early at 1.9 years, after a statistically significant difference was detected in the primary composite outcome of reduction in all vascular events. Studies that are stopped early may exaggerate positive findings.45
Further, JUPITER’s patients were a select group, with normal LDL-C levels, elevated hsCRP values, and without diabetes. Of 90,000 patients screened, 72,000 (80%) did not meet the inclusion criteria and were not enrolled. This high rate of exclusion limits the generalizability of study findings beyond the shortcomings of post hoc subgroup analysis.
The meta-analysis performed by the CTT Collaborators32 used individual participant data from large-scale randomized trials of lipid-modifying treatment. This analysis was specific to people at low risk of vascular disease. In a supplementary appendix, the authors described the reduction in major vascular events for each 1.0 mmol/L decrease in LDL-C in three age categories: under age 60, ages 61 to 70, and over age 70.
The authors also stratified the results by risk category and provided information about those with a risk of major vascular events of less than 20%, which would be more representative of a purer primary prevention population.
For the elderly subgroup at low risk, the CTT Collaborators32 only reported a composite of major vascular events (coronary death, nonfatal myocardial infarction [MI], ischemic stroke, or revascularization) and did not describe individual outcomes, such as prevention of coronary heart disease.
Study results are based on postrandomization findings and therefore may be observational, not experimental.46
Studies of statins for secondary prevention of cardiovascular disease
The aim of secondary prevention is to reduce the risk of recurrent cardiovascular events in patients who already have cardiovascular disease.
To address the question of whether statins reduce cardiovascular risk, we reviewed:
PROSPER,13 which included a preplanned analysis of the secondary prevention population.
Afilalo et al,31,47 who performed a meta-analysis of the elderly subgroups of nine major secondary prevention studies (19,569 patients) using published and unpublished data.
To address the question of whether statins benefit individuals with heart failure, we found two relevant studies:
GISSI-HF (Gruppo Italiano per lo Studio della Sopravvivenza nell’Insufficienza Cardiaca Heart Failure)25 and CORONA (Controlled Rosuvastatin Multinational Trial in Heart Failure),26 which were large, international, well-conducted randomized controlled trials that examined statin use in heart failure.
To answer the question of whether statins benefit individuals after a stroke or transient ischemic attack, we found one relevant study:
SPARCL (Stroke Prevention by Aggressive Reduction in Cholesterol Levels),27 which evaluated the benefit of statins in older adults with a history of stroke or transient ischemic attack. It was a prospective, double-blind, placebo-controlled, international trial conducted at 205 centers. One to 6 months after their cerebrovascular event, patients were randomized to receive either atorvastatin 80 mg or placebo. Given the young age of patients in this trial (mean age 63), we also reviewed a post hoc subgroup analysis of the elderly patients in SPARCL (age > 65).30
HOW DID THE STUDY POPULATION COMPARE WITH THOSE WHO ARE FRAIL?
Frail older adults are almost always excluded from large-scale clinical trials,48 leading to uncertainty about whether the conclusions can be applied to those with advanced frailty.
Although age is an imperfect proxy measure of frailty,49 we consider the age of the study population as well as their comorbidities.
Participants in the studies we reviewed were generally younger and healthier than those who are frail, with mean ages of about 75 or less (Table 1).
PROSPER was the most representative study, as it specifically enrolled older adults, albeit without frailty,13 and excluded people with poor cognitive function as defined by a Mini Mental State Examination score less than 24.
JUPITER enrolled a select population, as described above. The median age in the elderly subgroup was 74 (interquartile range 72–78).29
The Afilalo et al31 meta-analysis primarily included studies of young-elderly patients, with a mean age of less than 70. PROSPER13 was an exception.
The GISSI-HF study,25 which examined the benefit of statins in heart failure, described their study population as frail, although the mean age was only 68. Compared with those in GISSI-HF, the CORONA patients26 with heart failure were older (mean age 73) and had more severe heart failure. Accordingly, it is possible that many of the CORONA participants were frail.
ARE STUDY OUTCOMES CLINICALLY RELEVANT TO THOSE WHO ARE FRAIL?
Because baseline cardiovascular risk increases with age, the elderly should, in theory, experience greater absolute benefit from lipid-lowering. However, there is uncertainty about whether this is true in practice.
Some, but not all, epidemiologic studies show a weaker relationship between cholesterol levels and cardiovascular morbidity and mortality rates in older compared to younger adults.50,51 This may be because those with high cholesterol levels die before they get old (time-related bias), or because those with life-threatening illness may have lower cholesterol levels.50 In addition, classic risk factors such as age, sex, systolic blood pressure, cholesterol values, diabetes, smoking, and left ventricular hypertrophy on electrocardiography may have less power to predict cardiovascular risk among older patients.52
The goal of treatment in frailty is to prevent further disability or improve quality of life. Therefore, meaningful outcomes for lipid-lowering therapy should include symptomatic nonfatal MI and its associated morbidity (eg, heart failure and persistent angina) or symptomatic nonfatal stroke leading to disability. Outcomes without sustained clinical impact, such as transient ischemic attack, nondisabling stroke, or silent MI, while potentially important in other populations, are less relevant in severe frailty. Notably, in many statin studies, outcomes include asymptomatic heart disease (eg, silent MI and “suspected events”) and nondisabling stroke (eg, mild stroke, transient ischemic attack). When symptomatic outcomes are not reported separately, the impact of the reported benefit on quality of life and function is uncertain.
The outcome of all-cause mortality is generally recognized as a gold standard for determining treatment benefit. However, since advanced frailty is characterized by multiple competing causes for mortality, a reduction in all-cause mortality that is achieved by addressing a single issue in nonfrail populations may not extend to the frail.
To more fully understand the impact of lipid-lowering therapy on quality of life and function, we examined the following questions:
Do statins as primary prevention reduce symptomatic heart disease?
Outcomes for coronary heart disease from PROSPER and JUPITER are summarized in Table 2.
PROSPER. In the PROSPER primary prevention group,13 statin therapy did not reduce the combined outcome of coronary heart disease death and nonfatal MI.
The JUPITER trial demonstrated a statistically significant benefit for preventing MI in the elderly subpopulation (ages 70–97),29 but the number needed to treat was high (211 for 2 years), with a wide confidence interval (CI) (95% CI 106–32,924). The trial did not adequately differentiate between symptomatic and asymptomatic events, making it difficult to determine outcome relevance. Also, due to the methodologic limitations of JUPITER as described above, its results should be interpreted with caution.43,44
The CTT Collaborators32 did not report individual outcomes (eg, coronary heart disease) for the elderly low-risk subgroup and, therefore, this meta-analysis does not answer the question of whether statins reduce symptomatic heart disease in primary prevention populations.
Taken together, these findings do not provide convincing evidence that statin therapy as primary prevention reduces the incidence of symptomatic heart disease for severely frail older adults.
Do statins as secondary prevention reduce symptomatic heart disease?
Most studies defined secondary prevention narrowly as treatment for patients with established coronary artery disease. For instance, in the Afilalo et al meta-analysis,31 the small number of studies that included individuals with other forms of vascular disease (such as peripheral vascular disease) enrolled few participants with noncardiac conditions (eg, 29% in PROSPER13 and 13% in the Heart Protection Study20).
Therefore, any evidence of benefit for secondary prevention demonstrated in these studies is most applicable to patients with coronary heart disease, with less certainty for those with other forms of cardiovascular disease.
In PROSPER,13 the secondary prevention group experienced benefit in the combined outcome of coronary heart disease death or nonfatal MI. In the treatment group, 12.7% experienced this outcome compared with 16.8% with placebo, an absolute risk reduction of 4.1% in 3 years (P = .004, number needed to treat 25, 95% CI 15–77). This measure includes coronary heart disease death, an outcome that may not be generalizable to those who are frail. In addition, the outcome of nonfatal MI includes both symptomatic and suspected events. As such, there is uncertainty whether the realized benefit is clinically relevant to frail older adults.
The Afilalo et al meta-analysis31 showed that the number needed to treat to prevent one nonfatal MI was 38 (95% CI 16–118) over 5 years (Table 2). However, this outcome included both symptomatic and asymptomatic (silent) events.
Based on the available data, we conclude that it is not possible to determine whether statins reduce symptomatic heart disease as secondary prevention for older adults who are frail.
Do statins reduce heart disease in combined populations?
In the combined primary and secondary population from PROSPER,13 pravastatin decreased the risk of nonfatal symptomatic MI from 4.3% in the placebo group to 3.4%, a relatively small reduction in absolute risk (0.9%) and not statistically significant by our chi-square calculation (P = .099).
Do statins prevent a first symptomatic stroke in people with or without preexisting cardiovascular disease?
Preventing strokes that cause functional decline is an important outcome for the frail elderly. Stroke outcomes from PROSPER,13 JUPITER,29 and the Afilalo et al meta-analysis31 are summarized in Table 3.
For primary prevention:
In PROSPER (primary prevention),13 there was no statistically significant benefit in the combined outcome of fatal and nonfatal stroke or the single outcome of transient ischemic attack after 3.2 years.
JUPITER,29 in contrast, found that rosuvastatin 20 mg reduced strokes in primary prevention, but the absolute benefit was small. In 2 years, 0.8% of the treatment group had strokes, compared with 1.4% with placebo, an absolute risk reduction of 0.6% (P = .023, number needed to treat 161, 95% CI 86–1,192).
Neither PROSPER nor JUPITER differentiated between disabling and nondisabling strokes.
For secondary prevention:
In PROSPER (secondary prevention),13 there was no statistically significant benefit in the combined outcome of fatal and nonfatal stroke or the single outcome of transient ischemic attack after 3.2 years.
The Afilalo et al secondary prevention meta-analysis demonstrated a 25% relative reduction in stroke (relative risk 0.75, 95% CI 0.56–0.94, number needed to treat 58, 95% CI 27–177).31
Notably, the stroke outcome in Afilalo included both disabling and nondisabling strokes. For example, in the Heart Protection Study,20 the largest study in the Afilalo et al meta-analysis, approximately 50% of nonfatal, classifiable strokes in the overall study population (ie, both younger and older patients) were not disabling. Including disabling and nondisabling strokes in a composite outcome confounds the clinical meaningfulness of these findings in frailty, as the number needed to treat to prevent one disabling stroke cannot be calculated from the data provided.
Do statins prevent a second (symptomatic) stroke in people with a previous stroke?
SPARCL27 (Table 3) examined the question of whether statins decrease the risk of recurrent ischemic stroke for patients with a prior history of stroke or transient ischemic attack. There was a statistically significant reduction in the primary composite outcome of fatal and nonfatal stroke, with 11.2% of the treatment group and 13.1% of the placebo group experiencing this outcome, an absolute risk reduction of 1.9% at 5 years (P = .03; number needed to treat 52, 95% CI 26–1,303). However, the difference in nonfatal stroke, which is the outcome of interest for frailty (since mortality has uncertain relevance), was not statistically significant (10.4% with treatment vs 11.8% with placebo, P =.11).
An exploratory subgroup analysis of SPARCL patients based on age30 showed a smaller, nonsignificant reduction in the primary end point of fatal and nonfatal stroke in the group over age 65 (relative risk 0.90, 95% confidence interval 0.73–1.11, P = .33) compared with the younger group (age < 65) (relative risk 0.74, 95% CI 0.57–0.96, P = .02).
The applicability of these results to the frail elderly is uncertain, since the subgroup analysis was not powered to determine outcomes based on age stratification and there were differences between groups in characteristics such as blood pressure and smoking status. In addition, the outcome of interest, nonfatal stroke, is not provided for the elderly subgroup.
In conclusion, in both primary and secondary prevention populations, the evidence that statins reduce nonfatal, symptomatic stroke rates for older adults is uncertain.
Do statins decrease all-cause mortality for primary or secondary prevention?
Due to competing risks for death, the outcome of mortality may not be relevant to those who are frail; however, studies showed the following:
For primary prevention, there was no decrease in mortality in PROSPER13 or in the elderly subgroup of JUPITER.29
For secondary prevention, an analysis of PROSPER trial data by Afilalo et al31 showed a significant 18% decrease in all-cause mortality (relative risk 0.82, 95% CI 0.69–0.98) using pravastatin 40 mg.
A decrease in all-cause mortality with statins was also reported in the pooled result of the Afilalo et al meta-analysis.31
What are the reported composite outcomes for primary and secondary prevention?
While we were most interested in the symptomatic outcomes described above, we recognize that the small numbers of events make it difficult to draw firm conclusions. Therefore, we also considered composite primary outcomes, even though most included multiple measures that have varying associations with disability and relevancy to frail older adults.
For primary prevention, in the PROSPER preplanned subgroup analysis,13 there was no statistical benefit for any outcome, including the primary composite measure. In contrast, the elderly subpopulation in the JUPITER trial28 showed a treatment benefit with rosuvastatin 20 mg compared with placebo for the primary composite outcome of MI, stroke, cardiovascular death, hospitalization for unstable angina, or revascularization. The number needed to treat for 2 years was 62 (95% CI 39–148).
In the CTT meta-analysis,32 patients at all levels of baseline risk showed benefit up to age 70. However, there was no statistically significant benefit in the composite primary outcome of coronary deaths, nonfatal myocardial infarction, ischemic stroke, or revascularization in the population most representative of elderly primary prevention—those who were more than 70 years old with a 5-year baseline risk of less than 20%.
For secondary prevention, in PROSPER,13 the subpopulation of patients treated for secondary prevention experienced benefit in the primary composite outcome of coronary heart disease death, nonfatal MI, or fatal or nonfatal stroke, achieving a 4% absolute risk reduction with a number needed to treat of 23 (95% CI 14–81) over 3 years.
Do statins decrease disability?
PROSPER was the only study that reported on disability. Compared with placebo, pravastatin did not decrease disability in the total population as measured by basic and instrumental activities of daily living scales.
Do statins help patients with heart failure?
Neither GISSI-HF25 nor CORONA26 found significant benefit from rosuvastatin 10 mg, despite LDL-C lowering of 27% in GISSI-HF and 45% in CORONA.
Do ezetimibe or other nonstatin lipid-lowering agents improve outcomes?
There is no definitive evidence that ezetimibe provides clinically meaningful benefit as a single agent.
For combination therapy, the IMPROVE-IT (Improved Reduction of Outcomes: Vytorin Efficacy International Trial)53 showed that adding ezetimibe 10 mg to simvastatin 40 mg after an acute coronary syndrome reduced the risk of nonfatal myocardial infarction compared with simvastatin monotherapy (event rate 12.8% vs 14.4%; hazard ratio 0.87, 95% CI 0.80–0.95; P = .002) for a population with a mean age of 64. The risk of any stroke was also reduced; strokes occurred in 4.2% of those receiving combination therapy vs 4.8% with monotherapy (hazard ratio 0.86, 95% CI 0.73–1.00, P = .05). After a median of 6 years, 42% of patients in each group had discontinued treatment. Given the very specific clinical scenario of acute coronary syndrome and the young age of the patients in this trial, we do not think that this study justifies the use of ezetimibe for severely frail older adults.
There is no evidence that other combinations (ie, a statin plus another lipid-lowering drug) improve clinical outcomes for either primary or secondary prevention in any population.54
WILL FRAIL PATIENTS LIVE LONG ENOUGH TO BENEFIT?
It is often difficult to determine the number of years that are needed to achieve benefit, as most trials do not provide a statistical analysis of varying time frames.
The PROSPER trial13 lasted 3.2 years. From the Kaplan-Meier curves in PROSPER, we estimate that it took about 1.5 years to achieve a 1% absolute risk reduction and 2.5 years for a 2% absolute risk reduction in coronary heart disease death and nonfatal MI in the combined primary and secondary groups.
JUPITER28 was stopped early at 1.9 years. The Afilalo et al meta-analysis31 was based on follow-up over 4.9 years.
IMPROVE-IT53 reported event rates at 7 years. The authors note that benefit in the primary composite outcome appeared to emerge at 1 year, although no statistical support is given for this statement and divergence in the Kaplan-Meier curves is not visually apparent.
The duration of other studies ranged between 2.7 and 4.9 years (Table 1).26–28
It has been suggested that statins should be considered for elderly patients who have a life expectancy of at least 5 years.3 However, many older adults have already been taking statins for many years, which makes it difficult to interpret the available timeframe evidence.
In a multicenter, unblinded, randomized trial,55 statins were either stopped or continued in older adults who had a short life expectancy and a median survival of approximately 7 months. Causes of death were evenly divided between cancer and noncancer diagnoses, and 22% of the patients were cognitively impaired. Discontinuing statin therapy did not increase mortality or cardiovascular events within 60 days. Nevertheless, stopping statin therapy did not achieve noninferiority for the primary end point, the proportion of participants who died within 60 days. Statin discontinuation was associated with improved quality of life, although the study was not blinded, which could have influenced results.
HAVE THE HARMS BEEN SUFFICIENTLY CONSIDERED?
Frail older adults commonly take multiple medications and are more vulnerable to adverse events.56
Many statins require dose reduction with severe renal impairment (creatinine clearance < 30 mL/min/1.73 m2), which would be a common consideration in severely frail older adults.
Myopathy
Myopathy, which includes myalgias and muscle weakness, is a statin-related adverse event that can impair quality of life. Myopathy typically develops within the first 6 months but can occur at any time during statin treatment.57 When muscle-related adverse effects occur, they may affect the elderly more significantly, particularly their ability to perform activities of daily living, rise from a chair, or mobilize independently. Another concern is that older adults with dementia may not be able to accurately report muscle-related symptoms.
It is difficult to ascertain the true prevalence of myopathy, especially in advanced age and frailty. Randomized controlled trials report incidence rates of 1.5% to 5%, which is comparable to placebo.57,58 However, inconsistent definitions of myopathy and exclusion of subjects with previous statin intolerance or adverse effects during run-in periods limit interpretability.57 Clinical experience suggests that muscle complaints may be relatively common.59–61
Advanced age, female sex, low body mass index, and multisystem disease are all associated with frailty and have also been described as risk factors for statin-associated muscle syndromes.61 Physiologic changes associated with frailty, such as reduced muscle strength, decreased lean body mass, impaired functional mobility, decreased reserve capacity, and altered drug metabolism may increase the risk and severity of myopathy.62
Adverse cognitive events
Meta-analyses of randomized clinical trials and narrative reviews find no definitive relationship between statin therapy and adverse cognitive events.63–67 Nevertheless, there have been case reports of memory loss associated with the use of statins, and the US Food and Drug Administration has issued a warning that statins have been associated with memory loss and confusion.68
It may be difficult to determine whether a statin is causing or aggravating cognitive symptoms among individuals with dementia without a trial withdrawal of the drug.
OUR RECOMMENDATIONS
The recommendations below are intended for adults with severe or very severe frailty (ie, a score of 7 or 8 on the Clinical Frailty Scale11 or FACT5 and therefore apply to most older adults living in long-term care facilities.
Primary prevention
There is no reason to prescribe or continue statins for primary prevention, as it is unlikely that they would provide benefit for outcomes that are relevant in this population.
Secondary prevention
Statin treatment is probably not necessary for secondary prevention in those with severe frailty, although there may be extenuating circumstances that justify statin use.
Heart failure
There is no reason to start or continue statins for heart failure, as there is insufficient evidence that they are effective for this indication in any population.
Ezetimibe
There is no evidence that ezetimibe reduces cardiovascular events in any population when used as monotherapy. For a select population with acute coronary syndromes, ezetimibe has a modest effect. Given the very specific clinical scenario of acute coronary syndrome, we do not think that the available evidence justifies the use of ezetimibe for severely frail older adults.
Agents other than ezetimibe combined with statins
There is no reason to start or continue other lipid-lowering drugs in conjunction with statins.
Statin dosing
As statin adverse effects have the potential to increase with advancing age and frailty, lower doses may be appropriate.68
Adverse events
Consider stopping statins on a trial basis if there is concern regarding myopathy, drug interactions, or other adverse effects.
BOTTOM LINE: DO STATINS IMPROVE QUALITY OF LIFE OR FUNCTION?
In primary prevention for older adults, there is doubt that statins prevent cardiovascular disease and stroke-related events because the main study involving the elderly did not show a benefit in the primary prevention subgroup.13 Additionally, there is no conclusive evidence that statin treatment decreases mortality in primary prevention.13,29
There is insufficient information to determine whether the frail elderly should receive statins for secondary prevention. Although there is evidence that treatment decreases measures of coronary heart disease and stroke, it is unclear whether it improves quality of life or function for those who are frail. To answer this question, we need more information about whether reported outcomes (such as stroke and MI) are associated with disability, which is not provided in many of the studies we reviewed. When disability was specifically considered in the PROSPER trial for the combined population of primary and secondary prevention, treatment with statins had no impact on basic and instrumental activities of daily living.
Some experts may not agree with our interpretation of the complex evidence presented in this article. Others may ask, “What is the harm in using statins, even if there is no definitive benefit?” However, the harms associated with statin therapy for the frail are poorly defined. In the face of these uncertainties and in the absence of definitive improvement in quality of life, we believe that “less is more” in the context of severe frailty.69
The cost of medications should also be considered, especially in long-term care facilities, where there is an added expense of drug administration that diverts human resources away from interactions that are more congruent with respecting the lifestage of frailty.
Careful review of evidence before applying clinical practice guidelines to those who are frail should become the norm. When considering treatment of frail patients, the five questions described in this review shed light on the applicability of clinical trial evidence. Therapies that are highly effective in healthier populations may be less effective when individuals are severely frail. Accordingly, we propose that medications should only be used if they improve quality of life or function.
Frail elderly patients are at high risk of adverse clinical outcomes, including those due to polypharmacy. Several groups tackle “deprescribing” by developing lists of medications that are potentially inappropriate for the elderly, such as the Beers or STOPP/START criteria.1–4
See related editorialIn contrast, our group (the Palliative and Therapeutic Harmonization [PATH] program and the Dalhousie Academic Detailing Service) has developed evidence-based, frailty-specific guidelines for treating hypertension5 and diabetes,6 in which we advocate less-stringent treatment targets and tapering or discontinuing medications, as needed.
The PATH program7 is a clinical approach that prioritizes the consideration of frailty when making treatment decisions. The Dalhousie Academic Detailing Service collaborates with the Nova Scotia Health Authority to research and develop evidence-informed educational messages about the treatment of common medical conditions.
Here, we address lipid-lowering therapy in this population.
CONSIDERING FRAILTY
Frailty is defined in several ways. The Fried model8,9 identifies frailty when 3 of the following characteristics are present: unintentional weight loss, exhaustion, muscle weakness, slow walking speed, or low levels of activity. The Clinical Frailty Scale10,11 and the Frailty Assessment for Care-planning Tool (FACT)5 use deficits in cognition, function, and mobility to define frailty. According to these scales, people are considered severely frail when they require assistance with basic activities of daily living (such as bathing or dressing), owing to cognitive or physical deficits from any cause.
In reviewing the evidence, we consider five questions:
- What is the quality of the evidence? (Up to 48% of clinical practice guideline recommendations may be based on low-level evidence or expert opinion.12)
- How did the study population compare with the frail?
- Are study outcomes and potential benefits clinically relevant to those who are frail?
- How long did it take for the clinical benefit of a treatment to become apparent, and are the frail elderly likely to live that long?
- Have the harms of treatment been sufficiently considered?
WHAT IS THE QUALITY OF THE EVIDENCE?
We found no studies that specifically evaluated the benefit of lipid-lowering for severely frail older adults. Therefore, we examined randomized controlled trials that enrolled non-frail older adults,13–28 subgroup analyses of randomized controlled trials,29,30 meta-analyses that analyzed subgroups of elderly populations,31,32 and publications describing the study designs of randomized controlled trials.33–37
Most of the evidence comes from post hoc subgroup analyses of elderly populations. Although meta-analysis is commonly used to compare subgroups, the Cochrane handbook and others consider subgroup comparisons observational by nature.38,39 (See Table 1 for lipid-lowering studies discussed in this article.)
Studies of statins for primary prevention of cardiovascular disease
For evidence of benefit from lipid-lowering for primary prevention (ie, to reduce the risk of cardiovascular events in patients with no known cardiovascular disease at baseline but at increased risk), we reviewed the meta-analysis conducted by the Cholesterol Treatment Trialists’ (CTT) Collaborators.32 Since this meta-analysis included the major trials that enrolled elderly patients, individual publications of post hoc, elderly subgroups were, for the most part, not examined individually. The exception to this approach was a decision to report on the PROSPER13 and JUPITER28 trials separately, because PROSPER is the most representative of the elderly population and JUPITER reached the lowest LDL-C of primary prevention trials published to date and included a large elderly subgroup (n = 5,695).
Savarese et al40 evaluated the benefits of statins for older adults who did not have established cardiovascular disease. We did not report on this meta-analysis, as not all of the subjects that populated the meta-analysis were representative of a typical prevention population. For instance, in the Anglo-Scandinavian Cardiac Outcomes Trial lipid-lowering arm,41 14% of the subjects had had a previous stroke or transient ischemic attack. In the Antihypertensive and Lipid-Lowering Treatment Trial,42 16% of the population had a family history of premature coronary heart disease.
In addition, all the trials in the Savarese meta-analysis were also included in the CTT meta-analysis.32 The CTT reports on baseline risk using patient-level data stratified by age and risk, which may be more relevant to the question of primary prevention for older adults, as highlighted in our review.
PROSPER (Prospective Study of Pravastatin in the Elderly at Risk),13 a well-conducted, double-blind, randomized controlled trial with low probability of bias, compared pravastatin 40 mg and placebo. It was the only study that specifically enrolled older adults, with prespecified analysis of primary and secondary prevention subgroups. The primary prevention subgroup accounted for 56% of the 5,084 participants.
JUPITER (Justification for the Use of Statins in Prevention)28 compared rosuvastatin 20 mg and placebo in 17,802 participants. All had low-density lipoprotein cholesterol (LDL-C) levels below 3.4 mmol/L (130 mg/dL) and elevated levels of the inflammatory biomarker high-sensitivity C-reactive protein (hsCRP), ie, 2 mg/L or higher. Subsequently, Glynn et al performed a post hoc, exploratory subgroup analysis of elderly participants (N = 5,695).29
The JUPITER trial had several limitations.43,44 The planned follow-up period was 5 years, but the trial was stopped early at 1.9 years, after a statistically significant difference was detected in the primary composite outcome of reduction in all vascular events. Studies that are stopped early may exaggerate positive findings.45
Further, JUPITER’s patients were a select group, with normal LDL-C levels, elevated hsCRP values, and without diabetes. Of 90,000 patients screened, 72,000 (80%) did not meet the inclusion criteria and were not enrolled. This high rate of exclusion limits the generalizability of study findings beyond the shortcomings of post hoc subgroup analysis.
The meta-analysis performed by the CTT Collaborators32 used individual participant data from large-scale randomized trials of lipid-modifying treatment. This analysis was specific to people at low risk of vascular disease. In a supplementary appendix, the authors described the reduction in major vascular events for each 1.0 mmol/L decrease in LDL-C in three age categories: under age 60, ages 61 to 70, and over age 70.
The authors also stratified the results by risk category and provided information about those with a risk of major vascular events of less than 20%, which would be more representative of a purer primary prevention population.
For the elderly subgroup at low risk, the CTT Collaborators32 only reported a composite of major vascular events (coronary death, nonfatal myocardial infarction [MI], ischemic stroke, or revascularization) and did not describe individual outcomes, such as prevention of coronary heart disease.
Study results are based on postrandomization findings and therefore may be observational, not experimental.46
Studies of statins for secondary prevention of cardiovascular disease
The aim of secondary prevention is to reduce the risk of recurrent cardiovascular events in patients who already have cardiovascular disease.
To address the question of whether statins reduce cardiovascular risk, we reviewed:
PROSPER,13 which included a preplanned analysis of the secondary prevention population.
Afilalo et al,31,47 who performed a meta-analysis of the elderly subgroups of nine major secondary prevention studies (19,569 patients) using published and unpublished data.
To address the question of whether statins benefit individuals with heart failure, we found two relevant studies:
GISSI-HF (Gruppo Italiano per lo Studio della Sopravvivenza nell’Insufficienza Cardiaca Heart Failure)25 and CORONA (Controlled Rosuvastatin Multinational Trial in Heart Failure),26 which were large, international, well-conducted randomized controlled trials that examined statin use in heart failure.
To answer the question of whether statins benefit individuals after a stroke or transient ischemic attack, we found one relevant study:
SPARCL (Stroke Prevention by Aggressive Reduction in Cholesterol Levels),27 which evaluated the benefit of statins in older adults with a history of stroke or transient ischemic attack. It was a prospective, double-blind, placebo-controlled, international trial conducted at 205 centers. One to 6 months after their cerebrovascular event, patients were randomized to receive either atorvastatin 80 mg or placebo. Given the young age of patients in this trial (mean age 63), we also reviewed a post hoc subgroup analysis of the elderly patients in SPARCL (age > 65).30
HOW DID THE STUDY POPULATION COMPARE WITH THOSE WHO ARE FRAIL?
Frail older adults are almost always excluded from large-scale clinical trials,48 leading to uncertainty about whether the conclusions can be applied to those with advanced frailty.
Although age is an imperfect proxy measure of frailty,49 we consider the age of the study population as well as their comorbidities.
Participants in the studies we reviewed were generally younger and healthier than those who are frail, with mean ages of about 75 or less (Table 1).
PROSPER was the most representative study, as it specifically enrolled older adults, albeit without frailty,13 and excluded people with poor cognitive function as defined by a Mini Mental State Examination score less than 24.
JUPITER enrolled a select population, as described above. The median age in the elderly subgroup was 74 (interquartile range 72–78).29
The Afilalo et al31 meta-analysis primarily included studies of young-elderly patients, with a mean age of less than 70. PROSPER13 was an exception.
The GISSI-HF study,25 which examined the benefit of statins in heart failure, described their study population as frail, although the mean age was only 68. Compared with those in GISSI-HF, the CORONA patients26 with heart failure were older (mean age 73) and had more severe heart failure. Accordingly, it is possible that many of the CORONA participants were frail.
ARE STUDY OUTCOMES CLINICALLY RELEVANT TO THOSE WHO ARE FRAIL?
Because baseline cardiovascular risk increases with age, the elderly should, in theory, experience greater absolute benefit from lipid-lowering. However, there is uncertainty about whether this is true in practice.
Some, but not all, epidemiologic studies show a weaker relationship between cholesterol levels and cardiovascular morbidity and mortality rates in older compared to younger adults.50,51 This may be because those with high cholesterol levels die before they get old (time-related bias), or because those with life-threatening illness may have lower cholesterol levels.50 In addition, classic risk factors such as age, sex, systolic blood pressure, cholesterol values, diabetes, smoking, and left ventricular hypertrophy on electrocardiography may have less power to predict cardiovascular risk among older patients.52
The goal of treatment in frailty is to prevent further disability or improve quality of life. Therefore, meaningful outcomes for lipid-lowering therapy should include symptomatic nonfatal MI and its associated morbidity (eg, heart failure and persistent angina) or symptomatic nonfatal stroke leading to disability. Outcomes without sustained clinical impact, such as transient ischemic attack, nondisabling stroke, or silent MI, while potentially important in other populations, are less relevant in severe frailty. Notably, in many statin studies, outcomes include asymptomatic heart disease (eg, silent MI and “suspected events”) and nondisabling stroke (eg, mild stroke, transient ischemic attack). When symptomatic outcomes are not reported separately, the impact of the reported benefit on quality of life and function is uncertain.
The outcome of all-cause mortality is generally recognized as a gold standard for determining treatment benefit. However, since advanced frailty is characterized by multiple competing causes for mortality, a reduction in all-cause mortality that is achieved by addressing a single issue in nonfrail populations may not extend to the frail.
To more fully understand the impact of lipid-lowering therapy on quality of life and function, we examined the following questions:
Do statins as primary prevention reduce symptomatic heart disease?
Outcomes for coronary heart disease from PROSPER and JUPITER are summarized in Table 2.
PROSPER. In the PROSPER primary prevention group,13 statin therapy did not reduce the combined outcome of coronary heart disease death and nonfatal MI.
The JUPITER trial demonstrated a statistically significant benefit for preventing MI in the elderly subpopulation (ages 70–97),29 but the number needed to treat was high (211 for 2 years), with a wide confidence interval (CI) (95% CI 106–32,924). The trial did not adequately differentiate between symptomatic and asymptomatic events, making it difficult to determine outcome relevance. Also, due to the methodologic limitations of JUPITER as described above, its results should be interpreted with caution.43,44
The CTT Collaborators32 did not report individual outcomes (eg, coronary heart disease) for the elderly low-risk subgroup and, therefore, this meta-analysis does not answer the question of whether statins reduce symptomatic heart disease in primary prevention populations.
Taken together, these findings do not provide convincing evidence that statin therapy as primary prevention reduces the incidence of symptomatic heart disease for severely frail older adults.
Do statins as secondary prevention reduce symptomatic heart disease?
Most studies defined secondary prevention narrowly as treatment for patients with established coronary artery disease. For instance, in the Afilalo et al meta-analysis,31 the small number of studies that included individuals with other forms of vascular disease (such as peripheral vascular disease) enrolled few participants with noncardiac conditions (eg, 29% in PROSPER13 and 13% in the Heart Protection Study20).
Therefore, any evidence of benefit for secondary prevention demonstrated in these studies is most applicable to patients with coronary heart disease, with less certainty for those with other forms of cardiovascular disease.
In PROSPER,13 the secondary prevention group experienced benefit in the combined outcome of coronary heart disease death or nonfatal MI. In the treatment group, 12.7% experienced this outcome compared with 16.8% with placebo, an absolute risk reduction of 4.1% in 3 years (P = .004, number needed to treat 25, 95% CI 15–77). This measure includes coronary heart disease death, an outcome that may not be generalizable to those who are frail. In addition, the outcome of nonfatal MI includes both symptomatic and suspected events. As such, there is uncertainty whether the realized benefit is clinically relevant to frail older adults.
The Afilalo et al meta-analysis31 showed that the number needed to treat to prevent one nonfatal MI was 38 (95% CI 16–118) over 5 years (Table 2). However, this outcome included both symptomatic and asymptomatic (silent) events.
Based on the available data, we conclude that it is not possible to determine whether statins reduce symptomatic heart disease as secondary prevention for older adults who are frail.
Do statins reduce heart disease in combined populations?
In the combined primary and secondary population from PROSPER,13 pravastatin decreased the risk of nonfatal symptomatic MI from 4.3% in the placebo group to 3.4%, a relatively small reduction in absolute risk (0.9%) and not statistically significant by our chi-square calculation (P = .099).
Do statins prevent a first symptomatic stroke in people with or without preexisting cardiovascular disease?
Preventing strokes that cause functional decline is an important outcome for the frail elderly. Stroke outcomes from PROSPER,13 JUPITER,29 and the Afilalo et al meta-analysis31 are summarized in Table 3.
For primary prevention:
In PROSPER (primary prevention),13 there was no statistically significant benefit in the combined outcome of fatal and nonfatal stroke or the single outcome of transient ischemic attack after 3.2 years.
JUPITER,29 in contrast, found that rosuvastatin 20 mg reduced strokes in primary prevention, but the absolute benefit was small. In 2 years, 0.8% of the treatment group had strokes, compared with 1.4% with placebo, an absolute risk reduction of 0.6% (P = .023, number needed to treat 161, 95% CI 86–1,192).
Neither PROSPER nor JUPITER differentiated between disabling and nondisabling strokes.
For secondary prevention:
In PROSPER (secondary prevention),13 there was no statistically significant benefit in the combined outcome of fatal and nonfatal stroke or the single outcome of transient ischemic attack after 3.2 years.
The Afilalo et al secondary prevention meta-analysis demonstrated a 25% relative reduction in stroke (relative risk 0.75, 95% CI 0.56–0.94, number needed to treat 58, 95% CI 27–177).31
Notably, the stroke outcome in Afilalo included both disabling and nondisabling strokes. For example, in the Heart Protection Study,20 the largest study in the Afilalo et al meta-analysis, approximately 50% of nonfatal, classifiable strokes in the overall study population (ie, both younger and older patients) were not disabling. Including disabling and nondisabling strokes in a composite outcome confounds the clinical meaningfulness of these findings in frailty, as the number needed to treat to prevent one disabling stroke cannot be calculated from the data provided.
Do statins prevent a second (symptomatic) stroke in people with a previous stroke?
SPARCL27 (Table 3) examined the question of whether statins decrease the risk of recurrent ischemic stroke for patients with a prior history of stroke or transient ischemic attack. There was a statistically significant reduction in the primary composite outcome of fatal and nonfatal stroke, with 11.2% of the treatment group and 13.1% of the placebo group experiencing this outcome, an absolute risk reduction of 1.9% at 5 years (P = .03; number needed to treat 52, 95% CI 26–1,303). However, the difference in nonfatal stroke, which is the outcome of interest for frailty (since mortality has uncertain relevance), was not statistically significant (10.4% with treatment vs 11.8% with placebo, P =.11).
An exploratory subgroup analysis of SPARCL patients based on age30 showed a smaller, nonsignificant reduction in the primary end point of fatal and nonfatal stroke in the group over age 65 (relative risk 0.90, 95% confidence interval 0.73–1.11, P = .33) compared with the younger group (age < 65) (relative risk 0.74, 95% CI 0.57–0.96, P = .02).
The applicability of these results to the frail elderly is uncertain, since the subgroup analysis was not powered to determine outcomes based on age stratification and there were differences between groups in characteristics such as blood pressure and smoking status. In addition, the outcome of interest, nonfatal stroke, is not provided for the elderly subgroup.
In conclusion, in both primary and secondary prevention populations, the evidence that statins reduce nonfatal, symptomatic stroke rates for older adults is uncertain.
Do statins decrease all-cause mortality for primary or secondary prevention?
Due to competing risks for death, the outcome of mortality may not be relevant to those who are frail; however, studies showed the following:
For primary prevention, there was no decrease in mortality in PROSPER13 or in the elderly subgroup of JUPITER.29
For secondary prevention, an analysis of PROSPER trial data by Afilalo et al31 showed a significant 18% decrease in all-cause mortality (relative risk 0.82, 95% CI 0.69–0.98) using pravastatin 40 mg.
A decrease in all-cause mortality with statins was also reported in the pooled result of the Afilalo et al meta-analysis.31
What are the reported composite outcomes for primary and secondary prevention?
While we were most interested in the symptomatic outcomes described above, we recognize that the small numbers of events make it difficult to draw firm conclusions. Therefore, we also considered composite primary outcomes, even though most included multiple measures that have varying associations with disability and relevancy to frail older adults.
For primary prevention, in the PROSPER preplanned subgroup analysis,13 there was no statistical benefit for any outcome, including the primary composite measure. In contrast, the elderly subpopulation in the JUPITER trial28 showed a treatment benefit with rosuvastatin 20 mg compared with placebo for the primary composite outcome of MI, stroke, cardiovascular death, hospitalization for unstable angina, or revascularization. The number needed to treat for 2 years was 62 (95% CI 39–148).
In the CTT meta-analysis,32 patients at all levels of baseline risk showed benefit up to age 70. However, there was no statistically significant benefit in the composite primary outcome of coronary deaths, nonfatal myocardial infarction, ischemic stroke, or revascularization in the population most representative of elderly primary prevention—those who were more than 70 years old with a 5-year baseline risk of less than 20%.
For secondary prevention, in PROSPER,13 the subpopulation of patients treated for secondary prevention experienced benefit in the primary composite outcome of coronary heart disease death, nonfatal MI, or fatal or nonfatal stroke, achieving a 4% absolute risk reduction with a number needed to treat of 23 (95% CI 14–81) over 3 years.
Do statins decrease disability?
PROSPER was the only study that reported on disability. Compared with placebo, pravastatin did not decrease disability in the total population as measured by basic and instrumental activities of daily living scales.
Do statins help patients with heart failure?
Neither GISSI-HF25 nor CORONA26 found significant benefit from rosuvastatin 10 mg, despite LDL-C lowering of 27% in GISSI-HF and 45% in CORONA.
Do ezetimibe or other nonstatin lipid-lowering agents improve outcomes?
There is no definitive evidence that ezetimibe provides clinically meaningful benefit as a single agent.
For combination therapy, the IMPROVE-IT (Improved Reduction of Outcomes: Vytorin Efficacy International Trial)53 showed that adding ezetimibe 10 mg to simvastatin 40 mg after an acute coronary syndrome reduced the risk of nonfatal myocardial infarction compared with simvastatin monotherapy (event rate 12.8% vs 14.4%; hazard ratio 0.87, 95% CI 0.80–0.95; P = .002) for a population with a mean age of 64. The risk of any stroke was also reduced; strokes occurred in 4.2% of those receiving combination therapy vs 4.8% with monotherapy (hazard ratio 0.86, 95% CI 0.73–1.00, P = .05). After a median of 6 years, 42% of patients in each group had discontinued treatment. Given the very specific clinical scenario of acute coronary syndrome and the young age of the patients in this trial, we do not think that this study justifies the use of ezetimibe for severely frail older adults.
There is no evidence that other combinations (ie, a statin plus another lipid-lowering drug) improve clinical outcomes for either primary or secondary prevention in any population.54
WILL FRAIL PATIENTS LIVE LONG ENOUGH TO BENEFIT?
It is often difficult to determine the number of years that are needed to achieve benefit, as most trials do not provide a statistical analysis of varying time frames.
The PROSPER trial13 lasted 3.2 years. From the Kaplan-Meier curves in PROSPER, we estimate that it took about 1.5 years to achieve a 1% absolute risk reduction and 2.5 years for a 2% absolute risk reduction in coronary heart disease death and nonfatal MI in the combined primary and secondary groups.
JUPITER28 was stopped early at 1.9 years. The Afilalo et al meta-analysis31 was based on follow-up over 4.9 years.
IMPROVE-IT53 reported event rates at 7 years. The authors note that benefit in the primary composite outcome appeared to emerge at 1 year, although no statistical support is given for this statement and divergence in the Kaplan-Meier curves is not visually apparent.
The duration of other studies ranged between 2.7 and 4.9 years (Table 1).26–28
It has been suggested that statins should be considered for elderly patients who have a life expectancy of at least 5 years.3 However, many older adults have already been taking statins for many years, which makes it difficult to interpret the available timeframe evidence.
In a multicenter, unblinded, randomized trial,55 statins were either stopped or continued in older adults who had a short life expectancy and a median survival of approximately 7 months. Causes of death were evenly divided between cancer and noncancer diagnoses, and 22% of the patients were cognitively impaired. Discontinuing statin therapy did not increase mortality or cardiovascular events within 60 days. Nevertheless, stopping statin therapy did not achieve noninferiority for the primary end point, the proportion of participants who died within 60 days. Statin discontinuation was associated with improved quality of life, although the study was not blinded, which could have influenced results.
HAVE THE HARMS BEEN SUFFICIENTLY CONSIDERED?
Frail older adults commonly take multiple medications and are more vulnerable to adverse events.56
Many statins require dose reduction with severe renal impairment (creatinine clearance < 30 mL/min/1.73 m2), which would be a common consideration in severely frail older adults.
Myopathy
Myopathy, which includes myalgias and muscle weakness, is a statin-related adverse event that can impair quality of life. Myopathy typically develops within the first 6 months but can occur at any time during statin treatment.57 When muscle-related adverse effects occur, they may affect the elderly more significantly, particularly their ability to perform activities of daily living, rise from a chair, or mobilize independently. Another concern is that older adults with dementia may not be able to accurately report muscle-related symptoms.
It is difficult to ascertain the true prevalence of myopathy, especially in advanced age and frailty. Randomized controlled trials report incidence rates of 1.5% to 5%, which is comparable to placebo.57,58 However, inconsistent definitions of myopathy and exclusion of subjects with previous statin intolerance or adverse effects during run-in periods limit interpretability.57 Clinical experience suggests that muscle complaints may be relatively common.59–61
Advanced age, female sex, low body mass index, and multisystem disease are all associated with frailty and have also been described as risk factors for statin-associated muscle syndromes.61 Physiologic changes associated with frailty, such as reduced muscle strength, decreased lean body mass, impaired functional mobility, decreased reserve capacity, and altered drug metabolism may increase the risk and severity of myopathy.62
Adverse cognitive events
Meta-analyses of randomized clinical trials and narrative reviews find no definitive relationship between statin therapy and adverse cognitive events.63–67 Nevertheless, there have been case reports of memory loss associated with the use of statins, and the US Food and Drug Administration has issued a warning that statins have been associated with memory loss and confusion.68
It may be difficult to determine whether a statin is causing or aggravating cognitive symptoms among individuals with dementia without a trial withdrawal of the drug.
OUR RECOMMENDATIONS
The recommendations below are intended for adults with severe or very severe frailty (ie, a score of 7 or 8 on the Clinical Frailty Scale11 or FACT5 and therefore apply to most older adults living in long-term care facilities.
Primary prevention
There is no reason to prescribe or continue statins for primary prevention, as it is unlikely that they would provide benefit for outcomes that are relevant in this population.
Secondary prevention
Statin treatment is probably not necessary for secondary prevention in those with severe frailty, although there may be extenuating circumstances that justify statin use.
Heart failure
There is no reason to start or continue statins for heart failure, as there is insufficient evidence that they are effective for this indication in any population.
Ezetimibe
There is no evidence that ezetimibe reduces cardiovascular events in any population when used as monotherapy. For a select population with acute coronary syndromes, ezetimibe has a modest effect. Given the very specific clinical scenario of acute coronary syndrome, we do not think that the available evidence justifies the use of ezetimibe for severely frail older adults.
Agents other than ezetimibe combined with statins
There is no reason to start or continue other lipid-lowering drugs in conjunction with statins.
Statin dosing
As statin adverse effects have the potential to increase with advancing age and frailty, lower doses may be appropriate.68
Adverse events
Consider stopping statins on a trial basis if there is concern regarding myopathy, drug interactions, or other adverse effects.
BOTTOM LINE: DO STATINS IMPROVE QUALITY OF LIFE OR FUNCTION?
In primary prevention for older adults, there is doubt that statins prevent cardiovascular disease and stroke-related events because the main study involving the elderly did not show a benefit in the primary prevention subgroup.13 Additionally, there is no conclusive evidence that statin treatment decreases mortality in primary prevention.13,29
There is insufficient information to determine whether the frail elderly should receive statins for secondary prevention. Although there is evidence that treatment decreases measures of coronary heart disease and stroke, it is unclear whether it improves quality of life or function for those who are frail. To answer this question, we need more information about whether reported outcomes (such as stroke and MI) are associated with disability, which is not provided in many of the studies we reviewed. When disability was specifically considered in the PROSPER trial for the combined population of primary and secondary prevention, treatment with statins had no impact on basic and instrumental activities of daily living.
Some experts may not agree with our interpretation of the complex evidence presented in this article. Others may ask, “What is the harm in using statins, even if there is no definitive benefit?” However, the harms associated with statin therapy for the frail are poorly defined. In the face of these uncertainties and in the absence of definitive improvement in quality of life, we believe that “less is more” in the context of severe frailty.69
The cost of medications should also be considered, especially in long-term care facilities, where there is an added expense of drug administration that diverts human resources away from interactions that are more congruent with respecting the lifestage of frailty.
Careful review of evidence before applying clinical practice guidelines to those who are frail should become the norm. When considering treatment of frail patients, the five questions described in this review shed light on the applicability of clinical trial evidence. Therapies that are highly effective in healthier populations may be less effective when individuals are severely frail. Accordingly, we propose that medications should only be used if they improve quality of life or function.
- Ontario Pharmacy Research Collaboration. Deprescribing guidelines for the elderly. www.open-pharmacy-research.ca/research-projects/emerging-services/deprescribing-guidelines. Accessed December 28, 2016.
- Scott IA, Hilmer SN, Reeve E, et al. Reducing inappropriate polypharmacy: the process of deprescribing. JAMA Intern Med 2015; 175:827–834.
- O’Mahony D, O’Sullivan D, Byrne S, O’Connor MN, Ryan C, Gallagher P. STOPP/START criteria for potentially inappropriate prescribing in older people: version 2. Age Ageing 2015; 44:213–218.
- American Geriatrics Society 2012 Beers Criteria Update Expert Panel. American Geriatrics Society updated Beers Criteria for potentially inappropriate medication use in older adults. J Am Geriatr Soc 2012; 60:616–631.
- Mallery LH, Allen M, Fleming I, et al. Promoting higher blood pressure targets for frail older adults: a consensus guideline from Canada. Cleve Clin J Med 2014; 81:427–437.
- Mallery LH, Ransom T, Steeves B, Cook B, Dunbar P, Moorhouse P. Evidence-informed guidelines for treating frail older adults with type 2 diabetes: from the Diabetes Care Program of Nova Scotia (DCPNS) and the Palliative and Therapeutic Harmonization (PATH) program. J Am Med Dir Assoc 2013; 14:801–808.
- Moorhouse P, Mallery L. Palliative and therapeutic harmonization: a model for appropriate decision-making in frail older adults. J Am Geriatr Soc 2012; 60:2326–2332.
- Fried LP, Tangen CM, Walston J, et al; Cardiovascular Health Study Collaborative Research Group. Frailty in older adults: evidence for a phenotype. J Gerontol A Biol Sci Med Sci 2001; 56:M146–M156.
- Morley JE, Malmstrom TK, Miller DK. A simple frailty questionnaire (FRAIL) predicts outcomes in middle aged African Americans. J Nutr Health Aging 2012; 16:601–608.
- Rockwood K, Song Z, MacKnight C, et al. A global clinical measure of fitness and frailty in elderly people. CMAJ 2005; 173:489–495.
- Morley JE, Vellas B, van Kan GA, et al. Frailty consensus: a call to action. J Am Med Dir Assoc 2013; 14:392–397.
- Tricoci P, Allen JM, Kramer JM, Califf RM, Smith SC Jr. Scientific evidence underlying the ACC/AHA clinical practice guidelines. JAMA 2009; 301:831–841.
- Shepherd J, Blauw GJ, Murphy MB, et al; PROSPER study group. PROspective Study of Pravastatin in the Elderly at Risk. Pravastatin in elderly individuals at risk of vascular disease (PROSPER): a randomised controlled trial. Lancet 2002; 360:1623–1630.
- Randomised trial of cholesterol lowering in 4444 patients with coronary heart disease: the Scandinavian Simvastatin Survival Study (4S). Lancet 1994; 344:1383–1389.
- Miettien TA, Pyorala K, Olsson AG, et al. Cholesterol-lowering therapy in women and elderly patients with myocardial infarction or angina pectoris: findings from the Scandinavian Simvastatin Study Group (4S). Circulation 1997; 96:4211–4218.
- Lewis SJ, Moye LA, Sacks FM, et al. Effect of pravastatin on cardiovascular events in older patients with myocardial infarction and cholesterol levels in the average range. Results of the Cholesterol and Recurrent Events (CARE) trial. Ann Intern Med 1998; 129:681–689.
- Hunt D, Young P, Simes J, et al. Benefits of pravastatin on cardiovascular events and mortality in older patients with coronary heart disease are equal to or exceed those seen in younger patients: results from the LIPID trial. Ann Intern Med 2001; 134:931–940.
- Prevention of cardiovascular events and death with pravastatin in patients with coronary heart disease and a broad range of initial cholesterol levels. The Long-Term Intervention with Pravastatin in Ischaemic Disease (LIPID) Study Group. N Engl J Med 1998; 339:1349–1357.
- Heart Protection Study Collaborative Group. The effects of cholesterol lowering with simvastatin on cause-specific mortality and on cancer incidence in 20,536 high-risk people: a randomized placebo-controlled trial. BMC Med 2005; 3:6.
- Heart Protection Study Collaborative Group. MRC/BHF Heart Protection Study of cholesterol lowering with simvastatin in 20,536 high-risk individuals: a randomized placebo-controlled trial. Lancet 2002; 360:7–22.
- Pitt B, Mancini GB, Ellis SG, Rosman HS, Park JS, McGovern ME. Pravastatin limitation of atherosclerosis in the coronary arteries (PLAC 1): reduction in atherosclerosis progression and clinical events. PLAC 1 investigation. J Am Coll Cardiol 1995; 26:1133–1139.
- Jukema JW, Bruschke AV, van Boven AJ, et al. Effects of lipid lowering by pravastatin on progression and regression of coronary artery disease in symptomatic men with normal to moderately elevated serum cholesterol levels. The Regression Growth Evaluation Statin Study (REGRESS). Circulation 1995; 91:2528–2540.
- Serruys PW, Foley DP, Jackson G, et al. A randomized placebo-controlled trial of fluvastatin for prevention of restenosis after successful coronary balloon angioplasty; final results of the fluvastatin angiographic restenosis (FLARE) trial. Eur Heart J 1999; 20:58–69.
- Serruys PW, de Feyter P, Macaya C, et al; Lescol Intervention Prevention Study (LIPS) Investigators. Fluvastatin for prevention of cardiac events following successful first percutaneous coronary intervention: a randomized controlled trial. JAMA 2002; 287:3215–3222.
- Tavazzi L, Maggioni AP, Marchioli R, et al; Gissi-HF Investigators. Effect of rosuvastatin in patients with chronic heart failure (the GISSI-HF trial): a randomized, double-blind, placebo-controlled trial. Lancet 2008; 372:1231–1239.
- Kjekshus J, Apatrei E, Barrios V, et al; CORONA Group. Rosuvastatin in older patients with systolic heart failure. N Engl J Med 2007; 357:2248–2261.
- Amarenco P, Bogousslavsky J, Callahan A, et al; Stroke Prevention by Aggressive Reduction in Cholesterol Levels (SPARCL) Investigators. High-dose atorvastatin after stroke or transient ischemic attack. N Engl J Med 2006; 355:549–559.
- Ridker PM, Danielson E, Fonseca FA, et al; JUPITER Study Group. Rosuvastatin to prevent vascular events in men and women with elevated C-reactive protein. N Engl J Med 2008; 359:2195–2207.
- Glynn RJ, Koenig W, Nordestgaard BG, Shepherd J, Ridker PM. Rosuvastatin for primary prevention in older persons with elevated C-reactive protein and low to average low-density lipoprotein cholesterol levels: exploratory analysis of a randomized trial. Ann Intern Med 2010; 152:488–496, W174.
- Chaturvedi S, Zivin J, Breazna A, et al; SPARCL Investigators. Effect of atorvastatin in elderly patients with a recent stroke or transient ischemic attack. Neurology 2009; 72:688–694.
- Afilalo J, Duque G, Steele R, Jukema JW, de Craen AJ, Eisenberg MJ. Statins for secondary prevention in elderly patients: a hierarchical bayesian meta-analysis. J Am Coll Cardiol 2008; 51:37–45.
- Cholesterol Treatment Trialists’ (CTT) Collaborators; Mihaylova B, Emberson J, Blackwell L, et al. The effects of lowering LDL cholesterol with statin therapy in people at low risk of vascular disease: meta-analysis of individual data from 27 randomised trials. Lancet 2012; 380:581– 590.
- Sacks FM, Pfeffer MA, Moye L, et al. Rationale and design of a secondary prevention trial of lowering normal plasma cholesterol levels after acute myocardial infarction: the Cholesterol and Recurrent Events (CARE). Am J Cardiol 1991; 68:1436–1446.
- Armitage J, Collins R. Need for large scale randomised evidence about lowering LDL cholesterol in people with diabetes mellitus: MRC/BHF Heart Protection Study and other major trials. Heart 2000; 84:357–360.
- Design features and baseline characteristics of the LIPID (Long-Term Intervention with Pravastatin in Ischemic Disease) study: a randomized trial in patients with previous acute myocardial infarction and/or unstable angina pectoris. Am J Cardiol 1995; 76:474–479.
- Shepherd J, Blauw GJ, Murphy MB, et al. The design of a prospective study of Pravastatin in the Elderly at Risk (PROSPER). Am J Cardiol 1999; 84:1192–1197.
- Amarenco P, Bogousslavsky J, Callahan AS, et al; SPARCL Investigators. Design and baseline characteristics of the stroke prevention by aggressive reduction in cholesterol levels (SPARCL) study. Cerebrovasc Dis 2003; 16:389–395.
- Interpretation of subgroup analyses and meta-regressions. In: Higgins JPT, Green S, editors. Cochrane Handbook for Systematic Reviews of Interventions Version 5.1.0. The Cochrane Collaboration, 2011. http://handbook.cochrane.org/chapter_9/9_6_6_interpretation_of_subgroup_analyses_and_meta_regressions.htm. Accessed December 5, 2016.
- Borenstein M, Higgins JP. Meta-analysis and subgroups. Prev Sci 2013; 14:134–143.
- Savarese G, Gotto AM Jr, Paolillo S, et al. Benefits of statins in elderly subjects without established cardiovascular disease: a meta-analysis. J Am Coll Cardiol 2013; 62:2090–2099.
- Sever PS, Dahlof B, Poulter NR, et al. Prevention of coronary and stroke events with atorvastatin in hypertensive patients who have average or lower-than-average cholesterol concentrations, in the Anglo-Scandinavian Cardiac Outcomes Trial—Lipid Lowering Arm (ASCOT-LLA): a multicentre randomised controlled trial. Lancet 2003; 361:1149–1158.
- The Antihypertensive and Lipid-Lowering Treatment to Prevent Heart Attack Trial. Major outcomes in moderately hypercholesterolemic, hypertensive patients randomized to pravastatin vs usual care: The Antihypertensive and Lipid-Lowering Treatment to Prevent Heart Attack Trial (ALLHAT-LLT). JAMA 2002; 288:2998–3007.
- de Longeril M, Salen P, Abramson J, et al. Cholesterol lowering, cardiovascular diseases, and the rosuvastatin-JUPITER controversy: a critical reappraisal. Arch Intern Med 2010; 170:1032–1036.
- Yusuf S, Lonn E, Bosch J. Lipid lowering for primary prevention. Lancet 2009: 373:1152–1155.
- Briel M, Bassler D, Wang AT, Guyatt GH, Montori VM. The dangers of stopping a trial too early. J Bone Joint Surg Am 2012; 94(suppl 1):56–60.
- Hayward RA, Krumholz HM. Three reasons to abandon low-density lipoprotein targets: an open letter to the Adult Treatment Panel IV of the National Institutes of Health. Circ Cardiovasc Qual Outcomes 2012; 5:2–5.
- Afilalo J, Duque G, Steele R, Jukema JW, de Craen AJ, Eisenberg MJ. Statins for secondary prevention in elderly patients: a hierarchical Bayesian meta-analysis. www.ncbi.nlm.nih.gov/pubmedhealth/PMH0026417. Accessed December 5, 2016.
- Holmes HM, Hayley DC, Alexander GC, Sachs GA. Reconsidering medication appropriateness for patients late in life. Arch Intern Med 2006; 166:605–609.
- Rockwood K, Mitnitski A. Frailty defined by deficit accumulation and geriatric medicine defined by frailty. Clin Geriatr Med 2011; 27:17–26.
- Petersen LK, Christensen K, Kragstrup J. Lipid-lowering treatment to the end? A review of observational studies and RCTs on cholesterol and mortality in 80+-year olds. Age Ageing 2010; 39:674–680.
- Psaty BM, Anderson M, Kronmal RA, et al. The association between lipid levels and the risks of incident myocardial infarction, stroke, and total mortality: the Cardiovascular Health Study. J Am Geriatr Soc 2004; 52:1639–1647.
- de Ruijter W, Westendorp RG, Assendelft WJ, et al. Use of Framingham risk score and new biomarkers to predict cardiovascular mortality in older people: population based observational cohort study. BMJ 2009; 338:a3083.
- Canon CP, Blazing MA, Giugliano RP, et al; IMPROVE-IT Investigators. Ezetimibe added to statin therapy after acute coronary syndromes. N Engl J Med 2015; 372:2387–2397.
- Anderson TJ, Gregoire J, Hegele RA, et al. 2012 update of the Canadian Cardiovascular Society guidelines for the diagnosis and treatment of dyslipidemia for the prevention of cardiovascular disease in the adult. Can J Cardiol 2013; 29:151–167.
- Kutner JS, Blatchford PJ, Taylor DH, et al. Safety and benefit of discontinuing statin therapy in the setting of advanced, life-limiting illness: a randomized clinical trial. JAMA Intern Med 2015; 175:691–700.
- Tinetti ME, Bogardus ST Jr, Agostini JV. Potential pitfalls of disease-specific guidelines for patients with multiple conditions. N Engl J Med 2004; 351:2870–2874.
- Rosenson RS. Current overview of statin-induced myopathy. Am J Med 2004; 116:408–416.
- Mancini GB, Baker S, Bergeron J, et al. Diagnosis, prevention, and management of statin adverse effects and intolerance: proceedings of a Canadian Working Group Consensus Conference. Can J Cardiol 2011; 27:635–662.
- Cohen JD, Brinton EA, Ito MK, Jacobson TA. Understanding Statin Use in America and Gaps in Patient Education (USAGE): an internet-based survey of 10,138 current and former statin users. J Clin Lipidol 2012; 6:208–215.
- Joy TR, Hegele RA. Narrative review: statin-related myopathy. Ann Intern Med 2009; 150:858–868.
- Talbert RL. Safety issues with statin therapy. J Am Pharm Assoc (2003) 2006; 46:479–490.
- Sewright KA, Clarkson PM, Thompson PD. Statin myopathy: incidence, risk factors, and pathophysiology. Curr Atheroscler Rep 2007; 9:389–396.
- Ott BR, Daiello LA, Dahabreh IJ, et al. Do statins impair cognition? A systematic review and meta-analysis of randomized controlled trials. J Gen Intern Med 2015; 30:348–358.
- Mancini GB, Tashakkor AY, Baker S, et al. Diagnosis, prevention and management of statin adverse effects and intolerance: Canadian Working Group Consensus update. Can J Cardiol 2013: 29:1553–1568.
- Rojas-Fernandez CH, Cameron JC. Is statin-associated cognitive impairment clinically relevant? A narrative review and clinical recommendations. Ann Pharmacother 2012; 46:549–557.
- McGuinness B, O’Hare J, Craig D, Bullock R, Malouf R, Passmore P. Cochrane review on ‘Statins for the treatment of dementia’. Int J Geriatr Psychiatry 2013; 28:119–126.
- Pandey RD, Gupta PP, Jha D, Kumar S. Role of statins in Alzheimer’s disease: a retrospective meta-analysis for commonly investigated clinical parameters in RCTs. Int J Neurosci 2013; 123:521–525.
- Food and Drug Administration (FDA). FDA drug safety communication: important safety label changes to cholesterol-lowering statin drugs. www.fda.gov/drugs/ drugsafety/ucm293101.htm. Accessed December 5, 2016.
- Garfinkel D, Mangin D. Feasibility study of a systematic approach for discontinuation of multiple medications in older adults: addressing polypharmacy. Arch Intern Med 2010; 170:1648–1654.
- Ontario Pharmacy Research Collaboration. Deprescribing guidelines for the elderly. www.open-pharmacy-research.ca/research-projects/emerging-services/deprescribing-guidelines. Accessed December 28, 2016.
- Scott IA, Hilmer SN, Reeve E, et al. Reducing inappropriate polypharmacy: the process of deprescribing. JAMA Intern Med 2015; 175:827–834.
- O’Mahony D, O’Sullivan D, Byrne S, O’Connor MN, Ryan C, Gallagher P. STOPP/START criteria for potentially inappropriate prescribing in older people: version 2. Age Ageing 2015; 44:213–218.
- American Geriatrics Society 2012 Beers Criteria Update Expert Panel. American Geriatrics Society updated Beers Criteria for potentially inappropriate medication use in older adults. J Am Geriatr Soc 2012; 60:616–631.
- Mallery LH, Allen M, Fleming I, et al. Promoting higher blood pressure targets for frail older adults: a consensus guideline from Canada. Cleve Clin J Med 2014; 81:427–437.
- Mallery LH, Ransom T, Steeves B, Cook B, Dunbar P, Moorhouse P. Evidence-informed guidelines for treating frail older adults with type 2 diabetes: from the Diabetes Care Program of Nova Scotia (DCPNS) and the Palliative and Therapeutic Harmonization (PATH) program. J Am Med Dir Assoc 2013; 14:801–808.
- Moorhouse P, Mallery L. Palliative and therapeutic harmonization: a model for appropriate decision-making in frail older adults. J Am Geriatr Soc 2012; 60:2326–2332.
- Fried LP, Tangen CM, Walston J, et al; Cardiovascular Health Study Collaborative Research Group. Frailty in older adults: evidence for a phenotype. J Gerontol A Biol Sci Med Sci 2001; 56:M146–M156.
- Morley JE, Malmstrom TK, Miller DK. A simple frailty questionnaire (FRAIL) predicts outcomes in middle aged African Americans. J Nutr Health Aging 2012; 16:601–608.
- Rockwood K, Song Z, MacKnight C, et al. A global clinical measure of fitness and frailty in elderly people. CMAJ 2005; 173:489–495.
- Morley JE, Vellas B, van Kan GA, et al. Frailty consensus: a call to action. J Am Med Dir Assoc 2013; 14:392–397.
- Tricoci P, Allen JM, Kramer JM, Califf RM, Smith SC Jr. Scientific evidence underlying the ACC/AHA clinical practice guidelines. JAMA 2009; 301:831–841.
- Shepherd J, Blauw GJ, Murphy MB, et al; PROSPER study group. PROspective Study of Pravastatin in the Elderly at Risk. Pravastatin in elderly individuals at risk of vascular disease (PROSPER): a randomised controlled trial. Lancet 2002; 360:1623–1630.
- Randomised trial of cholesterol lowering in 4444 patients with coronary heart disease: the Scandinavian Simvastatin Survival Study (4S). Lancet 1994; 344:1383–1389.
- Miettien TA, Pyorala K, Olsson AG, et al. Cholesterol-lowering therapy in women and elderly patients with myocardial infarction or angina pectoris: findings from the Scandinavian Simvastatin Study Group (4S). Circulation 1997; 96:4211–4218.
- Lewis SJ, Moye LA, Sacks FM, et al. Effect of pravastatin on cardiovascular events in older patients with myocardial infarction and cholesterol levels in the average range. Results of the Cholesterol and Recurrent Events (CARE) trial. Ann Intern Med 1998; 129:681–689.
- Hunt D, Young P, Simes J, et al. Benefits of pravastatin on cardiovascular events and mortality in older patients with coronary heart disease are equal to or exceed those seen in younger patients: results from the LIPID trial. Ann Intern Med 2001; 134:931–940.
- Prevention of cardiovascular events and death with pravastatin in patients with coronary heart disease and a broad range of initial cholesterol levels. The Long-Term Intervention with Pravastatin in Ischaemic Disease (LIPID) Study Group. N Engl J Med 1998; 339:1349–1357.
- Heart Protection Study Collaborative Group. The effects of cholesterol lowering with simvastatin on cause-specific mortality and on cancer incidence in 20,536 high-risk people: a randomized placebo-controlled trial. BMC Med 2005; 3:6.
- Heart Protection Study Collaborative Group. MRC/BHF Heart Protection Study of cholesterol lowering with simvastatin in 20,536 high-risk individuals: a randomized placebo-controlled trial. Lancet 2002; 360:7–22.
- Pitt B, Mancini GB, Ellis SG, Rosman HS, Park JS, McGovern ME. Pravastatin limitation of atherosclerosis in the coronary arteries (PLAC 1): reduction in atherosclerosis progression and clinical events. PLAC 1 investigation. J Am Coll Cardiol 1995; 26:1133–1139.
- Jukema JW, Bruschke AV, van Boven AJ, et al. Effects of lipid lowering by pravastatin on progression and regression of coronary artery disease in symptomatic men with normal to moderately elevated serum cholesterol levels. The Regression Growth Evaluation Statin Study (REGRESS). Circulation 1995; 91:2528–2540.
- Serruys PW, Foley DP, Jackson G, et al. A randomized placebo-controlled trial of fluvastatin for prevention of restenosis after successful coronary balloon angioplasty; final results of the fluvastatin angiographic restenosis (FLARE) trial. Eur Heart J 1999; 20:58–69.
- Serruys PW, de Feyter P, Macaya C, et al; Lescol Intervention Prevention Study (LIPS) Investigators. Fluvastatin for prevention of cardiac events following successful first percutaneous coronary intervention: a randomized controlled trial. JAMA 2002; 287:3215–3222.
- Tavazzi L, Maggioni AP, Marchioli R, et al; Gissi-HF Investigators. Effect of rosuvastatin in patients with chronic heart failure (the GISSI-HF trial): a randomized, double-blind, placebo-controlled trial. Lancet 2008; 372:1231–1239.
- Kjekshus J, Apatrei E, Barrios V, et al; CORONA Group. Rosuvastatin in older patients with systolic heart failure. N Engl J Med 2007; 357:2248–2261.
- Amarenco P, Bogousslavsky J, Callahan A, et al; Stroke Prevention by Aggressive Reduction in Cholesterol Levels (SPARCL) Investigators. High-dose atorvastatin after stroke or transient ischemic attack. N Engl J Med 2006; 355:549–559.
- Ridker PM, Danielson E, Fonseca FA, et al; JUPITER Study Group. Rosuvastatin to prevent vascular events in men and women with elevated C-reactive protein. N Engl J Med 2008; 359:2195–2207.
- Glynn RJ, Koenig W, Nordestgaard BG, Shepherd J, Ridker PM. Rosuvastatin for primary prevention in older persons with elevated C-reactive protein and low to average low-density lipoprotein cholesterol levels: exploratory analysis of a randomized trial. Ann Intern Med 2010; 152:488–496, W174.
- Chaturvedi S, Zivin J, Breazna A, et al; SPARCL Investigators. Effect of atorvastatin in elderly patients with a recent stroke or transient ischemic attack. Neurology 2009; 72:688–694.
- Afilalo J, Duque G, Steele R, Jukema JW, de Craen AJ, Eisenberg MJ. Statins for secondary prevention in elderly patients: a hierarchical bayesian meta-analysis. J Am Coll Cardiol 2008; 51:37–45.
- Cholesterol Treatment Trialists’ (CTT) Collaborators; Mihaylova B, Emberson J, Blackwell L, et al. The effects of lowering LDL cholesterol with statin therapy in people at low risk of vascular disease: meta-analysis of individual data from 27 randomised trials. Lancet 2012; 380:581– 590.
- Sacks FM, Pfeffer MA, Moye L, et al. Rationale and design of a secondary prevention trial of lowering normal plasma cholesterol levels after acute myocardial infarction: the Cholesterol and Recurrent Events (CARE). Am J Cardiol 1991; 68:1436–1446.
- Armitage J, Collins R. Need for large scale randomised evidence about lowering LDL cholesterol in people with diabetes mellitus: MRC/BHF Heart Protection Study and other major trials. Heart 2000; 84:357–360.
- Design features and baseline characteristics of the LIPID (Long-Term Intervention with Pravastatin in Ischemic Disease) study: a randomized trial in patients with previous acute myocardial infarction and/or unstable angina pectoris. Am J Cardiol 1995; 76:474–479.
- Shepherd J, Blauw GJ, Murphy MB, et al. The design of a prospective study of Pravastatin in the Elderly at Risk (PROSPER). Am J Cardiol 1999; 84:1192–1197.
- Amarenco P, Bogousslavsky J, Callahan AS, et al; SPARCL Investigators. Design and baseline characteristics of the stroke prevention by aggressive reduction in cholesterol levels (SPARCL) study. Cerebrovasc Dis 2003; 16:389–395.
- Interpretation of subgroup analyses and meta-regressions. In: Higgins JPT, Green S, editors. Cochrane Handbook for Systematic Reviews of Interventions Version 5.1.0. The Cochrane Collaboration, 2011. http://handbook.cochrane.org/chapter_9/9_6_6_interpretation_of_subgroup_analyses_and_meta_regressions.htm. Accessed December 5, 2016.
- Borenstein M, Higgins JP. Meta-analysis and subgroups. Prev Sci 2013; 14:134–143.
- Savarese G, Gotto AM Jr, Paolillo S, et al. Benefits of statins in elderly subjects without established cardiovascular disease: a meta-analysis. J Am Coll Cardiol 2013; 62:2090–2099.
- Sever PS, Dahlof B, Poulter NR, et al. Prevention of coronary and stroke events with atorvastatin in hypertensive patients who have average or lower-than-average cholesterol concentrations, in the Anglo-Scandinavian Cardiac Outcomes Trial—Lipid Lowering Arm (ASCOT-LLA): a multicentre randomised controlled trial. Lancet 2003; 361:1149–1158.
- The Antihypertensive and Lipid-Lowering Treatment to Prevent Heart Attack Trial. Major outcomes in moderately hypercholesterolemic, hypertensive patients randomized to pravastatin vs usual care: The Antihypertensive and Lipid-Lowering Treatment to Prevent Heart Attack Trial (ALLHAT-LLT). JAMA 2002; 288:2998–3007.
- de Longeril M, Salen P, Abramson J, et al. Cholesterol lowering, cardiovascular diseases, and the rosuvastatin-JUPITER controversy: a critical reappraisal. Arch Intern Med 2010; 170:1032–1036.
- Yusuf S, Lonn E, Bosch J. Lipid lowering for primary prevention. Lancet 2009: 373:1152–1155.
- Briel M, Bassler D, Wang AT, Guyatt GH, Montori VM. The dangers of stopping a trial too early. J Bone Joint Surg Am 2012; 94(suppl 1):56–60.
- Hayward RA, Krumholz HM. Three reasons to abandon low-density lipoprotein targets: an open letter to the Adult Treatment Panel IV of the National Institutes of Health. Circ Cardiovasc Qual Outcomes 2012; 5:2–5.
- Afilalo J, Duque G, Steele R, Jukema JW, de Craen AJ, Eisenberg MJ. Statins for secondary prevention in elderly patients: a hierarchical Bayesian meta-analysis. www.ncbi.nlm.nih.gov/pubmedhealth/PMH0026417. Accessed December 5, 2016.
- Holmes HM, Hayley DC, Alexander GC, Sachs GA. Reconsidering medication appropriateness for patients late in life. Arch Intern Med 2006; 166:605–609.
- Rockwood K, Mitnitski A. Frailty defined by deficit accumulation and geriatric medicine defined by frailty. Clin Geriatr Med 2011; 27:17–26.
- Petersen LK, Christensen K, Kragstrup J. Lipid-lowering treatment to the end? A review of observational studies and RCTs on cholesterol and mortality in 80+-year olds. Age Ageing 2010; 39:674–680.
- Psaty BM, Anderson M, Kronmal RA, et al. The association between lipid levels and the risks of incident myocardial infarction, stroke, and total mortality: the Cardiovascular Health Study. J Am Geriatr Soc 2004; 52:1639–1647.
- de Ruijter W, Westendorp RG, Assendelft WJ, et al. Use of Framingham risk score and new biomarkers to predict cardiovascular mortality in older people: population based observational cohort study. BMJ 2009; 338:a3083.
- Canon CP, Blazing MA, Giugliano RP, et al; IMPROVE-IT Investigators. Ezetimibe added to statin therapy after acute coronary syndromes. N Engl J Med 2015; 372:2387–2397.
- Anderson TJ, Gregoire J, Hegele RA, et al. 2012 update of the Canadian Cardiovascular Society guidelines for the diagnosis and treatment of dyslipidemia for the prevention of cardiovascular disease in the adult. Can J Cardiol 2013; 29:151–167.
- Kutner JS, Blatchford PJ, Taylor DH, et al. Safety and benefit of discontinuing statin therapy in the setting of advanced, life-limiting illness: a randomized clinical trial. JAMA Intern Med 2015; 175:691–700.
- Tinetti ME, Bogardus ST Jr, Agostini JV. Potential pitfalls of disease-specific guidelines for patients with multiple conditions. N Engl J Med 2004; 351:2870–2874.
- Rosenson RS. Current overview of statin-induced myopathy. Am J Med 2004; 116:408–416.
- Mancini GB, Baker S, Bergeron J, et al. Diagnosis, prevention, and management of statin adverse effects and intolerance: proceedings of a Canadian Working Group Consensus Conference. Can J Cardiol 2011; 27:635–662.
- Cohen JD, Brinton EA, Ito MK, Jacobson TA. Understanding Statin Use in America and Gaps in Patient Education (USAGE): an internet-based survey of 10,138 current and former statin users. J Clin Lipidol 2012; 6:208–215.
- Joy TR, Hegele RA. Narrative review: statin-related myopathy. Ann Intern Med 2009; 150:858–868.
- Talbert RL. Safety issues with statin therapy. J Am Pharm Assoc (2003) 2006; 46:479–490.
- Sewright KA, Clarkson PM, Thompson PD. Statin myopathy: incidence, risk factors, and pathophysiology. Curr Atheroscler Rep 2007; 9:389–396.
- Ott BR, Daiello LA, Dahabreh IJ, et al. Do statins impair cognition? A systematic review and meta-analysis of randomized controlled trials. J Gen Intern Med 2015; 30:348–358.
- Mancini GB, Tashakkor AY, Baker S, et al. Diagnosis, prevention and management of statin adverse effects and intolerance: Canadian Working Group Consensus update. Can J Cardiol 2013: 29:1553–1568.
- Rojas-Fernandez CH, Cameron JC. Is statin-associated cognitive impairment clinically relevant? A narrative review and clinical recommendations. Ann Pharmacother 2012; 46:549–557.
- McGuinness B, O’Hare J, Craig D, Bullock R, Malouf R, Passmore P. Cochrane review on ‘Statins for the treatment of dementia’. Int J Geriatr Psychiatry 2013; 28:119–126.
- Pandey RD, Gupta PP, Jha D, Kumar S. Role of statins in Alzheimer’s disease: a retrospective meta-analysis for commonly investigated clinical parameters in RCTs. Int J Neurosci 2013; 123:521–525.
- Food and Drug Administration (FDA). FDA drug safety communication: important safety label changes to cholesterol-lowering statin drugs. www.fda.gov/drugs/ drugsafety/ucm293101.htm. Accessed December 5, 2016.
- Garfinkel D, Mangin D. Feasibility study of a systematic approach for discontinuation of multiple medications in older adults: addressing polypharmacy. Arch Intern Med 2010; 170:1648–1654.
KEY POINTS
- There is no reason to prescribe or continue statins for primary prevention in severely frail elderly patients, as these drugs are unlikely to provide benefit in terms of outcomes relevant to this population.
- Statins are probably not necessary for secondary prevention in patients who are severely frail, although there may be extenuating circumstances for their use.
- There is no reason to start or continue statins for heart failure, as there is insufficient evidence that they are effective for this indication in any population.
- There is no reason to start or continue other lipid-lowering drugs in conjunction with statins.
- As the frail elderly may be more vulnerable to the side effects of statins, lower doses may be more appropriate if these drugs are prescribed.
- If there is concern regarding myopathy, a drug interaction, or other adverse effects, consider a trial of statin discontinuation.

Statin therapy in the frail elderly: A nuanced decision
The growing elderly population varies widely in functional capacity and mental agility. Age by itself is not a reliable indicator of physiologic performance in patients with cardiovascular disease.1
The concept of frailty helps to identify elderly patients most susceptible to adverse outcomes. Frailty is a powerful indicator of disability, loss of independence, hospitalization, and death. In a patient whose health is declining, frailty is an appropriate impetus for the clinician and patient to reevaluate the goals of care.
In this issue of the Journal, Mallery et al2 address an important topic: the use of preventive lipid-lowering therapies in frail patients with limited life expectancy. For these patients, they recommend against lipid-lowering therapy for primary prevention, and only in extenuating circumstances for secondary prevention.
No trials have evaluated lipid-lowering therapy specifically in frail older adults, and therefore, these recommendations are based on an evidence-informed appraisal of the literature. Mallery et al2 suggest that in the frail elderly, improvement in function and quality of life are more relevant end points than traditional cardiovascular outcomes. They conclude that available evidence does not support lipid-lowering therapy for most patients with advanced frailty.
POINTS TO CONSIDER
Mallery et al2 effectively articulate the need for frailty-specific care. Multimorbidity, polypharmacy, and increased adverse drug effects require special attention in the frail elderly. The authors make a sound argument against lipid-lowering therapy for primary prevention in the severely frail elderly, in whom the evidence for short-term benefit is not compelling. They also recommend against nonstatin lipid-lowering medications, and against statin therapy for heart failure, which is consistent with major guidelines. In the modern era of reflexive testing and prescribing, the authors’ “less is more” approach provides needed encouragement for thoughtful care in these vulnerable patients.
However, certain points of contention deserve additional consideration, including the imprecise definition of frailty, potential benefits and harms of statin therapy in high-risk patients, and the importance of shared decision-making.
How should frailty be defined?
Frailty biology is a field of ongoing research, and there is a lack of consensus on how best to define the condition.3 Estimates of the prevalence of frailty among older adults with cardiovascular disease range from 10% to 60%, owing to considerable variability in the tools used for frailty assessment.4
Mallery et al2 consider an individual to be severely frail if he or she requires assistance with basic activities of daily living as the result of any physical or cognitive deficit (derived from the Clinical Frailty Scale or Frailty Assessment for Care Planning Tool). While functional dependence may be a consequence of frailty, this generalized definition does not characterize the clinical phenotype, which includes slowness, weakness, low physical activity, exhaustion, and unintentional weight loss.
Furthermore, this definition offers no insight into the unique characteristics, causes, and clinical course related to frailty. Significant heterogeneity among “frail” patients precludes a uniform treatment approach in this population.
Do statins benefit frail patients at high risk?
Regarding secondary prevention, the authors highlight a meta-analysis by Afilalo et al,5 the most comprehensive assessment to date of statin therapy in elderly patients with documented coronary heart disease. This study included nearly 20,000 elderly patients in nine secondary prevention trials, including the secondary prevention subgroup of the Prospective Study of Pravastatin in the Elderly at Risk (PROSPER) trial.6
Afilalo et al5 calculated that statin therapy reduced the rates of all-cause mortality by 22% and coronary death by 30%, with even greater reductions in the rates of nonfatal myocardial infarction, stroke, and revascularization. Furthermore, the absolute risk reduction was higher and the number needed to treat was lower in those over age 80. Overall, these data convincingly showed that high-risk patients ages 65 to 82 enrolled in clinical trials derive substantial benefit from statin therapy.
Mallery et al2 contend that many of the secondary prevention statin trials evaluated composite outcomes over many years of follow-up and therefore are not generalizable to the frail elderly. However, the Afilalo meta-analysis5 does not provide patient-level data, and therefore the benefit for different clinical and demographic subgroups is unknown. It is only speculative to infer that those with frailty are unlikely to benefit. In fact, the improved outcomes observed with increasing age would argue against this notion.
Given the compelling data supporting statin therapy in the high-risk elderly population, some patients and clinicians may reasonably feel there is value in statin therapy—even in those with advanced frailty.
What about symptoms, disability, quality of life, and short-term benefits? Asymptomatic or “silent” myocardial infarction is associated with angina, congestive heart failure, and subsequent symptomatic myocardial infarction.7,8 Dismissing the importance of these end points in clinical trials fails to recognize potential downstream effects that are directly relevant to a patient’s overall health status.
The Study Assessing Goals in the Elderly (SAGE) trial9 assessed the effect of statin therapy on ischemia burden in patients ages 65 to 85 with stable coronary disease. The results showed that both moderate and intensive statin dosing significantly reduced myocardial ischemia at 3 and 12 months, as detected by continuous electrocardiographic monitoring.
More research is needed to determine the effect of statin therapy on functional capacity and quality of life. Currently, it is premature to conclude that statins have no relevance to these important patient-centered outcomes.
What are the potential harms?
Mallery et al2 cite numerous articles that emphasize the potential adverse effects of statin therapy in the elderly. Unfortunately, data supporting the safety of statin therapy in the elderly were not included. This should be stressed, given that older statin-eligible patients are often undertreated in contemporary practice.10
A 2015 systematic review and meta-analysis indicated that statin-related events are relatively rare in the elderly.11 Another study showed elderly patients who started statin therapy after a myocardial infarction had no change in short-term cognitive or physical function.12
Older age and low body mass index are risk factors for statin myopathy, underscoring the need for close monitoring in frail patients. However, it is important to maintain an objective and balanced approach when considering potential harms.
Need for shared decision-making
Mallery et al2 make no mention of shared decision-making. Best practice guidelines for the management of frailty support a holistic medical review to establish an individualized care plan for each patient.13 Firm recommendations based on indeterminate evidence undermine the patient-physician relationship and do not allow for personal preferences of care. In an environment of uncertain benefit and harm, the patient’s priorities and values should serve as the cornerstone for clinical decisions.
- Barakat K, Wilkinson P, Deaner A, Fluck D, Ranjadayalan K, Timmis A. How should age affect management of acute myocardial infarction? A prospective cohort study. Lancet 1999; 353:955–959.
- Mallery L, Moorhouse P, McLea Veysey P, Allen M, Fleming I. Frail elderly patients do not need lipid-lowering drugs. Cleve Clin J Med 2016; 83:131–142.
- Bergman H, Ferrucci L, Guralnik J, et al. Frailty: an emerging research and clinical paradigm—issues and controversies. J Gerontol A Biol Sci Med Sci 2007; 62:731–737.
- Afilalo J, Alexander KP, Mack MJ, et al. Frailty assessment in the cardiovascular care of older adults. J Am Coll Cardiol 2014; 63:747–762.
- Afilalo J, Duque G, Steele R, Jukema JW, de Craen AJ, Eisenberg MJ. Statins for secondary prevention in elderly patients: a hierarchical bayesian meta-analysis. J Am Coll Cardiol 2008; 51:37–45.
- Shepherd J, Blauw GJ, Murphy MB, et al; PROSPER study group. PROspective Study of Pravastatin in the Elderly at Risk. Pravastatin in elderly individuals at risk of vascular disease (PROSPER): a randomised controlled trial. Lancet 2002; 360:1623–1630.
- Nadelmann J, Frishman WH, Ooi WL, et al. Prevalence, incidence and prognosis of recognized and unrecognized myocardial infarction in persons aged 75 years or older: The Bronx Aging Study. Am J Cardiol 1990; 66:533–537.
- Sheifer SE, Gersh BJ, Yanez ND 3rd, Ades PA, Burke GL, Manolio TA. Prevalence, predisposing factors, and prognosis of clinically unrecognized myocardial infarction in the elderly. J Am Coll Cardiol 2000; 35:119–126.
- Deedwania P, Stone PH, Bairey Merz CN, et al. Effects of intensive versus moderate lipid-lowering therapy on myocardial ischemia in older patients with coronary heart disease: results of the Study Assessing Goals in the Elderly (SAGE). Circulation 2007; 115:700–707.
- Maddox TM, Borden WB, Tang F, et al. Implications of the 2013 ACC/AHA cholesterol guidelines for adults in contemporary cardiovascular practice: insights from the NCDR PINNACLE registry. J Am Coll Cardiol 2014; 64:2183–2192.
- Iwere RB, Hewitt J. Myopathy in older people receiving statin therapy: a systematic review and meta-analysis. Br J Clin Pharmacol 2015; 80:363–371.
- Swiger KJ, Martin SS, Tang F, et al. Cognitive and physical function by statin exposure in elderly individuals following acute myocardial infarction. Clin Cardiol 2015; 38:455–461.
- Turner G, Clegg A; British Geriatrics Society; Age UK; Royal College of General Practioners. Best practice guidelines for the management of frailty: a British Geriatrics Society, Age UK and Royal College of General Practitioners report. Age Ageing 2014; 43:744–747.
The growing elderly population varies widely in functional capacity and mental agility. Age by itself is not a reliable indicator of physiologic performance in patients with cardiovascular disease.1
The concept of frailty helps to identify elderly patients most susceptible to adverse outcomes. Frailty is a powerful indicator of disability, loss of independence, hospitalization, and death. In a patient whose health is declining, frailty is an appropriate impetus for the clinician and patient to reevaluate the goals of care.
In this issue of the Journal, Mallery et al2 address an important topic: the use of preventive lipid-lowering therapies in frail patients with limited life expectancy. For these patients, they recommend against lipid-lowering therapy for primary prevention, and only in extenuating circumstances for secondary prevention.
No trials have evaluated lipid-lowering therapy specifically in frail older adults, and therefore, these recommendations are based on an evidence-informed appraisal of the literature. Mallery et al2 suggest that in the frail elderly, improvement in function and quality of life are more relevant end points than traditional cardiovascular outcomes. They conclude that available evidence does not support lipid-lowering therapy for most patients with advanced frailty.
POINTS TO CONSIDER
Mallery et al2 effectively articulate the need for frailty-specific care. Multimorbidity, polypharmacy, and increased adverse drug effects require special attention in the frail elderly. The authors make a sound argument against lipid-lowering therapy for primary prevention in the severely frail elderly, in whom the evidence for short-term benefit is not compelling. They also recommend against nonstatin lipid-lowering medications, and against statin therapy for heart failure, which is consistent with major guidelines. In the modern era of reflexive testing and prescribing, the authors’ “less is more” approach provides needed encouragement for thoughtful care in these vulnerable patients.
However, certain points of contention deserve additional consideration, including the imprecise definition of frailty, potential benefits and harms of statin therapy in high-risk patients, and the importance of shared decision-making.
How should frailty be defined?
Frailty biology is a field of ongoing research, and there is a lack of consensus on how best to define the condition.3 Estimates of the prevalence of frailty among older adults with cardiovascular disease range from 10% to 60%, owing to considerable variability in the tools used for frailty assessment.4
Mallery et al2 consider an individual to be severely frail if he or she requires assistance with basic activities of daily living as the result of any physical or cognitive deficit (derived from the Clinical Frailty Scale or Frailty Assessment for Care Planning Tool). While functional dependence may be a consequence of frailty, this generalized definition does not characterize the clinical phenotype, which includes slowness, weakness, low physical activity, exhaustion, and unintentional weight loss.
Furthermore, this definition offers no insight into the unique characteristics, causes, and clinical course related to frailty. Significant heterogeneity among “frail” patients precludes a uniform treatment approach in this population.
Do statins benefit frail patients at high risk?
Regarding secondary prevention, the authors highlight a meta-analysis by Afilalo et al,5 the most comprehensive assessment to date of statin therapy in elderly patients with documented coronary heart disease. This study included nearly 20,000 elderly patients in nine secondary prevention trials, including the secondary prevention subgroup of the Prospective Study of Pravastatin in the Elderly at Risk (PROSPER) trial.6
Afilalo et al5 calculated that statin therapy reduced the rates of all-cause mortality by 22% and coronary death by 30%, with even greater reductions in the rates of nonfatal myocardial infarction, stroke, and revascularization. Furthermore, the absolute risk reduction was higher and the number needed to treat was lower in those over age 80. Overall, these data convincingly showed that high-risk patients ages 65 to 82 enrolled in clinical trials derive substantial benefit from statin therapy.
Mallery et al2 contend that many of the secondary prevention statin trials evaluated composite outcomes over many years of follow-up and therefore are not generalizable to the frail elderly. However, the Afilalo meta-analysis5 does not provide patient-level data, and therefore the benefit for different clinical and demographic subgroups is unknown. It is only speculative to infer that those with frailty are unlikely to benefit. In fact, the improved outcomes observed with increasing age would argue against this notion.
Given the compelling data supporting statin therapy in the high-risk elderly population, some patients and clinicians may reasonably feel there is value in statin therapy—even in those with advanced frailty.
What about symptoms, disability, quality of life, and short-term benefits? Asymptomatic or “silent” myocardial infarction is associated with angina, congestive heart failure, and subsequent symptomatic myocardial infarction.7,8 Dismissing the importance of these end points in clinical trials fails to recognize potential downstream effects that are directly relevant to a patient’s overall health status.
The Study Assessing Goals in the Elderly (SAGE) trial9 assessed the effect of statin therapy on ischemia burden in patients ages 65 to 85 with stable coronary disease. The results showed that both moderate and intensive statin dosing significantly reduced myocardial ischemia at 3 and 12 months, as detected by continuous electrocardiographic monitoring.
More research is needed to determine the effect of statin therapy on functional capacity and quality of life. Currently, it is premature to conclude that statins have no relevance to these important patient-centered outcomes.
What are the potential harms?
Mallery et al2 cite numerous articles that emphasize the potential adverse effects of statin therapy in the elderly. Unfortunately, data supporting the safety of statin therapy in the elderly were not included. This should be stressed, given that older statin-eligible patients are often undertreated in contemporary practice.10
A 2015 systematic review and meta-analysis indicated that statin-related events are relatively rare in the elderly.11 Another study showed elderly patients who started statin therapy after a myocardial infarction had no change in short-term cognitive or physical function.12
Older age and low body mass index are risk factors for statin myopathy, underscoring the need for close monitoring in frail patients. However, it is important to maintain an objective and balanced approach when considering potential harms.
Need for shared decision-making
Mallery et al2 make no mention of shared decision-making. Best practice guidelines for the management of frailty support a holistic medical review to establish an individualized care plan for each patient.13 Firm recommendations based on indeterminate evidence undermine the patient-physician relationship and do not allow for personal preferences of care. In an environment of uncertain benefit and harm, the patient’s priorities and values should serve as the cornerstone for clinical decisions.
The growing elderly population varies widely in functional capacity and mental agility. Age by itself is not a reliable indicator of physiologic performance in patients with cardiovascular disease.1
The concept of frailty helps to identify elderly patients most susceptible to adverse outcomes. Frailty is a powerful indicator of disability, loss of independence, hospitalization, and death. In a patient whose health is declining, frailty is an appropriate impetus for the clinician and patient to reevaluate the goals of care.
In this issue of the Journal, Mallery et al2 address an important topic: the use of preventive lipid-lowering therapies in frail patients with limited life expectancy. For these patients, they recommend against lipid-lowering therapy for primary prevention, and only in extenuating circumstances for secondary prevention.
No trials have evaluated lipid-lowering therapy specifically in frail older adults, and therefore, these recommendations are based on an evidence-informed appraisal of the literature. Mallery et al2 suggest that in the frail elderly, improvement in function and quality of life are more relevant end points than traditional cardiovascular outcomes. They conclude that available evidence does not support lipid-lowering therapy for most patients with advanced frailty.
POINTS TO CONSIDER
Mallery et al2 effectively articulate the need for frailty-specific care. Multimorbidity, polypharmacy, and increased adverse drug effects require special attention in the frail elderly. The authors make a sound argument against lipid-lowering therapy for primary prevention in the severely frail elderly, in whom the evidence for short-term benefit is not compelling. They also recommend against nonstatin lipid-lowering medications, and against statin therapy for heart failure, which is consistent with major guidelines. In the modern era of reflexive testing and prescribing, the authors’ “less is more” approach provides needed encouragement for thoughtful care in these vulnerable patients.
However, certain points of contention deserve additional consideration, including the imprecise definition of frailty, potential benefits and harms of statin therapy in high-risk patients, and the importance of shared decision-making.
How should frailty be defined?
Frailty biology is a field of ongoing research, and there is a lack of consensus on how best to define the condition.3 Estimates of the prevalence of frailty among older adults with cardiovascular disease range from 10% to 60%, owing to considerable variability in the tools used for frailty assessment.4
Mallery et al2 consider an individual to be severely frail if he or she requires assistance with basic activities of daily living as the result of any physical or cognitive deficit (derived from the Clinical Frailty Scale or Frailty Assessment for Care Planning Tool). While functional dependence may be a consequence of frailty, this generalized definition does not characterize the clinical phenotype, which includes slowness, weakness, low physical activity, exhaustion, and unintentional weight loss.
Furthermore, this definition offers no insight into the unique characteristics, causes, and clinical course related to frailty. Significant heterogeneity among “frail” patients precludes a uniform treatment approach in this population.
Do statins benefit frail patients at high risk?
Regarding secondary prevention, the authors highlight a meta-analysis by Afilalo et al,5 the most comprehensive assessment to date of statin therapy in elderly patients with documented coronary heart disease. This study included nearly 20,000 elderly patients in nine secondary prevention trials, including the secondary prevention subgroup of the Prospective Study of Pravastatin in the Elderly at Risk (PROSPER) trial.6
Afilalo et al5 calculated that statin therapy reduced the rates of all-cause mortality by 22% and coronary death by 30%, with even greater reductions in the rates of nonfatal myocardial infarction, stroke, and revascularization. Furthermore, the absolute risk reduction was higher and the number needed to treat was lower in those over age 80. Overall, these data convincingly showed that high-risk patients ages 65 to 82 enrolled in clinical trials derive substantial benefit from statin therapy.
Mallery et al2 contend that many of the secondary prevention statin trials evaluated composite outcomes over many years of follow-up and therefore are not generalizable to the frail elderly. However, the Afilalo meta-analysis5 does not provide patient-level data, and therefore the benefit for different clinical and demographic subgroups is unknown. It is only speculative to infer that those with frailty are unlikely to benefit. In fact, the improved outcomes observed with increasing age would argue against this notion.
Given the compelling data supporting statin therapy in the high-risk elderly population, some patients and clinicians may reasonably feel there is value in statin therapy—even in those with advanced frailty.
What about symptoms, disability, quality of life, and short-term benefits? Asymptomatic or “silent” myocardial infarction is associated with angina, congestive heart failure, and subsequent symptomatic myocardial infarction.7,8 Dismissing the importance of these end points in clinical trials fails to recognize potential downstream effects that are directly relevant to a patient’s overall health status.
The Study Assessing Goals in the Elderly (SAGE) trial9 assessed the effect of statin therapy on ischemia burden in patients ages 65 to 85 with stable coronary disease. The results showed that both moderate and intensive statin dosing significantly reduced myocardial ischemia at 3 and 12 months, as detected by continuous electrocardiographic monitoring.
More research is needed to determine the effect of statin therapy on functional capacity and quality of life. Currently, it is premature to conclude that statins have no relevance to these important patient-centered outcomes.
What are the potential harms?
Mallery et al2 cite numerous articles that emphasize the potential adverse effects of statin therapy in the elderly. Unfortunately, data supporting the safety of statin therapy in the elderly were not included. This should be stressed, given that older statin-eligible patients are often undertreated in contemporary practice.10
A 2015 systematic review and meta-analysis indicated that statin-related events are relatively rare in the elderly.11 Another study showed elderly patients who started statin therapy after a myocardial infarction had no change in short-term cognitive or physical function.12
Older age and low body mass index are risk factors for statin myopathy, underscoring the need for close monitoring in frail patients. However, it is important to maintain an objective and balanced approach when considering potential harms.
Need for shared decision-making
Mallery et al2 make no mention of shared decision-making. Best practice guidelines for the management of frailty support a holistic medical review to establish an individualized care plan for each patient.13 Firm recommendations based on indeterminate evidence undermine the patient-physician relationship and do not allow for personal preferences of care. In an environment of uncertain benefit and harm, the patient’s priorities and values should serve as the cornerstone for clinical decisions.
- Barakat K, Wilkinson P, Deaner A, Fluck D, Ranjadayalan K, Timmis A. How should age affect management of acute myocardial infarction? A prospective cohort study. Lancet 1999; 353:955–959.
- Mallery L, Moorhouse P, McLea Veysey P, Allen M, Fleming I. Frail elderly patients do not need lipid-lowering drugs. Cleve Clin J Med 2016; 83:131–142.
- Bergman H, Ferrucci L, Guralnik J, et al. Frailty: an emerging research and clinical paradigm—issues and controversies. J Gerontol A Biol Sci Med Sci 2007; 62:731–737.
- Afilalo J, Alexander KP, Mack MJ, et al. Frailty assessment in the cardiovascular care of older adults. J Am Coll Cardiol 2014; 63:747–762.
- Afilalo J, Duque G, Steele R, Jukema JW, de Craen AJ, Eisenberg MJ. Statins for secondary prevention in elderly patients: a hierarchical bayesian meta-analysis. J Am Coll Cardiol 2008; 51:37–45.
- Shepherd J, Blauw GJ, Murphy MB, et al; PROSPER study group. PROspective Study of Pravastatin in the Elderly at Risk. Pravastatin in elderly individuals at risk of vascular disease (PROSPER): a randomised controlled trial. Lancet 2002; 360:1623–1630.
- Nadelmann J, Frishman WH, Ooi WL, et al. Prevalence, incidence and prognosis of recognized and unrecognized myocardial infarction in persons aged 75 years or older: The Bronx Aging Study. Am J Cardiol 1990; 66:533–537.
- Sheifer SE, Gersh BJ, Yanez ND 3rd, Ades PA, Burke GL, Manolio TA. Prevalence, predisposing factors, and prognosis of clinically unrecognized myocardial infarction in the elderly. J Am Coll Cardiol 2000; 35:119–126.
- Deedwania P, Stone PH, Bairey Merz CN, et al. Effects of intensive versus moderate lipid-lowering therapy on myocardial ischemia in older patients with coronary heart disease: results of the Study Assessing Goals in the Elderly (SAGE). Circulation 2007; 115:700–707.
- Maddox TM, Borden WB, Tang F, et al. Implications of the 2013 ACC/AHA cholesterol guidelines for adults in contemporary cardiovascular practice: insights from the NCDR PINNACLE registry. J Am Coll Cardiol 2014; 64:2183–2192.
- Iwere RB, Hewitt J. Myopathy in older people receiving statin therapy: a systematic review and meta-analysis. Br J Clin Pharmacol 2015; 80:363–371.
- Swiger KJ, Martin SS, Tang F, et al. Cognitive and physical function by statin exposure in elderly individuals following acute myocardial infarction. Clin Cardiol 2015; 38:455–461.
- Turner G, Clegg A; British Geriatrics Society; Age UK; Royal College of General Practioners. Best practice guidelines for the management of frailty: a British Geriatrics Society, Age UK and Royal College of General Practitioners report. Age Ageing 2014; 43:744–747.
- Barakat K, Wilkinson P, Deaner A, Fluck D, Ranjadayalan K, Timmis A. How should age affect management of acute myocardial infarction? A prospective cohort study. Lancet 1999; 353:955–959.
- Mallery L, Moorhouse P, McLea Veysey P, Allen M, Fleming I. Frail elderly patients do not need lipid-lowering drugs. Cleve Clin J Med 2016; 83:131–142.
- Bergman H, Ferrucci L, Guralnik J, et al. Frailty: an emerging research and clinical paradigm—issues and controversies. J Gerontol A Biol Sci Med Sci 2007; 62:731–737.
- Afilalo J, Alexander KP, Mack MJ, et al. Frailty assessment in the cardiovascular care of older adults. J Am Coll Cardiol 2014; 63:747–762.
- Afilalo J, Duque G, Steele R, Jukema JW, de Craen AJ, Eisenberg MJ. Statins for secondary prevention in elderly patients: a hierarchical bayesian meta-analysis. J Am Coll Cardiol 2008; 51:37–45.
- Shepherd J, Blauw GJ, Murphy MB, et al; PROSPER study group. PROspective Study of Pravastatin in the Elderly at Risk. Pravastatin in elderly individuals at risk of vascular disease (PROSPER): a randomised controlled trial. Lancet 2002; 360:1623–1630.
- Nadelmann J, Frishman WH, Ooi WL, et al. Prevalence, incidence and prognosis of recognized and unrecognized myocardial infarction in persons aged 75 years or older: The Bronx Aging Study. Am J Cardiol 1990; 66:533–537.
- Sheifer SE, Gersh BJ, Yanez ND 3rd, Ades PA, Burke GL, Manolio TA. Prevalence, predisposing factors, and prognosis of clinically unrecognized myocardial infarction in the elderly. J Am Coll Cardiol 2000; 35:119–126.
- Deedwania P, Stone PH, Bairey Merz CN, et al. Effects of intensive versus moderate lipid-lowering therapy on myocardial ischemia in older patients with coronary heart disease: results of the Study Assessing Goals in the Elderly (SAGE). Circulation 2007; 115:700–707.
- Maddox TM, Borden WB, Tang F, et al. Implications of the 2013 ACC/AHA cholesterol guidelines for adults in contemporary cardiovascular practice: insights from the NCDR PINNACLE registry. J Am Coll Cardiol 2014; 64:2183–2192.
- Iwere RB, Hewitt J. Myopathy in older people receiving statin therapy: a systematic review and meta-analysis. Br J Clin Pharmacol 2015; 80:363–371.
- Swiger KJ, Martin SS, Tang F, et al. Cognitive and physical function by statin exposure in elderly individuals following acute myocardial infarction. Clin Cardiol 2015; 38:455–461.
- Turner G, Clegg A; British Geriatrics Society; Age UK; Royal College of General Practioners. Best practice guidelines for the management of frailty: a British Geriatrics Society, Age UK and Royal College of General Practitioners report. Age Ageing 2014; 43:744–747.

Thrombotic microangiopathies: Similar presentations, different therapies
Our knowledge of the pathogenesis of thrombotic microangiopathies has greatly advanced in the last decade, improving the diagnosis and treatment of these diseases.
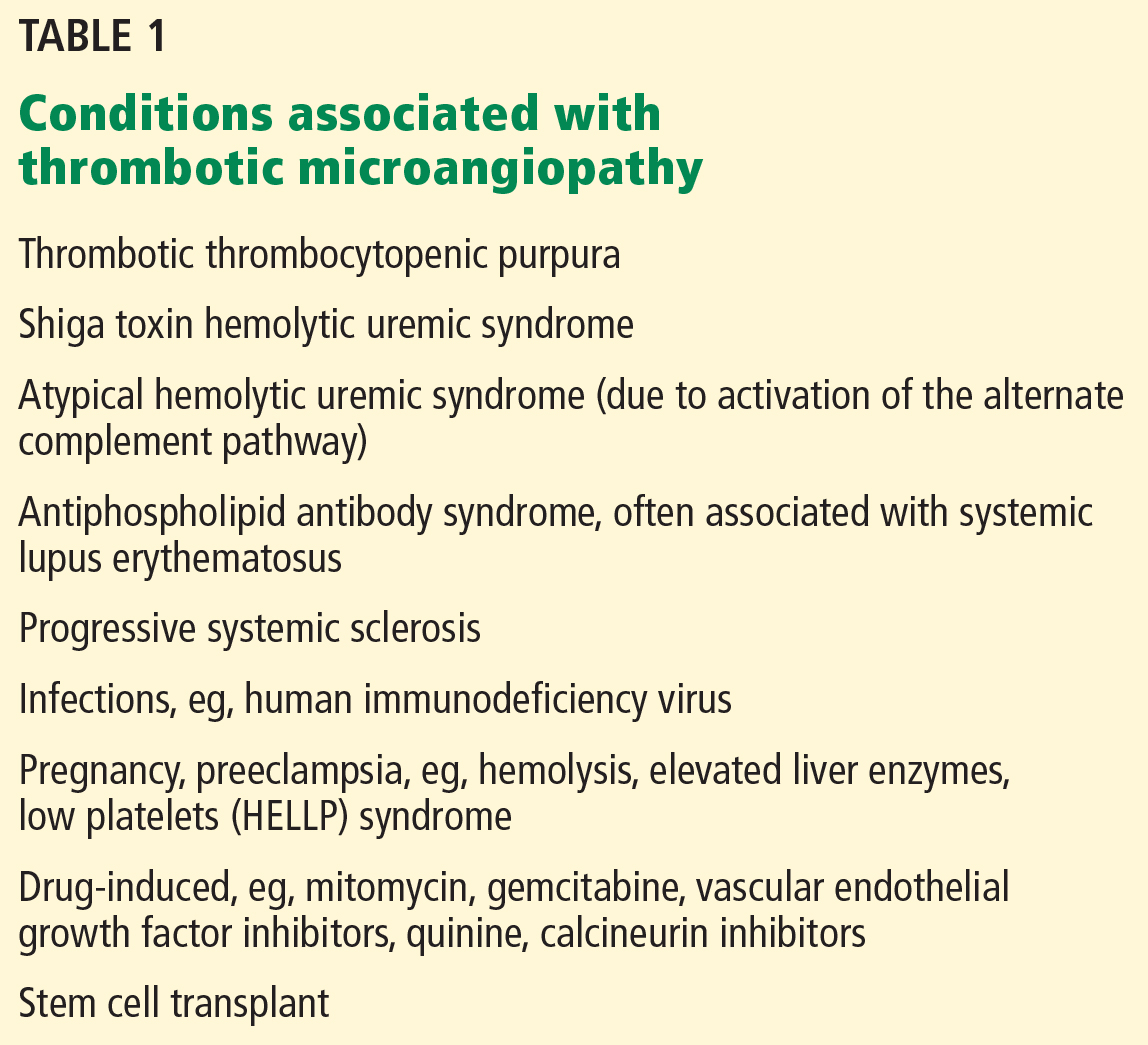
Many conditions involve thrombotic microangiopathies (Table 1). This article reviews the most common ones, ie, thrombotic thrombocytopenic purpura, hemolytic uremic syndrome, atypical hemolytic uremic syndrome, and antiphospholipid syndrome—their clinical features (focusing on the kidney), course, and management. Of note, although the diseases are similar, their pathogeneses and treatments differ.
DIFFERENT PATHWAYS TO MULTIORGAN THROMBOSIS
The thrombotic microangiopathies are multisystem disorders that can affect children and adults and often present with prominent renal and neurologic involvement. Endothelial injury is likely the inciting factor leading to thrombosis in the kidney and in many other organs. The causes variously include:
- Toxins from bacteria or drugs
- Abnormal complement activation, genetic or autoantibody-induced
- Procoagulant factors, eg, antiphospholipid antibodies
- Loss of anticoagulants, eg, from a defect of ADAMTS13 (a disintegrin and metalloproteinase with thrombospondin type 1 motif, member 13); ADAMTS13 is also known as von Willebrand factor-cleaving protease
- Severe hypertension.
The histopathologic features are similar in all the thrombotic microangiopathies. Laboratory findings include thrombocytopenia, microangiopathic hemolytic anemia (with schistocytes on the peripheral blood smear), and high serum lactate dehydrogenase (LDH) levels; these are also markers of treatment progress. Bilirubin may be elevated and haptoglobin absent. Renal biopsy reveals thrombi in the glomeruli and arterioles.
THROMBOTIC THROMBOCYTOPENIC PURPURA
A young woman with fever, bruising, and renal failure, then blindness
A 36-year-old black woman who had been previously healthy presents to her doctor with fever and bruising.
Her hematocrit is 28% (reference range 38%–46%), platelet count 15 x 109/L (150–450), and prothrombin and partial thromboplastin times are normal. Her peripheral blood smear shows microangiopathic hemolytic anemia with schistocytes.
Over the next few days, her urine output declines and she develops sudden blindness followed by decreased mental acuity. Blood is drawn and sent for ADAMTS13 assay. Treatment is started at once with daily therapeutic plasma exchange. The assay results, when they arrive, show marked ADAMTS13 reduction (< 5%). Over the ensuing weeks, her mental acuity improves, her vision returns, and her renal function improves.
ADAMTS13 deficiency is definitive
Thrombotic thrombocytopenic purpura is characterized by:
- Neurologic abnormalities and acute renal failure
- Thrombocytopenia and microangiopathic hemolytic anemia
- Histologic evidence of thrombotic microangiopathy
- Deficiency of von Willebrand factor-cleaving protease (ADAMTS13 < 10%).
von Willebrand factor forms ultralarge multimers in the circulation that interact with platelets; these are normally cleaved by ADAMTS13. With ADAMTS13 deficiency (from either a genetic mutation or autoantibodies), the ultralarge multimers lead to coagulation as blood flows through small vessels.1
In 2003, Tsai2 evaluated 127 patients over age 10 who had thrombocytopenia and microangiopathic hemolysis with no plausible cause or features suggestive of hemolytic uremic syndrome. All were severely deficient in ADAMTS13. Subsequently, thrombotic thrombocytopenic purpura has been defined by a severe actual or effective deficiency of ADAMTS13.
Prompt plasma exchange is critical
Although the ADAMTS13 assay is important for diagnosing thrombotic thrombocytopenic purpura, in suspected cases daily plasma exchange should be started promptly, before test results return. Plasma exchange removes autoantibodies to ADAMTS13 from the blood, removes circulating ultralarge von Willebrand factor multimers, and replaces the missing ADAMTS13. Untreated, the disease is progressive, with irreversible renal failure, neurologic deterioration, and a 90% mortality rate. Plasma exchange reduces the mortality rate to less than 15%. If another diagnosis is confirmed, plasma exchange can be stopped.
Plasma exchange has been shown in clinical trials to be superior to plasma infusion in normalizing platelet counts and reducing mortality.3,4 Mortality rates were comparable with different replacement fluids vs fresh-frozen plasma, including solvent or detergent-treated plasma, and cryo-poor (cryosupernatant) plasma.4 Antiplatelet therapy, platelet transfusions, and splenectomy are ineffective.
Glucocorticoids for early treatment
An appropriate strategy is to add a glucocorticoid to plasma-exchange therapy at once (oral prednisone 1 mg/kg per day or intravenous methylprednisolone 125 mg twice daily) and withdraw it after several days if it is determined that it is not needed. Steroids for suspected thrombotic thrombocytopenic purpura can be justified for several reasons:
- The results of the ADAMTS13 assay are usually delayed, so steroids provide coverage for other diagnoses.
- They are helpful if thrombotic thrombocytopenic purpura is idiopathic (which is true for most cases) and if the patient has a poor response to initial therapy with plasma exchange.
- They are indicated for patients whose platelet counts do not increase with several days of plasma exchange or whose thrombocytopenia recurs as plasma exchange is decreased.
Rituximab improves survival
Rituximab, a chimeric (half murine) monoclonal antibody against CD19 and CD20 B cells, suppresses antibody production by knocking out the precursors of antibody-producing cells.
Anecdotal reports and small studies involving a total of 42 patients have been published on the use of rituximab for thrombotic thrombocytopenic purpura. Courses of rituximab varied greatly, from 1 to 13 weekly doses at 375 mg/m2, with 4 doses being the most common. Complete remission occurred in 90% of cases.5,6 A typical study from 2014 involved 48 patients (30 of whom received rituximab) followed by severe ADAMTS13 deficiency during remission.7 Despite the small study size, the investigators found significantly improved relapse-free survival rates with rituximab treatment.
But rituximab can cost $25,000 for 2 doses of 1,000 mg, and this will most likely prohibit its routine use. The cost and insurance coverage vary with location and policies.
Based on such studies, a reasonable strategy is to treat thrombotic thrombocytopenic purpura with:
- Daily plasma exchange
- Steroids, at least until the diagnosis is certain
- Rituximab if warranted.
New targeted therapies
Caplacizumab, a humanized immunoglobulin that inhibits the interaction between ultralarge von Willebrand factor multimers and platelets, has the potential to change this strategy when it receives US Food and Drug Administration approval, which is expected soon.
Peyvandi et al8 randomized 75 patients with acquired thrombotic thrombocytopenic purpura to either subcutaneous caplacizumab 10 mg daily for 30 days or placebo. Both groups had daily plasma exchange. The treatment group had a 39% reduction in median time to normalization of platelets vs the placebo group, and 3 of 36 patients had exacerbations, compared with 11 of 39 patients in the placebo group. Although 8 patients relapsed within the first month after stopping caplacizumab, their cases were brought under control. There were also more bleeding episodes with caplacizumab (54% vs 38%), most being mild to moderate. Two patients in the placebo group died, but none in the treatment group.
The fact that platelet normalization occurred significantly faster with caplacizumab, even in some patients who had not yet had plasma exchange therapy initiated, has enormous clinical significance. The low platelet count in thrombotic thrombocytopenic purpura is a marker of susceptibility to rapid damage to the brain and kidneys, so correcting it quickly is critical.
Other strategies for new drug development include replacing the deficient ADAMTS13 with a recombinant molecule and blocking antibody production (the same mode of action as rituximab and glucocorticoids).9 Using all 3 strategies to treat thrombotic thrombocytopenic purpura may be the future standard of care.
HEMOLYTIC UREMIC SYNDROME
A child with sudden onset of bloody diarrhea and kidney failure
A 4-year-old girl plays with baby animals at a petting zoo and does not wash her hands immediately afterwards. Three days later, she develops fever, abdominal cramps, nausea, vomiting, and bloody diarrhea. Her pediatrician gives her antibiotics. On day 6, she develops ecchymoses on the extremities and lips, thrombocytopenia, low urine output, and seizures. Her stool tests positive for Escherichia coli O157:H7
Classic presentation: Young patient with bloody diarrhea
The classic presentation of hemolytic uremic syndrome is of a young patient with bloody diarrhea typically lasting 5 to 10 days. Kidney failure may follow, requiring dialysis in about 60% of patients for a mean of 10 days. About one-fourth of patients develop neurologic symptoms, and about the same fraction are left with long-term morbidity, eg, hypertension, proteinuria, and reduced glomerular filtration rate. The mortality rate is typically 4%10,11 but varies with the outbreak.
Histologically, the kidneys look identical to those in thrombotic thrombocytopenic purpura, with thrombi in glomeruli and small vessels.
E coli is the most common culprit, but other bacteria, including Shigella dysenteriae, and viruses are sometimes the cause. Fewer than 10% of children infected with Shiga toxin-positive E coli, also known as enterohemorrhagic E coli (O157:H7, O104:H4), develop hemolytic uremic syndrome.
Lessons from outbreaks
Petting zoos are a common source of transmission of pathogenic bacteria. Disease can be extremely serious: in 15 cases linked to a Florida petting zoo, 3 children died.
Other outbreaks involving pathogenic E coli have been tied to fresh vegetables and to undercooked hamburger at fast-food chains.
In Germany in 2011, more than 3,000 people acquired Shiga toxin nonhemolytic uremic syndrome due to E coli, and 16 of them died. In addition, 845 acquired hemolytic uremic syndrome, and 36 died. This outbreak was associated with the more virulent and less common O104:H4 strain, which has acquired a Shiga toxin-encoding phage. Patients were treated with quinolone antibiotics, which actually increase toxin production in this strain.12
Unusual in the German epidemic was that more adults were affected (88%), especially women (68% of cases).13 The source of infection was eventually found to be alfalfa sprouts, the seeds of which had been contaminated by E coli. Women did not harbor any intrinsic factor making them more susceptible; rather, they were more likely to eat salads.13
Supportive management
Supportive care is most important. Transfusion with packed red blood cells is indicated for hemoglobin below 6 g/dL. Hypertension should be controlled and dialysis provided. For central nervous system involvement or severe disease, plasma exchange is sometimes used.
Eculizumab was tried for a time as therapy but did not prove to be of benefit. Shiga toxin-binding agents have been developed, but by the time they are given it is too late in the disease process to help.
Antibiotics may harm; it is possible that they kill beneficial bacteria, allowing the Shiga toxin-producing E coli to better proliferate. Antimotility agents also are contraindicated. Other agents not recommended include urokinase, heparin, dipyridamole, and vincristine. Splenectomy is not advised.
The most important way to control hemolytic uremic syndrome is to prevent it by thoroughly cooking meat, cleaning fresh produce, and having children wash their hands after petting animals.
ATYPICAL HEMOLYTIC UREMIC SYNDROME
A young man in renal failure
A 28-year-old man has a history of “thrombotic thrombocytopenic purpura-hemolytic uremic syndrome” at age 12. He slowly progresses to end-stage renal disease and receives a renal transplant from his mother at age 20 that fails after 3 months. The renal transplant biopsy report at the time reads “thrombotic microangiopathy.” The patient’s brother also requires dialysis.
The patient’s complement values are low, especially C3. His father is offering him a kidney at this time, and the patient wants to know whether to proceed.
Normal ADAMTS13, no diarrhea
Hemolytic uremic syndrome without diarrhea is now called atypical hemolytic uremic syndrome. Patients have normal levels of ADAMTS13, do not have diarrhea, and have no evidence of Shiga toxin-producing E coli.
Continuous complement pathway activation
The complement system is part of the innate immune system, which provides immediate defense against infection and does not evolve as does the adaptive immune system. The classic complement pathway is activated by the C1 antibody-antigen complex. The alternative complement pathway leads to the same pathway via C3.14 Both pathways lead to the formation of C5 through C9 membrane attack complexes, which form channels across the membranes of target cells, leading to cell lysis and death.
The alternate pathway does not require an antibody trigger so is always active at a low level. Inhibitory factors (factor H, factor I, membrane cofactor protein, factor H-related proteins) are naturally present and slow it down at various steps. People who are born with an abnormal factor or, more commonly, develop antibodies against one of the factors, have uninhibited complement activation. If this happens in the blood vessels, massive coagulation and atypical hemolytic uremic syndrome ensues. The endothelial damage and clotting in the brain, kidney, and other organs are identical to that of hemolytic uremic syndrome caused by Shiga toxin.
Treat with eculizumab
Historically, atypical hemolytic uremic syndrome was treated with plasma exchange, which replaces defective complement regulatory proteins and removes inhibitory antibodies.
Understanding the complement pathways is key to developing drugs that target atypical hemolytic uremic syndrome, and about 60 are in the pipeline. The only one currently approved in the United States for atypical hemolytic uremic syndrome is eculizumab, a humanized monoclonal antibody that binds with high affinity to C5, blocking the end of the complement cascade and preventing formation of the membrane attack complex.15–18
The effects of eculizumab on atypical hemolytic uremic syndrome were studied in 2 prospective trials.19 Platelet counts rose rapidly within weeks of starting treatment, and kidney function improved. Benefits continued throughout the 64 weeks studied. There were no deaths among the 37 patients enrolled, and although these were single-arm trials, they provide evidence of dramatic benefit considering the high mortality risk of this disease.
Eculizumab is now considered the treatment of choice. It may be used empirically for patients with hemolytic uremic syndrome who test negative for Shiga toxin and antiphospholipid antibody, and who do not have a very low level of ADAMTS13. The big drawback of eculizumab is its high price,20–22 which varies by amount used, location, and pharmacy negotiation, but can be in the hundreds of thousands of dollars.
For a patient with atypical hemolytic uremic syndrome on dialysis, treatment with eculizumab should continue for 4 to 6 months if there are no extrarenal manifestations. But many patients continue to have the defect in the complement system, so the problem may recur.
Case revisited
For our patient considering a kidney transplant, many experts feel that a transplant can be done as long as platelet counts are monitored and treatment with eculizumab is restarted if needed. One can also make the case for waiting a few years for new oral drugs to become available before offering transplant.
ANTIPHOSPHOLIPID SYNDROME
A young woman with a history of thrombosis and miscarriages
A 27-year-old woman presents with arthralgias, low-grade fever, and malaise. She has a history of 3 spontaneous abortions and Raynaud phenomenon. Two years ago, she had deep vein thrombosis of the right calf after a long automobile trip.
She now has swollen metacarpophalangeal and proximal interphalangeal joints, livedo reticularis (a mottled venous pattern of the skin best seen under fluorescent light) of the legs and arms, and ankle edema (2-cm indentation).
Her blood pressure is 152/92 mm Hg. Laboratory values:
- White blood cell count 3.6 × 10⁹/L (reference range 4.5–11.0)
- Hematocrit 24% (36%–47%)
- Platelet count 89 × 109/L (150–450)
- Urinalysis: protein 4+, heme 3+, red blood cells 8–15 per high-power field (< 3), red blood cell casts present
- Blood urea nitrogen 43 mg/dL (10–20)
- Creatinine 2.6 mg/dL (0.5–1.1).
- Prothrombin time 14.6 s (10–14)
- Partial thromboplastin time 85 s (25–35)
- Antinuclear antibody positive at 1:160
- Anti-double-stranded DNA and serum complement normal
- Syphilis serologic screening (VDRL) positive.
The patient has leukopenia, anemia, thrombocytopenia, hematuria, proteinuria, high blood urea nitrogen, and markedly elevated partial thromboplastin time. Although she has a positive antinuclear antibody test and renal dysfunction, her anti-dsDNA and serum complement tests are normal, making the diagnosis of systemic lupus erythematosus unlikely.
Consider antiphospholipid syndrome
In any patient with multiple pregnancy losses, lupus, or a history of thrombosis, antiphospholipid syndrome should be considered.
In a series of patients with antiphospholipid antibody who underwent kidney biopsy, more than half were men, indicating that, unlike lupus, this is not primarily a disease of young women.
Diagnosis based on specific criteria
Clinical criteria require at least one of the following in the patient’s history23:
- One or more episodes of arterial, venous, or small-vessel thrombosis
- Unexplained pregnancy morbidity (death of a fetus or neonate with normal morphology or 3 or more spontaneous abortions).
Serologic criteria for any of the following antiphospholipid antibodies require that at least one of the following tests be positive at least twice and at least 12 weeks apart:
- Anticardiolipin antibodies—high-titer immunoglobulin (Ig) G or IgM
- Autoantibodies for beta 2-glycoprotein
- Lupus anticoagulant—autoantibodies that increase clotting time in vitro and target beta 2-glycoprotein I and prothrombin (despite its name and actions in vitro, lupus anticoagulant functions as a coagulant).
As with the other thrombotic microangiopathies, patients with anticardiolipin syndrome have microthrombi in the glomeruli and blood vessels that are evident on kidney biopsy.
Suspect condition in likely groups
Antiphospholipid syndrome is surprisingly common.24 In a case-control study, de Groot et al25 found that 3.1% of patients under age 70 with a first episode of venous thrombosis and no known cancer were positive for lupus anticoagulant vs 0.9% of controls. In another case-control study, Urbanus et al26 found that 17% of women under age 50 with a stroke tested positive for lupus anticoagulant compared with less than 1% of controls. Because of such studies, it has become routine to test for anticardiolipin and lupus anticoagulant in young patients presenting with a stroke.
About 1% of women trying to have children have recurrent miscarriages, and of these, 10% to 15% have antiphospholipid antibody present.27–30
Pathogenesis
Patients with antiphospholipid syndrome have a much higher proportion of plasma beta 2-glycoprotein in the oxidized form than do healthy controls. The level is also higher than in patients with a different autoimmune disease whether or not they have antibodies against beta 2-glycoprotein 1. Although about 40% of patients with lupus have an anticardiolipin antibody, only a small percentage develop antiphospholipid syndrome with clotting.
It is thought that antiphospholipid syndrome involves initial injury to the endothelium, then potentiation of thrombus formation. Oxidized beta 2-glycoprotein complexes may bind to the endothelial cell surface, causing it to become the target of antibodies. The exact relationships between the factors are not yet understood.
The risk of a thrombotic event in an asymptomatic patient positive for all 3 factors—lupus anticoagulant, anticardiolipin antibody, and anti-beta 2-glycoprotein I antibody—is more than 5% per year.31
Manage thrombosis with anticoagulation
Khamashta et al,32 in a 1995 study, retrospectively studied patients with antiphospholipid antibodies and a history of thrombosis. Of 147 patients, 66 had idiopathic primary disease, 62 had systemic lupus, and 19 had “lupus-like” disease. Almost 70% (101 patients) had a recurrence of thrombosis, totaling 186 events. The mean time to recurrence was 12 months (range 2 weeks to 12 years). Recurrence rates were 0.01 events per patient per year with high-dose warfarin, 0.23 with low-dose warfarin, and 0.18 with aspirin. But the highest bleeding rates were in the 6 months after warfarin withdrawal; 29 patients had bleeding events, one-fourth of which were severe.
Standard therapy has become anticoagulation, starting with heparin or enoxaparin, then warfarin. There is inadequate evidence for the role of newer oral anticoagulant therapy.
A very high INR is not generally better than a moderately elevated level
For a time, it was thought that the international normalized ratio (INR) should be kept on the very high side to prevent thrombosis.
Crowther et al33 conducted a randomized, double-blind trial comparing moderate warfarin therapy (INR 2.0–3.0) and high-intensity warfarin therapy (INR 3.1–4.0) in antiphospholipid syndrome. Thrombosis actually recurred more frequently in the high-intensity therapy group (10.7% vs 3.4%), with no significant difference in major bleeding events.
A reasonable strategy is to keep the INR between 2.5 and 3.0, keeping in mind that values fluctuate in any individual patient. A higher goal often leads to excessive anticoagulation and bleeding. If the goal is too low, recurrent thrombosis becomes more likely. There are fewer data on the newer oral anticoagulants, but their role is likely to increase as reversal agents are developed.
Recommendations published in 2003 for treating antiphospholipid syndrome include34:
- Warfarin (INR 2.0–3.0) after the first thrombotic event
- Warfarin (INR 3.0–4.0) if a clot develops despite warfarin
- Warfarin (INR > 3.0) for an arterial event.
For the rare but catastrophic antiphospholipid syndrome in which thrombosis occurs in multiple organs, recommendations are for heparin plus steroids, with or without intravenous immunoglobulin and plasmapheresis. This approach has not always been successful, and the mortality rate is high.
Treatment of asymptomatic carriers is uncertain
Treatment of asymptomatic carriers of the antiphospholipid antibody is controversial. Evidence for management is scarce; some experts recommend aspirin therapy, but benefit has yet to be proven in clinical trials.
Canaud et al35 documented the role of activation of the kinase mammalian target of rapamycin (mTOR) in the vascular changes characteristic of antiphospholipid nephropathy. Postkidney transplant surveillance biopsies of patients with antiphospholipid antibodies showed vascular damage occurring over time (despite patients being asymptomatic) compared with other renal transplant patients. Patients with antiphospholipid antibodies who were treated with the immunosuppressive drug sirolimus were protected from developing these changes. Twelve years after transplant, 70% of patients with antiphospholipid antibodies taking sirolimus still had a functioning graft compared with 11% of untreated patients.
- Sadler JE. Von Willebrand factor, ADAMTS13, and thrombotic thrombocytopenic purpura. Blood 2008; 112:11–18.
- Tsai HM. Advances in the pathogenesis, diagnosis, and treatment of thrombotic thrombocytopenic purpura. J Am Soc Nephrol 2003; 14:1072–1081.
- Rock GA, Shumak KH, Buskard NA, et al. Comparison of plasma exchange with plasma infusion in the treatment of thrombotic thrombocytopenic purpura. Canadian Apheresis Study Group. N Engl J Med 1991; 325:393–397.
- Brunskill SJ, Tusold A, Benjamin S, Stanworth SJ, Murphy MF. A systematic review of randomized controlled trials for plasma exchange in the treatment of thrombotic thrombocytopenic purpura. Transfus Med 2007; 17:17–35.
- Jasti S, Coyle T, Gentile T, Rosales L, Poiesz B. Rituximab as an adjunct to plasma exchange in TTP: a report of 12 cases and review of literature. J Clin Apher 2008; 23:151–156.
- Ling HT, Field JJ, Blinder MA. Sustained response with rituximab in patients with thrombotic thrombocytopenic purpura: a report of 13 cases and review of the literature. Am J Hematol 2009; 84:418–421.
- Hie M, Gay J, Galicier L, et al; French Thrombotic Microangiopathies Reference Centre. Preemptive rituximab infusions after remission efficiently prevent relapses in acquired thrombotic thrombocytopenic purpura. Blood 2014; 124:204–210.
- Peyvandi F, Scully M, Kremer Hovinga JA, et al; TITAN Investigators. Caplacizumab for acquired thrombotic thrombocytopenic purpura. N Engl J Med 2016; 374:511–522.
- Veyradier A. Von Willebrand factor—a new target for TTP treatment? N Engl J Med 2016; 374:583–585.
- Boyce TG, Swerdlow DL, Griffin PM. Escherichia coli O157:H7 and the hemolytic-uremic syndrome. N Engl J Med 1995; 333:364–368.
- Gerber A, Karch H, Allerberger F, Verweyen HM, Zimmerhackl LB. Clinical course and the role of Shiga toxin-producing Escherichia coli infection in the hemolytic-uremic syndrome in pediatric patients, 1997–2000, in Germany and Austria: a prospective study. J Infect Dis 2002; 186:493–500.
- Rasko DA, Webster DR, Sahl JW, et al. Origins of the E. coli strain causing an outbreak of hemolytic-uremic syndrome in Germany. N Engl J Med 2011; 365:709–717.
- Frank C, Werber D, Cramer JP, et al; HUS Investigation Team. Epidemic profile of Shiga-toxin-producing Escherichia coli O104:H4 outbreak in Germany. N Engl J Med 2011; 365:1771–1780.
- Bomback AS, Appel GB. Pathogenesis of the C3 glomerulopathies and reclassification of MPGN. Nat Rev Nephrol 2012; 8:634–642.
- Figueroa JE, Densen P. Infectious diseases associated with complement deficiencies. Clin Microbiol Rev 1991; 4:359–395.
- Walport MJ. Complement. First of two parts. N Engl J Med 2001; 344:1058–1066.
- Rother RP, Rollins SA, Mojcik CF, Brodsky RA, Bell L. Discovery and development of the complement inhibitor eculizumab for the treatment of paroxysmal nocturnal hemoglobinuria. Nat Biotechnol 2007; 25:1256–1264.
- Soliris (eculizumab). Prescribing information. Alexion Pharmaceuticals, Inc.
- Legendre CM, Licht C, Muus P, et al. Terminal complement inhibitor eculizumab in atypical hemolytic–uremic syndrome. N Engl J Med 2013; 368:2169–2181.
- Kim JJ, Waller SC, Reid CJ. Eculizumab in atypical haemolytic-uraemic syndrome allows cessation of plasma exchange and dialysis. Clin Kidney J 2012; 5:34–36.
- Povey H, Vundru R, Junglee N, Jibani M. Renal recovery with eculizumab in atypical hemolytic uremic syndrome following prolonged dialysis. Clin Nephrol 2014; 82:326–331.
- Gargau M, Azancot M, Ramos R, Sanchez-Corral P, Montero MA, Seron D. Early treatment with eculizumab may be beneficial in atypical haemolytic uraemic syndrome. Clin Kidney J 2012; 5:1–3.
- Miyakis S, Lockshin MD, Atsumi T, et al. International consensus statement on an update of the classification criteria for definite antiphospholipid syndrome (APS). J Thromb Haemost 2006; 4:295–306.
- Giannakopoulos B, Krilis SA. The pathogenesis of the antiphospholipid syndrome. N Engl J Med 2013; 368:1033–1044.
- de Groot PG, Lutters B, Derksen RH, Lisman T, Meijers JC, Rosendaal FR. Lupus anticoagulants and the risk of a first episode of deep venous thrombosis. J Thromb Haemost 2005; 3:1993–1997.
- Urbanus RT, Siegerink B, Roest M, Rosendaal FR, de Groot PG, Algra A. Antiphospholipid antibodies and risk of myocardial infarction and ischaemic stroke in young women in the RATIO study: a case-control study. Lancet Neurol 2009; 8:998–1005.
- Ruiz-Irastorza G, Crowther M, Branch W, Khamashta MA. Antiphospholipid syndrome. Lancet 2010; 376:1498–1509.
- Stirrat GM. Recurrent miscarriage I: definition and epidemiology. Lancet 1990; 336:673–675.
- Rai RS, Regan L, Clifford K, et al. Antiphospholipid antibodies and beta 2-glycoprotein-I in 500 women with recurrent miscarriage: results of a comprehensive screening approach. Hum Reprod 1995; 10:2001–2005.
- Yetman DL, Kutteh WH. Antiphospholipid antibody panels and recurrent pregnancy loss: prevalence of anticardiolipin antibodies compared with other antiphospholipid antibodies. Fertil Steril 1996; 66:540–546.
- Pengo V, Ruffatti A, Legnani C, et al. Incidence of a first thromboembolic event in asymptomatic carriers of high-risk antiphospholipid antibody profile: a multicenter prospective study. Blood 2011; 118:4714–4718.
- Khamashta MA, Cuadrado MJ, Mujic F, Taub NA, Hunt BJ, Hughes GR. The management of thrombosis in the antiphospholipid-antibody syndrome. N Engl J Med 1995; 332:993–997.
- Crowther MA, Ginsberg JS, Julian J, et al. A comparison of two intensities of warfarin for the prevention of recurrent thrombosis in patients with the antiphospholipid antibody syndrome. N Engl J Med 2003; 349:1133–1138.
- Lockshin M, Tenedios F, Petri M, et al. Cardiac disease in the antiphospholipid syndrome: recommendations for treatment. Committee consensus report. Lupus 2003; 12:518–523.
- Canaud G, Bienaimé F, Tabarin F, et al. Inhibition of the mTORC pathway in the antiphospholipid syndrome. N Engl J Med 2014; 371:303–312.
Our knowledge of the pathogenesis of thrombotic microangiopathies has greatly advanced in the last decade, improving the diagnosis and treatment of these diseases.
Many conditions involve thrombotic microangiopathies (Table 1). This article reviews the most common ones, ie, thrombotic thrombocytopenic purpura, hemolytic uremic syndrome, atypical hemolytic uremic syndrome, and antiphospholipid syndrome—their clinical features (focusing on the kidney), course, and management. Of note, although the diseases are similar, their pathogeneses and treatments differ.
DIFFERENT PATHWAYS TO MULTIORGAN THROMBOSIS
The thrombotic microangiopathies are multisystem disorders that can affect children and adults and often present with prominent renal and neurologic involvement. Endothelial injury is likely the inciting factor leading to thrombosis in the kidney and in many other organs. The causes variously include:
- Toxins from bacteria or drugs
- Abnormal complement activation, genetic or autoantibody-induced
- Procoagulant factors, eg, antiphospholipid antibodies
- Loss of anticoagulants, eg, from a defect of ADAMTS13 (a disintegrin and metalloproteinase with thrombospondin type 1 motif, member 13); ADAMTS13 is also known as von Willebrand factor-cleaving protease
- Severe hypertension.
The histopathologic features are similar in all the thrombotic microangiopathies. Laboratory findings include thrombocytopenia, microangiopathic hemolytic anemia (with schistocytes on the peripheral blood smear), and high serum lactate dehydrogenase (LDH) levels; these are also markers of treatment progress. Bilirubin may be elevated and haptoglobin absent. Renal biopsy reveals thrombi in the glomeruli and arterioles.
THROMBOTIC THROMBOCYTOPENIC PURPURA
A young woman with fever, bruising, and renal failure, then blindness
A 36-year-old black woman who had been previously healthy presents to her doctor with fever and bruising.
Her hematocrit is 28% (reference range 38%–46%), platelet count 15 x 109/L (150–450), and prothrombin and partial thromboplastin times are normal. Her peripheral blood smear shows microangiopathic hemolytic anemia with schistocytes.
Over the next few days, her urine output declines and she develops sudden blindness followed by decreased mental acuity. Blood is drawn and sent for ADAMTS13 assay. Treatment is started at once with daily therapeutic plasma exchange. The assay results, when they arrive, show marked ADAMTS13 reduction (< 5%). Over the ensuing weeks, her mental acuity improves, her vision returns, and her renal function improves.
ADAMTS13 deficiency is definitive
Thrombotic thrombocytopenic purpura is characterized by:
- Neurologic abnormalities and acute renal failure
- Thrombocytopenia and microangiopathic hemolytic anemia
- Histologic evidence of thrombotic microangiopathy
- Deficiency of von Willebrand factor-cleaving protease (ADAMTS13 < 10%).
von Willebrand factor forms ultralarge multimers in the circulation that interact with platelets; these are normally cleaved by ADAMTS13. With ADAMTS13 deficiency (from either a genetic mutation or autoantibodies), the ultralarge multimers lead to coagulation as blood flows through small vessels.1
In 2003, Tsai2 evaluated 127 patients over age 10 who had thrombocytopenia and microangiopathic hemolysis with no plausible cause or features suggestive of hemolytic uremic syndrome. All were severely deficient in ADAMTS13. Subsequently, thrombotic thrombocytopenic purpura has been defined by a severe actual or effective deficiency of ADAMTS13.
Prompt plasma exchange is critical
Although the ADAMTS13 assay is important for diagnosing thrombotic thrombocytopenic purpura, in suspected cases daily plasma exchange should be started promptly, before test results return. Plasma exchange removes autoantibodies to ADAMTS13 from the blood, removes circulating ultralarge von Willebrand factor multimers, and replaces the missing ADAMTS13. Untreated, the disease is progressive, with irreversible renal failure, neurologic deterioration, and a 90% mortality rate. Plasma exchange reduces the mortality rate to less than 15%. If another diagnosis is confirmed, plasma exchange can be stopped.
Plasma exchange has been shown in clinical trials to be superior to plasma infusion in normalizing platelet counts and reducing mortality.3,4 Mortality rates were comparable with different replacement fluids vs fresh-frozen plasma, including solvent or detergent-treated plasma, and cryo-poor (cryosupernatant) plasma.4 Antiplatelet therapy, platelet transfusions, and splenectomy are ineffective.
Glucocorticoids for early treatment
An appropriate strategy is to add a glucocorticoid to plasma-exchange therapy at once (oral prednisone 1 mg/kg per day or intravenous methylprednisolone 125 mg twice daily) and withdraw it after several days if it is determined that it is not needed. Steroids for suspected thrombotic thrombocytopenic purpura can be justified for several reasons:
- The results of the ADAMTS13 assay are usually delayed, so steroids provide coverage for other diagnoses.
- They are helpful if thrombotic thrombocytopenic purpura is idiopathic (which is true for most cases) and if the patient has a poor response to initial therapy with plasma exchange.
- They are indicated for patients whose platelet counts do not increase with several days of plasma exchange or whose thrombocytopenia recurs as plasma exchange is decreased.
Rituximab improves survival
Rituximab, a chimeric (half murine) monoclonal antibody against CD19 and CD20 B cells, suppresses antibody production by knocking out the precursors of antibody-producing cells.
Anecdotal reports and small studies involving a total of 42 patients have been published on the use of rituximab for thrombotic thrombocytopenic purpura. Courses of rituximab varied greatly, from 1 to 13 weekly doses at 375 mg/m2, with 4 doses being the most common. Complete remission occurred in 90% of cases.5,6 A typical study from 2014 involved 48 patients (30 of whom received rituximab) followed by severe ADAMTS13 deficiency during remission.7 Despite the small study size, the investigators found significantly improved relapse-free survival rates with rituximab treatment.
But rituximab can cost $25,000 for 2 doses of 1,000 mg, and this will most likely prohibit its routine use. The cost and insurance coverage vary with location and policies.
Based on such studies, a reasonable strategy is to treat thrombotic thrombocytopenic purpura with:
- Daily plasma exchange
- Steroids, at least until the diagnosis is certain
- Rituximab if warranted.
New targeted therapies
Caplacizumab, a humanized immunoglobulin that inhibits the interaction between ultralarge von Willebrand factor multimers and platelets, has the potential to change this strategy when it receives US Food and Drug Administration approval, which is expected soon.
Peyvandi et al8 randomized 75 patients with acquired thrombotic thrombocytopenic purpura to either subcutaneous caplacizumab 10 mg daily for 30 days or placebo. Both groups had daily plasma exchange. The treatment group had a 39% reduction in median time to normalization of platelets vs the placebo group, and 3 of 36 patients had exacerbations, compared with 11 of 39 patients in the placebo group. Although 8 patients relapsed within the first month after stopping caplacizumab, their cases were brought under control. There were also more bleeding episodes with caplacizumab (54% vs 38%), most being mild to moderate. Two patients in the placebo group died, but none in the treatment group.
The fact that platelet normalization occurred significantly faster with caplacizumab, even in some patients who had not yet had plasma exchange therapy initiated, has enormous clinical significance. The low platelet count in thrombotic thrombocytopenic purpura is a marker of susceptibility to rapid damage to the brain and kidneys, so correcting it quickly is critical.
Other strategies for new drug development include replacing the deficient ADAMTS13 with a recombinant molecule and blocking antibody production (the same mode of action as rituximab and glucocorticoids).9 Using all 3 strategies to treat thrombotic thrombocytopenic purpura may be the future standard of care.
HEMOLYTIC UREMIC SYNDROME
A child with sudden onset of bloody diarrhea and kidney failure
A 4-year-old girl plays with baby animals at a petting zoo and does not wash her hands immediately afterwards. Three days later, she develops fever, abdominal cramps, nausea, vomiting, and bloody diarrhea. Her pediatrician gives her antibiotics. On day 6, she develops ecchymoses on the extremities and lips, thrombocytopenia, low urine output, and seizures. Her stool tests positive for Escherichia coli O157:H7
Classic presentation: Young patient with bloody diarrhea
The classic presentation of hemolytic uremic syndrome is of a young patient with bloody diarrhea typically lasting 5 to 10 days. Kidney failure may follow, requiring dialysis in about 60% of patients for a mean of 10 days. About one-fourth of patients develop neurologic symptoms, and about the same fraction are left with long-term morbidity, eg, hypertension, proteinuria, and reduced glomerular filtration rate. The mortality rate is typically 4%10,11 but varies with the outbreak.
Histologically, the kidneys look identical to those in thrombotic thrombocytopenic purpura, with thrombi in glomeruli and small vessels.
E coli is the most common culprit, but other bacteria, including Shigella dysenteriae, and viruses are sometimes the cause. Fewer than 10% of children infected with Shiga toxin-positive E coli, also known as enterohemorrhagic E coli (O157:H7, O104:H4), develop hemolytic uremic syndrome.
Lessons from outbreaks
Petting zoos are a common source of transmission of pathogenic bacteria. Disease can be extremely serious: in 15 cases linked to a Florida petting zoo, 3 children died.
Other outbreaks involving pathogenic E coli have been tied to fresh vegetables and to undercooked hamburger at fast-food chains.
In Germany in 2011, more than 3,000 people acquired Shiga toxin nonhemolytic uremic syndrome due to E coli, and 16 of them died. In addition, 845 acquired hemolytic uremic syndrome, and 36 died. This outbreak was associated with the more virulent and less common O104:H4 strain, which has acquired a Shiga toxin-encoding phage. Patients were treated with quinolone antibiotics, which actually increase toxin production in this strain.12
Unusual in the German epidemic was that more adults were affected (88%), especially women (68% of cases).13 The source of infection was eventually found to be alfalfa sprouts, the seeds of which had been contaminated by E coli. Women did not harbor any intrinsic factor making them more susceptible; rather, they were more likely to eat salads.13
Supportive management
Supportive care is most important. Transfusion with packed red blood cells is indicated for hemoglobin below 6 g/dL. Hypertension should be controlled and dialysis provided. For central nervous system involvement or severe disease, plasma exchange is sometimes used.
Eculizumab was tried for a time as therapy but did not prove to be of benefit. Shiga toxin-binding agents have been developed, but by the time they are given it is too late in the disease process to help.
Antibiotics may harm; it is possible that they kill beneficial bacteria, allowing the Shiga toxin-producing E coli to better proliferate. Antimotility agents also are contraindicated. Other agents not recommended include urokinase, heparin, dipyridamole, and vincristine. Splenectomy is not advised.
The most important way to control hemolytic uremic syndrome is to prevent it by thoroughly cooking meat, cleaning fresh produce, and having children wash their hands after petting animals.
ATYPICAL HEMOLYTIC UREMIC SYNDROME
A young man in renal failure
A 28-year-old man has a history of “thrombotic thrombocytopenic purpura-hemolytic uremic syndrome” at age 12. He slowly progresses to end-stage renal disease and receives a renal transplant from his mother at age 20 that fails after 3 months. The renal transplant biopsy report at the time reads “thrombotic microangiopathy.” The patient’s brother also requires dialysis.
The patient’s complement values are low, especially C3. His father is offering him a kidney at this time, and the patient wants to know whether to proceed.
Normal ADAMTS13, no diarrhea
Hemolytic uremic syndrome without diarrhea is now called atypical hemolytic uremic syndrome. Patients have normal levels of ADAMTS13, do not have diarrhea, and have no evidence of Shiga toxin-producing E coli.
Continuous complement pathway activation
The complement system is part of the innate immune system, which provides immediate defense against infection and does not evolve as does the adaptive immune system. The classic complement pathway is activated by the C1 antibody-antigen complex. The alternative complement pathway leads to the same pathway via C3.14 Both pathways lead to the formation of C5 through C9 membrane attack complexes, which form channels across the membranes of target cells, leading to cell lysis and death.
The alternate pathway does not require an antibody trigger so is always active at a low level. Inhibitory factors (factor H, factor I, membrane cofactor protein, factor H-related proteins) are naturally present and slow it down at various steps. People who are born with an abnormal factor or, more commonly, develop antibodies against one of the factors, have uninhibited complement activation. If this happens in the blood vessels, massive coagulation and atypical hemolytic uremic syndrome ensues. The endothelial damage and clotting in the brain, kidney, and other organs are identical to that of hemolytic uremic syndrome caused by Shiga toxin.
Treat with eculizumab
Historically, atypical hemolytic uremic syndrome was treated with plasma exchange, which replaces defective complement regulatory proteins and removes inhibitory antibodies.
Understanding the complement pathways is key to developing drugs that target atypical hemolytic uremic syndrome, and about 60 are in the pipeline. The only one currently approved in the United States for atypical hemolytic uremic syndrome is eculizumab, a humanized monoclonal antibody that binds with high affinity to C5, blocking the end of the complement cascade and preventing formation of the membrane attack complex.15–18
The effects of eculizumab on atypical hemolytic uremic syndrome were studied in 2 prospective trials.19 Platelet counts rose rapidly within weeks of starting treatment, and kidney function improved. Benefits continued throughout the 64 weeks studied. There were no deaths among the 37 patients enrolled, and although these were single-arm trials, they provide evidence of dramatic benefit considering the high mortality risk of this disease.
Eculizumab is now considered the treatment of choice. It may be used empirically for patients with hemolytic uremic syndrome who test negative for Shiga toxin and antiphospholipid antibody, and who do not have a very low level of ADAMTS13. The big drawback of eculizumab is its high price,20–22 which varies by amount used, location, and pharmacy negotiation, but can be in the hundreds of thousands of dollars.
For a patient with atypical hemolytic uremic syndrome on dialysis, treatment with eculizumab should continue for 4 to 6 months if there are no extrarenal manifestations. But many patients continue to have the defect in the complement system, so the problem may recur.
Case revisited
For our patient considering a kidney transplant, many experts feel that a transplant can be done as long as platelet counts are monitored and treatment with eculizumab is restarted if needed. One can also make the case for waiting a few years for new oral drugs to become available before offering transplant.
ANTIPHOSPHOLIPID SYNDROME
A young woman with a history of thrombosis and miscarriages
A 27-year-old woman presents with arthralgias, low-grade fever, and malaise. She has a history of 3 spontaneous abortions and Raynaud phenomenon. Two years ago, she had deep vein thrombosis of the right calf after a long automobile trip.
She now has swollen metacarpophalangeal and proximal interphalangeal joints, livedo reticularis (a mottled venous pattern of the skin best seen under fluorescent light) of the legs and arms, and ankle edema (2-cm indentation).
Her blood pressure is 152/92 mm Hg. Laboratory values:
- White blood cell count 3.6 × 10⁹/L (reference range 4.5–11.0)
- Hematocrit 24% (36%–47%)
- Platelet count 89 × 109/L (150–450)
- Urinalysis: protein 4+, heme 3+, red blood cells 8–15 per high-power field (< 3), red blood cell casts present
- Blood urea nitrogen 43 mg/dL (10–20)
- Creatinine 2.6 mg/dL (0.5–1.1).
- Prothrombin time 14.6 s (10–14)
- Partial thromboplastin time 85 s (25–35)
- Antinuclear antibody positive at 1:160
- Anti-double-stranded DNA and serum complement normal
- Syphilis serologic screening (VDRL) positive.
The patient has leukopenia, anemia, thrombocytopenia, hematuria, proteinuria, high blood urea nitrogen, and markedly elevated partial thromboplastin time. Although she has a positive antinuclear antibody test and renal dysfunction, her anti-dsDNA and serum complement tests are normal, making the diagnosis of systemic lupus erythematosus unlikely.
Consider antiphospholipid syndrome
In any patient with multiple pregnancy losses, lupus, or a history of thrombosis, antiphospholipid syndrome should be considered.
In a series of patients with antiphospholipid antibody who underwent kidney biopsy, more than half were men, indicating that, unlike lupus, this is not primarily a disease of young women.
Diagnosis based on specific criteria
Clinical criteria require at least one of the following in the patient’s history23:
- One or more episodes of arterial, venous, or small-vessel thrombosis
- Unexplained pregnancy morbidity (death of a fetus or neonate with normal morphology or 3 or more spontaneous abortions).
Serologic criteria for any of the following antiphospholipid antibodies require that at least one of the following tests be positive at least twice and at least 12 weeks apart:
- Anticardiolipin antibodies—high-titer immunoglobulin (Ig) G or IgM
- Autoantibodies for beta 2-glycoprotein
- Lupus anticoagulant—autoantibodies that increase clotting time in vitro and target beta 2-glycoprotein I and prothrombin (despite its name and actions in vitro, lupus anticoagulant functions as a coagulant).
As with the other thrombotic microangiopathies, patients with anticardiolipin syndrome have microthrombi in the glomeruli and blood vessels that are evident on kidney biopsy.
Suspect condition in likely groups
Antiphospholipid syndrome is surprisingly common.24 In a case-control study, de Groot et al25 found that 3.1% of patients under age 70 with a first episode of venous thrombosis and no known cancer were positive for lupus anticoagulant vs 0.9% of controls. In another case-control study, Urbanus et al26 found that 17% of women under age 50 with a stroke tested positive for lupus anticoagulant compared with less than 1% of controls. Because of such studies, it has become routine to test for anticardiolipin and lupus anticoagulant in young patients presenting with a stroke.
About 1% of women trying to have children have recurrent miscarriages, and of these, 10% to 15% have antiphospholipid antibody present.27–30
Pathogenesis
Patients with antiphospholipid syndrome have a much higher proportion of plasma beta 2-glycoprotein in the oxidized form than do healthy controls. The level is also higher than in patients with a different autoimmune disease whether or not they have antibodies against beta 2-glycoprotein 1. Although about 40% of patients with lupus have an anticardiolipin antibody, only a small percentage develop antiphospholipid syndrome with clotting.
It is thought that antiphospholipid syndrome involves initial injury to the endothelium, then potentiation of thrombus formation. Oxidized beta 2-glycoprotein complexes may bind to the endothelial cell surface, causing it to become the target of antibodies. The exact relationships between the factors are not yet understood.
The risk of a thrombotic event in an asymptomatic patient positive for all 3 factors—lupus anticoagulant, anticardiolipin antibody, and anti-beta 2-glycoprotein I antibody—is more than 5% per year.31
Manage thrombosis with anticoagulation
Khamashta et al,32 in a 1995 study, retrospectively studied patients with antiphospholipid antibodies and a history of thrombosis. Of 147 patients, 66 had idiopathic primary disease, 62 had systemic lupus, and 19 had “lupus-like” disease. Almost 70% (101 patients) had a recurrence of thrombosis, totaling 186 events. The mean time to recurrence was 12 months (range 2 weeks to 12 years). Recurrence rates were 0.01 events per patient per year with high-dose warfarin, 0.23 with low-dose warfarin, and 0.18 with aspirin. But the highest bleeding rates were in the 6 months after warfarin withdrawal; 29 patients had bleeding events, one-fourth of which were severe.
Standard therapy has become anticoagulation, starting with heparin or enoxaparin, then warfarin. There is inadequate evidence for the role of newer oral anticoagulant therapy.
A very high INR is not generally better than a moderately elevated level
For a time, it was thought that the international normalized ratio (INR) should be kept on the very high side to prevent thrombosis.
Crowther et al33 conducted a randomized, double-blind trial comparing moderate warfarin therapy (INR 2.0–3.0) and high-intensity warfarin therapy (INR 3.1–4.0) in antiphospholipid syndrome. Thrombosis actually recurred more frequently in the high-intensity therapy group (10.7% vs 3.4%), with no significant difference in major bleeding events.
A reasonable strategy is to keep the INR between 2.5 and 3.0, keeping in mind that values fluctuate in any individual patient. A higher goal often leads to excessive anticoagulation and bleeding. If the goal is too low, recurrent thrombosis becomes more likely. There are fewer data on the newer oral anticoagulants, but their role is likely to increase as reversal agents are developed.
Recommendations published in 2003 for treating antiphospholipid syndrome include34:
- Warfarin (INR 2.0–3.0) after the first thrombotic event
- Warfarin (INR 3.0–4.0) if a clot develops despite warfarin
- Warfarin (INR > 3.0) for an arterial event.
For the rare but catastrophic antiphospholipid syndrome in which thrombosis occurs in multiple organs, recommendations are for heparin plus steroids, with or without intravenous immunoglobulin and plasmapheresis. This approach has not always been successful, and the mortality rate is high.
Treatment of asymptomatic carriers is uncertain
Treatment of asymptomatic carriers of the antiphospholipid antibody is controversial. Evidence for management is scarce; some experts recommend aspirin therapy, but benefit has yet to be proven in clinical trials.
Canaud et al35 documented the role of activation of the kinase mammalian target of rapamycin (mTOR) in the vascular changes characteristic of antiphospholipid nephropathy. Postkidney transplant surveillance biopsies of patients with antiphospholipid antibodies showed vascular damage occurring over time (despite patients being asymptomatic) compared with other renal transplant patients. Patients with antiphospholipid antibodies who were treated with the immunosuppressive drug sirolimus were protected from developing these changes. Twelve years after transplant, 70% of patients with antiphospholipid antibodies taking sirolimus still had a functioning graft compared with 11% of untreated patients.
Our knowledge of the pathogenesis of thrombotic microangiopathies has greatly advanced in the last decade, improving the diagnosis and treatment of these diseases.
Many conditions involve thrombotic microangiopathies (Table 1). This article reviews the most common ones, ie, thrombotic thrombocytopenic purpura, hemolytic uremic syndrome, atypical hemolytic uremic syndrome, and antiphospholipid syndrome—their clinical features (focusing on the kidney), course, and management. Of note, although the diseases are similar, their pathogeneses and treatments differ.
DIFFERENT PATHWAYS TO MULTIORGAN THROMBOSIS
The thrombotic microangiopathies are multisystem disorders that can affect children and adults and often present with prominent renal and neurologic involvement. Endothelial injury is likely the inciting factor leading to thrombosis in the kidney and in many other organs. The causes variously include:
- Toxins from bacteria or drugs
- Abnormal complement activation, genetic or autoantibody-induced
- Procoagulant factors, eg, antiphospholipid antibodies
- Loss of anticoagulants, eg, from a defect of ADAMTS13 (a disintegrin and metalloproteinase with thrombospondin type 1 motif, member 13); ADAMTS13 is also known as von Willebrand factor-cleaving protease
- Severe hypertension.
The histopathologic features are similar in all the thrombotic microangiopathies. Laboratory findings include thrombocytopenia, microangiopathic hemolytic anemia (with schistocytes on the peripheral blood smear), and high serum lactate dehydrogenase (LDH) levels; these are also markers of treatment progress. Bilirubin may be elevated and haptoglobin absent. Renal biopsy reveals thrombi in the glomeruli and arterioles.
THROMBOTIC THROMBOCYTOPENIC PURPURA
A young woman with fever, bruising, and renal failure, then blindness
A 36-year-old black woman who had been previously healthy presents to her doctor with fever and bruising.
Her hematocrit is 28% (reference range 38%–46%), platelet count 15 x 109/L (150–450), and prothrombin and partial thromboplastin times are normal. Her peripheral blood smear shows microangiopathic hemolytic anemia with schistocytes.
Over the next few days, her urine output declines and she develops sudden blindness followed by decreased mental acuity. Blood is drawn and sent for ADAMTS13 assay. Treatment is started at once with daily therapeutic plasma exchange. The assay results, when they arrive, show marked ADAMTS13 reduction (< 5%). Over the ensuing weeks, her mental acuity improves, her vision returns, and her renal function improves.
ADAMTS13 deficiency is definitive
Thrombotic thrombocytopenic purpura is characterized by:
- Neurologic abnormalities and acute renal failure
- Thrombocytopenia and microangiopathic hemolytic anemia
- Histologic evidence of thrombotic microangiopathy
- Deficiency of von Willebrand factor-cleaving protease (ADAMTS13 < 10%).
von Willebrand factor forms ultralarge multimers in the circulation that interact with platelets; these are normally cleaved by ADAMTS13. With ADAMTS13 deficiency (from either a genetic mutation or autoantibodies), the ultralarge multimers lead to coagulation as blood flows through small vessels.1
In 2003, Tsai2 evaluated 127 patients over age 10 who had thrombocytopenia and microangiopathic hemolysis with no plausible cause or features suggestive of hemolytic uremic syndrome. All were severely deficient in ADAMTS13. Subsequently, thrombotic thrombocytopenic purpura has been defined by a severe actual or effective deficiency of ADAMTS13.
Prompt plasma exchange is critical
Although the ADAMTS13 assay is important for diagnosing thrombotic thrombocytopenic purpura, in suspected cases daily plasma exchange should be started promptly, before test results return. Plasma exchange removes autoantibodies to ADAMTS13 from the blood, removes circulating ultralarge von Willebrand factor multimers, and replaces the missing ADAMTS13. Untreated, the disease is progressive, with irreversible renal failure, neurologic deterioration, and a 90% mortality rate. Plasma exchange reduces the mortality rate to less than 15%. If another diagnosis is confirmed, plasma exchange can be stopped.
Plasma exchange has been shown in clinical trials to be superior to plasma infusion in normalizing platelet counts and reducing mortality.3,4 Mortality rates were comparable with different replacement fluids vs fresh-frozen plasma, including solvent or detergent-treated plasma, and cryo-poor (cryosupernatant) plasma.4 Antiplatelet therapy, platelet transfusions, and splenectomy are ineffective.
Glucocorticoids for early treatment
An appropriate strategy is to add a glucocorticoid to plasma-exchange therapy at once (oral prednisone 1 mg/kg per day or intravenous methylprednisolone 125 mg twice daily) and withdraw it after several days if it is determined that it is not needed. Steroids for suspected thrombotic thrombocytopenic purpura can be justified for several reasons:
- The results of the ADAMTS13 assay are usually delayed, so steroids provide coverage for other diagnoses.
- They are helpful if thrombotic thrombocytopenic purpura is idiopathic (which is true for most cases) and if the patient has a poor response to initial therapy with plasma exchange.
- They are indicated for patients whose platelet counts do not increase with several days of plasma exchange or whose thrombocytopenia recurs as plasma exchange is decreased.
Rituximab improves survival
Rituximab, a chimeric (half murine) monoclonal antibody against CD19 and CD20 B cells, suppresses antibody production by knocking out the precursors of antibody-producing cells.
Anecdotal reports and small studies involving a total of 42 patients have been published on the use of rituximab for thrombotic thrombocytopenic purpura. Courses of rituximab varied greatly, from 1 to 13 weekly doses at 375 mg/m2, with 4 doses being the most common. Complete remission occurred in 90% of cases.5,6 A typical study from 2014 involved 48 patients (30 of whom received rituximab) followed by severe ADAMTS13 deficiency during remission.7 Despite the small study size, the investigators found significantly improved relapse-free survival rates with rituximab treatment.
But rituximab can cost $25,000 for 2 doses of 1,000 mg, and this will most likely prohibit its routine use. The cost and insurance coverage vary with location and policies.
Based on such studies, a reasonable strategy is to treat thrombotic thrombocytopenic purpura with:
- Daily plasma exchange
- Steroids, at least until the diagnosis is certain
- Rituximab if warranted.
New targeted therapies
Caplacizumab, a humanized immunoglobulin that inhibits the interaction between ultralarge von Willebrand factor multimers and platelets, has the potential to change this strategy when it receives US Food and Drug Administration approval, which is expected soon.
Peyvandi et al8 randomized 75 patients with acquired thrombotic thrombocytopenic purpura to either subcutaneous caplacizumab 10 mg daily for 30 days or placebo. Both groups had daily plasma exchange. The treatment group had a 39% reduction in median time to normalization of platelets vs the placebo group, and 3 of 36 patients had exacerbations, compared with 11 of 39 patients in the placebo group. Although 8 patients relapsed within the first month after stopping caplacizumab, their cases were brought under control. There were also more bleeding episodes with caplacizumab (54% vs 38%), most being mild to moderate. Two patients in the placebo group died, but none in the treatment group.
The fact that platelet normalization occurred significantly faster with caplacizumab, even in some patients who had not yet had plasma exchange therapy initiated, has enormous clinical significance. The low platelet count in thrombotic thrombocytopenic purpura is a marker of susceptibility to rapid damage to the brain and kidneys, so correcting it quickly is critical.
Other strategies for new drug development include replacing the deficient ADAMTS13 with a recombinant molecule and blocking antibody production (the same mode of action as rituximab and glucocorticoids).9 Using all 3 strategies to treat thrombotic thrombocytopenic purpura may be the future standard of care.
HEMOLYTIC UREMIC SYNDROME
A child with sudden onset of bloody diarrhea and kidney failure
A 4-year-old girl plays with baby animals at a petting zoo and does not wash her hands immediately afterwards. Three days later, she develops fever, abdominal cramps, nausea, vomiting, and bloody diarrhea. Her pediatrician gives her antibiotics. On day 6, she develops ecchymoses on the extremities and lips, thrombocytopenia, low urine output, and seizures. Her stool tests positive for Escherichia coli O157:H7
Classic presentation: Young patient with bloody diarrhea
The classic presentation of hemolytic uremic syndrome is of a young patient with bloody diarrhea typically lasting 5 to 10 days. Kidney failure may follow, requiring dialysis in about 60% of patients for a mean of 10 days. About one-fourth of patients develop neurologic symptoms, and about the same fraction are left with long-term morbidity, eg, hypertension, proteinuria, and reduced glomerular filtration rate. The mortality rate is typically 4%10,11 but varies with the outbreak.
Histologically, the kidneys look identical to those in thrombotic thrombocytopenic purpura, with thrombi in glomeruli and small vessels.
E coli is the most common culprit, but other bacteria, including Shigella dysenteriae, and viruses are sometimes the cause. Fewer than 10% of children infected with Shiga toxin-positive E coli, also known as enterohemorrhagic E coli (O157:H7, O104:H4), develop hemolytic uremic syndrome.
Lessons from outbreaks
Petting zoos are a common source of transmission of pathogenic bacteria. Disease can be extremely serious: in 15 cases linked to a Florida petting zoo, 3 children died.
Other outbreaks involving pathogenic E coli have been tied to fresh vegetables and to undercooked hamburger at fast-food chains.
In Germany in 2011, more than 3,000 people acquired Shiga toxin nonhemolytic uremic syndrome due to E coli, and 16 of them died. In addition, 845 acquired hemolytic uremic syndrome, and 36 died. This outbreak was associated with the more virulent and less common O104:H4 strain, which has acquired a Shiga toxin-encoding phage. Patients were treated with quinolone antibiotics, which actually increase toxin production in this strain.12
Unusual in the German epidemic was that more adults were affected (88%), especially women (68% of cases).13 The source of infection was eventually found to be alfalfa sprouts, the seeds of which had been contaminated by E coli. Women did not harbor any intrinsic factor making them more susceptible; rather, they were more likely to eat salads.13
Supportive management
Supportive care is most important. Transfusion with packed red blood cells is indicated for hemoglobin below 6 g/dL. Hypertension should be controlled and dialysis provided. For central nervous system involvement or severe disease, plasma exchange is sometimes used.
Eculizumab was tried for a time as therapy but did not prove to be of benefit. Shiga toxin-binding agents have been developed, but by the time they are given it is too late in the disease process to help.
Antibiotics may harm; it is possible that they kill beneficial bacteria, allowing the Shiga toxin-producing E coli to better proliferate. Antimotility agents also are contraindicated. Other agents not recommended include urokinase, heparin, dipyridamole, and vincristine. Splenectomy is not advised.
The most important way to control hemolytic uremic syndrome is to prevent it by thoroughly cooking meat, cleaning fresh produce, and having children wash their hands after petting animals.
ATYPICAL HEMOLYTIC UREMIC SYNDROME
A young man in renal failure
A 28-year-old man has a history of “thrombotic thrombocytopenic purpura-hemolytic uremic syndrome” at age 12. He slowly progresses to end-stage renal disease and receives a renal transplant from his mother at age 20 that fails after 3 months. The renal transplant biopsy report at the time reads “thrombotic microangiopathy.” The patient’s brother also requires dialysis.
The patient’s complement values are low, especially C3. His father is offering him a kidney at this time, and the patient wants to know whether to proceed.
Normal ADAMTS13, no diarrhea
Hemolytic uremic syndrome without diarrhea is now called atypical hemolytic uremic syndrome. Patients have normal levels of ADAMTS13, do not have diarrhea, and have no evidence of Shiga toxin-producing E coli.
Continuous complement pathway activation
The complement system is part of the innate immune system, which provides immediate defense against infection and does not evolve as does the adaptive immune system. The classic complement pathway is activated by the C1 antibody-antigen complex. The alternative complement pathway leads to the same pathway via C3.14 Both pathways lead to the formation of C5 through C9 membrane attack complexes, which form channels across the membranes of target cells, leading to cell lysis and death.
The alternate pathway does not require an antibody trigger so is always active at a low level. Inhibitory factors (factor H, factor I, membrane cofactor protein, factor H-related proteins) are naturally present and slow it down at various steps. People who are born with an abnormal factor or, more commonly, develop antibodies against one of the factors, have uninhibited complement activation. If this happens in the blood vessels, massive coagulation and atypical hemolytic uremic syndrome ensues. The endothelial damage and clotting in the brain, kidney, and other organs are identical to that of hemolytic uremic syndrome caused by Shiga toxin.
Treat with eculizumab
Historically, atypical hemolytic uremic syndrome was treated with plasma exchange, which replaces defective complement regulatory proteins and removes inhibitory antibodies.
Understanding the complement pathways is key to developing drugs that target atypical hemolytic uremic syndrome, and about 60 are in the pipeline. The only one currently approved in the United States for atypical hemolytic uremic syndrome is eculizumab, a humanized monoclonal antibody that binds with high affinity to C5, blocking the end of the complement cascade and preventing formation of the membrane attack complex.15–18
The effects of eculizumab on atypical hemolytic uremic syndrome were studied in 2 prospective trials.19 Platelet counts rose rapidly within weeks of starting treatment, and kidney function improved. Benefits continued throughout the 64 weeks studied. There were no deaths among the 37 patients enrolled, and although these were single-arm trials, they provide evidence of dramatic benefit considering the high mortality risk of this disease.
Eculizumab is now considered the treatment of choice. It may be used empirically for patients with hemolytic uremic syndrome who test negative for Shiga toxin and antiphospholipid antibody, and who do not have a very low level of ADAMTS13. The big drawback of eculizumab is its high price,20–22 which varies by amount used, location, and pharmacy negotiation, but can be in the hundreds of thousands of dollars.
For a patient with atypical hemolytic uremic syndrome on dialysis, treatment with eculizumab should continue for 4 to 6 months if there are no extrarenal manifestations. But many patients continue to have the defect in the complement system, so the problem may recur.
Case revisited
For our patient considering a kidney transplant, many experts feel that a transplant can be done as long as platelet counts are monitored and treatment with eculizumab is restarted if needed. One can also make the case for waiting a few years for new oral drugs to become available before offering transplant.
ANTIPHOSPHOLIPID SYNDROME
A young woman with a history of thrombosis and miscarriages
A 27-year-old woman presents with arthralgias, low-grade fever, and malaise. She has a history of 3 spontaneous abortions and Raynaud phenomenon. Two years ago, she had deep vein thrombosis of the right calf after a long automobile trip.
She now has swollen metacarpophalangeal and proximal interphalangeal joints, livedo reticularis (a mottled venous pattern of the skin best seen under fluorescent light) of the legs and arms, and ankle edema (2-cm indentation).
Her blood pressure is 152/92 mm Hg. Laboratory values:
- White blood cell count 3.6 × 10⁹/L (reference range 4.5–11.0)
- Hematocrit 24% (36%–47%)
- Platelet count 89 × 109/L (150–450)
- Urinalysis: protein 4+, heme 3+, red blood cells 8–15 per high-power field (< 3), red blood cell casts present
- Blood urea nitrogen 43 mg/dL (10–20)
- Creatinine 2.6 mg/dL (0.5–1.1).
- Prothrombin time 14.6 s (10–14)
- Partial thromboplastin time 85 s (25–35)
- Antinuclear antibody positive at 1:160
- Anti-double-stranded DNA and serum complement normal
- Syphilis serologic screening (VDRL) positive.
The patient has leukopenia, anemia, thrombocytopenia, hematuria, proteinuria, high blood urea nitrogen, and markedly elevated partial thromboplastin time. Although she has a positive antinuclear antibody test and renal dysfunction, her anti-dsDNA and serum complement tests are normal, making the diagnosis of systemic lupus erythematosus unlikely.
Consider antiphospholipid syndrome
In any patient with multiple pregnancy losses, lupus, or a history of thrombosis, antiphospholipid syndrome should be considered.
In a series of patients with antiphospholipid antibody who underwent kidney biopsy, more than half were men, indicating that, unlike lupus, this is not primarily a disease of young women.
Diagnosis based on specific criteria
Clinical criteria require at least one of the following in the patient’s history23:
- One or more episodes of arterial, venous, or small-vessel thrombosis
- Unexplained pregnancy morbidity (death of a fetus or neonate with normal morphology or 3 or more spontaneous abortions).
Serologic criteria for any of the following antiphospholipid antibodies require that at least one of the following tests be positive at least twice and at least 12 weeks apart:
- Anticardiolipin antibodies—high-titer immunoglobulin (Ig) G or IgM
- Autoantibodies for beta 2-glycoprotein
- Lupus anticoagulant—autoantibodies that increase clotting time in vitro and target beta 2-glycoprotein I and prothrombin (despite its name and actions in vitro, lupus anticoagulant functions as a coagulant).
As with the other thrombotic microangiopathies, patients with anticardiolipin syndrome have microthrombi in the glomeruli and blood vessels that are evident on kidney biopsy.
Suspect condition in likely groups
Antiphospholipid syndrome is surprisingly common.24 In a case-control study, de Groot et al25 found that 3.1% of patients under age 70 with a first episode of venous thrombosis and no known cancer were positive for lupus anticoagulant vs 0.9% of controls. In another case-control study, Urbanus et al26 found that 17% of women under age 50 with a stroke tested positive for lupus anticoagulant compared with less than 1% of controls. Because of such studies, it has become routine to test for anticardiolipin and lupus anticoagulant in young patients presenting with a stroke.
About 1% of women trying to have children have recurrent miscarriages, and of these, 10% to 15% have antiphospholipid antibody present.27–30
Pathogenesis
Patients with antiphospholipid syndrome have a much higher proportion of plasma beta 2-glycoprotein in the oxidized form than do healthy controls. The level is also higher than in patients with a different autoimmune disease whether or not they have antibodies against beta 2-glycoprotein 1. Although about 40% of patients with lupus have an anticardiolipin antibody, only a small percentage develop antiphospholipid syndrome with clotting.
It is thought that antiphospholipid syndrome involves initial injury to the endothelium, then potentiation of thrombus formation. Oxidized beta 2-glycoprotein complexes may bind to the endothelial cell surface, causing it to become the target of antibodies. The exact relationships between the factors are not yet understood.
The risk of a thrombotic event in an asymptomatic patient positive for all 3 factors—lupus anticoagulant, anticardiolipin antibody, and anti-beta 2-glycoprotein I antibody—is more than 5% per year.31
Manage thrombosis with anticoagulation
Khamashta et al,32 in a 1995 study, retrospectively studied patients with antiphospholipid antibodies and a history of thrombosis. Of 147 patients, 66 had idiopathic primary disease, 62 had systemic lupus, and 19 had “lupus-like” disease. Almost 70% (101 patients) had a recurrence of thrombosis, totaling 186 events. The mean time to recurrence was 12 months (range 2 weeks to 12 years). Recurrence rates were 0.01 events per patient per year with high-dose warfarin, 0.23 with low-dose warfarin, and 0.18 with aspirin. But the highest bleeding rates were in the 6 months after warfarin withdrawal; 29 patients had bleeding events, one-fourth of which were severe.
Standard therapy has become anticoagulation, starting with heparin or enoxaparin, then warfarin. There is inadequate evidence for the role of newer oral anticoagulant therapy.
A very high INR is not generally better than a moderately elevated level
For a time, it was thought that the international normalized ratio (INR) should be kept on the very high side to prevent thrombosis.
Crowther et al33 conducted a randomized, double-blind trial comparing moderate warfarin therapy (INR 2.0–3.0) and high-intensity warfarin therapy (INR 3.1–4.0) in antiphospholipid syndrome. Thrombosis actually recurred more frequently in the high-intensity therapy group (10.7% vs 3.4%), with no significant difference in major bleeding events.
A reasonable strategy is to keep the INR between 2.5 and 3.0, keeping in mind that values fluctuate in any individual patient. A higher goal often leads to excessive anticoagulation and bleeding. If the goal is too low, recurrent thrombosis becomes more likely. There are fewer data on the newer oral anticoagulants, but their role is likely to increase as reversal agents are developed.
Recommendations published in 2003 for treating antiphospholipid syndrome include34:
- Warfarin (INR 2.0–3.0) after the first thrombotic event
- Warfarin (INR 3.0–4.0) if a clot develops despite warfarin
- Warfarin (INR > 3.0) for an arterial event.
For the rare but catastrophic antiphospholipid syndrome in which thrombosis occurs in multiple organs, recommendations are for heparin plus steroids, with or without intravenous immunoglobulin and plasmapheresis. This approach has not always been successful, and the mortality rate is high.
Treatment of asymptomatic carriers is uncertain
Treatment of asymptomatic carriers of the antiphospholipid antibody is controversial. Evidence for management is scarce; some experts recommend aspirin therapy, but benefit has yet to be proven in clinical trials.
Canaud et al35 documented the role of activation of the kinase mammalian target of rapamycin (mTOR) in the vascular changes characteristic of antiphospholipid nephropathy. Postkidney transplant surveillance biopsies of patients with antiphospholipid antibodies showed vascular damage occurring over time (despite patients being asymptomatic) compared with other renal transplant patients. Patients with antiphospholipid antibodies who were treated with the immunosuppressive drug sirolimus were protected from developing these changes. Twelve years after transplant, 70% of patients with antiphospholipid antibodies taking sirolimus still had a functioning graft compared with 11% of untreated patients.
- Sadler JE. Von Willebrand factor, ADAMTS13, and thrombotic thrombocytopenic purpura. Blood 2008; 112:11–18.
- Tsai HM. Advances in the pathogenesis, diagnosis, and treatment of thrombotic thrombocytopenic purpura. J Am Soc Nephrol 2003; 14:1072–1081.
- Rock GA, Shumak KH, Buskard NA, et al. Comparison of plasma exchange with plasma infusion in the treatment of thrombotic thrombocytopenic purpura. Canadian Apheresis Study Group. N Engl J Med 1991; 325:393–397.
- Brunskill SJ, Tusold A, Benjamin S, Stanworth SJ, Murphy MF. A systematic review of randomized controlled trials for plasma exchange in the treatment of thrombotic thrombocytopenic purpura. Transfus Med 2007; 17:17–35.
- Jasti S, Coyle T, Gentile T, Rosales L, Poiesz B. Rituximab as an adjunct to plasma exchange in TTP: a report of 12 cases and review of literature. J Clin Apher 2008; 23:151–156.
- Ling HT, Field JJ, Blinder MA. Sustained response with rituximab in patients with thrombotic thrombocytopenic purpura: a report of 13 cases and review of the literature. Am J Hematol 2009; 84:418–421.
- Hie M, Gay J, Galicier L, et al; French Thrombotic Microangiopathies Reference Centre. Preemptive rituximab infusions after remission efficiently prevent relapses in acquired thrombotic thrombocytopenic purpura. Blood 2014; 124:204–210.
- Peyvandi F, Scully M, Kremer Hovinga JA, et al; TITAN Investigators. Caplacizumab for acquired thrombotic thrombocytopenic purpura. N Engl J Med 2016; 374:511–522.
- Veyradier A. Von Willebrand factor—a new target for TTP treatment? N Engl J Med 2016; 374:583–585.
- Boyce TG, Swerdlow DL, Griffin PM. Escherichia coli O157:H7 and the hemolytic-uremic syndrome. N Engl J Med 1995; 333:364–368.
- Gerber A, Karch H, Allerberger F, Verweyen HM, Zimmerhackl LB. Clinical course and the role of Shiga toxin-producing Escherichia coli infection in the hemolytic-uremic syndrome in pediatric patients, 1997–2000, in Germany and Austria: a prospective study. J Infect Dis 2002; 186:493–500.
- Rasko DA, Webster DR, Sahl JW, et al. Origins of the E. coli strain causing an outbreak of hemolytic-uremic syndrome in Germany. N Engl J Med 2011; 365:709–717.
- Frank C, Werber D, Cramer JP, et al; HUS Investigation Team. Epidemic profile of Shiga-toxin-producing Escherichia coli O104:H4 outbreak in Germany. N Engl J Med 2011; 365:1771–1780.
- Bomback AS, Appel GB. Pathogenesis of the C3 glomerulopathies and reclassification of MPGN. Nat Rev Nephrol 2012; 8:634–642.
- Figueroa JE, Densen P. Infectious diseases associated with complement deficiencies. Clin Microbiol Rev 1991; 4:359–395.
- Walport MJ. Complement. First of two parts. N Engl J Med 2001; 344:1058–1066.
- Rother RP, Rollins SA, Mojcik CF, Brodsky RA, Bell L. Discovery and development of the complement inhibitor eculizumab for the treatment of paroxysmal nocturnal hemoglobinuria. Nat Biotechnol 2007; 25:1256–1264.
- Soliris (eculizumab). Prescribing information. Alexion Pharmaceuticals, Inc.
- Legendre CM, Licht C, Muus P, et al. Terminal complement inhibitor eculizumab in atypical hemolytic–uremic syndrome. N Engl J Med 2013; 368:2169–2181.
- Kim JJ, Waller SC, Reid CJ. Eculizumab in atypical haemolytic-uraemic syndrome allows cessation of plasma exchange and dialysis. Clin Kidney J 2012; 5:34–36.
- Povey H, Vundru R, Junglee N, Jibani M. Renal recovery with eculizumab in atypical hemolytic uremic syndrome following prolonged dialysis. Clin Nephrol 2014; 82:326–331.
- Gargau M, Azancot M, Ramos R, Sanchez-Corral P, Montero MA, Seron D. Early treatment with eculizumab may be beneficial in atypical haemolytic uraemic syndrome. Clin Kidney J 2012; 5:1–3.
- Miyakis S, Lockshin MD, Atsumi T, et al. International consensus statement on an update of the classification criteria for definite antiphospholipid syndrome (APS). J Thromb Haemost 2006; 4:295–306.
- Giannakopoulos B, Krilis SA. The pathogenesis of the antiphospholipid syndrome. N Engl J Med 2013; 368:1033–1044.
- de Groot PG, Lutters B, Derksen RH, Lisman T, Meijers JC, Rosendaal FR. Lupus anticoagulants and the risk of a first episode of deep venous thrombosis. J Thromb Haemost 2005; 3:1993–1997.
- Urbanus RT, Siegerink B, Roest M, Rosendaal FR, de Groot PG, Algra A. Antiphospholipid antibodies and risk of myocardial infarction and ischaemic stroke in young women in the RATIO study: a case-control study. Lancet Neurol 2009; 8:998–1005.
- Ruiz-Irastorza G, Crowther M, Branch W, Khamashta MA. Antiphospholipid syndrome. Lancet 2010; 376:1498–1509.
- Stirrat GM. Recurrent miscarriage I: definition and epidemiology. Lancet 1990; 336:673–675.
- Rai RS, Regan L, Clifford K, et al. Antiphospholipid antibodies and beta 2-glycoprotein-I in 500 women with recurrent miscarriage: results of a comprehensive screening approach. Hum Reprod 1995; 10:2001–2005.
- Yetman DL, Kutteh WH. Antiphospholipid antibody panels and recurrent pregnancy loss: prevalence of anticardiolipin antibodies compared with other antiphospholipid antibodies. Fertil Steril 1996; 66:540–546.
- Pengo V, Ruffatti A, Legnani C, et al. Incidence of a first thromboembolic event in asymptomatic carriers of high-risk antiphospholipid antibody profile: a multicenter prospective study. Blood 2011; 118:4714–4718.
- Khamashta MA, Cuadrado MJ, Mujic F, Taub NA, Hunt BJ, Hughes GR. The management of thrombosis in the antiphospholipid-antibody syndrome. N Engl J Med 1995; 332:993–997.
- Crowther MA, Ginsberg JS, Julian J, et al. A comparison of two intensities of warfarin for the prevention of recurrent thrombosis in patients with the antiphospholipid antibody syndrome. N Engl J Med 2003; 349:1133–1138.
- Lockshin M, Tenedios F, Petri M, et al. Cardiac disease in the antiphospholipid syndrome: recommendations for treatment. Committee consensus report. Lupus 2003; 12:518–523.
- Canaud G, Bienaimé F, Tabarin F, et al. Inhibition of the mTORC pathway in the antiphospholipid syndrome. N Engl J Med 2014; 371:303–312.
- Sadler JE. Von Willebrand factor, ADAMTS13, and thrombotic thrombocytopenic purpura. Blood 2008; 112:11–18.
- Tsai HM. Advances in the pathogenesis, diagnosis, and treatment of thrombotic thrombocytopenic purpura. J Am Soc Nephrol 2003; 14:1072–1081.
- Rock GA, Shumak KH, Buskard NA, et al. Comparison of plasma exchange with plasma infusion in the treatment of thrombotic thrombocytopenic purpura. Canadian Apheresis Study Group. N Engl J Med 1991; 325:393–397.
- Brunskill SJ, Tusold A, Benjamin S, Stanworth SJ, Murphy MF. A systematic review of randomized controlled trials for plasma exchange in the treatment of thrombotic thrombocytopenic purpura. Transfus Med 2007; 17:17–35.
- Jasti S, Coyle T, Gentile T, Rosales L, Poiesz B. Rituximab as an adjunct to plasma exchange in TTP: a report of 12 cases and review of literature. J Clin Apher 2008; 23:151–156.
- Ling HT, Field JJ, Blinder MA. Sustained response with rituximab in patients with thrombotic thrombocytopenic purpura: a report of 13 cases and review of the literature. Am J Hematol 2009; 84:418–421.
- Hie M, Gay J, Galicier L, et al; French Thrombotic Microangiopathies Reference Centre. Preemptive rituximab infusions after remission efficiently prevent relapses in acquired thrombotic thrombocytopenic purpura. Blood 2014; 124:204–210.
- Peyvandi F, Scully M, Kremer Hovinga JA, et al; TITAN Investigators. Caplacizumab for acquired thrombotic thrombocytopenic purpura. N Engl J Med 2016; 374:511–522.
- Veyradier A. Von Willebrand factor—a new target for TTP treatment? N Engl J Med 2016; 374:583–585.
- Boyce TG, Swerdlow DL, Griffin PM. Escherichia coli O157:H7 and the hemolytic-uremic syndrome. N Engl J Med 1995; 333:364–368.
- Gerber A, Karch H, Allerberger F, Verweyen HM, Zimmerhackl LB. Clinical course and the role of Shiga toxin-producing Escherichia coli infection in the hemolytic-uremic syndrome in pediatric patients, 1997–2000, in Germany and Austria: a prospective study. J Infect Dis 2002; 186:493–500.
- Rasko DA, Webster DR, Sahl JW, et al. Origins of the E. coli strain causing an outbreak of hemolytic-uremic syndrome in Germany. N Engl J Med 2011; 365:709–717.
- Frank C, Werber D, Cramer JP, et al; HUS Investigation Team. Epidemic profile of Shiga-toxin-producing Escherichia coli O104:H4 outbreak in Germany. N Engl J Med 2011; 365:1771–1780.
- Bomback AS, Appel GB. Pathogenesis of the C3 glomerulopathies and reclassification of MPGN. Nat Rev Nephrol 2012; 8:634–642.
- Figueroa JE, Densen P. Infectious diseases associated with complement deficiencies. Clin Microbiol Rev 1991; 4:359–395.
- Walport MJ. Complement. First of two parts. N Engl J Med 2001; 344:1058–1066.
- Rother RP, Rollins SA, Mojcik CF, Brodsky RA, Bell L. Discovery and development of the complement inhibitor eculizumab for the treatment of paroxysmal nocturnal hemoglobinuria. Nat Biotechnol 2007; 25:1256–1264.
- Soliris (eculizumab). Prescribing information. Alexion Pharmaceuticals, Inc.
- Legendre CM, Licht C, Muus P, et al. Terminal complement inhibitor eculizumab in atypical hemolytic–uremic syndrome. N Engl J Med 2013; 368:2169–2181.
- Kim JJ, Waller SC, Reid CJ. Eculizumab in atypical haemolytic-uraemic syndrome allows cessation of plasma exchange and dialysis. Clin Kidney J 2012; 5:34–36.
- Povey H, Vundru R, Junglee N, Jibani M. Renal recovery with eculizumab in atypical hemolytic uremic syndrome following prolonged dialysis. Clin Nephrol 2014; 82:326–331.
- Gargau M, Azancot M, Ramos R, Sanchez-Corral P, Montero MA, Seron D. Early treatment with eculizumab may be beneficial in atypical haemolytic uraemic syndrome. Clin Kidney J 2012; 5:1–3.
- Miyakis S, Lockshin MD, Atsumi T, et al. International consensus statement on an update of the classification criteria for definite antiphospholipid syndrome (APS). J Thromb Haemost 2006; 4:295–306.
- Giannakopoulos B, Krilis SA. The pathogenesis of the antiphospholipid syndrome. N Engl J Med 2013; 368:1033–1044.
- de Groot PG, Lutters B, Derksen RH, Lisman T, Meijers JC, Rosendaal FR. Lupus anticoagulants and the risk of a first episode of deep venous thrombosis. J Thromb Haemost 2005; 3:1993–1997.
- Urbanus RT, Siegerink B, Roest M, Rosendaal FR, de Groot PG, Algra A. Antiphospholipid antibodies and risk of myocardial infarction and ischaemic stroke in young women in the RATIO study: a case-control study. Lancet Neurol 2009; 8:998–1005.
- Ruiz-Irastorza G, Crowther M, Branch W, Khamashta MA. Antiphospholipid syndrome. Lancet 2010; 376:1498–1509.
- Stirrat GM. Recurrent miscarriage I: definition and epidemiology. Lancet 1990; 336:673–675.
- Rai RS, Regan L, Clifford K, et al. Antiphospholipid antibodies and beta 2-glycoprotein-I in 500 women with recurrent miscarriage: results of a comprehensive screening approach. Hum Reprod 1995; 10:2001–2005.
- Yetman DL, Kutteh WH. Antiphospholipid antibody panels and recurrent pregnancy loss: prevalence of anticardiolipin antibodies compared with other antiphospholipid antibodies. Fertil Steril 1996; 66:540–546.
- Pengo V, Ruffatti A, Legnani C, et al. Incidence of a first thromboembolic event in asymptomatic carriers of high-risk antiphospholipid antibody profile: a multicenter prospective study. Blood 2011; 118:4714–4718.
- Khamashta MA, Cuadrado MJ, Mujic F, Taub NA, Hunt BJ, Hughes GR. The management of thrombosis in the antiphospholipid-antibody syndrome. N Engl J Med 1995; 332:993–997.
- Crowther MA, Ginsberg JS, Julian J, et al. A comparison of two intensities of warfarin for the prevention of recurrent thrombosis in patients with the antiphospholipid antibody syndrome. N Engl J Med 2003; 349:1133–1138.
- Lockshin M, Tenedios F, Petri M, et al. Cardiac disease in the antiphospholipid syndrome: recommendations for treatment. Committee consensus report. Lupus 2003; 12:518–523.
- Canaud G, Bienaimé F, Tabarin F, et al. Inhibition of the mTORC pathway in the antiphospholipid syndrome. N Engl J Med 2014; 371:303–312.
KEY POINTS
- Thrombotic thrombocytopenic purpura is diagnosed with the ADAMTS13 assay. As soon as it is suspected, it should be treated with daily plasma exchange, steroids (at least until the diagnosis is certain), and, if additional treatment is needed, rituximab.
- Hemolytic uremic syndrome is seen in children who handle farm animals and in children and adults in food outbreaks. It is managed supportively with transfusion of packed red blood cells and dialysis.
- Atypical hemolytic uremic syndrome should be suspected in patients with normal ADAMTS13 and without diarrhea or evidence of Shiga toxin-producing Escherichia coli. It often responds well to eculizumab, a blocker of C5 (the fifth component of complement).
- Antiphospholipid syndrome should be investigated in women who have multiple miscarriages or thrombotic events. Symptomatic disease requires long-term anticoagulation therapy.
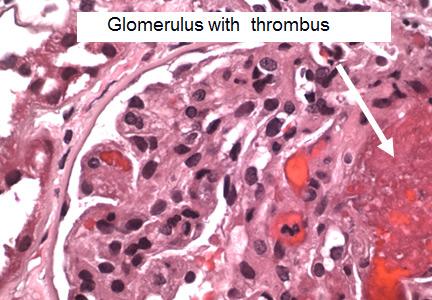
Ring-enhancing cerebral lesions
A 39-year-old woman with a history of human immunodeficiency virus (HIV) and hepatitis B virus infection was brought to the emergency department for evaluation of seizures, which had started a few days earlier. She was born and raised in a state bordering the Ohio River, an area where Histoplasma capsulatum is endemic. She denied any recent travel.
Her vital signs and neurologic examination were normal. Computed tomography of the head showed two areas of increased attenuation anterior to the frontal horns. To better characterize those lesions, magnetic resonance imaging (MRI) with contrast was done, which showed about a dozen 1-cm ring-enhancing lesions in the right cerebellum and both cerebral hemispheres (Figure 1).
Results of a complete blood cell count, metabolic profile, and chest radiography were normal. Her CD4 count was 428/μL (reference range 533–1,674) and 20% (60%–89%); her HIV viral load was 326,000 copies/mL.
She was initially treated empirically with sulfadiazine, pyrimethamine, and leukovorin for possible toxoplasmosis, which is the most common cause of ring-enhancing brain lesions in HIV patients. In the meantime, cerebrospinal fluid, blood, and urine were sent for a detailed workup for fungi, including Histoplasma. Results of the Histoplasma antibody and antigen studies of the serum, urine, and cerebrospinal fluid were positive, while cerebrospinal fluid testing for Toxoplasma by polymerase chain reaction testing was negative. Empirical treatment for toxoplasmosis was stopped and amphotericin B was started to treat disseminated histoplasmosis.
During her hospital course, she underwent brain biopsy via right frontotemporal craniotomy with resection of right frontal lesions. Pathologic study showed partially organizing abscesses with central necrosis (Figure 2), microscopy with Grocott-Gomori methenamine silver stain was positive for budding yeast forms consistent with H capsulatum (Figure 3), and special stain for acid-fast bacilli was negative for mycobacteria. Cultures of the brain biopsy specimen, blood, and cerebrospinal fluid for fungi, acid-fast bacilli, and bacteria did not reveal any growth after 28 days.
The patient was discharged home with instructions to take amphotericin B for a total of 6 weeks and then itraconazole. About 1 year later, she remained free of symptoms, although repeat MRI did not show any significant change in the size or number of histoplasmomas.
She did not comply well with her HIV treatment, and her immune status did not improve, so we decided to continue her itraconazole treatment for more than 1 year.
CEREBRAL HISTOPLASMOMA
The term “histoplasmoma” was introduced by Shapiro et al1 in 1955, when they first described numerous focal areas of softening, up to 1 cm in diameter, scattered throughout the brain at autopsy in a 41-year-old man who had died of disseminated histoplasmosis. They coined the word to describe these discrete areas of necrosis that might resemble tumors on the basis of their size, location, and capability of causing increased intracranial pressure.
Central nervous system involvement can either be a manifestation of disseminated disease or present as an isolated illness.2 It occurs in 5% to 10% of cases of disseminated histoplasmosis.3 Histoplasmosis of the central nervous system can have different manifestations; the most common presentation is chronic meningitis.4
Laboratory diagnosis is based on detecting H capsulatum antigen and antibody in the urine, blood, and cerebrospinal fluid. Tissue biopsy (histopathology) as well as cultures of tissue samples or body fluids may also establish the diagnosis.4
Toxoplasmosis and primary central nervous system lymphoma are the most common causes of brain ring-enhancing lesions in HIV patients in developed countries, while in the developing world neurocysticercosis and tuberculomas are more common.5,6 Much less common causes include brain abscesses secondary to bacterial infections (pyogenic abscess),7 cryptococcomas,8 syphilitic cerebral gummata,9 primary brain tumors (gliomas), and metastases.10
Compared with other forms of the disease, histoplasmosis of the central nervous system has higher rates of treatment failure and relapse, so treatment should be prolonged and aggressive.2,3 The cure rate with amphotericin B ranges from 33% to 61%, and higher doses produce better response rates.3
Current treatment recommendations are based on 2007 guidelines of the Infectious Diseases Society of America.11 Liposomal amphotericin B is the drug of choice because it achieves higher concentrations in the central nervous system than other drugs and is less toxic. It is given for 4 to 6 weeks, followed by itraconazole for at least 1 year and until the cerebrospinal fluid Histoplasma antigen test is negative and other cerebrospinal fluid abnormalities are resolved.
In patients who have primary disseminated histoplasmosis that includes the central nervous system, itraconazole can be given for more than 1 year or until immune recovery is achieved—or lifelong if necessary.2,12 Long-term suppressive antifungal therapy also should be considered in patients for whom appropriate initial therapy fails.2
Nephrotoxicity (acute kidney injury, hypokalemia, and hypomagnesemia), infusion-related drug reactions, and rash are among the well-described side effects of amphotericin B. Maintenance of intravascular volume and replacement of electrolytes should be an integral part of the amphotericin B treatment regimen.13
TAKE-AWAY POINTS
- Histoplasmomas should be considered in the differential diagnosis of ring-enhancing lesions of the central nervous system, along with toxoplasmosis and primary central nervous system lymphoma. This will allow timely initiation of the diagnostic workup, avoiding unnecessary and potentially risky interventions and delays in starting targeted antifungal therapy.
- There is no single gold standard test for central nervous system histoplasmosis. Rather, the final diagnosis is based on the combination of clinical, laboratory, and radiologic findings.
Acknowledgment: Library research assistance provided by HSHS St. John’s Hospital Health Sciences Library staff.
- Shapiro JL, Lux JJ, Sprofkin BE. Histoplasmosis of the central nervous system. Am J Pathol 1955; 31:319–335.
- Wheat LJ, Musial CE, Jenny-Avital E. Diagnosis and management of central nervous system histoplasmosis. Clin Infect Dis 2005; 40:844–852.
- Wheat LJ, Batteiger BE, Sathapatayavongs B. Histoplasma capsulatum infections of the central nervous system: a clinical review. Medicine (Baltimore) 1990; 69:244–260.
- Kauffman CA. Histoplasmosis: a clinical and laboratory update. Clin Microbiol Rev 2007; 20:115–132.
- Modi M, Mochan A, Modi G. Management of HIV-associated focal brain lesions in developing countries. QJM 2004; 97:413–421.
- Miller RF, Hall-Craggs MA, Costa DC, et al. Magnetic resonance imaging, thallium-201 SPET scanning, and laboratory analyses for discrimination of cerebral lymphoma and toxoplasmosis in AIDS. Sex Transm Infect 1998; 74:258–264.
- Cohen WA. Intracranial bacterial infections in patients with AIDS. Neuroimaging Clin N Am 1997; 7:223–229.
- Troncoso A, Fumagalli J, Shinzato R, Gulotta H, Toller M, Bava J. CNS cryptococcoma in an HIV-positive patient. J Int Assoc Physicians AIDS Care (Chic) 2002; 1:131–133.
- Land AM, Nelson GA, Bell SG, Denby KJ, Estrada CA, Willett LL. Widening the differential for brain masses in human immunodeficiency virus-positive patients: syphilitic cerebral gummata. Am J Med Sci 2013; 346:253–255.
- Balsys R, Janousek JE, Batnitzky S, Templeton AW. Peripheral enhancement in computerized cranial tomography: a non-specific finding. Surg Neurol 1979; 11:207–216.
- Wheat LJ, Freifeld AG, Kleiman MB, et al; Infectious Diseases Society of America. Clinical practice guidelines for the management of patients with histoplasmosis: 2007 update by the Infectious Diseases Society of America. Clin Infect Dis 2007; 45:807–825.
- Wheat J, Hafner R, Wulfsohn M, et al; National Institute of Allergy and Infectious Diseases Clinical Trials and Mycoses Study Group Collaborators. Prevention of relapse of histoplasmosis with itraconazole in patients with the acquired immunodeficiency syndrome. Ann Intern Med 1993; 118:610–616.
- Saccente M. Central nervous system histoplasmosis. Curr Treat Options Neurol 2008; 10:161–167.
A 39-year-old woman with a history of human immunodeficiency virus (HIV) and hepatitis B virus infection was brought to the emergency department for evaluation of seizures, which had started a few days earlier. She was born and raised in a state bordering the Ohio River, an area where Histoplasma capsulatum is endemic. She denied any recent travel.
Her vital signs and neurologic examination were normal. Computed tomography of the head showed two areas of increased attenuation anterior to the frontal horns. To better characterize those lesions, magnetic resonance imaging (MRI) with contrast was done, which showed about a dozen 1-cm ring-enhancing lesions in the right cerebellum and both cerebral hemispheres (Figure 1).
Results of a complete blood cell count, metabolic profile, and chest radiography were normal. Her CD4 count was 428/μL (reference range 533–1,674) and 20% (60%–89%); her HIV viral load was 326,000 copies/mL.
She was initially treated empirically with sulfadiazine, pyrimethamine, and leukovorin for possible toxoplasmosis, which is the most common cause of ring-enhancing brain lesions in HIV patients. In the meantime, cerebrospinal fluid, blood, and urine were sent for a detailed workup for fungi, including Histoplasma. Results of the Histoplasma antibody and antigen studies of the serum, urine, and cerebrospinal fluid were positive, while cerebrospinal fluid testing for Toxoplasma by polymerase chain reaction testing was negative. Empirical treatment for toxoplasmosis was stopped and amphotericin B was started to treat disseminated histoplasmosis.
During her hospital course, she underwent brain biopsy via right frontotemporal craniotomy with resection of right frontal lesions. Pathologic study showed partially organizing abscesses with central necrosis (Figure 2), microscopy with Grocott-Gomori methenamine silver stain was positive for budding yeast forms consistent with H capsulatum (Figure 3), and special stain for acid-fast bacilli was negative for mycobacteria. Cultures of the brain biopsy specimen, blood, and cerebrospinal fluid for fungi, acid-fast bacilli, and bacteria did not reveal any growth after 28 days.
The patient was discharged home with instructions to take amphotericin B for a total of 6 weeks and then itraconazole. About 1 year later, she remained free of symptoms, although repeat MRI did not show any significant change in the size or number of histoplasmomas.
She did not comply well with her HIV treatment, and her immune status did not improve, so we decided to continue her itraconazole treatment for more than 1 year.
CEREBRAL HISTOPLASMOMA
The term “histoplasmoma” was introduced by Shapiro et al1 in 1955, when they first described numerous focal areas of softening, up to 1 cm in diameter, scattered throughout the brain at autopsy in a 41-year-old man who had died of disseminated histoplasmosis. They coined the word to describe these discrete areas of necrosis that might resemble tumors on the basis of their size, location, and capability of causing increased intracranial pressure.
Central nervous system involvement can either be a manifestation of disseminated disease or present as an isolated illness.2 It occurs in 5% to 10% of cases of disseminated histoplasmosis.3 Histoplasmosis of the central nervous system can have different manifestations; the most common presentation is chronic meningitis.4
Laboratory diagnosis is based on detecting H capsulatum antigen and antibody in the urine, blood, and cerebrospinal fluid. Tissue biopsy (histopathology) as well as cultures of tissue samples or body fluids may also establish the diagnosis.4
Toxoplasmosis and primary central nervous system lymphoma are the most common causes of brain ring-enhancing lesions in HIV patients in developed countries, while in the developing world neurocysticercosis and tuberculomas are more common.5,6 Much less common causes include brain abscesses secondary to bacterial infections (pyogenic abscess),7 cryptococcomas,8 syphilitic cerebral gummata,9 primary brain tumors (gliomas), and metastases.10
Compared with other forms of the disease, histoplasmosis of the central nervous system has higher rates of treatment failure and relapse, so treatment should be prolonged and aggressive.2,3 The cure rate with amphotericin B ranges from 33% to 61%, and higher doses produce better response rates.3
Current treatment recommendations are based on 2007 guidelines of the Infectious Diseases Society of America.11 Liposomal amphotericin B is the drug of choice because it achieves higher concentrations in the central nervous system than other drugs and is less toxic. It is given for 4 to 6 weeks, followed by itraconazole for at least 1 year and until the cerebrospinal fluid Histoplasma antigen test is negative and other cerebrospinal fluid abnormalities are resolved.
In patients who have primary disseminated histoplasmosis that includes the central nervous system, itraconazole can be given for more than 1 year or until immune recovery is achieved—or lifelong if necessary.2,12 Long-term suppressive antifungal therapy also should be considered in patients for whom appropriate initial therapy fails.2
Nephrotoxicity (acute kidney injury, hypokalemia, and hypomagnesemia), infusion-related drug reactions, and rash are among the well-described side effects of amphotericin B. Maintenance of intravascular volume and replacement of electrolytes should be an integral part of the amphotericin B treatment regimen.13
TAKE-AWAY POINTS
- Histoplasmomas should be considered in the differential diagnosis of ring-enhancing lesions of the central nervous system, along with toxoplasmosis and primary central nervous system lymphoma. This will allow timely initiation of the diagnostic workup, avoiding unnecessary and potentially risky interventions and delays in starting targeted antifungal therapy.
- There is no single gold standard test for central nervous system histoplasmosis. Rather, the final diagnosis is based on the combination of clinical, laboratory, and radiologic findings.
Acknowledgment: Library research assistance provided by HSHS St. John’s Hospital Health Sciences Library staff.
A 39-year-old woman with a history of human immunodeficiency virus (HIV) and hepatitis B virus infection was brought to the emergency department for evaluation of seizures, which had started a few days earlier. She was born and raised in a state bordering the Ohio River, an area where Histoplasma capsulatum is endemic. She denied any recent travel.
Her vital signs and neurologic examination were normal. Computed tomography of the head showed two areas of increased attenuation anterior to the frontal horns. To better characterize those lesions, magnetic resonance imaging (MRI) with contrast was done, which showed about a dozen 1-cm ring-enhancing lesions in the right cerebellum and both cerebral hemispheres (Figure 1).
Results of a complete blood cell count, metabolic profile, and chest radiography were normal. Her CD4 count was 428/μL (reference range 533–1,674) and 20% (60%–89%); her HIV viral load was 326,000 copies/mL.
She was initially treated empirically with sulfadiazine, pyrimethamine, and leukovorin for possible toxoplasmosis, which is the most common cause of ring-enhancing brain lesions in HIV patients. In the meantime, cerebrospinal fluid, blood, and urine were sent for a detailed workup for fungi, including Histoplasma. Results of the Histoplasma antibody and antigen studies of the serum, urine, and cerebrospinal fluid were positive, while cerebrospinal fluid testing for Toxoplasma by polymerase chain reaction testing was negative. Empirical treatment for toxoplasmosis was stopped and amphotericin B was started to treat disseminated histoplasmosis.
During her hospital course, she underwent brain biopsy via right frontotemporal craniotomy with resection of right frontal lesions. Pathologic study showed partially organizing abscesses with central necrosis (Figure 2), microscopy with Grocott-Gomori methenamine silver stain was positive for budding yeast forms consistent with H capsulatum (Figure 3), and special stain for acid-fast bacilli was negative for mycobacteria. Cultures of the brain biopsy specimen, blood, and cerebrospinal fluid for fungi, acid-fast bacilli, and bacteria did not reveal any growth after 28 days.
The patient was discharged home with instructions to take amphotericin B for a total of 6 weeks and then itraconazole. About 1 year later, she remained free of symptoms, although repeat MRI did not show any significant change in the size or number of histoplasmomas.
She did not comply well with her HIV treatment, and her immune status did not improve, so we decided to continue her itraconazole treatment for more than 1 year.
CEREBRAL HISTOPLASMOMA
The term “histoplasmoma” was introduced by Shapiro et al1 in 1955, when they first described numerous focal areas of softening, up to 1 cm in diameter, scattered throughout the brain at autopsy in a 41-year-old man who had died of disseminated histoplasmosis. They coined the word to describe these discrete areas of necrosis that might resemble tumors on the basis of their size, location, and capability of causing increased intracranial pressure.
Central nervous system involvement can either be a manifestation of disseminated disease or present as an isolated illness.2 It occurs in 5% to 10% of cases of disseminated histoplasmosis.3 Histoplasmosis of the central nervous system can have different manifestations; the most common presentation is chronic meningitis.4
Laboratory diagnosis is based on detecting H capsulatum antigen and antibody in the urine, blood, and cerebrospinal fluid. Tissue biopsy (histopathology) as well as cultures of tissue samples or body fluids may also establish the diagnosis.4
Toxoplasmosis and primary central nervous system lymphoma are the most common causes of brain ring-enhancing lesions in HIV patients in developed countries, while in the developing world neurocysticercosis and tuberculomas are more common.5,6 Much less common causes include brain abscesses secondary to bacterial infections (pyogenic abscess),7 cryptococcomas,8 syphilitic cerebral gummata,9 primary brain tumors (gliomas), and metastases.10
Compared with other forms of the disease, histoplasmosis of the central nervous system has higher rates of treatment failure and relapse, so treatment should be prolonged and aggressive.2,3 The cure rate with amphotericin B ranges from 33% to 61%, and higher doses produce better response rates.3
Current treatment recommendations are based on 2007 guidelines of the Infectious Diseases Society of America.11 Liposomal amphotericin B is the drug of choice because it achieves higher concentrations in the central nervous system than other drugs and is less toxic. It is given for 4 to 6 weeks, followed by itraconazole for at least 1 year and until the cerebrospinal fluid Histoplasma antigen test is negative and other cerebrospinal fluid abnormalities are resolved.
In patients who have primary disseminated histoplasmosis that includes the central nervous system, itraconazole can be given for more than 1 year or until immune recovery is achieved—or lifelong if necessary.2,12 Long-term suppressive antifungal therapy also should be considered in patients for whom appropriate initial therapy fails.2
Nephrotoxicity (acute kidney injury, hypokalemia, and hypomagnesemia), infusion-related drug reactions, and rash are among the well-described side effects of amphotericin B. Maintenance of intravascular volume and replacement of electrolytes should be an integral part of the amphotericin B treatment regimen.13
TAKE-AWAY POINTS
- Histoplasmomas should be considered in the differential diagnosis of ring-enhancing lesions of the central nervous system, along with toxoplasmosis and primary central nervous system lymphoma. This will allow timely initiation of the diagnostic workup, avoiding unnecessary and potentially risky interventions and delays in starting targeted antifungal therapy.
- There is no single gold standard test for central nervous system histoplasmosis. Rather, the final diagnosis is based on the combination of clinical, laboratory, and radiologic findings.
Acknowledgment: Library research assistance provided by HSHS St. John’s Hospital Health Sciences Library staff.
- Shapiro JL, Lux JJ, Sprofkin BE. Histoplasmosis of the central nervous system. Am J Pathol 1955; 31:319–335.
- Wheat LJ, Musial CE, Jenny-Avital E. Diagnosis and management of central nervous system histoplasmosis. Clin Infect Dis 2005; 40:844–852.
- Wheat LJ, Batteiger BE, Sathapatayavongs B. Histoplasma capsulatum infections of the central nervous system: a clinical review. Medicine (Baltimore) 1990; 69:244–260.
- Kauffman CA. Histoplasmosis: a clinical and laboratory update. Clin Microbiol Rev 2007; 20:115–132.
- Modi M, Mochan A, Modi G. Management of HIV-associated focal brain lesions in developing countries. QJM 2004; 97:413–421.
- Miller RF, Hall-Craggs MA, Costa DC, et al. Magnetic resonance imaging, thallium-201 SPET scanning, and laboratory analyses for discrimination of cerebral lymphoma and toxoplasmosis in AIDS. Sex Transm Infect 1998; 74:258–264.
- Cohen WA. Intracranial bacterial infections in patients with AIDS. Neuroimaging Clin N Am 1997; 7:223–229.
- Troncoso A, Fumagalli J, Shinzato R, Gulotta H, Toller M, Bava J. CNS cryptococcoma in an HIV-positive patient. J Int Assoc Physicians AIDS Care (Chic) 2002; 1:131–133.
- Land AM, Nelson GA, Bell SG, Denby KJ, Estrada CA, Willett LL. Widening the differential for brain masses in human immunodeficiency virus-positive patients: syphilitic cerebral gummata. Am J Med Sci 2013; 346:253–255.
- Balsys R, Janousek JE, Batnitzky S, Templeton AW. Peripheral enhancement in computerized cranial tomography: a non-specific finding. Surg Neurol 1979; 11:207–216.
- Wheat LJ, Freifeld AG, Kleiman MB, et al; Infectious Diseases Society of America. Clinical practice guidelines for the management of patients with histoplasmosis: 2007 update by the Infectious Diseases Society of America. Clin Infect Dis 2007; 45:807–825.
- Wheat J, Hafner R, Wulfsohn M, et al; National Institute of Allergy and Infectious Diseases Clinical Trials and Mycoses Study Group Collaborators. Prevention of relapse of histoplasmosis with itraconazole in patients with the acquired immunodeficiency syndrome. Ann Intern Med 1993; 118:610–616.
- Saccente M. Central nervous system histoplasmosis. Curr Treat Options Neurol 2008; 10:161–167.
- Shapiro JL, Lux JJ, Sprofkin BE. Histoplasmosis of the central nervous system. Am J Pathol 1955; 31:319–335.
- Wheat LJ, Musial CE, Jenny-Avital E. Diagnosis and management of central nervous system histoplasmosis. Clin Infect Dis 2005; 40:844–852.
- Wheat LJ, Batteiger BE, Sathapatayavongs B. Histoplasma capsulatum infections of the central nervous system: a clinical review. Medicine (Baltimore) 1990; 69:244–260.
- Kauffman CA. Histoplasmosis: a clinical and laboratory update. Clin Microbiol Rev 2007; 20:115–132.
- Modi M, Mochan A, Modi G. Management of HIV-associated focal brain lesions in developing countries. QJM 2004; 97:413–421.
- Miller RF, Hall-Craggs MA, Costa DC, et al. Magnetic resonance imaging, thallium-201 SPET scanning, and laboratory analyses for discrimination of cerebral lymphoma and toxoplasmosis in AIDS. Sex Transm Infect 1998; 74:258–264.
- Cohen WA. Intracranial bacterial infections in patients with AIDS. Neuroimaging Clin N Am 1997; 7:223–229.
- Troncoso A, Fumagalli J, Shinzato R, Gulotta H, Toller M, Bava J. CNS cryptococcoma in an HIV-positive patient. J Int Assoc Physicians AIDS Care (Chic) 2002; 1:131–133.
- Land AM, Nelson GA, Bell SG, Denby KJ, Estrada CA, Willett LL. Widening the differential for brain masses in human immunodeficiency virus-positive patients: syphilitic cerebral gummata. Am J Med Sci 2013; 346:253–255.
- Balsys R, Janousek JE, Batnitzky S, Templeton AW. Peripheral enhancement in computerized cranial tomography: a non-specific finding. Surg Neurol 1979; 11:207–216.
- Wheat LJ, Freifeld AG, Kleiman MB, et al; Infectious Diseases Society of America. Clinical practice guidelines for the management of patients with histoplasmosis: 2007 update by the Infectious Diseases Society of America. Clin Infect Dis 2007; 45:807–825.
- Wheat J, Hafner R, Wulfsohn M, et al; National Institute of Allergy and Infectious Diseases Clinical Trials and Mycoses Study Group Collaborators. Prevention of relapse of histoplasmosis with itraconazole in patients with the acquired immunodeficiency syndrome. Ann Intern Med 1993; 118:610–616.
- Saccente M. Central nervous system histoplasmosis. Curr Treat Options Neurol 2008; 10:161–167.
Evidence helps, but some decisions remain within the art of medicine

Despite advances in therapy, more than 10% of patients with acute bacterial meningitis still die of it, and more suffer significant morbidity, including cognitive dysfunction and deafness. Well-defined protocols that include empiric antibiotics and systemic corticosteroids have improved the outcomes of patients with meningitis. But, as with other closed-space infections such as septic arthritis, any delay in providing appropriate antibiotic treatment is associated with a worse prognosis. In the case of bacterial meningitis, a retrospective analysis concluded that each hour of delay in delivering antibiotics and a corticosteroid can be associated with a relative (not absolute) increase in mortality of 13%.1
The precise diagnosis of bacterial meningitis depends entirely on obtaining cerebrospinal fluid for analysis, including culture and antibiotic sensitivity testing. But that simple statement belies several current and historical complexities. From my experience, getting a prompt diagnostic lumbar puncture is not as simple as it once was.
Many hospitals have imposed patient safety initiatives, which overall have been beneficial but have had the effect that medical residents and probably even hospitalists in some medical centers are less frequently the ones doing interventional procedures. Some procedures, such as placement of pulmonary arterial catheters in the medical intensive care unit, have been shown to be less useful and to pose more risk than once believed. The tasks of placing other central lines and performing thoracenteses have been relegated to special procedure teams trained in using ultrasound guidance. Interventional radiologists now often do the visceral biopsies and lumbar punctures, and as a result, it is hoped that procedural complication rates will decline. On the other hand, these changes mean that medical residents and future staff are less experienced in performing these procedures, even though there are times that they are the only ones available to perform them. The result is a potential delay in performing a necessary lumbar puncture.
Another reason that a lumbar puncture may be delayed is concern over iatrogenic herniation if the procedure is done in a patient who has elevated intracranial pressure. We do not know precisely how often this occurs if there is an undiagnosed brain mass lesion such as an abscess, which can mimic bacterial meningitis, or a malignancy, and meningitis itself may be associated with herniation. Yet, for years physicians have hesitated to perform lumbar punctures in some patients without first ruling out a brain mass by computed tomography (CT), a diagnostic flow algorithm that often introduces at least an hour of delay in performing the procedure and in obtaining cultures before starting antibiotics.
When I was in training, we were perhaps more cavalier, appropriately or not. If the history and examination did not suggest a brain mass and the patient had retinal vein pulsations without papilledema, we did the lumbar puncture. It was a different time, and there was a different perspective on risks and benefits. More recently, the trend has been to obtain a CT scan before a lumbar puncture in several subsets of patients.
A 2015 analysis from Sweden1 showed that we can probably do a lumbar puncture for suspected bacterial meningitis without first doing a CT scan in most patients, even in patients with moderately impaired mentation. Perhaps some other concerns can also be assuaged if evaluated, but we don’t have data. Mirrakhimov et al, in this issue of the Journal, review the current evidence on when to do CT before a lumbar puncture, even if it may significantly delay the procedure and the timely delivery of antibiotics. A perfect algorithm that balances the risks of delaying treatment, initiating less-than-ideal empiric antibiotics potentially without definitive culture, and inducing complications from a procedure done promptly may well be impossible to develop. Evidence helps us refine the diagnostic approach, but with limited data, some important decisions unfortunately remain within the “art” rather than the science of medicine.
- Glimåker M, Johansson B, Grindborg Ö, Bottai M, Lindquist L, Sjölin J. Adult bacterial meningitis: earlier treatment and improved outcome following guideline revision promoting prompt lumbar puncture. Clin Infect Dis 2015; 60:1162–1169.
Despite advances in therapy, more than 10% of patients with acute bacterial meningitis still die of it, and more suffer significant morbidity, including cognitive dysfunction and deafness. Well-defined protocols that include empiric antibiotics and systemic corticosteroids have improved the outcomes of patients with meningitis. But, as with other closed-space infections such as septic arthritis, any delay in providing appropriate antibiotic treatment is associated with a worse prognosis. In the case of bacterial meningitis, a retrospective analysis concluded that each hour of delay in delivering antibiotics and a corticosteroid can be associated with a relative (not absolute) increase in mortality of 13%.1
The precise diagnosis of bacterial meningitis depends entirely on obtaining cerebrospinal fluid for analysis, including culture and antibiotic sensitivity testing. But that simple statement belies several current and historical complexities. From my experience, getting a prompt diagnostic lumbar puncture is not as simple as it once was.
Many hospitals have imposed patient safety initiatives, which overall have been beneficial but have had the effect that medical residents and probably even hospitalists in some medical centers are less frequently the ones doing interventional procedures. Some procedures, such as placement of pulmonary arterial catheters in the medical intensive care unit, have been shown to be less useful and to pose more risk than once believed. The tasks of placing other central lines and performing thoracenteses have been relegated to special procedure teams trained in using ultrasound guidance. Interventional radiologists now often do the visceral biopsies and lumbar punctures, and as a result, it is hoped that procedural complication rates will decline. On the other hand, these changes mean that medical residents and future staff are less experienced in performing these procedures, even though there are times that they are the only ones available to perform them. The result is a potential delay in performing a necessary lumbar puncture.
Another reason that a lumbar puncture may be delayed is concern over iatrogenic herniation if the procedure is done in a patient who has elevated intracranial pressure. We do not know precisely how often this occurs if there is an undiagnosed brain mass lesion such as an abscess, which can mimic bacterial meningitis, or a malignancy, and meningitis itself may be associated with herniation. Yet, for years physicians have hesitated to perform lumbar punctures in some patients without first ruling out a brain mass by computed tomography (CT), a diagnostic flow algorithm that often introduces at least an hour of delay in performing the procedure and in obtaining cultures before starting antibiotics.
When I was in training, we were perhaps more cavalier, appropriately or not. If the history and examination did not suggest a brain mass and the patient had retinal vein pulsations without papilledema, we did the lumbar puncture. It was a different time, and there was a different perspective on risks and benefits. More recently, the trend has been to obtain a CT scan before a lumbar puncture in several subsets of patients.
A 2015 analysis from Sweden1 showed that we can probably do a lumbar puncture for suspected bacterial meningitis without first doing a CT scan in most patients, even in patients with moderately impaired mentation. Perhaps some other concerns can also be assuaged if evaluated, but we don’t have data. Mirrakhimov et al, in this issue of the Journal, review the current evidence on when to do CT before a lumbar puncture, even if it may significantly delay the procedure and the timely delivery of antibiotics. A perfect algorithm that balances the risks of delaying treatment, initiating less-than-ideal empiric antibiotics potentially without definitive culture, and inducing complications from a procedure done promptly may well be impossible to develop. Evidence helps us refine the diagnostic approach, but with limited data, some important decisions unfortunately remain within the “art” rather than the science of medicine.
Despite advances in therapy, more than 10% of patients with acute bacterial meningitis still die of it, and more suffer significant morbidity, including cognitive dysfunction and deafness. Well-defined protocols that include empiric antibiotics and systemic corticosteroids have improved the outcomes of patients with meningitis. But, as with other closed-space infections such as septic arthritis, any delay in providing appropriate antibiotic treatment is associated with a worse prognosis. In the case of bacterial meningitis, a retrospective analysis concluded that each hour of delay in delivering antibiotics and a corticosteroid can be associated with a relative (not absolute) increase in mortality of 13%.1
The precise diagnosis of bacterial meningitis depends entirely on obtaining cerebrospinal fluid for analysis, including culture and antibiotic sensitivity testing. But that simple statement belies several current and historical complexities. From my experience, getting a prompt diagnostic lumbar puncture is not as simple as it once was.
Many hospitals have imposed patient safety initiatives, which overall have been beneficial but have had the effect that medical residents and probably even hospitalists in some medical centers are less frequently the ones doing interventional procedures. Some procedures, such as placement of pulmonary arterial catheters in the medical intensive care unit, have been shown to be less useful and to pose more risk than once believed. The tasks of placing other central lines and performing thoracenteses have been relegated to special procedure teams trained in using ultrasound guidance. Interventional radiologists now often do the visceral biopsies and lumbar punctures, and as a result, it is hoped that procedural complication rates will decline. On the other hand, these changes mean that medical residents and future staff are less experienced in performing these procedures, even though there are times that they are the only ones available to perform them. The result is a potential delay in performing a necessary lumbar puncture.
Another reason that a lumbar puncture may be delayed is concern over iatrogenic herniation if the procedure is done in a patient who has elevated intracranial pressure. We do not know precisely how often this occurs if there is an undiagnosed brain mass lesion such as an abscess, which can mimic bacterial meningitis, or a malignancy, and meningitis itself may be associated with herniation. Yet, for years physicians have hesitated to perform lumbar punctures in some patients without first ruling out a brain mass by computed tomography (CT), a diagnostic flow algorithm that often introduces at least an hour of delay in performing the procedure and in obtaining cultures before starting antibiotics.
When I was in training, we were perhaps more cavalier, appropriately or not. If the history and examination did not suggest a brain mass and the patient had retinal vein pulsations without papilledema, we did the lumbar puncture. It was a different time, and there was a different perspective on risks and benefits. More recently, the trend has been to obtain a CT scan before a lumbar puncture in several subsets of patients.
A 2015 analysis from Sweden1 showed that we can probably do a lumbar puncture for suspected bacterial meningitis without first doing a CT scan in most patients, even in patients with moderately impaired mentation. Perhaps some other concerns can also be assuaged if evaluated, but we don’t have data. Mirrakhimov et al, in this issue of the Journal, review the current evidence on when to do CT before a lumbar puncture, even if it may significantly delay the procedure and the timely delivery of antibiotics. A perfect algorithm that balances the risks of delaying treatment, initiating less-than-ideal empiric antibiotics potentially without definitive culture, and inducing complications from a procedure done promptly may well be impossible to develop. Evidence helps us refine the diagnostic approach, but with limited data, some important decisions unfortunately remain within the “art” rather than the science of medicine.
- Glimåker M, Johansson B, Grindborg Ö, Bottai M, Lindquist L, Sjölin J. Adult bacterial meningitis: earlier treatment and improved outcome following guideline revision promoting prompt lumbar puncture. Clin Infect Dis 2015; 60:1162–1169.
- Glimåker M, Johansson B, Grindborg Ö, Bottai M, Lindquist L, Sjölin J. Adult bacterial meningitis: earlier treatment and improved outcome following guideline revision promoting prompt lumbar puncture. Clin Infect Dis 2015; 60:1162–1169.
Urinary leakage: What are the treatment options?
Urinary incontinence—the loss of bladder control—affects 15 million American women. Many endure it in silence, thinking that it is a normal part of aging or that no medical urinary incontinence treatments exist. But in many cases it can be managed through exercise, lifestyle changes, pelvic stimulation, and sometimes medicines or other treatments.
Types of urinary incontinence
Urgency incontinence causes an urgent desire to urinate (void), which is followed by involuntary loss of urine. This condition can be caused by an “overactive” bladder, or OAB. Normally, strong muscles (sphincters) control the flow of urine from the bladder. In OAB, the muscles contract or spasm with enough force to override the sphincter muscles of the urethra and allow urine to pass out of the bladder.
Stress incontinence occurs when an activity such as a coughing or sneezing increases pressure on the bladder. Typically, a small amount of urine leaks from the urethra. This problem can be caused by weak muscles of the pelvic floor, a weak sphincter muscle, or a problem with the way the sphincter muscle opens and closes. Women who have given birth are more likely to have stress incontinence.
Women with mixed incontinence have symptoms of both urgency and stress incontinence.
Treatment options
For urge incontinence, doctors generally recommend:
- Bladder training. You would complete a bladder diary to determine how often you urinate and then try to lengthen the time between voids.
- Kegel exercises. These help strengthen the pelvic muscles, improving pelvic support and the bladder’s ability to hold urine. When you try to stop the flow of urine or try not to pass gas, you are contracting the muscles of the pelvic floor. This is what happens when you do Kegel exercises. When doing the exercises, try not to move your legs, buttocks, or abdominal muscles. In fact, no one should be able to see that you are doing them. Do 5 sets of Kegel exercises a day. Each time you contract the muscles of the pelvic floor, hold for a slow count of 5 and then relax. Repeat this 10 times for 1 set of Kegels.
- Medications such as antidepressant drugs may be prescribed to relax the bladder. Other drugs, called anticholinergic drugs, help control muscle spasms in the bladder.
For stress incontinence, doctors generally recommend:
- Bladder training and Kegel exercises, as described above.
- Bulking agents, which are injected into the lining of the urethra. They increase the thickness of the lining of the urethra, which creates resistance against the flow of urine. Collagen is one bulking agent commonly used.
Treatments for either type of urinary incontinence include:
- Vaginal estrogen—this is used by women who are going through menopause or who are postmenopausal. Vaginal estrogen is provided in the form of creams, tablets, or a ring inserted into the vagina. It works in part by thickening the vaginal tissue, which increases pelvic support, and by relieving tissue irritation.
- Pelvic stimulation. Mild electrical impulses stimulate contractions of the pelvic floor muscles, and this eventually strengthens them. Some devices require a prescription and monthly office visits and are connected to biofeedback. Others, such as the Automatic Pelvic Exerciser (APEX M), are available over the counter.
- Biofeedback therapy with a physical therapist can help you learn how to perform Kegel exercises by letting you know if you are contracting your pelvic muscles correctly. Sensors are placed on the body or within the anus or vagina and provide feedback on a computer screen or through audio tones.
- Weight loss. Being overweight or obese can lead to urinary incontinence by increasing pressure in the abdomen. Losing even 5 pounds can make a big difference in bladder control.
This information is provided by your physician and the Cleveland Clinic Journal of Medicine. It does not replace your physician’s medical assessment and judgment.
This page may be reproduced noncommercially. For information on hundreds of health topics, see my.clevelandclinic.org/health.
Urinary incontinence—the loss of bladder control—affects 15 million American women. Many endure it in silence, thinking that it is a normal part of aging or that no medical urinary incontinence treatments exist. But in many cases it can be managed through exercise, lifestyle changes, pelvic stimulation, and sometimes medicines or other treatments.
Types of urinary incontinence
Urgency incontinence causes an urgent desire to urinate (void), which is followed by involuntary loss of urine. This condition can be caused by an “overactive” bladder, or OAB. Normally, strong muscles (sphincters) control the flow of urine from the bladder. In OAB, the muscles contract or spasm with enough force to override the sphincter muscles of the urethra and allow urine to pass out of the bladder.
Stress incontinence occurs when an activity such as a coughing or sneezing increases pressure on the bladder. Typically, a small amount of urine leaks from the urethra. This problem can be caused by weak muscles of the pelvic floor, a weak sphincter muscle, or a problem with the way the sphincter muscle opens and closes. Women who have given birth are more likely to have stress incontinence.
Women with mixed incontinence have symptoms of both urgency and stress incontinence.
Treatment options
For urge incontinence, doctors generally recommend:
- Bladder training. You would complete a bladder diary to determine how often you urinate and then try to lengthen the time between voids.
- Kegel exercises. These help strengthen the pelvic muscles, improving pelvic support and the bladder’s ability to hold urine. When you try to stop the flow of urine or try not to pass gas, you are contracting the muscles of the pelvic floor. This is what happens when you do Kegel exercises. When doing the exercises, try not to move your legs, buttocks, or abdominal muscles. In fact, no one should be able to see that you are doing them. Do 5 sets of Kegel exercises a day. Each time you contract the muscles of the pelvic floor, hold for a slow count of 5 and then relax. Repeat this 10 times for 1 set of Kegels.
- Medications such as antidepressant drugs may be prescribed to relax the bladder. Other drugs, called anticholinergic drugs, help control muscle spasms in the bladder.
For stress incontinence, doctors generally recommend:
- Bladder training and Kegel exercises, as described above.
- Bulking agents, which are injected into the lining of the urethra. They increase the thickness of the lining of the urethra, which creates resistance against the flow of urine. Collagen is one bulking agent commonly used.
Treatments for either type of urinary incontinence include:
- Vaginal estrogen—this is used by women who are going through menopause or who are postmenopausal. Vaginal estrogen is provided in the form of creams, tablets, or a ring inserted into the vagina. It works in part by thickening the vaginal tissue, which increases pelvic support, and by relieving tissue irritation.
- Pelvic stimulation. Mild electrical impulses stimulate contractions of the pelvic floor muscles, and this eventually strengthens them. Some devices require a prescription and monthly office visits and are connected to biofeedback. Others, such as the Automatic Pelvic Exerciser (APEX M), are available over the counter.
- Biofeedback therapy with a physical therapist can help you learn how to perform Kegel exercises by letting you know if you are contracting your pelvic muscles correctly. Sensors are placed on the body or within the anus or vagina and provide feedback on a computer screen or through audio tones.
- Weight loss. Being overweight or obese can lead to urinary incontinence by increasing pressure in the abdomen. Losing even 5 pounds can make a big difference in bladder control.
This information is provided by your physician and the Cleveland Clinic Journal of Medicine. It does not replace your physician’s medical assessment and judgment.
This page may be reproduced noncommercially. For information on hundreds of health topics, see my.clevelandclinic.org/health.
Urinary incontinence—the loss of bladder control—affects 15 million American women. Many endure it in silence, thinking that it is a normal part of aging or that no medical urinary incontinence treatments exist. But in many cases it can be managed through exercise, lifestyle changes, pelvic stimulation, and sometimes medicines or other treatments.
Types of urinary incontinence
Urgency incontinence causes an urgent desire to urinate (void), which is followed by involuntary loss of urine. This condition can be caused by an “overactive” bladder, or OAB. Normally, strong muscles (sphincters) control the flow of urine from the bladder. In OAB, the muscles contract or spasm with enough force to override the sphincter muscles of the urethra and allow urine to pass out of the bladder.
Stress incontinence occurs when an activity such as a coughing or sneezing increases pressure on the bladder. Typically, a small amount of urine leaks from the urethra. This problem can be caused by weak muscles of the pelvic floor, a weak sphincter muscle, or a problem with the way the sphincter muscle opens and closes. Women who have given birth are more likely to have stress incontinence.
Women with mixed incontinence have symptoms of both urgency and stress incontinence.
Treatment options
For urge incontinence, doctors generally recommend:
- Bladder training. You would complete a bladder diary to determine how often you urinate and then try to lengthen the time between voids.
- Kegel exercises. These help strengthen the pelvic muscles, improving pelvic support and the bladder’s ability to hold urine. When you try to stop the flow of urine or try not to pass gas, you are contracting the muscles of the pelvic floor. This is what happens when you do Kegel exercises. When doing the exercises, try not to move your legs, buttocks, or abdominal muscles. In fact, no one should be able to see that you are doing them. Do 5 sets of Kegel exercises a day. Each time you contract the muscles of the pelvic floor, hold for a slow count of 5 and then relax. Repeat this 10 times for 1 set of Kegels.
- Medications such as antidepressant drugs may be prescribed to relax the bladder. Other drugs, called anticholinergic drugs, help control muscle spasms in the bladder.
For stress incontinence, doctors generally recommend:
- Bladder training and Kegel exercises, as described above.
- Bulking agents, which are injected into the lining of the urethra. They increase the thickness of the lining of the urethra, which creates resistance against the flow of urine. Collagen is one bulking agent commonly used.
Treatments for either type of urinary incontinence include:
- Vaginal estrogen—this is used by women who are going through menopause or who are postmenopausal. Vaginal estrogen is provided in the form of creams, tablets, or a ring inserted into the vagina. It works in part by thickening the vaginal tissue, which increases pelvic support, and by relieving tissue irritation.
- Pelvic stimulation. Mild electrical impulses stimulate contractions of the pelvic floor muscles, and this eventually strengthens them. Some devices require a prescription and monthly office visits and are connected to biofeedback. Others, such as the Automatic Pelvic Exerciser (APEX M), are available over the counter.
- Biofeedback therapy with a physical therapist can help you learn how to perform Kegel exercises by letting you know if you are contracting your pelvic muscles correctly. Sensors are placed on the body or within the anus or vagina and provide feedback on a computer screen or through audio tones.
- Weight loss. Being overweight or obese can lead to urinary incontinence by increasing pressure in the abdomen. Losing even 5 pounds can make a big difference in bladder control.
This information is provided by your physician and the Cleveland Clinic Journal of Medicine. It does not replace your physician’s medical assessment and judgment.
This page may be reproduced noncommercially. For information on hundreds of health topics, see my.clevelandclinic.org/health.

Medical management of urinary incontinence in women
Urinary incontinence can lead to a cascade of symptomatic burden on the patient, causing distress, embarrassment, and suffering.
See related patient information
Traditionally, incontinence has been treated by surgeons, and surgery remains an option. However, more patients are now being managed by medical clinicians, who can offer a number of newer therapies. Ideally, a medical physician can initiate the evaluation and treatment and even effectively cure some forms of urinary incontinence.
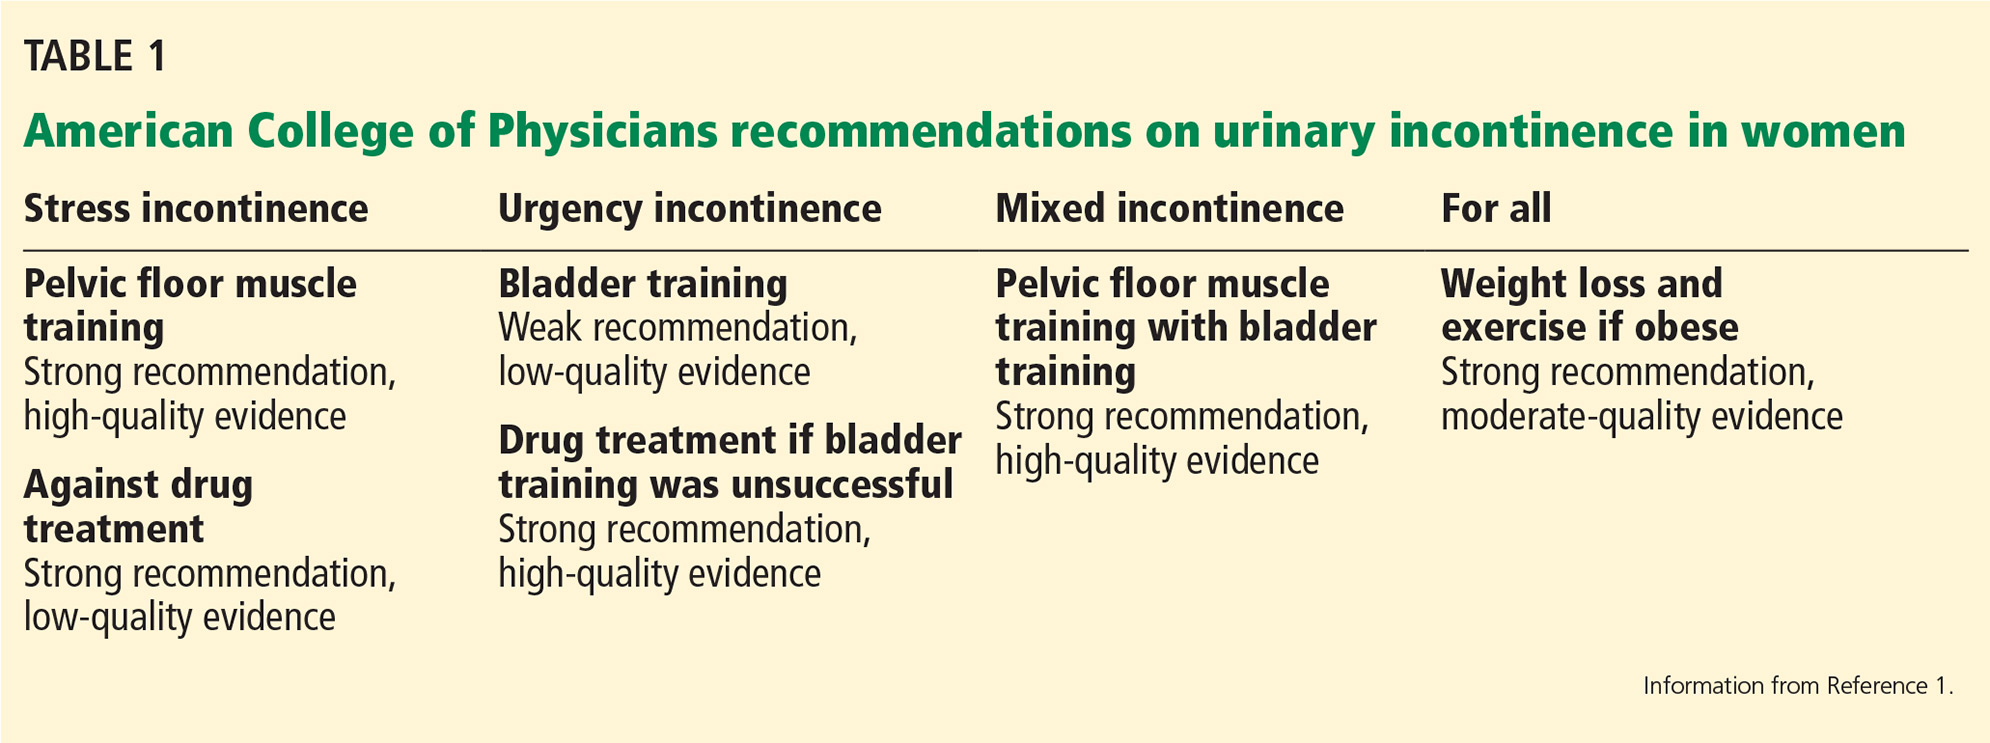
In 2014, the American College of Physicians (ACP) published recommendations on the medical treatment of urinary incontinence in women (Table 1).1
This review describes the medical management of urinary incontinence in women, emphasizing the ACP recommendations1 and newer over-the-counter options.
COMMON AND UNDERREPORTED
Many women erroneously believe that urinary incontinence is an inevitable consequence of aging and allow it to lessen their quality of life without seeking medical attention.
Indeed, it is common. The 2005–2006 National Health and Nutritional Examination Survey2 found the prevalence of urinary incontinence in US women to be 15.7%. The prevalence increases with age from 6.9% in women ages 20 through 29 to 31.7% in those age 80 and older. A separate analysis of the same data found that 25.0% of women age 20 and older had 1 or more pelvic floor disorders.3 Some estimates are even higher. Wu et al4 reported a prevalence of urinary incontinence of 51.1% in women ages 31 through 54.
Too few of these women are identified and treated, for many reasons, including embarrassment and inadequate screening. Half of women with urinary incontinence do not report their symptoms because of humiliation or anxiety.5
The burden of urinary incontinence extends beyond the individual and into society. The total cost of overactive bladder and urgency urinary incontinence in the United States was estimated to be $65.9 billion in 2007 and is projected to reach $82.6 billion in 2020.6
THREE TYPES
There are 3 types of urinary incontinence: stress, urgency, and mixed.
Stress urinary incontinence is involuntary loss of urine associated with physical exertion or increased abdominal pressure, eg, with coughing or sneezing.
Urgency urinary incontinence is involuntary loss of urine associated with the sudden need to void. Many patients experience these symptoms simultaneously, making the distinction difficult.
Mixed urinary incontinence is loss of urine with both urgency and increased abdominal pressure or physical exertion.
Overactive bladder, a related problem, is defined as urinary urgency, usually accompanied by frequency and nocturia, with or without urgency urinary incontinence, in the absence of a urinary tract infection or other obvious disease.7
Nongenitourinary causes such as neurologic disorders or even malignancy can present with urinary incontinence, and thus it is critical to perform a thorough initial evaluation.
A 2014 study revealed that by age 80, 20% of women may need to undergo surgery for stress urinary incontinence or pelvic organ prolapse. This statistic should motivate healthcare providers to focus on prevention and offer conservative medical management for these conditions first.8
QUESTIONS TO ASK
When doing a pelvic examination, once could inquire about urinary incontinence with questions such as:
Do you leak urine when you cough, sneeze, laugh, or jump or during sexual climax?
Do you have to get up more than once at night to urinate?
Do you feel the urge to urinate frequently?
BEHAVIORAL MODIFICATION AND BLADDER TRAINING
Bladder training is a conservative behavioral treatment for urinary incontinence that primary care physicians can teach. It is primarily used for urgency urinary incontinence but can also be useful in stress urinary incontinence.
After completing a bladder diary and gaining awareness of their daily voiding patterns, patients can learn scheduled voiding to train the bladder, gradually extending the urges to longer intervals.
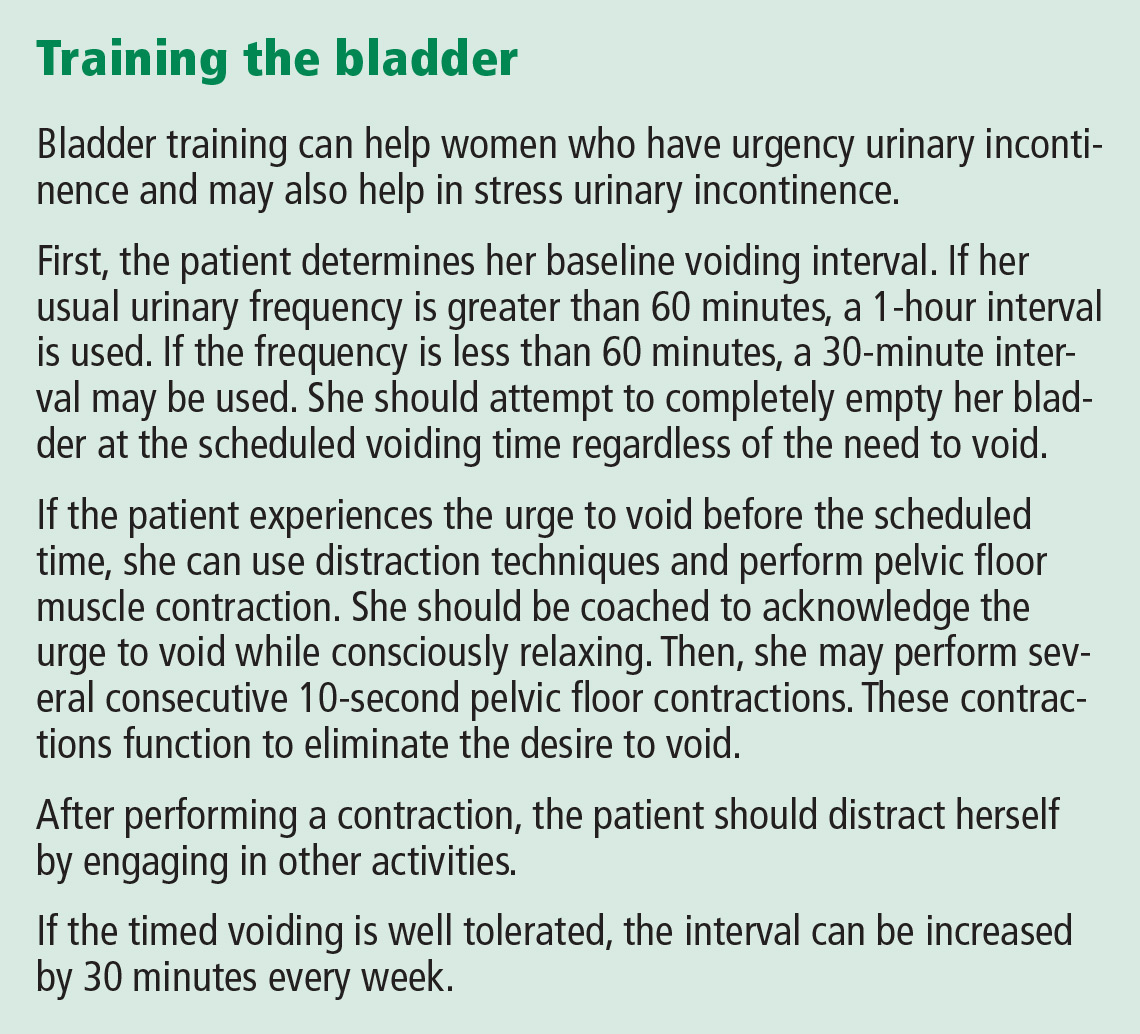
Clinicians should instruct patients on how to train the bladder, using methods first described by Wyman and Fantl.9 (See Training the bladder.)
There is evidence that bladder training improves urinary incontinence compared with usual care.10,11
The ACP recommends bladder training for women who have urgency urinary incontinence, but grades this recommendation as weak with low-quality evidence.
PELVIC FLOOR MUSCLE TRAINING
Introduced in 1948 by Dr. Arnold Kegel, pelvic floor muscle training has become widely adopted.12
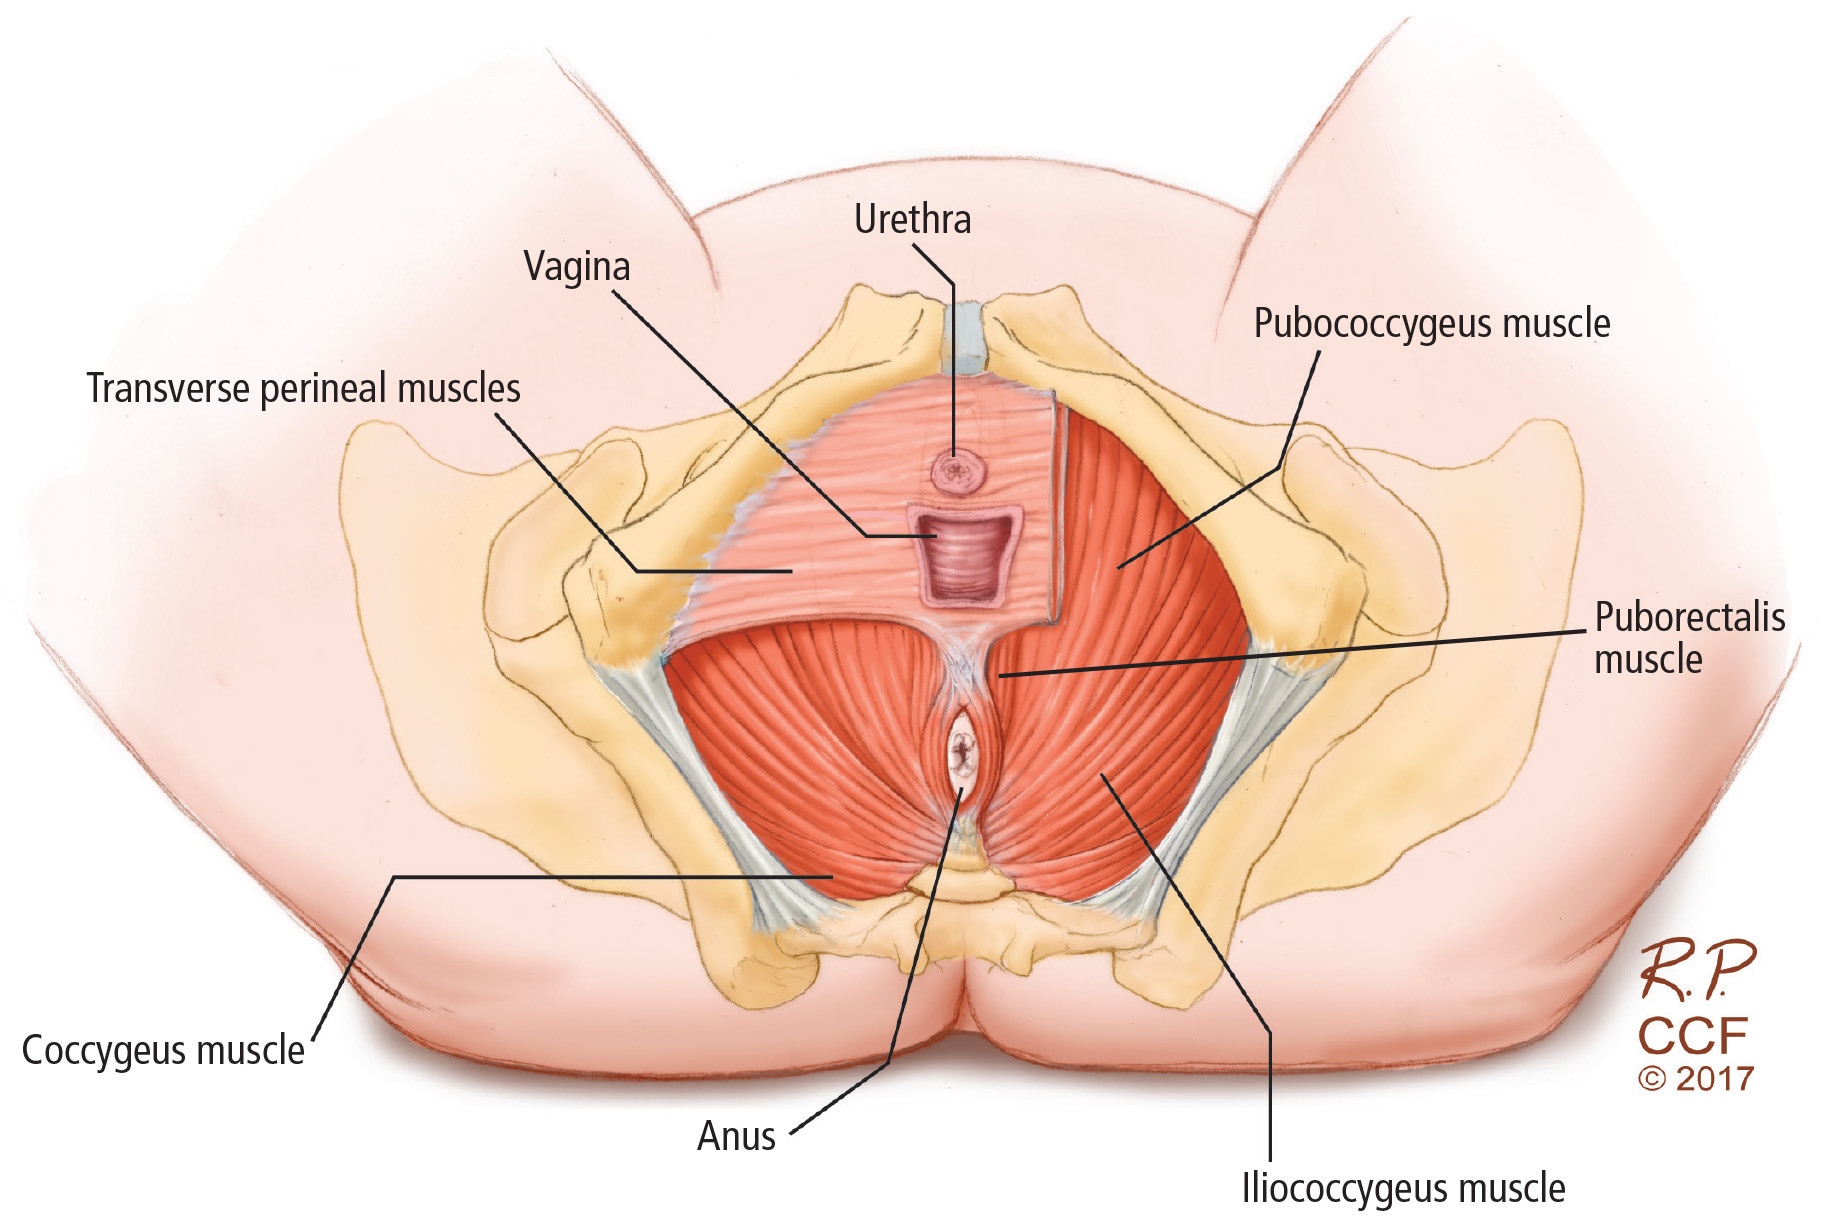
The pelvic floor consists of a group of muscles, resembling a hammock, that support the pelvic viscera. These muscles include the coccygeus and the layers of the levator ani (Figure 1). A weak pelvic floor is one of many risk factors for developing stress urinary incontinence. Like other muscle groups, a weak pelvic floor can be rehabilitated through various techniques, often guided by a physical therapist.
Compared with those who received no treatment, women with stress urinary incontinence who performed pelvic floor muscle training were 8 times more likely to report being cured and 17 times more likely to report cure or improvement.13
To perform a Kegel exercise, a woman consciously contracts her pelvic floor muscles as if stopping the flow of urine.
The Knack maneuver can be used to prevent leakage during anticipated events that increase intra-abdominal pressure. For example, when a cough or sneeze is imminent, patients can preemptively contract their pelvic floor and hold the contraction through the cough or sneeze.
Although many protocols have been compared, no specific pelvic floor exercise strategy has proven superior. A systematic review assessed variations in pelvic floor interventions, exercises, and delivery and found that there was insufficient evidence to make any recommendations about the best approach. However, the benefit was greater with regular supervision during pelvic floor muscle training than with little or no supervision.14
Pelvic floor muscle training strengthens the pelvic floor, which better supports the bladder neck and anatomically compensates for defects in stress urinary incontinence. In urgency urinary incontinence, a strong pelvic floor created by muscle training prevents leaking induced by the involuntary contractions of the detrusor muscle.
Recommendation
The ACP recommends pelvic floor muscle training as first-line treatment for stress urinary incontinence and mixed urinary incontinence, and grades this recommendation as strong with high-quality evidence.
BIOFEEDBACK AND PELVIC STIMULATION
Although pelvic floor exercises are effective in urinary incontinence, 30% of patients perform them incorrectly.15
Biofeedback therapy uses visual, verbal, and acoustic signals to give the patient immediate feedback and a greater awareness of her muscular activity. A commonly used technique employs a vaginal probe to measure and display pressure changes as the patient contracts her levator ani muscles.
Women who received biofeedback in addition to traditional pelvic floor physical therapy had greater improvement in urinary incontinence than those who received pelvic physical therapy alone (risk ratio 0.75, 95% confidence interval 0.66–0.86).16
Pelvic stimulation can be used separately or in conjunction with biofeedback in both urgency and stress urinary incontinence. When pelvic stimulation is used alone, 9 women need to be treated to achieve continence in 1, and 6 women need to be treated to improve continence in 1.16
Traditionally delivered by a pelvic floor physical therapist, pelvic stimulation and biofeedback have also been validated for home use.17,18 Several pelvic stimulation devices have been approved by the US Food and Drug Administration (FDA) for treating stress, urgency, and mixed urinary incontinence. These devices deliver stimulation to the pelvic floor at single or multiple frequencies. Although the mechanisms are not clearly understood, lower frequencies are used to treat urgency incontinence, while higher frequencies are used for stress incontinence. A theory is that higher-frequency stimulation strengthens the pelvic floor in stress urinary incontinence while lower frequency stimulation calms the detrusor muscle in urgency urinary incontinence.
The Apex and Apex M devices are both available over the counter, the former to treat stress urinary incontinence and the latter to treat mixed urinary incontinence, using pelvic stimulation alone. Other available devices, including the InTone and a smaller version, the InTone MV, are available by prescription and combine pelvic stimulation with biofeedback.18
Women who wish to avoid surgery, botulinum toxin injections, and daily oral medications, particularly those who are highly motivated, are ideal candidates for these over-the-counter automatic neuromuscular pelvic exercising devices.
PESSARIES AND OTHER DEVICES
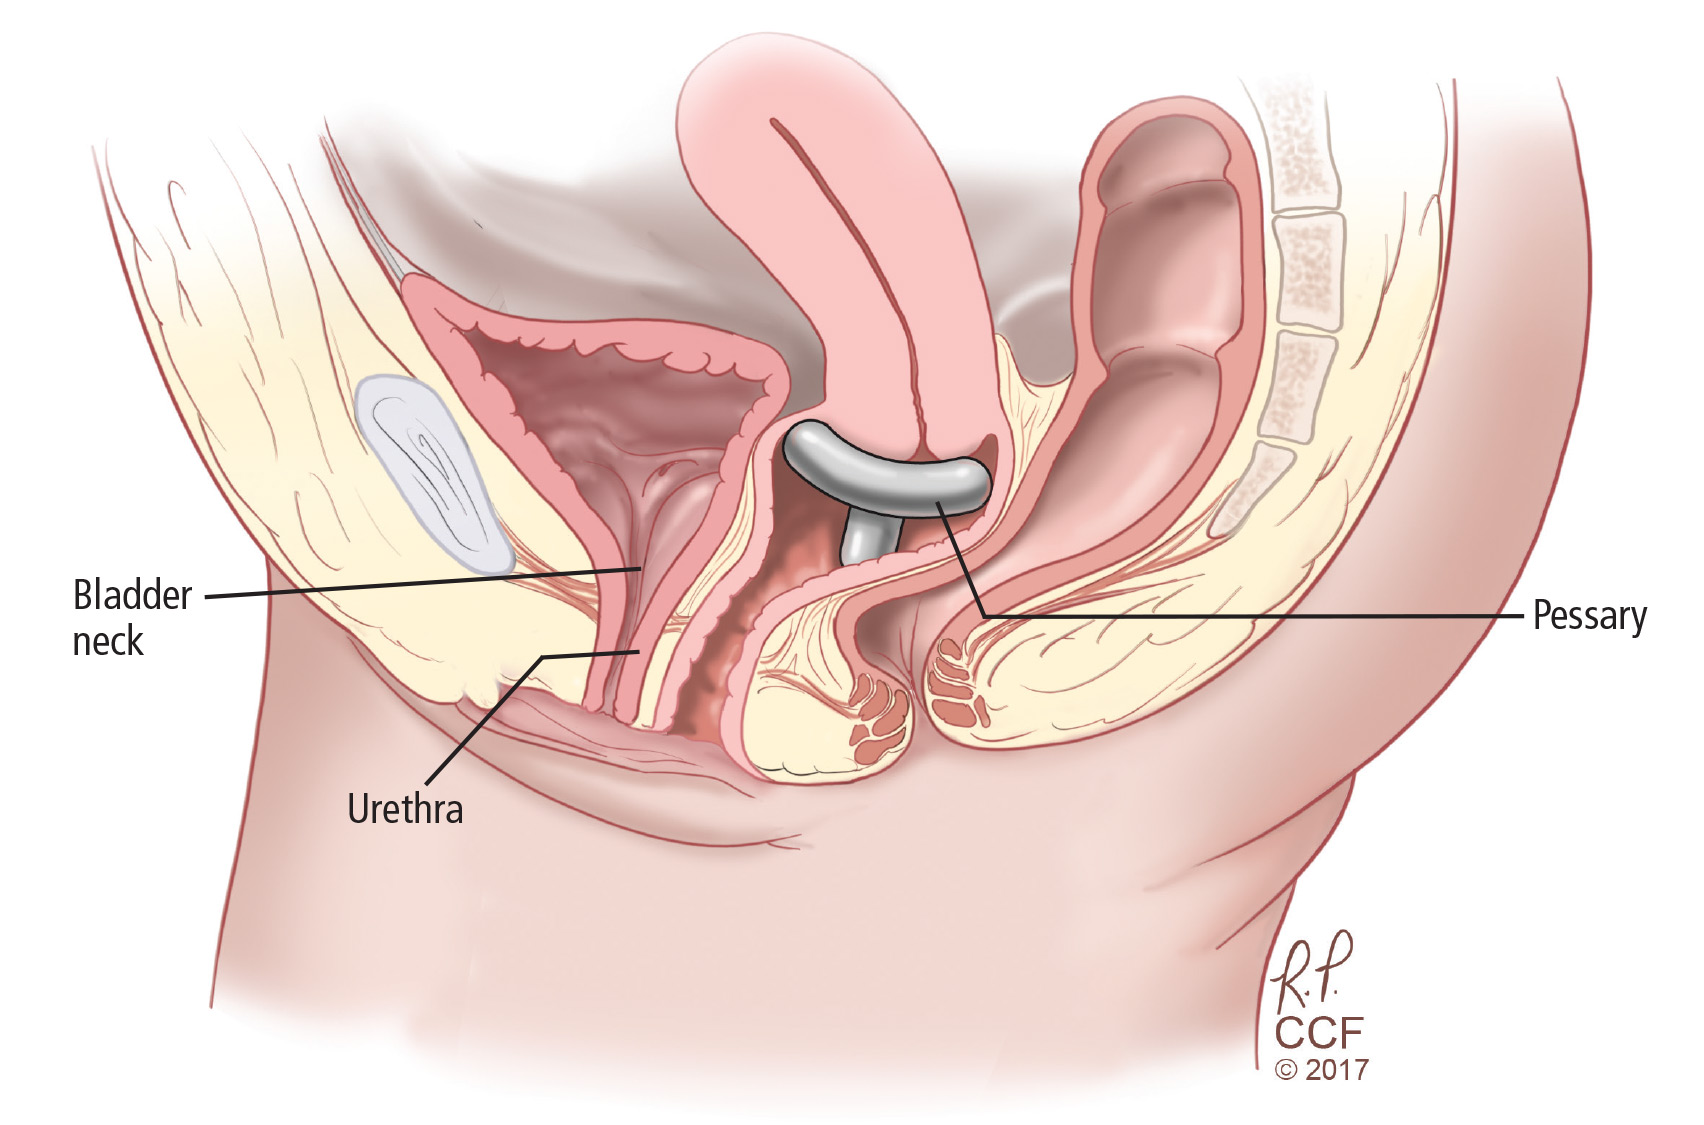
Pessaries are commonly used to treat pelvic organ prolapse but can also be designed to help correct the anatomic defect responsible for stress urinary incontinence. Continence pessaries support the bladder neck so that the urethrovesicular junction is stabilized rather than hypermobile during the increased intra-abdominal pressure that occurs with coughing, sneezing, or physical exertion (Figure 2). In theory, this should decrease leakage.
A systematic review concluded that the value of pessaries in the management of incontinence remains uncertain. However, there are inherent challenges in conducting trials of such devices.19 A pessary needs to be fitted by an appropriately trained healthcare provider. The Ambulatory Treatments for Leakage Associated With Stress Incontinence (ATLAS) trial20 reported that behavioral therapy was more effective than a pessary at 3 months, but the treatments were equivalent at 12 months.
The FDA has approved a disposable, over-the-counter silicone intravaginal device for treating stress urinary incontinence. Patients initially purchase a sizing kit and subsequently insert the nonabsorbent temporary intravaginal bladder supportive device, which is worn for up to 8 hours.
Women may elect to use regular tampons to do the job of a pessary, as they are easy to use and low in cost. No large randomized trials have compared tampons and pessaries, and currently no one device is known to be superior to another.
Overall, these devices are temporizing measures that have few serious adverse effects.
WEIGHT LOSS AND DIETARY CHANGES
Obesity has become a national epidemic, with more than 68% of Americans found to be overweight or obese according to the National Institutes of Health.21
Several studies found obesity to be an independent risk factor for urinary incontinence. As early as 1946, the British Birth Cohort study found that women ages 48 through 54 who were obese earlier in life had a higher risk of urinary incontinence in middle age, and those who were obese by age 20 were more likely to report severe incontinence.22 Likewise, the Nurses’ Health Study showed that women with a body mass index (BMI) more than 30 kg/m2 had 3.1 times the risk of severe incontinence compared with women with a normal BMI. Also, the Study of Women’s Health Across the Nation and the Leicestershire Medical Research Council (MRC) incontinence study both showed that a higher BMI and weight gain are strongly correlated with urinary incontinence.23,24
Increased intra-abdominal pressure may be the causative mechanism of stress urinary incontinence in obesity. The Korean National Health and Nutrition Examination Survey showed that central adiposity correlated with urgency incontinence.25,26
The MRC study was one of the largest to evaluate the effect of diet on urinary symptoms. Consuming a diet dense in vegetables, bread, and chicken was found to reduce the risk of urinary incontinence, while carbonated drinks were associated with a higher risk.25 These studies and others may point to reducing calories, and thus BMI, as a conservative treatment for urinary incontinence.
Newer data show bariatric surgery is associated with a strong reduction in urinary incontinence, demonstrated in a study that followed patients for 3 years after surgery.27 This encouraging result is but one of several positive health outcomes from bariatric surgery.
Recommendation
The ACP recommends both weight loss and exercise for overweight women with urinary incontinence, and grades this as strong with moderate-quality evidence.
DRUG THERAPY
The bladder neck is rich with sympathetic alpha-adrenergic receptors, and the bladder dome is dense with parasympathetic muscarinic receptors and sympathetic beta-adrenergic receptors. When the parasympathetic system is stimulated, the muscarinic receptors are activated, causing detrusor contraction and ultimately bladder emptying.
Agonism of beta-alpha adrenergic receptors and inhibition of parasympathetic receptors are both strategies of drug treatment of urinary incontinence.
Anticholinergic drugs
Anticholinergic medications function by blocking the muscarinic receptor, thereby inhibiting detrusor contraction.
Six oral anticholinergic medications are available: oxybutynin, tolterodine, fesoterodine, solifenacin, trospium, and darifenacin. These drugs have about the same effectiveness in treating urgency urinary incontinence, as measured by achieving continence and improving quality of life.28 Given their similarity in effectiveness, the choice of agent typically relies on the side-effect profile. Extended-release formulations have a more favorable side-effect profile, with fewer cases of dry mouth compared with immediate-release formulations.29
Overall, however, the benefit of these medications is small, with fewer than 200 patients achieving continence per 1,000 treated.28
Other limitations of these medications include their adverse effects and contraindications, and patients’ poor adherence to therapy. The most commonly reported adverse effect is dry mouth, but other common side effects include constipation, abdominal pain, dyspepsia, fatigue, dry eye, and dry skin. Transdermal oxybutynin therapy has been associated with fewer anticholinergic side effects than oral therapy.30
Contraindications to these medications include gastric retention, urinary retention, and angle-closure glaucoma.
Long-term adherence to anticholinergics is low, reported between 14% to 35% after 12 months, with the highest rates of adherence with solifenacin.31 The most commonly cited reason for discontinuation is lack of effect.32
Caution is urged when considering starting anticholinergic medications in older adults because of the central nervous system side effects, including drowsiness, hallucinations, cognitive impairment, and dementia. After 3 weeks, oxybutynin caused a memory decline as measured by delayed recall that was comparable to the decline seen over 10 years in normal aging.33 There is evidence suggesting trospium may cause less cognitive impairment, and therefore may be a better option for older patients.34
Beta-3 adrenoreceptor agonists
Activation of beta-3 adrenergic receptors through the sympathetic nervous system relaxes the detrusor muscle, allowing the bladder to store urine.
Mirabegron is a selective beta-3 adrenoreceptor agonist that effectively relaxes the bladder and increases bladder capacity. It improves continence, treatment satisfaction, and quality of life.35,36 There are fewer reports of dry mouth and constipation with this drug than with the anticholinergics; however, beta-3 adrenoreceptor agonists may be associated with greater risk of hypertension, nasopharyngitis, headache, and urinary tract infection.37
Duloxetine
Duloxetine, an antidepressant, blocks the reuptake of both serotonin and norepinephrine. Consequently, it decreases parasympathetic activity and increases sympathetic and somatic activity in the urinary system.38 While urine is stored, this cascade of neural activity is thought to collectively increase pudendal nerve activity and improve closure of the urethra.
Although duloxetine is approved to treat stress urinary incontinence in Europe, this is an off-label use in the United States.
A meta-analysis39 found that duloxetine improved quality of life in patients with stress urinary incontinence and that subjective cure rates were 10.8% with duloxetine vs 7.7% with placebo (P = .04). However the rate of adverse events is high, with nausea most common. Given its modest benefit and high rate of side effects, physicians may consider starting duloxetine only if there are psychiatric comorbidities such as depression, anxiety, or fibromyalgia.
Recommendations
The ACP recommends against systemic pharmacologic therapy for stress urinary incontinence. For urgency urinary incontinence, pharmacologic therapy is recommended if bladder training fails, and should be individualized based on the patient’s preference and medical comorbidities and the drug’s tolerability, cost, and ease of use.
Hormone therapy
In 2014, the North American Menopause Society recommended replacing the term “vulvovaginal atrophy” with the term genitourinary syndrome of menopause, which better encompasses the postmenopausal changes to the female genital system.40
Estrogen therapy is commercially available in both systemic and local preparations. The effect of exogenous estrogen on urinary incontinence may depend on whether it is given locally or systemically.
A systematic review41 definitively concluded that all commercially prepared local vaginal estrogen preparations can effectively relieve the genitourinary syndrome of menopause, including not only the common complaints of dryness, burning, and irritation but also urinary complaints of frequency, urgency, and urgency urinary incontinence.41 Additionally, the estradiol vaginal ring for vaginal atrophy (Estring) may have dual effects, functioning like an incontinence pessary by supporting the bladder neck while simultaneously providing local estrogen to the atrophied vaginal tissue.
However, in the Women’s Health Initiative,42 continent women who received either systemic estrogen therapy alone or systemic estrogen combined with progestin actually had a higher risk of developing urinary incontinence, and those already experiencing incontinence developed a worsening of their symptoms on systemic hormone therapy. The mechanism by which systemic hormone therapy causes urinary incontinence is unclear; however, previous studies showed that hormone therapy leads to a reduction in periurethral collagen and increased bladder contractility.43,44
TAKE-HOME POINTS
- Half of women with symptomatic urinary incontinence never report their symptoms.
- Bladder training is recommended for urgency incontinence and pelvic floor muscle training for stress incontinence.
- Thirty percent of women perform pelvic floor exercises incorrectly.
- Devices can be considered, including automatic pelvic exercise devices for stress and urgency incontinence and incontinence pessaries and disposable intravaginal bladder support devices for stress incontinence.
- Higher BMIs are strongly correlated with urinary incontinence.
- Anticholinergic medications are recommended for urgency but not stress incontinence.
- Vaginal estrogen cream may help with symptoms of urinary urgency, recurrent bladder infections, and nocturia in addition to incontinence.
- Qaseem A, Dallas P, Forciea MA, Starkey M, Denberg TD, Shekelle P; Clinical Guidelines Committee of the American College of Physicians. Nonsurgical management of urinary incontinence in women: a clinical practice guideline from the American College of Physicians. Ann Intern Med 2014; 161:429–440.
- Nygaard I, Barber MD, Burgio KL, et al; Pelvic Floor Disorders Network. Prevalence of symptomatic pelvic floor disorders in US women. JAMA 2008; 300:1311–1316.
- Wu JM, Vaughan CP, Goode PS, et al. Prevalence and trends of symptomatic pelvic floor disorders in US women. Obstet Gynecol 2014; 123:141–148.
- Wu JM, Stinnett S, Jackson RA, Jacoby A, Learman LA, Kuppermann M. Prevalence and incidence of urinary incontinence in a diverse population of women with noncancerous gynecologic conditions. Female Pelvic Med Reconstr Surg 2010; 16:284–289.
- Griffiths AN, Makam A, Edward GJ. Should we actively screen for urinary and anal incontinence in the general gynaecology outpatients setting? A prospective observational study. J Obstet Gynaecol 2006; 26:442–444.
- Coyne KS, Wein A, Nicholson S, Kvasz M, Chen CI, Milsom I. Economic burden of urgency urinary incontinence in the United Stated: a systematic review. J Manag Care Pharm 2014; 20:130–140.
- Haylen BT, Ridder D, Freeman RM, et al; International Urogynecological Association; International Continence Society. An International Urogynecological Association (IUGA)/International Continence Society (ICS) joint report on the terminology for female pelvic floor dysfunction. Neurourol Urodyn 2010; 29:4–20.
- Wu JM, Matthews CA, Conover MM, Pate V, Jonsson Funk M. Lifetime risk of stress urinary incontinence or pelvic organ prolapse surgery. Obstet Gynecol 2014; 123:1201–1206.
- Wyman JF, Fantl JA. Bladder training in the ambulatory care management of urinary incontinence. Urol Nurs 1991; 11:11–17.
- Fantl JA, Wyman JF, McClish DK, et al. Efficacy of bladder training in older women with urinary incontinence. JAMA 1991; 265:609–613.
- Subak LL, Quesenberry CP, Posner SF, Cattolica E, Soghikian K. The effect of behavioral therapy on urinary incontinence: a randomized controlled trial. Obstet Gynecol 2002; 100:72–78.
- Kegel AH. Progressive resistance exercise in the functional restoration of the perineal muscles. Am J Obstet Gynecol 1948; 56:238–248.
- Domoulin C, Hay-Smith EJ, Mac Habée-Séguin G. Pelvic floor muscle training versus no treatment, or inactive control treatments, for urinary incontinence in women. Cochrane Database Syst Rev 2014; 5:CD005654.
- Hay-Smith EJ, Herderschee R, Dumoulin C, Herbison GP. Comparisons of approaches to pelvic floor muscle training for urinary incontinence in women. Cochrane Database Syst Rev 2011; 12:CD009508.
- Bo K. Pelvic floor muscle strength and response to pelvic floor muscle training for stress urinary incontinence. Neurourol Urodyn 2003; 22:654–658.
- Herderschee R, Hay-Smith EJ, Herbison GP, Roovers JP, Heineman MJ. Feedback or biofeedback to augment pelvic floor muscle training for urinary incontinence in women. Cochrane Database Syst Rev 2011; 7:CD009252.
- Terlikowski R, Dobrzycka B, Kinalski M, Kuryliszyn-Moskal A, Terlikowski SJ. Transvaginal electrical stimulation with surface-EMG biofeedback in managing stress urinary incontinence in women of premenopausal age: a double-blind, placebo-controlled, randomized clinical trial. Int Urogynecol J 2013; 17:1631–1638.
- Guralnick ML, Kelly H, Engelke H, Koduri S, O’Connor RC. InTone: a novel pelvic floor rehabilitation device for urinary incontinence. Int Urogynecol J 2015; 26:99–106.
- Lipp A, Shaw C, Glavind K. Mechanical devices for urinary incontinence in women. Cochrane Database Syst Rev 2014; 12:CD001756.
- Richter HE, Burgio KL, Brubaker L, et al; Pelvic Floor Disorders Network. Continence pessary compared with behavioral therapy or combined therapy for stress incontinence: a randomized controlled trial. Obstet Gynecol 2010; 115:609–617.
- National Institute of Diabetes and Digestive and Kidney Diseases (NIDDK). Overweight and obesity statistics. www.niddk.nih.gov/health-information/health-statistics/Pages/overweight-obesity-statistics.aspx. Accessed January 6, 2017.
- Mishra GD, Hardy R, Cardozo L, Kuh D. Body weight through adult life and risk of urinary incontinence in middle-aged women. Results from a British prospective cohort. Int J Obes (Lond) 2008; 32:1415–1422.
- Danforth KN, Townsend MK, Lifford K, Curhan GC, Resnick NM, Grodstein F. Risk factors for urinary incontinence among middle age women. Am J Obstet Gynecol 2006; 194:339–345.
- Waetjen LE, Liao S, Johnson WO, et al. Factors associated with prevalence and incident urinary incontinence in a cohort of midlife women: a longitudinal analysis of data: study of women’s health across the nation. Am J Epidemiol 2007; 165:309–318.
- Dallosso HM, McGrother CW, Matthews RJ, Donaldson MM; Leicestershire MRC Incontinence Study Group. The association of diet and other lifestyle factors with overactive bladder and stress incontinence: a longitudinal study in women. BJU Int 2003; 92:69–77.
- Kim IH, Chung H, Kwon JW. Gender differences in the effect of obesity on chronic diseases among the elderly Koreans. J Korean Med Sci. 2011; 26:250–257.
- Subak LL, King WC, Belle SH, et al. Urinary incontinence before and after bariatric surgery. JAMA Intern Med 2015; 175:1378–1387.
- Shamliyan T, Wyman JF, Ramakrishnan R, Sainfort F, Kane RL. Benefits and harms of pharmacologic treatment for urinary incontinence in women: a systematic review. Ann Intern Med 2012; 156:861–874, W301–W310.
- Hay-Smith J, Herbison P, Ellis G, Morris A. Which anticholinergic drug for overactive bladder symptoms in adults. Cochrane Database Syst Rev 2005; 3:CD005429.
- Davila GW, Daugherty CA, Sanders SW; Transdermal Oxybutynin Study Group. A short term, multicenter, randomized double-blind dose titration study of the efficacy and anticholinergic side effects of transdermal compared to immediate release oral oxybutynin treatment of patients with urge urinary incontinence. J Urol 2001; 166:140–145.
- Wagg A, Compion G, Fahey A, Siddiqui E. Persistence with prescribed antimuscarinic therapy for overactive bladder: a UK experience. BJU Int 2012; 110:1767–1774.
- Benner JS, Nichol MB, Rovner ES, et al. Patient-reported reasons for discontinuing overactive bladder medication. BJU Int 2010; 105:1276–1282.
- Kay G, Crook T, Rekeda L, et al. Differential effects of the antimuscarinic agents darifenacin and oxybutynin ER on memory in older subjects. Eur Urol 2006; 50:317–326.
- Staskin D, Kay G, Tannenbaum C, et al. Trospium chloride has no effect on memory testing and is assay undetectable in the central nervous system of older patients with overactive bladder. Int J Clin Pract 2010; 64:1294–1300.
- Chapple CR, Amarenco G, Lopez A, et al; BLOSSOM Investigator Group. A proof of concept study: mirabegron, a new therapy for overactive bladder. Neurourol Urodyn 2013; 32:1116–1122.
- Nitti VB, Khullar V, van Kerrebroeck P, et al. Mirabegron for the treatment of overactive bladder: a prespecified pooled efficacy analysis and pooled safety analysis of three randomised, double-blind, placebo-controlled, phase III studies. Int J Clin Pract 2013; 67:619–632.
- Maman K, Aballea S, Nazir J, et al. Comparative efficacy and safety of medical treatments for the management of overactive bladder: a systematic literature review and mixed treatment comparison. Eur Urol 2014; 65:755–765.
- Katofiasc MA, Nissen J, Audia JE, Thor KB. Comparison of the effects of serotonin selective, norepinephrine, and dual serotonin and norepinephrine reuptake inhibitors on lower urinary tract function in cats. Life Sci 2002; 71:1227–1236.
- Mariappan P, Alhasso A, Ballantyne Z, Grant A, N’Dow J. Duloxetine, a serotonin and noradrenaline reuptake inhibitor for the treatment of stress urinary incontinence: a systematic review. Eur Urol 2007; 51:67–74.
- Portman DJ, Gass ML; Vulvovaginal Atrophy Terminology Consensus Conference Panel. Genitourinary syndrome of menopause: new terminology for vulvovaginal atrophy from the International Society for the Study of Women’s Sexual Health and the North American Menopause Society. Menopause 2014; 21:1063–1068.
- Rahn DD, Carberry C, Sanses TV, et al; Society of Gynecologic Surgeons Systematic Review Group. Vaginal estrogen for genitourinary syndrome of menopause: a systematic review. Obstet Gynecol 2014; 124:1147–1156.
- Hendrix SL, Cochrane BB, Nygaard IE, et al. Effects of estrogen with and without progestin on urinary incontinence. JAMA 2005; 293:935–948.
- Jackson S, James M, Abrams P. The effect of estradiol on vaginal collagen metabolism in postmenopausal women with genuine stress incontinence. BJOG 2002; 109:339–344.
- Lin AD, Levin R, Kogan B, et al. Estrogen induced functional hypertrophy and increased force generation of the female rabbit bladder. Neurourol Urodyn 2006; 25:473–479.
Urinary incontinence can lead to a cascade of symptomatic burden on the patient, causing distress, embarrassment, and suffering.
See related patient information
Traditionally, incontinence has been treated by surgeons, and surgery remains an option. However, more patients are now being managed by medical clinicians, who can offer a number of newer therapies. Ideally, a medical physician can initiate the evaluation and treatment and even effectively cure some forms of urinary incontinence.
In 2014, the American College of Physicians (ACP) published recommendations on the medical treatment of urinary incontinence in women (Table 1).1
This review describes the medical management of urinary incontinence in women, emphasizing the ACP recommendations1 and newer over-the-counter options.
COMMON AND UNDERREPORTED
Many women erroneously believe that urinary incontinence is an inevitable consequence of aging and allow it to lessen their quality of life without seeking medical attention.
Indeed, it is common. The 2005–2006 National Health and Nutritional Examination Survey2 found the prevalence of urinary incontinence in US women to be 15.7%. The prevalence increases with age from 6.9% in women ages 20 through 29 to 31.7% in those age 80 and older. A separate analysis of the same data found that 25.0% of women age 20 and older had 1 or more pelvic floor disorders.3 Some estimates are even higher. Wu et al4 reported a prevalence of urinary incontinence of 51.1% in women ages 31 through 54.
Too few of these women are identified and treated, for many reasons, including embarrassment and inadequate screening. Half of women with urinary incontinence do not report their symptoms because of humiliation or anxiety.5
The burden of urinary incontinence extends beyond the individual and into society. The total cost of overactive bladder and urgency urinary incontinence in the United States was estimated to be $65.9 billion in 2007 and is projected to reach $82.6 billion in 2020.6
THREE TYPES
There are 3 types of urinary incontinence: stress, urgency, and mixed.
Stress urinary incontinence is involuntary loss of urine associated with physical exertion or increased abdominal pressure, eg, with coughing or sneezing.
Urgency urinary incontinence is involuntary loss of urine associated with the sudden need to void. Many patients experience these symptoms simultaneously, making the distinction difficult.
Mixed urinary incontinence is loss of urine with both urgency and increased abdominal pressure or physical exertion.
Overactive bladder, a related problem, is defined as urinary urgency, usually accompanied by frequency and nocturia, with or without urgency urinary incontinence, in the absence of a urinary tract infection or other obvious disease.7
Nongenitourinary causes such as neurologic disorders or even malignancy can present with urinary incontinence, and thus it is critical to perform a thorough initial evaluation.
A 2014 study revealed that by age 80, 20% of women may need to undergo surgery for stress urinary incontinence or pelvic organ prolapse. This statistic should motivate healthcare providers to focus on prevention and offer conservative medical management for these conditions first.8
QUESTIONS TO ASK
When doing a pelvic examination, once could inquire about urinary incontinence with questions such as:
Do you leak urine when you cough, sneeze, laugh, or jump or during sexual climax?
Do you have to get up more than once at night to urinate?
Do you feel the urge to urinate frequently?
BEHAVIORAL MODIFICATION AND BLADDER TRAINING
Bladder training is a conservative behavioral treatment for urinary incontinence that primary care physicians can teach. It is primarily used for urgency urinary incontinence but can also be useful in stress urinary incontinence.
After completing a bladder diary and gaining awareness of their daily voiding patterns, patients can learn scheduled voiding to train the bladder, gradually extending the urges to longer intervals.
Clinicians should instruct patients on how to train the bladder, using methods first described by Wyman and Fantl.9 (See Training the bladder.)
There is evidence that bladder training improves urinary incontinence compared with usual care.10,11
The ACP recommends bladder training for women who have urgency urinary incontinence, but grades this recommendation as weak with low-quality evidence.
PELVIC FLOOR MUSCLE TRAINING
Introduced in 1948 by Dr. Arnold Kegel, pelvic floor muscle training has become widely adopted.12
The pelvic floor consists of a group of muscles, resembling a hammock, that support the pelvic viscera. These muscles include the coccygeus and the layers of the levator ani (Figure 1). A weak pelvic floor is one of many risk factors for developing stress urinary incontinence. Like other muscle groups, a weak pelvic floor can be rehabilitated through various techniques, often guided by a physical therapist.
Compared with those who received no treatment, women with stress urinary incontinence who performed pelvic floor muscle training were 8 times more likely to report being cured and 17 times more likely to report cure or improvement.13
To perform a Kegel exercise, a woman consciously contracts her pelvic floor muscles as if stopping the flow of urine.
The Knack maneuver can be used to prevent leakage during anticipated events that increase intra-abdominal pressure. For example, when a cough or sneeze is imminent, patients can preemptively contract their pelvic floor and hold the contraction through the cough or sneeze.
Although many protocols have been compared, no specific pelvic floor exercise strategy has proven superior. A systematic review assessed variations in pelvic floor interventions, exercises, and delivery and found that there was insufficient evidence to make any recommendations about the best approach. However, the benefit was greater with regular supervision during pelvic floor muscle training than with little or no supervision.14
Pelvic floor muscle training strengthens the pelvic floor, which better supports the bladder neck and anatomically compensates for defects in stress urinary incontinence. In urgency urinary incontinence, a strong pelvic floor created by muscle training prevents leaking induced by the involuntary contractions of the detrusor muscle.
Recommendation
The ACP recommends pelvic floor muscle training as first-line treatment for stress urinary incontinence and mixed urinary incontinence, and grades this recommendation as strong with high-quality evidence.
BIOFEEDBACK AND PELVIC STIMULATION
Although pelvic floor exercises are effective in urinary incontinence, 30% of patients perform them incorrectly.15
Biofeedback therapy uses visual, verbal, and acoustic signals to give the patient immediate feedback and a greater awareness of her muscular activity. A commonly used technique employs a vaginal probe to measure and display pressure changes as the patient contracts her levator ani muscles.
Women who received biofeedback in addition to traditional pelvic floor physical therapy had greater improvement in urinary incontinence than those who received pelvic physical therapy alone (risk ratio 0.75, 95% confidence interval 0.66–0.86).16
Pelvic stimulation can be used separately or in conjunction with biofeedback in both urgency and stress urinary incontinence. When pelvic stimulation is used alone, 9 women need to be treated to achieve continence in 1, and 6 women need to be treated to improve continence in 1.16
Traditionally delivered by a pelvic floor physical therapist, pelvic stimulation and biofeedback have also been validated for home use.17,18 Several pelvic stimulation devices have been approved by the US Food and Drug Administration (FDA) for treating stress, urgency, and mixed urinary incontinence. These devices deliver stimulation to the pelvic floor at single or multiple frequencies. Although the mechanisms are not clearly understood, lower frequencies are used to treat urgency incontinence, while higher frequencies are used for stress incontinence. A theory is that higher-frequency stimulation strengthens the pelvic floor in stress urinary incontinence while lower frequency stimulation calms the detrusor muscle in urgency urinary incontinence.
The Apex and Apex M devices are both available over the counter, the former to treat stress urinary incontinence and the latter to treat mixed urinary incontinence, using pelvic stimulation alone. Other available devices, including the InTone and a smaller version, the InTone MV, are available by prescription and combine pelvic stimulation with biofeedback.18
Women who wish to avoid surgery, botulinum toxin injections, and daily oral medications, particularly those who are highly motivated, are ideal candidates for these over-the-counter automatic neuromuscular pelvic exercising devices.
PESSARIES AND OTHER DEVICES
Pessaries are commonly used to treat pelvic organ prolapse but can also be designed to help correct the anatomic defect responsible for stress urinary incontinence. Continence pessaries support the bladder neck so that the urethrovesicular junction is stabilized rather than hypermobile during the increased intra-abdominal pressure that occurs with coughing, sneezing, or physical exertion (Figure 2). In theory, this should decrease leakage.
A systematic review concluded that the value of pessaries in the management of incontinence remains uncertain. However, there are inherent challenges in conducting trials of such devices.19 A pessary needs to be fitted by an appropriately trained healthcare provider. The Ambulatory Treatments for Leakage Associated With Stress Incontinence (ATLAS) trial20 reported that behavioral therapy was more effective than a pessary at 3 months, but the treatments were equivalent at 12 months.
The FDA has approved a disposable, over-the-counter silicone intravaginal device for treating stress urinary incontinence. Patients initially purchase a sizing kit and subsequently insert the nonabsorbent temporary intravaginal bladder supportive device, which is worn for up to 8 hours.
Women may elect to use regular tampons to do the job of a pessary, as they are easy to use and low in cost. No large randomized trials have compared tampons and pessaries, and currently no one device is known to be superior to another.
Overall, these devices are temporizing measures that have few serious adverse effects.
WEIGHT LOSS AND DIETARY CHANGES
Obesity has become a national epidemic, with more than 68% of Americans found to be overweight or obese according to the National Institutes of Health.21
Several studies found obesity to be an independent risk factor for urinary incontinence. As early as 1946, the British Birth Cohort study found that women ages 48 through 54 who were obese earlier in life had a higher risk of urinary incontinence in middle age, and those who were obese by age 20 were more likely to report severe incontinence.22 Likewise, the Nurses’ Health Study showed that women with a body mass index (BMI) more than 30 kg/m2 had 3.1 times the risk of severe incontinence compared with women with a normal BMI. Also, the Study of Women’s Health Across the Nation and the Leicestershire Medical Research Council (MRC) incontinence study both showed that a higher BMI and weight gain are strongly correlated with urinary incontinence.23,24
Increased intra-abdominal pressure may be the causative mechanism of stress urinary incontinence in obesity. The Korean National Health and Nutrition Examination Survey showed that central adiposity correlated with urgency incontinence.25,26
The MRC study was one of the largest to evaluate the effect of diet on urinary symptoms. Consuming a diet dense in vegetables, bread, and chicken was found to reduce the risk of urinary incontinence, while carbonated drinks were associated with a higher risk.25 These studies and others may point to reducing calories, and thus BMI, as a conservative treatment for urinary incontinence.
Newer data show bariatric surgery is associated with a strong reduction in urinary incontinence, demonstrated in a study that followed patients for 3 years after surgery.27 This encouraging result is but one of several positive health outcomes from bariatric surgery.
Recommendation
The ACP recommends both weight loss and exercise for overweight women with urinary incontinence, and grades this as strong with moderate-quality evidence.
DRUG THERAPY
The bladder neck is rich with sympathetic alpha-adrenergic receptors, and the bladder dome is dense with parasympathetic muscarinic receptors and sympathetic beta-adrenergic receptors. When the parasympathetic system is stimulated, the muscarinic receptors are activated, causing detrusor contraction and ultimately bladder emptying.
Agonism of beta-alpha adrenergic receptors and inhibition of parasympathetic receptors are both strategies of drug treatment of urinary incontinence.
Anticholinergic drugs
Anticholinergic medications function by blocking the muscarinic receptor, thereby inhibiting detrusor contraction.
Six oral anticholinergic medications are available: oxybutynin, tolterodine, fesoterodine, solifenacin, trospium, and darifenacin. These drugs have about the same effectiveness in treating urgency urinary incontinence, as measured by achieving continence and improving quality of life.28 Given their similarity in effectiveness, the choice of agent typically relies on the side-effect profile. Extended-release formulations have a more favorable side-effect profile, with fewer cases of dry mouth compared with immediate-release formulations.29
Overall, however, the benefit of these medications is small, with fewer than 200 patients achieving continence per 1,000 treated.28
Other limitations of these medications include their adverse effects and contraindications, and patients’ poor adherence to therapy. The most commonly reported adverse effect is dry mouth, but other common side effects include constipation, abdominal pain, dyspepsia, fatigue, dry eye, and dry skin. Transdermal oxybutynin therapy has been associated with fewer anticholinergic side effects than oral therapy.30
Contraindications to these medications include gastric retention, urinary retention, and angle-closure glaucoma.
Long-term adherence to anticholinergics is low, reported between 14% to 35% after 12 months, with the highest rates of adherence with solifenacin.31 The most commonly cited reason for discontinuation is lack of effect.32
Caution is urged when considering starting anticholinergic medications in older adults because of the central nervous system side effects, including drowsiness, hallucinations, cognitive impairment, and dementia. After 3 weeks, oxybutynin caused a memory decline as measured by delayed recall that was comparable to the decline seen over 10 years in normal aging.33 There is evidence suggesting trospium may cause less cognitive impairment, and therefore may be a better option for older patients.34
Beta-3 adrenoreceptor agonists
Activation of beta-3 adrenergic receptors through the sympathetic nervous system relaxes the detrusor muscle, allowing the bladder to store urine.
Mirabegron is a selective beta-3 adrenoreceptor agonist that effectively relaxes the bladder and increases bladder capacity. It improves continence, treatment satisfaction, and quality of life.35,36 There are fewer reports of dry mouth and constipation with this drug than with the anticholinergics; however, beta-3 adrenoreceptor agonists may be associated with greater risk of hypertension, nasopharyngitis, headache, and urinary tract infection.37
Duloxetine
Duloxetine, an antidepressant, blocks the reuptake of both serotonin and norepinephrine. Consequently, it decreases parasympathetic activity and increases sympathetic and somatic activity in the urinary system.38 While urine is stored, this cascade of neural activity is thought to collectively increase pudendal nerve activity and improve closure of the urethra.
Although duloxetine is approved to treat stress urinary incontinence in Europe, this is an off-label use in the United States.
A meta-analysis39 found that duloxetine improved quality of life in patients with stress urinary incontinence and that subjective cure rates were 10.8% with duloxetine vs 7.7% with placebo (P = .04). However the rate of adverse events is high, with nausea most common. Given its modest benefit and high rate of side effects, physicians may consider starting duloxetine only if there are psychiatric comorbidities such as depression, anxiety, or fibromyalgia.
Recommendations
The ACP recommends against systemic pharmacologic therapy for stress urinary incontinence. For urgency urinary incontinence, pharmacologic therapy is recommended if bladder training fails, and should be individualized based on the patient’s preference and medical comorbidities and the drug’s tolerability, cost, and ease of use.
Hormone therapy
In 2014, the North American Menopause Society recommended replacing the term “vulvovaginal atrophy” with the term genitourinary syndrome of menopause, which better encompasses the postmenopausal changes to the female genital system.40
Estrogen therapy is commercially available in both systemic and local preparations. The effect of exogenous estrogen on urinary incontinence may depend on whether it is given locally or systemically.
A systematic review41 definitively concluded that all commercially prepared local vaginal estrogen preparations can effectively relieve the genitourinary syndrome of menopause, including not only the common complaints of dryness, burning, and irritation but also urinary complaints of frequency, urgency, and urgency urinary incontinence.41 Additionally, the estradiol vaginal ring for vaginal atrophy (Estring) may have dual effects, functioning like an incontinence pessary by supporting the bladder neck while simultaneously providing local estrogen to the atrophied vaginal tissue.
However, in the Women’s Health Initiative,42 continent women who received either systemic estrogen therapy alone or systemic estrogen combined with progestin actually had a higher risk of developing urinary incontinence, and those already experiencing incontinence developed a worsening of their symptoms on systemic hormone therapy. The mechanism by which systemic hormone therapy causes urinary incontinence is unclear; however, previous studies showed that hormone therapy leads to a reduction in periurethral collagen and increased bladder contractility.43,44
TAKE-HOME POINTS
- Half of women with symptomatic urinary incontinence never report their symptoms.
- Bladder training is recommended for urgency incontinence and pelvic floor muscle training for stress incontinence.
- Thirty percent of women perform pelvic floor exercises incorrectly.
- Devices can be considered, including automatic pelvic exercise devices for stress and urgency incontinence and incontinence pessaries and disposable intravaginal bladder support devices for stress incontinence.
- Higher BMIs are strongly correlated with urinary incontinence.
- Anticholinergic medications are recommended for urgency but not stress incontinence.
- Vaginal estrogen cream may help with symptoms of urinary urgency, recurrent bladder infections, and nocturia in addition to incontinence.
Urinary incontinence can lead to a cascade of symptomatic burden on the patient, causing distress, embarrassment, and suffering.
See related patient information
Traditionally, incontinence has been treated by surgeons, and surgery remains an option. However, more patients are now being managed by medical clinicians, who can offer a number of newer therapies. Ideally, a medical physician can initiate the evaluation and treatment and even effectively cure some forms of urinary incontinence.
In 2014, the American College of Physicians (ACP) published recommendations on the medical treatment of urinary incontinence in women (Table 1).1
This review describes the medical management of urinary incontinence in women, emphasizing the ACP recommendations1 and newer over-the-counter options.
COMMON AND UNDERREPORTED
Many women erroneously believe that urinary incontinence is an inevitable consequence of aging and allow it to lessen their quality of life without seeking medical attention.
Indeed, it is common. The 2005–2006 National Health and Nutritional Examination Survey2 found the prevalence of urinary incontinence in US women to be 15.7%. The prevalence increases with age from 6.9% in women ages 20 through 29 to 31.7% in those age 80 and older. A separate analysis of the same data found that 25.0% of women age 20 and older had 1 or more pelvic floor disorders.3 Some estimates are even higher. Wu et al4 reported a prevalence of urinary incontinence of 51.1% in women ages 31 through 54.
Too few of these women are identified and treated, for many reasons, including embarrassment and inadequate screening. Half of women with urinary incontinence do not report their symptoms because of humiliation or anxiety.5
The burden of urinary incontinence extends beyond the individual and into society. The total cost of overactive bladder and urgency urinary incontinence in the United States was estimated to be $65.9 billion in 2007 and is projected to reach $82.6 billion in 2020.6
THREE TYPES
There are 3 types of urinary incontinence: stress, urgency, and mixed.
Stress urinary incontinence is involuntary loss of urine associated with physical exertion or increased abdominal pressure, eg, with coughing or sneezing.
Urgency urinary incontinence is involuntary loss of urine associated with the sudden need to void. Many patients experience these symptoms simultaneously, making the distinction difficult.
Mixed urinary incontinence is loss of urine with both urgency and increased abdominal pressure or physical exertion.
Overactive bladder, a related problem, is defined as urinary urgency, usually accompanied by frequency and nocturia, with or without urgency urinary incontinence, in the absence of a urinary tract infection or other obvious disease.7
Nongenitourinary causes such as neurologic disorders or even malignancy can present with urinary incontinence, and thus it is critical to perform a thorough initial evaluation.
A 2014 study revealed that by age 80, 20% of women may need to undergo surgery for stress urinary incontinence or pelvic organ prolapse. This statistic should motivate healthcare providers to focus on prevention and offer conservative medical management for these conditions first.8
QUESTIONS TO ASK
When doing a pelvic examination, once could inquire about urinary incontinence with questions such as:
Do you leak urine when you cough, sneeze, laugh, or jump or during sexual climax?
Do you have to get up more than once at night to urinate?
Do you feel the urge to urinate frequently?
BEHAVIORAL MODIFICATION AND BLADDER TRAINING
Bladder training is a conservative behavioral treatment for urinary incontinence that primary care physicians can teach. It is primarily used for urgency urinary incontinence but can also be useful in stress urinary incontinence.
After completing a bladder diary and gaining awareness of their daily voiding patterns, patients can learn scheduled voiding to train the bladder, gradually extending the urges to longer intervals.
Clinicians should instruct patients on how to train the bladder, using methods first described by Wyman and Fantl.9 (See Training the bladder.)
There is evidence that bladder training improves urinary incontinence compared with usual care.10,11
The ACP recommends bladder training for women who have urgency urinary incontinence, but grades this recommendation as weak with low-quality evidence.
PELVIC FLOOR MUSCLE TRAINING
Introduced in 1948 by Dr. Arnold Kegel, pelvic floor muscle training has become widely adopted.12
The pelvic floor consists of a group of muscles, resembling a hammock, that support the pelvic viscera. These muscles include the coccygeus and the layers of the levator ani (Figure 1). A weak pelvic floor is one of many risk factors for developing stress urinary incontinence. Like other muscle groups, a weak pelvic floor can be rehabilitated through various techniques, often guided by a physical therapist.
Compared with those who received no treatment, women with stress urinary incontinence who performed pelvic floor muscle training were 8 times more likely to report being cured and 17 times more likely to report cure or improvement.13
To perform a Kegel exercise, a woman consciously contracts her pelvic floor muscles as if stopping the flow of urine.
The Knack maneuver can be used to prevent leakage during anticipated events that increase intra-abdominal pressure. For example, when a cough or sneeze is imminent, patients can preemptively contract their pelvic floor and hold the contraction through the cough or sneeze.
Although many protocols have been compared, no specific pelvic floor exercise strategy has proven superior. A systematic review assessed variations in pelvic floor interventions, exercises, and delivery and found that there was insufficient evidence to make any recommendations about the best approach. However, the benefit was greater with regular supervision during pelvic floor muscle training than with little or no supervision.14
Pelvic floor muscle training strengthens the pelvic floor, which better supports the bladder neck and anatomically compensates for defects in stress urinary incontinence. In urgency urinary incontinence, a strong pelvic floor created by muscle training prevents leaking induced by the involuntary contractions of the detrusor muscle.
Recommendation
The ACP recommends pelvic floor muscle training as first-line treatment for stress urinary incontinence and mixed urinary incontinence, and grades this recommendation as strong with high-quality evidence.
BIOFEEDBACK AND PELVIC STIMULATION
Although pelvic floor exercises are effective in urinary incontinence, 30% of patients perform them incorrectly.15
Biofeedback therapy uses visual, verbal, and acoustic signals to give the patient immediate feedback and a greater awareness of her muscular activity. A commonly used technique employs a vaginal probe to measure and display pressure changes as the patient contracts her levator ani muscles.
Women who received biofeedback in addition to traditional pelvic floor physical therapy had greater improvement in urinary incontinence than those who received pelvic physical therapy alone (risk ratio 0.75, 95% confidence interval 0.66–0.86).16
Pelvic stimulation can be used separately or in conjunction with biofeedback in both urgency and stress urinary incontinence. When pelvic stimulation is used alone, 9 women need to be treated to achieve continence in 1, and 6 women need to be treated to improve continence in 1.16
Traditionally delivered by a pelvic floor physical therapist, pelvic stimulation and biofeedback have also been validated for home use.17,18 Several pelvic stimulation devices have been approved by the US Food and Drug Administration (FDA) for treating stress, urgency, and mixed urinary incontinence. These devices deliver stimulation to the pelvic floor at single or multiple frequencies. Although the mechanisms are not clearly understood, lower frequencies are used to treat urgency incontinence, while higher frequencies are used for stress incontinence. A theory is that higher-frequency stimulation strengthens the pelvic floor in stress urinary incontinence while lower frequency stimulation calms the detrusor muscle in urgency urinary incontinence.
The Apex and Apex M devices are both available over the counter, the former to treat stress urinary incontinence and the latter to treat mixed urinary incontinence, using pelvic stimulation alone. Other available devices, including the InTone and a smaller version, the InTone MV, are available by prescription and combine pelvic stimulation with biofeedback.18
Women who wish to avoid surgery, botulinum toxin injections, and daily oral medications, particularly those who are highly motivated, are ideal candidates for these over-the-counter automatic neuromuscular pelvic exercising devices.
PESSARIES AND OTHER DEVICES
Pessaries are commonly used to treat pelvic organ prolapse but can also be designed to help correct the anatomic defect responsible for stress urinary incontinence. Continence pessaries support the bladder neck so that the urethrovesicular junction is stabilized rather than hypermobile during the increased intra-abdominal pressure that occurs with coughing, sneezing, or physical exertion (Figure 2). In theory, this should decrease leakage.
A systematic review concluded that the value of pessaries in the management of incontinence remains uncertain. However, there are inherent challenges in conducting trials of such devices.19 A pessary needs to be fitted by an appropriately trained healthcare provider. The Ambulatory Treatments for Leakage Associated With Stress Incontinence (ATLAS) trial20 reported that behavioral therapy was more effective than a pessary at 3 months, but the treatments were equivalent at 12 months.
The FDA has approved a disposable, over-the-counter silicone intravaginal device for treating stress urinary incontinence. Patients initially purchase a sizing kit and subsequently insert the nonabsorbent temporary intravaginal bladder supportive device, which is worn for up to 8 hours.
Women may elect to use regular tampons to do the job of a pessary, as they are easy to use and low in cost. No large randomized trials have compared tampons and pessaries, and currently no one device is known to be superior to another.
Overall, these devices are temporizing measures that have few serious adverse effects.
WEIGHT LOSS AND DIETARY CHANGES
Obesity has become a national epidemic, with more than 68% of Americans found to be overweight or obese according to the National Institutes of Health.21
Several studies found obesity to be an independent risk factor for urinary incontinence. As early as 1946, the British Birth Cohort study found that women ages 48 through 54 who were obese earlier in life had a higher risk of urinary incontinence in middle age, and those who were obese by age 20 were more likely to report severe incontinence.22 Likewise, the Nurses’ Health Study showed that women with a body mass index (BMI) more than 30 kg/m2 had 3.1 times the risk of severe incontinence compared with women with a normal BMI. Also, the Study of Women’s Health Across the Nation and the Leicestershire Medical Research Council (MRC) incontinence study both showed that a higher BMI and weight gain are strongly correlated with urinary incontinence.23,24
Increased intra-abdominal pressure may be the causative mechanism of stress urinary incontinence in obesity. The Korean National Health and Nutrition Examination Survey showed that central adiposity correlated with urgency incontinence.25,26
The MRC study was one of the largest to evaluate the effect of diet on urinary symptoms. Consuming a diet dense in vegetables, bread, and chicken was found to reduce the risk of urinary incontinence, while carbonated drinks were associated with a higher risk.25 These studies and others may point to reducing calories, and thus BMI, as a conservative treatment for urinary incontinence.
Newer data show bariatric surgery is associated with a strong reduction in urinary incontinence, demonstrated in a study that followed patients for 3 years after surgery.27 This encouraging result is but one of several positive health outcomes from bariatric surgery.
Recommendation
The ACP recommends both weight loss and exercise for overweight women with urinary incontinence, and grades this as strong with moderate-quality evidence.
DRUG THERAPY
The bladder neck is rich with sympathetic alpha-adrenergic receptors, and the bladder dome is dense with parasympathetic muscarinic receptors and sympathetic beta-adrenergic receptors. When the parasympathetic system is stimulated, the muscarinic receptors are activated, causing detrusor contraction and ultimately bladder emptying.
Agonism of beta-alpha adrenergic receptors and inhibition of parasympathetic receptors are both strategies of drug treatment of urinary incontinence.
Anticholinergic drugs
Anticholinergic medications function by blocking the muscarinic receptor, thereby inhibiting detrusor contraction.
Six oral anticholinergic medications are available: oxybutynin, tolterodine, fesoterodine, solifenacin, trospium, and darifenacin. These drugs have about the same effectiveness in treating urgency urinary incontinence, as measured by achieving continence and improving quality of life.28 Given their similarity in effectiveness, the choice of agent typically relies on the side-effect profile. Extended-release formulations have a more favorable side-effect profile, with fewer cases of dry mouth compared with immediate-release formulations.29
Overall, however, the benefit of these medications is small, with fewer than 200 patients achieving continence per 1,000 treated.28
Other limitations of these medications include their adverse effects and contraindications, and patients’ poor adherence to therapy. The most commonly reported adverse effect is dry mouth, but other common side effects include constipation, abdominal pain, dyspepsia, fatigue, dry eye, and dry skin. Transdermal oxybutynin therapy has been associated with fewer anticholinergic side effects than oral therapy.30
Contraindications to these medications include gastric retention, urinary retention, and angle-closure glaucoma.
Long-term adherence to anticholinergics is low, reported between 14% to 35% after 12 months, with the highest rates of adherence with solifenacin.31 The most commonly cited reason for discontinuation is lack of effect.32
Caution is urged when considering starting anticholinergic medications in older adults because of the central nervous system side effects, including drowsiness, hallucinations, cognitive impairment, and dementia. After 3 weeks, oxybutynin caused a memory decline as measured by delayed recall that was comparable to the decline seen over 10 years in normal aging.33 There is evidence suggesting trospium may cause less cognitive impairment, and therefore may be a better option for older patients.34
Beta-3 adrenoreceptor agonists
Activation of beta-3 adrenergic receptors through the sympathetic nervous system relaxes the detrusor muscle, allowing the bladder to store urine.
Mirabegron is a selective beta-3 adrenoreceptor agonist that effectively relaxes the bladder and increases bladder capacity. It improves continence, treatment satisfaction, and quality of life.35,36 There are fewer reports of dry mouth and constipation with this drug than with the anticholinergics; however, beta-3 adrenoreceptor agonists may be associated with greater risk of hypertension, nasopharyngitis, headache, and urinary tract infection.37
Duloxetine
Duloxetine, an antidepressant, blocks the reuptake of both serotonin and norepinephrine. Consequently, it decreases parasympathetic activity and increases sympathetic and somatic activity in the urinary system.38 While urine is stored, this cascade of neural activity is thought to collectively increase pudendal nerve activity and improve closure of the urethra.
Although duloxetine is approved to treat stress urinary incontinence in Europe, this is an off-label use in the United States.
A meta-analysis39 found that duloxetine improved quality of life in patients with stress urinary incontinence and that subjective cure rates were 10.8% with duloxetine vs 7.7% with placebo (P = .04). However the rate of adverse events is high, with nausea most common. Given its modest benefit and high rate of side effects, physicians may consider starting duloxetine only if there are psychiatric comorbidities such as depression, anxiety, or fibromyalgia.
Recommendations
The ACP recommends against systemic pharmacologic therapy for stress urinary incontinence. For urgency urinary incontinence, pharmacologic therapy is recommended if bladder training fails, and should be individualized based on the patient’s preference and medical comorbidities and the drug’s tolerability, cost, and ease of use.
Hormone therapy
In 2014, the North American Menopause Society recommended replacing the term “vulvovaginal atrophy” with the term genitourinary syndrome of menopause, which better encompasses the postmenopausal changes to the female genital system.40
Estrogen therapy is commercially available in both systemic and local preparations. The effect of exogenous estrogen on urinary incontinence may depend on whether it is given locally or systemically.
A systematic review41 definitively concluded that all commercially prepared local vaginal estrogen preparations can effectively relieve the genitourinary syndrome of menopause, including not only the common complaints of dryness, burning, and irritation but also urinary complaints of frequency, urgency, and urgency urinary incontinence.41 Additionally, the estradiol vaginal ring for vaginal atrophy (Estring) may have dual effects, functioning like an incontinence pessary by supporting the bladder neck while simultaneously providing local estrogen to the atrophied vaginal tissue.
However, in the Women’s Health Initiative,42 continent women who received either systemic estrogen therapy alone or systemic estrogen combined with progestin actually had a higher risk of developing urinary incontinence, and those already experiencing incontinence developed a worsening of their symptoms on systemic hormone therapy. The mechanism by which systemic hormone therapy causes urinary incontinence is unclear; however, previous studies showed that hormone therapy leads to a reduction in periurethral collagen and increased bladder contractility.43,44
TAKE-HOME POINTS
- Half of women with symptomatic urinary incontinence never report their symptoms.
- Bladder training is recommended for urgency incontinence and pelvic floor muscle training for stress incontinence.
- Thirty percent of women perform pelvic floor exercises incorrectly.
- Devices can be considered, including automatic pelvic exercise devices for stress and urgency incontinence and incontinence pessaries and disposable intravaginal bladder support devices for stress incontinence.
- Higher BMIs are strongly correlated with urinary incontinence.
- Anticholinergic medications are recommended for urgency but not stress incontinence.
- Vaginal estrogen cream may help with symptoms of urinary urgency, recurrent bladder infections, and nocturia in addition to incontinence.
- Qaseem A, Dallas P, Forciea MA, Starkey M, Denberg TD, Shekelle P; Clinical Guidelines Committee of the American College of Physicians. Nonsurgical management of urinary incontinence in women: a clinical practice guideline from the American College of Physicians. Ann Intern Med 2014; 161:429–440.
- Nygaard I, Barber MD, Burgio KL, et al; Pelvic Floor Disorders Network. Prevalence of symptomatic pelvic floor disorders in US women. JAMA 2008; 300:1311–1316.
- Wu JM, Vaughan CP, Goode PS, et al. Prevalence and trends of symptomatic pelvic floor disorders in US women. Obstet Gynecol 2014; 123:141–148.
- Wu JM, Stinnett S, Jackson RA, Jacoby A, Learman LA, Kuppermann M. Prevalence and incidence of urinary incontinence in a diverse population of women with noncancerous gynecologic conditions. Female Pelvic Med Reconstr Surg 2010; 16:284–289.
- Griffiths AN, Makam A, Edward GJ. Should we actively screen for urinary and anal incontinence in the general gynaecology outpatients setting? A prospective observational study. J Obstet Gynaecol 2006; 26:442–444.
- Coyne KS, Wein A, Nicholson S, Kvasz M, Chen CI, Milsom I. Economic burden of urgency urinary incontinence in the United Stated: a systematic review. J Manag Care Pharm 2014; 20:130–140.
- Haylen BT, Ridder D, Freeman RM, et al; International Urogynecological Association; International Continence Society. An International Urogynecological Association (IUGA)/International Continence Society (ICS) joint report on the terminology for female pelvic floor dysfunction. Neurourol Urodyn 2010; 29:4–20.
- Wu JM, Matthews CA, Conover MM, Pate V, Jonsson Funk M. Lifetime risk of stress urinary incontinence or pelvic organ prolapse surgery. Obstet Gynecol 2014; 123:1201–1206.
- Wyman JF, Fantl JA. Bladder training in the ambulatory care management of urinary incontinence. Urol Nurs 1991; 11:11–17.
- Fantl JA, Wyman JF, McClish DK, et al. Efficacy of bladder training in older women with urinary incontinence. JAMA 1991; 265:609–613.
- Subak LL, Quesenberry CP, Posner SF, Cattolica E, Soghikian K. The effect of behavioral therapy on urinary incontinence: a randomized controlled trial. Obstet Gynecol 2002; 100:72–78.
- Kegel AH. Progressive resistance exercise in the functional restoration of the perineal muscles. Am J Obstet Gynecol 1948; 56:238–248.
- Domoulin C, Hay-Smith EJ, Mac Habée-Séguin G. Pelvic floor muscle training versus no treatment, or inactive control treatments, for urinary incontinence in women. Cochrane Database Syst Rev 2014; 5:CD005654.
- Hay-Smith EJ, Herderschee R, Dumoulin C, Herbison GP. Comparisons of approaches to pelvic floor muscle training for urinary incontinence in women. Cochrane Database Syst Rev 2011; 12:CD009508.
- Bo K. Pelvic floor muscle strength and response to pelvic floor muscle training for stress urinary incontinence. Neurourol Urodyn 2003; 22:654–658.
- Herderschee R, Hay-Smith EJ, Herbison GP, Roovers JP, Heineman MJ. Feedback or biofeedback to augment pelvic floor muscle training for urinary incontinence in women. Cochrane Database Syst Rev 2011; 7:CD009252.
- Terlikowski R, Dobrzycka B, Kinalski M, Kuryliszyn-Moskal A, Terlikowski SJ. Transvaginal electrical stimulation with surface-EMG biofeedback in managing stress urinary incontinence in women of premenopausal age: a double-blind, placebo-controlled, randomized clinical trial. Int Urogynecol J 2013; 17:1631–1638.
- Guralnick ML, Kelly H, Engelke H, Koduri S, O’Connor RC. InTone: a novel pelvic floor rehabilitation device for urinary incontinence. Int Urogynecol J 2015; 26:99–106.
- Lipp A, Shaw C, Glavind K. Mechanical devices for urinary incontinence in women. Cochrane Database Syst Rev 2014; 12:CD001756.
- Richter HE, Burgio KL, Brubaker L, et al; Pelvic Floor Disorders Network. Continence pessary compared with behavioral therapy or combined therapy for stress incontinence: a randomized controlled trial. Obstet Gynecol 2010; 115:609–617.
- National Institute of Diabetes and Digestive and Kidney Diseases (NIDDK). Overweight and obesity statistics. www.niddk.nih.gov/health-information/health-statistics/Pages/overweight-obesity-statistics.aspx. Accessed January 6, 2017.
- Mishra GD, Hardy R, Cardozo L, Kuh D. Body weight through adult life and risk of urinary incontinence in middle-aged women. Results from a British prospective cohort. Int J Obes (Lond) 2008; 32:1415–1422.
- Danforth KN, Townsend MK, Lifford K, Curhan GC, Resnick NM, Grodstein F. Risk factors for urinary incontinence among middle age women. Am J Obstet Gynecol 2006; 194:339–345.
- Waetjen LE, Liao S, Johnson WO, et al. Factors associated with prevalence and incident urinary incontinence in a cohort of midlife women: a longitudinal analysis of data: study of women’s health across the nation. Am J Epidemiol 2007; 165:309–318.
- Dallosso HM, McGrother CW, Matthews RJ, Donaldson MM; Leicestershire MRC Incontinence Study Group. The association of diet and other lifestyle factors with overactive bladder and stress incontinence: a longitudinal study in women. BJU Int 2003; 92:69–77.
- Kim IH, Chung H, Kwon JW. Gender differences in the effect of obesity on chronic diseases among the elderly Koreans. J Korean Med Sci. 2011; 26:250–257.
- Subak LL, King WC, Belle SH, et al. Urinary incontinence before and after bariatric surgery. JAMA Intern Med 2015; 175:1378–1387.
- Shamliyan T, Wyman JF, Ramakrishnan R, Sainfort F, Kane RL. Benefits and harms of pharmacologic treatment for urinary incontinence in women: a systematic review. Ann Intern Med 2012; 156:861–874, W301–W310.
- Hay-Smith J, Herbison P, Ellis G, Morris A. Which anticholinergic drug for overactive bladder symptoms in adults. Cochrane Database Syst Rev 2005; 3:CD005429.
- Davila GW, Daugherty CA, Sanders SW; Transdermal Oxybutynin Study Group. A short term, multicenter, randomized double-blind dose titration study of the efficacy and anticholinergic side effects of transdermal compared to immediate release oral oxybutynin treatment of patients with urge urinary incontinence. J Urol 2001; 166:140–145.
- Wagg A, Compion G, Fahey A, Siddiqui E. Persistence with prescribed antimuscarinic therapy for overactive bladder: a UK experience. BJU Int 2012; 110:1767–1774.
- Benner JS, Nichol MB, Rovner ES, et al. Patient-reported reasons for discontinuing overactive bladder medication. BJU Int 2010; 105:1276–1282.
- Kay G, Crook T, Rekeda L, et al. Differential effects of the antimuscarinic agents darifenacin and oxybutynin ER on memory in older subjects. Eur Urol 2006; 50:317–326.
- Staskin D, Kay G, Tannenbaum C, et al. Trospium chloride has no effect on memory testing and is assay undetectable in the central nervous system of older patients with overactive bladder. Int J Clin Pract 2010; 64:1294–1300.
- Chapple CR, Amarenco G, Lopez A, et al; BLOSSOM Investigator Group. A proof of concept study: mirabegron, a new therapy for overactive bladder. Neurourol Urodyn 2013; 32:1116–1122.
- Nitti VB, Khullar V, van Kerrebroeck P, et al. Mirabegron for the treatment of overactive bladder: a prespecified pooled efficacy analysis and pooled safety analysis of three randomised, double-blind, placebo-controlled, phase III studies. Int J Clin Pract 2013; 67:619–632.
- Maman K, Aballea S, Nazir J, et al. Comparative efficacy and safety of medical treatments for the management of overactive bladder: a systematic literature review and mixed treatment comparison. Eur Urol 2014; 65:755–765.
- Katofiasc MA, Nissen J, Audia JE, Thor KB. Comparison of the effects of serotonin selective, norepinephrine, and dual serotonin and norepinephrine reuptake inhibitors on lower urinary tract function in cats. Life Sci 2002; 71:1227–1236.
- Mariappan P, Alhasso A, Ballantyne Z, Grant A, N’Dow J. Duloxetine, a serotonin and noradrenaline reuptake inhibitor for the treatment of stress urinary incontinence: a systematic review. Eur Urol 2007; 51:67–74.
- Portman DJ, Gass ML; Vulvovaginal Atrophy Terminology Consensus Conference Panel. Genitourinary syndrome of menopause: new terminology for vulvovaginal atrophy from the International Society for the Study of Women’s Sexual Health and the North American Menopause Society. Menopause 2014; 21:1063–1068.
- Rahn DD, Carberry C, Sanses TV, et al; Society of Gynecologic Surgeons Systematic Review Group. Vaginal estrogen for genitourinary syndrome of menopause: a systematic review. Obstet Gynecol 2014; 124:1147–1156.
- Hendrix SL, Cochrane BB, Nygaard IE, et al. Effects of estrogen with and without progestin on urinary incontinence. JAMA 2005; 293:935–948.
- Jackson S, James M, Abrams P. The effect of estradiol on vaginal collagen metabolism in postmenopausal women with genuine stress incontinence. BJOG 2002; 109:339–344.
- Lin AD, Levin R, Kogan B, et al. Estrogen induced functional hypertrophy and increased force generation of the female rabbit bladder. Neurourol Urodyn 2006; 25:473–479.
- Qaseem A, Dallas P, Forciea MA, Starkey M, Denberg TD, Shekelle P; Clinical Guidelines Committee of the American College of Physicians. Nonsurgical management of urinary incontinence in women: a clinical practice guideline from the American College of Physicians. Ann Intern Med 2014; 161:429–440.
- Nygaard I, Barber MD, Burgio KL, et al; Pelvic Floor Disorders Network. Prevalence of symptomatic pelvic floor disorders in US women. JAMA 2008; 300:1311–1316.
- Wu JM, Vaughan CP, Goode PS, et al. Prevalence and trends of symptomatic pelvic floor disorders in US women. Obstet Gynecol 2014; 123:141–148.
- Wu JM, Stinnett S, Jackson RA, Jacoby A, Learman LA, Kuppermann M. Prevalence and incidence of urinary incontinence in a diverse population of women with noncancerous gynecologic conditions. Female Pelvic Med Reconstr Surg 2010; 16:284–289.
- Griffiths AN, Makam A, Edward GJ. Should we actively screen for urinary and anal incontinence in the general gynaecology outpatients setting? A prospective observational study. J Obstet Gynaecol 2006; 26:442–444.
- Coyne KS, Wein A, Nicholson S, Kvasz M, Chen CI, Milsom I. Economic burden of urgency urinary incontinence in the United Stated: a systematic review. J Manag Care Pharm 2014; 20:130–140.
- Haylen BT, Ridder D, Freeman RM, et al; International Urogynecological Association; International Continence Society. An International Urogynecological Association (IUGA)/International Continence Society (ICS) joint report on the terminology for female pelvic floor dysfunction. Neurourol Urodyn 2010; 29:4–20.
- Wu JM, Matthews CA, Conover MM, Pate V, Jonsson Funk M. Lifetime risk of stress urinary incontinence or pelvic organ prolapse surgery. Obstet Gynecol 2014; 123:1201–1206.
- Wyman JF, Fantl JA. Bladder training in the ambulatory care management of urinary incontinence. Urol Nurs 1991; 11:11–17.
- Fantl JA, Wyman JF, McClish DK, et al. Efficacy of bladder training in older women with urinary incontinence. JAMA 1991; 265:609–613.
- Subak LL, Quesenberry CP, Posner SF, Cattolica E, Soghikian K. The effect of behavioral therapy on urinary incontinence: a randomized controlled trial. Obstet Gynecol 2002; 100:72–78.
- Kegel AH. Progressive resistance exercise in the functional restoration of the perineal muscles. Am J Obstet Gynecol 1948; 56:238–248.
- Domoulin C, Hay-Smith EJ, Mac Habée-Séguin G. Pelvic floor muscle training versus no treatment, or inactive control treatments, for urinary incontinence in women. Cochrane Database Syst Rev 2014; 5:CD005654.
- Hay-Smith EJ, Herderschee R, Dumoulin C, Herbison GP. Comparisons of approaches to pelvic floor muscle training for urinary incontinence in women. Cochrane Database Syst Rev 2011; 12:CD009508.
- Bo K. Pelvic floor muscle strength and response to pelvic floor muscle training for stress urinary incontinence. Neurourol Urodyn 2003; 22:654–658.
- Herderschee R, Hay-Smith EJ, Herbison GP, Roovers JP, Heineman MJ. Feedback or biofeedback to augment pelvic floor muscle training for urinary incontinence in women. Cochrane Database Syst Rev 2011; 7:CD009252.
- Terlikowski R, Dobrzycka B, Kinalski M, Kuryliszyn-Moskal A, Terlikowski SJ. Transvaginal electrical stimulation with surface-EMG biofeedback in managing stress urinary incontinence in women of premenopausal age: a double-blind, placebo-controlled, randomized clinical trial. Int Urogynecol J 2013; 17:1631–1638.
- Guralnick ML, Kelly H, Engelke H, Koduri S, O’Connor RC. InTone: a novel pelvic floor rehabilitation device for urinary incontinence. Int Urogynecol J 2015; 26:99–106.
- Lipp A, Shaw C, Glavind K. Mechanical devices for urinary incontinence in women. Cochrane Database Syst Rev 2014; 12:CD001756.
- Richter HE, Burgio KL, Brubaker L, et al; Pelvic Floor Disorders Network. Continence pessary compared with behavioral therapy or combined therapy for stress incontinence: a randomized controlled trial. Obstet Gynecol 2010; 115:609–617.
- National Institute of Diabetes and Digestive and Kidney Diseases (NIDDK). Overweight and obesity statistics. www.niddk.nih.gov/health-information/health-statistics/Pages/overweight-obesity-statistics.aspx. Accessed January 6, 2017.
- Mishra GD, Hardy R, Cardozo L, Kuh D. Body weight through adult life and risk of urinary incontinence in middle-aged women. Results from a British prospective cohort. Int J Obes (Lond) 2008; 32:1415–1422.
- Danforth KN, Townsend MK, Lifford K, Curhan GC, Resnick NM, Grodstein F. Risk factors for urinary incontinence among middle age women. Am J Obstet Gynecol 2006; 194:339–345.
- Waetjen LE, Liao S, Johnson WO, et al. Factors associated with prevalence and incident urinary incontinence in a cohort of midlife women: a longitudinal analysis of data: study of women’s health across the nation. Am J Epidemiol 2007; 165:309–318.
- Dallosso HM, McGrother CW, Matthews RJ, Donaldson MM; Leicestershire MRC Incontinence Study Group. The association of diet and other lifestyle factors with overactive bladder and stress incontinence: a longitudinal study in women. BJU Int 2003; 92:69–77.
- Kim IH, Chung H, Kwon JW. Gender differences in the effect of obesity on chronic diseases among the elderly Koreans. J Korean Med Sci. 2011; 26:250–257.
- Subak LL, King WC, Belle SH, et al. Urinary incontinence before and after bariatric surgery. JAMA Intern Med 2015; 175:1378–1387.
- Shamliyan T, Wyman JF, Ramakrishnan R, Sainfort F, Kane RL. Benefits and harms of pharmacologic treatment for urinary incontinence in women: a systematic review. Ann Intern Med 2012; 156:861–874, W301–W310.
- Hay-Smith J, Herbison P, Ellis G, Morris A. Which anticholinergic drug for overactive bladder symptoms in adults. Cochrane Database Syst Rev 2005; 3:CD005429.
- Davila GW, Daugherty CA, Sanders SW; Transdermal Oxybutynin Study Group. A short term, multicenter, randomized double-blind dose titration study of the efficacy and anticholinergic side effects of transdermal compared to immediate release oral oxybutynin treatment of patients with urge urinary incontinence. J Urol 2001; 166:140–145.
- Wagg A, Compion G, Fahey A, Siddiqui E. Persistence with prescribed antimuscarinic therapy for overactive bladder: a UK experience. BJU Int 2012; 110:1767–1774.
- Benner JS, Nichol MB, Rovner ES, et al. Patient-reported reasons for discontinuing overactive bladder medication. BJU Int 2010; 105:1276–1282.
- Kay G, Crook T, Rekeda L, et al. Differential effects of the antimuscarinic agents darifenacin and oxybutynin ER on memory in older subjects. Eur Urol 2006; 50:317–326.
- Staskin D, Kay G, Tannenbaum C, et al. Trospium chloride has no effect on memory testing and is assay undetectable in the central nervous system of older patients with overactive bladder. Int J Clin Pract 2010; 64:1294–1300.
- Chapple CR, Amarenco G, Lopez A, et al; BLOSSOM Investigator Group. A proof of concept study: mirabegron, a new therapy for overactive bladder. Neurourol Urodyn 2013; 32:1116–1122.
- Nitti VB, Khullar V, van Kerrebroeck P, et al. Mirabegron for the treatment of overactive bladder: a prespecified pooled efficacy analysis and pooled safety analysis of three randomised, double-blind, placebo-controlled, phase III studies. Int J Clin Pract 2013; 67:619–632.
- Maman K, Aballea S, Nazir J, et al. Comparative efficacy and safety of medical treatments for the management of overactive bladder: a systematic literature review and mixed treatment comparison. Eur Urol 2014; 65:755–765.
- Katofiasc MA, Nissen J, Audia JE, Thor KB. Comparison of the effects of serotonin selective, norepinephrine, and dual serotonin and norepinephrine reuptake inhibitors on lower urinary tract function in cats. Life Sci 2002; 71:1227–1236.
- Mariappan P, Alhasso A, Ballantyne Z, Grant A, N’Dow J. Duloxetine, a serotonin and noradrenaline reuptake inhibitor for the treatment of stress urinary incontinence: a systematic review. Eur Urol 2007; 51:67–74.
- Portman DJ, Gass ML; Vulvovaginal Atrophy Terminology Consensus Conference Panel. Genitourinary syndrome of menopause: new terminology for vulvovaginal atrophy from the International Society for the Study of Women’s Sexual Health and the North American Menopause Society. Menopause 2014; 21:1063–1068.
- Rahn DD, Carberry C, Sanses TV, et al; Society of Gynecologic Surgeons Systematic Review Group. Vaginal estrogen for genitourinary syndrome of menopause: a systematic review. Obstet Gynecol 2014; 124:1147–1156.
- Hendrix SL, Cochrane BB, Nygaard IE, et al. Effects of estrogen with and without progestin on urinary incontinence. JAMA 2005; 293:935–948.
- Jackson S, James M, Abrams P. The effect of estradiol on vaginal collagen metabolism in postmenopausal women with genuine stress incontinence. BJOG 2002; 109:339–344.
- Lin AD, Levin R, Kogan B, et al. Estrogen induced functional hypertrophy and increased force generation of the female rabbit bladder. Neurourol Urodyn 2006; 25:473–479.
KEY POINTS
- The 3 types of urinary incontinence are stress, urgency, and mixed.
- The American College of Physicians (ACP) recommends weight loss and exercise for obese women with any of the 3 types of urinary incontinence.
- Pelvic floor muscle training has a strong ACP recommendation for stress incontinence, bladder training has a weak recommendation for urgency incontinence, and the combination of both has a strong recommendation in mixed incontinence.
- Drug treatment has a strong ACP recommendation for urgency incontinence if bladder training is unsuccessful, whereas the recommendation is against drug treatment for stress incontinence.
Opioid therapy and sleep apnea
To the Editor: I enjoyed Dr. Galicia-Castillo’s article about long-term opioid therapy in older adults,1 which reaffirmed the imperative to “start low and go slow” to minimize the risk of addiction. However, the article missed an opportunity to raise awareness regarding another extremely important side effect of chronic prescription opioid consumption, that of ingestion prior to sleep, with consequent cessation of breathing leading to death.
According to the Drug Enforcement Administration,2 most narcotic deaths are a result of respiratory depression. And the American Pain Society has stated, “No patient has succumbed to [opioid] respiratory depression while awake.”3
Dr. Galicia-Castillo noted that the prevalence of central sleep apnea in chronic opioid users is 24%, based on a review by Correa et al.4 As alarming as this number is, other investigators have estimated it to be even higher—as high as 50% to 90%.5
Walker et al,6 in a study of 60 patients, found that the higher the opioid dose the patients were on, the more episodes of obstructive sleep apnea and central sleep apnea per hour they had. Yet prescribing a low dose does not adequately protect the chronic opioid user. Farney et al7 reported that oxygen saturation dropped precipitously—from 98% to 70%—15 minutes after a patient took just 7.5 mg of hydrocodone in the middle of the night. Mogri et al8 reported that a patient had 91 apnea events within 1 hour of taking 15 mg of oxycodone at 2 am.
Opioids, benzodiazepines, barbiturates, and ethanol individually and additively suppress medullary reflex ventilatory drive during sleep, especially during non–rapid-eye-movement (non-REM) sleep.6 During waking hours, in contrast, there is redundant backup of cerebral cortical drive, ensuring that we keep breathing. Therefore, people are most vulnerable to dying of opioid ingestion during sleep.
Moreover, oxygen desaturation during episodes of sleep apnea may precipitate seizures (which may be lethal) or coronary vasospasm with consequent malignant arrhythmias and myocardial ischemia.
Continuous positive airway pressure protects against obstructive sleep apnea, but not against central sleep apnea.9
Patients need to be aware of the danger, and physicians need to consider the pharmacokinetic profiles of the opioid preparations they prescribe. If patients are taking an opioid that has a short half-life, such as immediate-release oxycodone, they should not take it within 5 hours of sleep. Longer-lasting preparations need a longer interval, and some, such as extended-release tramadol, may need to be taken only on awakening.
Safe sleep can be facilitated by medications that are sedating but do not compromise ventilation. Optimal agents also enhance restorative REM and stage III and IV deep-sleep duration, and some may have the additional benefit of reducing the risk of cancer.10,11 Such agents may include baclofen, cyproheptadine, gabapentin, mirtazepine, and melatonin. Nonpharmacologic measures include sleep hygiene, aerobic exercise, and cognitive behavioral therapy.
A retrospective study12 found that 301 (60.4%) of 498 patients who died while on opioid therapy and whose death was judged to be related to the opioid were also taking benzodiazepines. Patients who take opioids should avoid taking benzodiazepines, barbiturates, or alcohol before going to sleep, and physicians should be extremely cautious about prescribing benzodiazepines and barbiturates to patients who are on opioids.
- Galicia-Castillo M. Opioids for persistent pain in older adults. Cleve Clin J Med 2016; 83:443–451.
- Drug Enforcement Administration. Drugs of Abuse. 2005 Edition. Washington, DC: US Government Printing Office, 2005:19.
- American Pain Society, Principles of Analgesic Use in the Treatment of Acute Pain and Cancer Pain, 4th ed. Glenview, IL: American Pain Society, 1999:30.
- Correa D, Farney RJ, Chung F, Prasad A, Lam D, Wong J. Chronic opioid use and central sleep apnea: a review of the prevalence, mechanisms, and perioperative considerations. Anesth Analg 2015; 120:1273–1285.
- Panagiotou I, Mystakidou K. Non-analgesic effects of opioids: opioids’ effects on sleep (including sleep apnea). Curr Pharm Des 2012; 18:6025–6033.
- Walker JM, Farney RJ, Rhondeau SM, et al. Chronic opioid use is a risk factor for the development of central sleep apnea and ataxic breathing. J Clin Sleep Med 2007; 3:455–461. Erratum in J Clin Sleep Med 2007; 3:table of contents.
- Farney RJ, Walker JM, Cloward TV, Rhondeau S. Sleep-disordered breathing associated with long-term opioid therapy. Chest 2003; 123:632–639.
- Mogri M, Khan MI, Grant BJ, Mador MJ. Central sleep apnea induced by acute ingestion of opioids. Chest 2008; 133:1484–1488.
- Guilleminault C, Cao M, Yue HJ, Chawla P. Obstructive sleep apnea and chronic opioid use. Lung 2010; 188:459–468.
- Kao CH, Sun LM, Liang JA, Chang SN, Sung FC, Muo CH. Relationship of zolpidem and cancer risk: a Taiwanese population-based cohort study. Mayo Clin Proc 2012; 87:430–436.
- Kripke DF. Hypnotic drug risks of mortality, infection, depression, and cancer: but lack of benefit. F1000Res 2016; 5:918.
- Gomes T, Mamdani MM, Dhalla IA, Paterson JM, Juurlink DN. Opioid dose and drug-related mortality in patients with nonmalignant pain. Arch Intern Med 2011; 171:686–691.
To the Editor: I enjoyed Dr. Galicia-Castillo’s article about long-term opioid therapy in older adults,1 which reaffirmed the imperative to “start low and go slow” to minimize the risk of addiction. However, the article missed an opportunity to raise awareness regarding another extremely important side effect of chronic prescription opioid consumption, that of ingestion prior to sleep, with consequent cessation of breathing leading to death.
According to the Drug Enforcement Administration,2 most narcotic deaths are a result of respiratory depression. And the American Pain Society has stated, “No patient has succumbed to [opioid] respiratory depression while awake.”3
Dr. Galicia-Castillo noted that the prevalence of central sleep apnea in chronic opioid users is 24%, based on a review by Correa et al.4 As alarming as this number is, other investigators have estimated it to be even higher—as high as 50% to 90%.5
Walker et al,6 in a study of 60 patients, found that the higher the opioid dose the patients were on, the more episodes of obstructive sleep apnea and central sleep apnea per hour they had. Yet prescribing a low dose does not adequately protect the chronic opioid user. Farney et al7 reported that oxygen saturation dropped precipitously—from 98% to 70%—15 minutes after a patient took just 7.5 mg of hydrocodone in the middle of the night. Mogri et al8 reported that a patient had 91 apnea events within 1 hour of taking 15 mg of oxycodone at 2 am.
Opioids, benzodiazepines, barbiturates, and ethanol individually and additively suppress medullary reflex ventilatory drive during sleep, especially during non–rapid-eye-movement (non-REM) sleep.6 During waking hours, in contrast, there is redundant backup of cerebral cortical drive, ensuring that we keep breathing. Therefore, people are most vulnerable to dying of opioid ingestion during sleep.
Moreover, oxygen desaturation during episodes of sleep apnea may precipitate seizures (which may be lethal) or coronary vasospasm with consequent malignant arrhythmias and myocardial ischemia.
Continuous positive airway pressure protects against obstructive sleep apnea, but not against central sleep apnea.9
Patients need to be aware of the danger, and physicians need to consider the pharmacokinetic profiles of the opioid preparations they prescribe. If patients are taking an opioid that has a short half-life, such as immediate-release oxycodone, they should not take it within 5 hours of sleep. Longer-lasting preparations need a longer interval, and some, such as extended-release tramadol, may need to be taken only on awakening.
Safe sleep can be facilitated by medications that are sedating but do not compromise ventilation. Optimal agents also enhance restorative REM and stage III and IV deep-sleep duration, and some may have the additional benefit of reducing the risk of cancer.10,11 Such agents may include baclofen, cyproheptadine, gabapentin, mirtazepine, and melatonin. Nonpharmacologic measures include sleep hygiene, aerobic exercise, and cognitive behavioral therapy.
A retrospective study12 found that 301 (60.4%) of 498 patients who died while on opioid therapy and whose death was judged to be related to the opioid were also taking benzodiazepines. Patients who take opioids should avoid taking benzodiazepines, barbiturates, or alcohol before going to sleep, and physicians should be extremely cautious about prescribing benzodiazepines and barbiturates to patients who are on opioids.
To the Editor: I enjoyed Dr. Galicia-Castillo’s article about long-term opioid therapy in older adults,1 which reaffirmed the imperative to “start low and go slow” to minimize the risk of addiction. However, the article missed an opportunity to raise awareness regarding another extremely important side effect of chronic prescription opioid consumption, that of ingestion prior to sleep, with consequent cessation of breathing leading to death.
According to the Drug Enforcement Administration,2 most narcotic deaths are a result of respiratory depression. And the American Pain Society has stated, “No patient has succumbed to [opioid] respiratory depression while awake.”3
Dr. Galicia-Castillo noted that the prevalence of central sleep apnea in chronic opioid users is 24%, based on a review by Correa et al.4 As alarming as this number is, other investigators have estimated it to be even higher—as high as 50% to 90%.5
Walker et al,6 in a study of 60 patients, found that the higher the opioid dose the patients were on, the more episodes of obstructive sleep apnea and central sleep apnea per hour they had. Yet prescribing a low dose does not adequately protect the chronic opioid user. Farney et al7 reported that oxygen saturation dropped precipitously—from 98% to 70%—15 minutes after a patient took just 7.5 mg of hydrocodone in the middle of the night. Mogri et al8 reported that a patient had 91 apnea events within 1 hour of taking 15 mg of oxycodone at 2 am.
Opioids, benzodiazepines, barbiturates, and ethanol individually and additively suppress medullary reflex ventilatory drive during sleep, especially during non–rapid-eye-movement (non-REM) sleep.6 During waking hours, in contrast, there is redundant backup of cerebral cortical drive, ensuring that we keep breathing. Therefore, people are most vulnerable to dying of opioid ingestion during sleep.
Moreover, oxygen desaturation during episodes of sleep apnea may precipitate seizures (which may be lethal) or coronary vasospasm with consequent malignant arrhythmias and myocardial ischemia.
Continuous positive airway pressure protects against obstructive sleep apnea, but not against central sleep apnea.9
Patients need to be aware of the danger, and physicians need to consider the pharmacokinetic profiles of the opioid preparations they prescribe. If patients are taking an opioid that has a short half-life, such as immediate-release oxycodone, they should not take it within 5 hours of sleep. Longer-lasting preparations need a longer interval, and some, such as extended-release tramadol, may need to be taken only on awakening.
Safe sleep can be facilitated by medications that are sedating but do not compromise ventilation. Optimal agents also enhance restorative REM and stage III and IV deep-sleep duration, and some may have the additional benefit of reducing the risk of cancer.10,11 Such agents may include baclofen, cyproheptadine, gabapentin, mirtazepine, and melatonin. Nonpharmacologic measures include sleep hygiene, aerobic exercise, and cognitive behavioral therapy.
A retrospective study12 found that 301 (60.4%) of 498 patients who died while on opioid therapy and whose death was judged to be related to the opioid were also taking benzodiazepines. Patients who take opioids should avoid taking benzodiazepines, barbiturates, or alcohol before going to sleep, and physicians should be extremely cautious about prescribing benzodiazepines and barbiturates to patients who are on opioids.
- Galicia-Castillo M. Opioids for persistent pain in older adults. Cleve Clin J Med 2016; 83:443–451.
- Drug Enforcement Administration. Drugs of Abuse. 2005 Edition. Washington, DC: US Government Printing Office, 2005:19.
- American Pain Society, Principles of Analgesic Use in the Treatment of Acute Pain and Cancer Pain, 4th ed. Glenview, IL: American Pain Society, 1999:30.
- Correa D, Farney RJ, Chung F, Prasad A, Lam D, Wong J. Chronic opioid use and central sleep apnea: a review of the prevalence, mechanisms, and perioperative considerations. Anesth Analg 2015; 120:1273–1285.
- Panagiotou I, Mystakidou K. Non-analgesic effects of opioids: opioids’ effects on sleep (including sleep apnea). Curr Pharm Des 2012; 18:6025–6033.
- Walker JM, Farney RJ, Rhondeau SM, et al. Chronic opioid use is a risk factor for the development of central sleep apnea and ataxic breathing. J Clin Sleep Med 2007; 3:455–461. Erratum in J Clin Sleep Med 2007; 3:table of contents.
- Farney RJ, Walker JM, Cloward TV, Rhondeau S. Sleep-disordered breathing associated with long-term opioid therapy. Chest 2003; 123:632–639.
- Mogri M, Khan MI, Grant BJ, Mador MJ. Central sleep apnea induced by acute ingestion of opioids. Chest 2008; 133:1484–1488.
- Guilleminault C, Cao M, Yue HJ, Chawla P. Obstructive sleep apnea and chronic opioid use. Lung 2010; 188:459–468.
- Kao CH, Sun LM, Liang JA, Chang SN, Sung FC, Muo CH. Relationship of zolpidem and cancer risk: a Taiwanese population-based cohort study. Mayo Clin Proc 2012; 87:430–436.
- Kripke DF. Hypnotic drug risks of mortality, infection, depression, and cancer: but lack of benefit. F1000Res 2016; 5:918.
- Gomes T, Mamdani MM, Dhalla IA, Paterson JM, Juurlink DN. Opioid dose and drug-related mortality in patients with nonmalignant pain. Arch Intern Med 2011; 171:686–691.
- Galicia-Castillo M. Opioids for persistent pain in older adults. Cleve Clin J Med 2016; 83:443–451.
- Drug Enforcement Administration. Drugs of Abuse. 2005 Edition. Washington, DC: US Government Printing Office, 2005:19.
- American Pain Society, Principles of Analgesic Use in the Treatment of Acute Pain and Cancer Pain, 4th ed. Glenview, IL: American Pain Society, 1999:30.
- Correa D, Farney RJ, Chung F, Prasad A, Lam D, Wong J. Chronic opioid use and central sleep apnea: a review of the prevalence, mechanisms, and perioperative considerations. Anesth Analg 2015; 120:1273–1285.
- Panagiotou I, Mystakidou K. Non-analgesic effects of opioids: opioids’ effects on sleep (including sleep apnea). Curr Pharm Des 2012; 18:6025–6033.
- Walker JM, Farney RJ, Rhondeau SM, et al. Chronic opioid use is a risk factor for the development of central sleep apnea and ataxic breathing. J Clin Sleep Med 2007; 3:455–461. Erratum in J Clin Sleep Med 2007; 3:table of contents.
- Farney RJ, Walker JM, Cloward TV, Rhondeau S. Sleep-disordered breathing associated with long-term opioid therapy. Chest 2003; 123:632–639.
- Mogri M, Khan MI, Grant BJ, Mador MJ. Central sleep apnea induced by acute ingestion of opioids. Chest 2008; 133:1484–1488.
- Guilleminault C, Cao M, Yue HJ, Chawla P. Obstructive sleep apnea and chronic opioid use. Lung 2010; 188:459–468.
- Kao CH, Sun LM, Liang JA, Chang SN, Sung FC, Muo CH. Relationship of zolpidem and cancer risk: a Taiwanese population-based cohort study. Mayo Clin Proc 2012; 87:430–436.
- Kripke DF. Hypnotic drug risks of mortality, infection, depression, and cancer: but lack of benefit. F1000Res 2016; 5:918.
- Gomes T, Mamdani MM, Dhalla IA, Paterson JM, Juurlink DN. Opioid dose and drug-related mortality in patients with nonmalignant pain. Arch Intern Med 2011; 171:686–691.