User login
Characterizing Opioid Response in Older Veterans in the Post-Acute Setting
Older adults admitted to post-acute settings frequently have complex rehabilitation needs and multimorbidity, which predisposes them to pain management challenges.1,2 The prevalence of pain in post-acute and long-term care is as high as 65%, and opioid use is common among this population with 1 in 7 residents receiving long-term opioids.3,4
Opioids that do not adequately control pain represent a missed opportunity for deprescribing. There is limited evidence regarding efficacy of long-term opioid use (> 90 days) for improving pain and physical functioning.5 In addition, long-term opioid use carries significant risks, including overdose-related death, dependence, and increased emergency department visits.5 These risks are likely to be pronounced among veterans receiving post-acute care (PAC) who are older, have comorbid psychiatric disorders, are prescribed several centrally acting medications, and experience substance use disorder (SUD).6
Older adults are at increased risk for opioid toxicity because of reduced drug clearance and smaller therapeutic window.5 Centers for Disease Control and Prevention (CDC) guidelines recommend frequently assessing patients for benefit in terms of sustained improvement in pain as well as physical function.5 If pain and functional improvements are minimal, opioid use and nonopioid pain management strategies should be considered. Some patients will struggle with this approach. Directly asking patients about the effectiveness of opioids is challenging. Opioid users with chronic pain frequently report problems with opioids even as they describe them as indispensable for pain management.7,8
Earlier studies have assessed patient perspectives regarding opioid difficulties as well as their helpfulness, which could introduce recall bias. Patient-level factors that contribute to a global sense of distress, in addition to the presence of painful physical conditions, also could contribute to patients requesting opioids without experiencing adequate pain relief. One study in veterans residing in PAC facilities found that individuals with depression, posttraumatic stress disorder (PTSD), and SUD were more likely to report pain and receive scheduled analgesics; this effect persisted in individuals with PTSD even after adjusting for demographic and functional status variables.9 The study looked only at analgesics as a class and did not examine opioids specifically. It is possible that distressed individuals, such as those with uncontrolled depression, PTSD, and SUD, might be more likely to report high pain levels and receive opioids with inadequate benefit and increased risk. Identifying the primary condition causing distress and targeting treatment to that condition (ie, depression) is preferable to escalating opioids in an attempt to treat pain in the context of nonresponse. Assessing an individual’s aggregate response to opioids rather than relying on a single self-report is a useful addition to current pain management strategies.
The goal of this study was to pilot a method of identifying opioid-nonresponsive pain using administrative data, measure its prevalence in a PAC population of veterans, and explore clinical and demographic correlates with particular attention to variates that could indicate high levels of psychological and physical distress. Identifying pain that is poorly responsive to opioids would give clinicians the opportunity to avoid or minimize opioid use and prioritize treatments that are likely to improve the resident’s pain, quality of life, and physical function while minimizing recall bias. We hypothesized that pain that responds poorly to opioids would be prevalent among veterans residing in a PAC unit. We considered that veterans with pain poorly responsive to opioids would be more likely to have factors that would place them at increased risk of adverse effects, such as comorbid psychiatric conditions, history of SUD, and multimorbidity, providing further rationale for clinical equipoise in that population.6
Methods
This was a small, retrospective cross-sectional study using administrative data and chart review. The study included veterans who were administered opioids while residing in a single US Department of Veterans Affairs (VA) community living center PAC (CLC-PAC) unit during at least 1 of 4 nonconsecutive, random days in 2016 and 2017. The study was approved by the institutional review board of the Ann Arbor VA Health System (#2017-1034) as part of a larger project involving models of care in vulnerable older veterans.
Inclusion criteria were the presence of at least moderate pain (≥ 4 on a 0 to 10 scale); receiving ≥ 2 opioids ordered as needed over the prespecified 24-hour observation period; and having ≥ 2 pre-and postopioid administration pain scores during the observation period. Veterans who did not meet these criteria were excluded. At the time of initial sample selection, we did not capture information related to coprescribed analgesics, including a standing order of opioids. To obtain the sample, we initially characterized all veterans on the 4 days residing in the CLC-PAC unit as those reporting at least moderate pain (≥ 4) and those who reported no or mild pain (< 4). The cut point of 4 of 10 is consistent with moderate pain based on earlier work showing higher likelihood of pain that interferes with physical function.10 We then restricted the sample to veterans who received ≥ 2 opioids ordered as needed for pain and had ≥ 2 pre- and postopioid administration numeric pain rating scores during the 24-hour observation period. This methodology was chosen to enrich our sample for those who received opioids regularly for ongoing pain. Opioids were defined as full µ-opioid receptor agonists and included hydrocodone, oxycodone, morphine, hydromorphone, fentanyl, tramadol, and methadone.
Medication administration data were obtained from the VA corporate data warehouse, which houses all barcode medication administration data collected at the point of care. The dataset includes pain scores gathered by nursing staff before and after administering an as-needed analgesic. The corporate data warehouse records data/time of pain scores and the analgesic name, dosage, formulation, and date/time of administration. Using a standardized assessment form developed iteratively, we calculated opioid dosage in oral morphine equivalents (OME) for comparison.11,12 All abstracted data were reexamined for accuracy. Data initially were collected in an anonymized, blinded fashion. Participants were then unblinded for chart review. Initial data was captured in resident-days instead of unique residents because an individual resident might have been admitted on several observation days. We were primarily interested in how pain responded to opioids administered in response to resident request; therefore, we did not examine response to opioids that were continuously ordered (ie, scheduled). We did consider scheduled opioids when calculating total daily opioid dosage during the chart review.
Outcome of Interest
The primary outcome of interest was an individual’s response to as-needed opioids, which we defined as change in the pain score after opioid administration. The pre-opioid pain score was the score that immediately preceded administration of an as-needed opioid. The postopioid administration pain score was the first score after opioid administration if obtained within 3 hours of administration. Scores collected > 3 hours after opioid administration were excluded because they no longer accurately reflected the impact of the opioid due to the short half-lives. Observations were excluded if an opioid was administered without a recorded pain score; this occurred once for 6 individuals. Observations also were excluded if an opioid was administered but the data were captured on the following day (outside of the 24-hour window); this occurred once for 3 individuals.
We calculated a ∆ score by subtracting the postopioid pain rating score from the pre-opioid score. Individual ∆ scores were then averaged over the 24-hour period (range, 2-5 opioid doses). For example, if an individual reported a pre-opioid pain score of 10, and a postopioid pain score of 2, the ∆ was recorded as 8. If the individual’s next pre-opioid score was 10, and post-opioid score was 6, the ∆ was recorded as 4. ∆ scores over the 24-hour period were averaged together to determine that individual’s response to as-needed opioids. In the previous example, the mean ∆ score is 6. Lower mean ∆ scores reflect decreased responsiveness to opioids’ analgesic effect.
Demographic and clinical data were obtained from electronic health record review using a standardized assessment form. These data included information about medical and psychiatric comorbidities, specialist consultations, and CLC-PAC unit admission indications and diagnoses. Medications of interest were categorized as antidepressants, antipsychotics, benzodiazepines, muscle relaxants, hypnotics, stimulants, antiepileptic drugs/mood stabilizers (including gabapentin and pregabalin), and all adjuvant analgesics. Adjuvant analgesics were defined as medications administered for pain as documented by chart notes or those ordered as needed for pain, and analyzed as a composite variable. Antidepressants with analgesic properties (serotonin-norepinephrine reuptake inhibitors and tricyclic antidepressants) were considered adjuvant analgesics. Psychiatric information collected included presence of mood, anxiety, and psychotic disorders, and PTSD. SUD information was collected separately from other psychiatric disorders.
Analyses
The study population was described using tabulations for categorical data and means and standard deviations for continuous data. Responsiveness to opioids was analyzed as a continuous variable. Those with higher mean ∆ scores were considered to have pain relatively more responsive to opioids, while lower mean ∆ scores indicated pain less responsive to opioids. We constructed linear regression models controlling for average pre-opioid pain rating scores to explore associations between opioid responsiveness and variables of interest. All analyses were completed using Stata version 15. This study was not adequately powered to detect differences across the spectrum of opioid responsiveness, although the authors have reported differences in this article.
Results
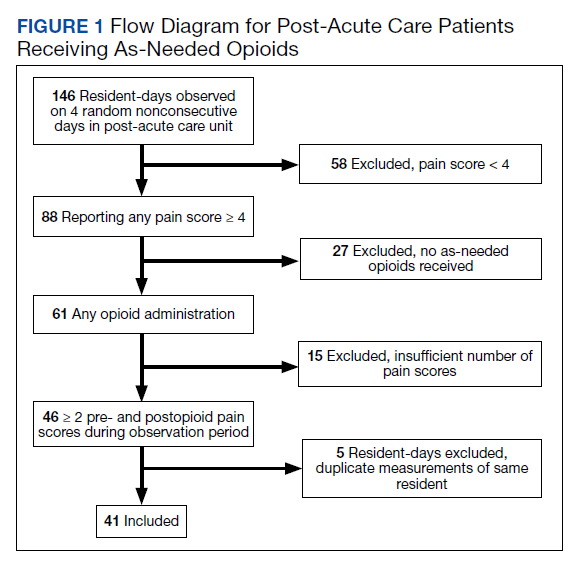
Over the 4-day observational period there were 146 resident-days. Of these, 88 (60.3%) reported at least 1 pain score of ≥ 4. Of those, 61 (41.8%) received ≥ 1 as-needed opioid for pain. We identified 46 resident-days meeting study criteria of ≥ 2 pre- and postanalgesic scores. We identified 41 unique individuals (Figure 1). Two individuals were admitted to the CLC-PAC unit on 2 of the 4 observation days, and 1 individual was admitted to the CLC-PAC unit on 3 of the 4 observation days. For individuals admitted several days, we included data only from the initial observation day.
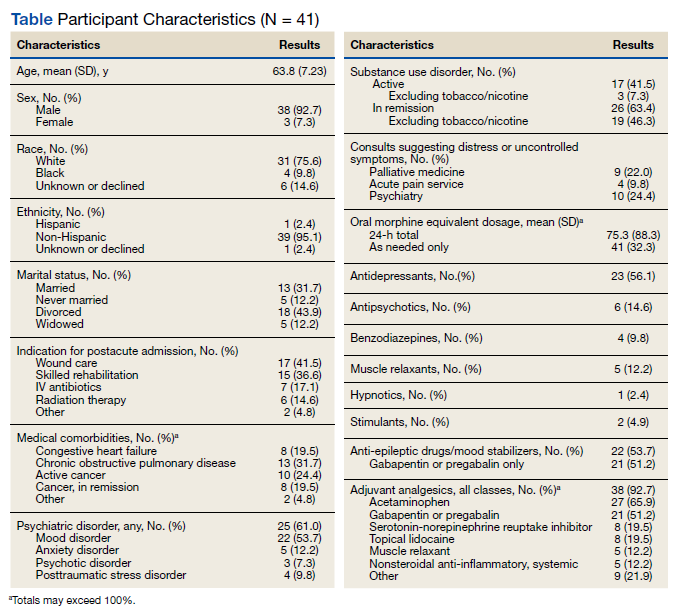
Response to opioids varied greatly in this sample. The mean (SD) ∆ pain score was 3.4 (1.6) and ranged from 0.5 to 6.3. Using linear regression, we found no relationship between admission indication, medical comorbidities (including active cancer), and opioid responsiveness (Table).
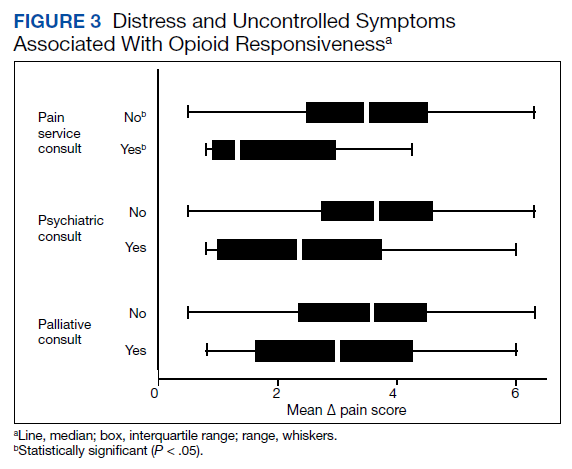
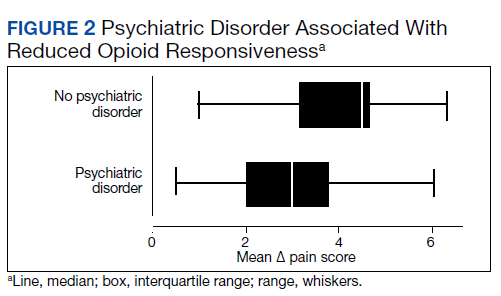
Psychiatric disorders were highly prevalent, with 25 individuals (61.0%) having ≥ 1 any psychiatric diagnosis identified on chart review. The presence of any psychiatric diagnosis was significantly associated with reduced responsiveness to opioids (β = −1.08; 95% CI, −2.04 to −0.13; P = .03). SUDs also were common, with 17 individuals (41.5%) having an active SUD; most were tobacco/nicotine. Twenty-six veterans (63.4%) had documentation of SUD in remission with 19 (46.3%) for substances other than tobacco/nicotine. There was no indication that any veteran in the sample was prescribed medication for opioid use disorder (OUD) at the time of observation. There was no relationship between opioid responsiveness and SUDs, neither active or in remission. Consults to other services that suggested distress or difficult-to-control symptoms also were frequent. Consults to the pain service were significantly associated with reduced responsiveness to opioids (β = −1.75; 95% CI, −3.33 to −0.17; P = .03). Association between psychiatry consultation and reduced opioid responsiveness trended toward significance (β = −0.95; 95% CI, −2.06 to 0.17; P = .09) (Figures 2 and 3). There was no significant association with palliative medicine consultation and opioid responsiveness.
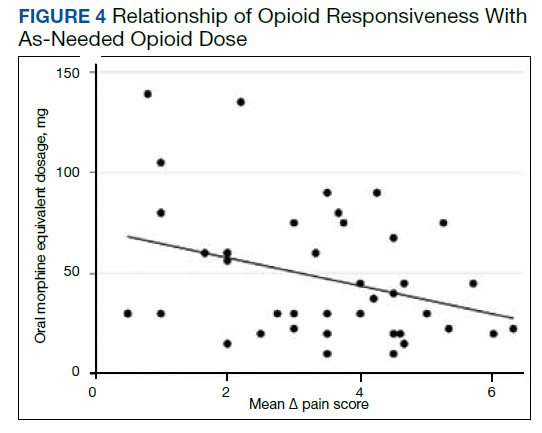
A poorer response to opioids was associated with a significantly higher as-needed opioid dosage (β = −0.02; 95% CI, −0.04 to −0.01; P = .002) as well as a trend toward higher total opioid dosage (β = −0.005; 95% CI, −0.01 to 0.0003; P = .06) (Figure 4). Thirty-eight (92.7%) participants received nonopioid adjuvant analgesics for pain. More than half (56.1%) received antidepressants or gabapentinoids (51.2%), although we did not assess whether they were prescribed for pain or another indication. We did not identify a relationship between any specific psychoactive drug class and opioid responsiveness in this sample.
Discussion
This exploratory study used readily available administrative data in a CLC-PAC unit to assess responsiveness to opioids via a numeric mean ∆ score, with higher values indicating more pain relief in response to opioids. We then constructed linear regression models to characterize the relationship between the mean ∆ score and factors known to be associated with difficult-to-control pain and psychosocial distress. As expected, opioid responsiveness was highly variable among residents; some residents experienced essentially no reduction in pain, on average, despite receiving opioids. Psychiatric comorbidity, higher dosage in OMEs, and the presence of a pain service consult significantly correlated with poorer response to opioids. To our knowledge, this is the first study to quantify opioid responsiveness and describe the relationship with clinical correlates in the understudied PAC population.
Earlier research has demonstrated a relationship between the presence of psychiatric disorders and increased likelihood of receiving any analgesics among veterans residing in PAC.9 Our study adds to the literature by quantifying opioid response using readily available administrative data and examining associations with psychiatric diagnoses. These findings highlight the possibility that attempting to treat high levels of pain by escalating the opioid dosage in patients with a comorbid psychiatric diagnosis should be re-addressed, particularly if there is no meaningful pain reduction at lower opioid dosages. Our sample had a variety of admission diagnoses and medical comorbidities, however, we did not identify a relationship with opioid responsiveness, including an active cancer diagnosis. Although SUDs were highly prevalent in our sample, there was no relationship with opioid responsiveness. This suggests that lack of response to opioids is not merely a matter of drug tolerance or an indication of drug-seeking behavior.
Factors Impacting Response
Many factors could affect whether an individual obtains an adequate analgesic response to opioids or other pain medications, including variations in genes encoding opioid receptors and hepatic enzymes involved in drug metabolism and an individual’s opioid exposure history.13 The phenomenon of requiring more drug to produce the same relief after repeated exposures (ie, tolerance) is well known.14 Opioid-induced hyperalgesia is a phenomenon whereby a patient’s overall pain increases while receiving opioids, but each opioid dose might be perceived as beneficial.15 Increasingly, psychosocial distress is an important factor in opioid response. Adverse selection is the process culminating in those with psychosocial distress and/or SUDs being prescribed more opioids for longer durations.16 Our data suggests that this process could play a role in PAC settings. In addition, exaggerating pain to obtain additional opioids for nonmedical purposes, such as euphoria or relaxation, also is possible.17
When clinically assessing an individual whose pain is not well controlled despite escalating opioid dosages, prescribers must consider which of these factors likely is predominant. However, the first step of determining who has a poor opioid response is not straightforward. Directly asking patients is challenging; many individuals perceive opioids to be helpful while simultaneously reporting inadequately controlled pain.7,8 The primary value of this study is the possibility of providing prescribers a quick, simple method of assessing a patient’s response to opioids. Using this method, individuals who are responding poorly to opioids, including those who might exaggerate pain for secondary gain, could be identified. Health care professionals could consider revisiting pain management strategies, assess for the presence of OUD, or evaluate other contributors to inadequately controlled pain. Although we only collected data regarding response to opioids in this study, any pain medication administered as needed (ie, nonsteroidal anti-inflammatory drugs, acetaminophen) could be analyzed using this methodology, allowing identification of other helpful pain management strategies. We began the validation process with extensive chart review, but further validation is required before this method can be applied to routine clinical practice.
Patients who report uncontrolled pain despite receiving opioids are a clinically challenging population. The traditional strategy has been to escalate opioids, which is recommended by the World Health Organization stepladder approach for patients with cancer pain and limited life expectancy.18 Applying this approach to a general population of patients with chronic pain is ineffective and dangerous.19 The CDC and the VA/US Department of Defense (VA/DoD) guidelines both recommend carefully reassessing risks and benefits at total daily dosages > 50 OME and avoid increasing dosages to > 90 OME daily in most circumstances.5,20 Our finding that participants taking higher dosages of opioids were not more likely to have better control over their pain supports this recommendation.
Limitations
This study has several limitations, the most significant is its small sample size because of the exploratory nature of the project. Results are based on a small pilot sample enriched to include individuals with at least moderate pain who receive opioids frequently at 1 VA CLC-PAC unit; therefore, the results might not be representative of all veterans or a more general population. Our small sample size limits power to detect small differences. Data collected should be used to inform formal power calculations before subsequent larger studies to select adequate sample size. Validation studies, including samples from the same population using different dates, which reproduce findings are an important step. Moreover, we only had data on a single dimension of pain (intensity/severity), as measured by the pain scale, which nursing staff used to make a real-time clinical decision of whether to administer an as-needed opioid. Future studies should consider using pain measures that provide multidimensional assessment (ie, severity, functional interference) and/or were developed specifically for veterans, such as the Defense and Veterans Pain Rating Scale.21
Our study was cross-sectional in nature and addressed a single 24-hour period of data per participant. The years of data collection (2016 and 2017) followed a decline in overall opioid prescribing that has continued, likely influenced by CDC and VA/DoD guidelines.22 It is unclear whether our observations are an accurate reflection of individuals’ response over time or whether prescribing practices in PAC have shifted.
We did not consider the type of pain being treated or explore clinicians’ reasons for prescribing opioids, therefore limiting our ability to know whether opioids were indicated. Information regarding OUD and other SUDs was limited to what was documented in the chart during the CLC-PAC unit admission. We did not have information on length of exposure to opioids. It is possible that opioid tolerance could play a role in reducing opioid responsiveness. However, simple tolerance would not be expected to explain robust correlations with psychiatric comorbidities. Also, simple tolerance would be expected to be overcome with higher opioid dosages, whereas our study demonstrates less responsiveness. These data suggests that some individuals’ pain might be poorly opioid responsive, and psychiatric factors could increase this risk. We used a novel data source in combination with chart review; to our knowledge, barcode medication administration data have not been used in this manner previously. Future work needs to validate this method, using larger sample sizes and several clinical sites. Finally, we used regression models that controlled for average pre-opioid pain rating scores, which is only 1 covariate important for examining effects. Larger studies with adequate power should control for multiple covariates known to be associated with pain and opioid response.
Conclusions
Opioid responsiveness is important clinically yet challenging to assess. This pilot study identifies a way of classifying pain as relatively opioid nonresponsive using administrative data but requires further validation before considering scaling for more general use. The possibility that a substantial percentage of residents in a CLC-PAC unit could be receiving increasing dosages of opioids without adequate benefit justifies the need for more research and underscores the need for prescribers to assess individuals frequently for ongoing benefit of opioids regardless of diagnosis or mechanism of pain.
Acknowledgments
The authors thank Andrzej Galecki, Corey Powell, and the University of Michigan Consulting for Statistics, Computing and Analytics Research Center for assistance with statistical analysis.
1. Marshall TL, Reinhardt JP. Pain management in the last 6 months of life: predictors of opioid and non-opioid use. J Am Med Dir Assoc. 2019;20(6):789-790. doi:10.1016/j.jamda.2019.02.026
2. Tait RC, Chibnall JT. Pain in older subacute care patients: associations with clinical status and treatment. Pain Med. 2002;3(3):231-239. doi:10.1046/j.1526-4637.2002.02031.x
3. Pimentel CB, Briesacher BA, Gurwitz JH, Rosen AB, Pimentel MT, Lapane KL. Pain management in nursing home residents with cancer. J Am Geriatr Soc. 2015;63(4):633-641. doi:10.1111/jgs.13345
4. Hunnicutt JN, Tjia J, Lapane KL. Hospice use and pain management in elderly nursing home residents with cancer. J Pain Symptom Manage. 2017;53(3):561-570. doi:10.1016/j.jpainsymman.2016.10.369
5. Dowell D, Haegerich TM, Chou R. CDC guideline for prescribing opioids for chronic pain — United States, 2016. MMWR Recomm Rep. 2016;65(No. RR-1):1-49. doi:10.15585/mmwr.rr6501e1
6. Oliva EM, Bowe T, Tavakoli S, et al. Development and applications of the Veterans Health Administration’s Stratification Tool for Opioid Risk Mitigation (STORM) to improve opioid safety and prevent overdose and suicide. Psychol Serv. 2017;14(1):34-49. doi:10.1037/ser0000099
7. Goesling J, Moser SE, Lin LA, Hassett AL, Wasserman RA, Brummett CM. Discrepancies between perceived benefit of opioids and self-reported patient outcomes. Pain Med. 2018;19(2):297-306. doi:10.1093/pm/pnw263
8. Sullivan M, Von Korff M, Banta-Green C. Problems and concerns of patients receiving chronic opioid therapy for chronic non-cancer pain. Pain. 2010;149(2):345-353. doi:10.1016/j.pain.2010.02.037
9. Brennan PL, Greenbaum MA, Lemke S, Schutte KK. Mental health disorder, pain, and pain treatment among long-term care residents: evidence from the Minimum Data Set 3.0. Aging Ment Health. 2019;23(9):1146-1155. doi:10.1080/13607863.2018.1481922
10. Woo A, Lechner B, Fu T, et al. Cut points for mild, moderate, and severe pain among cancer and non-cancer patients: a literature review. Ann Palliat Med. 2015;4(4):176-183. doi:10.3978/j.issn.2224-5820.2015.09.04
11. Centers for Disease Control and Prevention. Calculating total daily dose of opioids for safer dosage. 2017. Accessed December 15, 2021. https://www.cdc.gov/drugoverdose/pdf/calculating_total_daily_dose-a.pdf
12. Nielsen S, Degenhardt L, Hoban B, Gisev N. Comparing opioids: a guide to estimating oral morphine equivalents (OME) in research. NDARC Technical Report No. 329. National Drug and Alcohol Research Centre; 2014. Accessed December 15, 2021. http://www.drugsandalcohol.ie/22703/1/NDARC Comparing opioids.pdf
13. Smith HS. Variations in opioid responsiveness. Pain Physician. 2008;11(2):237-248.
14. Collin E, Cesselin F. Neurobiological mechanisms of opioid tolerance and dependence. Clin Neuropharmacol. 1991;14(6):465-488. doi:10.1097/00002826-199112000-00001
15. Higgins C, Smith BH, Matthews K. Evidence of opioid-induced hyperalgesia in clinical populations after chronic opioid exposure: a systematic review and meta-analysis. Br J Anaesth. 2019;122(6):e114-e126. doi:10.1016/j.bja.2018.09.019
16. Howe CQ, Sullivan MD. The missing ‘P’ in pain management: how the current opioid epidemic highlights the need for psychiatric services in chronic pain care. Gen Hosp Psychiatry. 2014;36(1):99-104. doi:10.1016/j.genhosppsych.2013.10.003
17. Substance Abuse and Mental Health Services Administration. Key substance use and mental health indicators in the United States: results from the 2018 National Survey on Drug Use and Health. HHS Publ No PEP19-5068, NSDUH Ser H-54. 2019;170:51-58. Accessed December 15, 2021. https://www.samhsa.gov/data/sites/default/files/cbhsq-reports/NSDUHNationalFindingsReport2018/NSDUHNationalFindingsReport2018.pdf
18. World Health Organization. WHO’s cancer pain ladder for adults. Accessed September 21, 2018. www.who.int/ncds/management/palliative-care/Infographic-cancer-pain-lowres.pdf
19. Ballantyne JC, Kalso E, Stannard C. WHO analgesic ladder: a good concept gone astray. BMJ. 2016;352:i20. doi:10.1136/bmj.i20
20. The Opioid Therapy for Chronic Pain Work Group. VA/DoD clinical practice guideline for opioid therapy for chronic pain. US Dept of Veterans Affairs and Dept of Defense; 2017. Accessed December 15, 2021. https://www.healthquality.va.gov/guidelines/Pain/cot/VADoDOTCPG022717.pdf
21. Defense & Veterans Pain Rating Scale (DVPRS). Defense & Veterans Center for Integrative Pain Management. Accessed July 21, 2021. https://www.dvcipm.org/clinical-resources/defense-veterans-pain-rating-scale-dvprs/
22. Guy GP Jr, Zhang K, Bohm MK, et al. Vital signs: changes in opioid prescribing in the United States, 2006–2015. MMWR Morb Mortal Wkly Rep. 2017;66(26):697-704. doi:10.15585/mmwr.mm6626a4
Older adults admitted to post-acute settings frequently have complex rehabilitation needs and multimorbidity, which predisposes them to pain management challenges.1,2 The prevalence of pain in post-acute and long-term care is as high as 65%, and opioid use is common among this population with 1 in 7 residents receiving long-term opioids.3,4
Opioids that do not adequately control pain represent a missed opportunity for deprescribing. There is limited evidence regarding efficacy of long-term opioid use (> 90 days) for improving pain and physical functioning.5 In addition, long-term opioid use carries significant risks, including overdose-related death, dependence, and increased emergency department visits.5 These risks are likely to be pronounced among veterans receiving post-acute care (PAC) who are older, have comorbid psychiatric disorders, are prescribed several centrally acting medications, and experience substance use disorder (SUD).6
Older adults are at increased risk for opioid toxicity because of reduced drug clearance and smaller therapeutic window.5 Centers for Disease Control and Prevention (CDC) guidelines recommend frequently assessing patients for benefit in terms of sustained improvement in pain as well as physical function.5 If pain and functional improvements are minimal, opioid use and nonopioid pain management strategies should be considered. Some patients will struggle with this approach. Directly asking patients about the effectiveness of opioids is challenging. Opioid users with chronic pain frequently report problems with opioids even as they describe them as indispensable for pain management.7,8
Earlier studies have assessed patient perspectives regarding opioid difficulties as well as their helpfulness, which could introduce recall bias. Patient-level factors that contribute to a global sense of distress, in addition to the presence of painful physical conditions, also could contribute to patients requesting opioids without experiencing adequate pain relief. One study in veterans residing in PAC facilities found that individuals with depression, posttraumatic stress disorder (PTSD), and SUD were more likely to report pain and receive scheduled analgesics; this effect persisted in individuals with PTSD even after adjusting for demographic and functional status variables.9 The study looked only at analgesics as a class and did not examine opioids specifically. It is possible that distressed individuals, such as those with uncontrolled depression, PTSD, and SUD, might be more likely to report high pain levels and receive opioids with inadequate benefit and increased risk. Identifying the primary condition causing distress and targeting treatment to that condition (ie, depression) is preferable to escalating opioids in an attempt to treat pain in the context of nonresponse. Assessing an individual’s aggregate response to opioids rather than relying on a single self-report is a useful addition to current pain management strategies.
The goal of this study was to pilot a method of identifying opioid-nonresponsive pain using administrative data, measure its prevalence in a PAC population of veterans, and explore clinical and demographic correlates with particular attention to variates that could indicate high levels of psychological and physical distress. Identifying pain that is poorly responsive to opioids would give clinicians the opportunity to avoid or minimize opioid use and prioritize treatments that are likely to improve the resident’s pain, quality of life, and physical function while minimizing recall bias. We hypothesized that pain that responds poorly to opioids would be prevalent among veterans residing in a PAC unit. We considered that veterans with pain poorly responsive to opioids would be more likely to have factors that would place them at increased risk of adverse effects, such as comorbid psychiatric conditions, history of SUD, and multimorbidity, providing further rationale for clinical equipoise in that population.6
Methods
This was a small, retrospective cross-sectional study using administrative data and chart review. The study included veterans who were administered opioids while residing in a single US Department of Veterans Affairs (VA) community living center PAC (CLC-PAC) unit during at least 1 of 4 nonconsecutive, random days in 2016 and 2017. The study was approved by the institutional review board of the Ann Arbor VA Health System (#2017-1034) as part of a larger project involving models of care in vulnerable older veterans.
Inclusion criteria were the presence of at least moderate pain (≥ 4 on a 0 to 10 scale); receiving ≥ 2 opioids ordered as needed over the prespecified 24-hour observation period; and having ≥ 2 pre-and postopioid administration pain scores during the observation period. Veterans who did not meet these criteria were excluded. At the time of initial sample selection, we did not capture information related to coprescribed analgesics, including a standing order of opioids. To obtain the sample, we initially characterized all veterans on the 4 days residing in the CLC-PAC unit as those reporting at least moderate pain (≥ 4) and those who reported no or mild pain (< 4). The cut point of 4 of 10 is consistent with moderate pain based on earlier work showing higher likelihood of pain that interferes with physical function.10 We then restricted the sample to veterans who received ≥ 2 opioids ordered as needed for pain and had ≥ 2 pre- and postopioid administration numeric pain rating scores during the 24-hour observation period. This methodology was chosen to enrich our sample for those who received opioids regularly for ongoing pain. Opioids were defined as full µ-opioid receptor agonists and included hydrocodone, oxycodone, morphine, hydromorphone, fentanyl, tramadol, and methadone.
Medication administration data were obtained from the VA corporate data warehouse, which houses all barcode medication administration data collected at the point of care. The dataset includes pain scores gathered by nursing staff before and after administering an as-needed analgesic. The corporate data warehouse records data/time of pain scores and the analgesic name, dosage, formulation, and date/time of administration. Using a standardized assessment form developed iteratively, we calculated opioid dosage in oral morphine equivalents (OME) for comparison.11,12 All abstracted data were reexamined for accuracy. Data initially were collected in an anonymized, blinded fashion. Participants were then unblinded for chart review. Initial data was captured in resident-days instead of unique residents because an individual resident might have been admitted on several observation days. We were primarily interested in how pain responded to opioids administered in response to resident request; therefore, we did not examine response to opioids that were continuously ordered (ie, scheduled). We did consider scheduled opioids when calculating total daily opioid dosage during the chart review.
Outcome of Interest
The primary outcome of interest was an individual’s response to as-needed opioids, which we defined as change in the pain score after opioid administration. The pre-opioid pain score was the score that immediately preceded administration of an as-needed opioid. The postopioid administration pain score was the first score after opioid administration if obtained within 3 hours of administration. Scores collected > 3 hours after opioid administration were excluded because they no longer accurately reflected the impact of the opioid due to the short half-lives. Observations were excluded if an opioid was administered without a recorded pain score; this occurred once for 6 individuals. Observations also were excluded if an opioid was administered but the data were captured on the following day (outside of the 24-hour window); this occurred once for 3 individuals.
We calculated a ∆ score by subtracting the postopioid pain rating score from the pre-opioid score. Individual ∆ scores were then averaged over the 24-hour period (range, 2-5 opioid doses). For example, if an individual reported a pre-opioid pain score of 10, and a postopioid pain score of 2, the ∆ was recorded as 8. If the individual’s next pre-opioid score was 10, and post-opioid score was 6, the ∆ was recorded as 4. ∆ scores over the 24-hour period were averaged together to determine that individual’s response to as-needed opioids. In the previous example, the mean ∆ score is 6. Lower mean ∆ scores reflect decreased responsiveness to opioids’ analgesic effect.
Demographic and clinical data were obtained from electronic health record review using a standardized assessment form. These data included information about medical and psychiatric comorbidities, specialist consultations, and CLC-PAC unit admission indications and diagnoses. Medications of interest were categorized as antidepressants, antipsychotics, benzodiazepines, muscle relaxants, hypnotics, stimulants, antiepileptic drugs/mood stabilizers (including gabapentin and pregabalin), and all adjuvant analgesics. Adjuvant analgesics were defined as medications administered for pain as documented by chart notes or those ordered as needed for pain, and analyzed as a composite variable. Antidepressants with analgesic properties (serotonin-norepinephrine reuptake inhibitors and tricyclic antidepressants) were considered adjuvant analgesics. Psychiatric information collected included presence of mood, anxiety, and psychotic disorders, and PTSD. SUD information was collected separately from other psychiatric disorders.
Analyses
The study population was described using tabulations for categorical data and means and standard deviations for continuous data. Responsiveness to opioids was analyzed as a continuous variable. Those with higher mean ∆ scores were considered to have pain relatively more responsive to opioids, while lower mean ∆ scores indicated pain less responsive to opioids. We constructed linear regression models controlling for average pre-opioid pain rating scores to explore associations between opioid responsiveness and variables of interest. All analyses were completed using Stata version 15. This study was not adequately powered to detect differences across the spectrum of opioid responsiveness, although the authors have reported differences in this article.
Results
Over the 4-day observational period there were 146 resident-days. Of these, 88 (60.3%) reported at least 1 pain score of ≥ 4. Of those, 61 (41.8%) received ≥ 1 as-needed opioid for pain. We identified 46 resident-days meeting study criteria of ≥ 2 pre- and postanalgesic scores. We identified 41 unique individuals (Figure 1). Two individuals were admitted to the CLC-PAC unit on 2 of the 4 observation days, and 1 individual was admitted to the CLC-PAC unit on 3 of the 4 observation days. For individuals admitted several days, we included data only from the initial observation day.
Response to opioids varied greatly in this sample. The mean (SD) ∆ pain score was 3.4 (1.6) and ranged from 0.5 to 6.3. Using linear regression, we found no relationship between admission indication, medical comorbidities (including active cancer), and opioid responsiveness (Table).
Psychiatric disorders were highly prevalent, with 25 individuals (61.0%) having ≥ 1 any psychiatric diagnosis identified on chart review. The presence of any psychiatric diagnosis was significantly associated with reduced responsiveness to opioids (β = −1.08; 95% CI, −2.04 to −0.13; P = .03). SUDs also were common, with 17 individuals (41.5%) having an active SUD; most were tobacco/nicotine. Twenty-six veterans (63.4%) had documentation of SUD in remission with 19 (46.3%) for substances other than tobacco/nicotine. There was no indication that any veteran in the sample was prescribed medication for opioid use disorder (OUD) at the time of observation. There was no relationship between opioid responsiveness and SUDs, neither active or in remission. Consults to other services that suggested distress or difficult-to-control symptoms also were frequent. Consults to the pain service were significantly associated with reduced responsiveness to opioids (β = −1.75; 95% CI, −3.33 to −0.17; P = .03). Association between psychiatry consultation and reduced opioid responsiveness trended toward significance (β = −0.95; 95% CI, −2.06 to 0.17; P = .09) (Figures 2 and 3). There was no significant association with palliative medicine consultation and opioid responsiveness.
A poorer response to opioids was associated with a significantly higher as-needed opioid dosage (β = −0.02; 95% CI, −0.04 to −0.01; P = .002) as well as a trend toward higher total opioid dosage (β = −0.005; 95% CI, −0.01 to 0.0003; P = .06) (Figure 4). Thirty-eight (92.7%) participants received nonopioid adjuvant analgesics for pain. More than half (56.1%) received antidepressants or gabapentinoids (51.2%), although we did not assess whether they were prescribed for pain or another indication. We did not identify a relationship between any specific psychoactive drug class and opioid responsiveness in this sample.
Discussion
This exploratory study used readily available administrative data in a CLC-PAC unit to assess responsiveness to opioids via a numeric mean ∆ score, with higher values indicating more pain relief in response to opioids. We then constructed linear regression models to characterize the relationship between the mean ∆ score and factors known to be associated with difficult-to-control pain and psychosocial distress. As expected, opioid responsiveness was highly variable among residents; some residents experienced essentially no reduction in pain, on average, despite receiving opioids. Psychiatric comorbidity, higher dosage in OMEs, and the presence of a pain service consult significantly correlated with poorer response to opioids. To our knowledge, this is the first study to quantify opioid responsiveness and describe the relationship with clinical correlates in the understudied PAC population.
Earlier research has demonstrated a relationship between the presence of psychiatric disorders and increased likelihood of receiving any analgesics among veterans residing in PAC.9 Our study adds to the literature by quantifying opioid response using readily available administrative data and examining associations with psychiatric diagnoses. These findings highlight the possibility that attempting to treat high levels of pain by escalating the opioid dosage in patients with a comorbid psychiatric diagnosis should be re-addressed, particularly if there is no meaningful pain reduction at lower opioid dosages. Our sample had a variety of admission diagnoses and medical comorbidities, however, we did not identify a relationship with opioid responsiveness, including an active cancer diagnosis. Although SUDs were highly prevalent in our sample, there was no relationship with opioid responsiveness. This suggests that lack of response to opioids is not merely a matter of drug tolerance or an indication of drug-seeking behavior.
Factors Impacting Response
Many factors could affect whether an individual obtains an adequate analgesic response to opioids or other pain medications, including variations in genes encoding opioid receptors and hepatic enzymes involved in drug metabolism and an individual’s opioid exposure history.13 The phenomenon of requiring more drug to produce the same relief after repeated exposures (ie, tolerance) is well known.14 Opioid-induced hyperalgesia is a phenomenon whereby a patient’s overall pain increases while receiving opioids, but each opioid dose might be perceived as beneficial.15 Increasingly, psychosocial distress is an important factor in opioid response. Adverse selection is the process culminating in those with psychosocial distress and/or SUDs being prescribed more opioids for longer durations.16 Our data suggests that this process could play a role in PAC settings. In addition, exaggerating pain to obtain additional opioids for nonmedical purposes, such as euphoria or relaxation, also is possible.17
When clinically assessing an individual whose pain is not well controlled despite escalating opioid dosages, prescribers must consider which of these factors likely is predominant. However, the first step of determining who has a poor opioid response is not straightforward. Directly asking patients is challenging; many individuals perceive opioids to be helpful while simultaneously reporting inadequately controlled pain.7,8 The primary value of this study is the possibility of providing prescribers a quick, simple method of assessing a patient’s response to opioids. Using this method, individuals who are responding poorly to opioids, including those who might exaggerate pain for secondary gain, could be identified. Health care professionals could consider revisiting pain management strategies, assess for the presence of OUD, or evaluate other contributors to inadequately controlled pain. Although we only collected data regarding response to opioids in this study, any pain medication administered as needed (ie, nonsteroidal anti-inflammatory drugs, acetaminophen) could be analyzed using this methodology, allowing identification of other helpful pain management strategies. We began the validation process with extensive chart review, but further validation is required before this method can be applied to routine clinical practice.
Patients who report uncontrolled pain despite receiving opioids are a clinically challenging population. The traditional strategy has been to escalate opioids, which is recommended by the World Health Organization stepladder approach for patients with cancer pain and limited life expectancy.18 Applying this approach to a general population of patients with chronic pain is ineffective and dangerous.19 The CDC and the VA/US Department of Defense (VA/DoD) guidelines both recommend carefully reassessing risks and benefits at total daily dosages > 50 OME and avoid increasing dosages to > 90 OME daily in most circumstances.5,20 Our finding that participants taking higher dosages of opioids were not more likely to have better control over their pain supports this recommendation.
Limitations
This study has several limitations, the most significant is its small sample size because of the exploratory nature of the project. Results are based on a small pilot sample enriched to include individuals with at least moderate pain who receive opioids frequently at 1 VA CLC-PAC unit; therefore, the results might not be representative of all veterans or a more general population. Our small sample size limits power to detect small differences. Data collected should be used to inform formal power calculations before subsequent larger studies to select adequate sample size. Validation studies, including samples from the same population using different dates, which reproduce findings are an important step. Moreover, we only had data on a single dimension of pain (intensity/severity), as measured by the pain scale, which nursing staff used to make a real-time clinical decision of whether to administer an as-needed opioid. Future studies should consider using pain measures that provide multidimensional assessment (ie, severity, functional interference) and/or were developed specifically for veterans, such as the Defense and Veterans Pain Rating Scale.21
Our study was cross-sectional in nature and addressed a single 24-hour period of data per participant. The years of data collection (2016 and 2017) followed a decline in overall opioid prescribing that has continued, likely influenced by CDC and VA/DoD guidelines.22 It is unclear whether our observations are an accurate reflection of individuals’ response over time or whether prescribing practices in PAC have shifted.
We did not consider the type of pain being treated or explore clinicians’ reasons for prescribing opioids, therefore limiting our ability to know whether opioids were indicated. Information regarding OUD and other SUDs was limited to what was documented in the chart during the CLC-PAC unit admission. We did not have information on length of exposure to opioids. It is possible that opioid tolerance could play a role in reducing opioid responsiveness. However, simple tolerance would not be expected to explain robust correlations with psychiatric comorbidities. Also, simple tolerance would be expected to be overcome with higher opioid dosages, whereas our study demonstrates less responsiveness. These data suggests that some individuals’ pain might be poorly opioid responsive, and psychiatric factors could increase this risk. We used a novel data source in combination with chart review; to our knowledge, barcode medication administration data have not been used in this manner previously. Future work needs to validate this method, using larger sample sizes and several clinical sites. Finally, we used regression models that controlled for average pre-opioid pain rating scores, which is only 1 covariate important for examining effects. Larger studies with adequate power should control for multiple covariates known to be associated with pain and opioid response.
Conclusions
Opioid responsiveness is important clinically yet challenging to assess. This pilot study identifies a way of classifying pain as relatively opioid nonresponsive using administrative data but requires further validation before considering scaling for more general use. The possibility that a substantial percentage of residents in a CLC-PAC unit could be receiving increasing dosages of opioids without adequate benefit justifies the need for more research and underscores the need for prescribers to assess individuals frequently for ongoing benefit of opioids regardless of diagnosis or mechanism of pain.
Acknowledgments
The authors thank Andrzej Galecki, Corey Powell, and the University of Michigan Consulting for Statistics, Computing and Analytics Research Center for assistance with statistical analysis.
Older adults admitted to post-acute settings frequently have complex rehabilitation needs and multimorbidity, which predisposes them to pain management challenges.1,2 The prevalence of pain in post-acute and long-term care is as high as 65%, and opioid use is common among this population with 1 in 7 residents receiving long-term opioids.3,4
Opioids that do not adequately control pain represent a missed opportunity for deprescribing. There is limited evidence regarding efficacy of long-term opioid use (> 90 days) for improving pain and physical functioning.5 In addition, long-term opioid use carries significant risks, including overdose-related death, dependence, and increased emergency department visits.5 These risks are likely to be pronounced among veterans receiving post-acute care (PAC) who are older, have comorbid psychiatric disorders, are prescribed several centrally acting medications, and experience substance use disorder (SUD).6
Older adults are at increased risk for opioid toxicity because of reduced drug clearance and smaller therapeutic window.5 Centers for Disease Control and Prevention (CDC) guidelines recommend frequently assessing patients for benefit in terms of sustained improvement in pain as well as physical function.5 If pain and functional improvements are minimal, opioid use and nonopioid pain management strategies should be considered. Some patients will struggle with this approach. Directly asking patients about the effectiveness of opioids is challenging. Opioid users with chronic pain frequently report problems with opioids even as they describe them as indispensable for pain management.7,8
Earlier studies have assessed patient perspectives regarding opioid difficulties as well as their helpfulness, which could introduce recall bias. Patient-level factors that contribute to a global sense of distress, in addition to the presence of painful physical conditions, also could contribute to patients requesting opioids without experiencing adequate pain relief. One study in veterans residing in PAC facilities found that individuals with depression, posttraumatic stress disorder (PTSD), and SUD were more likely to report pain and receive scheduled analgesics; this effect persisted in individuals with PTSD even after adjusting for demographic and functional status variables.9 The study looked only at analgesics as a class and did not examine opioids specifically. It is possible that distressed individuals, such as those with uncontrolled depression, PTSD, and SUD, might be more likely to report high pain levels and receive opioids with inadequate benefit and increased risk. Identifying the primary condition causing distress and targeting treatment to that condition (ie, depression) is preferable to escalating opioids in an attempt to treat pain in the context of nonresponse. Assessing an individual’s aggregate response to opioids rather than relying on a single self-report is a useful addition to current pain management strategies.
The goal of this study was to pilot a method of identifying opioid-nonresponsive pain using administrative data, measure its prevalence in a PAC population of veterans, and explore clinical and demographic correlates with particular attention to variates that could indicate high levels of psychological and physical distress. Identifying pain that is poorly responsive to opioids would give clinicians the opportunity to avoid or minimize opioid use and prioritize treatments that are likely to improve the resident’s pain, quality of life, and physical function while minimizing recall bias. We hypothesized that pain that responds poorly to opioids would be prevalent among veterans residing in a PAC unit. We considered that veterans with pain poorly responsive to opioids would be more likely to have factors that would place them at increased risk of adverse effects, such as comorbid psychiatric conditions, history of SUD, and multimorbidity, providing further rationale for clinical equipoise in that population.6
Methods
This was a small, retrospective cross-sectional study using administrative data and chart review. The study included veterans who were administered opioids while residing in a single US Department of Veterans Affairs (VA) community living center PAC (CLC-PAC) unit during at least 1 of 4 nonconsecutive, random days in 2016 and 2017. The study was approved by the institutional review board of the Ann Arbor VA Health System (#2017-1034) as part of a larger project involving models of care in vulnerable older veterans.
Inclusion criteria were the presence of at least moderate pain (≥ 4 on a 0 to 10 scale); receiving ≥ 2 opioids ordered as needed over the prespecified 24-hour observation period; and having ≥ 2 pre-and postopioid administration pain scores during the observation period. Veterans who did not meet these criteria were excluded. At the time of initial sample selection, we did not capture information related to coprescribed analgesics, including a standing order of opioids. To obtain the sample, we initially characterized all veterans on the 4 days residing in the CLC-PAC unit as those reporting at least moderate pain (≥ 4) and those who reported no or mild pain (< 4). The cut point of 4 of 10 is consistent with moderate pain based on earlier work showing higher likelihood of pain that interferes with physical function.10 We then restricted the sample to veterans who received ≥ 2 opioids ordered as needed for pain and had ≥ 2 pre- and postopioid administration numeric pain rating scores during the 24-hour observation period. This methodology was chosen to enrich our sample for those who received opioids regularly for ongoing pain. Opioids were defined as full µ-opioid receptor agonists and included hydrocodone, oxycodone, morphine, hydromorphone, fentanyl, tramadol, and methadone.
Medication administration data were obtained from the VA corporate data warehouse, which houses all barcode medication administration data collected at the point of care. The dataset includes pain scores gathered by nursing staff before and after administering an as-needed analgesic. The corporate data warehouse records data/time of pain scores and the analgesic name, dosage, formulation, and date/time of administration. Using a standardized assessment form developed iteratively, we calculated opioid dosage in oral morphine equivalents (OME) for comparison.11,12 All abstracted data were reexamined for accuracy. Data initially were collected in an anonymized, blinded fashion. Participants were then unblinded for chart review. Initial data was captured in resident-days instead of unique residents because an individual resident might have been admitted on several observation days. We were primarily interested in how pain responded to opioids administered in response to resident request; therefore, we did not examine response to opioids that were continuously ordered (ie, scheduled). We did consider scheduled opioids when calculating total daily opioid dosage during the chart review.
Outcome of Interest
The primary outcome of interest was an individual’s response to as-needed opioids, which we defined as change in the pain score after opioid administration. The pre-opioid pain score was the score that immediately preceded administration of an as-needed opioid. The postopioid administration pain score was the first score after opioid administration if obtained within 3 hours of administration. Scores collected > 3 hours after opioid administration were excluded because they no longer accurately reflected the impact of the opioid due to the short half-lives. Observations were excluded if an opioid was administered without a recorded pain score; this occurred once for 6 individuals. Observations also were excluded if an opioid was administered but the data were captured on the following day (outside of the 24-hour window); this occurred once for 3 individuals.
We calculated a ∆ score by subtracting the postopioid pain rating score from the pre-opioid score. Individual ∆ scores were then averaged over the 24-hour period (range, 2-5 opioid doses). For example, if an individual reported a pre-opioid pain score of 10, and a postopioid pain score of 2, the ∆ was recorded as 8. If the individual’s next pre-opioid score was 10, and post-opioid score was 6, the ∆ was recorded as 4. ∆ scores over the 24-hour period were averaged together to determine that individual’s response to as-needed opioids. In the previous example, the mean ∆ score is 6. Lower mean ∆ scores reflect decreased responsiveness to opioids’ analgesic effect.
Demographic and clinical data were obtained from electronic health record review using a standardized assessment form. These data included information about medical and psychiatric comorbidities, specialist consultations, and CLC-PAC unit admission indications and diagnoses. Medications of interest were categorized as antidepressants, antipsychotics, benzodiazepines, muscle relaxants, hypnotics, stimulants, antiepileptic drugs/mood stabilizers (including gabapentin and pregabalin), and all adjuvant analgesics. Adjuvant analgesics were defined as medications administered for pain as documented by chart notes or those ordered as needed for pain, and analyzed as a composite variable. Antidepressants with analgesic properties (serotonin-norepinephrine reuptake inhibitors and tricyclic antidepressants) were considered adjuvant analgesics. Psychiatric information collected included presence of mood, anxiety, and psychotic disorders, and PTSD. SUD information was collected separately from other psychiatric disorders.
Analyses
The study population was described using tabulations for categorical data and means and standard deviations for continuous data. Responsiveness to opioids was analyzed as a continuous variable. Those with higher mean ∆ scores were considered to have pain relatively more responsive to opioids, while lower mean ∆ scores indicated pain less responsive to opioids. We constructed linear regression models controlling for average pre-opioid pain rating scores to explore associations between opioid responsiveness and variables of interest. All analyses were completed using Stata version 15. This study was not adequately powered to detect differences across the spectrum of opioid responsiveness, although the authors have reported differences in this article.
Results
Over the 4-day observational period there were 146 resident-days. Of these, 88 (60.3%) reported at least 1 pain score of ≥ 4. Of those, 61 (41.8%) received ≥ 1 as-needed opioid for pain. We identified 46 resident-days meeting study criteria of ≥ 2 pre- and postanalgesic scores. We identified 41 unique individuals (Figure 1). Two individuals were admitted to the CLC-PAC unit on 2 of the 4 observation days, and 1 individual was admitted to the CLC-PAC unit on 3 of the 4 observation days. For individuals admitted several days, we included data only from the initial observation day.
Response to opioids varied greatly in this sample. The mean (SD) ∆ pain score was 3.4 (1.6) and ranged from 0.5 to 6.3. Using linear regression, we found no relationship between admission indication, medical comorbidities (including active cancer), and opioid responsiveness (Table).
Psychiatric disorders were highly prevalent, with 25 individuals (61.0%) having ≥ 1 any psychiatric diagnosis identified on chart review. The presence of any psychiatric diagnosis was significantly associated with reduced responsiveness to opioids (β = −1.08; 95% CI, −2.04 to −0.13; P = .03). SUDs also were common, with 17 individuals (41.5%) having an active SUD; most were tobacco/nicotine. Twenty-six veterans (63.4%) had documentation of SUD in remission with 19 (46.3%) for substances other than tobacco/nicotine. There was no indication that any veteran in the sample was prescribed medication for opioid use disorder (OUD) at the time of observation. There was no relationship between opioid responsiveness and SUDs, neither active or in remission. Consults to other services that suggested distress or difficult-to-control symptoms also were frequent. Consults to the pain service were significantly associated with reduced responsiveness to opioids (β = −1.75; 95% CI, −3.33 to −0.17; P = .03). Association between psychiatry consultation and reduced opioid responsiveness trended toward significance (β = −0.95; 95% CI, −2.06 to 0.17; P = .09) (Figures 2 and 3). There was no significant association with palliative medicine consultation and opioid responsiveness.
A poorer response to opioids was associated with a significantly higher as-needed opioid dosage (β = −0.02; 95% CI, −0.04 to −0.01; P = .002) as well as a trend toward higher total opioid dosage (β = −0.005; 95% CI, −0.01 to 0.0003; P = .06) (Figure 4). Thirty-eight (92.7%) participants received nonopioid adjuvant analgesics for pain. More than half (56.1%) received antidepressants or gabapentinoids (51.2%), although we did not assess whether they were prescribed for pain or another indication. We did not identify a relationship between any specific psychoactive drug class and opioid responsiveness in this sample.
Discussion
This exploratory study used readily available administrative data in a CLC-PAC unit to assess responsiveness to opioids via a numeric mean ∆ score, with higher values indicating more pain relief in response to opioids. We then constructed linear regression models to characterize the relationship between the mean ∆ score and factors known to be associated with difficult-to-control pain and psychosocial distress. As expected, opioid responsiveness was highly variable among residents; some residents experienced essentially no reduction in pain, on average, despite receiving opioids. Psychiatric comorbidity, higher dosage in OMEs, and the presence of a pain service consult significantly correlated with poorer response to opioids. To our knowledge, this is the first study to quantify opioid responsiveness and describe the relationship with clinical correlates in the understudied PAC population.
Earlier research has demonstrated a relationship between the presence of psychiatric disorders and increased likelihood of receiving any analgesics among veterans residing in PAC.9 Our study adds to the literature by quantifying opioid response using readily available administrative data and examining associations with psychiatric diagnoses. These findings highlight the possibility that attempting to treat high levels of pain by escalating the opioid dosage in patients with a comorbid psychiatric diagnosis should be re-addressed, particularly if there is no meaningful pain reduction at lower opioid dosages. Our sample had a variety of admission diagnoses and medical comorbidities, however, we did not identify a relationship with opioid responsiveness, including an active cancer diagnosis. Although SUDs were highly prevalent in our sample, there was no relationship with opioid responsiveness. This suggests that lack of response to opioids is not merely a matter of drug tolerance or an indication of drug-seeking behavior.
Factors Impacting Response
Many factors could affect whether an individual obtains an adequate analgesic response to opioids or other pain medications, including variations in genes encoding opioid receptors and hepatic enzymes involved in drug metabolism and an individual’s opioid exposure history.13 The phenomenon of requiring more drug to produce the same relief after repeated exposures (ie, tolerance) is well known.14 Opioid-induced hyperalgesia is a phenomenon whereby a patient’s overall pain increases while receiving opioids, but each opioid dose might be perceived as beneficial.15 Increasingly, psychosocial distress is an important factor in opioid response. Adverse selection is the process culminating in those with psychosocial distress and/or SUDs being prescribed more opioids for longer durations.16 Our data suggests that this process could play a role in PAC settings. In addition, exaggerating pain to obtain additional opioids for nonmedical purposes, such as euphoria or relaxation, also is possible.17
When clinically assessing an individual whose pain is not well controlled despite escalating opioid dosages, prescribers must consider which of these factors likely is predominant. However, the first step of determining who has a poor opioid response is not straightforward. Directly asking patients is challenging; many individuals perceive opioids to be helpful while simultaneously reporting inadequately controlled pain.7,8 The primary value of this study is the possibility of providing prescribers a quick, simple method of assessing a patient’s response to opioids. Using this method, individuals who are responding poorly to opioids, including those who might exaggerate pain for secondary gain, could be identified. Health care professionals could consider revisiting pain management strategies, assess for the presence of OUD, or evaluate other contributors to inadequately controlled pain. Although we only collected data regarding response to opioids in this study, any pain medication administered as needed (ie, nonsteroidal anti-inflammatory drugs, acetaminophen) could be analyzed using this methodology, allowing identification of other helpful pain management strategies. We began the validation process with extensive chart review, but further validation is required before this method can be applied to routine clinical practice.
Patients who report uncontrolled pain despite receiving opioids are a clinically challenging population. The traditional strategy has been to escalate opioids, which is recommended by the World Health Organization stepladder approach for patients with cancer pain and limited life expectancy.18 Applying this approach to a general population of patients with chronic pain is ineffective and dangerous.19 The CDC and the VA/US Department of Defense (VA/DoD) guidelines both recommend carefully reassessing risks and benefits at total daily dosages > 50 OME and avoid increasing dosages to > 90 OME daily in most circumstances.5,20 Our finding that participants taking higher dosages of opioids were not more likely to have better control over their pain supports this recommendation.
Limitations
This study has several limitations, the most significant is its small sample size because of the exploratory nature of the project. Results are based on a small pilot sample enriched to include individuals with at least moderate pain who receive opioids frequently at 1 VA CLC-PAC unit; therefore, the results might not be representative of all veterans or a more general population. Our small sample size limits power to detect small differences. Data collected should be used to inform formal power calculations before subsequent larger studies to select adequate sample size. Validation studies, including samples from the same population using different dates, which reproduce findings are an important step. Moreover, we only had data on a single dimension of pain (intensity/severity), as measured by the pain scale, which nursing staff used to make a real-time clinical decision of whether to administer an as-needed opioid. Future studies should consider using pain measures that provide multidimensional assessment (ie, severity, functional interference) and/or were developed specifically for veterans, such as the Defense and Veterans Pain Rating Scale.21
Our study was cross-sectional in nature and addressed a single 24-hour period of data per participant. The years of data collection (2016 and 2017) followed a decline in overall opioid prescribing that has continued, likely influenced by CDC and VA/DoD guidelines.22 It is unclear whether our observations are an accurate reflection of individuals’ response over time or whether prescribing practices in PAC have shifted.
We did not consider the type of pain being treated or explore clinicians’ reasons for prescribing opioids, therefore limiting our ability to know whether opioids were indicated. Information regarding OUD and other SUDs was limited to what was documented in the chart during the CLC-PAC unit admission. We did not have information on length of exposure to opioids. It is possible that opioid tolerance could play a role in reducing opioid responsiveness. However, simple tolerance would not be expected to explain robust correlations with psychiatric comorbidities. Also, simple tolerance would be expected to be overcome with higher opioid dosages, whereas our study demonstrates less responsiveness. These data suggests that some individuals’ pain might be poorly opioid responsive, and psychiatric factors could increase this risk. We used a novel data source in combination with chart review; to our knowledge, barcode medication administration data have not been used in this manner previously. Future work needs to validate this method, using larger sample sizes and several clinical sites. Finally, we used regression models that controlled for average pre-opioid pain rating scores, which is only 1 covariate important for examining effects. Larger studies with adequate power should control for multiple covariates known to be associated with pain and opioid response.
Conclusions
Opioid responsiveness is important clinically yet challenging to assess. This pilot study identifies a way of classifying pain as relatively opioid nonresponsive using administrative data but requires further validation before considering scaling for more general use. The possibility that a substantial percentage of residents in a CLC-PAC unit could be receiving increasing dosages of opioids without adequate benefit justifies the need for more research and underscores the need for prescribers to assess individuals frequently for ongoing benefit of opioids regardless of diagnosis or mechanism of pain.
Acknowledgments
The authors thank Andrzej Galecki, Corey Powell, and the University of Michigan Consulting for Statistics, Computing and Analytics Research Center for assistance with statistical analysis.
1. Marshall TL, Reinhardt JP. Pain management in the last 6 months of life: predictors of opioid and non-opioid use. J Am Med Dir Assoc. 2019;20(6):789-790. doi:10.1016/j.jamda.2019.02.026
2. Tait RC, Chibnall JT. Pain in older subacute care patients: associations with clinical status and treatment. Pain Med. 2002;3(3):231-239. doi:10.1046/j.1526-4637.2002.02031.x
3. Pimentel CB, Briesacher BA, Gurwitz JH, Rosen AB, Pimentel MT, Lapane KL. Pain management in nursing home residents with cancer. J Am Geriatr Soc. 2015;63(4):633-641. doi:10.1111/jgs.13345
4. Hunnicutt JN, Tjia J, Lapane KL. Hospice use and pain management in elderly nursing home residents with cancer. J Pain Symptom Manage. 2017;53(3):561-570. doi:10.1016/j.jpainsymman.2016.10.369
5. Dowell D, Haegerich TM, Chou R. CDC guideline for prescribing opioids for chronic pain — United States, 2016. MMWR Recomm Rep. 2016;65(No. RR-1):1-49. doi:10.15585/mmwr.rr6501e1
6. Oliva EM, Bowe T, Tavakoli S, et al. Development and applications of the Veterans Health Administration’s Stratification Tool for Opioid Risk Mitigation (STORM) to improve opioid safety and prevent overdose and suicide. Psychol Serv. 2017;14(1):34-49. doi:10.1037/ser0000099
7. Goesling J, Moser SE, Lin LA, Hassett AL, Wasserman RA, Brummett CM. Discrepancies between perceived benefit of opioids and self-reported patient outcomes. Pain Med. 2018;19(2):297-306. doi:10.1093/pm/pnw263
8. Sullivan M, Von Korff M, Banta-Green C. Problems and concerns of patients receiving chronic opioid therapy for chronic non-cancer pain. Pain. 2010;149(2):345-353. doi:10.1016/j.pain.2010.02.037
9. Brennan PL, Greenbaum MA, Lemke S, Schutte KK. Mental health disorder, pain, and pain treatment among long-term care residents: evidence from the Minimum Data Set 3.0. Aging Ment Health. 2019;23(9):1146-1155. doi:10.1080/13607863.2018.1481922
10. Woo A, Lechner B, Fu T, et al. Cut points for mild, moderate, and severe pain among cancer and non-cancer patients: a literature review. Ann Palliat Med. 2015;4(4):176-183. doi:10.3978/j.issn.2224-5820.2015.09.04
11. Centers for Disease Control and Prevention. Calculating total daily dose of opioids for safer dosage. 2017. Accessed December 15, 2021. https://www.cdc.gov/drugoverdose/pdf/calculating_total_daily_dose-a.pdf
12. Nielsen S, Degenhardt L, Hoban B, Gisev N. Comparing opioids: a guide to estimating oral morphine equivalents (OME) in research. NDARC Technical Report No. 329. National Drug and Alcohol Research Centre; 2014. Accessed December 15, 2021. http://www.drugsandalcohol.ie/22703/1/NDARC Comparing opioids.pdf
13. Smith HS. Variations in opioid responsiveness. Pain Physician. 2008;11(2):237-248.
14. Collin E, Cesselin F. Neurobiological mechanisms of opioid tolerance and dependence. Clin Neuropharmacol. 1991;14(6):465-488. doi:10.1097/00002826-199112000-00001
15. Higgins C, Smith BH, Matthews K. Evidence of opioid-induced hyperalgesia in clinical populations after chronic opioid exposure: a systematic review and meta-analysis. Br J Anaesth. 2019;122(6):e114-e126. doi:10.1016/j.bja.2018.09.019
16. Howe CQ, Sullivan MD. The missing ‘P’ in pain management: how the current opioid epidemic highlights the need for psychiatric services in chronic pain care. Gen Hosp Psychiatry. 2014;36(1):99-104. doi:10.1016/j.genhosppsych.2013.10.003
17. Substance Abuse and Mental Health Services Administration. Key substance use and mental health indicators in the United States: results from the 2018 National Survey on Drug Use and Health. HHS Publ No PEP19-5068, NSDUH Ser H-54. 2019;170:51-58. Accessed December 15, 2021. https://www.samhsa.gov/data/sites/default/files/cbhsq-reports/NSDUHNationalFindingsReport2018/NSDUHNationalFindingsReport2018.pdf
18. World Health Organization. WHO’s cancer pain ladder for adults. Accessed September 21, 2018. www.who.int/ncds/management/palliative-care/Infographic-cancer-pain-lowres.pdf
19. Ballantyne JC, Kalso E, Stannard C. WHO analgesic ladder: a good concept gone astray. BMJ. 2016;352:i20. doi:10.1136/bmj.i20
20. The Opioid Therapy for Chronic Pain Work Group. VA/DoD clinical practice guideline for opioid therapy for chronic pain. US Dept of Veterans Affairs and Dept of Defense; 2017. Accessed December 15, 2021. https://www.healthquality.va.gov/guidelines/Pain/cot/VADoDOTCPG022717.pdf
21. Defense & Veterans Pain Rating Scale (DVPRS). Defense & Veterans Center for Integrative Pain Management. Accessed July 21, 2021. https://www.dvcipm.org/clinical-resources/defense-veterans-pain-rating-scale-dvprs/
22. Guy GP Jr, Zhang K, Bohm MK, et al. Vital signs: changes in opioid prescribing in the United States, 2006–2015. MMWR Morb Mortal Wkly Rep. 2017;66(26):697-704. doi:10.15585/mmwr.mm6626a4
1. Marshall TL, Reinhardt JP. Pain management in the last 6 months of life: predictors of opioid and non-opioid use. J Am Med Dir Assoc. 2019;20(6):789-790. doi:10.1016/j.jamda.2019.02.026
2. Tait RC, Chibnall JT. Pain in older subacute care patients: associations with clinical status and treatment. Pain Med. 2002;3(3):231-239. doi:10.1046/j.1526-4637.2002.02031.x
3. Pimentel CB, Briesacher BA, Gurwitz JH, Rosen AB, Pimentel MT, Lapane KL. Pain management in nursing home residents with cancer. J Am Geriatr Soc. 2015;63(4):633-641. doi:10.1111/jgs.13345
4. Hunnicutt JN, Tjia J, Lapane KL. Hospice use and pain management in elderly nursing home residents with cancer. J Pain Symptom Manage. 2017;53(3):561-570. doi:10.1016/j.jpainsymman.2016.10.369
5. Dowell D, Haegerich TM, Chou R. CDC guideline for prescribing opioids for chronic pain — United States, 2016. MMWR Recomm Rep. 2016;65(No. RR-1):1-49. doi:10.15585/mmwr.rr6501e1
6. Oliva EM, Bowe T, Tavakoli S, et al. Development and applications of the Veterans Health Administration’s Stratification Tool for Opioid Risk Mitigation (STORM) to improve opioid safety and prevent overdose and suicide. Psychol Serv. 2017;14(1):34-49. doi:10.1037/ser0000099
7. Goesling J, Moser SE, Lin LA, Hassett AL, Wasserman RA, Brummett CM. Discrepancies between perceived benefit of opioids and self-reported patient outcomes. Pain Med. 2018;19(2):297-306. doi:10.1093/pm/pnw263
8. Sullivan M, Von Korff M, Banta-Green C. Problems and concerns of patients receiving chronic opioid therapy for chronic non-cancer pain. Pain. 2010;149(2):345-353. doi:10.1016/j.pain.2010.02.037
9. Brennan PL, Greenbaum MA, Lemke S, Schutte KK. Mental health disorder, pain, and pain treatment among long-term care residents: evidence from the Minimum Data Set 3.0. Aging Ment Health. 2019;23(9):1146-1155. doi:10.1080/13607863.2018.1481922
10. Woo A, Lechner B, Fu T, et al. Cut points for mild, moderate, and severe pain among cancer and non-cancer patients: a literature review. Ann Palliat Med. 2015;4(4):176-183. doi:10.3978/j.issn.2224-5820.2015.09.04
11. Centers for Disease Control and Prevention. Calculating total daily dose of opioids for safer dosage. 2017. Accessed December 15, 2021. https://www.cdc.gov/drugoverdose/pdf/calculating_total_daily_dose-a.pdf
12. Nielsen S, Degenhardt L, Hoban B, Gisev N. Comparing opioids: a guide to estimating oral morphine equivalents (OME) in research. NDARC Technical Report No. 329. National Drug and Alcohol Research Centre; 2014. Accessed December 15, 2021. http://www.drugsandalcohol.ie/22703/1/NDARC Comparing opioids.pdf
13. Smith HS. Variations in opioid responsiveness. Pain Physician. 2008;11(2):237-248.
14. Collin E, Cesselin F. Neurobiological mechanisms of opioid tolerance and dependence. Clin Neuropharmacol. 1991;14(6):465-488. doi:10.1097/00002826-199112000-00001
15. Higgins C, Smith BH, Matthews K. Evidence of opioid-induced hyperalgesia in clinical populations after chronic opioid exposure: a systematic review and meta-analysis. Br J Anaesth. 2019;122(6):e114-e126. doi:10.1016/j.bja.2018.09.019
16. Howe CQ, Sullivan MD. The missing ‘P’ in pain management: how the current opioid epidemic highlights the need for psychiatric services in chronic pain care. Gen Hosp Psychiatry. 2014;36(1):99-104. doi:10.1016/j.genhosppsych.2013.10.003
17. Substance Abuse and Mental Health Services Administration. Key substance use and mental health indicators in the United States: results from the 2018 National Survey on Drug Use and Health. HHS Publ No PEP19-5068, NSDUH Ser H-54. 2019;170:51-58. Accessed December 15, 2021. https://www.samhsa.gov/data/sites/default/files/cbhsq-reports/NSDUHNationalFindingsReport2018/NSDUHNationalFindingsReport2018.pdf
18. World Health Organization. WHO’s cancer pain ladder for adults. Accessed September 21, 2018. www.who.int/ncds/management/palliative-care/Infographic-cancer-pain-lowres.pdf
19. Ballantyne JC, Kalso E, Stannard C. WHO analgesic ladder: a good concept gone astray. BMJ. 2016;352:i20. doi:10.1136/bmj.i20
20. The Opioid Therapy for Chronic Pain Work Group. VA/DoD clinical practice guideline for opioid therapy for chronic pain. US Dept of Veterans Affairs and Dept of Defense; 2017. Accessed December 15, 2021. https://www.healthquality.va.gov/guidelines/Pain/cot/VADoDOTCPG022717.pdf
21. Defense & Veterans Pain Rating Scale (DVPRS). Defense & Veterans Center for Integrative Pain Management. Accessed July 21, 2021. https://www.dvcipm.org/clinical-resources/defense-veterans-pain-rating-scale-dvprs/
22. Guy GP Jr, Zhang K, Bohm MK, et al. Vital signs: changes in opioid prescribing in the United States, 2006–2015. MMWR Morb Mortal Wkly Rep. 2017;66(26):697-704. doi:10.15585/mmwr.mm6626a4
“Fishy” papule
A biopsy was performed to exclude squamous cell carcinoma and an additional biopsy was sent for tissue culture for aerobic and acid-fast bacteria. The culture revealed a surprising diagnosis: cutaneous mycobacterium marinum.
Mycobacterium marinum is one of many nontuberculosis mycobacteria that may rarely cause infections in immunocompetent patients. M marinum is found worldwide in saltwater and freshwater. Infections may occur in individuals working in fisheries or fish markets, natural marine environments, or with aquariums. The infection may gain access through small, even unnoticed breaks in the skin. Papules, pustules, or abscesses caused by M marinum develop a few weeks after exposure and share many features with other common skin infections, including Staphylococcus aureus. Lymphatic involvement and sporotrichoid spread may occur. Immunocompromised patients can experience deeper involvement into tendons. Patients with significant soft tissue pain should undergo computed tomography, or preferably magnetic resonance imaging, to determine the extent of disease.
For immunocompetent patients and those with limited disease, as in this case, spontaneous resolution can occur after a year or more. However, because of the potential risk of more severe disease, treatment is recommended. M marinum is resistant to multiple antibiotics and there are no standardized treatment guidelines. Minocycline 100 mg bid for 3 weeks to 3 months is 1 accepted regimen for limited disease; treatment should be continued for 3 to 4 weeks following clinical resolution.1 Patients with more widespread disease benefit from evaluation by Infectious Diseases. Patients exposed to atypical mycobacteria may have false positive QuantiFERON-TB Gold tests that are commonly performed prior to biologic therapies.2
This patient achieved complete resolution of his signs and symptoms after receiving minocycline 100 mg bid for 6 weeks. He continues to fish recreationally.
Text courtesy of Jonathan Karnes, MD, medical director, MDFMR Dermatology Services, Augusta, ME. Photos courtesy of Jonathan Karnes, MD (copyright retained).
1. Rallis E, Koumantaki-Mathioudaki E. Treatment of Mycobacterium marinum cutaneous infections. Expert Opin Pharmacother. 2007;8:2965-2978. doi: 10.1517/14656566.8.17.2965
2. Gajurel K, Subramanian AK. False-positive QuantiFERON TB-Gold test due to Mycobacterium gordonae. Diagn Microbiol Infect Dis. 2016;84:315-317. doi: 10.1016/j.diagmicrobio.2015.10.020
A biopsy was performed to exclude squamous cell carcinoma and an additional biopsy was sent for tissue culture for aerobic and acid-fast bacteria. The culture revealed a surprising diagnosis: cutaneous mycobacterium marinum.
Mycobacterium marinum is one of many nontuberculosis mycobacteria that may rarely cause infections in immunocompetent patients. M marinum is found worldwide in saltwater and freshwater. Infections may occur in individuals working in fisheries or fish markets, natural marine environments, or with aquariums. The infection may gain access through small, even unnoticed breaks in the skin. Papules, pustules, or abscesses caused by M marinum develop a few weeks after exposure and share many features with other common skin infections, including Staphylococcus aureus. Lymphatic involvement and sporotrichoid spread may occur. Immunocompromised patients can experience deeper involvement into tendons. Patients with significant soft tissue pain should undergo computed tomography, or preferably magnetic resonance imaging, to determine the extent of disease.
For immunocompetent patients and those with limited disease, as in this case, spontaneous resolution can occur after a year or more. However, because of the potential risk of more severe disease, treatment is recommended. M marinum is resistant to multiple antibiotics and there are no standardized treatment guidelines. Minocycline 100 mg bid for 3 weeks to 3 months is 1 accepted regimen for limited disease; treatment should be continued for 3 to 4 weeks following clinical resolution.1 Patients with more widespread disease benefit from evaluation by Infectious Diseases. Patients exposed to atypical mycobacteria may have false positive QuantiFERON-TB Gold tests that are commonly performed prior to biologic therapies.2
This patient achieved complete resolution of his signs and symptoms after receiving minocycline 100 mg bid for 6 weeks. He continues to fish recreationally.
Text courtesy of Jonathan Karnes, MD, medical director, MDFMR Dermatology Services, Augusta, ME. Photos courtesy of Jonathan Karnes, MD (copyright retained).
A biopsy was performed to exclude squamous cell carcinoma and an additional biopsy was sent for tissue culture for aerobic and acid-fast bacteria. The culture revealed a surprising diagnosis: cutaneous mycobacterium marinum.
Mycobacterium marinum is one of many nontuberculosis mycobacteria that may rarely cause infections in immunocompetent patients. M marinum is found worldwide in saltwater and freshwater. Infections may occur in individuals working in fisheries or fish markets, natural marine environments, or with aquariums. The infection may gain access through small, even unnoticed breaks in the skin. Papules, pustules, or abscesses caused by M marinum develop a few weeks after exposure and share many features with other common skin infections, including Staphylococcus aureus. Lymphatic involvement and sporotrichoid spread may occur. Immunocompromised patients can experience deeper involvement into tendons. Patients with significant soft tissue pain should undergo computed tomography, or preferably magnetic resonance imaging, to determine the extent of disease.
For immunocompetent patients and those with limited disease, as in this case, spontaneous resolution can occur after a year or more. However, because of the potential risk of more severe disease, treatment is recommended. M marinum is resistant to multiple antibiotics and there are no standardized treatment guidelines. Minocycline 100 mg bid for 3 weeks to 3 months is 1 accepted regimen for limited disease; treatment should be continued for 3 to 4 weeks following clinical resolution.1 Patients with more widespread disease benefit from evaluation by Infectious Diseases. Patients exposed to atypical mycobacteria may have false positive QuantiFERON-TB Gold tests that are commonly performed prior to biologic therapies.2
This patient achieved complete resolution of his signs and symptoms after receiving minocycline 100 mg bid for 6 weeks. He continues to fish recreationally.
Text courtesy of Jonathan Karnes, MD, medical director, MDFMR Dermatology Services, Augusta, ME. Photos courtesy of Jonathan Karnes, MD (copyright retained).
1. Rallis E, Koumantaki-Mathioudaki E. Treatment of Mycobacterium marinum cutaneous infections. Expert Opin Pharmacother. 2007;8:2965-2978. doi: 10.1517/14656566.8.17.2965
2. Gajurel K, Subramanian AK. False-positive QuantiFERON TB-Gold test due to Mycobacterium gordonae. Diagn Microbiol Infect Dis. 2016;84:315-317. doi: 10.1016/j.diagmicrobio.2015.10.020
1. Rallis E, Koumantaki-Mathioudaki E. Treatment of Mycobacterium marinum cutaneous infections. Expert Opin Pharmacother. 2007;8:2965-2978. doi: 10.1517/14656566.8.17.2965
2. Gajurel K, Subramanian AK. False-positive QuantiFERON TB-Gold test due to Mycobacterium gordonae. Diagn Microbiol Infect Dis. 2016;84:315-317. doi: 10.1016/j.diagmicrobio.2015.10.020
Pollution levels linked to physical and mental health problems
Other analyses of data have found environmental air pollution from sources such as car exhaust and factory output can trigger an inflammatory response in the body. What’s new about a study published in RMD Open is that it explored an association between long-term exposure to pollution and risk of autoimmune diseases, wrote Giovanni Adami, MD, of the University of Verona (Italy) and colleagues.
“Environmental air pollution, according to the World Health Organization, is a major risk to health and 99% of the population worldwide is living in places where recommendations for air quality are not met,” said Dr. Adami in an interview. The limited data on the precise role of air pollution on rheumatic diseases in particular prompted the study, he said.
To explore the potential link between air pollution exposure and autoimmune disease, the researchers reviewed medical information from 81,363 adults via a national medical database in Italy; the data were submitted between June 2016 and November 2020.
The average age of the study population was 65 years, and 92% were women; 22% had at least one coexisting health condition. Each study participant was linked to local environmental monitoring via their residential postcode.
The researchers obtained details about concentrations of particulate matter in the environment from the Italian Institute of Environmental Protection that included 617 monitoring stations in 110 Italian provinces. They focused on concentrations of 10 and 2.5 (PM10 and PM2.5).
Exposure thresholds of 30 mcg/m3 for PM10 and 20 mcg/m3 for PM2.5 are generally considered harmful to health, they noted. On average, the long-term exposure was 16 mcg/m3 for PM2.5 and 25 mcg/m3 for PM10 between 2013 and 2019.
Overall, 9,723 individuals (12%) were diagnosed with an autoimmune disease between 2016 and 2020.
Exposure to PM10 was associated with a 7% higher risk of diagnosis with any autoimmune disease for every 10 mcg/m3 increase in concentration, but no association appeared between PM2.5 exposure and increased risk of autoimmune diseases.
However, in an adjusted model, chronic exposure to PM10 above 30 mcg/m3 and to PM2.5 above 20 mcg/m3 were associated with a 12% and 13% higher risk, respectively, of any autoimmune disease.
Chronic exposure to high levels of PM10 was specifically associated with a higher risk of rheumatoid arthritis, but no other autoimmune diseases. Chronic exposure to high levels of PM2.5 was associated with a higher risk of rheumatoid arthritis, connective tissue diseases, and inflammatory bowel diseases.
In their discussion, the researchers noted that the smaller diameter of PM2.5 molecules fluctuate less in response to rain and other weather, compared with PM10 molecules, which might make them a more accurate predictor of exposure to chronic air pollution.
The study findings were limited by several factors including the observational design, which prohibits the establishment of cause, and a lack of data on the start of symptoms and dates of diagnoses for autoimmune diseases, the researchers noted. Other limitations include the high percentage of older women in the study, which may limit generalizability, and the inability to account for additional personal exposure to pollutants outside of the environmental exposure, they said.
However, the results were strengthened by the large sample size and wide geographic distribution with variable pollution exposure, they said.
“Unfortunately, we were not surprised at all,” by the findings, Dr. Adami said in an interview.
“The biological rationale underpinning our findings is strong. Nevertheless, the magnitude of the effect was overwhelming. In addition, we saw an effect even at threshold of exposure that is widely considered as safe,” Dr. Adami noted.
Clinicians have been taught to consider cigarette smoking or other lifestyle behaviors as major risk factors for the development of several autoimmune diseases, said Dr. Adami. “In the future, we probably should include air pollution exposure as a risk factor as well. Interestingly, there is also accumulating evidence linking acute exposure to environmental air pollution with flares of chronic arthritis,” he said.
“Our study could have direct societal and political consequences,” and might help direct policy makers’ decisions on addressing strategies aimed to reduce fossil emissions, he said. As for additional research, “we certainly need multination studies to confirm our results on a larger scale,” Dr. Adami emphasized. “In addition, it is time to take action and start designing interventions aimed to reduce acute and chronic exposure to air pollution in patients suffering from RMDs.”
Consider the big picture of air quality
The Italian study is especially timely “given our evolving and emerging understanding of environmental risk factors for acute and chronic diseases, which we must first understand before we can address,” said Eileen Barrett, MD, of the University of New Mexico, Albuquerque, in an interview.

“I am largely surprised about the findings, as most physicians aren’t studying ambient air quality and risk for autoimmune disease,” said Dr. Barrett. “More often we think of air quality when we think of risk for respiratory diseases than autoimmune diseases, per se,” she said.
“There are several take-home messages from this study,” said Dr. Barrett. “The first is that we need more research to understand the consequences of air pollutants on health. Second, this study reminds us to think broadly about how air quality and our environment can affect health. And third, all clinicians should be committed to promoting science that can improve public health and reduce death and disability,” she emphasized.
The findings do not specifically reflect associations between pollution and other conditions such as chronic obstructive pulmonary disease and asthma although previous studies have shown an association between asthma and COPD exacerbations and air pollution, Dr. Barrett said.
“Further research will be needed to confirm the associations reported in this study,” Dr. Barrett said.
More research in other countries, including research related to other autoimmune diseases, and with other datasets on population and community level risks from poor air quality, would be helpful, and that information could be used to advise smart public policy, Dr. Barrett added.
Air pollution’s mental health impact
Air pollution’s effects extend beyond physical to the psychological, a new study of depression in teenagers showed. This study was published in Developmental Psychology.
Previous research on the environmental factors associated with depressive symptoms in teens has focused mainly on individual and family level contributors; the impact of the physical environment has not been well studied, the investigators, Erika M. Manczak, PhD, of the University of Denver and colleagues, wrote.
In their paper, the authors found a significant impact of neighborhood ozone exposure on the trajectory of depressive symptoms in teens over a 4-year period.
“Given that inhaling pollution activates biological pathways implicated in the development of depression, including immune, cardiovascular, and neurodevelopmental processes, exposure to ambient air pollution may influence the development and/or trajectory of depressive symptoms in youth,” they said.
The researchers recruited 213 adolescents in the San Francisco Bay area through local advertisements. The participants were aged 9-13 years at baseline, with an average age of 11 years. A total of 121 were female, 47% were white, 8.5% were African American, 12.3% were Asian, 10.4% were nonwhite Latin, and 21.7% were biracial or another ethnicity. The participants self-reported depressive symptoms and other psychopathology symptoms up to three times during the study period. Ozone exposure was calculated based on home addresses.
After controlling for other personal, family, and neighborhood variables, the researchers found that higher levels of ozone exposure were significantly associated with increased depressive symptoms over time, and the slope of trajectory of depressive symptoms became steeper as the ozone levels increased (P less than .001). Ozone did not significantly predict the trajectory of any other psychopathology symptoms.
“The results of this study provide preliminary support for the possibility that ozone is an overlooked contributor to the development or course of youth depressive symptoms,” the researchers wrote in their discussion.
“Interestingly, the association between ozone and symptom trajectories as measured by Anxious/Depressed subscale of the [Youth Self-Report] was not as strong as it was for the [Children’s Depression Inventory-Short Version] or Withdrawn/Depressed scales, suggesting that associations are more robust for behavioral withdrawal symptoms of depression than for other types of symptoms,” they noted.
The study findings were limited by the use of self-reports and by the inability of the study design to show causality, the researchers said. Other limitations include the use of average assessments of ozone that are less precise, lack of assessment of biological pathways for risk, lack of formal psychiatric diagnoses, and the small geographic region included in the study, they said.
However, the results provide preliminary evidence that ozone exposure is a potential contributing factor to depressive symptoms in youth, and serve as a jumping-off point for future research, they noted. Future studies should address changes in systemic inflammation, neurodevelopment, or stress reactivity, as well as concurrent psychosocial or biological factors, and temporal associations between air pollution and mental health symptoms, they concluded.
Environmental factors drive inflammatory responses
Peter L. Loper Jr., MD, considers the findings of the Developmental Psychology study to be unsurprising but important – because air pollution is simply getting worse.

“As the study authors cite, there is sufficient data correlating ozone to negative physical health outcomes in youth, but a paucity of data exploring the impact of poor air quality on mental health outcomes in this demographic,” noted Dr. Loper, of the University of South Carolina, Columbia, in an interview.
“As discussed by the study researchers, any environmental exposure that increases immune-mediated inflammation can result in negative health outcomes. In fact, there is already data to suggest that similar cytokines, or immune cell signalers, that get released by our immune system due to environmental exposures and that contribute to asthma, may also be implicated in depression and other mental health problems,” he noted.
“Just like downstream symptom indicators of physical illnesses such as asthma are secondary to immune-mediated pulmonary inflammation, downstream symptom indicators of mental illness, such as depression, are secondary to immune-mediated neuroinflammation,” Dr. Loper emphasized. “The most well-characterized upstream phenomenon perpetuating the downstream symptom indicators of depression involve neuroinflammatory states due to psychosocial and relational factors such as chronic stress, poor relationships, or substance use. However, any environmental factor that triggers an immune response and inflammation can promote neuroinflammation that manifests as symptoms of mental illness.”
The message for teens with depression and their families is that “we are a product of our environment,” Dr. Loper said. “When our environments are proinflammatory, or cause our immune system to become overactive, then we will develop illness; however, the most potent mediator of inflammation in the brain, and the downstream symptoms of depression, is our relationships with those we love most,” he said.
Dr. Loper suggested research aimed at identifying other sources of immune-mediated inflammation caused by physical environments and better understanding how environmental phenomenon like ozone may compound previously established risk factors for mental illness could be useful.
The RMD Open study received no outside funding, and its authors had no financial conflicts.
The Developmental Psychology study was supported by the National Institute of Mental Health and the Stanford University Precision Health and Integrated Diagnostics Center. The researchers for that report, and Dr. Loper and Dr. Barrett had no conflicts to disclose.
Other analyses of data have found environmental air pollution from sources such as car exhaust and factory output can trigger an inflammatory response in the body. What’s new about a study published in RMD Open is that it explored an association between long-term exposure to pollution and risk of autoimmune diseases, wrote Giovanni Adami, MD, of the University of Verona (Italy) and colleagues.
“Environmental air pollution, according to the World Health Organization, is a major risk to health and 99% of the population worldwide is living in places where recommendations for air quality are not met,” said Dr. Adami in an interview. The limited data on the precise role of air pollution on rheumatic diseases in particular prompted the study, he said.
To explore the potential link between air pollution exposure and autoimmune disease, the researchers reviewed medical information from 81,363 adults via a national medical database in Italy; the data were submitted between June 2016 and November 2020.
The average age of the study population was 65 years, and 92% were women; 22% had at least one coexisting health condition. Each study participant was linked to local environmental monitoring via their residential postcode.
The researchers obtained details about concentrations of particulate matter in the environment from the Italian Institute of Environmental Protection that included 617 monitoring stations in 110 Italian provinces. They focused on concentrations of 10 and 2.5 (PM10 and PM2.5).
Exposure thresholds of 30 mcg/m3 for PM10 and 20 mcg/m3 for PM2.5 are generally considered harmful to health, they noted. On average, the long-term exposure was 16 mcg/m3 for PM2.5 and 25 mcg/m3 for PM10 between 2013 and 2019.
Overall, 9,723 individuals (12%) were diagnosed with an autoimmune disease between 2016 and 2020.
Exposure to PM10 was associated with a 7% higher risk of diagnosis with any autoimmune disease for every 10 mcg/m3 increase in concentration, but no association appeared between PM2.5 exposure and increased risk of autoimmune diseases.
However, in an adjusted model, chronic exposure to PM10 above 30 mcg/m3 and to PM2.5 above 20 mcg/m3 were associated with a 12% and 13% higher risk, respectively, of any autoimmune disease.
Chronic exposure to high levels of PM10 was specifically associated with a higher risk of rheumatoid arthritis, but no other autoimmune diseases. Chronic exposure to high levels of PM2.5 was associated with a higher risk of rheumatoid arthritis, connective tissue diseases, and inflammatory bowel diseases.
In their discussion, the researchers noted that the smaller diameter of PM2.5 molecules fluctuate less in response to rain and other weather, compared with PM10 molecules, which might make them a more accurate predictor of exposure to chronic air pollution.
The study findings were limited by several factors including the observational design, which prohibits the establishment of cause, and a lack of data on the start of symptoms and dates of diagnoses for autoimmune diseases, the researchers noted. Other limitations include the high percentage of older women in the study, which may limit generalizability, and the inability to account for additional personal exposure to pollutants outside of the environmental exposure, they said.
However, the results were strengthened by the large sample size and wide geographic distribution with variable pollution exposure, they said.
“Unfortunately, we were not surprised at all,” by the findings, Dr. Adami said in an interview.
“The biological rationale underpinning our findings is strong. Nevertheless, the magnitude of the effect was overwhelming. In addition, we saw an effect even at threshold of exposure that is widely considered as safe,” Dr. Adami noted.
Clinicians have been taught to consider cigarette smoking or other lifestyle behaviors as major risk factors for the development of several autoimmune diseases, said Dr. Adami. “In the future, we probably should include air pollution exposure as a risk factor as well. Interestingly, there is also accumulating evidence linking acute exposure to environmental air pollution with flares of chronic arthritis,” he said.
“Our study could have direct societal and political consequences,” and might help direct policy makers’ decisions on addressing strategies aimed to reduce fossil emissions, he said. As for additional research, “we certainly need multination studies to confirm our results on a larger scale,” Dr. Adami emphasized. “In addition, it is time to take action and start designing interventions aimed to reduce acute and chronic exposure to air pollution in patients suffering from RMDs.”
Consider the big picture of air quality
The Italian study is especially timely “given our evolving and emerging understanding of environmental risk factors for acute and chronic diseases, which we must first understand before we can address,” said Eileen Barrett, MD, of the University of New Mexico, Albuquerque, in an interview.
“I am largely surprised about the findings, as most physicians aren’t studying ambient air quality and risk for autoimmune disease,” said Dr. Barrett. “More often we think of air quality when we think of risk for respiratory diseases than autoimmune diseases, per se,” she said.
“There are several take-home messages from this study,” said Dr. Barrett. “The first is that we need more research to understand the consequences of air pollutants on health. Second, this study reminds us to think broadly about how air quality and our environment can affect health. And third, all clinicians should be committed to promoting science that can improve public health and reduce death and disability,” she emphasized.
The findings do not specifically reflect associations between pollution and other conditions such as chronic obstructive pulmonary disease and asthma although previous studies have shown an association between asthma and COPD exacerbations and air pollution, Dr. Barrett said.
“Further research will be needed to confirm the associations reported in this study,” Dr. Barrett said.
More research in other countries, including research related to other autoimmune diseases, and with other datasets on population and community level risks from poor air quality, would be helpful, and that information could be used to advise smart public policy, Dr. Barrett added.
Air pollution’s mental health impact
Air pollution’s effects extend beyond physical to the psychological, a new study of depression in teenagers showed. This study was published in Developmental Psychology.
Previous research on the environmental factors associated with depressive symptoms in teens has focused mainly on individual and family level contributors; the impact of the physical environment has not been well studied, the investigators, Erika M. Manczak, PhD, of the University of Denver and colleagues, wrote.
In their paper, the authors found a significant impact of neighborhood ozone exposure on the trajectory of depressive symptoms in teens over a 4-year period.
“Given that inhaling pollution activates biological pathways implicated in the development of depression, including immune, cardiovascular, and neurodevelopmental processes, exposure to ambient air pollution may influence the development and/or trajectory of depressive symptoms in youth,” they said.
The researchers recruited 213 adolescents in the San Francisco Bay area through local advertisements. The participants were aged 9-13 years at baseline, with an average age of 11 years. A total of 121 were female, 47% were white, 8.5% were African American, 12.3% were Asian, 10.4% were nonwhite Latin, and 21.7% were biracial or another ethnicity. The participants self-reported depressive symptoms and other psychopathology symptoms up to three times during the study period. Ozone exposure was calculated based on home addresses.
After controlling for other personal, family, and neighborhood variables, the researchers found that higher levels of ozone exposure were significantly associated with increased depressive symptoms over time, and the slope of trajectory of depressive symptoms became steeper as the ozone levels increased (P less than .001). Ozone did not significantly predict the trajectory of any other psychopathology symptoms.
“The results of this study provide preliminary support for the possibility that ozone is an overlooked contributor to the development or course of youth depressive symptoms,” the researchers wrote in their discussion.
“Interestingly, the association between ozone and symptom trajectories as measured by Anxious/Depressed subscale of the [Youth Self-Report] was not as strong as it was for the [Children’s Depression Inventory-Short Version] or Withdrawn/Depressed scales, suggesting that associations are more robust for behavioral withdrawal symptoms of depression than for other types of symptoms,” they noted.
The study findings were limited by the use of self-reports and by the inability of the study design to show causality, the researchers said. Other limitations include the use of average assessments of ozone that are less precise, lack of assessment of biological pathways for risk, lack of formal psychiatric diagnoses, and the small geographic region included in the study, they said.
However, the results provide preliminary evidence that ozone exposure is a potential contributing factor to depressive symptoms in youth, and serve as a jumping-off point for future research, they noted. Future studies should address changes in systemic inflammation, neurodevelopment, or stress reactivity, as well as concurrent psychosocial or biological factors, and temporal associations between air pollution and mental health symptoms, they concluded.
Environmental factors drive inflammatory responses
Peter L. Loper Jr., MD, considers the findings of the Developmental Psychology study to be unsurprising but important – because air pollution is simply getting worse.
“As the study authors cite, there is sufficient data correlating ozone to negative physical health outcomes in youth, but a paucity of data exploring the impact of poor air quality on mental health outcomes in this demographic,” noted Dr. Loper, of the University of South Carolina, Columbia, in an interview.
“As discussed by the study researchers, any environmental exposure that increases immune-mediated inflammation can result in negative health outcomes. In fact, there is already data to suggest that similar cytokines, or immune cell signalers, that get released by our immune system due to environmental exposures and that contribute to asthma, may also be implicated in depression and other mental health problems,” he noted.
“Just like downstream symptom indicators of physical illnesses such as asthma are secondary to immune-mediated pulmonary inflammation, downstream symptom indicators of mental illness, such as depression, are secondary to immune-mediated neuroinflammation,” Dr. Loper emphasized. “The most well-characterized upstream phenomenon perpetuating the downstream symptom indicators of depression involve neuroinflammatory states due to psychosocial and relational factors such as chronic stress, poor relationships, or substance use. However, any environmental factor that triggers an immune response and inflammation can promote neuroinflammation that manifests as symptoms of mental illness.”
The message for teens with depression and their families is that “we are a product of our environment,” Dr. Loper said. “When our environments are proinflammatory, or cause our immune system to become overactive, then we will develop illness; however, the most potent mediator of inflammation in the brain, and the downstream symptoms of depression, is our relationships with those we love most,” he said.
Dr. Loper suggested research aimed at identifying other sources of immune-mediated inflammation caused by physical environments and better understanding how environmental phenomenon like ozone may compound previously established risk factors for mental illness could be useful.
The RMD Open study received no outside funding, and its authors had no financial conflicts.
The Developmental Psychology study was supported by the National Institute of Mental Health and the Stanford University Precision Health and Integrated Diagnostics Center. The researchers for that report, and Dr. Loper and Dr. Barrett had no conflicts to disclose.
Other analyses of data have found environmental air pollution from sources such as car exhaust and factory output can trigger an inflammatory response in the body. What’s new about a study published in RMD Open is that it explored an association between long-term exposure to pollution and risk of autoimmune diseases, wrote Giovanni Adami, MD, of the University of Verona (Italy) and colleagues.
“Environmental air pollution, according to the World Health Organization, is a major risk to health and 99% of the population worldwide is living in places where recommendations for air quality are not met,” said Dr. Adami in an interview. The limited data on the precise role of air pollution on rheumatic diseases in particular prompted the study, he said.
To explore the potential link between air pollution exposure and autoimmune disease, the researchers reviewed medical information from 81,363 adults via a national medical database in Italy; the data were submitted between June 2016 and November 2020.
The average age of the study population was 65 years, and 92% were women; 22% had at least one coexisting health condition. Each study participant was linked to local environmental monitoring via their residential postcode.
The researchers obtained details about concentrations of particulate matter in the environment from the Italian Institute of Environmental Protection that included 617 monitoring stations in 110 Italian provinces. They focused on concentrations of 10 and 2.5 (PM10 and PM2.5).
Exposure thresholds of 30 mcg/m3 for PM10 and 20 mcg/m3 for PM2.5 are generally considered harmful to health, they noted. On average, the long-term exposure was 16 mcg/m3 for PM2.5 and 25 mcg/m3 for PM10 between 2013 and 2019.
Overall, 9,723 individuals (12%) were diagnosed with an autoimmune disease between 2016 and 2020.
Exposure to PM10 was associated with a 7% higher risk of diagnosis with any autoimmune disease for every 10 mcg/m3 increase in concentration, but no association appeared between PM2.5 exposure and increased risk of autoimmune diseases.
However, in an adjusted model, chronic exposure to PM10 above 30 mcg/m3 and to PM2.5 above 20 mcg/m3 were associated with a 12% and 13% higher risk, respectively, of any autoimmune disease.
Chronic exposure to high levels of PM10 was specifically associated with a higher risk of rheumatoid arthritis, but no other autoimmune diseases. Chronic exposure to high levels of PM2.5 was associated with a higher risk of rheumatoid arthritis, connective tissue diseases, and inflammatory bowel diseases.
In their discussion, the researchers noted that the smaller diameter of PM2.5 molecules fluctuate less in response to rain and other weather, compared with PM10 molecules, which might make them a more accurate predictor of exposure to chronic air pollution.
The study findings were limited by several factors including the observational design, which prohibits the establishment of cause, and a lack of data on the start of symptoms and dates of diagnoses for autoimmune diseases, the researchers noted. Other limitations include the high percentage of older women in the study, which may limit generalizability, and the inability to account for additional personal exposure to pollutants outside of the environmental exposure, they said.
However, the results were strengthened by the large sample size and wide geographic distribution with variable pollution exposure, they said.
“Unfortunately, we were not surprised at all,” by the findings, Dr. Adami said in an interview.
“The biological rationale underpinning our findings is strong. Nevertheless, the magnitude of the effect was overwhelming. In addition, we saw an effect even at threshold of exposure that is widely considered as safe,” Dr. Adami noted.
Clinicians have been taught to consider cigarette smoking or other lifestyle behaviors as major risk factors for the development of several autoimmune diseases, said Dr. Adami. “In the future, we probably should include air pollution exposure as a risk factor as well. Interestingly, there is also accumulating evidence linking acute exposure to environmental air pollution with flares of chronic arthritis,” he said.
“Our study could have direct societal and political consequences,” and might help direct policy makers’ decisions on addressing strategies aimed to reduce fossil emissions, he said. As for additional research, “we certainly need multination studies to confirm our results on a larger scale,” Dr. Adami emphasized. “In addition, it is time to take action and start designing interventions aimed to reduce acute and chronic exposure to air pollution in patients suffering from RMDs.”
Consider the big picture of air quality
The Italian study is especially timely “given our evolving and emerging understanding of environmental risk factors for acute and chronic diseases, which we must first understand before we can address,” said Eileen Barrett, MD, of the University of New Mexico, Albuquerque, in an interview.
“I am largely surprised about the findings, as most physicians aren’t studying ambient air quality and risk for autoimmune disease,” said Dr. Barrett. “More often we think of air quality when we think of risk for respiratory diseases than autoimmune diseases, per se,” she said.
“There are several take-home messages from this study,” said Dr. Barrett. “The first is that we need more research to understand the consequences of air pollutants on health. Second, this study reminds us to think broadly about how air quality and our environment can affect health. And third, all clinicians should be committed to promoting science that can improve public health and reduce death and disability,” she emphasized.
The findings do not specifically reflect associations between pollution and other conditions such as chronic obstructive pulmonary disease and asthma although previous studies have shown an association between asthma and COPD exacerbations and air pollution, Dr. Barrett said.
“Further research will be needed to confirm the associations reported in this study,” Dr. Barrett said.
More research in other countries, including research related to other autoimmune diseases, and with other datasets on population and community level risks from poor air quality, would be helpful, and that information could be used to advise smart public policy, Dr. Barrett added.
Air pollution’s mental health impact
Air pollution’s effects extend beyond physical to the psychological, a new study of depression in teenagers showed. This study was published in Developmental Psychology.
Previous research on the environmental factors associated with depressive symptoms in teens has focused mainly on individual and family level contributors; the impact of the physical environment has not been well studied, the investigators, Erika M. Manczak, PhD, of the University of Denver and colleagues, wrote.
In their paper, the authors found a significant impact of neighborhood ozone exposure on the trajectory of depressive symptoms in teens over a 4-year period.
“Given that inhaling pollution activates biological pathways implicated in the development of depression, including immune, cardiovascular, and neurodevelopmental processes, exposure to ambient air pollution may influence the development and/or trajectory of depressive symptoms in youth,” they said.
The researchers recruited 213 adolescents in the San Francisco Bay area through local advertisements. The participants were aged 9-13 years at baseline, with an average age of 11 years. A total of 121 were female, 47% were white, 8.5% were African American, 12.3% were Asian, 10.4% were nonwhite Latin, and 21.7% were biracial or another ethnicity. The participants self-reported depressive symptoms and other psychopathology symptoms up to three times during the study period. Ozone exposure was calculated based on home addresses.
After controlling for other personal, family, and neighborhood variables, the researchers found that higher levels of ozone exposure were significantly associated with increased depressive symptoms over time, and the slope of trajectory of depressive symptoms became steeper as the ozone levels increased (P less than .001). Ozone did not significantly predict the trajectory of any other psychopathology symptoms.
“The results of this study provide preliminary support for the possibility that ozone is an overlooked contributor to the development or course of youth depressive symptoms,” the researchers wrote in their discussion.
“Interestingly, the association between ozone and symptom trajectories as measured by Anxious/Depressed subscale of the [Youth Self-Report] was not as strong as it was for the [Children’s Depression Inventory-Short Version] or Withdrawn/Depressed scales, suggesting that associations are more robust for behavioral withdrawal symptoms of depression than for other types of symptoms,” they noted.
The study findings were limited by the use of self-reports and by the inability of the study design to show causality, the researchers said. Other limitations include the use of average assessments of ozone that are less precise, lack of assessment of biological pathways for risk, lack of formal psychiatric diagnoses, and the small geographic region included in the study, they said.
However, the results provide preliminary evidence that ozone exposure is a potential contributing factor to depressive symptoms in youth, and serve as a jumping-off point for future research, they noted. Future studies should address changes in systemic inflammation, neurodevelopment, or stress reactivity, as well as concurrent psychosocial or biological factors, and temporal associations between air pollution and mental health symptoms, they concluded.
Environmental factors drive inflammatory responses
Peter L. Loper Jr., MD, considers the findings of the Developmental Psychology study to be unsurprising but important – because air pollution is simply getting worse.
“As the study authors cite, there is sufficient data correlating ozone to negative physical health outcomes in youth, but a paucity of data exploring the impact of poor air quality on mental health outcomes in this demographic,” noted Dr. Loper, of the University of South Carolina, Columbia, in an interview.
“As discussed by the study researchers, any environmental exposure that increases immune-mediated inflammation can result in negative health outcomes. In fact, there is already data to suggest that similar cytokines, or immune cell signalers, that get released by our immune system due to environmental exposures and that contribute to asthma, may also be implicated in depression and other mental health problems,” he noted.
“Just like downstream symptom indicators of physical illnesses such as asthma are secondary to immune-mediated pulmonary inflammation, downstream symptom indicators of mental illness, such as depression, are secondary to immune-mediated neuroinflammation,” Dr. Loper emphasized. “The most well-characterized upstream phenomenon perpetuating the downstream symptom indicators of depression involve neuroinflammatory states due to psychosocial and relational factors such as chronic stress, poor relationships, or substance use. However, any environmental factor that triggers an immune response and inflammation can promote neuroinflammation that manifests as symptoms of mental illness.”
The message for teens with depression and their families is that “we are a product of our environment,” Dr. Loper said. “When our environments are proinflammatory, or cause our immune system to become overactive, then we will develop illness; however, the most potent mediator of inflammation in the brain, and the downstream symptoms of depression, is our relationships with those we love most,” he said.
Dr. Loper suggested research aimed at identifying other sources of immune-mediated inflammation caused by physical environments and better understanding how environmental phenomenon like ozone may compound previously established risk factors for mental illness could be useful.
The RMD Open study received no outside funding, and its authors had no financial conflicts.
The Developmental Psychology study was supported by the National Institute of Mental Health and the Stanford University Precision Health and Integrated Diagnostics Center. The researchers for that report, and Dr. Loper and Dr. Barrett had no conflicts to disclose.
FROM RMD OPEN

Cardiologists say rights to maternity leave violated
A survey of 323 women cardiologists who were working while they were pregnant showed that nearly 75% experienced discriminatory maternity-leave practices, some of which were likely violations of the Family and Medical Leave Act (FMLA).
More than 40% saw their salaries decreased during their year of pregnancy, 38% were required to perform extra service or call before taking maternity leave, exposing them to occupational hazards such as radiation, and 40% experienced a pregnancy complication, significantly higher than the general population and other medical specialties.

Additionally, of those who performed extra service or call, 18% were placed on bedrest before delivery, compared with 7.4% who did not perform extra service or call.
More than half of respondents reported that pregnancy negatively impacted their careers, and 42.4% said they experienced pressure to return to work and a delay in promotions, both illegal practices under the FMLA.
The survey is published in the Journal of the American College of Cardiology.
“Childbearing is difficult for women in cardiology with more than double the rate of gestational complications of the U.S. population, frequent income loss out of proportion to reduced productivity, and for nearly half, has an adverse impact on their career,” lead author Martha Gulati, MD, University of Arizona, Phoenix, said in a statement.
“While many professions struggle to create environments supportive of pregnancy and child-rearing, the prevalence of illegal behavior in cardiology is quite high and presents substantial legal risk for employers,” Dr. Gulati added.
C. Noel Bairey Merz, MD, professor of cardiology at Cedars-Sinai Smidt Heart Institute, Los Angeles, and a coauthor of the survey, told this news organization that it’s not surprising that such a situation exists, even “in this day and age.”

“I’m not surprised as a woman in cardiology myself. I was told by my training director that if I took off more than my allowed sick leave when I had my first and second children, I would have to repeat the year of training, so not surprised at all. I hear this from colleagues all the time,” Dr. Bairey Merz said.
The exchange left her feeling fearful for her career.
“Who wants to repeat a year? It pushes you back from a career standpoint, financially, everything. It also made me angry. I had a colleague who busted his leg in a motorcycle accident. He was unable to do any procedures for 16 weeks, and he didn’t have to repeat the year,” she pointed out.
The challenge that pregnancy represents is frequently cited by women as a deterrent for applying for a cardiology fellowship, Laxmi S. Mehta, MD, Ohio State University, Columbus, and colleagues wrote in an accompanying editorial.
The findings from the survey “reveal restrictive maternity leave data in a profession that has historically and currently continues to have a diversity problem,” they wrote.
“Maternity and pregnancy issues are a thing in cardiology,” Dr. Mehta said in an interview. “It’s one of the reasons why women get deterred from going into the field. It makes it challenging to choose cardiology if you perceive that the culture is negative, that it’s hard to be pregnant, or to bear children, or to take care of them post partum. It is problematic and it should not be occurring now.”
Leadership that condones such restrictive policies or even promotes them through ignorance and inaction needs to be held accountable, she added.

“We need to move forward from this negativity and make it more warm and welcoming to have families, whether you are a trainee or a practicing cardiologist, male or female. We need transparent and consistent parental leave policies and things like lactation support when a woman returns to work. That is a big issue,” Dr. Mehta said.
Having cardiovascular leaders champion the cause of adequate maternity and paternity leave are crucial to creating a newer, inclusive environment in cardiology.
As an example, Dr. Mehta recounted her own experience when she was in training 17 years ago.
“When I interviewed for a cardiology fellowship, one of the female program directors asked me if I was planning to have children, because if I did, the other fellows wouldn’t like it if they had to cover for me,” she said. “I ended up doing my fellowship where the chief of cardiology encouraged me to have children. He said: ‘Have your children during training, we will support you.’ And he did. I still had to do all of the call make-up and that stuff, but I worked in a supportive environment, and it made all the difference.”
“It’s about allyship,” she added. “You will have some people who are supportive and some who are not, but when you have the chief supporting you, you have a strong ally.”
The researchers suggest that one strategy is to temporarily replace cardiologists on maternity leave with locums, or “deepen the bench of coverage for clinical work, as is done for other absences. Given the expanding coverage of parental and family medical leaves, and awareness of these issues nationally, the need for this is likely to become less of an exception and more the rule.”
For example, nine states and Washington, D.C. now provide paid parental leave, they wrote, “and there is pending legislation in others.”
Dr. Bairey Merz and Dr. Mehta reported no relevant financial relationships.
A version of this article first appeared on Medscape.com.
A survey of 323 women cardiologists who were working while they were pregnant showed that nearly 75% experienced discriminatory maternity-leave practices, some of which were likely violations of the Family and Medical Leave Act (FMLA).
More than 40% saw their salaries decreased during their year of pregnancy, 38% were required to perform extra service or call before taking maternity leave, exposing them to occupational hazards such as radiation, and 40% experienced a pregnancy complication, significantly higher than the general population and other medical specialties.
Additionally, of those who performed extra service or call, 18% were placed on bedrest before delivery, compared with 7.4% who did not perform extra service or call.
More than half of respondents reported that pregnancy negatively impacted their careers, and 42.4% said they experienced pressure to return to work and a delay in promotions, both illegal practices under the FMLA.
The survey is published in the Journal of the American College of Cardiology.
“Childbearing is difficult for women in cardiology with more than double the rate of gestational complications of the U.S. population, frequent income loss out of proportion to reduced productivity, and for nearly half, has an adverse impact on their career,” lead author Martha Gulati, MD, University of Arizona, Phoenix, said in a statement.
“While many professions struggle to create environments supportive of pregnancy and child-rearing, the prevalence of illegal behavior in cardiology is quite high and presents substantial legal risk for employers,” Dr. Gulati added.
C. Noel Bairey Merz, MD, professor of cardiology at Cedars-Sinai Smidt Heart Institute, Los Angeles, and a coauthor of the survey, told this news organization that it’s not surprising that such a situation exists, even “in this day and age.”
“I’m not surprised as a woman in cardiology myself. I was told by my training director that if I took off more than my allowed sick leave when I had my first and second children, I would have to repeat the year of training, so not surprised at all. I hear this from colleagues all the time,” Dr. Bairey Merz said.
The exchange left her feeling fearful for her career.
“Who wants to repeat a year? It pushes you back from a career standpoint, financially, everything. It also made me angry. I had a colleague who busted his leg in a motorcycle accident. He was unable to do any procedures for 16 weeks, and he didn’t have to repeat the year,” she pointed out.
The challenge that pregnancy represents is frequently cited by women as a deterrent for applying for a cardiology fellowship, Laxmi S. Mehta, MD, Ohio State University, Columbus, and colleagues wrote in an accompanying editorial.
The findings from the survey “reveal restrictive maternity leave data in a profession that has historically and currently continues to have a diversity problem,” they wrote.
“Maternity and pregnancy issues are a thing in cardiology,” Dr. Mehta said in an interview. “It’s one of the reasons why women get deterred from going into the field. It makes it challenging to choose cardiology if you perceive that the culture is negative, that it’s hard to be pregnant, or to bear children, or to take care of them post partum. It is problematic and it should not be occurring now.”
Leadership that condones such restrictive policies or even promotes them through ignorance and inaction needs to be held accountable, she added.
“We need to move forward from this negativity and make it more warm and welcoming to have families, whether you are a trainee or a practicing cardiologist, male or female. We need transparent and consistent parental leave policies and things like lactation support when a woman returns to work. That is a big issue,” Dr. Mehta said.
Having cardiovascular leaders champion the cause of adequate maternity and paternity leave are crucial to creating a newer, inclusive environment in cardiology.
As an example, Dr. Mehta recounted her own experience when she was in training 17 years ago.
“When I interviewed for a cardiology fellowship, one of the female program directors asked me if I was planning to have children, because if I did, the other fellows wouldn’t like it if they had to cover for me,” she said. “I ended up doing my fellowship where the chief of cardiology encouraged me to have children. He said: ‘Have your children during training, we will support you.’ And he did. I still had to do all of the call make-up and that stuff, but I worked in a supportive environment, and it made all the difference.”
“It’s about allyship,” she added. “You will have some people who are supportive and some who are not, but when you have the chief supporting you, you have a strong ally.”
The researchers suggest that one strategy is to temporarily replace cardiologists on maternity leave with locums, or “deepen the bench of coverage for clinical work, as is done for other absences. Given the expanding coverage of parental and family medical leaves, and awareness of these issues nationally, the need for this is likely to become less of an exception and more the rule.”
For example, nine states and Washington, D.C. now provide paid parental leave, they wrote, “and there is pending legislation in others.”
Dr. Bairey Merz and Dr. Mehta reported no relevant financial relationships.
A version of this article first appeared on Medscape.com.
A survey of 323 women cardiologists who were working while they were pregnant showed that nearly 75% experienced discriminatory maternity-leave practices, some of which were likely violations of the Family and Medical Leave Act (FMLA).
More than 40% saw their salaries decreased during their year of pregnancy, 38% were required to perform extra service or call before taking maternity leave, exposing them to occupational hazards such as radiation, and 40% experienced a pregnancy complication, significantly higher than the general population and other medical specialties.
Additionally, of those who performed extra service or call, 18% were placed on bedrest before delivery, compared with 7.4% who did not perform extra service or call.
More than half of respondents reported that pregnancy negatively impacted their careers, and 42.4% said they experienced pressure to return to work and a delay in promotions, both illegal practices under the FMLA.
The survey is published in the Journal of the American College of Cardiology.
“Childbearing is difficult for women in cardiology with more than double the rate of gestational complications of the U.S. population, frequent income loss out of proportion to reduced productivity, and for nearly half, has an adverse impact on their career,” lead author Martha Gulati, MD, University of Arizona, Phoenix, said in a statement.
“While many professions struggle to create environments supportive of pregnancy and child-rearing, the prevalence of illegal behavior in cardiology is quite high and presents substantial legal risk for employers,” Dr. Gulati added.
C. Noel Bairey Merz, MD, professor of cardiology at Cedars-Sinai Smidt Heart Institute, Los Angeles, and a coauthor of the survey, told this news organization that it’s not surprising that such a situation exists, even “in this day and age.”
“I’m not surprised as a woman in cardiology myself. I was told by my training director that if I took off more than my allowed sick leave when I had my first and second children, I would have to repeat the year of training, so not surprised at all. I hear this from colleagues all the time,” Dr. Bairey Merz said.
The exchange left her feeling fearful for her career.
“Who wants to repeat a year? It pushes you back from a career standpoint, financially, everything. It also made me angry. I had a colleague who busted his leg in a motorcycle accident. He was unable to do any procedures for 16 weeks, and he didn’t have to repeat the year,” she pointed out.
The challenge that pregnancy represents is frequently cited by women as a deterrent for applying for a cardiology fellowship, Laxmi S. Mehta, MD, Ohio State University, Columbus, and colleagues wrote in an accompanying editorial.
The findings from the survey “reveal restrictive maternity leave data in a profession that has historically and currently continues to have a diversity problem,” they wrote.
“Maternity and pregnancy issues are a thing in cardiology,” Dr. Mehta said in an interview. “It’s one of the reasons why women get deterred from going into the field. It makes it challenging to choose cardiology if you perceive that the culture is negative, that it’s hard to be pregnant, or to bear children, or to take care of them post partum. It is problematic and it should not be occurring now.”
Leadership that condones such restrictive policies or even promotes them through ignorance and inaction needs to be held accountable, she added.
“We need to move forward from this negativity and make it more warm and welcoming to have families, whether you are a trainee or a practicing cardiologist, male or female. We need transparent and consistent parental leave policies and things like lactation support when a woman returns to work. That is a big issue,” Dr. Mehta said.
Having cardiovascular leaders champion the cause of adequate maternity and paternity leave are crucial to creating a newer, inclusive environment in cardiology.
As an example, Dr. Mehta recounted her own experience when she was in training 17 years ago.
“When I interviewed for a cardiology fellowship, one of the female program directors asked me if I was planning to have children, because if I did, the other fellows wouldn’t like it if they had to cover for me,” she said. “I ended up doing my fellowship where the chief of cardiology encouraged me to have children. He said: ‘Have your children during training, we will support you.’ And he did. I still had to do all of the call make-up and that stuff, but I worked in a supportive environment, and it made all the difference.”
“It’s about allyship,” she added. “You will have some people who are supportive and some who are not, but when you have the chief supporting you, you have a strong ally.”
The researchers suggest that one strategy is to temporarily replace cardiologists on maternity leave with locums, or “deepen the bench of coverage for clinical work, as is done for other absences. Given the expanding coverage of parental and family medical leaves, and awareness of these issues nationally, the need for this is likely to become less of an exception and more the rule.”
For example, nine states and Washington, D.C. now provide paid parental leave, they wrote, “and there is pending legislation in others.”
Dr. Bairey Merz and Dr. Mehta reported no relevant financial relationships.
A version of this article first appeared on Medscape.com.
FROM THE JOURNAL OF THE AMERICAN COLLEGE OF CARDIOLOGY

As predicted: jump in metastatic prostate cancer diagnoses
men with the prostate-specific antigen (PSA), shows a report published online in JAMA Network Open.
It was a consequence that many experts in prostate cancer predicted at the time the recommendation was made – initially in 2008 against routine screening in men older than 75 years, then in all men in 2012.
The thinking was that the harms of screening all men – leading to unnecessary prostatectomies and other treatments in many men – outweighed the benefits of catching early high-risk disease in fewer men. Screening rates plummeted as a result.
But experts in prostate cancer warned that the move, while reducing overdiagnosis and overtreatment, would have the unfortunate consequence of underdiagnosis and, consequently, nondetection of the cases of prostate cancer that would spread.
The new findings are the latest to suggest that this is, in fact, what happened, and echo similar findings previously reported by this news organization.
For this study, investigators at the University of Southern California, Los Angeles, analyzed the incidence of metastatic prostate cancer (mPCa) in the Surveillance, Epidemiology, and End Results (SEER) database from 2004-2018, with 2018 being the latest data available.
SEER captures about 28% of the U.S. population and recorded almost 50,000 new mPCa cases over the period.
Among men 45-75 years old, the incidence of mPCa increased 41% from when USPSTF recommended against screening through 2018, which translated to an annual percentage change (APC) of 5.3%.
Among men 75 years and older, mPCa rates jumped 43% through 2018, an APC of 6.5%.
The researchers did not find an increase in deaths from prostate cancer, but given the 5-7 years median survival, it might be too early to tell.
“The observation of a rising incidence of mPCa in itself does not imply that screening practices should be changed. The overall risk versus benefit of PSA-based screening is extremely complex and must take into account various other factors that impact the overall health of the community,” say investigators, led by Mihir Desai, MD, a clinical urology professor at USC.
However, screening practices have already changed. The USPSTF withdrew its objections to screening in 2018 and instead recommended personalized decisionmaking for men 55-69 years old, citing new evidence that screening prevents metastatic disease and reduces PCa mortality more than previously recognized, Richard Hoffman, MD, MPH, an internal medicine professor at the University of Iowa, Iowa City, said in an accompanying editorial.
The study’s trends in mPCa “might be transitory because the screening guidelines have” changed, Dr. Hoffman writes.
For now, clinicians should “consistently address screening with men who are healthy enough to benefit” from catching dangerous tumors early and engage them “in shared decisionmaking discussions to” strike the right balance between minimizing overdiagnosis and catching high-risk tumors before they spread, he said.
Easier said than done, but the field is advancing. Active surveillance, instead of surgery, for what seem to be low-risk tumors is one step in the right direction, Dr. Hoffman commented.
No external funding was reported. Dr. Desai is a consultant for Procept Biorobotics and Auris Surgical. Dr. Hoffman reported royalties from UpToDate and fees from law firms as an expert witness on prostate cancer screening cases.
A version of this article first appeared on Medscape.com.
men with the prostate-specific antigen (PSA), shows a report published online in JAMA Network Open.
It was a consequence that many experts in prostate cancer predicted at the time the recommendation was made – initially in 2008 against routine screening in men older than 75 years, then in all men in 2012.
The thinking was that the harms of screening all men – leading to unnecessary prostatectomies and other treatments in many men – outweighed the benefits of catching early high-risk disease in fewer men. Screening rates plummeted as a result.
But experts in prostate cancer warned that the move, while reducing overdiagnosis and overtreatment, would have the unfortunate consequence of underdiagnosis and, consequently, nondetection of the cases of prostate cancer that would spread.
The new findings are the latest to suggest that this is, in fact, what happened, and echo similar findings previously reported by this news organization.
For this study, investigators at the University of Southern California, Los Angeles, analyzed the incidence of metastatic prostate cancer (mPCa) in the Surveillance, Epidemiology, and End Results (SEER) database from 2004-2018, with 2018 being the latest data available.
SEER captures about 28% of the U.S. population and recorded almost 50,000 new mPCa cases over the period.
Among men 45-75 years old, the incidence of mPCa increased 41% from when USPSTF recommended against screening through 2018, which translated to an annual percentage change (APC) of 5.3%.
Among men 75 years and older, mPCa rates jumped 43% through 2018, an APC of 6.5%.
The researchers did not find an increase in deaths from prostate cancer, but given the 5-7 years median survival, it might be too early to tell.
“The observation of a rising incidence of mPCa in itself does not imply that screening practices should be changed. The overall risk versus benefit of PSA-based screening is extremely complex and must take into account various other factors that impact the overall health of the community,” say investigators, led by Mihir Desai, MD, a clinical urology professor at USC.
However, screening practices have already changed. The USPSTF withdrew its objections to screening in 2018 and instead recommended personalized decisionmaking for men 55-69 years old, citing new evidence that screening prevents metastatic disease and reduces PCa mortality more than previously recognized, Richard Hoffman, MD, MPH, an internal medicine professor at the University of Iowa, Iowa City, said in an accompanying editorial.
The study’s trends in mPCa “might be transitory because the screening guidelines have” changed, Dr. Hoffman writes.
For now, clinicians should “consistently address screening with men who are healthy enough to benefit” from catching dangerous tumors early and engage them “in shared decisionmaking discussions to” strike the right balance between minimizing overdiagnosis and catching high-risk tumors before they spread, he said.
Easier said than done, but the field is advancing. Active surveillance, instead of surgery, for what seem to be low-risk tumors is one step in the right direction, Dr. Hoffman commented.
No external funding was reported. Dr. Desai is a consultant for Procept Biorobotics and Auris Surgical. Dr. Hoffman reported royalties from UpToDate and fees from law firms as an expert witness on prostate cancer screening cases.
A version of this article first appeared on Medscape.com.
men with the prostate-specific antigen (PSA), shows a report published online in JAMA Network Open.
It was a consequence that many experts in prostate cancer predicted at the time the recommendation was made – initially in 2008 against routine screening in men older than 75 years, then in all men in 2012.
The thinking was that the harms of screening all men – leading to unnecessary prostatectomies and other treatments in many men – outweighed the benefits of catching early high-risk disease in fewer men. Screening rates plummeted as a result.
But experts in prostate cancer warned that the move, while reducing overdiagnosis and overtreatment, would have the unfortunate consequence of underdiagnosis and, consequently, nondetection of the cases of prostate cancer that would spread.
The new findings are the latest to suggest that this is, in fact, what happened, and echo similar findings previously reported by this news organization.
For this study, investigators at the University of Southern California, Los Angeles, analyzed the incidence of metastatic prostate cancer (mPCa) in the Surveillance, Epidemiology, and End Results (SEER) database from 2004-2018, with 2018 being the latest data available.
SEER captures about 28% of the U.S. population and recorded almost 50,000 new mPCa cases over the period.
Among men 45-75 years old, the incidence of mPCa increased 41% from when USPSTF recommended against screening through 2018, which translated to an annual percentage change (APC) of 5.3%.
Among men 75 years and older, mPCa rates jumped 43% through 2018, an APC of 6.5%.
The researchers did not find an increase in deaths from prostate cancer, but given the 5-7 years median survival, it might be too early to tell.
“The observation of a rising incidence of mPCa in itself does not imply that screening practices should be changed. The overall risk versus benefit of PSA-based screening is extremely complex and must take into account various other factors that impact the overall health of the community,” say investigators, led by Mihir Desai, MD, a clinical urology professor at USC.
However, screening practices have already changed. The USPSTF withdrew its objections to screening in 2018 and instead recommended personalized decisionmaking for men 55-69 years old, citing new evidence that screening prevents metastatic disease and reduces PCa mortality more than previously recognized, Richard Hoffman, MD, MPH, an internal medicine professor at the University of Iowa, Iowa City, said in an accompanying editorial.
The study’s trends in mPCa “might be transitory because the screening guidelines have” changed, Dr. Hoffman writes.
For now, clinicians should “consistently address screening with men who are healthy enough to benefit” from catching dangerous tumors early and engage them “in shared decisionmaking discussions to” strike the right balance between minimizing overdiagnosis and catching high-risk tumors before they spread, he said.
Easier said than done, but the field is advancing. Active surveillance, instead of surgery, for what seem to be low-risk tumors is one step in the right direction, Dr. Hoffman commented.
No external funding was reported. Dr. Desai is a consultant for Procept Biorobotics and Auris Surgical. Dr. Hoffman reported royalties from UpToDate and fees from law firms as an expert witness on prostate cancer screening cases.
A version of this article first appeared on Medscape.com.
FROM JAMA NETWORK OPEN
Burden of thyroid cancer: Substantial and increasing
in many developed countries, including the Unites States, concluded a new analysis based on 30 years of observational data.
“We report overall increases in the burden of thyroid cancer across the majority of EU15+ countries between 1990 and 2019, evidenced by plateaus in incidence rates and reductions in mortality and DALY [disability-adjusted life-years] rates,” the authors reported.
“However, in a number of countries, including the U.S., there are unfavorable increasing mortality and DALY trends over this time period ... [and] a better understanding of the trends in the disease burden of thyroid cancer may help to inform future health system planning,” they added.
The study was published online March 10, 2022, in JAMA Otolaryngology–Head & Neck Surgery.
Trends in thyroid cancer
For the analysis, James Schuster-Bruce, MBChB, from St. George’s University Hospital NHS Foundation Trust, London, and colleagues compared trends in thyroid cancer across 30 years of follow-up among 15 countries of the (pre-2004) European Union as well as those in the United States, Australia, Canada, and Norway (EU15+).
Data from the Global Burden of Disease study database were used to track these trends. “We extracted age-standardized incidence rates (ASIRs), age-standardized mortality rates (ASMRs), and DALYs for thyroid cancer from EU15+ countries between 1990 and 2019 using the dedicated GBD study results tool,” the investigators explained.
In 2019, ASIRs were highest in Italy at 6.36 per 100,000 population, followed by the United States at a rate of 5.59 per 100,000 population – although incidence rates of thyroid cancer have actually recently decreased in U.S. women, they noted.
“Thirteen of 19 countries showed an average annual percentage increase in ASIR across the study period,” the investigators added. Out of all the EU15+ countries, the average annual percentage change (AAPC) was the highest in Australia at 2.5 per 100,000 population and the United States at 1.2 per 100,000.
On the other hand, a largely plateauing trend in incidence rates across the majority of EU15+ nations has been observed since 1990, as reflected by incidence rates ranging from –0.8 to 0.8 per 100,000 in the most recent period, the researchers added. ASMRs ranged from a 0.40 per 100,000 in Greece to 0.57 per 100,000 in Luxembourg.
In the United States, the ASMR in 2019 was 0.43 per 100,000 population while the ASMR was the lowest in the United Kingdom in the same year at 0.38 per 100,000 population.
Australia, Denmark, and the United States were the only countries showing positive AAPC changes, the team observed. For example, in the most recent period to 2019, Denmark and Australia had reductions in ASMR trends, whereas in the United States, the trend was toward increasing ASMRs
In 2019, the DALYs of the EU15+ nations ranged from 9.63 per 100,000 in the United Kingdom to 14.46 per 100,000 in Luxembourg. In the most recent period, a downward trend in DALYs was observed in Australia and Denmark while it plateaued in the United States.
“Overall, we identified improvements in thyroid cancer mortality and DALYs, but overall increases in thyroid cancer incidence in EU15+ countries over the past 3 decades,” the investigators commented.
It has been widely suggested that improvements in diagnostic techniques have contributed significantly to increasing incidence rates of thyroid cancer, but there is concern about overdiagnosis. Newer diagnostic techniques detect significant numbers of slow-growing, subclinical papillary thyroid cancers that make up at least one quarter of all thyroid cancer subtypes, the authors pointed out.
“It has therefore been suggested that an increase in subclinical disease has inflated the data to look more substantial than the clinical reality,” the authors wrote. However, they insisted that overdiagnosis alone is unlikely to account entirely for increasing incidence trends in the current analysis.
Rather, their concern for countries with high incidence rates of thyroid cancer is the surveillance burden of disease that does not affect mortality. “Close observation of future time trends in thyroid cancer disease burden should be performed in the context of recent changes in international clinical practice guidelines, which have suggested more conservative diagnostic and management strategies,” the authors suggested.
“In the context of the more conservative treatment guidelines and reported increase in true disease, it is important to closely observe mortality and DALYs over the coming years to ensure optimum thyroid cancer management in these nations,” they added.
The study had no specific funding. Dr. Schuster-Bruce disclosed no relevant financial relationships.
A version of this article first appeared on Medscape.com.
in many developed countries, including the Unites States, concluded a new analysis based on 30 years of observational data.
“We report overall increases in the burden of thyroid cancer across the majority of EU15+ countries between 1990 and 2019, evidenced by plateaus in incidence rates and reductions in mortality and DALY [disability-adjusted life-years] rates,” the authors reported.
“However, in a number of countries, including the U.S., there are unfavorable increasing mortality and DALY trends over this time period ... [and] a better understanding of the trends in the disease burden of thyroid cancer may help to inform future health system planning,” they added.
The study was published online March 10, 2022, in JAMA Otolaryngology–Head & Neck Surgery.
Trends in thyroid cancer
For the analysis, James Schuster-Bruce, MBChB, from St. George’s University Hospital NHS Foundation Trust, London, and colleagues compared trends in thyroid cancer across 30 years of follow-up among 15 countries of the (pre-2004) European Union as well as those in the United States, Australia, Canada, and Norway (EU15+).
Data from the Global Burden of Disease study database were used to track these trends. “We extracted age-standardized incidence rates (ASIRs), age-standardized mortality rates (ASMRs), and DALYs for thyroid cancer from EU15+ countries between 1990 and 2019 using the dedicated GBD study results tool,” the investigators explained.
In 2019, ASIRs were highest in Italy at 6.36 per 100,000 population, followed by the United States at a rate of 5.59 per 100,000 population – although incidence rates of thyroid cancer have actually recently decreased in U.S. women, they noted.
“Thirteen of 19 countries showed an average annual percentage increase in ASIR across the study period,” the investigators added. Out of all the EU15+ countries, the average annual percentage change (AAPC) was the highest in Australia at 2.5 per 100,000 population and the United States at 1.2 per 100,000.
On the other hand, a largely plateauing trend in incidence rates across the majority of EU15+ nations has been observed since 1990, as reflected by incidence rates ranging from –0.8 to 0.8 per 100,000 in the most recent period, the researchers added. ASMRs ranged from a 0.40 per 100,000 in Greece to 0.57 per 100,000 in Luxembourg.
In the United States, the ASMR in 2019 was 0.43 per 100,000 population while the ASMR was the lowest in the United Kingdom in the same year at 0.38 per 100,000 population.
Australia, Denmark, and the United States were the only countries showing positive AAPC changes, the team observed. For example, in the most recent period to 2019, Denmark and Australia had reductions in ASMR trends, whereas in the United States, the trend was toward increasing ASMRs
In 2019, the DALYs of the EU15+ nations ranged from 9.63 per 100,000 in the United Kingdom to 14.46 per 100,000 in Luxembourg. In the most recent period, a downward trend in DALYs was observed in Australia and Denmark while it plateaued in the United States.
“Overall, we identified improvements in thyroid cancer mortality and DALYs, but overall increases in thyroid cancer incidence in EU15+ countries over the past 3 decades,” the investigators commented.
It has been widely suggested that improvements in diagnostic techniques have contributed significantly to increasing incidence rates of thyroid cancer, but there is concern about overdiagnosis. Newer diagnostic techniques detect significant numbers of slow-growing, subclinical papillary thyroid cancers that make up at least one quarter of all thyroid cancer subtypes, the authors pointed out.
“It has therefore been suggested that an increase in subclinical disease has inflated the data to look more substantial than the clinical reality,” the authors wrote. However, they insisted that overdiagnosis alone is unlikely to account entirely for increasing incidence trends in the current analysis.
Rather, their concern for countries with high incidence rates of thyroid cancer is the surveillance burden of disease that does not affect mortality. “Close observation of future time trends in thyroid cancer disease burden should be performed in the context of recent changes in international clinical practice guidelines, which have suggested more conservative diagnostic and management strategies,” the authors suggested.
“In the context of the more conservative treatment guidelines and reported increase in true disease, it is important to closely observe mortality and DALYs over the coming years to ensure optimum thyroid cancer management in these nations,” they added.
The study had no specific funding. Dr. Schuster-Bruce disclosed no relevant financial relationships.
A version of this article first appeared on Medscape.com.
in many developed countries, including the Unites States, concluded a new analysis based on 30 years of observational data.
“We report overall increases in the burden of thyroid cancer across the majority of EU15+ countries between 1990 and 2019, evidenced by plateaus in incidence rates and reductions in mortality and DALY [disability-adjusted life-years] rates,” the authors reported.
“However, in a number of countries, including the U.S., there are unfavorable increasing mortality and DALY trends over this time period ... [and] a better understanding of the trends in the disease burden of thyroid cancer may help to inform future health system planning,” they added.
The study was published online March 10, 2022, in JAMA Otolaryngology–Head & Neck Surgery.
Trends in thyroid cancer
For the analysis, James Schuster-Bruce, MBChB, from St. George’s University Hospital NHS Foundation Trust, London, and colleagues compared trends in thyroid cancer across 30 years of follow-up among 15 countries of the (pre-2004) European Union as well as those in the United States, Australia, Canada, and Norway (EU15+).
Data from the Global Burden of Disease study database were used to track these trends. “We extracted age-standardized incidence rates (ASIRs), age-standardized mortality rates (ASMRs), and DALYs for thyroid cancer from EU15+ countries between 1990 and 2019 using the dedicated GBD study results tool,” the investigators explained.
In 2019, ASIRs were highest in Italy at 6.36 per 100,000 population, followed by the United States at a rate of 5.59 per 100,000 population – although incidence rates of thyroid cancer have actually recently decreased in U.S. women, they noted.
“Thirteen of 19 countries showed an average annual percentage increase in ASIR across the study period,” the investigators added. Out of all the EU15+ countries, the average annual percentage change (AAPC) was the highest in Australia at 2.5 per 100,000 population and the United States at 1.2 per 100,000.
On the other hand, a largely plateauing trend in incidence rates across the majority of EU15+ nations has been observed since 1990, as reflected by incidence rates ranging from –0.8 to 0.8 per 100,000 in the most recent period, the researchers added. ASMRs ranged from a 0.40 per 100,000 in Greece to 0.57 per 100,000 in Luxembourg.
In the United States, the ASMR in 2019 was 0.43 per 100,000 population while the ASMR was the lowest in the United Kingdom in the same year at 0.38 per 100,000 population.
Australia, Denmark, and the United States were the only countries showing positive AAPC changes, the team observed. For example, in the most recent period to 2019, Denmark and Australia had reductions in ASMR trends, whereas in the United States, the trend was toward increasing ASMRs
In 2019, the DALYs of the EU15+ nations ranged from 9.63 per 100,000 in the United Kingdom to 14.46 per 100,000 in Luxembourg. In the most recent period, a downward trend in DALYs was observed in Australia and Denmark while it plateaued in the United States.
“Overall, we identified improvements in thyroid cancer mortality and DALYs, but overall increases in thyroid cancer incidence in EU15+ countries over the past 3 decades,” the investigators commented.
It has been widely suggested that improvements in diagnostic techniques have contributed significantly to increasing incidence rates of thyroid cancer, but there is concern about overdiagnosis. Newer diagnostic techniques detect significant numbers of slow-growing, subclinical papillary thyroid cancers that make up at least one quarter of all thyroid cancer subtypes, the authors pointed out.
“It has therefore been suggested that an increase in subclinical disease has inflated the data to look more substantial than the clinical reality,” the authors wrote. However, they insisted that overdiagnosis alone is unlikely to account entirely for increasing incidence trends in the current analysis.
Rather, their concern for countries with high incidence rates of thyroid cancer is the surveillance burden of disease that does not affect mortality. “Close observation of future time trends in thyroid cancer disease burden should be performed in the context of recent changes in international clinical practice guidelines, which have suggested more conservative diagnostic and management strategies,” the authors suggested.
“In the context of the more conservative treatment guidelines and reported increase in true disease, it is important to closely observe mortality and DALYs over the coming years to ensure optimum thyroid cancer management in these nations,” they added.
The study had no specific funding. Dr. Schuster-Bruce disclosed no relevant financial relationships.
A version of this article first appeared on Medscape.com.
FROM JAMA OTOLARYNGOLOGY–HEAD & NECK SURGERY.
Cancer increases patients’ risk for cardiovascular deaths
and irrespective of cancer type, according to a population-based study.
The retrospective analysis, which included data from more than 200,000 patients with cancer, found that a new cancer diagnosis significantly increased the risk of cardiovascular (CV) death (hazard ratio [HR], 1.33) as well as other CV events, including stroke (HR, 1.44), heart failure (HR, 1.62) and pulmonary embolism (HR, 3.43).
From the results, the researchers concluded that a “new cancer diagnosis is independently associated with a significantly increased risk for cardiovascular death and nonfatal morbidity regardless of cancer site.”
The findings were published in the Journal of the American College of Cardiology: CardioOncology (2022 Mar;4[1]:85-94).
Patients with cancer and cancer survivors are known to have an increased risk for heart failure, but evidence on the risk for other CV outcomes remains less clear. In addition, the authors noted, many cancer therapies – including chest irradiation and chemotherapy – can increase a person’s risk of incident CV disease during treatment and after, but data on the long-term CV risk among cancer survivors conflict.
D. Ian Paterson, MD, of the University of Alberta, Edmonton, and coauthors wanted to clarify how a new cancer diagnosis at various sites and stages might affect a person’s risk for fatal and nonfatal CV events over the long term.
The current analysis included data from 224,016 patients with a new cancer diagnosis identified from an administrative database of more than 4.5 million adults residing in Alberta. The researcher identified 73,360 CV deaths and 470,481 nonfatal CV events between April 2007 and December 2018.
Comparing CV events in those with and in those without cancer, the authors found that patients with cancer had a 33% increased risk for CV mortality over the 12-year study follow-up, after adjusting for sociodemographic data and comorbidities (HR, 1.33; 95% confidence interval [CI], 1.29-1.37). Patients with cancer also had an increased risk for stroke (HR, 1.44), heart failure (HR, 1.62) and pulmonary embolism (HR, 3.43), though not myocardial infarction (HR, 1.01; 95% CI, 0.97 – 1.05), compared to those without cancer.
The extent of the risk varied somewhat by cancer stage, time from diagnosis, and cancer type.
A new cancer diagnosis put patients at a significantly higher risk of CV mortality, heart failure, stroke, or pulmonary embolism, regardless of the cancer site, but the risk of CV events was highest for patients with genitourinary, gastrointestinal, thoracic, nervous system, and hematologic malignancies. These patients accounted for more than half of the cancer cohort and more than 70% of the incident CV burden.
Patients with more advanced cancer were at the highest risk for poor CV outcomes, but even those with very early-stage disease faced an elevated risk.
The risk for CV events was greatest in the first year following a cancer diagnosis for all outcomes (HRs, 1.24-8.36) but remained significantly elevated for CV death, heart failure, and pulmonary embolism a decade later.
Overall, the authors concluded that “patients with cancer constitute a high-risk population for CV disease” over the long term and suggested that those with cancer “may benefit from comanagement that includes cardiologists as well as stroke and thrombosis specialists.”
In an accompanying editorial, Hiroshi Ohtsu of Juntendo University in Tokyo, and colleagues concluded that the work “has remarkable strengths” and important clinical implications. However, they said that additional steps may be warranted before translating these findings to clinical practice.
For example, the study is limited by its retrospective population-based design and the lack of data on cancer therapy as well as on several patient factors, including ethnicity, smoking, and physical activity.
The study authors agreed, noting that future work should evaluate how cancer therapies and other potential contributors to poor CV outcomes influence patients’ risk.
“Such work would potentially lead to better prediction of CV risk for patients with cancer and survivors and improved prevention and treatment strategies,” they wrote.
The study was supported by a foundation grant from the Canadian Institutes of Health Research. The authors have disclosed no relevant financial relationships. The editorial was supported in part by funding to individual authors from the Japan Society for the Promotion of Science/Ministry of Education, Culture, Sports, Science and Technology, the Ministry of Health, Labour and Welfare, and the Agency for Medical Research and Development.
A version of this article first appeared on Medscape.com.
and irrespective of cancer type, according to a population-based study.
The retrospective analysis, which included data from more than 200,000 patients with cancer, found that a new cancer diagnosis significantly increased the risk of cardiovascular (CV) death (hazard ratio [HR], 1.33) as well as other CV events, including stroke (HR, 1.44), heart failure (HR, 1.62) and pulmonary embolism (HR, 3.43).
From the results, the researchers concluded that a “new cancer diagnosis is independently associated with a significantly increased risk for cardiovascular death and nonfatal morbidity regardless of cancer site.”
The findings were published in the Journal of the American College of Cardiology: CardioOncology (2022 Mar;4[1]:85-94).
Patients with cancer and cancer survivors are known to have an increased risk for heart failure, but evidence on the risk for other CV outcomes remains less clear. In addition, the authors noted, many cancer therapies – including chest irradiation and chemotherapy – can increase a person’s risk of incident CV disease during treatment and after, but data on the long-term CV risk among cancer survivors conflict.
D. Ian Paterson, MD, of the University of Alberta, Edmonton, and coauthors wanted to clarify how a new cancer diagnosis at various sites and stages might affect a person’s risk for fatal and nonfatal CV events over the long term.
The current analysis included data from 224,016 patients with a new cancer diagnosis identified from an administrative database of more than 4.5 million adults residing in Alberta. The researcher identified 73,360 CV deaths and 470,481 nonfatal CV events between April 2007 and December 2018.
Comparing CV events in those with and in those without cancer, the authors found that patients with cancer had a 33% increased risk for CV mortality over the 12-year study follow-up, after adjusting for sociodemographic data and comorbidities (HR, 1.33; 95% confidence interval [CI], 1.29-1.37). Patients with cancer also had an increased risk for stroke (HR, 1.44), heart failure (HR, 1.62) and pulmonary embolism (HR, 3.43), though not myocardial infarction (HR, 1.01; 95% CI, 0.97 – 1.05), compared to those without cancer.
The extent of the risk varied somewhat by cancer stage, time from diagnosis, and cancer type.
A new cancer diagnosis put patients at a significantly higher risk of CV mortality, heart failure, stroke, or pulmonary embolism, regardless of the cancer site, but the risk of CV events was highest for patients with genitourinary, gastrointestinal, thoracic, nervous system, and hematologic malignancies. These patients accounted for more than half of the cancer cohort and more than 70% of the incident CV burden.
Patients with more advanced cancer were at the highest risk for poor CV outcomes, but even those with very early-stage disease faced an elevated risk.
The risk for CV events was greatest in the first year following a cancer diagnosis for all outcomes (HRs, 1.24-8.36) but remained significantly elevated for CV death, heart failure, and pulmonary embolism a decade later.
Overall, the authors concluded that “patients with cancer constitute a high-risk population for CV disease” over the long term and suggested that those with cancer “may benefit from comanagement that includes cardiologists as well as stroke and thrombosis specialists.”
In an accompanying editorial, Hiroshi Ohtsu of Juntendo University in Tokyo, and colleagues concluded that the work “has remarkable strengths” and important clinical implications. However, they said that additional steps may be warranted before translating these findings to clinical practice.
For example, the study is limited by its retrospective population-based design and the lack of data on cancer therapy as well as on several patient factors, including ethnicity, smoking, and physical activity.
The study authors agreed, noting that future work should evaluate how cancer therapies and other potential contributors to poor CV outcomes influence patients’ risk.
“Such work would potentially lead to better prediction of CV risk for patients with cancer and survivors and improved prevention and treatment strategies,” they wrote.
The study was supported by a foundation grant from the Canadian Institutes of Health Research. The authors have disclosed no relevant financial relationships. The editorial was supported in part by funding to individual authors from the Japan Society for the Promotion of Science/Ministry of Education, Culture, Sports, Science and Technology, the Ministry of Health, Labour and Welfare, and the Agency for Medical Research and Development.
A version of this article first appeared on Medscape.com.
and irrespective of cancer type, according to a population-based study.
The retrospective analysis, which included data from more than 200,000 patients with cancer, found that a new cancer diagnosis significantly increased the risk of cardiovascular (CV) death (hazard ratio [HR], 1.33) as well as other CV events, including stroke (HR, 1.44), heart failure (HR, 1.62) and pulmonary embolism (HR, 3.43).
From the results, the researchers concluded that a “new cancer diagnosis is independently associated with a significantly increased risk for cardiovascular death and nonfatal morbidity regardless of cancer site.”
The findings were published in the Journal of the American College of Cardiology: CardioOncology (2022 Mar;4[1]:85-94).
Patients with cancer and cancer survivors are known to have an increased risk for heart failure, but evidence on the risk for other CV outcomes remains less clear. In addition, the authors noted, many cancer therapies – including chest irradiation and chemotherapy – can increase a person’s risk of incident CV disease during treatment and after, but data on the long-term CV risk among cancer survivors conflict.
D. Ian Paterson, MD, of the University of Alberta, Edmonton, and coauthors wanted to clarify how a new cancer diagnosis at various sites and stages might affect a person’s risk for fatal and nonfatal CV events over the long term.
The current analysis included data from 224,016 patients with a new cancer diagnosis identified from an administrative database of more than 4.5 million adults residing in Alberta. The researcher identified 73,360 CV deaths and 470,481 nonfatal CV events between April 2007 and December 2018.
Comparing CV events in those with and in those without cancer, the authors found that patients with cancer had a 33% increased risk for CV mortality over the 12-year study follow-up, after adjusting for sociodemographic data and comorbidities (HR, 1.33; 95% confidence interval [CI], 1.29-1.37). Patients with cancer also had an increased risk for stroke (HR, 1.44), heart failure (HR, 1.62) and pulmonary embolism (HR, 3.43), though not myocardial infarction (HR, 1.01; 95% CI, 0.97 – 1.05), compared to those without cancer.
The extent of the risk varied somewhat by cancer stage, time from diagnosis, and cancer type.
A new cancer diagnosis put patients at a significantly higher risk of CV mortality, heart failure, stroke, or pulmonary embolism, regardless of the cancer site, but the risk of CV events was highest for patients with genitourinary, gastrointestinal, thoracic, nervous system, and hematologic malignancies. These patients accounted for more than half of the cancer cohort and more than 70% of the incident CV burden.
Patients with more advanced cancer were at the highest risk for poor CV outcomes, but even those with very early-stage disease faced an elevated risk.
The risk for CV events was greatest in the first year following a cancer diagnosis for all outcomes (HRs, 1.24-8.36) but remained significantly elevated for CV death, heart failure, and pulmonary embolism a decade later.
Overall, the authors concluded that “patients with cancer constitute a high-risk population for CV disease” over the long term and suggested that those with cancer “may benefit from comanagement that includes cardiologists as well as stroke and thrombosis specialists.”
In an accompanying editorial, Hiroshi Ohtsu of Juntendo University in Tokyo, and colleagues concluded that the work “has remarkable strengths” and important clinical implications. However, they said that additional steps may be warranted before translating these findings to clinical practice.
For example, the study is limited by its retrospective population-based design and the lack of data on cancer therapy as well as on several patient factors, including ethnicity, smoking, and physical activity.
The study authors agreed, noting that future work should evaluate how cancer therapies and other potential contributors to poor CV outcomes influence patients’ risk.
“Such work would potentially lead to better prediction of CV risk for patients with cancer and survivors and improved prevention and treatment strategies,” they wrote.
The study was supported by a foundation grant from the Canadian Institutes of Health Research. The authors have disclosed no relevant financial relationships. The editorial was supported in part by funding to individual authors from the Japan Society for the Promotion of Science/Ministry of Education, Culture, Sports, Science and Technology, the Ministry of Health, Labour and Welfare, and the Agency for Medical Research and Development.
A version of this article first appeared on Medscape.com.
FROM JOURNAL OF THE AMERICAN COLLEGE OF CARDIOLOGY
Intensity-modulated radiotherapy reduces esophagitis in palliative NSCLC
Reducing the dose of radiation to the esophagus during palliative radiotherapy for advanced lung cancer significantly reduced the incidence of esophagitis among a small group of patients, according to a new randomized study.
The study, called Palliative Radiation for Advanced Central Lung Tumors with Intentional Avoidance of the Esophagus (PROACTIVE), explored the use of a technique called intensity-modulated radiotherapy (IMRT) to sculpt the radiation dose around the esophagus, reducing its exposure. IMRT is a standard technique to avoid healthy tissue with higher radiation doses in the curative setting, but it hasn’t been explored much in the palliative setting, said investigators led by Alexander V. Louie, MD, PhD, a radiation oncologist at the University of Toronto’s Odette Cancer Centre.
The study included 90 patients (mean age 70 years, 56% female) with stage 3 and 4 non–small cell lung cancer. They were randomized evenly to standard radiotherapy with the esophagus getting the same dose as the tumor, or to esophagus-sparing IMRT (ES-IMRT) with the esophagus exposed to no more than 80% of the prescribed dose.
The overall survival was similar between both groups: 8.6 months for standard therapy and 8.7 months for IMRT. Forty percent of patients received 20 Gy in 5 fractions and the rest 30 Gy in 10 fractions. The reduction in esophagitis with IMRT was most evident in the 30 Gy group.
Only one patient in the esophagus-sparing group developed grade 2 esophagitis versus 11 patients (24%) in the standard radiotherapy group. There were no grade 3 or higher cases. There was also an almost 4-point improvement (54.3 points with ES-IMRT versus 50.5 points) on an esophagus-related quality of life (QOL) measure, which is a subscale of the Functional Assessment of Cancer Therapy: Esophagus questionnaire, but it wasn’t statistically significant (P = 0.06).
“The ES-IMRT technique we describe herein represents a paradigm shift in palliative radiotherapy planning,” the investigators wrote. “This technique holds merit for translation into clinical practice.”
However, in their editorial, Ashley A. Weiner, MD, PhD, and Joel E. Tepper, MD, of the Lineberger Comprehensive Cancer Center at the University of North Carolina at Chapel Hill, wrote that it is too preliminary to recommend esophagus-sparing IMRT to patients. “In the absence of meeting the primary quality of life end point and without demonstration of adequate symptom palliation, one cannot recommend ES-IMRT as a standard therapy for palliation of thoracic symptoms due to NSCLC,” they wrote.
They said the study raises an important issue: The balance between tumor coverage and sparing healthy tissue when symptom palliation instead of cure is the goal.
Striking the right balance “is challenging and part of the art of radiotherapy” particularly in the palliative setting, where there are many unanswered questions, they said.
Unlike in curative intent scenarios, “the ideal dose to the tumor to provide a maximal palliative benefit is unknown, and perhaps there is no ideal dose,” Dr. Weiner and Dr. Tepper said.
It’s also unclear whether the entire tumor needs to be irradiated to the full dose when the goal is simply to shrink the tumor and relieve symptoms. “Perhaps a lower dose to a portion of the tumor makes sense,” especially when radiation doses for palliation are “somewhat arbitrary,” they said.
Indeed, the portion of the tumor next to the esophagus in the IMRT subjects was necessarily undercovered to achieve the esophagus-sparing effect. “It seems very likely to us that underdosing a small portion of the tumor will have little adverse effect” on palliation, Dr. Weiner and Dr. Tepper wrote.
Also, “if undercovering” the tumor with lower doses “results in adequate tumor reduction for palliation,” they wondered if IMRT – a more expensive and complex technique than standard radiotherapy – is even needed.
The work was funded by the Canadian Cancer Society. Dr. Louie reported payments from AstraZeneca as an advisor and personal fees from Varian Medical Systems and Reflexion, the makers of IMRT technology. The authors of the editorial reported no conflicts of interest.
Reducing the dose of radiation to the esophagus during palliative radiotherapy for advanced lung cancer significantly reduced the incidence of esophagitis among a small group of patients, according to a new randomized study.
The study, called Palliative Radiation for Advanced Central Lung Tumors with Intentional Avoidance of the Esophagus (PROACTIVE), explored the use of a technique called intensity-modulated radiotherapy (IMRT) to sculpt the radiation dose around the esophagus, reducing its exposure. IMRT is a standard technique to avoid healthy tissue with higher radiation doses in the curative setting, but it hasn’t been explored much in the palliative setting, said investigators led by Alexander V. Louie, MD, PhD, a radiation oncologist at the University of Toronto’s Odette Cancer Centre.
The study included 90 patients (mean age 70 years, 56% female) with stage 3 and 4 non–small cell lung cancer. They were randomized evenly to standard radiotherapy with the esophagus getting the same dose as the tumor, or to esophagus-sparing IMRT (ES-IMRT) with the esophagus exposed to no more than 80% of the prescribed dose.
The overall survival was similar between both groups: 8.6 months for standard therapy and 8.7 months for IMRT. Forty percent of patients received 20 Gy in 5 fractions and the rest 30 Gy in 10 fractions. The reduction in esophagitis with IMRT was most evident in the 30 Gy group.
Only one patient in the esophagus-sparing group developed grade 2 esophagitis versus 11 patients (24%) in the standard radiotherapy group. There were no grade 3 or higher cases. There was also an almost 4-point improvement (54.3 points with ES-IMRT versus 50.5 points) on an esophagus-related quality of life (QOL) measure, which is a subscale of the Functional Assessment of Cancer Therapy: Esophagus questionnaire, but it wasn’t statistically significant (P = 0.06).
“The ES-IMRT technique we describe herein represents a paradigm shift in palliative radiotherapy planning,” the investigators wrote. “This technique holds merit for translation into clinical practice.”
However, in their editorial, Ashley A. Weiner, MD, PhD, and Joel E. Tepper, MD, of the Lineberger Comprehensive Cancer Center at the University of North Carolina at Chapel Hill, wrote that it is too preliminary to recommend esophagus-sparing IMRT to patients. “In the absence of meeting the primary quality of life end point and without demonstration of adequate symptom palliation, one cannot recommend ES-IMRT as a standard therapy for palliation of thoracic symptoms due to NSCLC,” they wrote.
They said the study raises an important issue: The balance between tumor coverage and sparing healthy tissue when symptom palliation instead of cure is the goal.
Striking the right balance “is challenging and part of the art of radiotherapy” particularly in the palliative setting, where there are many unanswered questions, they said.
Unlike in curative intent scenarios, “the ideal dose to the tumor to provide a maximal palliative benefit is unknown, and perhaps there is no ideal dose,” Dr. Weiner and Dr. Tepper said.
It’s also unclear whether the entire tumor needs to be irradiated to the full dose when the goal is simply to shrink the tumor and relieve symptoms. “Perhaps a lower dose to a portion of the tumor makes sense,” especially when radiation doses for palliation are “somewhat arbitrary,” they said.
Indeed, the portion of the tumor next to the esophagus in the IMRT subjects was necessarily undercovered to achieve the esophagus-sparing effect. “It seems very likely to us that underdosing a small portion of the tumor will have little adverse effect” on palliation, Dr. Weiner and Dr. Tepper wrote.
Also, “if undercovering” the tumor with lower doses “results in adequate tumor reduction for palliation,” they wondered if IMRT – a more expensive and complex technique than standard radiotherapy – is even needed.
The work was funded by the Canadian Cancer Society. Dr. Louie reported payments from AstraZeneca as an advisor and personal fees from Varian Medical Systems and Reflexion, the makers of IMRT technology. The authors of the editorial reported no conflicts of interest.
Reducing the dose of radiation to the esophagus during palliative radiotherapy for advanced lung cancer significantly reduced the incidence of esophagitis among a small group of patients, according to a new randomized study.
The study, called Palliative Radiation for Advanced Central Lung Tumors with Intentional Avoidance of the Esophagus (PROACTIVE), explored the use of a technique called intensity-modulated radiotherapy (IMRT) to sculpt the radiation dose around the esophagus, reducing its exposure. IMRT is a standard technique to avoid healthy tissue with higher radiation doses in the curative setting, but it hasn’t been explored much in the palliative setting, said investigators led by Alexander V. Louie, MD, PhD, a radiation oncologist at the University of Toronto’s Odette Cancer Centre.
The study included 90 patients (mean age 70 years, 56% female) with stage 3 and 4 non–small cell lung cancer. They were randomized evenly to standard radiotherapy with the esophagus getting the same dose as the tumor, or to esophagus-sparing IMRT (ES-IMRT) with the esophagus exposed to no more than 80% of the prescribed dose.
The overall survival was similar between both groups: 8.6 months for standard therapy and 8.7 months for IMRT. Forty percent of patients received 20 Gy in 5 fractions and the rest 30 Gy in 10 fractions. The reduction in esophagitis with IMRT was most evident in the 30 Gy group.
Only one patient in the esophagus-sparing group developed grade 2 esophagitis versus 11 patients (24%) in the standard radiotherapy group. There were no grade 3 or higher cases. There was also an almost 4-point improvement (54.3 points with ES-IMRT versus 50.5 points) on an esophagus-related quality of life (QOL) measure, which is a subscale of the Functional Assessment of Cancer Therapy: Esophagus questionnaire, but it wasn’t statistically significant (P = 0.06).
“The ES-IMRT technique we describe herein represents a paradigm shift in palliative radiotherapy planning,” the investigators wrote. “This technique holds merit for translation into clinical practice.”
However, in their editorial, Ashley A. Weiner, MD, PhD, and Joel E. Tepper, MD, of the Lineberger Comprehensive Cancer Center at the University of North Carolina at Chapel Hill, wrote that it is too preliminary to recommend esophagus-sparing IMRT to patients. “In the absence of meeting the primary quality of life end point and without demonstration of adequate symptom palliation, one cannot recommend ES-IMRT as a standard therapy for palliation of thoracic symptoms due to NSCLC,” they wrote.
They said the study raises an important issue: The balance between tumor coverage and sparing healthy tissue when symptom palliation instead of cure is the goal.
Striking the right balance “is challenging and part of the art of radiotherapy” particularly in the palliative setting, where there are many unanswered questions, they said.
Unlike in curative intent scenarios, “the ideal dose to the tumor to provide a maximal palliative benefit is unknown, and perhaps there is no ideal dose,” Dr. Weiner and Dr. Tepper said.
It’s also unclear whether the entire tumor needs to be irradiated to the full dose when the goal is simply to shrink the tumor and relieve symptoms. “Perhaps a lower dose to a portion of the tumor makes sense,” especially when radiation doses for palliation are “somewhat arbitrary,” they said.
Indeed, the portion of the tumor next to the esophagus in the IMRT subjects was necessarily undercovered to achieve the esophagus-sparing effect. “It seems very likely to us that underdosing a small portion of the tumor will have little adverse effect” on palliation, Dr. Weiner and Dr. Tepper wrote.
Also, “if undercovering” the tumor with lower doses “results in adequate tumor reduction for palliation,” they wondered if IMRT – a more expensive and complex technique than standard radiotherapy – is even needed.
The work was funded by the Canadian Cancer Society. Dr. Louie reported payments from AstraZeneca as an advisor and personal fees from Varian Medical Systems and Reflexion, the makers of IMRT technology. The authors of the editorial reported no conflicts of interest.
FROM JAMA ONCOLOGY
Relax. The dog-tor will see you now
Patients in the emergency room who spent just 10 minutes with a trained therapy dog reported less pain, anxiety, and depression and improved well-being, researchers from the University of Saskatchewan in Canada found.
“The ER is an important community resource but also a scary place for most people,” James Stempien, MD, provincial department head of emergency medicine with the Saskatchewan Health Authority, who worked on the study, said in an interview.
“People tend to visit the ER on the worst day of their life, either for them or a loved one. Interacting with a therapy dog can make the ER visit a little calmer. We have also seen benefit for the staff that get to interact with the dogs as well,” he says.
“Thanks to our wonderful therapy dog volunteer teams, the cost is minimal and the result is priceless,” Dr. Stempien says.
The study, published in the journal PLOS One, builds on earlier “uncontrolled” studies by the Saskatchewan team.
Those studies showed that most ER patients wanted to visit with the therapy dog, if given a chance. After the encounter, patients reported feeling more comfortable, happier, and less distressed while waiting in the ER.
“A controlled trial was the natural next step,” says study investigator Colleen Dell, PhD, of One Health and Wellness at the University of Saskatchewan.
The study was done at the Royal University Hospital (RUH) in Saskatoon, Saskatchewan -- the first emergency department in Canada to introduce therapy dogs to improve the experience of waiting patients.
Nearly 200 adults visiting the ER received either a 10-minute visit with a therapy dog and its handler in addition to usual care or just usual care.
“This did not occur in patients in the ER who did not visit with a therapy dog.
“This gives us confidence in the intervention,” Dr. Dell says.
Pain is a major reason that patients come to the ER, and interactions with a therapy dog may distract from that pain, the researchers believe.
The study results lend more evidence to research that shows animals can help in medical settings, says Kara Rauscher, a licensed social worker and interim director of behavioral health for Nashville CARES in Tennessee, who wasn’t involved in the study.
“There are clearly opportunities to replicate this study in other emergency departments to strengthen our understanding of the potential benefits of these programs,” she says.
Part of her work at Nashville CARES, an AIDS service organization, has been supporting care that moves away from questions like, “What’s wrong with you?” to patient-focused questions like, “What happened to you?” It is a practice known as trauma-informed care.
“This includes bringing in therapy dogs for staff to spend time with during the workday; anecdotally, our staff reported a reduction in stress and improvements in mood,” Ms. Rauscher says.
A version of this article first appeared on WebMD.com.
Patients in the emergency room who spent just 10 minutes with a trained therapy dog reported less pain, anxiety, and depression and improved well-being, researchers from the University of Saskatchewan in Canada found.
“The ER is an important community resource but also a scary place for most people,” James Stempien, MD, provincial department head of emergency medicine with the Saskatchewan Health Authority, who worked on the study, said in an interview.
“People tend to visit the ER on the worst day of their life, either for them or a loved one. Interacting with a therapy dog can make the ER visit a little calmer. We have also seen benefit for the staff that get to interact with the dogs as well,” he says.
“Thanks to our wonderful therapy dog volunteer teams, the cost is minimal and the result is priceless,” Dr. Stempien says.
The study, published in the journal PLOS One, builds on earlier “uncontrolled” studies by the Saskatchewan team.
Those studies showed that most ER patients wanted to visit with the therapy dog, if given a chance. After the encounter, patients reported feeling more comfortable, happier, and less distressed while waiting in the ER.
“A controlled trial was the natural next step,” says study investigator Colleen Dell, PhD, of One Health and Wellness at the University of Saskatchewan.
The study was done at the Royal University Hospital (RUH) in Saskatoon, Saskatchewan -- the first emergency department in Canada to introduce therapy dogs to improve the experience of waiting patients.
Nearly 200 adults visiting the ER received either a 10-minute visit with a therapy dog and its handler in addition to usual care or just usual care.
“This did not occur in patients in the ER who did not visit with a therapy dog.
“This gives us confidence in the intervention,” Dr. Dell says.
Pain is a major reason that patients come to the ER, and interactions with a therapy dog may distract from that pain, the researchers believe.
The study results lend more evidence to research that shows animals can help in medical settings, says Kara Rauscher, a licensed social worker and interim director of behavioral health for Nashville CARES in Tennessee, who wasn’t involved in the study.
“There are clearly opportunities to replicate this study in other emergency departments to strengthen our understanding of the potential benefits of these programs,” she says.
Part of her work at Nashville CARES, an AIDS service organization, has been supporting care that moves away from questions like, “What’s wrong with you?” to patient-focused questions like, “What happened to you?” It is a practice known as trauma-informed care.
“This includes bringing in therapy dogs for staff to spend time with during the workday; anecdotally, our staff reported a reduction in stress and improvements in mood,” Ms. Rauscher says.
A version of this article first appeared on WebMD.com.
Patients in the emergency room who spent just 10 minutes with a trained therapy dog reported less pain, anxiety, and depression and improved well-being, researchers from the University of Saskatchewan in Canada found.
“The ER is an important community resource but also a scary place for most people,” James Stempien, MD, provincial department head of emergency medicine with the Saskatchewan Health Authority, who worked on the study, said in an interview.
“People tend to visit the ER on the worst day of their life, either for them or a loved one. Interacting with a therapy dog can make the ER visit a little calmer. We have also seen benefit for the staff that get to interact with the dogs as well,” he says.
“Thanks to our wonderful therapy dog volunteer teams, the cost is minimal and the result is priceless,” Dr. Stempien says.
The study, published in the journal PLOS One, builds on earlier “uncontrolled” studies by the Saskatchewan team.
Those studies showed that most ER patients wanted to visit with the therapy dog, if given a chance. After the encounter, patients reported feeling more comfortable, happier, and less distressed while waiting in the ER.
“A controlled trial was the natural next step,” says study investigator Colleen Dell, PhD, of One Health and Wellness at the University of Saskatchewan.
The study was done at the Royal University Hospital (RUH) in Saskatoon, Saskatchewan -- the first emergency department in Canada to introduce therapy dogs to improve the experience of waiting patients.
Nearly 200 adults visiting the ER received either a 10-minute visit with a therapy dog and its handler in addition to usual care or just usual care.
“This did not occur in patients in the ER who did not visit with a therapy dog.
“This gives us confidence in the intervention,” Dr. Dell says.
Pain is a major reason that patients come to the ER, and interactions with a therapy dog may distract from that pain, the researchers believe.
The study results lend more evidence to research that shows animals can help in medical settings, says Kara Rauscher, a licensed social worker and interim director of behavioral health for Nashville CARES in Tennessee, who wasn’t involved in the study.
“There are clearly opportunities to replicate this study in other emergency departments to strengthen our understanding of the potential benefits of these programs,” she says.
Part of her work at Nashville CARES, an AIDS service organization, has been supporting care that moves away from questions like, “What’s wrong with you?” to patient-focused questions like, “What happened to you?” It is a practice known as trauma-informed care.
“This includes bringing in therapy dogs for staff to spend time with during the workday; anecdotally, our staff reported a reduction in stress and improvements in mood,” Ms. Rauscher says.
A version of this article first appeared on WebMD.com.
FROM PLOS ONE
Insurance mandates drive genetic testing and sex selection in IVF
The use of preimplantation genetic tests (PGT) in in vitro fertilization cycles, including tests for nonmedical sex selection, increased significantly in states without mandated insurance coverage, based on data from a study of 300,000 IVF cycles.
Previous studies have shown associations between IVF insurance coverage and various IVF practice patterns, but trends in genetic testing according to state-mandated insurance have not been explored, Bronwyn S. Bedrick, MD, of Johns Hopkins University, Baltimore, and colleagues wrote.
“Preimplantation genetic testing was introduced into clinical practice to prevent transmission of genetic disease and to improve uptake of single embryo transfer, but in the real world there are many potential applications,” corresponding author Emily Jungheim, MD, of Northwestern University, Chicago, said in an interview. “We wanted to know how PGT is being applied given that its use is on the rise.”
In a study published in Obstetrics & Gynecology, the researchers analyzed genetic testing in deidentified autologous, nonbanking IVF cycles from 2014 to 2016 obtained through the Society for Assisted Reproductive Technology Clinic Outcome Reporting System (SART CORS). The data set included 301,465 IVF cycles and 224,235 unique patients over the 3-year study period. Of these, 78,578 cycles (26%) used PGT, and overall, the proportion of IVF cycles using PGT approximately doubled, from 17% in 2014 to 34% in 2016 – a significant increase over time (risk ratio, 1.37). As of 2021, 13 states had mandates that health insurance include IVF costs.
In states with insurance mandates versus nonmandated states, the proportion of any PGT was 28.8% vs. 19.6%, and the probability was 32% lower in states with mandates (RR. 0.68; P < .001).
Aneuploidy was the most common indication for PGT, and accounted for 60% of the cycles; however, the number of cycles using PGT for elective sex selection increased from 1,314 cycles in 2014 to 2,184 in 2016 (approximately 66% increase).
In a multivariate analysis, IVF cycles for elective sex selection was 56% lower in states with mandates, compared with those without (RR, 0.44; P < .001).
In addition, cycles involving nonmedical sex selection were significantly more likely to result in male offspring, the researchers said.
“The increase in the number of cycles using elective sex selection seen in this study may reflect the growing number of clinics offering [PGT] for nonmedical sex selection as well as increasing public awareness of preimplantation genetic testing,” the researchers wrote.
However, the socioeconomic characteristics of women may play a role in the use of PGT, as those living in states with no mandate must be able pay the cost of IVF procedures, as well as the cost of PGT if desired, they noted.
“Because fertility centers may offer patients the choice to select the sex of their embryo after preimplantation genetic testing, this may in effect permit elective sex selection,” the researchers said. The shift in the male-female sex ratio in these cases “is concerning given the implications for future social demographics as IVF and preimplantation genetic testing utilization increase, and the negative effect outcomes could have on medical insurance policy and allocation of resources for medically indicated IVF and preimplantation genetic testing.”
The study findings were limited by several factors including the lack of clinic identifiers and lack of data characteristics including, race, ethnicity, and previous live births, the researchers noted. Other limitations included a lack of data on the sex preferences of the couple, and whether the sex of the embryo was known, and whether male and female embryos were transferred. Also, no states have mandates to cover PGT, and the limited study period may not generalize to current practices.
However, the study strengths include the large size and comprehensive database, and have implications for future policies and expansion of insurance coverage for infertility treatment and for preventing transmission of genetic diseases, they said.
Be mindful of consequences of testing
In an interview, Dr. Jungheim said she was surprised by some of the findings. “I thought we would see that PGT-A utilization was lower in states without mandates given the already high cost of IVF for patients paying out of pocket. I was also surprised to see that more males were born after PGT-A; it suggests that overall, patients using PGT-A favor males.
“For clinicians, we need to be mindful of the long-term impact of our practices,” she emphasized. “Shifting the sex ratio in favor of one sex or the other is an unintended consequence of IVF with PGT-A that can have negative implications for future generations.”
In the study, the researchers proposed a revision to the American Society for Reproductive Medicine Ethics Committee opinion on sex selection to provide guidance in keeping with ASRM’s mission of “accessible, ethical, and quality reproductive care for every person.”
However, “even if the ASRM Ethics Committee Opinion was revised, it’s up to clinicians to decide what they are comfortable with,” said Dr. Jungheim. “When patients are paying out of pocket for expensive treatments that require emotional investment and time, it can be difficult to keep medical decision making strictly evidence based.” Improved insurance coverage and access to fertility care may help with some of these decisions, but more real-world evidence is needed.
Let’s talk about sex (selection)
The study findings are both “novel and sobering,” and enhance the current body of evidence of associations between state insurance mandates and IVF outcomes, Jennifer Eaton, MD, of Brown University, Providence, R.I., wrote in an accompanying editorial.
“The association between mandate status and elective sex selection is particularly eye-opening,” said Dr. Eaton. The overall increased use of PGT for sex selection does not account for sex selection as part of testing for aneuploidy. In fact, “patients with euploid embryos of both sexes are frequently given the opportunity to select which embryo to transfer.”
The current study provides “compelling evidence that it is time to revisit the ethical dilemma of elective sex selection in the United States,” Dr. Eaton emphasized. The current ASRM guidance states that IVF clinics are not obligated to provide or refuse to provide nonmedically indicated methods of sex selection, but in light of the current study and other studies, a revision to the existing ASRM Ethics Committee opinion is needed.
The study received no outside funding. Neither the researchers nor Dr. Eaton had any financial conflicts to disclose.
The use of preimplantation genetic tests (PGT) in in vitro fertilization cycles, including tests for nonmedical sex selection, increased significantly in states without mandated insurance coverage, based on data from a study of 300,000 IVF cycles.
Previous studies have shown associations between IVF insurance coverage and various IVF practice patterns, but trends in genetic testing according to state-mandated insurance have not been explored, Bronwyn S. Bedrick, MD, of Johns Hopkins University, Baltimore, and colleagues wrote.
“Preimplantation genetic testing was introduced into clinical practice to prevent transmission of genetic disease and to improve uptake of single embryo transfer, but in the real world there are many potential applications,” corresponding author Emily Jungheim, MD, of Northwestern University, Chicago, said in an interview. “We wanted to know how PGT is being applied given that its use is on the rise.”
In a study published in Obstetrics & Gynecology, the researchers analyzed genetic testing in deidentified autologous, nonbanking IVF cycles from 2014 to 2016 obtained through the Society for Assisted Reproductive Technology Clinic Outcome Reporting System (SART CORS). The data set included 301,465 IVF cycles and 224,235 unique patients over the 3-year study period. Of these, 78,578 cycles (26%) used PGT, and overall, the proportion of IVF cycles using PGT approximately doubled, from 17% in 2014 to 34% in 2016 – a significant increase over time (risk ratio, 1.37). As of 2021, 13 states had mandates that health insurance include IVF costs.
In states with insurance mandates versus nonmandated states, the proportion of any PGT was 28.8% vs. 19.6%, and the probability was 32% lower in states with mandates (RR. 0.68; P < .001).
Aneuploidy was the most common indication for PGT, and accounted for 60% of the cycles; however, the number of cycles using PGT for elective sex selection increased from 1,314 cycles in 2014 to 2,184 in 2016 (approximately 66% increase).
In a multivariate analysis, IVF cycles for elective sex selection was 56% lower in states with mandates, compared with those without (RR, 0.44; P < .001).
In addition, cycles involving nonmedical sex selection were significantly more likely to result in male offspring, the researchers said.
“The increase in the number of cycles using elective sex selection seen in this study may reflect the growing number of clinics offering [PGT] for nonmedical sex selection as well as increasing public awareness of preimplantation genetic testing,” the researchers wrote.
However, the socioeconomic characteristics of women may play a role in the use of PGT, as those living in states with no mandate must be able pay the cost of IVF procedures, as well as the cost of PGT if desired, they noted.
“Because fertility centers may offer patients the choice to select the sex of their embryo after preimplantation genetic testing, this may in effect permit elective sex selection,” the researchers said. The shift in the male-female sex ratio in these cases “is concerning given the implications for future social demographics as IVF and preimplantation genetic testing utilization increase, and the negative effect outcomes could have on medical insurance policy and allocation of resources for medically indicated IVF and preimplantation genetic testing.”
The study findings were limited by several factors including the lack of clinic identifiers and lack of data characteristics including, race, ethnicity, and previous live births, the researchers noted. Other limitations included a lack of data on the sex preferences of the couple, and whether the sex of the embryo was known, and whether male and female embryos were transferred. Also, no states have mandates to cover PGT, and the limited study period may not generalize to current practices.
However, the study strengths include the large size and comprehensive database, and have implications for future policies and expansion of insurance coverage for infertility treatment and for preventing transmission of genetic diseases, they said.
Be mindful of consequences of testing
In an interview, Dr. Jungheim said she was surprised by some of the findings. “I thought we would see that PGT-A utilization was lower in states without mandates given the already high cost of IVF for patients paying out of pocket. I was also surprised to see that more males were born after PGT-A; it suggests that overall, patients using PGT-A favor males.
“For clinicians, we need to be mindful of the long-term impact of our practices,” she emphasized. “Shifting the sex ratio in favor of one sex or the other is an unintended consequence of IVF with PGT-A that can have negative implications for future generations.”
In the study, the researchers proposed a revision to the American Society for Reproductive Medicine Ethics Committee opinion on sex selection to provide guidance in keeping with ASRM’s mission of “accessible, ethical, and quality reproductive care for every person.”
However, “even if the ASRM Ethics Committee Opinion was revised, it’s up to clinicians to decide what they are comfortable with,” said Dr. Jungheim. “When patients are paying out of pocket for expensive treatments that require emotional investment and time, it can be difficult to keep medical decision making strictly evidence based.” Improved insurance coverage and access to fertility care may help with some of these decisions, but more real-world evidence is needed.
Let’s talk about sex (selection)
The study findings are both “novel and sobering,” and enhance the current body of evidence of associations between state insurance mandates and IVF outcomes, Jennifer Eaton, MD, of Brown University, Providence, R.I., wrote in an accompanying editorial.
“The association between mandate status and elective sex selection is particularly eye-opening,” said Dr. Eaton. The overall increased use of PGT for sex selection does not account for sex selection as part of testing for aneuploidy. In fact, “patients with euploid embryos of both sexes are frequently given the opportunity to select which embryo to transfer.”
The current study provides “compelling evidence that it is time to revisit the ethical dilemma of elective sex selection in the United States,” Dr. Eaton emphasized. The current ASRM guidance states that IVF clinics are not obligated to provide or refuse to provide nonmedically indicated methods of sex selection, but in light of the current study and other studies, a revision to the existing ASRM Ethics Committee opinion is needed.
The study received no outside funding. Neither the researchers nor Dr. Eaton had any financial conflicts to disclose.
The use of preimplantation genetic tests (PGT) in in vitro fertilization cycles, including tests for nonmedical sex selection, increased significantly in states without mandated insurance coverage, based on data from a study of 300,000 IVF cycles.
Previous studies have shown associations between IVF insurance coverage and various IVF practice patterns, but trends in genetic testing according to state-mandated insurance have not been explored, Bronwyn S. Bedrick, MD, of Johns Hopkins University, Baltimore, and colleagues wrote.
“Preimplantation genetic testing was introduced into clinical practice to prevent transmission of genetic disease and to improve uptake of single embryo transfer, but in the real world there are many potential applications,” corresponding author Emily Jungheim, MD, of Northwestern University, Chicago, said in an interview. “We wanted to know how PGT is being applied given that its use is on the rise.”
In a study published in Obstetrics & Gynecology, the researchers analyzed genetic testing in deidentified autologous, nonbanking IVF cycles from 2014 to 2016 obtained through the Society for Assisted Reproductive Technology Clinic Outcome Reporting System (SART CORS). The data set included 301,465 IVF cycles and 224,235 unique patients over the 3-year study period. Of these, 78,578 cycles (26%) used PGT, and overall, the proportion of IVF cycles using PGT approximately doubled, from 17% in 2014 to 34% in 2016 – a significant increase over time (risk ratio, 1.37). As of 2021, 13 states had mandates that health insurance include IVF costs.
In states with insurance mandates versus nonmandated states, the proportion of any PGT was 28.8% vs. 19.6%, and the probability was 32% lower in states with mandates (RR. 0.68; P < .001).
Aneuploidy was the most common indication for PGT, and accounted for 60% of the cycles; however, the number of cycles using PGT for elective sex selection increased from 1,314 cycles in 2014 to 2,184 in 2016 (approximately 66% increase).
In a multivariate analysis, IVF cycles for elective sex selection was 56% lower in states with mandates, compared with those without (RR, 0.44; P < .001).
In addition, cycles involving nonmedical sex selection were significantly more likely to result in male offspring, the researchers said.
“The increase in the number of cycles using elective sex selection seen in this study may reflect the growing number of clinics offering [PGT] for nonmedical sex selection as well as increasing public awareness of preimplantation genetic testing,” the researchers wrote.
However, the socioeconomic characteristics of women may play a role in the use of PGT, as those living in states with no mandate must be able pay the cost of IVF procedures, as well as the cost of PGT if desired, they noted.
“Because fertility centers may offer patients the choice to select the sex of their embryo after preimplantation genetic testing, this may in effect permit elective sex selection,” the researchers said. The shift in the male-female sex ratio in these cases “is concerning given the implications for future social demographics as IVF and preimplantation genetic testing utilization increase, and the negative effect outcomes could have on medical insurance policy and allocation of resources for medically indicated IVF and preimplantation genetic testing.”
The study findings were limited by several factors including the lack of clinic identifiers and lack of data characteristics including, race, ethnicity, and previous live births, the researchers noted. Other limitations included a lack of data on the sex preferences of the couple, and whether the sex of the embryo was known, and whether male and female embryos were transferred. Also, no states have mandates to cover PGT, and the limited study period may not generalize to current practices.
However, the study strengths include the large size and comprehensive database, and have implications for future policies and expansion of insurance coverage for infertility treatment and for preventing transmission of genetic diseases, they said.
Be mindful of consequences of testing
In an interview, Dr. Jungheim said she was surprised by some of the findings. “I thought we would see that PGT-A utilization was lower in states without mandates given the already high cost of IVF for patients paying out of pocket. I was also surprised to see that more males were born after PGT-A; it suggests that overall, patients using PGT-A favor males.
“For clinicians, we need to be mindful of the long-term impact of our practices,” she emphasized. “Shifting the sex ratio in favor of one sex or the other is an unintended consequence of IVF with PGT-A that can have negative implications for future generations.”
In the study, the researchers proposed a revision to the American Society for Reproductive Medicine Ethics Committee opinion on sex selection to provide guidance in keeping with ASRM’s mission of “accessible, ethical, and quality reproductive care for every person.”
However, “even if the ASRM Ethics Committee Opinion was revised, it’s up to clinicians to decide what they are comfortable with,” said Dr. Jungheim. “When patients are paying out of pocket for expensive treatments that require emotional investment and time, it can be difficult to keep medical decision making strictly evidence based.” Improved insurance coverage and access to fertility care may help with some of these decisions, but more real-world evidence is needed.
Let’s talk about sex (selection)
The study findings are both “novel and sobering,” and enhance the current body of evidence of associations between state insurance mandates and IVF outcomes, Jennifer Eaton, MD, of Brown University, Providence, R.I., wrote in an accompanying editorial.
“The association between mandate status and elective sex selection is particularly eye-opening,” said Dr. Eaton. The overall increased use of PGT for sex selection does not account for sex selection as part of testing for aneuploidy. In fact, “patients with euploid embryos of both sexes are frequently given the opportunity to select which embryo to transfer.”
The current study provides “compelling evidence that it is time to revisit the ethical dilemma of elective sex selection in the United States,” Dr. Eaton emphasized. The current ASRM guidance states that IVF clinics are not obligated to provide or refuse to provide nonmedically indicated methods of sex selection, but in light of the current study and other studies, a revision to the existing ASRM Ethics Committee opinion is needed.
The study received no outside funding. Neither the researchers nor Dr. Eaton had any financial conflicts to disclose.
FROM OBSTETRICS & GYNECOLOGY