User login
What are the benefits of a fourth vaccination against COVID?
The fourth vaccination against COVID-19 is the subject of intense discussion. Immunity against new Omicron variants (currently BA.4 and BA.5) is getting weaker and weaker. Is another vaccination with the available vaccines worth it?
For Leif Erik Sander, MD, director of infectious diseases and pneumology at Charité University Medicine, Berlin, the latest data send a clear message. “The COVID-19 vaccination is still effective against Omicron. After three doses of the vaccine, it continues to prevent severe diseases, respiratory failures, and death,” he reported at the 62nd Congress of the German Pneumology and Respiratory Medicine Society in Leipzig.
The most recent data from the United Kingdom show that the vaccine’s effectiveness against Omicron decreases after just a few months, which speaks in favor of a fourth vaccination. “Omicron is a development that we did not anticipate occurring so early on,” said Dr. Sander.
In terms of phylogenetics, Omicron is far removed from the previous variants of concern. More than 30 mutations to the spike protein (the antigen that is vaccinated against) foster the loss of immunity.
Boosters broaden immunity
“The booster makes all the difference here,” emphasized Dr. Sander. Experiments at Charité Berlin show that after double vaccination, the vaccination sera from healthy young people no longer neutralizes Omicron.
“The third vaccination broadens the humoral immune response against the spike protein so that conserved epitopes that are unchanged, even in Omicron, are addressed, with the result that you have neutralization capacity again,” the infectious diseases specialist explained.
Continued protection
However, data from the United Kingdom on vaccine effectiveness show where the limit lies. Initially, after three doses, vaccine effectiveness against symptomatic disease after Omicron infection is very good. This effectiveness decreases significantly over the course of the next few months. “Lots of people experience an Omicron infection despite the booster,” said Mr. Sander.
Nonetheless, the high incidence of Omicron infections in the recent past has not overwhelmed the health care system. “This is because the vaccine’s effectiveness against severe diseases that require hospitalization and against respiratory failure is still good in the at-risk population over the age of 65, once they have had their three vaccinations,” said Dr. Sander. The data also show that there is good protection of over 90%, even against mortality.
Waning observed
It could be said that currently, vaccination even continues to work against Omicron, says Dr. Sander. It prevents severe disease, respiratory failure, and death. Nonetheless, after just 3 months, a slight waning of immune protection can be observed in all three endpoints.
Therefore, the question arises as to whether a fourth vaccination is worthwhile. In Israel, “Delta was successfully eradicated with the third vaccination,” and now they are trying this again for Omicron with a fourth vaccination, reported Dr. Sander.
Fourth vaccination protective
The first investigations show that protection against severe disease can be increased once more. “For the over-60s, protection is almost quadrupled through the fourth vaccination,” says Dr. Sander. “However, this is still plagued with a lot of uncertainty; it is still not known how stable it is.”
There is hope on the basis of results of an as yet non–peer-reviewed study from Sweden, which is currently available only as a preprint. That study shows that a fourth vaccination in a high-risk population of care-home residents and people older than 80 years can halve overall mortality. “If this can be confirmed and replicated, it must be recommended quite extensively for this high-risk group,” said Dr. Sander. The Standing Committee on Vaccination in Germany is currently recommending that high-risk groups be vaccinated against COVID-19 for the fourth time. To date, though, this has only been implemented halfheartedly.
Propensity for mutation
Omicron keeps developing. Following BA.1 and the more infectious subvariant BA.2, BA.4 and BA.5 are spreading in Germany. “To date, there is no evidence that vaccine protection against severe diseases has changed as a result of BA.2 emerging,” said Dr. Sander.
However, the loss of immunity against BA.4 and BA.5 is more strongly pronounced. “If you were infected with BA.1, you are not immune to BA.5,” says Dr. Sander. Lessened immunity from BA.4 and BA.5 is even more pronounced. “Anyone who was infected with BA.1 is not immune to BA.5,” says Dr. Sander. The two clades not only have spike protein mutations shared by BA.2 but also additional spike protein mutations. According to the expert, it could well be that these strains will prevail because they are best able to avoid the immunity of the population.
Adapted vaccines feasible?
“Vaccines adapted to BA.1 were developed very early on and were also part of clinical research,” said Dr. Sander. The initial data indicate that additional antibody responses are being mobilized that may neutralize the new variants.
It was deduced from trials on monkeys that the available vaccines were so good that only small improvements were to be expected, said Dr. Sander.
Moderna’s adapted vaccine
The U.S. pharmaceutical company Moderna recently submitted the first results regarding its bivalent Omicron vaccine mRNA-1273.214, which is adapted to Omicron BA.1. Data from BioNTech are expected soon.
Moderna tested a booster that contains both the spike mRNA from the original vaccine and a new mRNA adapted to the Omicron variant BA.1. The experimental vaccine mRNA-1273.214 exhibited an eightfold increase in geometric mean neutralization titer against Omicron in study participants who were seronegative at the start, compared with the already-approved vaccine.
In its latest notice, Moderna did not publish any data on how effective the updated vaccine is against the virus variants BA.4 or BA.5. Data on clinical endpoints, such as hospitalization or mortality, are also not available.
Conservative epitopes
Should it be assumed that the development of vaccines will always lag the emergence of new subvariants? In this respect, Dr. Sander appears optimistic. “The immunological mechanism is clear, that various B cells and antibodies will be formed that are directed against conservative epitopes that have various variants. This is good news, since we do not want to protect against BA.1 now, just for BA.8 to emerge when the vaccine goes to market. We want to protect ourselves as broadly as possible, and it seems like it may be possible to do so with this vaccine.”
Double vaccination?
Dr. Sander anticipates that a fourth vaccination against COVID-19 will occur with the next wave of the coronavirus in September or October. He remarked that coupling it with the influenza vaccination should be considered.
The coronavirus pandemic has led to shifts in other seasonal waves of pathogens. In the summer, pediatric departments were unexpectedly inundated with children suffering from RSV infections. And while the flu season over the past 2 years has been almost absent, the influenza wave may occur significantly earlier than usual this year.
“In Australia, the influenza wave arrived much earlier this year than usual, which may of course also be fruitful for us,” said Dr. Sander. “Perhaps we will also get influenza as early as in September or October. I would then plead for vaccine centers to be allowed to vaccinate against both influenza and COVID-19 at the same time. Maybe then we will also have a reasonable influenza vaccination rate,” he added.
This article was translated from the Medscape German edition.
A version of this article first appeared on Medscape.com.
The fourth vaccination against COVID-19 is the subject of intense discussion. Immunity against new Omicron variants (currently BA.4 and BA.5) is getting weaker and weaker. Is another vaccination with the available vaccines worth it?
For Leif Erik Sander, MD, director of infectious diseases and pneumology at Charité University Medicine, Berlin, the latest data send a clear message. “The COVID-19 vaccination is still effective against Omicron. After three doses of the vaccine, it continues to prevent severe diseases, respiratory failures, and death,” he reported at the 62nd Congress of the German Pneumology and Respiratory Medicine Society in Leipzig.
The most recent data from the United Kingdom show that the vaccine’s effectiveness against Omicron decreases after just a few months, which speaks in favor of a fourth vaccination. “Omicron is a development that we did not anticipate occurring so early on,” said Dr. Sander.
In terms of phylogenetics, Omicron is far removed from the previous variants of concern. More than 30 mutations to the spike protein (the antigen that is vaccinated against) foster the loss of immunity.
Boosters broaden immunity
“The booster makes all the difference here,” emphasized Dr. Sander. Experiments at Charité Berlin show that after double vaccination, the vaccination sera from healthy young people no longer neutralizes Omicron.
“The third vaccination broadens the humoral immune response against the spike protein so that conserved epitopes that are unchanged, even in Omicron, are addressed, with the result that you have neutralization capacity again,” the infectious diseases specialist explained.
Continued protection
However, data from the United Kingdom on vaccine effectiveness show where the limit lies. Initially, after three doses, vaccine effectiveness against symptomatic disease after Omicron infection is very good. This effectiveness decreases significantly over the course of the next few months. “Lots of people experience an Omicron infection despite the booster,” said Mr. Sander.
Nonetheless, the high incidence of Omicron infections in the recent past has not overwhelmed the health care system. “This is because the vaccine’s effectiveness against severe diseases that require hospitalization and against respiratory failure is still good in the at-risk population over the age of 65, once they have had their three vaccinations,” said Dr. Sander. The data also show that there is good protection of over 90%, even against mortality.
Waning observed
It could be said that currently, vaccination even continues to work against Omicron, says Dr. Sander. It prevents severe disease, respiratory failure, and death. Nonetheless, after just 3 months, a slight waning of immune protection can be observed in all three endpoints.
Therefore, the question arises as to whether a fourth vaccination is worthwhile. In Israel, “Delta was successfully eradicated with the third vaccination,” and now they are trying this again for Omicron with a fourth vaccination, reported Dr. Sander.
Fourth vaccination protective
The first investigations show that protection against severe disease can be increased once more. “For the over-60s, protection is almost quadrupled through the fourth vaccination,” says Dr. Sander. “However, this is still plagued with a lot of uncertainty; it is still not known how stable it is.”
There is hope on the basis of results of an as yet non–peer-reviewed study from Sweden, which is currently available only as a preprint. That study shows that a fourth vaccination in a high-risk population of care-home residents and people older than 80 years can halve overall mortality. “If this can be confirmed and replicated, it must be recommended quite extensively for this high-risk group,” said Dr. Sander. The Standing Committee on Vaccination in Germany is currently recommending that high-risk groups be vaccinated against COVID-19 for the fourth time. To date, though, this has only been implemented halfheartedly.
Propensity for mutation
Omicron keeps developing. Following BA.1 and the more infectious subvariant BA.2, BA.4 and BA.5 are spreading in Germany. “To date, there is no evidence that vaccine protection against severe diseases has changed as a result of BA.2 emerging,” said Dr. Sander.
However, the loss of immunity against BA.4 and BA.5 is more strongly pronounced. “If you were infected with BA.1, you are not immune to BA.5,” says Dr. Sander. Lessened immunity from BA.4 and BA.5 is even more pronounced. “Anyone who was infected with BA.1 is not immune to BA.5,” says Dr. Sander. The two clades not only have spike protein mutations shared by BA.2 but also additional spike protein mutations. According to the expert, it could well be that these strains will prevail because they are best able to avoid the immunity of the population.
Adapted vaccines feasible?
“Vaccines adapted to BA.1 were developed very early on and were also part of clinical research,” said Dr. Sander. The initial data indicate that additional antibody responses are being mobilized that may neutralize the new variants.
It was deduced from trials on monkeys that the available vaccines were so good that only small improvements were to be expected, said Dr. Sander.
Moderna’s adapted vaccine
The U.S. pharmaceutical company Moderna recently submitted the first results regarding its bivalent Omicron vaccine mRNA-1273.214, which is adapted to Omicron BA.1. Data from BioNTech are expected soon.
Moderna tested a booster that contains both the spike mRNA from the original vaccine and a new mRNA adapted to the Omicron variant BA.1. The experimental vaccine mRNA-1273.214 exhibited an eightfold increase in geometric mean neutralization titer against Omicron in study participants who were seronegative at the start, compared with the already-approved vaccine.
In its latest notice, Moderna did not publish any data on how effective the updated vaccine is against the virus variants BA.4 or BA.5. Data on clinical endpoints, such as hospitalization or mortality, are also not available.
Conservative epitopes
Should it be assumed that the development of vaccines will always lag the emergence of new subvariants? In this respect, Dr. Sander appears optimistic. “The immunological mechanism is clear, that various B cells and antibodies will be formed that are directed against conservative epitopes that have various variants. This is good news, since we do not want to protect against BA.1 now, just for BA.8 to emerge when the vaccine goes to market. We want to protect ourselves as broadly as possible, and it seems like it may be possible to do so with this vaccine.”
Double vaccination?
Dr. Sander anticipates that a fourth vaccination against COVID-19 will occur with the next wave of the coronavirus in September or October. He remarked that coupling it with the influenza vaccination should be considered.
The coronavirus pandemic has led to shifts in other seasonal waves of pathogens. In the summer, pediatric departments were unexpectedly inundated with children suffering from RSV infections. And while the flu season over the past 2 years has been almost absent, the influenza wave may occur significantly earlier than usual this year.
“In Australia, the influenza wave arrived much earlier this year than usual, which may of course also be fruitful for us,” said Dr. Sander. “Perhaps we will also get influenza as early as in September or October. I would then plead for vaccine centers to be allowed to vaccinate against both influenza and COVID-19 at the same time. Maybe then we will also have a reasonable influenza vaccination rate,” he added.
This article was translated from the Medscape German edition.
A version of this article first appeared on Medscape.com.
The fourth vaccination against COVID-19 is the subject of intense discussion. Immunity against new Omicron variants (currently BA.4 and BA.5) is getting weaker and weaker. Is another vaccination with the available vaccines worth it?
For Leif Erik Sander, MD, director of infectious diseases and pneumology at Charité University Medicine, Berlin, the latest data send a clear message. “The COVID-19 vaccination is still effective against Omicron. After three doses of the vaccine, it continues to prevent severe diseases, respiratory failures, and death,” he reported at the 62nd Congress of the German Pneumology and Respiratory Medicine Society in Leipzig.
The most recent data from the United Kingdom show that the vaccine’s effectiveness against Omicron decreases after just a few months, which speaks in favor of a fourth vaccination. “Omicron is a development that we did not anticipate occurring so early on,” said Dr. Sander.
In terms of phylogenetics, Omicron is far removed from the previous variants of concern. More than 30 mutations to the spike protein (the antigen that is vaccinated against) foster the loss of immunity.
Boosters broaden immunity
“The booster makes all the difference here,” emphasized Dr. Sander. Experiments at Charité Berlin show that after double vaccination, the vaccination sera from healthy young people no longer neutralizes Omicron.
“The third vaccination broadens the humoral immune response against the spike protein so that conserved epitopes that are unchanged, even in Omicron, are addressed, with the result that you have neutralization capacity again,” the infectious diseases specialist explained.
Continued protection
However, data from the United Kingdom on vaccine effectiveness show where the limit lies. Initially, after three doses, vaccine effectiveness against symptomatic disease after Omicron infection is very good. This effectiveness decreases significantly over the course of the next few months. “Lots of people experience an Omicron infection despite the booster,” said Mr. Sander.
Nonetheless, the high incidence of Omicron infections in the recent past has not overwhelmed the health care system. “This is because the vaccine’s effectiveness against severe diseases that require hospitalization and against respiratory failure is still good in the at-risk population over the age of 65, once they have had their three vaccinations,” said Dr. Sander. The data also show that there is good protection of over 90%, even against mortality.
Waning observed
It could be said that currently, vaccination even continues to work against Omicron, says Dr. Sander. It prevents severe disease, respiratory failure, and death. Nonetheless, after just 3 months, a slight waning of immune protection can be observed in all three endpoints.
Therefore, the question arises as to whether a fourth vaccination is worthwhile. In Israel, “Delta was successfully eradicated with the third vaccination,” and now they are trying this again for Omicron with a fourth vaccination, reported Dr. Sander.
Fourth vaccination protective
The first investigations show that protection against severe disease can be increased once more. “For the over-60s, protection is almost quadrupled through the fourth vaccination,” says Dr. Sander. “However, this is still plagued with a lot of uncertainty; it is still not known how stable it is.”
There is hope on the basis of results of an as yet non–peer-reviewed study from Sweden, which is currently available only as a preprint. That study shows that a fourth vaccination in a high-risk population of care-home residents and people older than 80 years can halve overall mortality. “If this can be confirmed and replicated, it must be recommended quite extensively for this high-risk group,” said Dr. Sander. The Standing Committee on Vaccination in Germany is currently recommending that high-risk groups be vaccinated against COVID-19 for the fourth time. To date, though, this has only been implemented halfheartedly.
Propensity for mutation
Omicron keeps developing. Following BA.1 and the more infectious subvariant BA.2, BA.4 and BA.5 are spreading in Germany. “To date, there is no evidence that vaccine protection against severe diseases has changed as a result of BA.2 emerging,” said Dr. Sander.
However, the loss of immunity against BA.4 and BA.5 is more strongly pronounced. “If you were infected with BA.1, you are not immune to BA.5,” says Dr. Sander. Lessened immunity from BA.4 and BA.5 is even more pronounced. “Anyone who was infected with BA.1 is not immune to BA.5,” says Dr. Sander. The two clades not only have spike protein mutations shared by BA.2 but also additional spike protein mutations. According to the expert, it could well be that these strains will prevail because they are best able to avoid the immunity of the population.
Adapted vaccines feasible?
“Vaccines adapted to BA.1 were developed very early on and were also part of clinical research,” said Dr. Sander. The initial data indicate that additional antibody responses are being mobilized that may neutralize the new variants.
It was deduced from trials on monkeys that the available vaccines were so good that only small improvements were to be expected, said Dr. Sander.
Moderna’s adapted vaccine
The U.S. pharmaceutical company Moderna recently submitted the first results regarding its bivalent Omicron vaccine mRNA-1273.214, which is adapted to Omicron BA.1. Data from BioNTech are expected soon.
Moderna tested a booster that contains both the spike mRNA from the original vaccine and a new mRNA adapted to the Omicron variant BA.1. The experimental vaccine mRNA-1273.214 exhibited an eightfold increase in geometric mean neutralization titer against Omicron in study participants who were seronegative at the start, compared with the already-approved vaccine.
In its latest notice, Moderna did not publish any data on how effective the updated vaccine is against the virus variants BA.4 or BA.5. Data on clinical endpoints, such as hospitalization or mortality, are also not available.
Conservative epitopes
Should it be assumed that the development of vaccines will always lag the emergence of new subvariants? In this respect, Dr. Sander appears optimistic. “The immunological mechanism is clear, that various B cells and antibodies will be formed that are directed against conservative epitopes that have various variants. This is good news, since we do not want to protect against BA.1 now, just for BA.8 to emerge when the vaccine goes to market. We want to protect ourselves as broadly as possible, and it seems like it may be possible to do so with this vaccine.”
Double vaccination?
Dr. Sander anticipates that a fourth vaccination against COVID-19 will occur with the next wave of the coronavirus in September or October. He remarked that coupling it with the influenza vaccination should be considered.
The coronavirus pandemic has led to shifts in other seasonal waves of pathogens. In the summer, pediatric departments were unexpectedly inundated with children suffering from RSV infections. And while the flu season over the past 2 years has been almost absent, the influenza wave may occur significantly earlier than usual this year.
“In Australia, the influenza wave arrived much earlier this year than usual, which may of course also be fruitful for us,” said Dr. Sander. “Perhaps we will also get influenza as early as in September or October. I would then plead for vaccine centers to be allowed to vaccinate against both influenza and COVID-19 at the same time. Maybe then we will also have a reasonable influenza vaccination rate,” he added.
This article was translated from the Medscape German edition.
A version of this article first appeared on Medscape.com.
Menstrual phase impacts exercise effects in type 1 diabetes
Women with type 1 diabetes may need additional glucose after exercise during the luteal phase of the menstrual cycle, compared with other times, according to a study in nine women.
“We know that exercise is very beneficial for people with type 1 diabetes; we also know that fear of hypoglycemia is a major barrier to exercise in this population,” said Jane E. Yardley, PhD, in a presentation at the annual scientific sessions of the American Diabetes Association, New Orleans. Women with type 1 diabetes (T1D) perceive more barriers, compared with men, she added.
The menstrual cycle could be an additional barrier to exercise for women with T1D because it increases glucose fluctuations that have not been well documented in the literature to date, said Dr. Yardley, of the University of Alberta, Augustana.
The follicular phase of the menstrual cycle lasts from menses to the midcycle, about 14 days later. This is followed by the luteal phase, which lasts until approximately day 28, Dr. Yardley explained. Data on insulin sensitivity have shown that the late luteal phase is associated with “a little less insulin sensitivity” in women with T1D, she noted.
To assess the relationship between menstrual cycle, glucose control, and exercise, Dr. Yardley and colleagues compared the effects of a moderate aerobic exercise on glycemic responses between the early follicular and late luteal phases of the menstrual cycle in nine female participants with T1D.
The exercise involved 45 minutes of aerobic cycling at 50% of predetermined peak oxygen uptake (VO2peak) for 45 min. The mean age of the participants was 30.2 years, the mean hemoglobin A1C was 7.4%, and the mean VO2peak was 32.5 mL/kg per min. The women reported regular menstrual cycles, and none were using oral contraceptives.
Blood samples were collected before and immediately after exercise and after an hour of recovery. Participants wore continuous glucose monitors for at least 1 hour before and after exercise.
Menstrual cycle was confirmed via estrogen, estradiol, and progesterone.
Insulin levels varied greatly among the study participants, but the differences were not significant, Dr. Yardley said. Glucose levels consistently decreased during exercise and increased after exercise, she noted.
No significant difference in glucose was observed between the follicular and luteal phases.
However, “this needs to be interpreted in the context of the safety profiles that are in place in our lab,” which include carbohydrate supplements for individuals whose blood glucose levels drop below 4.5 mmol/L, she said.
In the current study, 6 of 9 participants required additional carbohydrates during the luteal phase, but only 1 participant needed additional carbohydrates during the follicular phase, she noted. For this reason, no differences were noted. “We actually prevented changes,” she said.
No significant differences were noted in mean glucose levels or number of hypoglycemic episodes at any of the time points between the two phases.
“One place where we did see a difference was in hyperglycemia 24 hours after exercise,” Dr. Yardley said. Level 1 hyperglycemia 24 hours after exercise was significantly more frequent in the follicular phase, compared with the luteal phase (P = .028).
The study findings were limited by the small sample size and homogenous population, and more research is needed to interpret the data, said Dr. Yardley.
However, the need for more glucose supplementation to prevent hypoglycemia during the luteal phase suggests a higher hypoglycemic risk associated with aerobic exercise during this time, she said.
In addition, the results suggest that the menstrual cycle should be taken into consideration when female participants are involved in exercise studies, she noted.
Study supports personalized exercise plans
“It is important to evaluate effects of exercise in people with type 1 diabetes and evaluate whether there is a difference those effects in men and women,” said Helena W. Rodbard, MD, an endocrinologist in private practice in Rockville, Md., in an interview. “There is also a need to evaluate to what extent the changes in blood glucose patterns in women in response to exercise differ depending on the phase of the ovarian cycle,” said Dr. Rodbard, who was not involved in the study.

In the current study, “the researchers observed a decline in glucose during a 45-minute period of moderate aerobic exercise, cycling at 50% VO2peak followed by an increase during a 60-minute recovery period. There was a suggestive finding, in the nine subjects, that more carbohydrate supplementation was needed during the late luteal phase of the menstrual cycle than during the follicular phase,” Dr. Rodbard noted. “In contrast, the authors reported a significantly increased degree of hyperglycemia during the recovery phase for subjects during the follicular phase. These findings are consistent with and extend several recent studies from Dr. Yardley and coworkers, who have been focused on this area of research,” she said.
“This study provides provocative evidence that glucose responses to aerobic exercise in women may depend on the timing in relationship to their ovarian cycle,” said Dr. Rodbard. “These findings are based on a small group of subjects and were present in some but not all subjects. Clinicians should encourage women to evaluate and record their experiences during and after exercise in terms of need for carbohydrate supplementation for documented or symptomatic hypoglycemia and in terms of glucose changes as recorded using continuous glucose monitoring (CGM), both in relation to type of exercise and in relation to time in the menstrual cycle,” she said.
The findings also highlight the importance of individualized therapy that is “based on subjective inputs combined with analysis of CGM data during and following exercise,” said Dr. Rodbard. “It is likely that use of Automated Insulin Delivery (AID) will be helpful in achieving this level of individualization in view of the wide range of types, intensity, and duration of physical activity and exercise in which people with T1D engage and the myriad factors that can influence the glycemic response,” she said.
Looking ahead, “the authors and others should expand the present series of subjects using aerobic exercise and examine other types of exercise as well,” Dr. Rodbard noted. “It will be important to evaluate the consistency of these changes in glucose patterns within individuals on multiple occasions, and it would be helpful to repeat the studies in women using oral contraceptives.”
Dr. Yardley disclosed research support from Abbott, Dexcom, and LifeScan and disclosed serving on the speaker’s bureau for Abbott Diabetes. Dr. Rodbard had no financial conflicts to disclose. She serves on the Editorial Advisory Board of Clinical Endocrinology News.
Women with type 1 diabetes may need additional glucose after exercise during the luteal phase of the menstrual cycle, compared with other times, according to a study in nine women.
“We know that exercise is very beneficial for people with type 1 diabetes; we also know that fear of hypoglycemia is a major barrier to exercise in this population,” said Jane E. Yardley, PhD, in a presentation at the annual scientific sessions of the American Diabetes Association, New Orleans. Women with type 1 diabetes (T1D) perceive more barriers, compared with men, she added.
The menstrual cycle could be an additional barrier to exercise for women with T1D because it increases glucose fluctuations that have not been well documented in the literature to date, said Dr. Yardley, of the University of Alberta, Augustana.
The follicular phase of the menstrual cycle lasts from menses to the midcycle, about 14 days later. This is followed by the luteal phase, which lasts until approximately day 28, Dr. Yardley explained. Data on insulin sensitivity have shown that the late luteal phase is associated with “a little less insulin sensitivity” in women with T1D, she noted.
To assess the relationship between menstrual cycle, glucose control, and exercise, Dr. Yardley and colleagues compared the effects of a moderate aerobic exercise on glycemic responses between the early follicular and late luteal phases of the menstrual cycle in nine female participants with T1D.
The exercise involved 45 minutes of aerobic cycling at 50% of predetermined peak oxygen uptake (VO2peak) for 45 min. The mean age of the participants was 30.2 years, the mean hemoglobin A1C was 7.4%, and the mean VO2peak was 32.5 mL/kg per min. The women reported regular menstrual cycles, and none were using oral contraceptives.
Blood samples were collected before and immediately after exercise and after an hour of recovery. Participants wore continuous glucose monitors for at least 1 hour before and after exercise.
Menstrual cycle was confirmed via estrogen, estradiol, and progesterone.
Insulin levels varied greatly among the study participants, but the differences were not significant, Dr. Yardley said. Glucose levels consistently decreased during exercise and increased after exercise, she noted.
No significant difference in glucose was observed between the follicular and luteal phases.
However, “this needs to be interpreted in the context of the safety profiles that are in place in our lab,” which include carbohydrate supplements for individuals whose blood glucose levels drop below 4.5 mmol/L, she said.
In the current study, 6 of 9 participants required additional carbohydrates during the luteal phase, but only 1 participant needed additional carbohydrates during the follicular phase, she noted. For this reason, no differences were noted. “We actually prevented changes,” she said.
No significant differences were noted in mean glucose levels or number of hypoglycemic episodes at any of the time points between the two phases.
“One place where we did see a difference was in hyperglycemia 24 hours after exercise,” Dr. Yardley said. Level 1 hyperglycemia 24 hours after exercise was significantly more frequent in the follicular phase, compared with the luteal phase (P = .028).
The study findings were limited by the small sample size and homogenous population, and more research is needed to interpret the data, said Dr. Yardley.
However, the need for more glucose supplementation to prevent hypoglycemia during the luteal phase suggests a higher hypoglycemic risk associated with aerobic exercise during this time, she said.
In addition, the results suggest that the menstrual cycle should be taken into consideration when female participants are involved in exercise studies, she noted.
Study supports personalized exercise plans
“It is important to evaluate effects of exercise in people with type 1 diabetes and evaluate whether there is a difference those effects in men and women,” said Helena W. Rodbard, MD, an endocrinologist in private practice in Rockville, Md., in an interview. “There is also a need to evaluate to what extent the changes in blood glucose patterns in women in response to exercise differ depending on the phase of the ovarian cycle,” said Dr. Rodbard, who was not involved in the study.
In the current study, “the researchers observed a decline in glucose during a 45-minute period of moderate aerobic exercise, cycling at 50% VO2peak followed by an increase during a 60-minute recovery period. There was a suggestive finding, in the nine subjects, that more carbohydrate supplementation was needed during the late luteal phase of the menstrual cycle than during the follicular phase,” Dr. Rodbard noted. “In contrast, the authors reported a significantly increased degree of hyperglycemia during the recovery phase for subjects during the follicular phase. These findings are consistent with and extend several recent studies from Dr. Yardley and coworkers, who have been focused on this area of research,” she said.
“This study provides provocative evidence that glucose responses to aerobic exercise in women may depend on the timing in relationship to their ovarian cycle,” said Dr. Rodbard. “These findings are based on a small group of subjects and were present in some but not all subjects. Clinicians should encourage women to evaluate and record their experiences during and after exercise in terms of need for carbohydrate supplementation for documented or symptomatic hypoglycemia and in terms of glucose changes as recorded using continuous glucose monitoring (CGM), both in relation to type of exercise and in relation to time in the menstrual cycle,” she said.
The findings also highlight the importance of individualized therapy that is “based on subjective inputs combined with analysis of CGM data during and following exercise,” said Dr. Rodbard. “It is likely that use of Automated Insulin Delivery (AID) will be helpful in achieving this level of individualization in view of the wide range of types, intensity, and duration of physical activity and exercise in which people with T1D engage and the myriad factors that can influence the glycemic response,” she said.
Looking ahead, “the authors and others should expand the present series of subjects using aerobic exercise and examine other types of exercise as well,” Dr. Rodbard noted. “It will be important to evaluate the consistency of these changes in glucose patterns within individuals on multiple occasions, and it would be helpful to repeat the studies in women using oral contraceptives.”
Dr. Yardley disclosed research support from Abbott, Dexcom, and LifeScan and disclosed serving on the speaker’s bureau for Abbott Diabetes. Dr. Rodbard had no financial conflicts to disclose. She serves on the Editorial Advisory Board of Clinical Endocrinology News.
Women with type 1 diabetes may need additional glucose after exercise during the luteal phase of the menstrual cycle, compared with other times, according to a study in nine women.
“We know that exercise is very beneficial for people with type 1 diabetes; we also know that fear of hypoglycemia is a major barrier to exercise in this population,” said Jane E. Yardley, PhD, in a presentation at the annual scientific sessions of the American Diabetes Association, New Orleans. Women with type 1 diabetes (T1D) perceive more barriers, compared with men, she added.
The menstrual cycle could be an additional barrier to exercise for women with T1D because it increases glucose fluctuations that have not been well documented in the literature to date, said Dr. Yardley, of the University of Alberta, Augustana.
The follicular phase of the menstrual cycle lasts from menses to the midcycle, about 14 days later. This is followed by the luteal phase, which lasts until approximately day 28, Dr. Yardley explained. Data on insulin sensitivity have shown that the late luteal phase is associated with “a little less insulin sensitivity” in women with T1D, she noted.
To assess the relationship between menstrual cycle, glucose control, and exercise, Dr. Yardley and colleagues compared the effects of a moderate aerobic exercise on glycemic responses between the early follicular and late luteal phases of the menstrual cycle in nine female participants with T1D.
The exercise involved 45 minutes of aerobic cycling at 50% of predetermined peak oxygen uptake (VO2peak) for 45 min. The mean age of the participants was 30.2 years, the mean hemoglobin A1C was 7.4%, and the mean VO2peak was 32.5 mL/kg per min. The women reported regular menstrual cycles, and none were using oral contraceptives.
Blood samples were collected before and immediately after exercise and after an hour of recovery. Participants wore continuous glucose monitors for at least 1 hour before and after exercise.
Menstrual cycle was confirmed via estrogen, estradiol, and progesterone.
Insulin levels varied greatly among the study participants, but the differences were not significant, Dr. Yardley said. Glucose levels consistently decreased during exercise and increased after exercise, she noted.
No significant difference in glucose was observed between the follicular and luteal phases.
However, “this needs to be interpreted in the context of the safety profiles that are in place in our lab,” which include carbohydrate supplements for individuals whose blood glucose levels drop below 4.5 mmol/L, she said.
In the current study, 6 of 9 participants required additional carbohydrates during the luteal phase, but only 1 participant needed additional carbohydrates during the follicular phase, she noted. For this reason, no differences were noted. “We actually prevented changes,” she said.
No significant differences were noted in mean glucose levels or number of hypoglycemic episodes at any of the time points between the two phases.
“One place where we did see a difference was in hyperglycemia 24 hours after exercise,” Dr. Yardley said. Level 1 hyperglycemia 24 hours after exercise was significantly more frequent in the follicular phase, compared with the luteal phase (P = .028).
The study findings were limited by the small sample size and homogenous population, and more research is needed to interpret the data, said Dr. Yardley.
However, the need for more glucose supplementation to prevent hypoglycemia during the luteal phase suggests a higher hypoglycemic risk associated with aerobic exercise during this time, she said.
In addition, the results suggest that the menstrual cycle should be taken into consideration when female participants are involved in exercise studies, she noted.
Study supports personalized exercise plans
“It is important to evaluate effects of exercise in people with type 1 diabetes and evaluate whether there is a difference those effects in men and women,” said Helena W. Rodbard, MD, an endocrinologist in private practice in Rockville, Md., in an interview. “There is also a need to evaluate to what extent the changes in blood glucose patterns in women in response to exercise differ depending on the phase of the ovarian cycle,” said Dr. Rodbard, who was not involved in the study.
In the current study, “the researchers observed a decline in glucose during a 45-minute period of moderate aerobic exercise, cycling at 50% VO2peak followed by an increase during a 60-minute recovery period. There was a suggestive finding, in the nine subjects, that more carbohydrate supplementation was needed during the late luteal phase of the menstrual cycle than during the follicular phase,” Dr. Rodbard noted. “In contrast, the authors reported a significantly increased degree of hyperglycemia during the recovery phase for subjects during the follicular phase. These findings are consistent with and extend several recent studies from Dr. Yardley and coworkers, who have been focused on this area of research,” she said.
“This study provides provocative evidence that glucose responses to aerobic exercise in women may depend on the timing in relationship to their ovarian cycle,” said Dr. Rodbard. “These findings are based on a small group of subjects and were present in some but not all subjects. Clinicians should encourage women to evaluate and record their experiences during and after exercise in terms of need for carbohydrate supplementation for documented or symptomatic hypoglycemia and in terms of glucose changes as recorded using continuous glucose monitoring (CGM), both in relation to type of exercise and in relation to time in the menstrual cycle,” she said.
The findings also highlight the importance of individualized therapy that is “based on subjective inputs combined with analysis of CGM data during and following exercise,” said Dr. Rodbard. “It is likely that use of Automated Insulin Delivery (AID) will be helpful in achieving this level of individualization in view of the wide range of types, intensity, and duration of physical activity and exercise in which people with T1D engage and the myriad factors that can influence the glycemic response,” she said.
Looking ahead, “the authors and others should expand the present series of subjects using aerobic exercise and examine other types of exercise as well,” Dr. Rodbard noted. “It will be important to evaluate the consistency of these changes in glucose patterns within individuals on multiple occasions, and it would be helpful to repeat the studies in women using oral contraceptives.”
Dr. Yardley disclosed research support from Abbott, Dexcom, and LifeScan and disclosed serving on the speaker’s bureau for Abbott Diabetes. Dr. Rodbard had no financial conflicts to disclose. She serves on the Editorial Advisory Board of Clinical Endocrinology News.
FROM ADA 2022

Progression from nonradiographic to radiographic axial spondyloarthritis evaluated in multinational study
Four risk factors predicted the progression from nonradiographic to radiographic axial spondyloarthritis (axSpA) over a 5-year period in the PROOF study, a global, real-world, prospective, observational study carried out in 29 countries across six different geographic regions.
The predictors of progression within 5 years, based on the presence of radiographic sacroiliitis, included male gender, fulfillment of imaging criteria, HLA-B27 positivity, and a good response to NSAIDs, Denis Poddubnyy, MD, professor of rheumatology at Charité-Universitätsmedizin Berlin, said in his presentation of the study results at the annual European Congress of Rheumatology.

“In this study, 16% of nonradiographic axSpA patients progressed to radiographic axSpA within 5 years, with the mean time to disease progression of 2.4 years,” he said. PROOF (Patients with Axial Spondyloarthritis: Multicountry Registry of Clinical Characteristics) was originally designed to compare demographic and clinical characteristics of patients with axSpA across geographic regions.
In this particular analysis, Dr. Poddubnyy and colleagues aimed to track structural damage progression in the sacroiliac joint over time, as he explained in an interview. The study enrolled 2,633 adults with chronic back pain lasting for at least 3 months with onset before the age of 45 years. This analysis included patients diagnosed with axSpA who also fulfilled the Assessment of SpondyloArthritis international Society (ASAS) classification criteria for axSpA.
Both baseline and follow-up radiographs of sacroiliac joints were evaluated for those with an initial diagnosis of nonradiographic axSpA by two central readers; in cases when the readers disagreed on the classification – either nonradiographic or radiographic axSpA – images were adjudicated by a third reader. Radiographic progression from nonradiographic to radiographic axSpA was evaluated over the next 5 years.
Among all enrolled patients, 82% (n = 2,165) were diagnosed with axSpA and fulfilled the ASAS classification criteria. Of 1,612 who were classified by central reading, 65% had radiographic axSpA while the remaining 35% had nonradiographic axSpA. About 78% of those with nonradiographic axSpA fulfilled the ASAS classification criteria because of positive findings on imaging plus one or more features of spondyloarthritis. The other 22% were classified according to clinical criteria.
A total of 246 nonradiographic axSpA patients who had one or more follow-up radiographs of the sacroiliac joint were included in the current analysis. In this smaller group of patients, progression from the initial diagnosis of nonradiographic to radiographic axSpA at any one point over the 5-year follow-up occurred in 40 patients (16%) at a range of between 0.9 and 5.1 years.
“Females are more likely to stay in the nonradiographic stage than males,” Dr. Poddubnyy noted. Indeed, male gender conferred an over-threefold higher risk of radiographic progression, compared with females (hazard ratio, 3.16; 95% confidence interval, 1.22-8.17; P = .0174). Fulfillment of imaging criteria – in other words, the presence of inflammation on MRI – was also a strong predictor of progression, conferring an over-sixfold risk of radiographic progression (HR, 6.64; 95% CI, 1.37-32.25; P = .0188).
Interestingly, a good response to NSAIDs – the mainstay treatment for both nonradiographic and radiographic axSpA – was also significantly associated with radiographic progression, conferring an over-fourfold risk among those with an initial diagnosis of nonradiographic axSpA (HR, 4.66; 95% CI, 1.23-17.71; P = .0237). And in a separate model, HLA-B27 positivity was significantly associated with radiographic progression, conferring a nearly fourfold higher risk of progression (HR, 3.99; 95% CI, 1.10-14.49; P = .0353).
Asked if rheumatologists need to manage patients with nonradiographic axSpA differently than those with radiographic progression, Dr. Poddubnyy said that there was a small difference between the two in that biologics such as interleukin-17 inhibitors or Janus kinase inhibitors are approved for radiographic axSpA, whereas they are not approved for nonradiographic disease despite some off-label use. “We need to have high levels of symptoms plus nonresponse to NSAIDs and then we can prescribe a biologic,” he added.
For patients with nonradiographic axSpA, patients similarly need to have a high symptom burden and a nonresponse to NSAIDs, but in addition, physicians need to demonstrate objective signs of inflammatory activity, such as an elevated C-reactive protein level or the presence of inflammation on MRI before moving on the next level.
AbbVie funded the PROOF study. Dr. Poddubnyy declared receiving speaker bureau fees from AbbVie, Bristol-Myers Squibb, Eli Lilly, Merck Sharp & Dohme, Novartis, Pfizer, and UCB. He has also served as a consultant for AbbVie, Biocad, Eli Lilly, Gilead, GlaxoSmithKline, Merck Sharp & Dohme, Novartis, Pfizer, Samsung Bioepis, and UCB, as well as research support from AbbVie, Eli Lilly, Merck Sharp & Dohme, Novartis, and Pfizer. A number of coauthors also disclosed financial relationships with these and other pharmaceutical companies.
Four risk factors predicted the progression from nonradiographic to radiographic axial spondyloarthritis (axSpA) over a 5-year period in the PROOF study, a global, real-world, prospective, observational study carried out in 29 countries across six different geographic regions.
The predictors of progression within 5 years, based on the presence of radiographic sacroiliitis, included male gender, fulfillment of imaging criteria, HLA-B27 positivity, and a good response to NSAIDs, Denis Poddubnyy, MD, professor of rheumatology at Charité-Universitätsmedizin Berlin, said in his presentation of the study results at the annual European Congress of Rheumatology.
“In this study, 16% of nonradiographic axSpA patients progressed to radiographic axSpA within 5 years, with the mean time to disease progression of 2.4 years,” he said. PROOF (Patients with Axial Spondyloarthritis: Multicountry Registry of Clinical Characteristics) was originally designed to compare demographic and clinical characteristics of patients with axSpA across geographic regions.
In this particular analysis, Dr. Poddubnyy and colleagues aimed to track structural damage progression in the sacroiliac joint over time, as he explained in an interview. The study enrolled 2,633 adults with chronic back pain lasting for at least 3 months with onset before the age of 45 years. This analysis included patients diagnosed with axSpA who also fulfilled the Assessment of SpondyloArthritis international Society (ASAS) classification criteria for axSpA.
Both baseline and follow-up radiographs of sacroiliac joints were evaluated for those with an initial diagnosis of nonradiographic axSpA by two central readers; in cases when the readers disagreed on the classification – either nonradiographic or radiographic axSpA – images were adjudicated by a third reader. Radiographic progression from nonradiographic to radiographic axSpA was evaluated over the next 5 years.
Among all enrolled patients, 82% (n = 2,165) were diagnosed with axSpA and fulfilled the ASAS classification criteria. Of 1,612 who were classified by central reading, 65% had radiographic axSpA while the remaining 35% had nonradiographic axSpA. About 78% of those with nonradiographic axSpA fulfilled the ASAS classification criteria because of positive findings on imaging plus one or more features of spondyloarthritis. The other 22% were classified according to clinical criteria.
A total of 246 nonradiographic axSpA patients who had one or more follow-up radiographs of the sacroiliac joint were included in the current analysis. In this smaller group of patients, progression from the initial diagnosis of nonradiographic to radiographic axSpA at any one point over the 5-year follow-up occurred in 40 patients (16%) at a range of between 0.9 and 5.1 years.
“Females are more likely to stay in the nonradiographic stage than males,” Dr. Poddubnyy noted. Indeed, male gender conferred an over-threefold higher risk of radiographic progression, compared with females (hazard ratio, 3.16; 95% confidence interval, 1.22-8.17; P = .0174). Fulfillment of imaging criteria – in other words, the presence of inflammation on MRI – was also a strong predictor of progression, conferring an over-sixfold risk of radiographic progression (HR, 6.64; 95% CI, 1.37-32.25; P = .0188).
Interestingly, a good response to NSAIDs – the mainstay treatment for both nonradiographic and radiographic axSpA – was also significantly associated with radiographic progression, conferring an over-fourfold risk among those with an initial diagnosis of nonradiographic axSpA (HR, 4.66; 95% CI, 1.23-17.71; P = .0237). And in a separate model, HLA-B27 positivity was significantly associated with radiographic progression, conferring a nearly fourfold higher risk of progression (HR, 3.99; 95% CI, 1.10-14.49; P = .0353).
Asked if rheumatologists need to manage patients with nonradiographic axSpA differently than those with radiographic progression, Dr. Poddubnyy said that there was a small difference between the two in that biologics such as interleukin-17 inhibitors or Janus kinase inhibitors are approved for radiographic axSpA, whereas they are not approved for nonradiographic disease despite some off-label use. “We need to have high levels of symptoms plus nonresponse to NSAIDs and then we can prescribe a biologic,” he added.
For patients with nonradiographic axSpA, patients similarly need to have a high symptom burden and a nonresponse to NSAIDs, but in addition, physicians need to demonstrate objective signs of inflammatory activity, such as an elevated C-reactive protein level or the presence of inflammation on MRI before moving on the next level.
AbbVie funded the PROOF study. Dr. Poddubnyy declared receiving speaker bureau fees from AbbVie, Bristol-Myers Squibb, Eli Lilly, Merck Sharp & Dohme, Novartis, Pfizer, and UCB. He has also served as a consultant for AbbVie, Biocad, Eli Lilly, Gilead, GlaxoSmithKline, Merck Sharp & Dohme, Novartis, Pfizer, Samsung Bioepis, and UCB, as well as research support from AbbVie, Eli Lilly, Merck Sharp & Dohme, Novartis, and Pfizer. A number of coauthors also disclosed financial relationships with these and other pharmaceutical companies.
Four risk factors predicted the progression from nonradiographic to radiographic axial spondyloarthritis (axSpA) over a 5-year period in the PROOF study, a global, real-world, prospective, observational study carried out in 29 countries across six different geographic regions.
The predictors of progression within 5 years, based on the presence of radiographic sacroiliitis, included male gender, fulfillment of imaging criteria, HLA-B27 positivity, and a good response to NSAIDs, Denis Poddubnyy, MD, professor of rheumatology at Charité-Universitätsmedizin Berlin, said in his presentation of the study results at the annual European Congress of Rheumatology.
“In this study, 16% of nonradiographic axSpA patients progressed to radiographic axSpA within 5 years, with the mean time to disease progression of 2.4 years,” he said. PROOF (Patients with Axial Spondyloarthritis: Multicountry Registry of Clinical Characteristics) was originally designed to compare demographic and clinical characteristics of patients with axSpA across geographic regions.
In this particular analysis, Dr. Poddubnyy and colleagues aimed to track structural damage progression in the sacroiliac joint over time, as he explained in an interview. The study enrolled 2,633 adults with chronic back pain lasting for at least 3 months with onset before the age of 45 years. This analysis included patients diagnosed with axSpA who also fulfilled the Assessment of SpondyloArthritis international Society (ASAS) classification criteria for axSpA.
Both baseline and follow-up radiographs of sacroiliac joints were evaluated for those with an initial diagnosis of nonradiographic axSpA by two central readers; in cases when the readers disagreed on the classification – either nonradiographic or radiographic axSpA – images were adjudicated by a third reader. Radiographic progression from nonradiographic to radiographic axSpA was evaluated over the next 5 years.
Among all enrolled patients, 82% (n = 2,165) were diagnosed with axSpA and fulfilled the ASAS classification criteria. Of 1,612 who were classified by central reading, 65% had radiographic axSpA while the remaining 35% had nonradiographic axSpA. About 78% of those with nonradiographic axSpA fulfilled the ASAS classification criteria because of positive findings on imaging plus one or more features of spondyloarthritis. The other 22% were classified according to clinical criteria.
A total of 246 nonradiographic axSpA patients who had one or more follow-up radiographs of the sacroiliac joint were included in the current analysis. In this smaller group of patients, progression from the initial diagnosis of nonradiographic to radiographic axSpA at any one point over the 5-year follow-up occurred in 40 patients (16%) at a range of between 0.9 and 5.1 years.
“Females are more likely to stay in the nonradiographic stage than males,” Dr. Poddubnyy noted. Indeed, male gender conferred an over-threefold higher risk of radiographic progression, compared with females (hazard ratio, 3.16; 95% confidence interval, 1.22-8.17; P = .0174). Fulfillment of imaging criteria – in other words, the presence of inflammation on MRI – was also a strong predictor of progression, conferring an over-sixfold risk of radiographic progression (HR, 6.64; 95% CI, 1.37-32.25; P = .0188).
Interestingly, a good response to NSAIDs – the mainstay treatment for both nonradiographic and radiographic axSpA – was also significantly associated with radiographic progression, conferring an over-fourfold risk among those with an initial diagnosis of nonradiographic axSpA (HR, 4.66; 95% CI, 1.23-17.71; P = .0237). And in a separate model, HLA-B27 positivity was significantly associated with radiographic progression, conferring a nearly fourfold higher risk of progression (HR, 3.99; 95% CI, 1.10-14.49; P = .0353).
Asked if rheumatologists need to manage patients with nonradiographic axSpA differently than those with radiographic progression, Dr. Poddubnyy said that there was a small difference between the two in that biologics such as interleukin-17 inhibitors or Janus kinase inhibitors are approved for radiographic axSpA, whereas they are not approved for nonradiographic disease despite some off-label use. “We need to have high levels of symptoms plus nonresponse to NSAIDs and then we can prescribe a biologic,” he added.
For patients with nonradiographic axSpA, patients similarly need to have a high symptom burden and a nonresponse to NSAIDs, but in addition, physicians need to demonstrate objective signs of inflammatory activity, such as an elevated C-reactive protein level or the presence of inflammation on MRI before moving on the next level.
AbbVie funded the PROOF study. Dr. Poddubnyy declared receiving speaker bureau fees from AbbVie, Bristol-Myers Squibb, Eli Lilly, Merck Sharp & Dohme, Novartis, Pfizer, and UCB. He has also served as a consultant for AbbVie, Biocad, Eli Lilly, Gilead, GlaxoSmithKline, Merck Sharp & Dohme, Novartis, Pfizer, Samsung Bioepis, and UCB, as well as research support from AbbVie, Eli Lilly, Merck Sharp & Dohme, Novartis, and Pfizer. A number of coauthors also disclosed financial relationships with these and other pharmaceutical companies.
FROM THE EULAR 2022 CONGRESS

Acute exacerbations common and often fatal in RA-ILD
Acute exacerbations (AEs) are both common in rheumatoid arthritis–associated interstitial lung disease (RA-ILD) and are a frequent cause of imminent mortality, a retrospective Japanese study suggests.
The same is also true for patients with idiopathic pulmonary fibrosis (IPF) for whom an AE is the most frequent cause of death as well, the same comparative study indicates.
“Several studies have reported that acute exacerbation, which occurs during the clinical course of idiopathic pulmonary fibrosis (IPF), also occurs in rheumatoid arthritis–associated interstitial lung disease (RA-ILD),” lead author Junji Otsuka, MD, PhD, of the National Hospital Organization Omuta National Hospital, Fukuoka, Japan, and colleagues observed.
“[We found that] AE was not uncommon in RA-ILD or IPF ... but the prognosis after AE of RA-ILD was significantly better than that of IPF [even though] the most frequent cause of death in RA-ILD and IPF was AE,” they stated.
The study was published online in Respiratory Medicine.
Patient features
The study involved 149 RA-ILD patients with a median age of 72 years at RA onset. The median time from ILD diagnosis to onset of AE was 48.5 months, while the median survival time after the onset of AE was 196 days (range 1-3,463 days), as the authors detailed. “All patients were treated with corticosteroids,” the authors noted, and almost all of them were treated with steroid pulse therapy.
Noninvasive positive pressure ventilation (NPPV) was used to maintain oxygenation in 18.5% of patients with severe respiratory failure, while invasive positive pressure ventilation (IPPV) was used in almost 26% of patients with the same degree of respiratory failure. Features of patients who developed an AE were then compared with those who did not.
Interestingly, no significant differences in clinical parameters were seen between those who developed an AE and those who did not. Nor were there any significant differences between the 2 groups in the length of time from the ILD diagnosis to the development of an AE. Some 18% of RA-ILD patients developed an AE, as did over 27% of patients with IPF, investigators report.
, compared with only 60 days for those with IPF (P = .038). In a multivariable analysis, hypoalbuminemia at an odds ratio of .090 (95% confidence interval, 0.011-0.733; P = .012) as well as percent carbon monoxide diffusion capacity at an OR of .810 (95% CI, 0.814-0.964; P < .01) were both independent risk factors for the development of an AE, the investigators pointed out.
The best cut-off level for predicting the risk of an AE was 3.0 g/dL (95% CI, 0.011-0.733; P = .012) for serum albumin and 53% (95% CI, 0.814-0.964; P < .01) for carbon monoxide diffusion capacity. As Dr. Otsuka noted in an email to this news organization, low serum albumin likely correlates with a generally poor condition, while low carbon monoxide diffusion capacity is likely due to lung fibrosis.
“But if low albumin and low carbon monoxide diffusion capacity are due to the progression of ILD, both values may be difficult to improve,” he added.
Survivors versus nonsurvivors
Of those patients with RA-ILD who developed an AE, approximately half recovered. Among the IPF patients who developed an AE during the study period, approximately 39% recovered from the event, while 70% did not. Comparing RA-ILD patients who survived versus whose who did not, again, no significant demographic or clinical differences were seen between the 2 groups. On the other hand, the number of patients treated with immunosuppressants for their AE was significantly higher among patients who did not survive the AE, compared with those who did (P =.022), investigators note.
Similarly, the number of patients who required NPPV was also significantly higher among those who did not survive, compared with those who did. In fact, “none of the surviving patients used NPPV (P <0.01),” the authors stress. The number of patients who required IPPV was also significantly higher among nonsurvivors than among survivors (P =.017), and of the small number of patients who were treated with IPPV, all but one died without recovery.
As the authors suggested, these findings suggest that RA-ILD patients who recover from an AE with the help of corticosteroids alone have a relatively decent prognosis. In contrast, those who require immunosuppressive drugs in addition to steroids or mechanical ventilation for AE management can be expected to have a poor prognosis.
The same can also be said for IPF patients and even with the help of mechanical ventilation “with IPF patients, the survival rate is low anyway, so the indication for mechanical ventilation should be carefully judged,” Dr. Otsuka stressed.
Cause of death
The authors also compared the cause of death between patients with RA-ILD and those with IPF. “In RA-ILD patients, the most frequent cause of death was AE,” they report, at close to 35% of all patients with RA-ILD. This was also true for IPF patients among whom AE was the cause of death for over 44%. “These results indicate that, as in IPF, AE develops in the clinical course of RA-ILD with considerable frequency,” investigators note.
“During the clinical course of RA-ILD, as with IPD, it is necessary to pay attention to AE,” they stress. Dr. Otsuka added: “It may be difficult to change the prognosis of these patients.”
“However, knowing which patients are more likely to develop AE may help predict the prognosis, and it may be improved if antifibrotic agents are used for these patients,” he said. Elizabeth Volkmann, MD, director, UCLA scleroderma program, University of California, Los Angeles, felt that understanding the risk factors for AEs in this patient population may help physicians identify a subgroup of patients with RA-ILD who require closer monitoring and follow-up.
“These patients may also require more aggressive treatment for RA-ILD to prevent AEs,” she said in an email to this news organization. Given that the study was retrospective in nature, Dr. Volkmann cautioned that there were likely multiple confounding factors that could have affected survival in this patient population and not to take away from the study that survival was solely affected by immunosuppressant use, for example.
“It is possible that patients [treated with] immunosuppressants had other features of their disease that independently heightened their risk of mortality,” Dr. Volkmann said. Similarly, physicians should not assume that the high mortality rate seen in RA-ILD patients who were treated with mechanical ventilation had anything to do with mechanical ventilation itself, as patients requiring ventilation are likely to have worse outcomes, as she stressed.
As for hypoalbuminemia, Dr. Volkmann pointed out that hypoalbuminemia is often a sign of malnutrition in these patients. “Studies have demonstrated that malnutrition is an independent predictor of mortality in patients with ILD,” she emphasized.
“Optimizing patients’ nutritional status could potentially help lower the risk of AEs,” Dr. Volkmann suggested.
Limitations of the study include the fact that it was a single-center design study and included only a limited number of patients.
No specific funding source was noted. The authors have no conflicts of interest to declare.
Acute exacerbations (AEs) are both common in rheumatoid arthritis–associated interstitial lung disease (RA-ILD) and are a frequent cause of imminent mortality, a retrospective Japanese study suggests.
The same is also true for patients with idiopathic pulmonary fibrosis (IPF) for whom an AE is the most frequent cause of death as well, the same comparative study indicates.
“Several studies have reported that acute exacerbation, which occurs during the clinical course of idiopathic pulmonary fibrosis (IPF), also occurs in rheumatoid arthritis–associated interstitial lung disease (RA-ILD),” lead author Junji Otsuka, MD, PhD, of the National Hospital Organization Omuta National Hospital, Fukuoka, Japan, and colleagues observed.
“[We found that] AE was not uncommon in RA-ILD or IPF ... but the prognosis after AE of RA-ILD was significantly better than that of IPF [even though] the most frequent cause of death in RA-ILD and IPF was AE,” they stated.
The study was published online in Respiratory Medicine.
Patient features
The study involved 149 RA-ILD patients with a median age of 72 years at RA onset. The median time from ILD diagnosis to onset of AE was 48.5 months, while the median survival time after the onset of AE was 196 days (range 1-3,463 days), as the authors detailed. “All patients were treated with corticosteroids,” the authors noted, and almost all of them were treated with steroid pulse therapy.
Noninvasive positive pressure ventilation (NPPV) was used to maintain oxygenation in 18.5% of patients with severe respiratory failure, while invasive positive pressure ventilation (IPPV) was used in almost 26% of patients with the same degree of respiratory failure. Features of patients who developed an AE were then compared with those who did not.
Interestingly, no significant differences in clinical parameters were seen between those who developed an AE and those who did not. Nor were there any significant differences between the 2 groups in the length of time from the ILD diagnosis to the development of an AE. Some 18% of RA-ILD patients developed an AE, as did over 27% of patients with IPF, investigators report.
, compared with only 60 days for those with IPF (P = .038). In a multivariable analysis, hypoalbuminemia at an odds ratio of .090 (95% confidence interval, 0.011-0.733; P = .012) as well as percent carbon monoxide diffusion capacity at an OR of .810 (95% CI, 0.814-0.964; P < .01) were both independent risk factors for the development of an AE, the investigators pointed out.
The best cut-off level for predicting the risk of an AE was 3.0 g/dL (95% CI, 0.011-0.733; P = .012) for serum albumin and 53% (95% CI, 0.814-0.964; P < .01) for carbon monoxide diffusion capacity. As Dr. Otsuka noted in an email to this news organization, low serum albumin likely correlates with a generally poor condition, while low carbon monoxide diffusion capacity is likely due to lung fibrosis.
“But if low albumin and low carbon monoxide diffusion capacity are due to the progression of ILD, both values may be difficult to improve,” he added.
Survivors versus nonsurvivors
Of those patients with RA-ILD who developed an AE, approximately half recovered. Among the IPF patients who developed an AE during the study period, approximately 39% recovered from the event, while 70% did not. Comparing RA-ILD patients who survived versus whose who did not, again, no significant demographic or clinical differences were seen between the 2 groups. On the other hand, the number of patients treated with immunosuppressants for their AE was significantly higher among patients who did not survive the AE, compared with those who did (P =.022), investigators note.
Similarly, the number of patients who required NPPV was also significantly higher among those who did not survive, compared with those who did. In fact, “none of the surviving patients used NPPV (P <0.01),” the authors stress. The number of patients who required IPPV was also significantly higher among nonsurvivors than among survivors (P =.017), and of the small number of patients who were treated with IPPV, all but one died without recovery.
As the authors suggested, these findings suggest that RA-ILD patients who recover from an AE with the help of corticosteroids alone have a relatively decent prognosis. In contrast, those who require immunosuppressive drugs in addition to steroids or mechanical ventilation for AE management can be expected to have a poor prognosis.
The same can also be said for IPF patients and even with the help of mechanical ventilation “with IPF patients, the survival rate is low anyway, so the indication for mechanical ventilation should be carefully judged,” Dr. Otsuka stressed.
Cause of death
The authors also compared the cause of death between patients with RA-ILD and those with IPF. “In RA-ILD patients, the most frequent cause of death was AE,” they report, at close to 35% of all patients with RA-ILD. This was also true for IPF patients among whom AE was the cause of death for over 44%. “These results indicate that, as in IPF, AE develops in the clinical course of RA-ILD with considerable frequency,” investigators note.
“During the clinical course of RA-ILD, as with IPD, it is necessary to pay attention to AE,” they stress. Dr. Otsuka added: “It may be difficult to change the prognosis of these patients.”
“However, knowing which patients are more likely to develop AE may help predict the prognosis, and it may be improved if antifibrotic agents are used for these patients,” he said. Elizabeth Volkmann, MD, director, UCLA scleroderma program, University of California, Los Angeles, felt that understanding the risk factors for AEs in this patient population may help physicians identify a subgroup of patients with RA-ILD who require closer monitoring and follow-up.
“These patients may also require more aggressive treatment for RA-ILD to prevent AEs,” she said in an email to this news organization. Given that the study was retrospective in nature, Dr. Volkmann cautioned that there were likely multiple confounding factors that could have affected survival in this patient population and not to take away from the study that survival was solely affected by immunosuppressant use, for example.
“It is possible that patients [treated with] immunosuppressants had other features of their disease that independently heightened their risk of mortality,” Dr. Volkmann said. Similarly, physicians should not assume that the high mortality rate seen in RA-ILD patients who were treated with mechanical ventilation had anything to do with mechanical ventilation itself, as patients requiring ventilation are likely to have worse outcomes, as she stressed.
As for hypoalbuminemia, Dr. Volkmann pointed out that hypoalbuminemia is often a sign of malnutrition in these patients. “Studies have demonstrated that malnutrition is an independent predictor of mortality in patients with ILD,” she emphasized.
“Optimizing patients’ nutritional status could potentially help lower the risk of AEs,” Dr. Volkmann suggested.
Limitations of the study include the fact that it was a single-center design study and included only a limited number of patients.
No specific funding source was noted. The authors have no conflicts of interest to declare.
Acute exacerbations (AEs) are both common in rheumatoid arthritis–associated interstitial lung disease (RA-ILD) and are a frequent cause of imminent mortality, a retrospective Japanese study suggests.
The same is also true for patients with idiopathic pulmonary fibrosis (IPF) for whom an AE is the most frequent cause of death as well, the same comparative study indicates.
“Several studies have reported that acute exacerbation, which occurs during the clinical course of idiopathic pulmonary fibrosis (IPF), also occurs in rheumatoid arthritis–associated interstitial lung disease (RA-ILD),” lead author Junji Otsuka, MD, PhD, of the National Hospital Organization Omuta National Hospital, Fukuoka, Japan, and colleagues observed.
“[We found that] AE was not uncommon in RA-ILD or IPF ... but the prognosis after AE of RA-ILD was significantly better than that of IPF [even though] the most frequent cause of death in RA-ILD and IPF was AE,” they stated.
The study was published online in Respiratory Medicine.
Patient features
The study involved 149 RA-ILD patients with a median age of 72 years at RA onset. The median time from ILD diagnosis to onset of AE was 48.5 months, while the median survival time after the onset of AE was 196 days (range 1-3,463 days), as the authors detailed. “All patients were treated with corticosteroids,” the authors noted, and almost all of them were treated with steroid pulse therapy.
Noninvasive positive pressure ventilation (NPPV) was used to maintain oxygenation in 18.5% of patients with severe respiratory failure, while invasive positive pressure ventilation (IPPV) was used in almost 26% of patients with the same degree of respiratory failure. Features of patients who developed an AE were then compared with those who did not.
Interestingly, no significant differences in clinical parameters were seen between those who developed an AE and those who did not. Nor were there any significant differences between the 2 groups in the length of time from the ILD diagnosis to the development of an AE. Some 18% of RA-ILD patients developed an AE, as did over 27% of patients with IPF, investigators report.
, compared with only 60 days for those with IPF (P = .038). In a multivariable analysis, hypoalbuminemia at an odds ratio of .090 (95% confidence interval, 0.011-0.733; P = .012) as well as percent carbon monoxide diffusion capacity at an OR of .810 (95% CI, 0.814-0.964; P < .01) were both independent risk factors for the development of an AE, the investigators pointed out.
The best cut-off level for predicting the risk of an AE was 3.0 g/dL (95% CI, 0.011-0.733; P = .012) for serum albumin and 53% (95% CI, 0.814-0.964; P < .01) for carbon monoxide diffusion capacity. As Dr. Otsuka noted in an email to this news organization, low serum albumin likely correlates with a generally poor condition, while low carbon monoxide diffusion capacity is likely due to lung fibrosis.
“But if low albumin and low carbon monoxide diffusion capacity are due to the progression of ILD, both values may be difficult to improve,” he added.
Survivors versus nonsurvivors
Of those patients with RA-ILD who developed an AE, approximately half recovered. Among the IPF patients who developed an AE during the study period, approximately 39% recovered from the event, while 70% did not. Comparing RA-ILD patients who survived versus whose who did not, again, no significant demographic or clinical differences were seen between the 2 groups. On the other hand, the number of patients treated with immunosuppressants for their AE was significantly higher among patients who did not survive the AE, compared with those who did (P =.022), investigators note.
Similarly, the number of patients who required NPPV was also significantly higher among those who did not survive, compared with those who did. In fact, “none of the surviving patients used NPPV (P <0.01),” the authors stress. The number of patients who required IPPV was also significantly higher among nonsurvivors than among survivors (P =.017), and of the small number of patients who were treated with IPPV, all but one died without recovery.
As the authors suggested, these findings suggest that RA-ILD patients who recover from an AE with the help of corticosteroids alone have a relatively decent prognosis. In contrast, those who require immunosuppressive drugs in addition to steroids or mechanical ventilation for AE management can be expected to have a poor prognosis.
The same can also be said for IPF patients and even with the help of mechanical ventilation “with IPF patients, the survival rate is low anyway, so the indication for mechanical ventilation should be carefully judged,” Dr. Otsuka stressed.
Cause of death
The authors also compared the cause of death between patients with RA-ILD and those with IPF. “In RA-ILD patients, the most frequent cause of death was AE,” they report, at close to 35% of all patients with RA-ILD. This was also true for IPF patients among whom AE was the cause of death for over 44%. “These results indicate that, as in IPF, AE develops in the clinical course of RA-ILD with considerable frequency,” investigators note.
“During the clinical course of RA-ILD, as with IPD, it is necessary to pay attention to AE,” they stress. Dr. Otsuka added: “It may be difficult to change the prognosis of these patients.”
“However, knowing which patients are more likely to develop AE may help predict the prognosis, and it may be improved if antifibrotic agents are used for these patients,” he said. Elizabeth Volkmann, MD, director, UCLA scleroderma program, University of California, Los Angeles, felt that understanding the risk factors for AEs in this patient population may help physicians identify a subgroup of patients with RA-ILD who require closer monitoring and follow-up.
“These patients may also require more aggressive treatment for RA-ILD to prevent AEs,” she said in an email to this news organization. Given that the study was retrospective in nature, Dr. Volkmann cautioned that there were likely multiple confounding factors that could have affected survival in this patient population and not to take away from the study that survival was solely affected by immunosuppressant use, for example.
“It is possible that patients [treated with] immunosuppressants had other features of their disease that independently heightened their risk of mortality,” Dr. Volkmann said. Similarly, physicians should not assume that the high mortality rate seen in RA-ILD patients who were treated with mechanical ventilation had anything to do with mechanical ventilation itself, as patients requiring ventilation are likely to have worse outcomes, as she stressed.
As for hypoalbuminemia, Dr. Volkmann pointed out that hypoalbuminemia is often a sign of malnutrition in these patients. “Studies have demonstrated that malnutrition is an independent predictor of mortality in patients with ILD,” she emphasized.
“Optimizing patients’ nutritional status could potentially help lower the risk of AEs,” Dr. Volkmann suggested.
Limitations of the study include the fact that it was a single-center design study and included only a limited number of patients.
No specific funding source was noted. The authors have no conflicts of interest to declare.
Study confirms increased CVT with AstraZeneca COVID vaccine
A new Scandinavian study has confirmed previous data showing increased rates of cerebral venous thrombosis and thrombocytopenia after the AstraZeneca COVID-19 vaccine.
The study also showed higher rates of several thromboembolic and thrombocytopenic outcomes after the Pfizer and Moderna mRNA vaccines, although these increases were less than the rates observed after the AstraZeneca vaccine, and sensitivity analyses were not consistent.
The researchers conclude that confirmatory analysis on the two mRNA vaccines by other methods are warranted.
The study was published in the June issue of JAMA Network Open.
“This study confirms what we know from other studies: that the AstraZeneca vaccine is associated with the rare but serious side effect of vaccine-induced immune thrombotic thrombocytopenia,” lead author Jacob Dag Berild, MD, Norwegian Institute of Public Health, Oslo, told this news organization.
he added.
Dr. Dag Berild noted that in the current study there was an excess of 1.6 events of cerebral venous thrombosis per 100,000 AstraZeneca vaccine doses, which is similar to what has been previously reported.
Asked how he saw these results affecting continued use of these vaccines, Dr. Dag Berild pointed out that the risk-benefit ratio of the vaccine depends on the risk of contracting COVID-19 and the risk for a severe outcome from COVID-19 weighed against the risk for an adverse event after vaccination.
“The European Medicines Agency has concluded that the overall risk-benefit ratio remains positive for the AstraZeneca vaccine, but Norway, Finland, and Denmark no longer use the AstraZeneca vaccine in their vaccination programs because of adequate availability of alternative vaccines. I think this is a reasonable decision,” he said.
For the current study, the researchers linked individual-level data separately from national population, patient, and vaccination registers in Norway, Finland, and Denmark. Patient registers were used to identify hospital visits and admissions related to thromboembolic and thrombocytopenic disease in all three countries.
The main outcomes were relative rates of coronary artery disease, coagulation disorders, and cerebrovascular disease in the 28-day period after vaccination, compared with the control period prior to vaccination.
The authors note that a strength of this study is the use of registers with full population coverage in three countries with universal health care, ensuring equal access to care for all permanent residents. At the end of the study period, from Jan. 1, 2020 to May 16, 2021, more than 5.3 million people in the three countries were vaccinated with one or two doses.
Another strength is the inherent adjustment for time-invariant confounders in the self-controlled case series design and the resulting control of confounders that can affect the more traditional observational studies when complete data for confounders are not available, they add.
Of the 265,339 hospital contacts, 43% were made by female patients and 93% by patients born in or before 1971, and 44% were for coronary artery disease, 21% for coagulation disorders, and 35% for cerebrovascular disease.
In the 28-day period after vaccination, there was an elevated rate of coronary artery disease after the Moderna vaccine (relative rate, 1.13) but not after the AstraZeneca (RR, 0.92) or Pfizer (RR, 0.96) vaccines.
There was an observed increase in the rate of coagulation disorders after all three vaccines (AstraZeneca RR, 2.01; Pfizer RR, 1.12; and Moderna RR, 1.26).
There was also an increase in the rate of cerebrovascular disease after all three vaccines (AstraZeneca RR, 1.32; Pfizer RR, 1.09; and Moderna RR, 1.21).
For individual diseases in the main outcomes, two notably high rates were observed after the AstraZeneca vaccine, with relative rates of 12.04 for cerebral venous thrombosis and 4.29 for thrombocytopenia, corresponding to 1.6 and 4.9 excess events per 100,000 doses, respectively.
The elevated risk after the AstraZeneca vaccine was consistent across all three countries and robust in sensitivity analyses.
The researchers report that they also observed statistically significant increases in hospital contacts for thrombocytopenic and thromboembolic events after the Pfizer and Moderna vaccines. However, the risk was smaller than after the AstraZeneca vaccine.
“Additionally, the national estimates varied, increased risk [was] observed only in the oldest cohorts, and sensitivity analysis checking underlying assumptions of the analyses were not consistent. Therefore, the overall and combined increased relative risks following the Pfizer and Moderna vaccinations should be interpreted with caution,” they say.
They note that their results with the AstraZeneca vaccine are in line with a comparison of observed and historic rates performed on partly the same population in Norway and Denmark and also with a Scottish national case-control study.
A version of this article first appeared on Medscape.com.
A new Scandinavian study has confirmed previous data showing increased rates of cerebral venous thrombosis and thrombocytopenia after the AstraZeneca COVID-19 vaccine.
The study also showed higher rates of several thromboembolic and thrombocytopenic outcomes after the Pfizer and Moderna mRNA vaccines, although these increases were less than the rates observed after the AstraZeneca vaccine, and sensitivity analyses were not consistent.
The researchers conclude that confirmatory analysis on the two mRNA vaccines by other methods are warranted.
The study was published in the June issue of JAMA Network Open.
“This study confirms what we know from other studies: that the AstraZeneca vaccine is associated with the rare but serious side effect of vaccine-induced immune thrombotic thrombocytopenia,” lead author Jacob Dag Berild, MD, Norwegian Institute of Public Health, Oslo, told this news organization.
he added.
Dr. Dag Berild noted that in the current study there was an excess of 1.6 events of cerebral venous thrombosis per 100,000 AstraZeneca vaccine doses, which is similar to what has been previously reported.
Asked how he saw these results affecting continued use of these vaccines, Dr. Dag Berild pointed out that the risk-benefit ratio of the vaccine depends on the risk of contracting COVID-19 and the risk for a severe outcome from COVID-19 weighed against the risk for an adverse event after vaccination.
“The European Medicines Agency has concluded that the overall risk-benefit ratio remains positive for the AstraZeneca vaccine, but Norway, Finland, and Denmark no longer use the AstraZeneca vaccine in their vaccination programs because of adequate availability of alternative vaccines. I think this is a reasonable decision,” he said.
For the current study, the researchers linked individual-level data separately from national population, patient, and vaccination registers in Norway, Finland, and Denmark. Patient registers were used to identify hospital visits and admissions related to thromboembolic and thrombocytopenic disease in all three countries.
The main outcomes were relative rates of coronary artery disease, coagulation disorders, and cerebrovascular disease in the 28-day period after vaccination, compared with the control period prior to vaccination.
The authors note that a strength of this study is the use of registers with full population coverage in three countries with universal health care, ensuring equal access to care for all permanent residents. At the end of the study period, from Jan. 1, 2020 to May 16, 2021, more than 5.3 million people in the three countries were vaccinated with one or two doses.
Another strength is the inherent adjustment for time-invariant confounders in the self-controlled case series design and the resulting control of confounders that can affect the more traditional observational studies when complete data for confounders are not available, they add.
Of the 265,339 hospital contacts, 43% were made by female patients and 93% by patients born in or before 1971, and 44% were for coronary artery disease, 21% for coagulation disorders, and 35% for cerebrovascular disease.
In the 28-day period after vaccination, there was an elevated rate of coronary artery disease after the Moderna vaccine (relative rate, 1.13) but not after the AstraZeneca (RR, 0.92) or Pfizer (RR, 0.96) vaccines.
There was an observed increase in the rate of coagulation disorders after all three vaccines (AstraZeneca RR, 2.01; Pfizer RR, 1.12; and Moderna RR, 1.26).
There was also an increase in the rate of cerebrovascular disease after all three vaccines (AstraZeneca RR, 1.32; Pfizer RR, 1.09; and Moderna RR, 1.21).
For individual diseases in the main outcomes, two notably high rates were observed after the AstraZeneca vaccine, with relative rates of 12.04 for cerebral venous thrombosis and 4.29 for thrombocytopenia, corresponding to 1.6 and 4.9 excess events per 100,000 doses, respectively.
The elevated risk after the AstraZeneca vaccine was consistent across all three countries and robust in sensitivity analyses.
The researchers report that they also observed statistically significant increases in hospital contacts for thrombocytopenic and thromboembolic events after the Pfizer and Moderna vaccines. However, the risk was smaller than after the AstraZeneca vaccine.
“Additionally, the national estimates varied, increased risk [was] observed only in the oldest cohorts, and sensitivity analysis checking underlying assumptions of the analyses were not consistent. Therefore, the overall and combined increased relative risks following the Pfizer and Moderna vaccinations should be interpreted with caution,” they say.
They note that their results with the AstraZeneca vaccine are in line with a comparison of observed and historic rates performed on partly the same population in Norway and Denmark and also with a Scottish national case-control study.
A version of this article first appeared on Medscape.com.
A new Scandinavian study has confirmed previous data showing increased rates of cerebral venous thrombosis and thrombocytopenia after the AstraZeneca COVID-19 vaccine.
The study also showed higher rates of several thromboembolic and thrombocytopenic outcomes after the Pfizer and Moderna mRNA vaccines, although these increases were less than the rates observed after the AstraZeneca vaccine, and sensitivity analyses were not consistent.
The researchers conclude that confirmatory analysis on the two mRNA vaccines by other methods are warranted.
The study was published in the June issue of JAMA Network Open.
“This study confirms what we know from other studies: that the AstraZeneca vaccine is associated with the rare but serious side effect of vaccine-induced immune thrombotic thrombocytopenia,” lead author Jacob Dag Berild, MD, Norwegian Institute of Public Health, Oslo, told this news organization.
he added.
Dr. Dag Berild noted that in the current study there was an excess of 1.6 events of cerebral venous thrombosis per 100,000 AstraZeneca vaccine doses, which is similar to what has been previously reported.
Asked how he saw these results affecting continued use of these vaccines, Dr. Dag Berild pointed out that the risk-benefit ratio of the vaccine depends on the risk of contracting COVID-19 and the risk for a severe outcome from COVID-19 weighed against the risk for an adverse event after vaccination.
“The European Medicines Agency has concluded that the overall risk-benefit ratio remains positive for the AstraZeneca vaccine, but Norway, Finland, and Denmark no longer use the AstraZeneca vaccine in their vaccination programs because of adequate availability of alternative vaccines. I think this is a reasonable decision,” he said.
For the current study, the researchers linked individual-level data separately from national population, patient, and vaccination registers in Norway, Finland, and Denmark. Patient registers were used to identify hospital visits and admissions related to thromboembolic and thrombocytopenic disease in all three countries.
The main outcomes were relative rates of coronary artery disease, coagulation disorders, and cerebrovascular disease in the 28-day period after vaccination, compared with the control period prior to vaccination.
The authors note that a strength of this study is the use of registers with full population coverage in three countries with universal health care, ensuring equal access to care for all permanent residents. At the end of the study period, from Jan. 1, 2020 to May 16, 2021, more than 5.3 million people in the three countries were vaccinated with one or two doses.
Another strength is the inherent adjustment for time-invariant confounders in the self-controlled case series design and the resulting control of confounders that can affect the more traditional observational studies when complete data for confounders are not available, they add.
Of the 265,339 hospital contacts, 43% were made by female patients and 93% by patients born in or before 1971, and 44% were for coronary artery disease, 21% for coagulation disorders, and 35% for cerebrovascular disease.
In the 28-day period after vaccination, there was an elevated rate of coronary artery disease after the Moderna vaccine (relative rate, 1.13) but not after the AstraZeneca (RR, 0.92) or Pfizer (RR, 0.96) vaccines.
There was an observed increase in the rate of coagulation disorders after all three vaccines (AstraZeneca RR, 2.01; Pfizer RR, 1.12; and Moderna RR, 1.26).
There was also an increase in the rate of cerebrovascular disease after all three vaccines (AstraZeneca RR, 1.32; Pfizer RR, 1.09; and Moderna RR, 1.21).
For individual diseases in the main outcomes, two notably high rates were observed after the AstraZeneca vaccine, with relative rates of 12.04 for cerebral venous thrombosis and 4.29 for thrombocytopenia, corresponding to 1.6 and 4.9 excess events per 100,000 doses, respectively.
The elevated risk after the AstraZeneca vaccine was consistent across all three countries and robust in sensitivity analyses.
The researchers report that they also observed statistically significant increases in hospital contacts for thrombocytopenic and thromboembolic events after the Pfizer and Moderna vaccines. However, the risk was smaller than after the AstraZeneca vaccine.
“Additionally, the national estimates varied, increased risk [was] observed only in the oldest cohorts, and sensitivity analysis checking underlying assumptions of the analyses were not consistent. Therefore, the overall and combined increased relative risks following the Pfizer and Moderna vaccinations should be interpreted with caution,” they say.
They note that their results with the AstraZeneca vaccine are in line with a comparison of observed and historic rates performed on partly the same population in Norway and Denmark and also with a Scottish national case-control study.
A version of this article first appeared on Medscape.com.
CBT may improve comorbid posttraumatic headache, PTSD
Results from a randomized clinical trial of almost 200 military veterans showed that, compared with usual care, CBT for headache led to significant improvement in both headache disability and PTSD symptoms. Cognitive-processing therapy (CPT) also led to significant improvement in PTSD symptoms, but it did not improve headache disability.
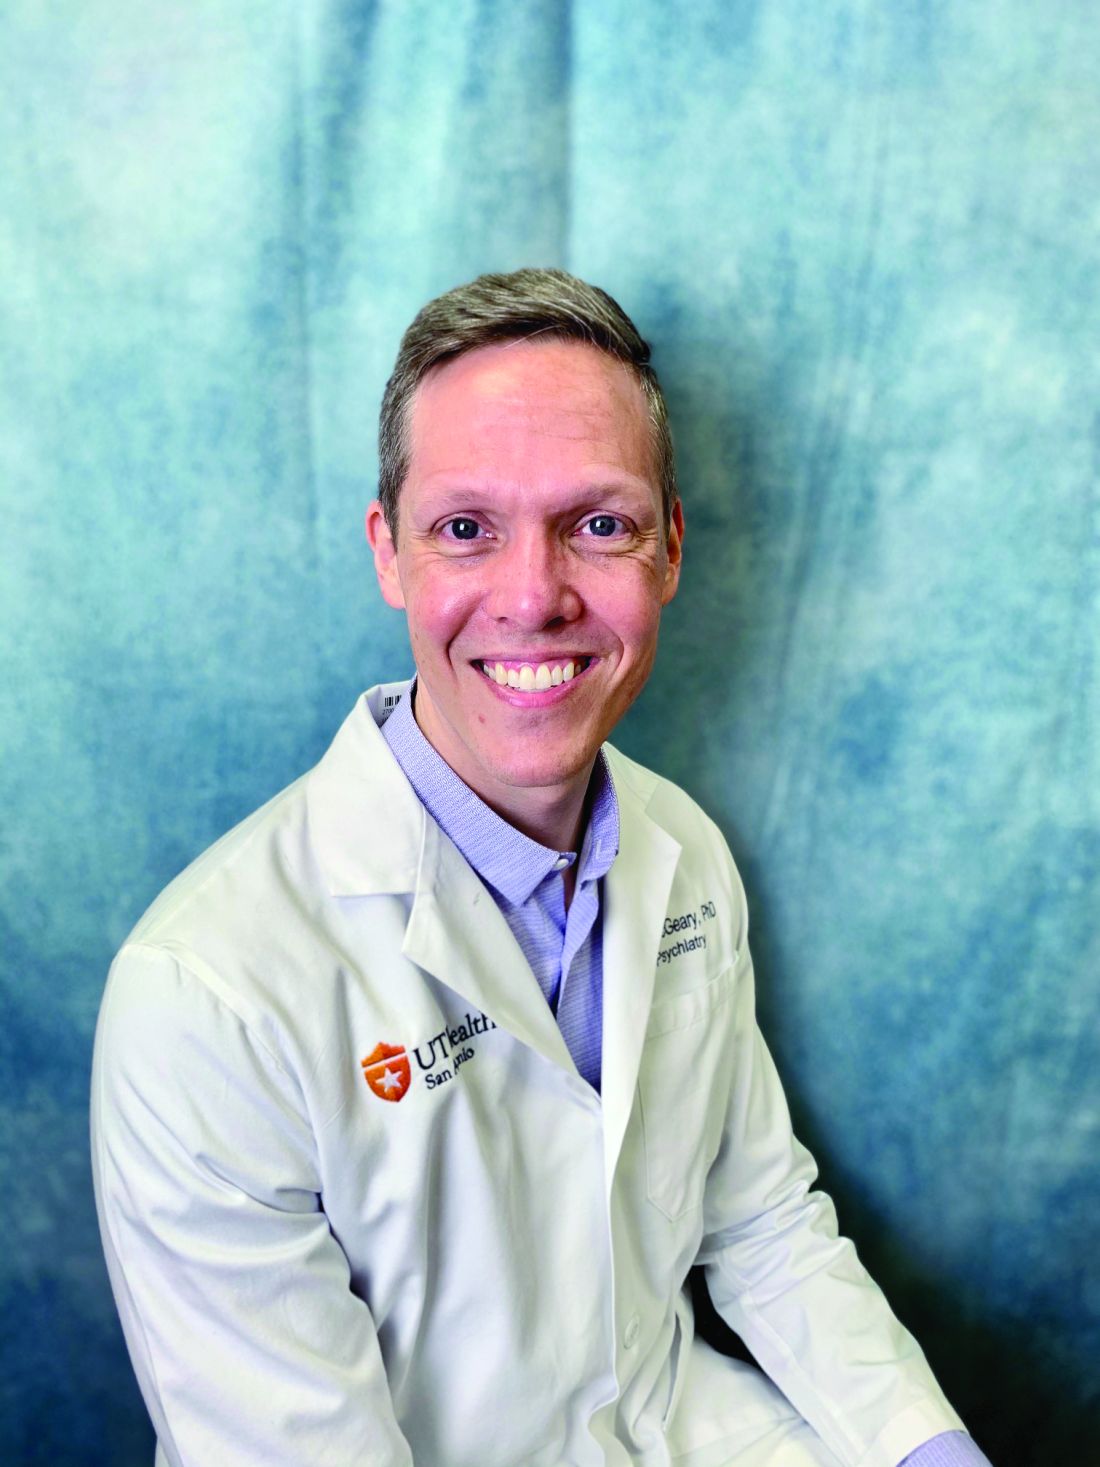
Lead author Donald McGeary, PhD, department of rehabilitation medicine, the University of Texas Health Science Center,San Antonio, noted the improvements shown in headache disability after CBT were likely caused by its building of patients’ confidence that they could control or manage their headaches themselves.
That sense of control was key to helping patients “get their lives back. If you can improve a person’s belief that they can control their headache, they function better,” Dr. McGeary said in a news release.
The findings were published online in JAMA Neurology.
Signature wounds
Both mild traumatic brain injury (TBI) and PTSD are signature wounds of post-9/11 military conflicts. The two conditions commonly occur together and can harm quality of life and functioning, the investigators noted. Following mild TBI, many veterans experience persistent posttraumatic headache, which often co-occurs with PTSD.
To gauge the impact of CBTs for this patient population, researchers recruited 193 post-9/11 combat veterans (mean age, 39.7 years) with clinically significant PTSD symptoms and posttraumatic headache that had persisted more than 3 months after TBI. Of these, 167 were men.
All participants were receiving care at the Polytrauma Rehabilitation Center of the South Texas Veterans Health Care System in Houston.
They were randomly allocated to undergo 8 sessions of manualized CBT for headache, 12 sessions of manualized CPT for PTSD, or usual headache treatment.
CBT for headache uses CBT concepts to reduce headache disability and improve mood – and includes key components, such as relaxation, setting goals for activities patients want to resume, and planning for those situations.
CPT is a leading psychotherapy for PTSD. It teaches patients how to evaluate and change upsetting and maladaptive thoughts related to their trauma. The idea is that, by changing thoughts, patients can change the way they feel.
Treatment as usual was consistent with multidisciplinary treatment in a large Veterans Affairs multiple-trauma center and could include pharmacotherapies, physical and occupational therapies, pain medications, acupuncture, and massage.
The coprimary outcomes were headache-related disability on the six-item Headache Impact Test (HIT-6) and PTSD symptom severity on the PTSD Checklist for Diagnostic and Statistical Manual of Mental Disorders, Fifth Edition (PCL-5), assessed from end of treatment to 6 months post treatment.
At baseline, all participants reported severe headache-related disability (mean HIT-6 score, 65.8 points) and severe PTSD symptoms (mean PCL-5 score, 48.4 points).
Significant improvement
Compared with usual care, CBT for headache led to significant improvement in headache disability (posttreatment mean change in HIT-6 score, –3.4 points; P < .01) and PTSD symptoms (posttreatment change in PCL-5, –6.5 points; P = .04).
CPT also led to significant improvement in PTSD symptoms (8.9 points lower on the PCL-5 after treatment; P = .01), but it had only a modest effect on headache disability (1.4 points lower after treatment; P = .21).
“This was a surprise,” Dr. McGeary said. “If theories about PTSD driving posttraumatic headache are correct, you’d expect CPT to help both PTSD and headache. Our findings call that into question.”
Despite improvements in headache disability, CBT for headache did not significantly reduce headache frequency or intensity.
The researchers are now hoping to replicate their findings in a larger trial at multiple military and VA sites around the United States.
“We need more women, more racial and ethnic diversity, veterans as well as active military of different branches with varying comorbidities in different geographic regions attached to different hospitals and medical systems, because we’re comparing to usual care,” Dr. McGeary said.
A step forward
Commenting on the study, retired Col. Elspeth Cameron Ritchie, MD, chair of psychiatry, MedStar Washington Hospital Center, Washington, said she was “pleased” to see that this study was conducted and that she was pleased with the results.

“It’s been 20 years since 9/11, and wars are pretty much forgotten, but people are still suffering from the effects of traumatic brain injury and posttraumatic stress disorder. These are not conditions that go away quickly or lightly. They do take work,” said Dr. Ritchie, who was not involved with the research.
Finding therapies besides medication that are helpful is “good and is a step forward. The more alternatives we have, the better,” she concluded.
The study was supported in part by the Department of Defense and the Department of Veterans Affairs. Dr. McGeary and Dr. Ritchie have reported no relevant financial relationships.
A version of this article first appeared on Medscape.com.
Results from a randomized clinical trial of almost 200 military veterans showed that, compared with usual care, CBT for headache led to significant improvement in both headache disability and PTSD symptoms. Cognitive-processing therapy (CPT) also led to significant improvement in PTSD symptoms, but it did not improve headache disability.
Lead author Donald McGeary, PhD, department of rehabilitation medicine, the University of Texas Health Science Center,San Antonio, noted the improvements shown in headache disability after CBT were likely caused by its building of patients’ confidence that they could control or manage their headaches themselves.
That sense of control was key to helping patients “get their lives back. If you can improve a person’s belief that they can control their headache, they function better,” Dr. McGeary said in a news release.
The findings were published online in JAMA Neurology.
Signature wounds
Both mild traumatic brain injury (TBI) and PTSD are signature wounds of post-9/11 military conflicts. The two conditions commonly occur together and can harm quality of life and functioning, the investigators noted. Following mild TBI, many veterans experience persistent posttraumatic headache, which often co-occurs with PTSD.
To gauge the impact of CBTs for this patient population, researchers recruited 193 post-9/11 combat veterans (mean age, 39.7 years) with clinically significant PTSD symptoms and posttraumatic headache that had persisted more than 3 months after TBI. Of these, 167 were men.
All participants were receiving care at the Polytrauma Rehabilitation Center of the South Texas Veterans Health Care System in Houston.
They were randomly allocated to undergo 8 sessions of manualized CBT for headache, 12 sessions of manualized CPT for PTSD, or usual headache treatment.
CBT for headache uses CBT concepts to reduce headache disability and improve mood – and includes key components, such as relaxation, setting goals for activities patients want to resume, and planning for those situations.
CPT is a leading psychotherapy for PTSD. It teaches patients how to evaluate and change upsetting and maladaptive thoughts related to their trauma. The idea is that, by changing thoughts, patients can change the way they feel.
Treatment as usual was consistent with multidisciplinary treatment in a large Veterans Affairs multiple-trauma center and could include pharmacotherapies, physical and occupational therapies, pain medications, acupuncture, and massage.
The coprimary outcomes were headache-related disability on the six-item Headache Impact Test (HIT-6) and PTSD symptom severity on the PTSD Checklist for Diagnostic and Statistical Manual of Mental Disorders, Fifth Edition (PCL-5), assessed from end of treatment to 6 months post treatment.
At baseline, all participants reported severe headache-related disability (mean HIT-6 score, 65.8 points) and severe PTSD symptoms (mean PCL-5 score, 48.4 points).
Significant improvement
Compared with usual care, CBT for headache led to significant improvement in headache disability (posttreatment mean change in HIT-6 score, –3.4 points; P < .01) and PTSD symptoms (posttreatment change in PCL-5, –6.5 points; P = .04).
CPT also led to significant improvement in PTSD symptoms (8.9 points lower on the PCL-5 after treatment; P = .01), but it had only a modest effect on headache disability (1.4 points lower after treatment; P = .21).
“This was a surprise,” Dr. McGeary said. “If theories about PTSD driving posttraumatic headache are correct, you’d expect CPT to help both PTSD and headache. Our findings call that into question.”
Despite improvements in headache disability, CBT for headache did not significantly reduce headache frequency or intensity.
The researchers are now hoping to replicate their findings in a larger trial at multiple military and VA sites around the United States.
“We need more women, more racial and ethnic diversity, veterans as well as active military of different branches with varying comorbidities in different geographic regions attached to different hospitals and medical systems, because we’re comparing to usual care,” Dr. McGeary said.
A step forward
Commenting on the study, retired Col. Elspeth Cameron Ritchie, MD, chair of psychiatry, MedStar Washington Hospital Center, Washington, said she was “pleased” to see that this study was conducted and that she was pleased with the results.
“It’s been 20 years since 9/11, and wars are pretty much forgotten, but people are still suffering from the effects of traumatic brain injury and posttraumatic stress disorder. These are not conditions that go away quickly or lightly. They do take work,” said Dr. Ritchie, who was not involved with the research.
Finding therapies besides medication that are helpful is “good and is a step forward. The more alternatives we have, the better,” she concluded.
The study was supported in part by the Department of Defense and the Department of Veterans Affairs. Dr. McGeary and Dr. Ritchie have reported no relevant financial relationships.
A version of this article first appeared on Medscape.com.
Results from a randomized clinical trial of almost 200 military veterans showed that, compared with usual care, CBT for headache led to significant improvement in both headache disability and PTSD symptoms. Cognitive-processing therapy (CPT) also led to significant improvement in PTSD symptoms, but it did not improve headache disability.
Lead author Donald McGeary, PhD, department of rehabilitation medicine, the University of Texas Health Science Center,San Antonio, noted the improvements shown in headache disability after CBT were likely caused by its building of patients’ confidence that they could control or manage their headaches themselves.
That sense of control was key to helping patients “get their lives back. If you can improve a person’s belief that they can control their headache, they function better,” Dr. McGeary said in a news release.
The findings were published online in JAMA Neurology.
Signature wounds
Both mild traumatic brain injury (TBI) and PTSD are signature wounds of post-9/11 military conflicts. The two conditions commonly occur together and can harm quality of life and functioning, the investigators noted. Following mild TBI, many veterans experience persistent posttraumatic headache, which often co-occurs with PTSD.
To gauge the impact of CBTs for this patient population, researchers recruited 193 post-9/11 combat veterans (mean age, 39.7 years) with clinically significant PTSD symptoms and posttraumatic headache that had persisted more than 3 months after TBI. Of these, 167 were men.
All participants were receiving care at the Polytrauma Rehabilitation Center of the South Texas Veterans Health Care System in Houston.
They were randomly allocated to undergo 8 sessions of manualized CBT for headache, 12 sessions of manualized CPT for PTSD, or usual headache treatment.
CBT for headache uses CBT concepts to reduce headache disability and improve mood – and includes key components, such as relaxation, setting goals for activities patients want to resume, and planning for those situations.
CPT is a leading psychotherapy for PTSD. It teaches patients how to evaluate and change upsetting and maladaptive thoughts related to their trauma. The idea is that, by changing thoughts, patients can change the way they feel.
Treatment as usual was consistent with multidisciplinary treatment in a large Veterans Affairs multiple-trauma center and could include pharmacotherapies, physical and occupational therapies, pain medications, acupuncture, and massage.
The coprimary outcomes were headache-related disability on the six-item Headache Impact Test (HIT-6) and PTSD symptom severity on the PTSD Checklist for Diagnostic and Statistical Manual of Mental Disorders, Fifth Edition (PCL-5), assessed from end of treatment to 6 months post treatment.
At baseline, all participants reported severe headache-related disability (mean HIT-6 score, 65.8 points) and severe PTSD symptoms (mean PCL-5 score, 48.4 points).
Significant improvement
Compared with usual care, CBT for headache led to significant improvement in headache disability (posttreatment mean change in HIT-6 score, –3.4 points; P < .01) and PTSD symptoms (posttreatment change in PCL-5, –6.5 points; P = .04).
CPT also led to significant improvement in PTSD symptoms (8.9 points lower on the PCL-5 after treatment; P = .01), but it had only a modest effect on headache disability (1.4 points lower after treatment; P = .21).
“This was a surprise,” Dr. McGeary said. “If theories about PTSD driving posttraumatic headache are correct, you’d expect CPT to help both PTSD and headache. Our findings call that into question.”
Despite improvements in headache disability, CBT for headache did not significantly reduce headache frequency or intensity.
The researchers are now hoping to replicate their findings in a larger trial at multiple military and VA sites around the United States.
“We need more women, more racial and ethnic diversity, veterans as well as active military of different branches with varying comorbidities in different geographic regions attached to different hospitals and medical systems, because we’re comparing to usual care,” Dr. McGeary said.
A step forward
Commenting on the study, retired Col. Elspeth Cameron Ritchie, MD, chair of psychiatry, MedStar Washington Hospital Center, Washington, said she was “pleased” to see that this study was conducted and that she was pleased with the results.
“It’s been 20 years since 9/11, and wars are pretty much forgotten, but people are still suffering from the effects of traumatic brain injury and posttraumatic stress disorder. These are not conditions that go away quickly or lightly. They do take work,” said Dr. Ritchie, who was not involved with the research.
Finding therapies besides medication that are helpful is “good and is a step forward. The more alternatives we have, the better,” she concluded.
The study was supported in part by the Department of Defense and the Department of Veterans Affairs. Dr. McGeary and Dr. Ritchie have reported no relevant financial relationships.
A version of this article first appeared on Medscape.com.
FROM JAMA NEUROLOGY
Statins in NAFLD: Taking a closer look at benefits
LONDON – Substantial reductions in liver fat and fibrosis can be achieved with statin therapy, according to research presented at the annual International Liver Congress sponsored by the European Association for the Study of the Liver.
Statins are thought to have multiple beneficial actions in people with fatty liver disease, but there has been little insight into how they may be exerting such effects.
Now, data from the Rotterdam Study and others suggest that statins may be reducing the formation of lipid droplets as well as influencing the expression of important inflammatory genes.
The results “require further confirmation,” the team behind the work said, which was done at Erasmus Medical Center in Rotterdam, the Netherlands, in collaboration with researchers at The First Affiliated Hospital of Wenzhou (China) Medical University.
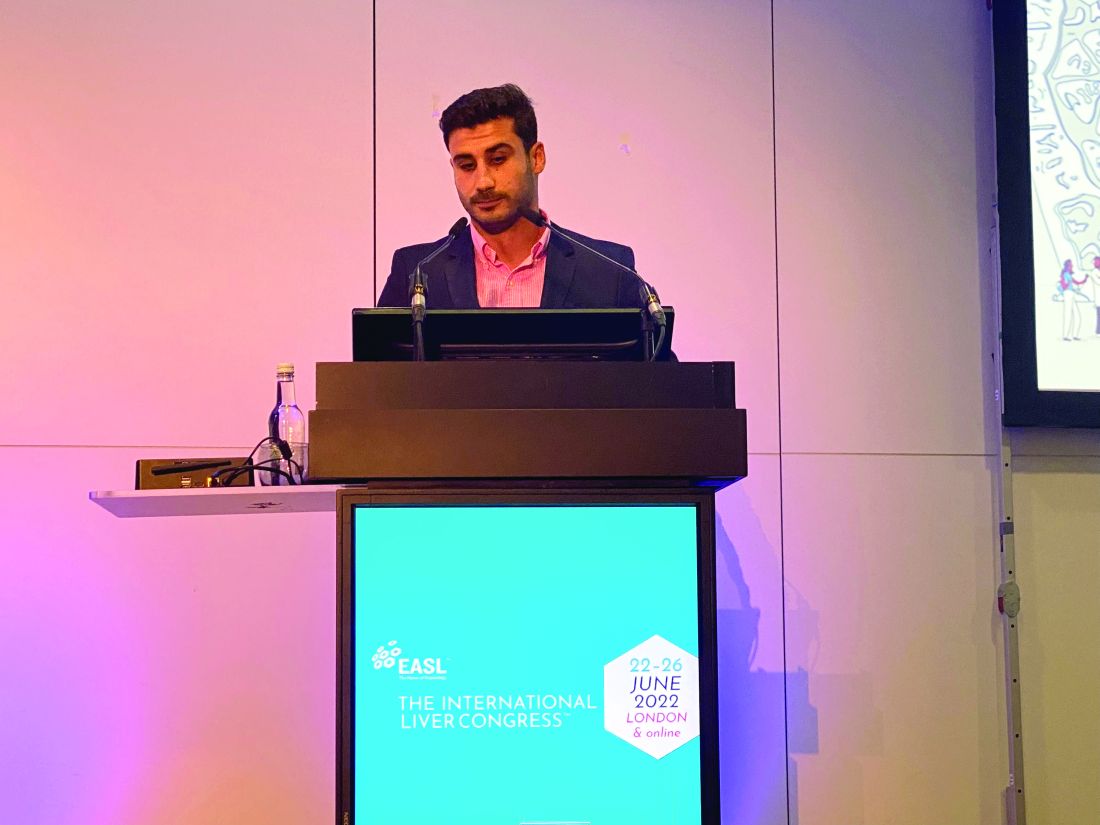
“Statins are inversely associated with multiple components of the NAFLD [nonalcoholic fatty liver disease] spectrum,” said Ibrahim Ayada, a PhD student in the department of gastroenterology and hepatology at Erasmus MC.
“Statins can inhibit lipid synthesis in organoids and statins also exhibit healthy inflammatory effects, which might contribute to the hepatoprotective effects that we observe in our population studies,” Mr. Ayada said.
A rising problem that needs addressing
Together NAFLD and NASH constitute a significant and increasing health burden, Mr. Ayada observed, noting that there were an estimated 64 million people in the United States and 52 million people in Europe, at least, with the rise mirroring the obesity pandemic.
“The number of patients visiting outpatient clinics has nearly doubled within a study period of 5 years,” he said.
“There is no pharmacologic therapy,” he reminded his audience, observing that fatty liver disease was a major indication for liver transplantation.
Statins are a long-standing staple of cardiovascular disease management and are known to have pleiotropic effects, Mr. Ayada explained. Their use in NAFLD and non-alcoholic steatohepatitis (NASH) has been purported but is supported by inconclusive evidence.
Indeed, a prior Cochrane review performed in 2013 found only two studies that were eligible for analysis and had “high risk of bias and a small numbers of participants,” according to the review’s authors.
Examining the connection
To look at the possible benefits of statins in people with NASH and examine how these effects might be occurring, Mr. Ayada and collaborators first took data from the Rotterdam Study, a large population-based prospective cohort that has been collecting data on its participants since the early 90s.
Data on over 4,500 participants were examined and of these, just over 1,000 had NAFLD. Statin versus no statin use was found to be associated with around a 30% reduction in fatty liver disease, with an odds ratio or 0.72 for NAFLD.
Then, looking only at a subset of patients with biopsy-proven NAFLD, statin use was associated with a 45% reduction in NASH (OR, 0.55) and a 24% reduction in fibrosis, although only the NASH reduction was significant (P = .031). The purpose of this cohort is to look at potential biomarkers and all participants had donated blood, urine, and stool samples; all were of Chinese descent, Mr. Ayada said.
“We then pooled our results with existing evidence in a meta-analysis,” said Mr. Ayada, including 16 studies. While results showed an overall inverse association, only the findings for a reduction in NAFLD and fibrosis were significant; the relationship between statins and NASH was not significant.
Investigating mechanistic effects
Then, for the second part of their work, Mr. Ayada and associates looked at potential mechanistic effects of statins.
“We did part two because we knew part one was going to be cross-sectional and we could only show the association and not causality, so we tried to shed some light on possible pathways,” he said.
To do this they used a novel model of liver organoids developed to study fatty liver disease and test potential therapeutics. In this model human liver organoids are exposed to sodium lactate, sodium pyruvate, and octanoic acid, which induce the formation of lipid droplets. Exposing the organoids to statins – simvastatin and lovastatin were used in the experiments – resulted in a reduced number of the induced lipid droplets.
“Although all concentrations of statins significantly inhibited the lipid size versus the control, the major effect was quite modest,” observed Mr. Ayada. The effect was most noticeable at the highest dose used (10 micromolar), and what they think might be happening is that the statins are clearing the smaller droplets first, leaving the larger ones behind.
Next, they looked at the effect of statin treatment on inflammatory gene expression in liver-derived monocytes. These will turn into macrophages and play a key role in chronic inflammation, Mr. Ayada explained. Initial results suggest that several proinflammatory cytokines such as interleukin-1 beta, IL-6, and IL-8 may be downplayed by statin therapy.
An anti-inflammatory effect of statins was also reported in unrelated poster presentations at the congress. While researchers Seul Ki Han and associated from South Korea showed an anti-inflammatory effect of a combination of simvastatin and ezetimibe (SAT083), a Dutch team found that atorvastatin reduced the infiltration of hepatic macrophages, neutrophils, and monocytes, as well as lowering levels of proinflammatory cytokines (SAT033).
Statins for NASH – a missed opportunity?
“As far as I am aware there is no robust evidence from large, randomized trials to suggest statins lessen chances of NAFLD, or improve its surrogate markers such as ALT or GGT [gamma-glutamyltransferase] levels,” Naveed Sattar, PhD, FRCP, FRCPath, FRSE, FMedSci, commented in an interview.
“The Rotterdam study is merely cross-sectional and cannot answer the question of causality,” added Dr. Sattar, who is professor of metabolic medicine and Honorary Consultant in Cardiovascular & Medical Science at the University of Glasgow. “It may be people who have less NAFLD are more likely to be prescribed statins, perhaps because doctors are wary of prescribing statins to those with slightly deranged liver tests,” he qualified.
Moreover, said Dr. Sattar, “prior evidence shows statins are underused in people with heart disease but who have NAFLD, which represents a missed opportunity to prevent heart disease.
“If statins had positive effects for preventing conversion of NAFLD to NASH or lessening fibrosis, I believe we would have known that by now.”
As for use of statins in future treatments of fatty liver disease, Dr. Sattar said: “I would not pin my hopes on statins to improve liver health, but doctors need to remember statins are safe in people with NAFLD or NASH and they should not be withheld in those who have existing cardiovascular disease or at elevated risk.”
The study received no commercial funding. Mr. Ayada and Dr. Sattar had no relevant conflicts of interest.
LONDON – Substantial reductions in liver fat and fibrosis can be achieved with statin therapy, according to research presented at the annual International Liver Congress sponsored by the European Association for the Study of the Liver.
Statins are thought to have multiple beneficial actions in people with fatty liver disease, but there has been little insight into how they may be exerting such effects.
Now, data from the Rotterdam Study and others suggest that statins may be reducing the formation of lipid droplets as well as influencing the expression of important inflammatory genes.
The results “require further confirmation,” the team behind the work said, which was done at Erasmus Medical Center in Rotterdam, the Netherlands, in collaboration with researchers at The First Affiliated Hospital of Wenzhou (China) Medical University.
“Statins are inversely associated with multiple components of the NAFLD [nonalcoholic fatty liver disease] spectrum,” said Ibrahim Ayada, a PhD student in the department of gastroenterology and hepatology at Erasmus MC.
“Statins can inhibit lipid synthesis in organoids and statins also exhibit healthy inflammatory effects, which might contribute to the hepatoprotective effects that we observe in our population studies,” Mr. Ayada said.
A rising problem that needs addressing
Together NAFLD and NASH constitute a significant and increasing health burden, Mr. Ayada observed, noting that there were an estimated 64 million people in the United States and 52 million people in Europe, at least, with the rise mirroring the obesity pandemic.
“The number of patients visiting outpatient clinics has nearly doubled within a study period of 5 years,” he said.
“There is no pharmacologic therapy,” he reminded his audience, observing that fatty liver disease was a major indication for liver transplantation.
Statins are a long-standing staple of cardiovascular disease management and are known to have pleiotropic effects, Mr. Ayada explained. Their use in NAFLD and non-alcoholic steatohepatitis (NASH) has been purported but is supported by inconclusive evidence.
Indeed, a prior Cochrane review performed in 2013 found only two studies that were eligible for analysis and had “high risk of bias and a small numbers of participants,” according to the review’s authors.
Examining the connection
To look at the possible benefits of statins in people with NASH and examine how these effects might be occurring, Mr. Ayada and collaborators first took data from the Rotterdam Study, a large population-based prospective cohort that has been collecting data on its participants since the early 90s.
Data on over 4,500 participants were examined and of these, just over 1,000 had NAFLD. Statin versus no statin use was found to be associated with around a 30% reduction in fatty liver disease, with an odds ratio or 0.72 for NAFLD.
Then, looking only at a subset of patients with biopsy-proven NAFLD, statin use was associated with a 45% reduction in NASH (OR, 0.55) and a 24% reduction in fibrosis, although only the NASH reduction was significant (P = .031). The purpose of this cohort is to look at potential biomarkers and all participants had donated blood, urine, and stool samples; all were of Chinese descent, Mr. Ayada said.
“We then pooled our results with existing evidence in a meta-analysis,” said Mr. Ayada, including 16 studies. While results showed an overall inverse association, only the findings for a reduction in NAFLD and fibrosis were significant; the relationship between statins and NASH was not significant.
Investigating mechanistic effects
Then, for the second part of their work, Mr. Ayada and associates looked at potential mechanistic effects of statins.
“We did part two because we knew part one was going to be cross-sectional and we could only show the association and not causality, so we tried to shed some light on possible pathways,” he said.
To do this they used a novel model of liver organoids developed to study fatty liver disease and test potential therapeutics. In this model human liver organoids are exposed to sodium lactate, sodium pyruvate, and octanoic acid, which induce the formation of lipid droplets. Exposing the organoids to statins – simvastatin and lovastatin were used in the experiments – resulted in a reduced number of the induced lipid droplets.
“Although all concentrations of statins significantly inhibited the lipid size versus the control, the major effect was quite modest,” observed Mr. Ayada. The effect was most noticeable at the highest dose used (10 micromolar), and what they think might be happening is that the statins are clearing the smaller droplets first, leaving the larger ones behind.
Next, they looked at the effect of statin treatment on inflammatory gene expression in liver-derived monocytes. These will turn into macrophages and play a key role in chronic inflammation, Mr. Ayada explained. Initial results suggest that several proinflammatory cytokines such as interleukin-1 beta, IL-6, and IL-8 may be downplayed by statin therapy.
An anti-inflammatory effect of statins was also reported in unrelated poster presentations at the congress. While researchers Seul Ki Han and associated from South Korea showed an anti-inflammatory effect of a combination of simvastatin and ezetimibe (SAT083), a Dutch team found that atorvastatin reduced the infiltration of hepatic macrophages, neutrophils, and monocytes, as well as lowering levels of proinflammatory cytokines (SAT033).
Statins for NASH – a missed opportunity?
“As far as I am aware there is no robust evidence from large, randomized trials to suggest statins lessen chances of NAFLD, or improve its surrogate markers such as ALT or GGT [gamma-glutamyltransferase] levels,” Naveed Sattar, PhD, FRCP, FRCPath, FRSE, FMedSci, commented in an interview.
“The Rotterdam study is merely cross-sectional and cannot answer the question of causality,” added Dr. Sattar, who is professor of metabolic medicine and Honorary Consultant in Cardiovascular & Medical Science at the University of Glasgow. “It may be people who have less NAFLD are more likely to be prescribed statins, perhaps because doctors are wary of prescribing statins to those with slightly deranged liver tests,” he qualified.
Moreover, said Dr. Sattar, “prior evidence shows statins are underused in people with heart disease but who have NAFLD, which represents a missed opportunity to prevent heart disease.
“If statins had positive effects for preventing conversion of NAFLD to NASH or lessening fibrosis, I believe we would have known that by now.”
As for use of statins in future treatments of fatty liver disease, Dr. Sattar said: “I would not pin my hopes on statins to improve liver health, but doctors need to remember statins are safe in people with NAFLD or NASH and they should not be withheld in those who have existing cardiovascular disease or at elevated risk.”
The study received no commercial funding. Mr. Ayada and Dr. Sattar had no relevant conflicts of interest.
LONDON – Substantial reductions in liver fat and fibrosis can be achieved with statin therapy, according to research presented at the annual International Liver Congress sponsored by the European Association for the Study of the Liver.
Statins are thought to have multiple beneficial actions in people with fatty liver disease, but there has been little insight into how they may be exerting such effects.
Now, data from the Rotterdam Study and others suggest that statins may be reducing the formation of lipid droplets as well as influencing the expression of important inflammatory genes.
The results “require further confirmation,” the team behind the work said, which was done at Erasmus Medical Center in Rotterdam, the Netherlands, in collaboration with researchers at The First Affiliated Hospital of Wenzhou (China) Medical University.
“Statins are inversely associated with multiple components of the NAFLD [nonalcoholic fatty liver disease] spectrum,” said Ibrahim Ayada, a PhD student in the department of gastroenterology and hepatology at Erasmus MC.
“Statins can inhibit lipid synthesis in organoids and statins also exhibit healthy inflammatory effects, which might contribute to the hepatoprotective effects that we observe in our population studies,” Mr. Ayada said.
A rising problem that needs addressing
Together NAFLD and NASH constitute a significant and increasing health burden, Mr. Ayada observed, noting that there were an estimated 64 million people in the United States and 52 million people in Europe, at least, with the rise mirroring the obesity pandemic.
“The number of patients visiting outpatient clinics has nearly doubled within a study period of 5 years,” he said.
“There is no pharmacologic therapy,” he reminded his audience, observing that fatty liver disease was a major indication for liver transplantation.
Statins are a long-standing staple of cardiovascular disease management and are known to have pleiotropic effects, Mr. Ayada explained. Their use in NAFLD and non-alcoholic steatohepatitis (NASH) has been purported but is supported by inconclusive evidence.
Indeed, a prior Cochrane review performed in 2013 found only two studies that were eligible for analysis and had “high risk of bias and a small numbers of participants,” according to the review’s authors.
Examining the connection
To look at the possible benefits of statins in people with NASH and examine how these effects might be occurring, Mr. Ayada and collaborators first took data from the Rotterdam Study, a large population-based prospective cohort that has been collecting data on its participants since the early 90s.
Data on over 4,500 participants were examined and of these, just over 1,000 had NAFLD. Statin versus no statin use was found to be associated with around a 30% reduction in fatty liver disease, with an odds ratio or 0.72 for NAFLD.
Then, looking only at a subset of patients with biopsy-proven NAFLD, statin use was associated with a 45% reduction in NASH (OR, 0.55) and a 24% reduction in fibrosis, although only the NASH reduction was significant (P = .031). The purpose of this cohort is to look at potential biomarkers and all participants had donated blood, urine, and stool samples; all were of Chinese descent, Mr. Ayada said.
“We then pooled our results with existing evidence in a meta-analysis,” said Mr. Ayada, including 16 studies. While results showed an overall inverse association, only the findings for a reduction in NAFLD and fibrosis were significant; the relationship between statins and NASH was not significant.
Investigating mechanistic effects
Then, for the second part of their work, Mr. Ayada and associates looked at potential mechanistic effects of statins.
“We did part two because we knew part one was going to be cross-sectional and we could only show the association and not causality, so we tried to shed some light on possible pathways,” he said.
To do this they used a novel model of liver organoids developed to study fatty liver disease and test potential therapeutics. In this model human liver organoids are exposed to sodium lactate, sodium pyruvate, and octanoic acid, which induce the formation of lipid droplets. Exposing the organoids to statins – simvastatin and lovastatin were used in the experiments – resulted in a reduced number of the induced lipid droplets.
“Although all concentrations of statins significantly inhibited the lipid size versus the control, the major effect was quite modest,” observed Mr. Ayada. The effect was most noticeable at the highest dose used (10 micromolar), and what they think might be happening is that the statins are clearing the smaller droplets first, leaving the larger ones behind.
Next, they looked at the effect of statin treatment on inflammatory gene expression in liver-derived monocytes. These will turn into macrophages and play a key role in chronic inflammation, Mr. Ayada explained. Initial results suggest that several proinflammatory cytokines such as interleukin-1 beta, IL-6, and IL-8 may be downplayed by statin therapy.
An anti-inflammatory effect of statins was also reported in unrelated poster presentations at the congress. While researchers Seul Ki Han and associated from South Korea showed an anti-inflammatory effect of a combination of simvastatin and ezetimibe (SAT083), a Dutch team found that atorvastatin reduced the infiltration of hepatic macrophages, neutrophils, and monocytes, as well as lowering levels of proinflammatory cytokines (SAT033).
Statins for NASH – a missed opportunity?
“As far as I am aware there is no robust evidence from large, randomized trials to suggest statins lessen chances of NAFLD, or improve its surrogate markers such as ALT or GGT [gamma-glutamyltransferase] levels,” Naveed Sattar, PhD, FRCP, FRCPath, FRSE, FMedSci, commented in an interview.
“The Rotterdam study is merely cross-sectional and cannot answer the question of causality,” added Dr. Sattar, who is professor of metabolic medicine and Honorary Consultant in Cardiovascular & Medical Science at the University of Glasgow. “It may be people who have less NAFLD are more likely to be prescribed statins, perhaps because doctors are wary of prescribing statins to those with slightly deranged liver tests,” he qualified.
Moreover, said Dr. Sattar, “prior evidence shows statins are underused in people with heart disease but who have NAFLD, which represents a missed opportunity to prevent heart disease.
“If statins had positive effects for preventing conversion of NAFLD to NASH or lessening fibrosis, I believe we would have known that by now.”
As for use of statins in future treatments of fatty liver disease, Dr. Sattar said: “I would not pin my hopes on statins to improve liver health, but doctors need to remember statins are safe in people with NAFLD or NASH and they should not be withheld in those who have existing cardiovascular disease or at elevated risk.”
The study received no commercial funding. Mr. Ayada and Dr. Sattar had no relevant conflicts of interest.
AT ILC 2022
Phase 3 data shows bulevirtide benefit in hepatitis D
LONDON – Bulevirtide may not just treat but perhaps be a potential cure for hepatitis D in some patients, as was suggested at the annual International Liver Congress.
Data from an ongoing phase 3 trial showed that, after 48 weeks of treatment, almost half of those treated with bulevirtide achieved the combined primary endpoint of reduced or undetectable hepatitis delta virus (HDV) RNA levels and normalized ALT levels.
“The good message for our patients is that the initial data of the smaller phase 2 trials will really be confirmed, so the drug works,” Heiner Wedemeyer, MD, said at a media briefing ahead of his presentation at the meeting sponsored by the European Association for the Study of the Liver .
“It induces a decline in viral load and, very importantly for us as hepatologists, liver enzymes normalize, this is really good news” added Dr. Wedemeyer, who is the clinic director of the department of gastroenterology, hepatology, and endocrinology at Hannover (Germany) Medical School.
“This is really an almost historic moment for hepatology,” he said. “It’s the first time that these patients have an antiviral treatment; they are afraid of dying and now they have a hope.”
Giving his thoughts, Thomas Berg, MD, Secretary General of EASL, said: “We are entering into a golden age of hepatology science when it comes to viral hepatitis.
Dr. Berg, also of University Clinic Leipzig (Germany), added: “We have several million people worldwide living with viral hepatitis; we have a cure for hepatitis C but there’s no cure for hepatitis B or hepatitis D, so these data give me great hope that we have scientific momentum with us.”
Pivotal phase 3 study
The MYR301 trial is an important and pivotal study for bulevirtide, which is a first-in-class HDV entry inhibitor. While it was approved for use Europe in 2020 under the brand name Hepcludex, the drug remains investigational in the United States.
“We were really surprised that EMA [European Medicines Agency] went forward, granting approval because there was no alternative available at that time,” Dr. Wedemeyer said. That approval is conditional, however, and was based on the results of phase 2 studies with the proviso that further data needed would need to be provided. Hopefully, the phase 3 findings will mean that the drug will receive full official approval, he said.
Overall, 150 patients with chronic hepatitis D were recruited into the phase 3 study and randomized to receive one of two doses of bulevirtide (2 mg or 10 mg) for 144 weeks or delayed treatment for 48 weeks followed by the higher dose of the drug until the remainder of the treatment period. Bulevirtide was given as once-daily subcutaneous injection.
The mean age of participants was 41 years, the majority (82.7%) were White, and just under half already had liver cirrhosis. For inclusion, Dr. Wedemeyer said that they had to have compensated cirrhosis.
Just over half had received prior interferon therapy and almost two-thirds were receiving concomitant nucleos(t)ide (NUC) treatment.
Key results
The primary endpoint was defined as a combination of decreased HDV RNA (defined as undetectable or a 2 log or greater decrease) and normalized ALT (defined as 3.1 U/L or less in women and 4.1 U/L or less in men). This was assessed after 48 weeks’ treatment and was achieved by 45% of participants given the 2-mg dose of bulevirtide, 48% of those given the 10-mg dose, and by 2% of those who had delayed treatment (P < .0001 for both doses, compared with delayed treatment).
The treatment benefit was consistent across all subgroups of patients, including those with cirrhosis, Dr. Wedemeyer reported.
Looking at some of the secondary endpoints, he reported that, when considering only decreased HDV RNA, the rate of response was over 70% with both dose of bulevirtide at week 48, compared with just 4% for delayed treatment (P < .0001), although there was no significant difference in rates of undetectable HDV RNA between the two doses. ALT normalization rates were 51%-56% versus 12% for delayed treatment (P < .0001).
A further benefit was seen in liver stiffness, with values reduced by at least three points at week 48 with either dose of bulevirtide, compared with an increase of almost 1 point for delayed treatment.
As for side effects, one of the concerns for bulevirtide is an increase in serum bile acids, but when this occurred, it occurred early and remained steady over the course of treatment, with a less pronounced effect in the 2 mg–dosed group than the 10 mg–dosed group. There were no serious adverse reactions related to bulevirtide or any adverse event that led to stopping the drug.
“There are always questions that need to be answered,” Dr. Wedemeyer acknowledged. Indeed, it’s unclear for how long patients need to be treated and if treatment with interferon is needed. In the phase 2 studies (MYR202 and MYR203), bulevirtide was given at the same time as pegylated interferon alpha (peg-IFNa) or tenofovir, whereas in the phase 3 MYR301 trial, it was given as monotherapy.
Real-world experience
“We have already some real-world data in parallel to this phase 3 trial,” Dr. Wedemeyer said. “So, for us in the hepatitis D field, it is a really exciting time; [it’s] completely novel data and game-changing for patients.”
“The results are similar to our real life study, but in our real-life study, we have some patients treated with interferon and some not treated with interferon,” Hélène Fontaine, MD, of Hôpital Cochin in Paris, observed in an interview.
She reported preliminary results from the prospective BuleDelta cohort, which showed a virologic response rate of 58% and ALT normalization in 46% of patients.
“Virologic response was achieved in more patients receiving bulevirtide in combination with interferon,” she said. Indeed, 84% of patient who received peg-IFNa versus 39% of those who did not achieved a virologic response. However, rates of ALT normalization were more frequent in those received bulevirtide monotherapy than in combination with peg-IFN1 (54% vs. 35%).
A greater benefit of combining bulevirtide with interferon therapy was also seen in another real-world study presented by Victor de Lédinghen, MD, PhD, of Bordeaux (France) University Hospital. After 18 months of treatment, bulevirtide plus peg-IFNa was associated with undetectable HDV RNA in 57% of patients versus 33% of those given the drug as monotherapy.
“Of course, if you add interferon, it’s better than without but you cannot use interferon in all patients,” he observed in an interview.
Results are good but could be better, he suggested, noting that the results are dependent on patients injecting themselves correctly on a daily basis.
At the media briefing Dr. Wedemeyer also commented on how bulevirtide must be delivered.
“The only, let’s say, disadvantage is that it has to be injected because it’s a peptide, which requires daily injections, but patients managed very well,” Dr. Wedemeyer said.
“There is some evidence from single cases that we may stop treatment and that the virus does not come back,” he said, but stressed that patients should not stop treatment on their own as the risk is not known.
“For patients with advanced disease I consider this as a maintenance treatment,” Dr. Wedemeyer said, at least for the time being.
The MYR3201 study was funded by Gilead Sciences. The BuleDelta cohort is sponsored by the ANRS Maladies Infectieuses Emergencies. Dr. Wedemeyer acknowledged research funding, acting as a consultant to, and giving paid lectures on behalf of Gilead Sciences and MYR as well as having ties to multiple pharmaceutical and biotechnology companies. Dr. Berg, Dr. Fontaine, and Dr. de Lédinghen had no conflicts of interest to report.
LONDON – Bulevirtide may not just treat but perhaps be a potential cure for hepatitis D in some patients, as was suggested at the annual International Liver Congress.
Data from an ongoing phase 3 trial showed that, after 48 weeks of treatment, almost half of those treated with bulevirtide achieved the combined primary endpoint of reduced or undetectable hepatitis delta virus (HDV) RNA levels and normalized ALT levels.
“The good message for our patients is that the initial data of the smaller phase 2 trials will really be confirmed, so the drug works,” Heiner Wedemeyer, MD, said at a media briefing ahead of his presentation at the meeting sponsored by the European Association for the Study of the Liver .
“It induces a decline in viral load and, very importantly for us as hepatologists, liver enzymes normalize, this is really good news” added Dr. Wedemeyer, who is the clinic director of the department of gastroenterology, hepatology, and endocrinology at Hannover (Germany) Medical School.
“This is really an almost historic moment for hepatology,” he said. “It’s the first time that these patients have an antiviral treatment; they are afraid of dying and now they have a hope.”
Giving his thoughts, Thomas Berg, MD, Secretary General of EASL, said: “We are entering into a golden age of hepatology science when it comes to viral hepatitis.
Dr. Berg, also of University Clinic Leipzig (Germany), added: “We have several million people worldwide living with viral hepatitis; we have a cure for hepatitis C but there’s no cure for hepatitis B or hepatitis D, so these data give me great hope that we have scientific momentum with us.”
Pivotal phase 3 study
The MYR301 trial is an important and pivotal study for bulevirtide, which is a first-in-class HDV entry inhibitor. While it was approved for use Europe in 2020 under the brand name Hepcludex, the drug remains investigational in the United States.
“We were really surprised that EMA [European Medicines Agency] went forward, granting approval because there was no alternative available at that time,” Dr. Wedemeyer said. That approval is conditional, however, and was based on the results of phase 2 studies with the proviso that further data needed would need to be provided. Hopefully, the phase 3 findings will mean that the drug will receive full official approval, he said.
Overall, 150 patients with chronic hepatitis D were recruited into the phase 3 study and randomized to receive one of two doses of bulevirtide (2 mg or 10 mg) for 144 weeks or delayed treatment for 48 weeks followed by the higher dose of the drug until the remainder of the treatment period. Bulevirtide was given as once-daily subcutaneous injection.
The mean age of participants was 41 years, the majority (82.7%) were White, and just under half already had liver cirrhosis. For inclusion, Dr. Wedemeyer said that they had to have compensated cirrhosis.
Just over half had received prior interferon therapy and almost two-thirds were receiving concomitant nucleos(t)ide (NUC) treatment.
Key results
The primary endpoint was defined as a combination of decreased HDV RNA (defined as undetectable or a 2 log or greater decrease) and normalized ALT (defined as 3.1 U/L or less in women and 4.1 U/L or less in men). This was assessed after 48 weeks’ treatment and was achieved by 45% of participants given the 2-mg dose of bulevirtide, 48% of those given the 10-mg dose, and by 2% of those who had delayed treatment (P < .0001 for both doses, compared with delayed treatment).
The treatment benefit was consistent across all subgroups of patients, including those with cirrhosis, Dr. Wedemeyer reported.
Looking at some of the secondary endpoints, he reported that, when considering only decreased HDV RNA, the rate of response was over 70% with both dose of bulevirtide at week 48, compared with just 4% for delayed treatment (P < .0001), although there was no significant difference in rates of undetectable HDV RNA between the two doses. ALT normalization rates were 51%-56% versus 12% for delayed treatment (P < .0001).
A further benefit was seen in liver stiffness, with values reduced by at least three points at week 48 with either dose of bulevirtide, compared with an increase of almost 1 point for delayed treatment.
As for side effects, one of the concerns for bulevirtide is an increase in serum bile acids, but when this occurred, it occurred early and remained steady over the course of treatment, with a less pronounced effect in the 2 mg–dosed group than the 10 mg–dosed group. There were no serious adverse reactions related to bulevirtide or any adverse event that led to stopping the drug.
“There are always questions that need to be answered,” Dr. Wedemeyer acknowledged. Indeed, it’s unclear for how long patients need to be treated and if treatment with interferon is needed. In the phase 2 studies (MYR202 and MYR203), bulevirtide was given at the same time as pegylated interferon alpha (peg-IFNa) or tenofovir, whereas in the phase 3 MYR301 trial, it was given as monotherapy.
Real-world experience
“We have already some real-world data in parallel to this phase 3 trial,” Dr. Wedemeyer said. “So, for us in the hepatitis D field, it is a really exciting time; [it’s] completely novel data and game-changing for patients.”
“The results are similar to our real life study, but in our real-life study, we have some patients treated with interferon and some not treated with interferon,” Hélène Fontaine, MD, of Hôpital Cochin in Paris, observed in an interview.
She reported preliminary results from the prospective BuleDelta cohort, which showed a virologic response rate of 58% and ALT normalization in 46% of patients.
“Virologic response was achieved in more patients receiving bulevirtide in combination with interferon,” she said. Indeed, 84% of patient who received peg-IFNa versus 39% of those who did not achieved a virologic response. However, rates of ALT normalization were more frequent in those received bulevirtide monotherapy than in combination with peg-IFN1 (54% vs. 35%).
A greater benefit of combining bulevirtide with interferon therapy was also seen in another real-world study presented by Victor de Lédinghen, MD, PhD, of Bordeaux (France) University Hospital. After 18 months of treatment, bulevirtide plus peg-IFNa was associated with undetectable HDV RNA in 57% of patients versus 33% of those given the drug as monotherapy.
“Of course, if you add interferon, it’s better than without but you cannot use interferon in all patients,” he observed in an interview.
Results are good but could be better, he suggested, noting that the results are dependent on patients injecting themselves correctly on a daily basis.
At the media briefing Dr. Wedemeyer also commented on how bulevirtide must be delivered.
“The only, let’s say, disadvantage is that it has to be injected because it’s a peptide, which requires daily injections, but patients managed very well,” Dr. Wedemeyer said.
“There is some evidence from single cases that we may stop treatment and that the virus does not come back,” he said, but stressed that patients should not stop treatment on their own as the risk is not known.
“For patients with advanced disease I consider this as a maintenance treatment,” Dr. Wedemeyer said, at least for the time being.
The MYR3201 study was funded by Gilead Sciences. The BuleDelta cohort is sponsored by the ANRS Maladies Infectieuses Emergencies. Dr. Wedemeyer acknowledged research funding, acting as a consultant to, and giving paid lectures on behalf of Gilead Sciences and MYR as well as having ties to multiple pharmaceutical and biotechnology companies. Dr. Berg, Dr. Fontaine, and Dr. de Lédinghen had no conflicts of interest to report.
LONDON – Bulevirtide may not just treat but perhaps be a potential cure for hepatitis D in some patients, as was suggested at the annual International Liver Congress.
Data from an ongoing phase 3 trial showed that, after 48 weeks of treatment, almost half of those treated with bulevirtide achieved the combined primary endpoint of reduced or undetectable hepatitis delta virus (HDV) RNA levels and normalized ALT levels.
“The good message for our patients is that the initial data of the smaller phase 2 trials will really be confirmed, so the drug works,” Heiner Wedemeyer, MD, said at a media briefing ahead of his presentation at the meeting sponsored by the European Association for the Study of the Liver .
“It induces a decline in viral load and, very importantly for us as hepatologists, liver enzymes normalize, this is really good news” added Dr. Wedemeyer, who is the clinic director of the department of gastroenterology, hepatology, and endocrinology at Hannover (Germany) Medical School.
“This is really an almost historic moment for hepatology,” he said. “It’s the first time that these patients have an antiviral treatment; they are afraid of dying and now they have a hope.”
Giving his thoughts, Thomas Berg, MD, Secretary General of EASL, said: “We are entering into a golden age of hepatology science when it comes to viral hepatitis.
Dr. Berg, also of University Clinic Leipzig (Germany), added: “We have several million people worldwide living with viral hepatitis; we have a cure for hepatitis C but there’s no cure for hepatitis B or hepatitis D, so these data give me great hope that we have scientific momentum with us.”
Pivotal phase 3 study
The MYR301 trial is an important and pivotal study for bulevirtide, which is a first-in-class HDV entry inhibitor. While it was approved for use Europe in 2020 under the brand name Hepcludex, the drug remains investigational in the United States.
“We were really surprised that EMA [European Medicines Agency] went forward, granting approval because there was no alternative available at that time,” Dr. Wedemeyer said. That approval is conditional, however, and was based on the results of phase 2 studies with the proviso that further data needed would need to be provided. Hopefully, the phase 3 findings will mean that the drug will receive full official approval, he said.
Overall, 150 patients with chronic hepatitis D were recruited into the phase 3 study and randomized to receive one of two doses of bulevirtide (2 mg or 10 mg) for 144 weeks or delayed treatment for 48 weeks followed by the higher dose of the drug until the remainder of the treatment period. Bulevirtide was given as once-daily subcutaneous injection.
The mean age of participants was 41 years, the majority (82.7%) were White, and just under half already had liver cirrhosis. For inclusion, Dr. Wedemeyer said that they had to have compensated cirrhosis.
Just over half had received prior interferon therapy and almost two-thirds were receiving concomitant nucleos(t)ide (NUC) treatment.
Key results
The primary endpoint was defined as a combination of decreased HDV RNA (defined as undetectable or a 2 log or greater decrease) and normalized ALT (defined as 3.1 U/L or less in women and 4.1 U/L or less in men). This was assessed after 48 weeks’ treatment and was achieved by 45% of participants given the 2-mg dose of bulevirtide, 48% of those given the 10-mg dose, and by 2% of those who had delayed treatment (P < .0001 for both doses, compared with delayed treatment).
The treatment benefit was consistent across all subgroups of patients, including those with cirrhosis, Dr. Wedemeyer reported.
Looking at some of the secondary endpoints, he reported that, when considering only decreased HDV RNA, the rate of response was over 70% with both dose of bulevirtide at week 48, compared with just 4% for delayed treatment (P < .0001), although there was no significant difference in rates of undetectable HDV RNA between the two doses. ALT normalization rates were 51%-56% versus 12% for delayed treatment (P < .0001).
A further benefit was seen in liver stiffness, with values reduced by at least three points at week 48 with either dose of bulevirtide, compared with an increase of almost 1 point for delayed treatment.
As for side effects, one of the concerns for bulevirtide is an increase in serum bile acids, but when this occurred, it occurred early and remained steady over the course of treatment, with a less pronounced effect in the 2 mg–dosed group than the 10 mg–dosed group. There were no serious adverse reactions related to bulevirtide or any adverse event that led to stopping the drug.
“There are always questions that need to be answered,” Dr. Wedemeyer acknowledged. Indeed, it’s unclear for how long patients need to be treated and if treatment with interferon is needed. In the phase 2 studies (MYR202 and MYR203), bulevirtide was given at the same time as pegylated interferon alpha (peg-IFNa) or tenofovir, whereas in the phase 3 MYR301 trial, it was given as monotherapy.
Real-world experience
“We have already some real-world data in parallel to this phase 3 trial,” Dr. Wedemeyer said. “So, for us in the hepatitis D field, it is a really exciting time; [it’s] completely novel data and game-changing for patients.”
“The results are similar to our real life study, but in our real-life study, we have some patients treated with interferon and some not treated with interferon,” Hélène Fontaine, MD, of Hôpital Cochin in Paris, observed in an interview.
She reported preliminary results from the prospective BuleDelta cohort, which showed a virologic response rate of 58% and ALT normalization in 46% of patients.
“Virologic response was achieved in more patients receiving bulevirtide in combination with interferon,” she said. Indeed, 84% of patient who received peg-IFNa versus 39% of those who did not achieved a virologic response. However, rates of ALT normalization were more frequent in those received bulevirtide monotherapy than in combination with peg-IFN1 (54% vs. 35%).
A greater benefit of combining bulevirtide with interferon therapy was also seen in another real-world study presented by Victor de Lédinghen, MD, PhD, of Bordeaux (France) University Hospital. After 18 months of treatment, bulevirtide plus peg-IFNa was associated with undetectable HDV RNA in 57% of patients versus 33% of those given the drug as monotherapy.
“Of course, if you add interferon, it’s better than without but you cannot use interferon in all patients,” he observed in an interview.
Results are good but could be better, he suggested, noting that the results are dependent on patients injecting themselves correctly on a daily basis.
At the media briefing Dr. Wedemeyer also commented on how bulevirtide must be delivered.
“The only, let’s say, disadvantage is that it has to be injected because it’s a peptide, which requires daily injections, but patients managed very well,” Dr. Wedemeyer said.
“There is some evidence from single cases that we may stop treatment and that the virus does not come back,” he said, but stressed that patients should not stop treatment on their own as the risk is not known.
“For patients with advanced disease I consider this as a maintenance treatment,” Dr. Wedemeyer said, at least for the time being.
The MYR3201 study was funded by Gilead Sciences. The BuleDelta cohort is sponsored by the ANRS Maladies Infectieuses Emergencies. Dr. Wedemeyer acknowledged research funding, acting as a consultant to, and giving paid lectures on behalf of Gilead Sciences and MYR as well as having ties to multiple pharmaceutical and biotechnology companies. Dr. Berg, Dr. Fontaine, and Dr. de Lédinghen had no conflicts of interest to report.
AT ILC 2022
A guide to understanding your anatomy


Effect of Pharmacist Interventions on Hospital Readmissions for Home-Based Primary Care Veterans
Following hospital discharge, patients are often in a vulnerable state due to new medical diagnoses, changes in medications, lack of understanding, and concerns for medical costs. In addition, the discharge process is complex and encompasses decisions regarding the postdischarge site of care, conveying patient instructions, and obtaining supplies and medications. There are several disciplines involved in the transitions of care process that are all essential for ensuring a successful transition and reducing the risk of hospital readmissions. Pharmacists play an integral role in the process.
When pharmacists are provided the opportunity to make therapeutic interventions, medication errors and hospital readmissions decrease and quality of life improves.1 Studies have shown that many older patients return home from the hospital with a limited understanding of their discharge instructions and oftentimes are unable to recall their discharge diagnoses and treatment plan, leaving opportunities for error when patients transition from one level of care to another.2,3 Additionally, high-quality transitional care is especially important for older adults with multiple comorbidities and complex therapeutic regimens as well as for their families and caregivers.4 To prevent hospital readmissions, pharmacists and other health care professionals (HCPs) should work diligently to prevent gaps in care as patients transition between settings. Common factors that lead to increased readmissions include premature discharge, inadequate follow-up, therapeutic errors, and medication-related problems. Furthermore, unintended hospital readmissions are common within the first 30 days following hospital discharge and lead to increased health care costs.2 For these reasons, many health care institutions have developed comprehensive models to improve the discharge process, decrease hospital readmissions, and reduce incidence of adverse events in general medical patients and high-risk populations.5
A study evaluating 693 hospital discharges found that 27.6% of patients were recommended for outpatient workups; however only 9% were actually completed.6 Due to lack of communication regarding discharge summaries, primary care practitioners (PCPs) were unaware of the need for outpatient workups; thus, these patients were lost to follow-up, and appropriate care was not received. Future studies should focus on interventions to improve the quality and dissemination of discharge information to PCPs.6 Fosnight and colleagues assessed a new transitions process focusing on the role of pharmacists. They evaluated medication reconciliations performed and discussed medication adherence barriers, medication recommendations, and time spent performing the interventions.7 After patients received a pharmacy intervention, Fosnight and colleagues reported that readmission rates decreased from 21.0% to 15.3% and mean length of stay decreased from 5.3 to 4.4 days. They also observed greater improvements in patients who received the full pharmacy intervention vs those receiving only parts of the intervention. This study concluded that adding a comprehensive pharmacy intervention to transitions of care resulted in an average of nearly 10 medication recommendations per patient, improved length of stay, and reduced readmission rates. After a review of similar studies, we concluded that a comprehensive discharge model is imperative to improve patient outcomes, along with HCP monitoring of the process to ensure appropriate follow-up.8
At Michael E. DeBakey Veteran Affairs Medical Center (MEDVAMC) in Houston, Texas, 30-day readmissions data were reviewed for veterans 6 months before and 12 months after enrollment in the Home-Based Primary Care (HBPC) service. HBPC is an in-home health care service provided to home-bound veterans with complex health care needs or when routine clinic-based care is not feasible. HBPC programs may differ among various US Department of Veterans Affairs (VA) medical centers. Currently, there are 9 HBPC teams at MEDVAMC and nearly 540 veterans are enrolled in the program. HBPC teams typically consist of PCPs, pharmacists, nurses, psychologists, occupational/physical therapists, social workers, medical support assistants, and dietitians.
Readmissions data are reviewed quarterly by fiscal year (FY) (Table 1). In FY 2019 quarter (Q) 2, the readmission rate before HBPC enrollment was 31% and decreased to 20% after enrollment. In FY 2019 Q3, the readmission rate was 29% before enrollment and decreased to 16% afterward. In FY 2019 Q4, the readmission rate before HBPC enrollment was 28% and decreased to 19% afterward. Although the readmission rates appeared to be decreasing overall, improvements were needed to decrease these rates further and to ensure readmissions were not rising as there was a slight increase in Q4. After reviewing these data, the HBPC service implemented a streamlined hospital discharge process to lower readmission rates and improve patient outcomes.
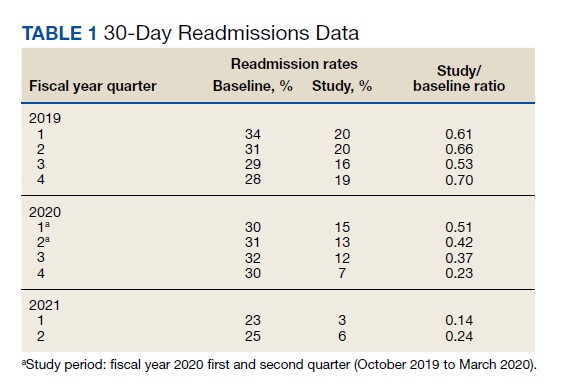
HBPC at MEDVAMC incorporates a team-based approach and the new streamlined discharge process implemented in 2019 highlights the role of each team member (Figure). Medical support assistants send daily emails of hospital discharges occurring in the last 7 days. Registered nurses are responsible for postdischarge calls within 2 days and home visits within 5 days. Pharmacists perform medication reconciliation within 14 days of discharge, review and/or educate on new medications, and change medications. The PCP is responsible for posthospital calls within 2 days and conducts a home visit within 5 days. Because HBPC programs vary among VA medical centers, the streamlined discharge process discussed may be applicable only to MEDVAMC. The primary objective of this quality improvement project was to identify specific pharmacist interventions to improve the HBPC discharge process and improve hospital readmission rates.
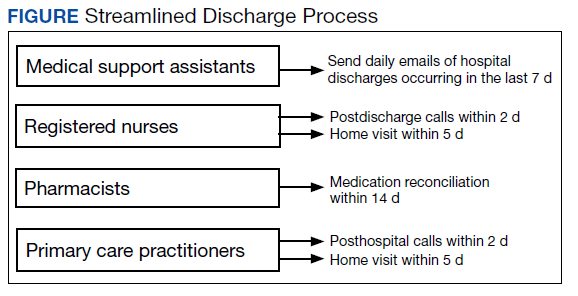
Methods
We conducted a Plan-Do-Study-Act quality improvement project. The first step was to conduct a review of veterans enrolled in HBPC at MEDVAMC.9 Patients included were enrolled in HBPC at MEDVAMC from October 2019 to March 2020 (FY 2020 Q1 and Q2). The Computerized Patient Record System was used to access the patients’ electronic health records. Patient information collected included race, age, sex, admission diagnosis, date of discharge, HBPC pharmacist name, PCP notification on the discharge summary, and 30-day readmission rates. Unplanned return to the hospital within 30 days, which was counted as a readmission, was defined as any admission for acute clinical events that required urgent hospital management.10
Next, we identified specific pharmacist interventions, including medication reconciliation completed by an HBPC pharmacist postdischarge; mean time to contact patients postdischarge; correct medications and supplies on discharge; incorrect dose; incorrect medication frequency or route of administration; therapeutic duplications; discontinuation of medications; additional drug therapy recommendations; laboratory test recommendations; maintenance medications not restarted or omitted; new medication education; and medication or formulation changes.
In the third step, we reviewed discharge summaries and clinical pharmacy notes to collect pharmacist intervention data. These data were analyzed to develop a standardized discharge process. Descriptive statistics were used to represent the results of the study.
Results
Medication reconciliation was completed postdischarge by an HBPC pharmacist in 118 of 175 study patients (67.4%). The mean age of patients was 76 years, about 95% were male (Table 2). There was a wide variety of admission diagnoses but sepsis, chronic obstructive pulmonary disease, and chronic kidney disease were most common. The PCP was notified on the discharge note for 68 (38.9%) patients. The mean time for HBPC pharmacists to contact patients postdischarge was about 3 days, which was much less than the 14 days allowed in the streamlined discharge process.
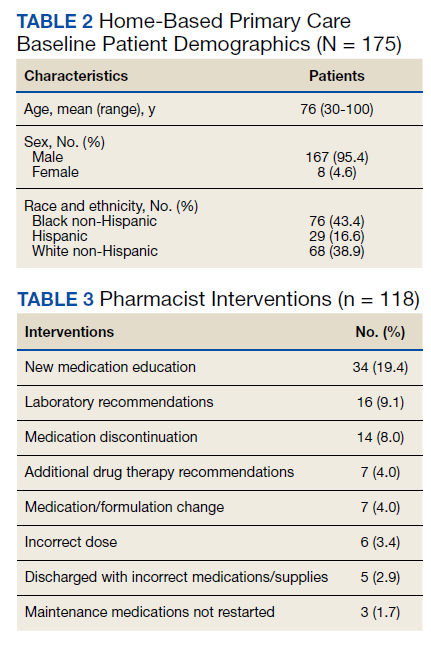
Pharmacists made the following interventions during medication reconciliation: New medication education was provided for 34 (19.4%) patients and was the largest intervention completed by HBPC pharmacists. Laboratory tests were recommended for 16 (9.1%) patients, medications were discontinued in 14 (8.0%) patients, and additional drug therapy recommendations were made for 7 (4.0%) patients. Medication or formulation changes were completed in 7 (4.0%) patients, incorrect doses were identified in 6 (3.4%) patients, 5 (2.9%) patients were not discharged with the correct medications or supplies, maintenance medications were not restarted in 3 (1.7%) patients, and there were no therapeutic duplications identified. In total, there were 92 (77.9%) patients with interventions compared with the 118 medication reconciliations completed (Table 3).
Process Improvement
As this was a new streamlined discharge process, it was important to assess the progress of the pharmacist role over time. We evaluated the number of medication reconciliations completed by quarter to determine whether more interventions were completed as the streamlined discharge process was being fully implemented. In FY 2020 Q1, medication reconciliation was completed by an HBPC pharmacist at a rate of 35%, and in FY 2020 Q2, at a rate of 65%.
In addition to assessing interventions completed by an HBPC pharmacist, we noted how many medication reconciliations were completed by an inpatient pharmacist as this may have impacted the results of this study. Of the 175 patients in this study, 49 (28%) received a medication reconciliation by an inpatient clinical pharmacy specialist before discharge. Last, when reviewing the readmissions data for the study period, it was evident that the streamlined discharge process was improving. In FY 2020 Q1, the readmissions rate prior to HBPC enrollment was 30% and decreased to 15% after and in FY 2020 Q2 was 31% before and decreased to 13% after HBPC enrollment. Before the study period in FY 2019 Q4, the readmissions rate after HBPC enrollment was 19%. Therefore, the readmissions rate decreased from 19% before the study period to 13% by the end of the study period.
Discussion
A comparison of the readmissions data from FYs 2019, 2020, and 2021 revealed that the newly implemented discharge process at MEDVAMC had been more effective.
There were 92 interventions made during the study period, which is about 78% of all medication reconciliations completed. Medication doses were changed based on patients’ renal function. Additional laboratory tests were recommended after discharge to ensure safety of therapy. Medications were discontinued if inappropriate or if patients were no longer on them to simplify their medication list and limit polypharmacy. New medication education was provided, including drug name, dose, route of administration, time of administration, frequency, indication, mechanism of action, adverse effect profile, monitoring parameters, and more. The HBPC pharmacists were able to make suitable interventions in a timely fashion as the average time to contact patients postdischarge was 3 days.
Areas for Improvement
The PCP was notified on the discharge note only in 68 (38.9%) patients. This could lead to gaps in care if other mechanisms are not in place to notify the PCP of the patient’s discharge. For this reason, it is imperative not only to implement a streamlined discharge process, but to review it and determine methods for continued improvement.9 The streamlined discharge process implemented by the HBPC team highlights when each team member should contact the patient postdischarge. However, it may be beneficial for each team member to have a list of vital information that should be communicated to the patient postdischarge and to other HCPs. For pharmacists, a standardized discharge note template may aid in the consistency of the medication reconciliation process postdischarge and may also increase interventions from pharmacists. For example, only some HBPC pharmacists inserted a new medication template in their discharge follow-up note. In addition, 23 (13.1%) patients were unreachable, and although a complete medication reconciliation was not feasible, a standardized note to review inpatient and outpatient medications along with the discharge plan may still serve as an asset for HCPs.
As the HBPC team continues to improve the discharge process, it is also important to highlight roles of the inpatient team who may assist with a smoother transition. For example, discharge summaries should be clear, complete, and concise, incorporating key elements from the hospital visit. Methods of communication on discharge should be efficient and understood by both inpatient and outpatient teams. Patients’ health literacy status should be considered when providing discharge instructions. Finally, patients should have a clear understanding of who is included in their primary care team should any questions arise. The potential interventions for HCPs highlighted in this study are critical for preventing adverse outcomes, improving patients’ quality of life, and decreasing hospital readmissions. However, implementing the streamlined discharge process was only step 1. Areas of improvement still exist to provide exceptional patient care.
Our goal is to increase pharmacist-led medication reconciliation after discharge to ≥ 80%. This will be assessed monthly after providing education to the HBPC team regarding the study results. The second goal is to maintain hospital readmission rates to ≤ 10%, which will be assessed with each quarterly review.
Strengths and Limitations
This study was one of the first to evaluate the impact of pharmacist intervention on improving patient outcomes in HBPC veterans. Additionally, only 1 investigator conducted the data collection, which decreased the opportunity for errors.
A notable limitation of this study is that the discharge processes may not be able to be duplicated in other HBPC settings due to variability in programs. Additionally, as this was a new discharge process, there were a few aspects that needed to be worked out in the beginning as it was established. Furthermore, this study did not clarify whether a medication reconciliation was conducted by a physician or nurse after discharge; therefore, this study cannot conclude that the medication interventions were solely attributed to pharmacists. Also this study did not assess readmissions for recurrent events only, which may have impacted the results in a different way from the current results that assessed readmission rates for any hospitalization. Other limitations include the retrospective study design at a single center.
Conclusions
This study outlines several opportunities for interventions to improve patient outcomes and aid in decreasing hospital readmission rates. Using the results from this study, education has been provided for the HBPC Service and its readmission committee. Additionally, the safety concerns identified have been addressed with inpatient and outpatient pharmacy leadership to improve the practices in both settings, prevent delays in patient care, and avoid future adverse outcomes. This project highlights the advantages of having pharmacists involved in transitions of care and demonstrates the benefit of HBPC pharmacists’ role in the streamlined discharge process. This project will be reviewed biannually to further improve the discharge process and quality of care for our veterans.
1. Coleman EA, Chugh A, Williams MV, et al. Understanding and execution of discharge instructions. Am J Med Qual. 2013;28(5):383-391. doi:10.1177/1062860612472931
2. Hume AL, Kirwin J, Bieber HL, et al. Improving care transitions: current practice and future opportunities for pharmacists. Pharmacotherapy. 2012;32(11):e326-e337. doi:10.1002/phar.1215
3. Milfred-LaForest SK, Gee JA, Pugacz AM, et al. Heart failure transitions of care: a pharmacist-led post discharge pilot experience. Prog Cardiovasc Dis. 2017;60(2):249-258. doi:10.1016/j.pcad.2017.08.005
4. Naylor M, Keating SA. Transitional care: moving patients from one care setting to another. Am J Nurs. 2008;108(suppl 9):58-63. doi:10.1097/01.NAJ.0000336420.34946.3a
5. Rennke S, Nguyen OK, Shoeb MH, Magan Y, Wachter RM, Ranji SR. Hospital-initiated transitional care interventions as a patient safety strategy. Ann Intern Med. 2013;158(5, pt 2):433-440. doi:10.7326/0003-4819-158-5-201303051-00011
6. Moore C, McGinn T, Halm E. Tying up loose ends: discharging patients with unresolved medical issues. Arch Intern Med. 2007;167:1305-1311. doi:10.1001/archinte.167.12.1305
7. Fosnight S, King P, Ewald J, et al. Effects of pharmacy interventions at transitions of care on patient outcomes. Am J Health Syst Pharm. 2020;77(12):943-949. doi:10.1093/ajhp/zxaa081
8. Shull MT, Braitman LE, Stites SD, DeLuca A, Hauser D. Effects of a pharmacist-driven intervention program on hospital readmissions. Am J Health Syst Pharm. 2018;75(9):e221-e230. doi:10.2146/ajhp170287
9. US Department of Health and Human Services, Agency for Healthcare Research and Quality. Plan-Do-Study-Act (PDSA) cycle. February 2015. Accessed June 2, 2022. https://www.ahrq.gov/health-literacy/improve/precautions/tool2b.html10. Horwitz L, Partovian C, Lin Z, et al. Yale New Haven Health Services Corporation/Center for Outcomes Research & Evaluation. Hospital-wide (all-condition) 30-day risk-standardized readmission measure. Updated August 20 2011. Accessed June 2, 2022. chrome-extension://efaidnbmnnnibpcajpcglclefindmkaj/https://www.cms.gov/medicare/quality-initiatives-patient-assessment-instruments/mms/downloads/mmshospital-wideall-conditionreadmissionrate.pdf
Following hospital discharge, patients are often in a vulnerable state due to new medical diagnoses, changes in medications, lack of understanding, and concerns for medical costs. In addition, the discharge process is complex and encompasses decisions regarding the postdischarge site of care, conveying patient instructions, and obtaining supplies and medications. There are several disciplines involved in the transitions of care process that are all essential for ensuring a successful transition and reducing the risk of hospital readmissions. Pharmacists play an integral role in the process.
When pharmacists are provided the opportunity to make therapeutic interventions, medication errors and hospital readmissions decrease and quality of life improves.1 Studies have shown that many older patients return home from the hospital with a limited understanding of their discharge instructions and oftentimes are unable to recall their discharge diagnoses and treatment plan, leaving opportunities for error when patients transition from one level of care to another.2,3 Additionally, high-quality transitional care is especially important for older adults with multiple comorbidities and complex therapeutic regimens as well as for their families and caregivers.4 To prevent hospital readmissions, pharmacists and other health care professionals (HCPs) should work diligently to prevent gaps in care as patients transition between settings. Common factors that lead to increased readmissions include premature discharge, inadequate follow-up, therapeutic errors, and medication-related problems. Furthermore, unintended hospital readmissions are common within the first 30 days following hospital discharge and lead to increased health care costs.2 For these reasons, many health care institutions have developed comprehensive models to improve the discharge process, decrease hospital readmissions, and reduce incidence of adverse events in general medical patients and high-risk populations.5
A study evaluating 693 hospital discharges found that 27.6% of patients were recommended for outpatient workups; however only 9% were actually completed.6 Due to lack of communication regarding discharge summaries, primary care practitioners (PCPs) were unaware of the need for outpatient workups; thus, these patients were lost to follow-up, and appropriate care was not received. Future studies should focus on interventions to improve the quality and dissemination of discharge information to PCPs.6 Fosnight and colleagues assessed a new transitions process focusing on the role of pharmacists. They evaluated medication reconciliations performed and discussed medication adherence barriers, medication recommendations, and time spent performing the interventions.7 After patients received a pharmacy intervention, Fosnight and colleagues reported that readmission rates decreased from 21.0% to 15.3% and mean length of stay decreased from 5.3 to 4.4 days. They also observed greater improvements in patients who received the full pharmacy intervention vs those receiving only parts of the intervention. This study concluded that adding a comprehensive pharmacy intervention to transitions of care resulted in an average of nearly 10 medication recommendations per patient, improved length of stay, and reduced readmission rates. After a review of similar studies, we concluded that a comprehensive discharge model is imperative to improve patient outcomes, along with HCP monitoring of the process to ensure appropriate follow-up.8
At Michael E. DeBakey Veteran Affairs Medical Center (MEDVAMC) in Houston, Texas, 30-day readmissions data were reviewed for veterans 6 months before and 12 months after enrollment in the Home-Based Primary Care (HBPC) service. HBPC is an in-home health care service provided to home-bound veterans with complex health care needs or when routine clinic-based care is not feasible. HBPC programs may differ among various US Department of Veterans Affairs (VA) medical centers. Currently, there are 9 HBPC teams at MEDVAMC and nearly 540 veterans are enrolled in the program. HBPC teams typically consist of PCPs, pharmacists, nurses, psychologists, occupational/physical therapists, social workers, medical support assistants, and dietitians.
Readmissions data are reviewed quarterly by fiscal year (FY) (Table 1). In FY 2019 quarter (Q) 2, the readmission rate before HBPC enrollment was 31% and decreased to 20% after enrollment. In FY 2019 Q3, the readmission rate was 29% before enrollment and decreased to 16% afterward. In FY 2019 Q4, the readmission rate before HBPC enrollment was 28% and decreased to 19% afterward. Although the readmission rates appeared to be decreasing overall, improvements were needed to decrease these rates further and to ensure readmissions were not rising as there was a slight increase in Q4. After reviewing these data, the HBPC service implemented a streamlined hospital discharge process to lower readmission rates and improve patient outcomes.
HBPC at MEDVAMC incorporates a team-based approach and the new streamlined discharge process implemented in 2019 highlights the role of each team member (Figure). Medical support assistants send daily emails of hospital discharges occurring in the last 7 days. Registered nurses are responsible for postdischarge calls within 2 days and home visits within 5 days. Pharmacists perform medication reconciliation within 14 days of discharge, review and/or educate on new medications, and change medications. The PCP is responsible for posthospital calls within 2 days and conducts a home visit within 5 days. Because HBPC programs vary among VA medical centers, the streamlined discharge process discussed may be applicable only to MEDVAMC. The primary objective of this quality improvement project was to identify specific pharmacist interventions to improve the HBPC discharge process and improve hospital readmission rates.
Methods
We conducted a Plan-Do-Study-Act quality improvement project. The first step was to conduct a review of veterans enrolled in HBPC at MEDVAMC.9 Patients included were enrolled in HBPC at MEDVAMC from October 2019 to March 2020 (FY 2020 Q1 and Q2). The Computerized Patient Record System was used to access the patients’ electronic health records. Patient information collected included race, age, sex, admission diagnosis, date of discharge, HBPC pharmacist name, PCP notification on the discharge summary, and 30-day readmission rates. Unplanned return to the hospital within 30 days, which was counted as a readmission, was defined as any admission for acute clinical events that required urgent hospital management.10
Next, we identified specific pharmacist interventions, including medication reconciliation completed by an HBPC pharmacist postdischarge; mean time to contact patients postdischarge; correct medications and supplies on discharge; incorrect dose; incorrect medication frequency or route of administration; therapeutic duplications; discontinuation of medications; additional drug therapy recommendations; laboratory test recommendations; maintenance medications not restarted or omitted; new medication education; and medication or formulation changes.
In the third step, we reviewed discharge summaries and clinical pharmacy notes to collect pharmacist intervention data. These data were analyzed to develop a standardized discharge process. Descriptive statistics were used to represent the results of the study.
Results
Medication reconciliation was completed postdischarge by an HBPC pharmacist in 118 of 175 study patients (67.4%). The mean age of patients was 76 years, about 95% were male (Table 2). There was a wide variety of admission diagnoses but sepsis, chronic obstructive pulmonary disease, and chronic kidney disease were most common. The PCP was notified on the discharge note for 68 (38.9%) patients. The mean time for HBPC pharmacists to contact patients postdischarge was about 3 days, which was much less than the 14 days allowed in the streamlined discharge process.
Pharmacists made the following interventions during medication reconciliation: New medication education was provided for 34 (19.4%) patients and was the largest intervention completed by HBPC pharmacists. Laboratory tests were recommended for 16 (9.1%) patients, medications were discontinued in 14 (8.0%) patients, and additional drug therapy recommendations were made for 7 (4.0%) patients. Medication or formulation changes were completed in 7 (4.0%) patients, incorrect doses were identified in 6 (3.4%) patients, 5 (2.9%) patients were not discharged with the correct medications or supplies, maintenance medications were not restarted in 3 (1.7%) patients, and there were no therapeutic duplications identified. In total, there were 92 (77.9%) patients with interventions compared with the 118 medication reconciliations completed (Table 3).
Process Improvement
As this was a new streamlined discharge process, it was important to assess the progress of the pharmacist role over time. We evaluated the number of medication reconciliations completed by quarter to determine whether more interventions were completed as the streamlined discharge process was being fully implemented. In FY 2020 Q1, medication reconciliation was completed by an HBPC pharmacist at a rate of 35%, and in FY 2020 Q2, at a rate of 65%.
In addition to assessing interventions completed by an HBPC pharmacist, we noted how many medication reconciliations were completed by an inpatient pharmacist as this may have impacted the results of this study. Of the 175 patients in this study, 49 (28%) received a medication reconciliation by an inpatient clinical pharmacy specialist before discharge. Last, when reviewing the readmissions data for the study period, it was evident that the streamlined discharge process was improving. In FY 2020 Q1, the readmissions rate prior to HBPC enrollment was 30% and decreased to 15% after and in FY 2020 Q2 was 31% before and decreased to 13% after HBPC enrollment. Before the study period in FY 2019 Q4, the readmissions rate after HBPC enrollment was 19%. Therefore, the readmissions rate decreased from 19% before the study period to 13% by the end of the study period.
Discussion
A comparison of the readmissions data from FYs 2019, 2020, and 2021 revealed that the newly implemented discharge process at MEDVAMC had been more effective.
There were 92 interventions made during the study period, which is about 78% of all medication reconciliations completed. Medication doses were changed based on patients’ renal function. Additional laboratory tests were recommended after discharge to ensure safety of therapy. Medications were discontinued if inappropriate or if patients were no longer on them to simplify their medication list and limit polypharmacy. New medication education was provided, including drug name, dose, route of administration, time of administration, frequency, indication, mechanism of action, adverse effect profile, monitoring parameters, and more. The HBPC pharmacists were able to make suitable interventions in a timely fashion as the average time to contact patients postdischarge was 3 days.
Areas for Improvement
The PCP was notified on the discharge note only in 68 (38.9%) patients. This could lead to gaps in care if other mechanisms are not in place to notify the PCP of the patient’s discharge. For this reason, it is imperative not only to implement a streamlined discharge process, but to review it and determine methods for continued improvement.9 The streamlined discharge process implemented by the HBPC team highlights when each team member should contact the patient postdischarge. However, it may be beneficial for each team member to have a list of vital information that should be communicated to the patient postdischarge and to other HCPs. For pharmacists, a standardized discharge note template may aid in the consistency of the medication reconciliation process postdischarge and may also increase interventions from pharmacists. For example, only some HBPC pharmacists inserted a new medication template in their discharge follow-up note. In addition, 23 (13.1%) patients were unreachable, and although a complete medication reconciliation was not feasible, a standardized note to review inpatient and outpatient medications along with the discharge plan may still serve as an asset for HCPs.
As the HBPC team continues to improve the discharge process, it is also important to highlight roles of the inpatient team who may assist with a smoother transition. For example, discharge summaries should be clear, complete, and concise, incorporating key elements from the hospital visit. Methods of communication on discharge should be efficient and understood by both inpatient and outpatient teams. Patients’ health literacy status should be considered when providing discharge instructions. Finally, patients should have a clear understanding of who is included in their primary care team should any questions arise. The potential interventions for HCPs highlighted in this study are critical for preventing adverse outcomes, improving patients’ quality of life, and decreasing hospital readmissions. However, implementing the streamlined discharge process was only step 1. Areas of improvement still exist to provide exceptional patient care.
Our goal is to increase pharmacist-led medication reconciliation after discharge to ≥ 80%. This will be assessed monthly after providing education to the HBPC team regarding the study results. The second goal is to maintain hospital readmission rates to ≤ 10%, which will be assessed with each quarterly review.
Strengths and Limitations
This study was one of the first to evaluate the impact of pharmacist intervention on improving patient outcomes in HBPC veterans. Additionally, only 1 investigator conducted the data collection, which decreased the opportunity for errors.
A notable limitation of this study is that the discharge processes may not be able to be duplicated in other HBPC settings due to variability in programs. Additionally, as this was a new discharge process, there were a few aspects that needed to be worked out in the beginning as it was established. Furthermore, this study did not clarify whether a medication reconciliation was conducted by a physician or nurse after discharge; therefore, this study cannot conclude that the medication interventions were solely attributed to pharmacists. Also this study did not assess readmissions for recurrent events only, which may have impacted the results in a different way from the current results that assessed readmission rates for any hospitalization. Other limitations include the retrospective study design at a single center.
Conclusions
This study outlines several opportunities for interventions to improve patient outcomes and aid in decreasing hospital readmission rates. Using the results from this study, education has been provided for the HBPC Service and its readmission committee. Additionally, the safety concerns identified have been addressed with inpatient and outpatient pharmacy leadership to improve the practices in both settings, prevent delays in patient care, and avoid future adverse outcomes. This project highlights the advantages of having pharmacists involved in transitions of care and demonstrates the benefit of HBPC pharmacists’ role in the streamlined discharge process. This project will be reviewed biannually to further improve the discharge process and quality of care for our veterans.
Following hospital discharge, patients are often in a vulnerable state due to new medical diagnoses, changes in medications, lack of understanding, and concerns for medical costs. In addition, the discharge process is complex and encompasses decisions regarding the postdischarge site of care, conveying patient instructions, and obtaining supplies and medications. There are several disciplines involved in the transitions of care process that are all essential for ensuring a successful transition and reducing the risk of hospital readmissions. Pharmacists play an integral role in the process.
When pharmacists are provided the opportunity to make therapeutic interventions, medication errors and hospital readmissions decrease and quality of life improves.1 Studies have shown that many older patients return home from the hospital with a limited understanding of their discharge instructions and oftentimes are unable to recall their discharge diagnoses and treatment plan, leaving opportunities for error when patients transition from one level of care to another.2,3 Additionally, high-quality transitional care is especially important for older adults with multiple comorbidities and complex therapeutic regimens as well as for their families and caregivers.4 To prevent hospital readmissions, pharmacists and other health care professionals (HCPs) should work diligently to prevent gaps in care as patients transition between settings. Common factors that lead to increased readmissions include premature discharge, inadequate follow-up, therapeutic errors, and medication-related problems. Furthermore, unintended hospital readmissions are common within the first 30 days following hospital discharge and lead to increased health care costs.2 For these reasons, many health care institutions have developed comprehensive models to improve the discharge process, decrease hospital readmissions, and reduce incidence of adverse events in general medical patients and high-risk populations.5
A study evaluating 693 hospital discharges found that 27.6% of patients were recommended for outpatient workups; however only 9% were actually completed.6 Due to lack of communication regarding discharge summaries, primary care practitioners (PCPs) were unaware of the need for outpatient workups; thus, these patients were lost to follow-up, and appropriate care was not received. Future studies should focus on interventions to improve the quality and dissemination of discharge information to PCPs.6 Fosnight and colleagues assessed a new transitions process focusing on the role of pharmacists. They evaluated medication reconciliations performed and discussed medication adherence barriers, medication recommendations, and time spent performing the interventions.7 After patients received a pharmacy intervention, Fosnight and colleagues reported that readmission rates decreased from 21.0% to 15.3% and mean length of stay decreased from 5.3 to 4.4 days. They also observed greater improvements in patients who received the full pharmacy intervention vs those receiving only parts of the intervention. This study concluded that adding a comprehensive pharmacy intervention to transitions of care resulted in an average of nearly 10 medication recommendations per patient, improved length of stay, and reduced readmission rates. After a review of similar studies, we concluded that a comprehensive discharge model is imperative to improve patient outcomes, along with HCP monitoring of the process to ensure appropriate follow-up.8
At Michael E. DeBakey Veteran Affairs Medical Center (MEDVAMC) in Houston, Texas, 30-day readmissions data were reviewed for veterans 6 months before and 12 months after enrollment in the Home-Based Primary Care (HBPC) service. HBPC is an in-home health care service provided to home-bound veterans with complex health care needs or when routine clinic-based care is not feasible. HBPC programs may differ among various US Department of Veterans Affairs (VA) medical centers. Currently, there are 9 HBPC teams at MEDVAMC and nearly 540 veterans are enrolled in the program. HBPC teams typically consist of PCPs, pharmacists, nurses, psychologists, occupational/physical therapists, social workers, medical support assistants, and dietitians.
Readmissions data are reviewed quarterly by fiscal year (FY) (Table 1). In FY 2019 quarter (Q) 2, the readmission rate before HBPC enrollment was 31% and decreased to 20% after enrollment. In FY 2019 Q3, the readmission rate was 29% before enrollment and decreased to 16% afterward. In FY 2019 Q4, the readmission rate before HBPC enrollment was 28% and decreased to 19% afterward. Although the readmission rates appeared to be decreasing overall, improvements were needed to decrease these rates further and to ensure readmissions were not rising as there was a slight increase in Q4. After reviewing these data, the HBPC service implemented a streamlined hospital discharge process to lower readmission rates and improve patient outcomes.
HBPC at MEDVAMC incorporates a team-based approach and the new streamlined discharge process implemented in 2019 highlights the role of each team member (Figure). Medical support assistants send daily emails of hospital discharges occurring in the last 7 days. Registered nurses are responsible for postdischarge calls within 2 days and home visits within 5 days. Pharmacists perform medication reconciliation within 14 days of discharge, review and/or educate on new medications, and change medications. The PCP is responsible for posthospital calls within 2 days and conducts a home visit within 5 days. Because HBPC programs vary among VA medical centers, the streamlined discharge process discussed may be applicable only to MEDVAMC. The primary objective of this quality improvement project was to identify specific pharmacist interventions to improve the HBPC discharge process and improve hospital readmission rates.
Methods
We conducted a Plan-Do-Study-Act quality improvement project. The first step was to conduct a review of veterans enrolled in HBPC at MEDVAMC.9 Patients included were enrolled in HBPC at MEDVAMC from October 2019 to March 2020 (FY 2020 Q1 and Q2). The Computerized Patient Record System was used to access the patients’ electronic health records. Patient information collected included race, age, sex, admission diagnosis, date of discharge, HBPC pharmacist name, PCP notification on the discharge summary, and 30-day readmission rates. Unplanned return to the hospital within 30 days, which was counted as a readmission, was defined as any admission for acute clinical events that required urgent hospital management.10
Next, we identified specific pharmacist interventions, including medication reconciliation completed by an HBPC pharmacist postdischarge; mean time to contact patients postdischarge; correct medications and supplies on discharge; incorrect dose; incorrect medication frequency or route of administration; therapeutic duplications; discontinuation of medications; additional drug therapy recommendations; laboratory test recommendations; maintenance medications not restarted or omitted; new medication education; and medication or formulation changes.
In the third step, we reviewed discharge summaries and clinical pharmacy notes to collect pharmacist intervention data. These data were analyzed to develop a standardized discharge process. Descriptive statistics were used to represent the results of the study.
Results
Medication reconciliation was completed postdischarge by an HBPC pharmacist in 118 of 175 study patients (67.4%). The mean age of patients was 76 years, about 95% were male (Table 2). There was a wide variety of admission diagnoses but sepsis, chronic obstructive pulmonary disease, and chronic kidney disease were most common. The PCP was notified on the discharge note for 68 (38.9%) patients. The mean time for HBPC pharmacists to contact patients postdischarge was about 3 days, which was much less than the 14 days allowed in the streamlined discharge process.
Pharmacists made the following interventions during medication reconciliation: New medication education was provided for 34 (19.4%) patients and was the largest intervention completed by HBPC pharmacists. Laboratory tests were recommended for 16 (9.1%) patients, medications were discontinued in 14 (8.0%) patients, and additional drug therapy recommendations were made for 7 (4.0%) patients. Medication or formulation changes were completed in 7 (4.0%) patients, incorrect doses were identified in 6 (3.4%) patients, 5 (2.9%) patients were not discharged with the correct medications or supplies, maintenance medications were not restarted in 3 (1.7%) patients, and there were no therapeutic duplications identified. In total, there were 92 (77.9%) patients with interventions compared with the 118 medication reconciliations completed (Table 3).
Process Improvement
As this was a new streamlined discharge process, it was important to assess the progress of the pharmacist role over time. We evaluated the number of medication reconciliations completed by quarter to determine whether more interventions were completed as the streamlined discharge process was being fully implemented. In FY 2020 Q1, medication reconciliation was completed by an HBPC pharmacist at a rate of 35%, and in FY 2020 Q2, at a rate of 65%.
In addition to assessing interventions completed by an HBPC pharmacist, we noted how many medication reconciliations were completed by an inpatient pharmacist as this may have impacted the results of this study. Of the 175 patients in this study, 49 (28%) received a medication reconciliation by an inpatient clinical pharmacy specialist before discharge. Last, when reviewing the readmissions data for the study period, it was evident that the streamlined discharge process was improving. In FY 2020 Q1, the readmissions rate prior to HBPC enrollment was 30% and decreased to 15% after and in FY 2020 Q2 was 31% before and decreased to 13% after HBPC enrollment. Before the study period in FY 2019 Q4, the readmissions rate after HBPC enrollment was 19%. Therefore, the readmissions rate decreased from 19% before the study period to 13% by the end of the study period.
Discussion
A comparison of the readmissions data from FYs 2019, 2020, and 2021 revealed that the newly implemented discharge process at MEDVAMC had been more effective.
There were 92 interventions made during the study period, which is about 78% of all medication reconciliations completed. Medication doses were changed based on patients’ renal function. Additional laboratory tests were recommended after discharge to ensure safety of therapy. Medications were discontinued if inappropriate or if patients were no longer on them to simplify their medication list and limit polypharmacy. New medication education was provided, including drug name, dose, route of administration, time of administration, frequency, indication, mechanism of action, adverse effect profile, monitoring parameters, and more. The HBPC pharmacists were able to make suitable interventions in a timely fashion as the average time to contact patients postdischarge was 3 days.
Areas for Improvement
The PCP was notified on the discharge note only in 68 (38.9%) patients. This could lead to gaps in care if other mechanisms are not in place to notify the PCP of the patient’s discharge. For this reason, it is imperative not only to implement a streamlined discharge process, but to review it and determine methods for continued improvement.9 The streamlined discharge process implemented by the HBPC team highlights when each team member should contact the patient postdischarge. However, it may be beneficial for each team member to have a list of vital information that should be communicated to the patient postdischarge and to other HCPs. For pharmacists, a standardized discharge note template may aid in the consistency of the medication reconciliation process postdischarge and may also increase interventions from pharmacists. For example, only some HBPC pharmacists inserted a new medication template in their discharge follow-up note. In addition, 23 (13.1%) patients were unreachable, and although a complete medication reconciliation was not feasible, a standardized note to review inpatient and outpatient medications along with the discharge plan may still serve as an asset for HCPs.
As the HBPC team continues to improve the discharge process, it is also important to highlight roles of the inpatient team who may assist with a smoother transition. For example, discharge summaries should be clear, complete, and concise, incorporating key elements from the hospital visit. Methods of communication on discharge should be efficient and understood by both inpatient and outpatient teams. Patients’ health literacy status should be considered when providing discharge instructions. Finally, patients should have a clear understanding of who is included in their primary care team should any questions arise. The potential interventions for HCPs highlighted in this study are critical for preventing adverse outcomes, improving patients’ quality of life, and decreasing hospital readmissions. However, implementing the streamlined discharge process was only step 1. Areas of improvement still exist to provide exceptional patient care.
Our goal is to increase pharmacist-led medication reconciliation after discharge to ≥ 80%. This will be assessed monthly after providing education to the HBPC team regarding the study results. The second goal is to maintain hospital readmission rates to ≤ 10%, which will be assessed with each quarterly review.
Strengths and Limitations
This study was one of the first to evaluate the impact of pharmacist intervention on improving patient outcomes in HBPC veterans. Additionally, only 1 investigator conducted the data collection, which decreased the opportunity for errors.
A notable limitation of this study is that the discharge processes may not be able to be duplicated in other HBPC settings due to variability in programs. Additionally, as this was a new discharge process, there were a few aspects that needed to be worked out in the beginning as it was established. Furthermore, this study did not clarify whether a medication reconciliation was conducted by a physician or nurse after discharge; therefore, this study cannot conclude that the medication interventions were solely attributed to pharmacists. Also this study did not assess readmissions for recurrent events only, which may have impacted the results in a different way from the current results that assessed readmission rates for any hospitalization. Other limitations include the retrospective study design at a single center.
Conclusions
This study outlines several opportunities for interventions to improve patient outcomes and aid in decreasing hospital readmission rates. Using the results from this study, education has been provided for the HBPC Service and its readmission committee. Additionally, the safety concerns identified have been addressed with inpatient and outpatient pharmacy leadership to improve the practices in both settings, prevent delays in patient care, and avoid future adverse outcomes. This project highlights the advantages of having pharmacists involved in transitions of care and demonstrates the benefit of HBPC pharmacists’ role in the streamlined discharge process. This project will be reviewed biannually to further improve the discharge process and quality of care for our veterans.
1. Coleman EA, Chugh A, Williams MV, et al. Understanding and execution of discharge instructions. Am J Med Qual. 2013;28(5):383-391. doi:10.1177/1062860612472931
2. Hume AL, Kirwin J, Bieber HL, et al. Improving care transitions: current practice and future opportunities for pharmacists. Pharmacotherapy. 2012;32(11):e326-e337. doi:10.1002/phar.1215
3. Milfred-LaForest SK, Gee JA, Pugacz AM, et al. Heart failure transitions of care: a pharmacist-led post discharge pilot experience. Prog Cardiovasc Dis. 2017;60(2):249-258. doi:10.1016/j.pcad.2017.08.005
4. Naylor M, Keating SA. Transitional care: moving patients from one care setting to another. Am J Nurs. 2008;108(suppl 9):58-63. doi:10.1097/01.NAJ.0000336420.34946.3a
5. Rennke S, Nguyen OK, Shoeb MH, Magan Y, Wachter RM, Ranji SR. Hospital-initiated transitional care interventions as a patient safety strategy. Ann Intern Med. 2013;158(5, pt 2):433-440. doi:10.7326/0003-4819-158-5-201303051-00011
6. Moore C, McGinn T, Halm E. Tying up loose ends: discharging patients with unresolved medical issues. Arch Intern Med. 2007;167:1305-1311. doi:10.1001/archinte.167.12.1305
7. Fosnight S, King P, Ewald J, et al. Effects of pharmacy interventions at transitions of care on patient outcomes. Am J Health Syst Pharm. 2020;77(12):943-949. doi:10.1093/ajhp/zxaa081
8. Shull MT, Braitman LE, Stites SD, DeLuca A, Hauser D. Effects of a pharmacist-driven intervention program on hospital readmissions. Am J Health Syst Pharm. 2018;75(9):e221-e230. doi:10.2146/ajhp170287
9. US Department of Health and Human Services, Agency for Healthcare Research and Quality. Plan-Do-Study-Act (PDSA) cycle. February 2015. Accessed June 2, 2022. https://www.ahrq.gov/health-literacy/improve/precautions/tool2b.html10. Horwitz L, Partovian C, Lin Z, et al. Yale New Haven Health Services Corporation/Center for Outcomes Research & Evaluation. Hospital-wide (all-condition) 30-day risk-standardized readmission measure. Updated August 20 2011. Accessed June 2, 2022. chrome-extension://efaidnbmnnnibpcajpcglclefindmkaj/https://www.cms.gov/medicare/quality-initiatives-patient-assessment-instruments/mms/downloads/mmshospital-wideall-conditionreadmissionrate.pdf
1. Coleman EA, Chugh A, Williams MV, et al. Understanding and execution of discharge instructions. Am J Med Qual. 2013;28(5):383-391. doi:10.1177/1062860612472931
2. Hume AL, Kirwin J, Bieber HL, et al. Improving care transitions: current practice and future opportunities for pharmacists. Pharmacotherapy. 2012;32(11):e326-e337. doi:10.1002/phar.1215
3. Milfred-LaForest SK, Gee JA, Pugacz AM, et al. Heart failure transitions of care: a pharmacist-led post discharge pilot experience. Prog Cardiovasc Dis. 2017;60(2):249-258. doi:10.1016/j.pcad.2017.08.005
4. Naylor M, Keating SA. Transitional care: moving patients from one care setting to another. Am J Nurs. 2008;108(suppl 9):58-63. doi:10.1097/01.NAJ.0000336420.34946.3a
5. Rennke S, Nguyen OK, Shoeb MH, Magan Y, Wachter RM, Ranji SR. Hospital-initiated transitional care interventions as a patient safety strategy. Ann Intern Med. 2013;158(5, pt 2):433-440. doi:10.7326/0003-4819-158-5-201303051-00011
6. Moore C, McGinn T, Halm E. Tying up loose ends: discharging patients with unresolved medical issues. Arch Intern Med. 2007;167:1305-1311. doi:10.1001/archinte.167.12.1305
7. Fosnight S, King P, Ewald J, et al. Effects of pharmacy interventions at transitions of care on patient outcomes. Am J Health Syst Pharm. 2020;77(12):943-949. doi:10.1093/ajhp/zxaa081
8. Shull MT, Braitman LE, Stites SD, DeLuca A, Hauser D. Effects of a pharmacist-driven intervention program on hospital readmissions. Am J Health Syst Pharm. 2018;75(9):e221-e230. doi:10.2146/ajhp170287
9. US Department of Health and Human Services, Agency for Healthcare Research and Quality. Plan-Do-Study-Act (PDSA) cycle. February 2015. Accessed June 2, 2022. https://www.ahrq.gov/health-literacy/improve/precautions/tool2b.html10. Horwitz L, Partovian C, Lin Z, et al. Yale New Haven Health Services Corporation/Center for Outcomes Research & Evaluation. Hospital-wide (all-condition) 30-day risk-standardized readmission measure. Updated August 20 2011. Accessed June 2, 2022. chrome-extension://efaidnbmnnnibpcajpcglclefindmkaj/https://www.cms.gov/medicare/quality-initiatives-patient-assessment-instruments/mms/downloads/mmshospital-wideall-conditionreadmissionrate.pdf