User login
Bringing you the latest news, research and reviews, exclusive interviews, podcasts, quizzes, and more.
div[contains(@class, 'header__large-screen')]
div[contains(@class, 'read-next-article')]
div[contains(@class, 'nav-primary')]
nav[contains(@class, 'nav-primary')]
section[contains(@class, 'footer-nav-section-wrapper')]
footer[@id='footer']
div[contains(@class, 'main-prefix')]
section[contains(@class, 'nav-hidden')]
div[contains(@class, 'ce-card-content')]
nav[contains(@class, 'nav-ce-stack')]
Diabetic neuropathic pain linked to brain bioenergic anomalies
Abnormal mitochondrial activity in pain-processing areas of the brain may explain why some persons with type 2 diabetes experience painful peripheral neuropathy while others do not, new U.K. study findings have suggested.
A greater ratio of adenosine triphosphate (ATP) – “the cellular energy currency of all life” – to phosphocreatine (PCr) was observed in the somatosensory cortex and right thalamus in those with painful diabetic peripheral neuropathy (DPN). Importantly, this correlated with neuropathic pain symptom intensity as measured by the Neuropathic Pain Symptom Inventory (NPSI) and the Doleur Neuroathique en 4 (DN4).
The findings suggest that altered cerebral phosphorus metabolite ratios may serve as a biomarker of DPN, said the study’s investigators.
“Normally the ATP:Cr ratio will be unaltered, but there’s stress to the brain that might change,” Gordon Sloan, a clinical research fellow within the Diabetes Research Unit at the Royal Hallamshire Hospital in Sheffield (England) said at the virtual annual meeting of the European Association for the Study of Diabetes.
DPN affects around a quarter of patients with type 2 diabetes but treatments are “inadequate”, and “unfortunately fewer than a third of individuals receive 50% or greater pain relief from current neuropathic pain treatments,” Mr. Sloan said. “Ultimately, this lack of understanding of the pathophysiology of the condition is therefore clear rationale to investigate the disease mechanisms further and to find novel targets for treatments,” he added.
Brain metabolites offer clues to neuropathic pain levels
The thalamus and primary somatosensory cortex are two key areas of the brain that are involved in the perception of painful stimuli, Mr. Sloan explained. “The thalamus receives most of the slowest sensory impulses from the peripheral nervous system modulating and processing them for relaying the signals to the rest of the pain matrix, including the somatosensory cortex where these sensations are interpreted and localized.”
Prior imaging work by Mr. Sloan’s group and others have shown that there are alterations in the functioning of both these brain areas in those with painful DPN versus healthy volunteers and those with type 2 diabetes but no DPN. So for their current study, Mr. Sloan and associates from Sheffield University and Sheffield Teaching Hospitals National Health Service Trust, used an advanced imaging method – phosphorus magnetic resonance spectroscopy (MRS) – to scan the thalamus and somatosensory cortex of 43 persons with type 2 diabetes and 12 healthy volunteers. Of those with diabetes, 11 had no DPN, 12 had DPN but were not currently in pain, and 20 had painful DPN.
From the scans, three phosphorus metabolite ratios were calculated, which gave an indication of mitochondrial activity: first, the ATP to PCr ratio, which gives a measure of cellular energy status; second, the ATP to inorganic phosphate (Pi) ratio, which measures oxidative phosphorylation; and third, the ratio of phosphomonoesters (PME) to phosphodiesters (PDE), which gives a measure of cell membrane turnover.
“We have measured the ratio of high-energy phosphate levels which are an indirect representation of the balance between energy generation, reserve and usage in the brain,” Mr. Sloan said.
The subjects studied were of a similar age, around 63 years on average, and well matched in terms of their sex and body mass index. Those with diabetes of course had higher blood glucose and glycated hemoglobin than did the healthy volunteers during the scans. Among those with diabetes, those with DPN were significantly more likely to have a longer duration of diabetes (12.5 years for painful DPN and 15.8 years for nonpainful DPN) than were those with no DPN (8.7 years).
Furthermore, those with DPN had higher scores on the Neuropathic Pain Symptom Inventory (NPSI) than did those without, although there was not much difference between those with painful or nonpainful DPN. On the other had, those with painful DPN were more likely to have higher scores when using the Doleur Neuroathique en 4 (DN4) to assess their pain level.
Results showed significant changes in cerebral cellular bioenergetics in the pain processing regions of the brain in those with painful DPN. The ATP:PCr at the thalamus and at the somatosensory cortex was significantly higher in those with painful DPN, compared with healthy volunteers. The other measures of phosphorus metabolite levels (ATP:Pi and PME:PDE) were unaltered.
“We hypothesize that the findings of the study are suggestive of increased energy demands in regions of pain perception due to increased neuronal activity” said Dr. Sloan.
The study’s results add further evidence for cerebral alterations playing a key role in the generation and maintenance of pain in painful DPN.
SOURCE: Sloan S et al. EASD 2020, oral presentation 181.
Abnormal mitochondrial activity in pain-processing areas of the brain may explain why some persons with type 2 diabetes experience painful peripheral neuropathy while others do not, new U.K. study findings have suggested.
A greater ratio of adenosine triphosphate (ATP) – “the cellular energy currency of all life” – to phosphocreatine (PCr) was observed in the somatosensory cortex and right thalamus in those with painful diabetic peripheral neuropathy (DPN). Importantly, this correlated with neuropathic pain symptom intensity as measured by the Neuropathic Pain Symptom Inventory (NPSI) and the Doleur Neuroathique en 4 (DN4).
The findings suggest that altered cerebral phosphorus metabolite ratios may serve as a biomarker of DPN, said the study’s investigators.
“Normally the ATP:Cr ratio will be unaltered, but there’s stress to the brain that might change,” Gordon Sloan, a clinical research fellow within the Diabetes Research Unit at the Royal Hallamshire Hospital in Sheffield (England) said at the virtual annual meeting of the European Association for the Study of Diabetes.
DPN affects around a quarter of patients with type 2 diabetes but treatments are “inadequate”, and “unfortunately fewer than a third of individuals receive 50% or greater pain relief from current neuropathic pain treatments,” Mr. Sloan said. “Ultimately, this lack of understanding of the pathophysiology of the condition is therefore clear rationale to investigate the disease mechanisms further and to find novel targets for treatments,” he added.
Brain metabolites offer clues to neuropathic pain levels
The thalamus and primary somatosensory cortex are two key areas of the brain that are involved in the perception of painful stimuli, Mr. Sloan explained. “The thalamus receives most of the slowest sensory impulses from the peripheral nervous system modulating and processing them for relaying the signals to the rest of the pain matrix, including the somatosensory cortex where these sensations are interpreted and localized.”
Prior imaging work by Mr. Sloan’s group and others have shown that there are alterations in the functioning of both these brain areas in those with painful DPN versus healthy volunteers and those with type 2 diabetes but no DPN. So for their current study, Mr. Sloan and associates from Sheffield University and Sheffield Teaching Hospitals National Health Service Trust, used an advanced imaging method – phosphorus magnetic resonance spectroscopy (MRS) – to scan the thalamus and somatosensory cortex of 43 persons with type 2 diabetes and 12 healthy volunteers. Of those with diabetes, 11 had no DPN, 12 had DPN but were not currently in pain, and 20 had painful DPN.
From the scans, three phosphorus metabolite ratios were calculated, which gave an indication of mitochondrial activity: first, the ATP to PCr ratio, which gives a measure of cellular energy status; second, the ATP to inorganic phosphate (Pi) ratio, which measures oxidative phosphorylation; and third, the ratio of phosphomonoesters (PME) to phosphodiesters (PDE), which gives a measure of cell membrane turnover.
“We have measured the ratio of high-energy phosphate levels which are an indirect representation of the balance between energy generation, reserve and usage in the brain,” Mr. Sloan said.
The subjects studied were of a similar age, around 63 years on average, and well matched in terms of their sex and body mass index. Those with diabetes of course had higher blood glucose and glycated hemoglobin than did the healthy volunteers during the scans. Among those with diabetes, those with DPN were significantly more likely to have a longer duration of diabetes (12.5 years for painful DPN and 15.8 years for nonpainful DPN) than were those with no DPN (8.7 years).
Furthermore, those with DPN had higher scores on the Neuropathic Pain Symptom Inventory (NPSI) than did those without, although there was not much difference between those with painful or nonpainful DPN. On the other had, those with painful DPN were more likely to have higher scores when using the Doleur Neuroathique en 4 (DN4) to assess their pain level.
Results showed significant changes in cerebral cellular bioenergetics in the pain processing regions of the brain in those with painful DPN. The ATP:PCr at the thalamus and at the somatosensory cortex was significantly higher in those with painful DPN, compared with healthy volunteers. The other measures of phosphorus metabolite levels (ATP:Pi and PME:PDE) were unaltered.
“We hypothesize that the findings of the study are suggestive of increased energy demands in regions of pain perception due to increased neuronal activity” said Dr. Sloan.
The study’s results add further evidence for cerebral alterations playing a key role in the generation and maintenance of pain in painful DPN.
SOURCE: Sloan S et al. EASD 2020, oral presentation 181.
Abnormal mitochondrial activity in pain-processing areas of the brain may explain why some persons with type 2 diabetes experience painful peripheral neuropathy while others do not, new U.K. study findings have suggested.
A greater ratio of adenosine triphosphate (ATP) – “the cellular energy currency of all life” – to phosphocreatine (PCr) was observed in the somatosensory cortex and right thalamus in those with painful diabetic peripheral neuropathy (DPN). Importantly, this correlated with neuropathic pain symptom intensity as measured by the Neuropathic Pain Symptom Inventory (NPSI) and the Doleur Neuroathique en 4 (DN4).
The findings suggest that altered cerebral phosphorus metabolite ratios may serve as a biomarker of DPN, said the study’s investigators.
“Normally the ATP:Cr ratio will be unaltered, but there’s stress to the brain that might change,” Gordon Sloan, a clinical research fellow within the Diabetes Research Unit at the Royal Hallamshire Hospital in Sheffield (England) said at the virtual annual meeting of the European Association for the Study of Diabetes.
DPN affects around a quarter of patients with type 2 diabetes but treatments are “inadequate”, and “unfortunately fewer than a third of individuals receive 50% or greater pain relief from current neuropathic pain treatments,” Mr. Sloan said. “Ultimately, this lack of understanding of the pathophysiology of the condition is therefore clear rationale to investigate the disease mechanisms further and to find novel targets for treatments,” he added.
Brain metabolites offer clues to neuropathic pain levels
The thalamus and primary somatosensory cortex are two key areas of the brain that are involved in the perception of painful stimuli, Mr. Sloan explained. “The thalamus receives most of the slowest sensory impulses from the peripheral nervous system modulating and processing them for relaying the signals to the rest of the pain matrix, including the somatosensory cortex where these sensations are interpreted and localized.”
Prior imaging work by Mr. Sloan’s group and others have shown that there are alterations in the functioning of both these brain areas in those with painful DPN versus healthy volunteers and those with type 2 diabetes but no DPN. So for their current study, Mr. Sloan and associates from Sheffield University and Sheffield Teaching Hospitals National Health Service Trust, used an advanced imaging method – phosphorus magnetic resonance spectroscopy (MRS) – to scan the thalamus and somatosensory cortex of 43 persons with type 2 diabetes and 12 healthy volunteers. Of those with diabetes, 11 had no DPN, 12 had DPN but were not currently in pain, and 20 had painful DPN.
From the scans, three phosphorus metabolite ratios were calculated, which gave an indication of mitochondrial activity: first, the ATP to PCr ratio, which gives a measure of cellular energy status; second, the ATP to inorganic phosphate (Pi) ratio, which measures oxidative phosphorylation; and third, the ratio of phosphomonoesters (PME) to phosphodiesters (PDE), which gives a measure of cell membrane turnover.
“We have measured the ratio of high-energy phosphate levels which are an indirect representation of the balance between energy generation, reserve and usage in the brain,” Mr. Sloan said.
The subjects studied were of a similar age, around 63 years on average, and well matched in terms of their sex and body mass index. Those with diabetes of course had higher blood glucose and glycated hemoglobin than did the healthy volunteers during the scans. Among those with diabetes, those with DPN were significantly more likely to have a longer duration of diabetes (12.5 years for painful DPN and 15.8 years for nonpainful DPN) than were those with no DPN (8.7 years).
Furthermore, those with DPN had higher scores on the Neuropathic Pain Symptom Inventory (NPSI) than did those without, although there was not much difference between those with painful or nonpainful DPN. On the other had, those with painful DPN were more likely to have higher scores when using the Doleur Neuroathique en 4 (DN4) to assess their pain level.
Results showed significant changes in cerebral cellular bioenergetics in the pain processing regions of the brain in those with painful DPN. The ATP:PCr at the thalamus and at the somatosensory cortex was significantly higher in those with painful DPN, compared with healthy volunteers. The other measures of phosphorus metabolite levels (ATP:Pi and PME:PDE) were unaltered.
“We hypothesize that the findings of the study are suggestive of increased energy demands in regions of pain perception due to increased neuronal activity” said Dr. Sloan.
The study’s results add further evidence for cerebral alterations playing a key role in the generation and maintenance of pain in painful DPN.
SOURCE: Sloan S et al. EASD 2020, oral presentation 181.
FROM EASD 2020
Fauci: Cautious optimism for COVID-19 vaccine by end of 2020
with distribution of first doses possible before the end of the year, according to Anthony S. Fauci, MD, director, National Institute of Allergy and Infectious Diseases, Bethesda, Md.

“Given the rate of infection that’s going on in this country, and the distribution of the clinical trial sites involving tens of thousands of volunteers, we project that we will have an answer as to whether or not we have a safe and effective vaccine by November or December,” Dr. Fauci said today in his virtual keynote address during the annual meeting of the American College of Chest Physicians.
“It may come earlier -- this month, in October,” he added in his remarks. “That is unlikely – it is more likely that we’ll have an answer in November and December.”
If that timing does come to pass, Dr. Fauci said, it’s possible that distribution of doses could start at the end of the year, continuing throughout the beginning and middle of 2021.
Although there are no guarantees, Dr. Fauci said he is “cautiously optimistic” regarding the timeline.
He said that his optimism is based in part on animal studies and phase 1 data that demonstrate robust neutralizing antibody responses to a vaccine that are equivalent to, if not greater than, natural infection with the SARS-CoV-2 virus that causes COVID-19.
Rapid development gives reason for hope
Ryan C. Maves, MD, FCCP, a critical care and infectious disease specialist at Naval Medical Center San Diego, said there is reason to be hopeful that a vaccine will be available by the end of the calendar year. He cautioned, however, that this timing is based on the assumption that one of the vaccines will be proven safe and effective very soon.

“We’re lucky to have multiple phase 3 trials using multiple vaccine technologies in different platforms,” Dr. Maves said in a panel discussion following Dr. Fauci’s remarks. “I think the odds are very high that one of them will be effective.”
“I’m hoping that multiple vaccines will be effective,” Dr. Maves added. “Then we’ll be in a good position of determining which is the best of several good options, as a society and as a world.”
COVID-19 vaccine development over the past year has been remarkably fast, especially given the previous record set by the mumps vaccine, which took about four years to go from initial steps to rollout, Dr. Maves noted.
Dr. Fauci said the federal government has taken a “strategic approach” to the COVID-19 vaccine that includes direct involvement in the research and development of six different vaccine candidates, five of which are now in phase 3 trials.
As part of that strategic approach, the study protocols are harmonized to have a common data and safety monitoring board, common primary and secondary endpoints, and an independent statistical group to determine correlates of protection, Dr. Fauci said.
Prioritizing COVID-19 vaccine distribution
Who gets COVID-19 vaccine first will be a challenge for governmental organizations as well as bioethicists, who have proposed different strategies for fairly prioritizing different groups for access.
Reaching communities of color will be an important consideration for prioritization, according to Dr. Maves, given the disproportionate burden of disease on Black and Hispanic individuals, among other such populations.
COVID-19–related hospitalization rates have been substantially higher in communities of color, Dr. Fauci said in his keynote address. Age-adjusted hospitalization rates for Hispanic/Latinx and Black populations are 375 to 368 per 100,000, respectively, compared with just 82 per 100,000 for White non-Hispanics, according to data from the Centers for Disease Control and Prevention.
Outreach to those communities should include building trust in those populations that they will benefit from a safe and effective vaccine, and making sure that the vaccine is available to those communities as quickly as possible, Dr. Maves said.
Dr. Fauci and Dr. Maves provided no disclosures related to their presentations.
with distribution of first doses possible before the end of the year, according to Anthony S. Fauci, MD, director, National Institute of Allergy and Infectious Diseases, Bethesda, Md.
“Given the rate of infection that’s going on in this country, and the distribution of the clinical trial sites involving tens of thousands of volunteers, we project that we will have an answer as to whether or not we have a safe and effective vaccine by November or December,” Dr. Fauci said today in his virtual keynote address during the annual meeting of the American College of Chest Physicians.
“It may come earlier -- this month, in October,” he added in his remarks. “That is unlikely – it is more likely that we’ll have an answer in November and December.”
If that timing does come to pass, Dr. Fauci said, it’s possible that distribution of doses could start at the end of the year, continuing throughout the beginning and middle of 2021.
Although there are no guarantees, Dr. Fauci said he is “cautiously optimistic” regarding the timeline.
He said that his optimism is based in part on animal studies and phase 1 data that demonstrate robust neutralizing antibody responses to a vaccine that are equivalent to, if not greater than, natural infection with the SARS-CoV-2 virus that causes COVID-19.
Rapid development gives reason for hope
Ryan C. Maves, MD, FCCP, a critical care and infectious disease specialist at Naval Medical Center San Diego, said there is reason to be hopeful that a vaccine will be available by the end of the calendar year. He cautioned, however, that this timing is based on the assumption that one of the vaccines will be proven safe and effective very soon.
“We’re lucky to have multiple phase 3 trials using multiple vaccine technologies in different platforms,” Dr. Maves said in a panel discussion following Dr. Fauci’s remarks. “I think the odds are very high that one of them will be effective.”
“I’m hoping that multiple vaccines will be effective,” Dr. Maves added. “Then we’ll be in a good position of determining which is the best of several good options, as a society and as a world.”
COVID-19 vaccine development over the past year has been remarkably fast, especially given the previous record set by the mumps vaccine, which took about four years to go from initial steps to rollout, Dr. Maves noted.
Dr. Fauci said the federal government has taken a “strategic approach” to the COVID-19 vaccine that includes direct involvement in the research and development of six different vaccine candidates, five of which are now in phase 3 trials.
As part of that strategic approach, the study protocols are harmonized to have a common data and safety monitoring board, common primary and secondary endpoints, and an independent statistical group to determine correlates of protection, Dr. Fauci said.
Prioritizing COVID-19 vaccine distribution
Who gets COVID-19 vaccine first will be a challenge for governmental organizations as well as bioethicists, who have proposed different strategies for fairly prioritizing different groups for access.
Reaching communities of color will be an important consideration for prioritization, according to Dr. Maves, given the disproportionate burden of disease on Black and Hispanic individuals, among other such populations.
COVID-19–related hospitalization rates have been substantially higher in communities of color, Dr. Fauci said in his keynote address. Age-adjusted hospitalization rates for Hispanic/Latinx and Black populations are 375 to 368 per 100,000, respectively, compared with just 82 per 100,000 for White non-Hispanics, according to data from the Centers for Disease Control and Prevention.
Outreach to those communities should include building trust in those populations that they will benefit from a safe and effective vaccine, and making sure that the vaccine is available to those communities as quickly as possible, Dr. Maves said.
Dr. Fauci and Dr. Maves provided no disclosures related to their presentations.
with distribution of first doses possible before the end of the year, according to Anthony S. Fauci, MD, director, National Institute of Allergy and Infectious Diseases, Bethesda, Md.
“Given the rate of infection that’s going on in this country, and the distribution of the clinical trial sites involving tens of thousands of volunteers, we project that we will have an answer as to whether or not we have a safe and effective vaccine by November or December,” Dr. Fauci said today in his virtual keynote address during the annual meeting of the American College of Chest Physicians.
“It may come earlier -- this month, in October,” he added in his remarks. “That is unlikely – it is more likely that we’ll have an answer in November and December.”
If that timing does come to pass, Dr. Fauci said, it’s possible that distribution of doses could start at the end of the year, continuing throughout the beginning and middle of 2021.
Although there are no guarantees, Dr. Fauci said he is “cautiously optimistic” regarding the timeline.
He said that his optimism is based in part on animal studies and phase 1 data that demonstrate robust neutralizing antibody responses to a vaccine that are equivalent to, if not greater than, natural infection with the SARS-CoV-2 virus that causes COVID-19.
Rapid development gives reason for hope
Ryan C. Maves, MD, FCCP, a critical care and infectious disease specialist at Naval Medical Center San Diego, said there is reason to be hopeful that a vaccine will be available by the end of the calendar year. He cautioned, however, that this timing is based on the assumption that one of the vaccines will be proven safe and effective very soon.
“We’re lucky to have multiple phase 3 trials using multiple vaccine technologies in different platforms,” Dr. Maves said in a panel discussion following Dr. Fauci’s remarks. “I think the odds are very high that one of them will be effective.”
“I’m hoping that multiple vaccines will be effective,” Dr. Maves added. “Then we’ll be in a good position of determining which is the best of several good options, as a society and as a world.”
COVID-19 vaccine development over the past year has been remarkably fast, especially given the previous record set by the mumps vaccine, which took about four years to go from initial steps to rollout, Dr. Maves noted.
Dr. Fauci said the federal government has taken a “strategic approach” to the COVID-19 vaccine that includes direct involvement in the research and development of six different vaccine candidates, five of which are now in phase 3 trials.
As part of that strategic approach, the study protocols are harmonized to have a common data and safety monitoring board, common primary and secondary endpoints, and an independent statistical group to determine correlates of protection, Dr. Fauci said.
Prioritizing COVID-19 vaccine distribution
Who gets COVID-19 vaccine first will be a challenge for governmental organizations as well as bioethicists, who have proposed different strategies for fairly prioritizing different groups for access.
Reaching communities of color will be an important consideration for prioritization, according to Dr. Maves, given the disproportionate burden of disease on Black and Hispanic individuals, among other such populations.
COVID-19–related hospitalization rates have been substantially higher in communities of color, Dr. Fauci said in his keynote address. Age-adjusted hospitalization rates for Hispanic/Latinx and Black populations are 375 to 368 per 100,000, respectively, compared with just 82 per 100,000 for White non-Hispanics, according to data from the Centers for Disease Control and Prevention.
Outreach to those communities should include building trust in those populations that they will benefit from a safe and effective vaccine, and making sure that the vaccine is available to those communities as quickly as possible, Dr. Maves said.
Dr. Fauci and Dr. Maves provided no disclosures related to their presentations.
FROM CHEST 2020
Recall widens for diabetes drug metformin
The recall of extended-release metformin continues this month as 76 more lots have been flagged for a possible cancer-causing ingredient.
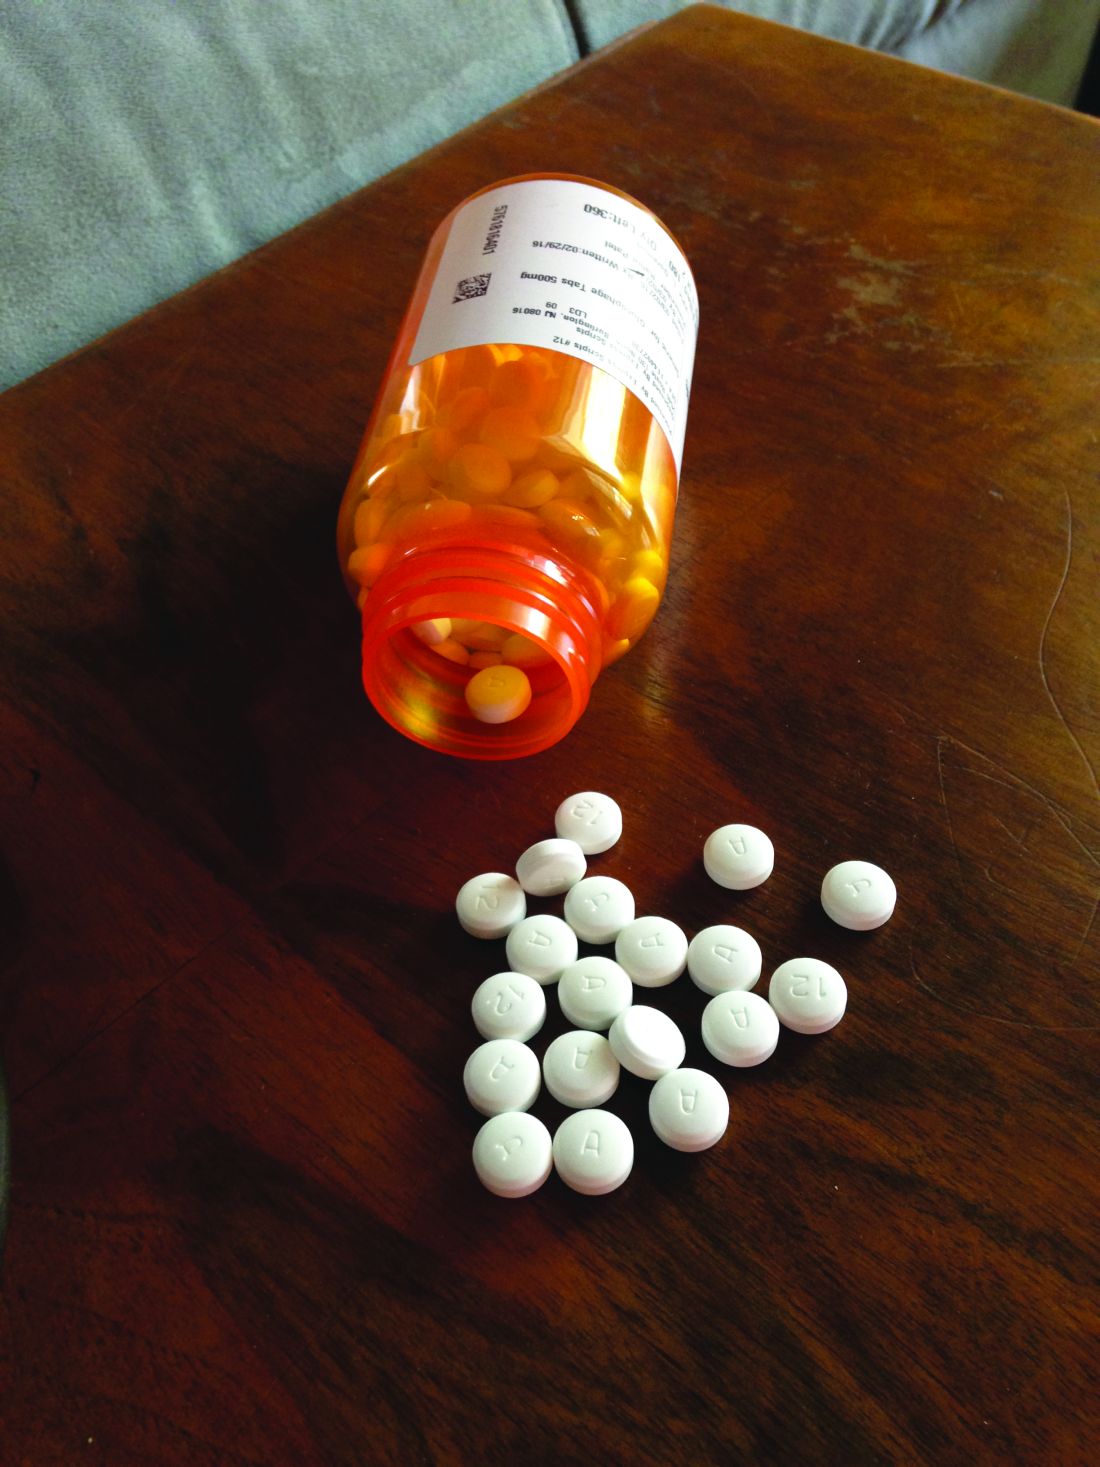
The Food and Drug Administration announced the latest recall, involving Marksans Pharma Limited and Sun Pharmaceutical Industries products, on Oct. 5. It involves the 500-mg and 700-mg tablets. More than 175 different drug combinations have been recalled since late May.
Consumers can see all the recalled metformin products at this FDA website. The agency says that immediate-release metformin does not appear to have the same contamination problem.
The FDA has been investigating the presence of nitrosamines, known to be possible carcinogens, in the popular diabetes medications since December, when they were first discovered in drugs in other countries. The agency said this month they still do not know the source of nitrosamines in the medications.
The investigation and subsequent recalls follow similar ones for contamination of popular heartburn and blood pressure drugs also for nitrosamines, such as N-Nitrosodimethylamine (NDMA).
The FDA says patients taking metformin products that have been recalled should continue taking the medication until a doctor or pharmacist gives them a replacement or a different treatment option. It could be dangerous for patients with type 2 diabetes to stop taking the medication without first talking to their doctor.
The agency has asked drug manufacturers to test products before batches are released into the market. The companies must tell the FDA if any product shows levels of nitrosamines above the acceptable limit.
The risk from nitrosamines is not clear. The FDA says they may increase the risk of cancer in people who are exposed to high levels over a long period of time, “but we do not anticipate that shorter-term exposure at levels above the acceptable intake limit would lead to an increase in the risk of cancer.”
This article first appeared on WebMD.com.
The recall of extended-release metformin continues this month as 76 more lots have been flagged for a possible cancer-causing ingredient.
The Food and Drug Administration announced the latest recall, involving Marksans Pharma Limited and Sun Pharmaceutical Industries products, on Oct. 5. It involves the 500-mg and 700-mg tablets. More than 175 different drug combinations have been recalled since late May.
Consumers can see all the recalled metformin products at this FDA website. The agency says that immediate-release metformin does not appear to have the same contamination problem.
The FDA has been investigating the presence of nitrosamines, known to be possible carcinogens, in the popular diabetes medications since December, when they were first discovered in drugs in other countries. The agency said this month they still do not know the source of nitrosamines in the medications.
The investigation and subsequent recalls follow similar ones for contamination of popular heartburn and blood pressure drugs also for nitrosamines, such as N-Nitrosodimethylamine (NDMA).
The FDA says patients taking metformin products that have been recalled should continue taking the medication until a doctor or pharmacist gives them a replacement or a different treatment option. It could be dangerous for patients with type 2 diabetes to stop taking the medication without first talking to their doctor.
The agency has asked drug manufacturers to test products before batches are released into the market. The companies must tell the FDA if any product shows levels of nitrosamines above the acceptable limit.
The risk from nitrosamines is not clear. The FDA says they may increase the risk of cancer in people who are exposed to high levels over a long period of time, “but we do not anticipate that shorter-term exposure at levels above the acceptable intake limit would lead to an increase in the risk of cancer.”
This article first appeared on WebMD.com.
The recall of extended-release metformin continues this month as 76 more lots have been flagged for a possible cancer-causing ingredient.
The Food and Drug Administration announced the latest recall, involving Marksans Pharma Limited and Sun Pharmaceutical Industries products, on Oct. 5. It involves the 500-mg and 700-mg tablets. More than 175 different drug combinations have been recalled since late May.
Consumers can see all the recalled metformin products at this FDA website. The agency says that immediate-release metformin does not appear to have the same contamination problem.
The FDA has been investigating the presence of nitrosamines, known to be possible carcinogens, in the popular diabetes medications since December, when they were first discovered in drugs in other countries. The agency said this month they still do not know the source of nitrosamines in the medications.
The investigation and subsequent recalls follow similar ones for contamination of popular heartburn and blood pressure drugs also for nitrosamines, such as N-Nitrosodimethylamine (NDMA).
The FDA says patients taking metformin products that have been recalled should continue taking the medication until a doctor or pharmacist gives them a replacement or a different treatment option. It could be dangerous for patients with type 2 diabetes to stop taking the medication without first talking to their doctor.
The agency has asked drug manufacturers to test products before batches are released into the market. The companies must tell the FDA if any product shows levels of nitrosamines above the acceptable limit.
The risk from nitrosamines is not clear. The FDA says they may increase the risk of cancer in people who are exposed to high levels over a long period of time, “but we do not anticipate that shorter-term exposure at levels above the acceptable intake limit would lead to an increase in the risk of cancer.”
This article first appeared on WebMD.com.
NACMI: Clear benefit with PCI in STEMI COVID-19 patients
Patients with COVID-19 who present with ST-segment elevation MI (STEMI) represent a unique, high-risk population with greater risks for in-hospital death and stroke, according to initial results from the North American COVID-19 ST-Segment Elevation Myocardial Infarction Registry (NACMI).

Although COVID-19–confirmed patients were less likely to undergo angiography than patients under investigation (PUI) for COVID-19 or historical STEMI activation controls, 71% underwent primary percutaneous coronary intervention (PCI).
“Primary PCI is preferable and feasible in COVID-19–positive patients, with door-to-balloon times similar to PUI or COVID-negative patients, and that supports the updated COVID-specific STEMI guidelines,” study cochair Timothy D. Henry, MD, said in a late-breaking clinical science session at TCT 2020, the Transcatheter Cardiovascular Therapeutics virtual annual meeting.
The multisociety COVID-specific guidelines were initially issued in April, endorsing PCI as the standard of care and allowing for consideration of fibrinolysis-based therapy at non-PCI capable hospitals.
Five previous publications on a total of 174 COVID-19 patients with ST-elevation have shown there are more frequent in-hospital STEMI presentations, more cases without a clear culprit lesion, more thrombotic lesions and microthrombi, and higher mortality, ranging from 12% to 72%. Still, there has been considerable controversy over exactly what to do when COVID-19 patients with ST elevation reach the cath lab, he said at the meeting sponsored by the Cardiovascular Research Foundation.
NACMI represents the largest experience with ST-elevation patients and is a unique collaboration between the Society for Cardiovascular Angiography and Interventions, Canadian Association of Interventional Cardiology, American College of Cardiology, and Midwest STEMI Consortium, noted Dr. Henry, who is medical director of the Lindner Center for Research and Education at the Christ Hospital, Cincinnati.
The registry enrolled any COVID-19–positive patient or person under investigation older than 18 years with ST-segment elevation or new-onset left bundle branch block on electrocardiogram with a clinical correlate of myocardial ischemia such as chest pain, dyspnea, cardiac arrest, shock, or mechanical ventilation. There were no exclusion criteria.
Data from 171 patients with confirmed COVID-19 and 423 PUI from 64 sites were then propensity-matched to a control population from the Midwest STEMI Consortium, a prospective, multicenter registry of consecutive STEMI patients.
The three groups were similar in sex and age but there was a striking difference in race, with 27% of African American and 24% of Hispanic patients COVID-confirmed, compared with 11% and 6% in the PUI group and 4% and 1% in the control group. Likewise, there was a significant increase in diabetes (44% vs. 33% vs. 20%), which has been reported previously with influenza.
COVID-19–positive patients, as compared with PUI and controls, were significantly more likely to present with cardiogenic shock before PCI (20% vs. 14% vs. 5%), but not cardiac arrest (12% vs. 17% vs. 11%), and to have lower left ventricular ejection fractions (45% vs. 45% vs. 50%).
They also presented with more atypical symptoms than PUI patients, particularly infiltrates on chest x-ray (49% vs. 17%) and dyspnea (58% vs. 38%). Data were not available for these outcomes among historic controls.
Importantly, 21% of the COVID-19 patients did not undergo angiography, compared with 5% of PUI patients and 0% of controls (P < .001), “which is much higher than we would expect or have suspected,” Dr. Henry said. Thrombolytic use was very uncommon in those undergoing angiography, likely as a result of the guidelines.
Very surprisingly, there were no differences in door-to-balloon times between the COVID-positive, PUI, and control groups despite the ongoing pandemic (80 min vs. 78 min vs. 86 min).
But there was clear worsening in in-hospital mortality in COVID-19–positive patients (32% vs. 12% and 6%; P < .001), as well as in-hospital stroke (3.4% vs. 2% vs. 0.6%) that reached statistical significance only when compared with historical controls (P = .039). Total length of stay was twice as long in COVID-confirmed patients as in both PUI and controls (6 days vs. 3 days; P < .001).
Following the formal presentation, invited discussant Philippe Gabriel Steg, MD, Imperial College London, said the researchers have provided a great service in reporting the data so quickly but noted that an ongoing French registry of events before, during, and after the first COVID-19 wave has not seen an increased death rate.
“Can you tease out whether the increased death rate is related to cardiovascular deaths or to COVID-related pneumonias, shocks, ARDSs [acute respiratory distress syndromes], and so on and so forth? Because our impression – and that’s what we’ve published in Lancet Public Health – is that the cardiovascular morality rate doesn’t seem that affected by COVID.”
Dr. Henry replied that these are early data but “I will tell you that patients who did get PCI had a mortality rate that was only around 12% or 13%, and the patients who did not undergo angiography or were treated with medical therapy had higher mortality. Now, of course, that’s selected and we need to do a much better matching and look at that, but that’s our goal and we will have that information,” he said.
During a press briefing on the study, discussant Renu Virmani, MD, president and founder of CVPath Institute, noted that, in their analysis of 40 autopsy cases from Bergamot, Italy, small intramyocardial microthrombi were seen in nine patients, whereas epicardial microthrombi were seen in only three or four.
“Some of the cases are being taken as being related to coronary disease but may be more thrombotic than anything else,” she said. “I think there’s a combination, and that’s why the outcomes are so poor. You didn’t show us TIMI flow but that’s something to think about: Was TIMI flow different in the patients who died because you have very high mortality? I think we need to get to the bottom of what is the underlying cause of that thrombosis.”
Future topics of interest include ethnic and regional/country differences; time-to-treatment including chest pain onset-to-arrival; transfer, in-hospital, and no-culprit patients; changes over time during the pandemic; and eventually 1-year outcomes, Dr. Henry said.
Press briefing moderator Ajay Kirtane, MD, director of the cardiac catheterization labs at NewYork-Presbyterian/Columbia University Irving, New York, remarked that “a lot of times people will pooh-pooh observational data, but this is exactly the type of data that we need to try to be able to gather information about what our practices are, how they fit. And I think many of us around the world will see these data, and it will echo their own experience.”
The study was funded by the Society for Cardiovascular Angiography and Interventions and the Canadian Association of Interventional Cardiology. Dr. Henry has disclosed no relevant financial relationships.
A version of this article originally appeared on Medscape.com.
Patients with COVID-19 who present with ST-segment elevation MI (STEMI) represent a unique, high-risk population with greater risks for in-hospital death and stroke, according to initial results from the North American COVID-19 ST-Segment Elevation Myocardial Infarction Registry (NACMI).
Although COVID-19–confirmed patients were less likely to undergo angiography than patients under investigation (PUI) for COVID-19 or historical STEMI activation controls, 71% underwent primary percutaneous coronary intervention (PCI).
“Primary PCI is preferable and feasible in COVID-19–positive patients, with door-to-balloon times similar to PUI or COVID-negative patients, and that supports the updated COVID-specific STEMI guidelines,” study cochair Timothy D. Henry, MD, said in a late-breaking clinical science session at TCT 2020, the Transcatheter Cardiovascular Therapeutics virtual annual meeting.
The multisociety COVID-specific guidelines were initially issued in April, endorsing PCI as the standard of care and allowing for consideration of fibrinolysis-based therapy at non-PCI capable hospitals.
Five previous publications on a total of 174 COVID-19 patients with ST-elevation have shown there are more frequent in-hospital STEMI presentations, more cases without a clear culprit lesion, more thrombotic lesions and microthrombi, and higher mortality, ranging from 12% to 72%. Still, there has been considerable controversy over exactly what to do when COVID-19 patients with ST elevation reach the cath lab, he said at the meeting sponsored by the Cardiovascular Research Foundation.
NACMI represents the largest experience with ST-elevation patients and is a unique collaboration between the Society for Cardiovascular Angiography and Interventions, Canadian Association of Interventional Cardiology, American College of Cardiology, and Midwest STEMI Consortium, noted Dr. Henry, who is medical director of the Lindner Center for Research and Education at the Christ Hospital, Cincinnati.
The registry enrolled any COVID-19–positive patient or person under investigation older than 18 years with ST-segment elevation or new-onset left bundle branch block on electrocardiogram with a clinical correlate of myocardial ischemia such as chest pain, dyspnea, cardiac arrest, shock, or mechanical ventilation. There were no exclusion criteria.
Data from 171 patients with confirmed COVID-19 and 423 PUI from 64 sites were then propensity-matched to a control population from the Midwest STEMI Consortium, a prospective, multicenter registry of consecutive STEMI patients.
The three groups were similar in sex and age but there was a striking difference in race, with 27% of African American and 24% of Hispanic patients COVID-confirmed, compared with 11% and 6% in the PUI group and 4% and 1% in the control group. Likewise, there was a significant increase in diabetes (44% vs. 33% vs. 20%), which has been reported previously with influenza.
COVID-19–positive patients, as compared with PUI and controls, were significantly more likely to present with cardiogenic shock before PCI (20% vs. 14% vs. 5%), but not cardiac arrest (12% vs. 17% vs. 11%), and to have lower left ventricular ejection fractions (45% vs. 45% vs. 50%).
They also presented with more atypical symptoms than PUI patients, particularly infiltrates on chest x-ray (49% vs. 17%) and dyspnea (58% vs. 38%). Data were not available for these outcomes among historic controls.
Importantly, 21% of the COVID-19 patients did not undergo angiography, compared with 5% of PUI patients and 0% of controls (P < .001), “which is much higher than we would expect or have suspected,” Dr. Henry said. Thrombolytic use was very uncommon in those undergoing angiography, likely as a result of the guidelines.
Very surprisingly, there were no differences in door-to-balloon times between the COVID-positive, PUI, and control groups despite the ongoing pandemic (80 min vs. 78 min vs. 86 min).
But there was clear worsening in in-hospital mortality in COVID-19–positive patients (32% vs. 12% and 6%; P < .001), as well as in-hospital stroke (3.4% vs. 2% vs. 0.6%) that reached statistical significance only when compared with historical controls (P = .039). Total length of stay was twice as long in COVID-confirmed patients as in both PUI and controls (6 days vs. 3 days; P < .001).
Following the formal presentation, invited discussant Philippe Gabriel Steg, MD, Imperial College London, said the researchers have provided a great service in reporting the data so quickly but noted that an ongoing French registry of events before, during, and after the first COVID-19 wave has not seen an increased death rate.
“Can you tease out whether the increased death rate is related to cardiovascular deaths or to COVID-related pneumonias, shocks, ARDSs [acute respiratory distress syndromes], and so on and so forth? Because our impression – and that’s what we’ve published in Lancet Public Health – is that the cardiovascular morality rate doesn’t seem that affected by COVID.”
Dr. Henry replied that these are early data but “I will tell you that patients who did get PCI had a mortality rate that was only around 12% or 13%, and the patients who did not undergo angiography or were treated with medical therapy had higher mortality. Now, of course, that’s selected and we need to do a much better matching and look at that, but that’s our goal and we will have that information,” he said.
During a press briefing on the study, discussant Renu Virmani, MD, president and founder of CVPath Institute, noted that, in their analysis of 40 autopsy cases from Bergamot, Italy, small intramyocardial microthrombi were seen in nine patients, whereas epicardial microthrombi were seen in only three or four.
“Some of the cases are being taken as being related to coronary disease but may be more thrombotic than anything else,” she said. “I think there’s a combination, and that’s why the outcomes are so poor. You didn’t show us TIMI flow but that’s something to think about: Was TIMI flow different in the patients who died because you have very high mortality? I think we need to get to the bottom of what is the underlying cause of that thrombosis.”
Future topics of interest include ethnic and regional/country differences; time-to-treatment including chest pain onset-to-arrival; transfer, in-hospital, and no-culprit patients; changes over time during the pandemic; and eventually 1-year outcomes, Dr. Henry said.
Press briefing moderator Ajay Kirtane, MD, director of the cardiac catheterization labs at NewYork-Presbyterian/Columbia University Irving, New York, remarked that “a lot of times people will pooh-pooh observational data, but this is exactly the type of data that we need to try to be able to gather information about what our practices are, how they fit. And I think many of us around the world will see these data, and it will echo their own experience.”
The study was funded by the Society for Cardiovascular Angiography and Interventions and the Canadian Association of Interventional Cardiology. Dr. Henry has disclosed no relevant financial relationships.
A version of this article originally appeared on Medscape.com.
Patients with COVID-19 who present with ST-segment elevation MI (STEMI) represent a unique, high-risk population with greater risks for in-hospital death and stroke, according to initial results from the North American COVID-19 ST-Segment Elevation Myocardial Infarction Registry (NACMI).
Although COVID-19–confirmed patients were less likely to undergo angiography than patients under investigation (PUI) for COVID-19 or historical STEMI activation controls, 71% underwent primary percutaneous coronary intervention (PCI).
“Primary PCI is preferable and feasible in COVID-19–positive patients, with door-to-balloon times similar to PUI or COVID-negative patients, and that supports the updated COVID-specific STEMI guidelines,” study cochair Timothy D. Henry, MD, said in a late-breaking clinical science session at TCT 2020, the Transcatheter Cardiovascular Therapeutics virtual annual meeting.
The multisociety COVID-specific guidelines were initially issued in April, endorsing PCI as the standard of care and allowing for consideration of fibrinolysis-based therapy at non-PCI capable hospitals.
Five previous publications on a total of 174 COVID-19 patients with ST-elevation have shown there are more frequent in-hospital STEMI presentations, more cases without a clear culprit lesion, more thrombotic lesions and microthrombi, and higher mortality, ranging from 12% to 72%. Still, there has been considerable controversy over exactly what to do when COVID-19 patients with ST elevation reach the cath lab, he said at the meeting sponsored by the Cardiovascular Research Foundation.
NACMI represents the largest experience with ST-elevation patients and is a unique collaboration between the Society for Cardiovascular Angiography and Interventions, Canadian Association of Interventional Cardiology, American College of Cardiology, and Midwest STEMI Consortium, noted Dr. Henry, who is medical director of the Lindner Center for Research and Education at the Christ Hospital, Cincinnati.
The registry enrolled any COVID-19–positive patient or person under investigation older than 18 years with ST-segment elevation or new-onset left bundle branch block on electrocardiogram with a clinical correlate of myocardial ischemia such as chest pain, dyspnea, cardiac arrest, shock, or mechanical ventilation. There were no exclusion criteria.
Data from 171 patients with confirmed COVID-19 and 423 PUI from 64 sites were then propensity-matched to a control population from the Midwest STEMI Consortium, a prospective, multicenter registry of consecutive STEMI patients.
The three groups were similar in sex and age but there was a striking difference in race, with 27% of African American and 24% of Hispanic patients COVID-confirmed, compared with 11% and 6% in the PUI group and 4% and 1% in the control group. Likewise, there was a significant increase in diabetes (44% vs. 33% vs. 20%), which has been reported previously with influenza.
COVID-19–positive patients, as compared with PUI and controls, were significantly more likely to present with cardiogenic shock before PCI (20% vs. 14% vs. 5%), but not cardiac arrest (12% vs. 17% vs. 11%), and to have lower left ventricular ejection fractions (45% vs. 45% vs. 50%).
They also presented with more atypical symptoms than PUI patients, particularly infiltrates on chest x-ray (49% vs. 17%) and dyspnea (58% vs. 38%). Data were not available for these outcomes among historic controls.
Importantly, 21% of the COVID-19 patients did not undergo angiography, compared with 5% of PUI patients and 0% of controls (P < .001), “which is much higher than we would expect or have suspected,” Dr. Henry said. Thrombolytic use was very uncommon in those undergoing angiography, likely as a result of the guidelines.
Very surprisingly, there were no differences in door-to-balloon times between the COVID-positive, PUI, and control groups despite the ongoing pandemic (80 min vs. 78 min vs. 86 min).
But there was clear worsening in in-hospital mortality in COVID-19–positive patients (32% vs. 12% and 6%; P < .001), as well as in-hospital stroke (3.4% vs. 2% vs. 0.6%) that reached statistical significance only when compared with historical controls (P = .039). Total length of stay was twice as long in COVID-confirmed patients as in both PUI and controls (6 days vs. 3 days; P < .001).
Following the formal presentation, invited discussant Philippe Gabriel Steg, MD, Imperial College London, said the researchers have provided a great service in reporting the data so quickly but noted that an ongoing French registry of events before, during, and after the first COVID-19 wave has not seen an increased death rate.
“Can you tease out whether the increased death rate is related to cardiovascular deaths or to COVID-related pneumonias, shocks, ARDSs [acute respiratory distress syndromes], and so on and so forth? Because our impression – and that’s what we’ve published in Lancet Public Health – is that the cardiovascular morality rate doesn’t seem that affected by COVID.”
Dr. Henry replied that these are early data but “I will tell you that patients who did get PCI had a mortality rate that was only around 12% or 13%, and the patients who did not undergo angiography or were treated with medical therapy had higher mortality. Now, of course, that’s selected and we need to do a much better matching and look at that, but that’s our goal and we will have that information,” he said.
During a press briefing on the study, discussant Renu Virmani, MD, president and founder of CVPath Institute, noted that, in their analysis of 40 autopsy cases from Bergamot, Italy, small intramyocardial microthrombi were seen in nine patients, whereas epicardial microthrombi were seen in only three or four.
“Some of the cases are being taken as being related to coronary disease but may be more thrombotic than anything else,” she said. “I think there’s a combination, and that’s why the outcomes are so poor. You didn’t show us TIMI flow but that’s something to think about: Was TIMI flow different in the patients who died because you have very high mortality? I think we need to get to the bottom of what is the underlying cause of that thrombosis.”
Future topics of interest include ethnic and regional/country differences; time-to-treatment including chest pain onset-to-arrival; transfer, in-hospital, and no-culprit patients; changes over time during the pandemic; and eventually 1-year outcomes, Dr. Henry said.
Press briefing moderator Ajay Kirtane, MD, director of the cardiac catheterization labs at NewYork-Presbyterian/Columbia University Irving, New York, remarked that “a lot of times people will pooh-pooh observational data, but this is exactly the type of data that we need to try to be able to gather information about what our practices are, how they fit. And I think many of us around the world will see these data, and it will echo their own experience.”
The study was funded by the Society for Cardiovascular Angiography and Interventions and the Canadian Association of Interventional Cardiology. Dr. Henry has disclosed no relevant financial relationships.
A version of this article originally appeared on Medscape.com.
Substance in tears could be used for diabetes monitoring
Measuring glycated albumin (glycoalbumin, GA) in tears could be a future way for those with diabetes to monitor their blood sugar levels noninvasively.

In a 100-patient trial, levels of GA in tears were found to be strongly correlated (r = .722; P < .001) with those in the blood.
“GA levels in blood are widely measured in clinical practice in Japan,” said study investigator Masakazu Aihara, MD, PhD, in an interview.
“It’s a biomarker that reflects the 2-week average blood glucose level like fructosamine,” explained the researcher from the department of diabetes and metabolic diseases in the Graduate School of Medicine at the University of Tokyo.
This could make it a better biomarker for detecting earlier changes in blood glucose than glycated hemoglobin (HbA1c), which reflects changes in blood glucose over the preceding 2-3 months.
Prior studies had shown that glucose levels can be measured in tear samples and that tear glucose levels correlated with blood glucose levels, Dr. Aihara and fellow researchers observed in a poster presentation at the virtual annual meeting of the European Association for the Study of Diabetes.
“While looking for noninvasive diabetes-related markers, we found that tears contained albumin. Based on this fact, we thought that GA could be measured in tears,” Dr. Aihara explained.
Using tears to test for biomarkers is not a new idea – tears not only protect the eye, they contain a variety of large proteins, and their composition can change with disease. Indeed, researchers have been looking at their usefulness in helping find biomarkers for Parkinson’s disease and diabetic peripheral neuropathy.
During their study, Dr. Aihara and associates collected tear and blood samples at the same time. Tear samples were assessed using liquid chromatography (LC) and mass spectrometry (MS). An enzymic method was used to measure GA levels in blood. Several diagnosis assay kits for GA are sold in Japan, Dr. Aihara said, and at least one of these has U.S. Food and Drug Administration approval.
Multiple regression analysis revealed that the correlation between GA levels in tears and in blood was maintained even after adjustment for age, gender, nephropathy stage, and obesity (P < .001). The results obtained from the tests were thought unlikely to be affected by any changes in the concentration or dilution of tear samples.
“Since GA levels in blood are clinically used in all types of diabetes, GA levels in tears is also expected to be useful in all types of diabetes,” Dr. Aihara said, noting that the effects of receiving treatment on GA levels in tears is something that he would like to look at.
The team would also like to optimize how tear samples are collected and reduce the volume of tears that are required for analysis. At the moment tears are collected via a dropper and about 100 mcL of tear fluid is required for measurement.
“At present, it is difficult to measure for dry eye patients because sufficient tears cannot be collected, but if the required amount of tears decreases in the future, it may be indicated for dry eye patients,” Dr. Aihara noted.
Discussing further research plans, he added: “We would like to examine the conditions of LC-MS/MS so that the correlation coefficient with GA in blood can be improved.
“Since LC-MS/MS is a large equipment in the laboratory, I would like to develop a device that can measure at the clinic or at home in the future.”
The study was funded by a grant from the Japan Agency for Medical Research and Development. Dr. Aihara had no conflicts of interest.
SOURCE: Aihara M et al. EASD 2020, poster presentation 624.
Measuring glycated albumin (glycoalbumin, GA) in tears could be a future way for those with diabetes to monitor their blood sugar levels noninvasively.
In a 100-patient trial, levels of GA in tears were found to be strongly correlated (r = .722; P < .001) with those in the blood.
“GA levels in blood are widely measured in clinical practice in Japan,” said study investigator Masakazu Aihara, MD, PhD, in an interview.
“It’s a biomarker that reflects the 2-week average blood glucose level like fructosamine,” explained the researcher from the department of diabetes and metabolic diseases in the Graduate School of Medicine at the University of Tokyo.
This could make it a better biomarker for detecting earlier changes in blood glucose than glycated hemoglobin (HbA1c), which reflects changes in blood glucose over the preceding 2-3 months.
Prior studies had shown that glucose levels can be measured in tear samples and that tear glucose levels correlated with blood glucose levels, Dr. Aihara and fellow researchers observed in a poster presentation at the virtual annual meeting of the European Association for the Study of Diabetes.
“While looking for noninvasive diabetes-related markers, we found that tears contained albumin. Based on this fact, we thought that GA could be measured in tears,” Dr. Aihara explained.
Using tears to test for biomarkers is not a new idea – tears not only protect the eye, they contain a variety of large proteins, and their composition can change with disease. Indeed, researchers have been looking at their usefulness in helping find biomarkers for Parkinson’s disease and diabetic peripheral neuropathy.
During their study, Dr. Aihara and associates collected tear and blood samples at the same time. Tear samples were assessed using liquid chromatography (LC) and mass spectrometry (MS). An enzymic method was used to measure GA levels in blood. Several diagnosis assay kits for GA are sold in Japan, Dr. Aihara said, and at least one of these has U.S. Food and Drug Administration approval.
Multiple regression analysis revealed that the correlation between GA levels in tears and in blood was maintained even after adjustment for age, gender, nephropathy stage, and obesity (P < .001). The results obtained from the tests were thought unlikely to be affected by any changes in the concentration or dilution of tear samples.
“Since GA levels in blood are clinically used in all types of diabetes, GA levels in tears is also expected to be useful in all types of diabetes,” Dr. Aihara said, noting that the effects of receiving treatment on GA levels in tears is something that he would like to look at.
The team would also like to optimize how tear samples are collected and reduce the volume of tears that are required for analysis. At the moment tears are collected via a dropper and about 100 mcL of tear fluid is required for measurement.
“At present, it is difficult to measure for dry eye patients because sufficient tears cannot be collected, but if the required amount of tears decreases in the future, it may be indicated for dry eye patients,” Dr. Aihara noted.
Discussing further research plans, he added: “We would like to examine the conditions of LC-MS/MS so that the correlation coefficient with GA in blood can be improved.
“Since LC-MS/MS is a large equipment in the laboratory, I would like to develop a device that can measure at the clinic or at home in the future.”
The study was funded by a grant from the Japan Agency for Medical Research and Development. Dr. Aihara had no conflicts of interest.
SOURCE: Aihara M et al. EASD 2020, poster presentation 624.
Measuring glycated albumin (glycoalbumin, GA) in tears could be a future way for those with diabetes to monitor their blood sugar levels noninvasively.
In a 100-patient trial, levels of GA in tears were found to be strongly correlated (r = .722; P < .001) with those in the blood.
“GA levels in blood are widely measured in clinical practice in Japan,” said study investigator Masakazu Aihara, MD, PhD, in an interview.
“It’s a biomarker that reflects the 2-week average blood glucose level like fructosamine,” explained the researcher from the department of diabetes and metabolic diseases in the Graduate School of Medicine at the University of Tokyo.
This could make it a better biomarker for detecting earlier changes in blood glucose than glycated hemoglobin (HbA1c), which reflects changes in blood glucose over the preceding 2-3 months.
Prior studies had shown that glucose levels can be measured in tear samples and that tear glucose levels correlated with blood glucose levels, Dr. Aihara and fellow researchers observed in a poster presentation at the virtual annual meeting of the European Association for the Study of Diabetes.
“While looking for noninvasive diabetes-related markers, we found that tears contained albumin. Based on this fact, we thought that GA could be measured in tears,” Dr. Aihara explained.
Using tears to test for biomarkers is not a new idea – tears not only protect the eye, they contain a variety of large proteins, and their composition can change with disease. Indeed, researchers have been looking at their usefulness in helping find biomarkers for Parkinson’s disease and diabetic peripheral neuropathy.
During their study, Dr. Aihara and associates collected tear and blood samples at the same time. Tear samples were assessed using liquid chromatography (LC) and mass spectrometry (MS). An enzymic method was used to measure GA levels in blood. Several diagnosis assay kits for GA are sold in Japan, Dr. Aihara said, and at least one of these has U.S. Food and Drug Administration approval.
Multiple regression analysis revealed that the correlation between GA levels in tears and in blood was maintained even after adjustment for age, gender, nephropathy stage, and obesity (P < .001). The results obtained from the tests were thought unlikely to be affected by any changes in the concentration or dilution of tear samples.
“Since GA levels in blood are clinically used in all types of diabetes, GA levels in tears is also expected to be useful in all types of diabetes,” Dr. Aihara said, noting that the effects of receiving treatment on GA levels in tears is something that he would like to look at.
The team would also like to optimize how tear samples are collected and reduce the volume of tears that are required for analysis. At the moment tears are collected via a dropper and about 100 mcL of tear fluid is required for measurement.
“At present, it is difficult to measure for dry eye patients because sufficient tears cannot be collected, but if the required amount of tears decreases in the future, it may be indicated for dry eye patients,” Dr. Aihara noted.
Discussing further research plans, he added: “We would like to examine the conditions of LC-MS/MS so that the correlation coefficient with GA in blood can be improved.
“Since LC-MS/MS is a large equipment in the laboratory, I would like to develop a device that can measure at the clinic or at home in the future.”
The study was funded by a grant from the Japan Agency for Medical Research and Development. Dr. Aihara had no conflicts of interest.
SOURCE: Aihara M et al. EASD 2020, poster presentation 624.
FROM EASD 2020
The unsteady state
As the COVID-19 pandemic continues to chug along, some communities feel it slowing to a pace at which they might feel comfortable about a return to, if not quite “business as usual,” at least “business as sort of normal-ish.” They are ready to accept a level of disease that signals they have reached a steady state. However, in other communities, the virus has picked up speed and is threatening to overwhelm the medical infrastructure. If you are in one of those fortunate and skillfully managed states in which folks are beginning to talk seriously, but with little evidence, that it is time to return to normal, it is probably far too early.

Eons ago in pandemic terms, the World Health Organization in Thailand published a list of criteria to aid in determining when a community could consider lifting the limits that seemed to have been effective in halting transmission of the virus (“Transitioning to and maintaining a steady state of low-level or no transmission,” WHO, Thailand, 2020 Apr 18). While much more has been learned about the behavior of the virus since the spring of 2020, the criteria from the WHO in Thailand are worth considering.
Here is my summary of their criteria for returning to normalcy. First, virus transmission is controlled to the point that only sporadic cases and small clusters exist, and that all of these are traceable in origin. Second, health care and public health systems are in place with sufficient capacities to manage a shift from detection to treatment should the case load increase dramatically; this capacity should include detection, testing, isolation, and quarantine. Third, outbreaks in high-risk populations such as nursing homes have been minimized. Fourth, workplace prevention strategies are in place and have been demonstrated to be effective. Fifth, risk of imported cases is at manageable levels. Finally, communities are engaged.
It is hard to argue with the rationale behind each of these criteria. However, the United States is not Thailand, and just thinking about how this country would go about meeting those criteria provides a window into some of the reasons why we have done so poorly and will continue to be challenged in dealing with the pandemic.
First, notice that the criteria make no mention of a vaccine. One gets the sense that from the top down our country is banking too heavily on the effectiveness and widespread delivery of a vaccine. Even if and when a vaccine is developed and delivered, all of these criteria still must be met and kept in mind for a future pandemic.
Second, the criteria call for an effective health care system, but it is abundantly clear that the United States does not have a cohesive health care system and probably won’t for the foreseeable future. The best we can hope for is individual states cobbling together their own systems, which may in turn serve as examples for those states who haven’t had the foresight. We have had a public health system of sorts, but its credibility and effectiveness has been neutered to the point that again we must rely on each state’s ability to see through the haze and create it’s own systems for detection, testing, tracking, isolating, and quarantining – often with little help in materiel support from the federal government. The sliver of good news is that, after a bit of a stumbling start, detecting and limiting the importation of cases from abroad is being addressed.
We continue to hear and see evidence that there are segments of the population who are not engaged in the activities that we have learned are necessary to stabilize the pandemic. My sense is that those people represent a very small minority. But, it is probably large enough to make the route to a steady state on a national level long and painful. This unfortunately is to be expected in a country that was built on a framework of personal freedoms. The best you can hope for in achieving a steady state is to live in one of the states that seems to be achieving the fine balance between personal freedoms and the common good.
Dr. Wilkoff practiced primary care pediatrics in Brunswick, Maine for nearly 40 years. He has authored several books on behavioral pediatrics, including “How to Say No to Your Toddler.” Other than a Littman stethoscope he accepted as a first-year medical student in 1966, Dr. Wilkoff reports having nothing to disclose. Email him at pdnews@mdedge.com.
As the COVID-19 pandemic continues to chug along, some communities feel it slowing to a pace at which they might feel comfortable about a return to, if not quite “business as usual,” at least “business as sort of normal-ish.” They are ready to accept a level of disease that signals they have reached a steady state. However, in other communities, the virus has picked up speed and is threatening to overwhelm the medical infrastructure. If you are in one of those fortunate and skillfully managed states in which folks are beginning to talk seriously, but with little evidence, that it is time to return to normal, it is probably far too early.
Eons ago in pandemic terms, the World Health Organization in Thailand published a list of criteria to aid in determining when a community could consider lifting the limits that seemed to have been effective in halting transmission of the virus (“Transitioning to and maintaining a steady state of low-level or no transmission,” WHO, Thailand, 2020 Apr 18). While much more has been learned about the behavior of the virus since the spring of 2020, the criteria from the WHO in Thailand are worth considering.
Here is my summary of their criteria for returning to normalcy. First, virus transmission is controlled to the point that only sporadic cases and small clusters exist, and that all of these are traceable in origin. Second, health care and public health systems are in place with sufficient capacities to manage a shift from detection to treatment should the case load increase dramatically; this capacity should include detection, testing, isolation, and quarantine. Third, outbreaks in high-risk populations such as nursing homes have been minimized. Fourth, workplace prevention strategies are in place and have been demonstrated to be effective. Fifth, risk of imported cases is at manageable levels. Finally, communities are engaged.
It is hard to argue with the rationale behind each of these criteria. However, the United States is not Thailand, and just thinking about how this country would go about meeting those criteria provides a window into some of the reasons why we have done so poorly and will continue to be challenged in dealing with the pandemic.
First, notice that the criteria make no mention of a vaccine. One gets the sense that from the top down our country is banking too heavily on the effectiveness and widespread delivery of a vaccine. Even if and when a vaccine is developed and delivered, all of these criteria still must be met and kept in mind for a future pandemic.
Second, the criteria call for an effective health care system, but it is abundantly clear that the United States does not have a cohesive health care system and probably won’t for the foreseeable future. The best we can hope for is individual states cobbling together their own systems, which may in turn serve as examples for those states who haven’t had the foresight. We have had a public health system of sorts, but its credibility and effectiveness has been neutered to the point that again we must rely on each state’s ability to see through the haze and create it’s own systems for detection, testing, tracking, isolating, and quarantining – often with little help in materiel support from the federal government. The sliver of good news is that, after a bit of a stumbling start, detecting and limiting the importation of cases from abroad is being addressed.
We continue to hear and see evidence that there are segments of the population who are not engaged in the activities that we have learned are necessary to stabilize the pandemic. My sense is that those people represent a very small minority. But, it is probably large enough to make the route to a steady state on a national level long and painful. This unfortunately is to be expected in a country that was built on a framework of personal freedoms. The best you can hope for in achieving a steady state is to live in one of the states that seems to be achieving the fine balance between personal freedoms and the common good.
Dr. Wilkoff practiced primary care pediatrics in Brunswick, Maine for nearly 40 years. He has authored several books on behavioral pediatrics, including “How to Say No to Your Toddler.” Other than a Littman stethoscope he accepted as a first-year medical student in 1966, Dr. Wilkoff reports having nothing to disclose. Email him at pdnews@mdedge.com.
As the COVID-19 pandemic continues to chug along, some communities feel it slowing to a pace at which they might feel comfortable about a return to, if not quite “business as usual,” at least “business as sort of normal-ish.” They are ready to accept a level of disease that signals they have reached a steady state. However, in other communities, the virus has picked up speed and is threatening to overwhelm the medical infrastructure. If you are in one of those fortunate and skillfully managed states in which folks are beginning to talk seriously, but with little evidence, that it is time to return to normal, it is probably far too early.
Eons ago in pandemic terms, the World Health Organization in Thailand published a list of criteria to aid in determining when a community could consider lifting the limits that seemed to have been effective in halting transmission of the virus (“Transitioning to and maintaining a steady state of low-level or no transmission,” WHO, Thailand, 2020 Apr 18). While much more has been learned about the behavior of the virus since the spring of 2020, the criteria from the WHO in Thailand are worth considering.
Here is my summary of their criteria for returning to normalcy. First, virus transmission is controlled to the point that only sporadic cases and small clusters exist, and that all of these are traceable in origin. Second, health care and public health systems are in place with sufficient capacities to manage a shift from detection to treatment should the case load increase dramatically; this capacity should include detection, testing, isolation, and quarantine. Third, outbreaks in high-risk populations such as nursing homes have been minimized. Fourth, workplace prevention strategies are in place and have been demonstrated to be effective. Fifth, risk of imported cases is at manageable levels. Finally, communities are engaged.
It is hard to argue with the rationale behind each of these criteria. However, the United States is not Thailand, and just thinking about how this country would go about meeting those criteria provides a window into some of the reasons why we have done so poorly and will continue to be challenged in dealing with the pandemic.
First, notice that the criteria make no mention of a vaccine. One gets the sense that from the top down our country is banking too heavily on the effectiveness and widespread delivery of a vaccine. Even if and when a vaccine is developed and delivered, all of these criteria still must be met and kept in mind for a future pandemic.
Second, the criteria call for an effective health care system, but it is abundantly clear that the United States does not have a cohesive health care system and probably won’t for the foreseeable future. The best we can hope for is individual states cobbling together their own systems, which may in turn serve as examples for those states who haven’t had the foresight. We have had a public health system of sorts, but its credibility and effectiveness has been neutered to the point that again we must rely on each state’s ability to see through the haze and create it’s own systems for detection, testing, tracking, isolating, and quarantining – often with little help in materiel support from the federal government. The sliver of good news is that, after a bit of a stumbling start, detecting and limiting the importation of cases from abroad is being addressed.
We continue to hear and see evidence that there are segments of the population who are not engaged in the activities that we have learned are necessary to stabilize the pandemic. My sense is that those people represent a very small minority. But, it is probably large enough to make the route to a steady state on a national level long and painful. This unfortunately is to be expected in a country that was built on a framework of personal freedoms. The best you can hope for in achieving a steady state is to live in one of the states that seems to be achieving the fine balance between personal freedoms and the common good.
Dr. Wilkoff practiced primary care pediatrics in Brunswick, Maine for nearly 40 years. He has authored several books on behavioral pediatrics, including “How to Say No to Your Toddler.” Other than a Littman stethoscope he accepted as a first-year medical student in 1966, Dr. Wilkoff reports having nothing to disclose. Email him at pdnews@mdedge.com.
Mastering mask communicating
. For those specialties not accustomed to wearing a mask all day, it’s frustrating: How many times have you had to repeat yourself today? Or ask your patient to say something again? (Ain’t no one got time to repeat a third time how to do that prednisone taper). Worse, we’re losing important nonverbal cues that help us connect with our patients. How can we be understood when our faces are covered and 6 feet away?

Masks muffle both verbal and nonverbal communication. For soft-spoken or high-pitched speakers, the verbal effect is significant. In particular, masks make hearing consonants more difficult. They can make the “sh,” “th,” “f,” and “s” sounds difficult to distinguish. Typically, we’d use context and lip reading to boost the signal, but this fix is blocked (and the clear mouth-window masks are kinda creepy).
Masks also prevent us from seeing facial microexpressions, critical information when you are trying to connect with someone or to build trust. A randomized controlled trial published in 2013 indeed showed that doctors wearing a mask were perceived as less empathetic and had diminished relational continuity with patients as compared to doctors not wearing a mask. There are a few things we can do to help.
Speak more loudly is obvious advice. Loud talking has limitations though, as it can feel rude, and it blunts inflections, which add richness and emotion. (Shouting “THIS WILL ONLY HURT A LITTLE” seems a mixed message). More important than the volume is your choice of words. Try to use simple terms and short sentences. Pause between points. Hit your consonants harder.
It’s also important that you have their full attention and are giving yours. As much as possible, try to align squared up with patients. Facing your computer exacerbates the problem. Look them in their eyes and be sure they are connected with you before any complex or difficult conversations. Hearing-impaired patients are now sometimes leaving out their aids because it’s too uncomfortable to wear them with their mask. You might ask them to put them back in. Check in with patients and repeat back what you heard them say. This can help with clarity and with connecting. Use your face more: if you’ve ever acted on stage, this would be your on-stage face. Exaggerate your expressions so it’s a little easier for them to read you.
Lastly, there are apps such as Ava or Google Live Translator, which can transcribe your speech real time. You could then share your screen with the patient so they can read exactly what you’ve said.
Some of us are natural communicators. Even if you are not, you can mitigate some of our current challenges. I’ll admit, it’s been a bit easier for me than for others. Between my prominent eyebrows and Italian-American upbringing, I can express my way through pretty much any face covering. If you’d like to learn how to use your hands better, then just watch this little girl: https://youtu.be/Z5wAWyqDrnc.
Dr. Benabio is director of Healthcare Transformation and chief of dermatology at Kaiser Permanente San Diego. The opinions expressed in this column are his own and do not represent those of Kaiser Permanente. Dr. Benabio is @Dermdoc on Twitter. Write to him at dermnews@mdedge.com.
. For those specialties not accustomed to wearing a mask all day, it’s frustrating: How many times have you had to repeat yourself today? Or ask your patient to say something again? (Ain’t no one got time to repeat a third time how to do that prednisone taper). Worse, we’re losing important nonverbal cues that help us connect with our patients. How can we be understood when our faces are covered and 6 feet away?
Masks muffle both verbal and nonverbal communication. For soft-spoken or high-pitched speakers, the verbal effect is significant. In particular, masks make hearing consonants more difficult. They can make the “sh,” “th,” “f,” and “s” sounds difficult to distinguish. Typically, we’d use context and lip reading to boost the signal, but this fix is blocked (and the clear mouth-window masks are kinda creepy).
Masks also prevent us from seeing facial microexpressions, critical information when you are trying to connect with someone or to build trust. A randomized controlled trial published in 2013 indeed showed that doctors wearing a mask were perceived as less empathetic and had diminished relational continuity with patients as compared to doctors not wearing a mask. There are a few things we can do to help.
Speak more loudly is obvious advice. Loud talking has limitations though, as it can feel rude, and it blunts inflections, which add richness and emotion. (Shouting “THIS WILL ONLY HURT A LITTLE” seems a mixed message). More important than the volume is your choice of words. Try to use simple terms and short sentences. Pause between points. Hit your consonants harder.
It’s also important that you have their full attention and are giving yours. As much as possible, try to align squared up with patients. Facing your computer exacerbates the problem. Look them in their eyes and be sure they are connected with you before any complex or difficult conversations. Hearing-impaired patients are now sometimes leaving out their aids because it’s too uncomfortable to wear them with their mask. You might ask them to put them back in. Check in with patients and repeat back what you heard them say. This can help with clarity and with connecting. Use your face more: if you’ve ever acted on stage, this would be your on-stage face. Exaggerate your expressions so it’s a little easier for them to read you.
Lastly, there are apps such as Ava or Google Live Translator, which can transcribe your speech real time. You could then share your screen with the patient so they can read exactly what you’ve said.
Some of us are natural communicators. Even if you are not, you can mitigate some of our current challenges. I’ll admit, it’s been a bit easier for me than for others. Between my prominent eyebrows and Italian-American upbringing, I can express my way through pretty much any face covering. If you’d like to learn how to use your hands better, then just watch this little girl: https://youtu.be/Z5wAWyqDrnc.
Dr. Benabio is director of Healthcare Transformation and chief of dermatology at Kaiser Permanente San Diego. The opinions expressed in this column are his own and do not represent those of Kaiser Permanente. Dr. Benabio is @Dermdoc on Twitter. Write to him at dermnews@mdedge.com.
. For those specialties not accustomed to wearing a mask all day, it’s frustrating: How many times have you had to repeat yourself today? Or ask your patient to say something again? (Ain’t no one got time to repeat a third time how to do that prednisone taper). Worse, we’re losing important nonverbal cues that help us connect with our patients. How can we be understood when our faces are covered and 6 feet away?
Masks muffle both verbal and nonverbal communication. For soft-spoken or high-pitched speakers, the verbal effect is significant. In particular, masks make hearing consonants more difficult. They can make the “sh,” “th,” “f,” and “s” sounds difficult to distinguish. Typically, we’d use context and lip reading to boost the signal, but this fix is blocked (and the clear mouth-window masks are kinda creepy).
Masks also prevent us from seeing facial microexpressions, critical information when you are trying to connect with someone or to build trust. A randomized controlled trial published in 2013 indeed showed that doctors wearing a mask were perceived as less empathetic and had diminished relational continuity with patients as compared to doctors not wearing a mask. There are a few things we can do to help.
Speak more loudly is obvious advice. Loud talking has limitations though, as it can feel rude, and it blunts inflections, which add richness and emotion. (Shouting “THIS WILL ONLY HURT A LITTLE” seems a mixed message). More important than the volume is your choice of words. Try to use simple terms and short sentences. Pause between points. Hit your consonants harder.
It’s also important that you have their full attention and are giving yours. As much as possible, try to align squared up with patients. Facing your computer exacerbates the problem. Look them in their eyes and be sure they are connected with you before any complex or difficult conversations. Hearing-impaired patients are now sometimes leaving out their aids because it’s too uncomfortable to wear them with their mask. You might ask them to put them back in. Check in with patients and repeat back what you heard them say. This can help with clarity and with connecting. Use your face more: if you’ve ever acted on stage, this would be your on-stage face. Exaggerate your expressions so it’s a little easier for them to read you.
Lastly, there are apps such as Ava or Google Live Translator, which can transcribe your speech real time. You could then share your screen with the patient so they can read exactly what you’ve said.
Some of us are natural communicators. Even if you are not, you can mitigate some of our current challenges. I’ll admit, it’s been a bit easier for me than for others. Between my prominent eyebrows and Italian-American upbringing, I can express my way through pretty much any face covering. If you’d like to learn how to use your hands better, then just watch this little girl: https://youtu.be/Z5wAWyqDrnc.
Dr. Benabio is director of Healthcare Transformation and chief of dermatology at Kaiser Permanente San Diego. The opinions expressed in this column are his own and do not represent those of Kaiser Permanente. Dr. Benabio is @Dermdoc on Twitter. Write to him at dermnews@mdedge.com.
Entresto halves renal events in preserved EF heart failure patients
Patients with heart failure with preserved ejection fraction (HFpEF) who received sacubitril/valsartan in the PARAGON-HF trial had significant protection against progression of renal dysfunction in a prespecified secondary analysis.
The 2,419 patients with HFpEF who received sacubitril/valsartan (Entresto) had half the rate of the primary adverse renal outcome, compared with the 2,403 patients randomized to valsartan alone in the comparator group, a significant difference, according to the results published online Sept. 29 in Circulation by Finnian R. McCausland, MBBCh, and colleagues.
In absolute terms, sacubitril/valsartan treatment, an angiotensin-receptor/neprilysin inhibitor (ARNI), cut the incidence of the combined renal endpoint – renal death, end-stage renal disease, or at least a 50% drop in estimated glomerular filtration rate (eGFR) – from 2.7% in the control group to 1.4% in the sacubitril/valsartan group during a median follow-up of 35 months.
The absolute difference of 1.3% equated to a number needed to treat of 51 to prevent one of these events.
Also notable was that renal protection from sacubitril/valsartan was equally robust across the range of baseline kidney function.
‘An important therapeutic option’
The efficacy “across the spectrum of baseline renal function” indicates treatment with sacubitril/valsartan is “an important therapeutic option to slow renal-function decline in patients with heart failure,” wrote Dr. McCausland, a nephrologist at Brigham and Women’s Hospital in Boston, and colleagues.
The authors’ conclusion is striking because currently no drug class has produced clear evidence for efficacy in HFpEF.
On the other hand, the PARAGON-HF trial that provided the data for this new analysis was statistically neutral for its primary endpoint – a reduction in the combined rate of cardiovascular death and hospitalizations for heart failure – with a P value of .06 and 95% confidence interval of 0.75-1.01.
“Because this difference [in the primary endpoint incidence between the two study group] did not meet the predetermined level of statistical significance, subsequent analyses were considered to be exploratory,” noted the authors of the primary analysis of PARAGON-HF, as reported by Medscape Medical News.
Despite this limitation in interpreting secondary outcomes from the trial, the new report of a significant renal benefit “opens the potential to provide evidence-based treatment for patients with HFpEF,” commented Sheldon W. Tobe, MD, and Stephanie Poon, MD, in an editorial accompanying the latest analysis.
“At the very least, these results are certainly intriguing and suggest that there may be important patient subgroups with HFpEF who might benefit from using sacubitril/valsartan,” they emphasized.
First large trial to show renal improvement in HFpEF
The editorialists’ enthusiasm for the implications of the new findings relate in part to the fact that “PARAGON-HF is the first large trial to demonstrate improvement in renal parameters in HFpEF,” they noted.
“The finding that the composite renal outcome did not differ according to baseline eGFR is significant and suggests that the beneficial effect on renal function was indirect, possibly linked to improved cardiac function,” say Dr. Tobe, a nephrologist, and Dr. Poon, a cardiologist, both at Sunnybrook Health Sciences Centre in Toronto.
PARAGON-HF enrolled 4,822 HFpEF patients at 848 centers in 43 countries, and the efficacy analysis included 4,796 patients.
The composite renal outcome was mainly driven by the incidence of a 50% or greater drop from baseline in eGFR, which occurred in 27 patients (1.1%) in the sacubitril/valsartan group and 60 patients (2.5%) who received valsartan alone.
The annual average drop in eGFR during the study was 2.0 mL/min per 1.73m2 in the sacubitril/valsartan group and 2.7 mL/min per 1.73m2 in the control group.
Although the heart failure community was disappointed that sacubitril/valsartan failed to show a significant benefit for the study’s primary outcome in HFpEF, the combination has become a mainstay of treatment for patients with HFpEF based on its performance in the PARADIGM-HF trial.
And despite the unqualified support sacubitril/valsartan now receives in guidelines and its label as a foundational treatment for HFpEF, the formulation has had a hard time gaining traction in U.S. practice, often because of barriers placed by third-party payers.
PARAGON-HF was sponsored by Novartis, which markets sacubitril/valsartan (Entresto). Dr. McCausland has reported no relevant financial relationships. Dr. Tobe has reported participating on a steering committee for Bayer Fidelio/Figaro studies and being a speaker on behalf of Pfizer and Servier. Dr. Poon has reported being an adviser to Novartis, Boehringer Ingelheim, and Servier.
A version of this article originally appeared on Medscape.com.
Patients with heart failure with preserved ejection fraction (HFpEF) who received sacubitril/valsartan in the PARAGON-HF trial had significant protection against progression of renal dysfunction in a prespecified secondary analysis.
The 2,419 patients with HFpEF who received sacubitril/valsartan (Entresto) had half the rate of the primary adverse renal outcome, compared with the 2,403 patients randomized to valsartan alone in the comparator group, a significant difference, according to the results published online Sept. 29 in Circulation by Finnian R. McCausland, MBBCh, and colleagues.
In absolute terms, sacubitril/valsartan treatment, an angiotensin-receptor/neprilysin inhibitor (ARNI), cut the incidence of the combined renal endpoint – renal death, end-stage renal disease, or at least a 50% drop in estimated glomerular filtration rate (eGFR) – from 2.7% in the control group to 1.4% in the sacubitril/valsartan group during a median follow-up of 35 months.
The absolute difference of 1.3% equated to a number needed to treat of 51 to prevent one of these events.
Also notable was that renal protection from sacubitril/valsartan was equally robust across the range of baseline kidney function.
‘An important therapeutic option’
The efficacy “across the spectrum of baseline renal function” indicates treatment with sacubitril/valsartan is “an important therapeutic option to slow renal-function decline in patients with heart failure,” wrote Dr. McCausland, a nephrologist at Brigham and Women’s Hospital in Boston, and colleagues.
The authors’ conclusion is striking because currently no drug class has produced clear evidence for efficacy in HFpEF.
On the other hand, the PARAGON-HF trial that provided the data for this new analysis was statistically neutral for its primary endpoint – a reduction in the combined rate of cardiovascular death and hospitalizations for heart failure – with a P value of .06 and 95% confidence interval of 0.75-1.01.
“Because this difference [in the primary endpoint incidence between the two study group] did not meet the predetermined level of statistical significance, subsequent analyses were considered to be exploratory,” noted the authors of the primary analysis of PARAGON-HF, as reported by Medscape Medical News.
Despite this limitation in interpreting secondary outcomes from the trial, the new report of a significant renal benefit “opens the potential to provide evidence-based treatment for patients with HFpEF,” commented Sheldon W. Tobe, MD, and Stephanie Poon, MD, in an editorial accompanying the latest analysis.
“At the very least, these results are certainly intriguing and suggest that there may be important patient subgroups with HFpEF who might benefit from using sacubitril/valsartan,” they emphasized.
First large trial to show renal improvement in HFpEF
The editorialists’ enthusiasm for the implications of the new findings relate in part to the fact that “PARAGON-HF is the first large trial to demonstrate improvement in renal parameters in HFpEF,” they noted.
“The finding that the composite renal outcome did not differ according to baseline eGFR is significant and suggests that the beneficial effect on renal function was indirect, possibly linked to improved cardiac function,” say Dr. Tobe, a nephrologist, and Dr. Poon, a cardiologist, both at Sunnybrook Health Sciences Centre in Toronto.
PARAGON-HF enrolled 4,822 HFpEF patients at 848 centers in 43 countries, and the efficacy analysis included 4,796 patients.
The composite renal outcome was mainly driven by the incidence of a 50% or greater drop from baseline in eGFR, which occurred in 27 patients (1.1%) in the sacubitril/valsartan group and 60 patients (2.5%) who received valsartan alone.
The annual average drop in eGFR during the study was 2.0 mL/min per 1.73m2 in the sacubitril/valsartan group and 2.7 mL/min per 1.73m2 in the control group.
Although the heart failure community was disappointed that sacubitril/valsartan failed to show a significant benefit for the study’s primary outcome in HFpEF, the combination has become a mainstay of treatment for patients with HFpEF based on its performance in the PARADIGM-HF trial.
And despite the unqualified support sacubitril/valsartan now receives in guidelines and its label as a foundational treatment for HFpEF, the formulation has had a hard time gaining traction in U.S. practice, often because of barriers placed by third-party payers.
PARAGON-HF was sponsored by Novartis, which markets sacubitril/valsartan (Entresto). Dr. McCausland has reported no relevant financial relationships. Dr. Tobe has reported participating on a steering committee for Bayer Fidelio/Figaro studies and being a speaker on behalf of Pfizer and Servier. Dr. Poon has reported being an adviser to Novartis, Boehringer Ingelheim, and Servier.
A version of this article originally appeared on Medscape.com.
Patients with heart failure with preserved ejection fraction (HFpEF) who received sacubitril/valsartan in the PARAGON-HF trial had significant protection against progression of renal dysfunction in a prespecified secondary analysis.
The 2,419 patients with HFpEF who received sacubitril/valsartan (Entresto) had half the rate of the primary adverse renal outcome, compared with the 2,403 patients randomized to valsartan alone in the comparator group, a significant difference, according to the results published online Sept. 29 in Circulation by Finnian R. McCausland, MBBCh, and colleagues.
In absolute terms, sacubitril/valsartan treatment, an angiotensin-receptor/neprilysin inhibitor (ARNI), cut the incidence of the combined renal endpoint – renal death, end-stage renal disease, or at least a 50% drop in estimated glomerular filtration rate (eGFR) – from 2.7% in the control group to 1.4% in the sacubitril/valsartan group during a median follow-up of 35 months.
The absolute difference of 1.3% equated to a number needed to treat of 51 to prevent one of these events.
Also notable was that renal protection from sacubitril/valsartan was equally robust across the range of baseline kidney function.
‘An important therapeutic option’
The efficacy “across the spectrum of baseline renal function” indicates treatment with sacubitril/valsartan is “an important therapeutic option to slow renal-function decline in patients with heart failure,” wrote Dr. McCausland, a nephrologist at Brigham and Women’s Hospital in Boston, and colleagues.
The authors’ conclusion is striking because currently no drug class has produced clear evidence for efficacy in HFpEF.
On the other hand, the PARAGON-HF trial that provided the data for this new analysis was statistically neutral for its primary endpoint – a reduction in the combined rate of cardiovascular death and hospitalizations for heart failure – with a P value of .06 and 95% confidence interval of 0.75-1.01.
“Because this difference [in the primary endpoint incidence between the two study group] did not meet the predetermined level of statistical significance, subsequent analyses were considered to be exploratory,” noted the authors of the primary analysis of PARAGON-HF, as reported by Medscape Medical News.
Despite this limitation in interpreting secondary outcomes from the trial, the new report of a significant renal benefit “opens the potential to provide evidence-based treatment for patients with HFpEF,” commented Sheldon W. Tobe, MD, and Stephanie Poon, MD, in an editorial accompanying the latest analysis.
“At the very least, these results are certainly intriguing and suggest that there may be important patient subgroups with HFpEF who might benefit from using sacubitril/valsartan,” they emphasized.
First large trial to show renal improvement in HFpEF
The editorialists’ enthusiasm for the implications of the new findings relate in part to the fact that “PARAGON-HF is the first large trial to demonstrate improvement in renal parameters in HFpEF,” they noted.
“The finding that the composite renal outcome did not differ according to baseline eGFR is significant and suggests that the beneficial effect on renal function was indirect, possibly linked to improved cardiac function,” say Dr. Tobe, a nephrologist, and Dr. Poon, a cardiologist, both at Sunnybrook Health Sciences Centre in Toronto.
PARAGON-HF enrolled 4,822 HFpEF patients at 848 centers in 43 countries, and the efficacy analysis included 4,796 patients.
The composite renal outcome was mainly driven by the incidence of a 50% or greater drop from baseline in eGFR, which occurred in 27 patients (1.1%) in the sacubitril/valsartan group and 60 patients (2.5%) who received valsartan alone.
The annual average drop in eGFR during the study was 2.0 mL/min per 1.73m2 in the sacubitril/valsartan group and 2.7 mL/min per 1.73m2 in the control group.
Although the heart failure community was disappointed that sacubitril/valsartan failed to show a significant benefit for the study’s primary outcome in HFpEF, the combination has become a mainstay of treatment for patients with HFpEF based on its performance in the PARADIGM-HF trial.
And despite the unqualified support sacubitril/valsartan now receives in guidelines and its label as a foundational treatment for HFpEF, the formulation has had a hard time gaining traction in U.S. practice, often because of barriers placed by third-party payers.
PARAGON-HF was sponsored by Novartis, which markets sacubitril/valsartan (Entresto). Dr. McCausland has reported no relevant financial relationships. Dr. Tobe has reported participating on a steering committee for Bayer Fidelio/Figaro studies and being a speaker on behalf of Pfizer and Servier. Dr. Poon has reported being an adviser to Novartis, Boehringer Ingelheim, and Servier.
A version of this article originally appeared on Medscape.com.
Blood group O linked to decreased risk of SARS-CoV-2 infection
Blood group O was associated with a decreased risk for contracting SARS-CoV-2 infection, according to the results of large retrospective analysis of the Danish population.
Researchers Mike Bogetofte Barnkob, MD, of the Department of Clinical Immunology, Odense (Denmark) University Hospital, and colleagues performed a retrospective cohort analysis of all Danish individuals with a known ABO blood group who were tested for SARS-CoV-2 between Feb. 27, 2020, and July 30, 2020.
Of the 841,327 people tested, ABO and RhD blood groups could be identified for 473,654 individuals. ABO and RhD data from 2,204,742 (38% of the entire Danish population) were used as a reference, according to the online report in Blood Advances.
The primary outcome was status of ABO and RhD blood groups and test results for SARS-CoV-2. The secondary outcomes followed were hospitalization and death from COVID-19.
Reduced prevalence
The study found that ABO blood groups varied significantly between patients and the reference group, with only 38.41% (95% confidence interval, 37.30%-39.50%) of the patients belonging to blood group O, compared with 41.70% (95% CI, 41.60%-41.80%) in the controls, corresponding to a relative risk of 0.87 (95% CI, 0.83-0.91) for acquiring COVID-19.
There was a slight, but statistically significant, difference in blood group distribution between the SARS-CoV-22 individuals and the reference population (P < .001), according to the authors.
Among the SARS-CoV-2 individuals, fewer group O individuals were found (P < .001); while more A, B, and AB individuals were seen (P < .001, P = .011, and P = .091, respectively). There was no significant difference seen among A, B, and AB blood groups (P = .30). The RR for contracting SARS-CoV-2 were 1.09 (95% CI, 1.04-1.14) for A group individuals; 1.06 (95% CI, 0.99-1.14) for B group; and 1.15 (95% CI, 1.03-1.27) for AB group, respectively.
There was no difference found in the RhD group between positive test cases and the reference population (P = .15). In addition, there was no statistical difference (all P > .40) between ABO blood groups and clinical severity of COVID-19 for nonhospitalized patients versus hospitalized patients or for deceased patients versus living patients, the researchers added.
Possible causes
The authors speculated on two possible causes of the lower prevalence of SARS-CoV-2 infection in the blood group O population. The first is that anti-A and anti-B antibodies may have an effect on neutralizing SARS-CoV viruses and that anti-A and anti-B are present on mucosal surfaces in some individuals lacking the corresponding ABO blood group. The second is that the association between ABO blood groups and levels of von Willebrand factor, which is higher in non-O individuals and is tied to an increased likelihood of arterial and venous thrombosis, could have an indirect or unknown impact on susceptibility to infection, according to the authors.
“Given the known increased risk of thrombosis in non-O individuals and the evolving central role for thrombosis in the pathogenesis of COVID-19, it is important to explore this aspect more closely in larger patient cohorts (e.g., by examining ABO blood type and viral load, the severity of symptoms, and the long-term effects following COVID-19),” the researchers concluded.
One author reported receiving fees from Bristol Myers Squibb, Novartis, and Roche. The remaining authors reported they had no competing financial interests.
SOURCE: Barnkob MB et al. Blood Adv. 2020 Oct 14. doi: 10.1182/bloodadvances.2020002657.
Blood group O was associated with a decreased risk for contracting SARS-CoV-2 infection, according to the results of large retrospective analysis of the Danish population.
Researchers Mike Bogetofte Barnkob, MD, of the Department of Clinical Immunology, Odense (Denmark) University Hospital, and colleagues performed a retrospective cohort analysis of all Danish individuals with a known ABO blood group who were tested for SARS-CoV-2 between Feb. 27, 2020, and July 30, 2020.
Of the 841,327 people tested, ABO and RhD blood groups could be identified for 473,654 individuals. ABO and RhD data from 2,204,742 (38% of the entire Danish population) were used as a reference, according to the online report in Blood Advances.
The primary outcome was status of ABO and RhD blood groups and test results for SARS-CoV-2. The secondary outcomes followed were hospitalization and death from COVID-19.
Reduced prevalence
The study found that ABO blood groups varied significantly between patients and the reference group, with only 38.41% (95% confidence interval, 37.30%-39.50%) of the patients belonging to blood group O, compared with 41.70% (95% CI, 41.60%-41.80%) in the controls, corresponding to a relative risk of 0.87 (95% CI, 0.83-0.91) for acquiring COVID-19.
There was a slight, but statistically significant, difference in blood group distribution between the SARS-CoV-22 individuals and the reference population (P < .001), according to the authors.
Among the SARS-CoV-2 individuals, fewer group O individuals were found (P < .001); while more A, B, and AB individuals were seen (P < .001, P = .011, and P = .091, respectively). There was no significant difference seen among A, B, and AB blood groups (P = .30). The RR for contracting SARS-CoV-2 were 1.09 (95% CI, 1.04-1.14) for A group individuals; 1.06 (95% CI, 0.99-1.14) for B group; and 1.15 (95% CI, 1.03-1.27) for AB group, respectively.
There was no difference found in the RhD group between positive test cases and the reference population (P = .15). In addition, there was no statistical difference (all P > .40) between ABO blood groups and clinical severity of COVID-19 for nonhospitalized patients versus hospitalized patients or for deceased patients versus living patients, the researchers added.
Possible causes
The authors speculated on two possible causes of the lower prevalence of SARS-CoV-2 infection in the blood group O population. The first is that anti-A and anti-B antibodies may have an effect on neutralizing SARS-CoV viruses and that anti-A and anti-B are present on mucosal surfaces in some individuals lacking the corresponding ABO blood group. The second is that the association between ABO blood groups and levels of von Willebrand factor, which is higher in non-O individuals and is tied to an increased likelihood of arterial and venous thrombosis, could have an indirect or unknown impact on susceptibility to infection, according to the authors.
“Given the known increased risk of thrombosis in non-O individuals and the evolving central role for thrombosis in the pathogenesis of COVID-19, it is important to explore this aspect more closely in larger patient cohorts (e.g., by examining ABO blood type and viral load, the severity of symptoms, and the long-term effects following COVID-19),” the researchers concluded.
One author reported receiving fees from Bristol Myers Squibb, Novartis, and Roche. The remaining authors reported they had no competing financial interests.
SOURCE: Barnkob MB et al. Blood Adv. 2020 Oct 14. doi: 10.1182/bloodadvances.2020002657.
Blood group O was associated with a decreased risk for contracting SARS-CoV-2 infection, according to the results of large retrospective analysis of the Danish population.
Researchers Mike Bogetofte Barnkob, MD, of the Department of Clinical Immunology, Odense (Denmark) University Hospital, and colleagues performed a retrospective cohort analysis of all Danish individuals with a known ABO blood group who were tested for SARS-CoV-2 between Feb. 27, 2020, and July 30, 2020.
Of the 841,327 people tested, ABO and RhD blood groups could be identified for 473,654 individuals. ABO and RhD data from 2,204,742 (38% of the entire Danish population) were used as a reference, according to the online report in Blood Advances.
The primary outcome was status of ABO and RhD blood groups and test results for SARS-CoV-2. The secondary outcomes followed were hospitalization and death from COVID-19.
Reduced prevalence
The study found that ABO blood groups varied significantly between patients and the reference group, with only 38.41% (95% confidence interval, 37.30%-39.50%) of the patients belonging to blood group O, compared with 41.70% (95% CI, 41.60%-41.80%) in the controls, corresponding to a relative risk of 0.87 (95% CI, 0.83-0.91) for acquiring COVID-19.
There was a slight, but statistically significant, difference in blood group distribution between the SARS-CoV-22 individuals and the reference population (P < .001), according to the authors.
Among the SARS-CoV-2 individuals, fewer group O individuals were found (P < .001); while more A, B, and AB individuals were seen (P < .001, P = .011, and P = .091, respectively). There was no significant difference seen among A, B, and AB blood groups (P = .30). The RR for contracting SARS-CoV-2 were 1.09 (95% CI, 1.04-1.14) for A group individuals; 1.06 (95% CI, 0.99-1.14) for B group; and 1.15 (95% CI, 1.03-1.27) for AB group, respectively.
There was no difference found in the RhD group between positive test cases and the reference population (P = .15). In addition, there was no statistical difference (all P > .40) between ABO blood groups and clinical severity of COVID-19 for nonhospitalized patients versus hospitalized patients or for deceased patients versus living patients, the researchers added.
Possible causes
The authors speculated on two possible causes of the lower prevalence of SARS-CoV-2 infection in the blood group O population. The first is that anti-A and anti-B antibodies may have an effect on neutralizing SARS-CoV viruses and that anti-A and anti-B are present on mucosal surfaces in some individuals lacking the corresponding ABO blood group. The second is that the association between ABO blood groups and levels of von Willebrand factor, which is higher in non-O individuals and is tied to an increased likelihood of arterial and venous thrombosis, could have an indirect or unknown impact on susceptibility to infection, according to the authors.
“Given the known increased risk of thrombosis in non-O individuals and the evolving central role for thrombosis in the pathogenesis of COVID-19, it is important to explore this aspect more closely in larger patient cohorts (e.g., by examining ABO blood type and viral load, the severity of symptoms, and the long-term effects following COVID-19),” the researchers concluded.
One author reported receiving fees from Bristol Myers Squibb, Novartis, and Roche. The remaining authors reported they had no competing financial interests.
SOURCE: Barnkob MB et al. Blood Adv. 2020 Oct 14. doi: 10.1182/bloodadvances.2020002657.
FROM BLOOD ADVANCES
Burosumab is a ‘game changer,’ effective in all subgroups of XLH
A recently approved agent, burosumab (Crysvita), was better than placebo across a range of efficacy outcomes for 14 predefined subgroups of adults with X-linked hypophosphatemia (XLH), new research shows.
The authors analyzed data from the initial 24-week randomized blinded phase of the pivotal phase 3 trial that led to regulatory approval of this drug in the United States in 2018 for XLH, a rare form of rickets characterized by low serum phosphorus levels, skeletal defects, pain, and stiffness.
As in the main analysis, in the subgroups, among patients who received burosumab, serum phosphorus levels were improved, and outcomes were better on the following measures: Western Ontario and McMaster Universities Arthritis Index (WOMAC) stiffness scale, the WOMAC physical function measure, and the Brief Pain Inventory (BPI), which were the main efficacy outcomes. Improvements were seen for many other outcomes as well.
Maria-Luisa Brandi, MD, Careggi University Hospital, Florence, Italy, presented the new subanalysis during the virtual American Society of Bone and Mineral Research (ASBMR) 2020 annual meeting.
The subgroup results were consistent with the overall trial findings, “showing a favorable direction of effect of burosumab relative to placebo” except for results in patients recruited in Asia and non-White patients; those results were considered inconclusive because there were too few participants in those categories, she told Medscape Medical News,.
Lorenz Hofbauer, MD, scientific chair of the ASBMR meeting, said that the take-away message is that the drug “works to reduce pain and disability” in adults with XLH with more severe/less severe symptoms, and “it provides new hope for many patients suffering from this disease,” he told Medscape Medical News.
Burosemab also appears superior to what has previously been considered standard therapy for XLH, phosphate/calcitriol, the experts say.
‘Rare is relative,’ burosumab is a ‘transformative therapy’
“The disease prevalence is 1 to 9 in a million,” Brandi said. “Undiagnosed adults are treated by the doctor that makes the diagnosis, usually a nephrologist or a rheumatologist or a bone doctor; this depends on the prevalent complications in a given patient. The endocrinologist who treats this patient is the one expert in bone disorders.”
Hofbauer noted, however, that “[r]are is relative. If you run a bone clinic, you will see four to five patients with XLH; if you are a regional center, 20 to 30 patients. People with rare disease travel more than 1000 miles to see experts.”
The US Food and Drug Administration approved burosumab for use in children and adults with XLH 2 years ago. The European Medicines Agency (EMA) approved it for use in children.
The drug is expected to be approved by the EMA for adults with XLH some time this year, said Hofbauer, who is from Dresden Technical University, Dresden, Germany.
Burosumab is a “game changer” with respect to previous treatments, he stressed.
This study is one of the top five clinical abstracts of the ASBMR meeting, which are selected on the basis of “scientific content/novelty, making a difference in clinical practice,” Hofbauer explained. He noted that “new drugs that work are always in the top ranks.”
Craig Munns, PhD, who was senior author of a recent review about burosumab, agrees.
“Burosumab is transformative, as it is a paradigm shift in the way we manage XLH,” he told Medscape Medical News.
“Standard therapy for children is with oral phosphate and calcitriol, and many adults do not receive any therapy,” said Munns, from the University of Sydney, Sydney, Australia.
“Phosphate and calcitriol need to be taken multiple times per day, is an incomplete therapy, and has many complications. Burosumab offers a 2-weekly (children) or 4-weekly (adult) dosing regime with superior outcomes compared to no treatment or phosphate/calcitriol,” he emphasized.
Efficacy in 14 predefined subgroups
“Burosumab is an anti-FGF-23 [anti–fibroblast growth factor-23] antibody for a rare genetic disease, XLH, in which the gene for PHEX is defective,” Hofbauer explained.
“PHEX is an enzyme that clears FGF-23; if it does not work, then FGF-23 accumulates in the body and causes phosphate wasting with wide consequences for bone, muscle, and joints. Burosumab is a smart approach, since it blocks these excessive FGF-23 effects.”
Children with XLH have rickets, deformities in the lower skeleton, and short stature, Brandi noted, whereas adults have fractures, pseudofractures, enthesopathy (calcification of joint capsule, tendon insertions, and ligaments), pain, stiffness, and impaired physical function.
However, “treatment with oral phosphate and vitamin D is associated with nephrocalcinosis and hyperparathyroidism,” she said.
In the phase 3 trial, 134 adults (aged 18 to 65 years) with XLH were randomly assigned in a double-blind manner to receive either burosumab or placebo for 24 weeks, followed by 24 weeks of open-label burosumab. The patients’ serum phosphorus levels were <2.5 mg/dL, and they were experiencing measurable bone/joint pain.
Baseline characteristics were similar for the patients who received placebo (66) and those who received burosumab (68). The mean age of the patients was 40 years; 65% were women; and 81% were White.
The current exploratory analysis examined efficacy outcomes in patients grouped according to the following factors and characteristics: sex; age (≤41 years or >41 years); race (non-White, White); region (Asia, North America/Europe); baseline WOMAC pain score; WOMAC total pain; WOMAC stiffness; WOMAC physical function; BPI worst pain; BPI average pain; opioid use; pain medication use; active fractures and pseudofractures; and 6-minute walking test distance.
The efficacy outcomes were as follows: serum phosphorus level (primary outcome), BPI worst pain, WOMAC stiffness, and WOMAC physical function (key secondary outcomes); and WOMAC pain, WOMAC total score, BPI average pain, BPI pain interference, BPI worst fatigue, BPI global score, patient global impression (PGI), and 6-minute walking distance.
In the overall cohort, at 24 weeks, in comparison with patients who received placebo, patients who received burosumab had favorable responses with respect to serum phosphorus level, WOMAC stiffness (P =. 012),WOMAC physical function (P = .048), and BPI worst pain (P = .092, not significant), as well as significant improvements in WOMAC total score and the 6-minute walk test. There were nonsignificant improvements in WOMAC pain and BPI average pain.
In the subgroup analysis, burosumab was superior to placebo for the primary outcome (serum phosphorus) in all subgroups. It was also superior to placebo for the key secondary outcomes (worst pain, stiffness, and physical function) across all subgroups except for patients from Asia (18 patients) and non-White patients (26).
The study was funded by Kyowa Kirin in partnership with Ultragenyx. Brandi receives consultancy and speaker fees as well as research grants from Kyowa Kirin and other pharmaceutical companies. Munns has received research funding from Kyowa Kirin.
This article first appeared on Medscape.com.
A recently approved agent, burosumab (Crysvita), was better than placebo across a range of efficacy outcomes for 14 predefined subgroups of adults with X-linked hypophosphatemia (XLH), new research shows.
The authors analyzed data from the initial 24-week randomized blinded phase of the pivotal phase 3 trial that led to regulatory approval of this drug in the United States in 2018 for XLH, a rare form of rickets characterized by low serum phosphorus levels, skeletal defects, pain, and stiffness.
As in the main analysis, in the subgroups, among patients who received burosumab, serum phosphorus levels were improved, and outcomes were better on the following measures: Western Ontario and McMaster Universities Arthritis Index (WOMAC) stiffness scale, the WOMAC physical function measure, and the Brief Pain Inventory (BPI), which were the main efficacy outcomes. Improvements were seen for many other outcomes as well.
Maria-Luisa Brandi, MD, Careggi University Hospital, Florence, Italy, presented the new subanalysis during the virtual American Society of Bone and Mineral Research (ASBMR) 2020 annual meeting.
The subgroup results were consistent with the overall trial findings, “showing a favorable direction of effect of burosumab relative to placebo” except for results in patients recruited in Asia and non-White patients; those results were considered inconclusive because there were too few participants in those categories, she told Medscape Medical News,.
Lorenz Hofbauer, MD, scientific chair of the ASBMR meeting, said that the take-away message is that the drug “works to reduce pain and disability” in adults with XLH with more severe/less severe symptoms, and “it provides new hope for many patients suffering from this disease,” he told Medscape Medical News.
Burosemab also appears superior to what has previously been considered standard therapy for XLH, phosphate/calcitriol, the experts say.
‘Rare is relative,’ burosumab is a ‘transformative therapy’
“The disease prevalence is 1 to 9 in a million,” Brandi said. “Undiagnosed adults are treated by the doctor that makes the diagnosis, usually a nephrologist or a rheumatologist or a bone doctor; this depends on the prevalent complications in a given patient. The endocrinologist who treats this patient is the one expert in bone disorders.”
Hofbauer noted, however, that “[r]are is relative. If you run a bone clinic, you will see four to five patients with XLH; if you are a regional center, 20 to 30 patients. People with rare disease travel more than 1000 miles to see experts.”
The US Food and Drug Administration approved burosumab for use in children and adults with XLH 2 years ago. The European Medicines Agency (EMA) approved it for use in children.
The drug is expected to be approved by the EMA for adults with XLH some time this year, said Hofbauer, who is from Dresden Technical University, Dresden, Germany.
Burosumab is a “game changer” with respect to previous treatments, he stressed.
This study is one of the top five clinical abstracts of the ASBMR meeting, which are selected on the basis of “scientific content/novelty, making a difference in clinical practice,” Hofbauer explained. He noted that “new drugs that work are always in the top ranks.”
Craig Munns, PhD, who was senior author of a recent review about burosumab, agrees.
“Burosumab is transformative, as it is a paradigm shift in the way we manage XLH,” he told Medscape Medical News.
“Standard therapy for children is with oral phosphate and calcitriol, and many adults do not receive any therapy,” said Munns, from the University of Sydney, Sydney, Australia.
“Phosphate and calcitriol need to be taken multiple times per day, is an incomplete therapy, and has many complications. Burosumab offers a 2-weekly (children) or 4-weekly (adult) dosing regime with superior outcomes compared to no treatment or phosphate/calcitriol,” he emphasized.
Efficacy in 14 predefined subgroups
“Burosumab is an anti-FGF-23 [anti–fibroblast growth factor-23] antibody for a rare genetic disease, XLH, in which the gene for PHEX is defective,” Hofbauer explained.
“PHEX is an enzyme that clears FGF-23; if it does not work, then FGF-23 accumulates in the body and causes phosphate wasting with wide consequences for bone, muscle, and joints. Burosumab is a smart approach, since it blocks these excessive FGF-23 effects.”
Children with XLH have rickets, deformities in the lower skeleton, and short stature, Brandi noted, whereas adults have fractures, pseudofractures, enthesopathy (calcification of joint capsule, tendon insertions, and ligaments), pain, stiffness, and impaired physical function.
However, “treatment with oral phosphate and vitamin D is associated with nephrocalcinosis and hyperparathyroidism,” she said.
In the phase 3 trial, 134 adults (aged 18 to 65 years) with XLH were randomly assigned in a double-blind manner to receive either burosumab or placebo for 24 weeks, followed by 24 weeks of open-label burosumab. The patients’ serum phosphorus levels were <2.5 mg/dL, and they were experiencing measurable bone/joint pain.
Baseline characteristics were similar for the patients who received placebo (66) and those who received burosumab (68). The mean age of the patients was 40 years; 65% were women; and 81% were White.
The current exploratory analysis examined efficacy outcomes in patients grouped according to the following factors and characteristics: sex; age (≤41 years or >41 years); race (non-White, White); region (Asia, North America/Europe); baseline WOMAC pain score; WOMAC total pain; WOMAC stiffness; WOMAC physical function; BPI worst pain; BPI average pain; opioid use; pain medication use; active fractures and pseudofractures; and 6-minute walking test distance.
The efficacy outcomes were as follows: serum phosphorus level (primary outcome), BPI worst pain, WOMAC stiffness, and WOMAC physical function (key secondary outcomes); and WOMAC pain, WOMAC total score, BPI average pain, BPI pain interference, BPI worst fatigue, BPI global score, patient global impression (PGI), and 6-minute walking distance.
In the overall cohort, at 24 weeks, in comparison with patients who received placebo, patients who received burosumab had favorable responses with respect to serum phosphorus level, WOMAC stiffness (P =. 012),WOMAC physical function (P = .048), and BPI worst pain (P = .092, not significant), as well as significant improvements in WOMAC total score and the 6-minute walk test. There were nonsignificant improvements in WOMAC pain and BPI average pain.
In the subgroup analysis, burosumab was superior to placebo for the primary outcome (serum phosphorus) in all subgroups. It was also superior to placebo for the key secondary outcomes (worst pain, stiffness, and physical function) across all subgroups except for patients from Asia (18 patients) and non-White patients (26).
The study was funded by Kyowa Kirin in partnership with Ultragenyx. Brandi receives consultancy and speaker fees as well as research grants from Kyowa Kirin and other pharmaceutical companies. Munns has received research funding from Kyowa Kirin.
This article first appeared on Medscape.com.
A recently approved agent, burosumab (Crysvita), was better than placebo across a range of efficacy outcomes for 14 predefined subgroups of adults with X-linked hypophosphatemia (XLH), new research shows.
The authors analyzed data from the initial 24-week randomized blinded phase of the pivotal phase 3 trial that led to regulatory approval of this drug in the United States in 2018 for XLH, a rare form of rickets characterized by low serum phosphorus levels, skeletal defects, pain, and stiffness.
As in the main analysis, in the subgroups, among patients who received burosumab, serum phosphorus levels were improved, and outcomes were better on the following measures: Western Ontario and McMaster Universities Arthritis Index (WOMAC) stiffness scale, the WOMAC physical function measure, and the Brief Pain Inventory (BPI), which were the main efficacy outcomes. Improvements were seen for many other outcomes as well.
Maria-Luisa Brandi, MD, Careggi University Hospital, Florence, Italy, presented the new subanalysis during the virtual American Society of Bone and Mineral Research (ASBMR) 2020 annual meeting.
The subgroup results were consistent with the overall trial findings, “showing a favorable direction of effect of burosumab relative to placebo” except for results in patients recruited in Asia and non-White patients; those results were considered inconclusive because there were too few participants in those categories, she told Medscape Medical News,.
Lorenz Hofbauer, MD, scientific chair of the ASBMR meeting, said that the take-away message is that the drug “works to reduce pain and disability” in adults with XLH with more severe/less severe symptoms, and “it provides new hope for many patients suffering from this disease,” he told Medscape Medical News.
Burosemab also appears superior to what has previously been considered standard therapy for XLH, phosphate/calcitriol, the experts say.
‘Rare is relative,’ burosumab is a ‘transformative therapy’
“The disease prevalence is 1 to 9 in a million,” Brandi said. “Undiagnosed adults are treated by the doctor that makes the diagnosis, usually a nephrologist or a rheumatologist or a bone doctor; this depends on the prevalent complications in a given patient. The endocrinologist who treats this patient is the one expert in bone disorders.”
Hofbauer noted, however, that “[r]are is relative. If you run a bone clinic, you will see four to five patients with XLH; if you are a regional center, 20 to 30 patients. People with rare disease travel more than 1000 miles to see experts.”
The US Food and Drug Administration approved burosumab for use in children and adults with XLH 2 years ago. The European Medicines Agency (EMA) approved it for use in children.
The drug is expected to be approved by the EMA for adults with XLH some time this year, said Hofbauer, who is from Dresden Technical University, Dresden, Germany.
Burosumab is a “game changer” with respect to previous treatments, he stressed.
This study is one of the top five clinical abstracts of the ASBMR meeting, which are selected on the basis of “scientific content/novelty, making a difference in clinical practice,” Hofbauer explained. He noted that “new drugs that work are always in the top ranks.”
Craig Munns, PhD, who was senior author of a recent review about burosumab, agrees.
“Burosumab is transformative, as it is a paradigm shift in the way we manage XLH,” he told Medscape Medical News.
“Standard therapy for children is with oral phosphate and calcitriol, and many adults do not receive any therapy,” said Munns, from the University of Sydney, Sydney, Australia.
“Phosphate and calcitriol need to be taken multiple times per day, is an incomplete therapy, and has many complications. Burosumab offers a 2-weekly (children) or 4-weekly (adult) dosing regime with superior outcomes compared to no treatment or phosphate/calcitriol,” he emphasized.
Efficacy in 14 predefined subgroups
“Burosumab is an anti-FGF-23 [anti–fibroblast growth factor-23] antibody for a rare genetic disease, XLH, in which the gene for PHEX is defective,” Hofbauer explained.
“PHEX is an enzyme that clears FGF-23; if it does not work, then FGF-23 accumulates in the body and causes phosphate wasting with wide consequences for bone, muscle, and joints. Burosumab is a smart approach, since it blocks these excessive FGF-23 effects.”
Children with XLH have rickets, deformities in the lower skeleton, and short stature, Brandi noted, whereas adults have fractures, pseudofractures, enthesopathy (calcification of joint capsule, tendon insertions, and ligaments), pain, stiffness, and impaired physical function.
However, “treatment with oral phosphate and vitamin D is associated with nephrocalcinosis and hyperparathyroidism,” she said.
In the phase 3 trial, 134 adults (aged 18 to 65 years) with XLH were randomly assigned in a double-blind manner to receive either burosumab or placebo for 24 weeks, followed by 24 weeks of open-label burosumab. The patients’ serum phosphorus levels were <2.5 mg/dL, and they were experiencing measurable bone/joint pain.
Baseline characteristics were similar for the patients who received placebo (66) and those who received burosumab (68). The mean age of the patients was 40 years; 65% were women; and 81% were White.
The current exploratory analysis examined efficacy outcomes in patients grouped according to the following factors and characteristics: sex; age (≤41 years or >41 years); race (non-White, White); region (Asia, North America/Europe); baseline WOMAC pain score; WOMAC total pain; WOMAC stiffness; WOMAC physical function; BPI worst pain; BPI average pain; opioid use; pain medication use; active fractures and pseudofractures; and 6-minute walking test distance.
The efficacy outcomes were as follows: serum phosphorus level (primary outcome), BPI worst pain, WOMAC stiffness, and WOMAC physical function (key secondary outcomes); and WOMAC pain, WOMAC total score, BPI average pain, BPI pain interference, BPI worst fatigue, BPI global score, patient global impression (PGI), and 6-minute walking distance.
In the overall cohort, at 24 weeks, in comparison with patients who received placebo, patients who received burosumab had favorable responses with respect to serum phosphorus level, WOMAC stiffness (P =. 012),WOMAC physical function (P = .048), and BPI worst pain (P = .092, not significant), as well as significant improvements in WOMAC total score and the 6-minute walk test. There were nonsignificant improvements in WOMAC pain and BPI average pain.
In the subgroup analysis, burosumab was superior to placebo for the primary outcome (serum phosphorus) in all subgroups. It was also superior to placebo for the key secondary outcomes (worst pain, stiffness, and physical function) across all subgroups except for patients from Asia (18 patients) and non-White patients (26).
The study was funded by Kyowa Kirin in partnership with Ultragenyx. Brandi receives consultancy and speaker fees as well as research grants from Kyowa Kirin and other pharmaceutical companies. Munns has received research funding from Kyowa Kirin.
This article first appeared on Medscape.com.