User login
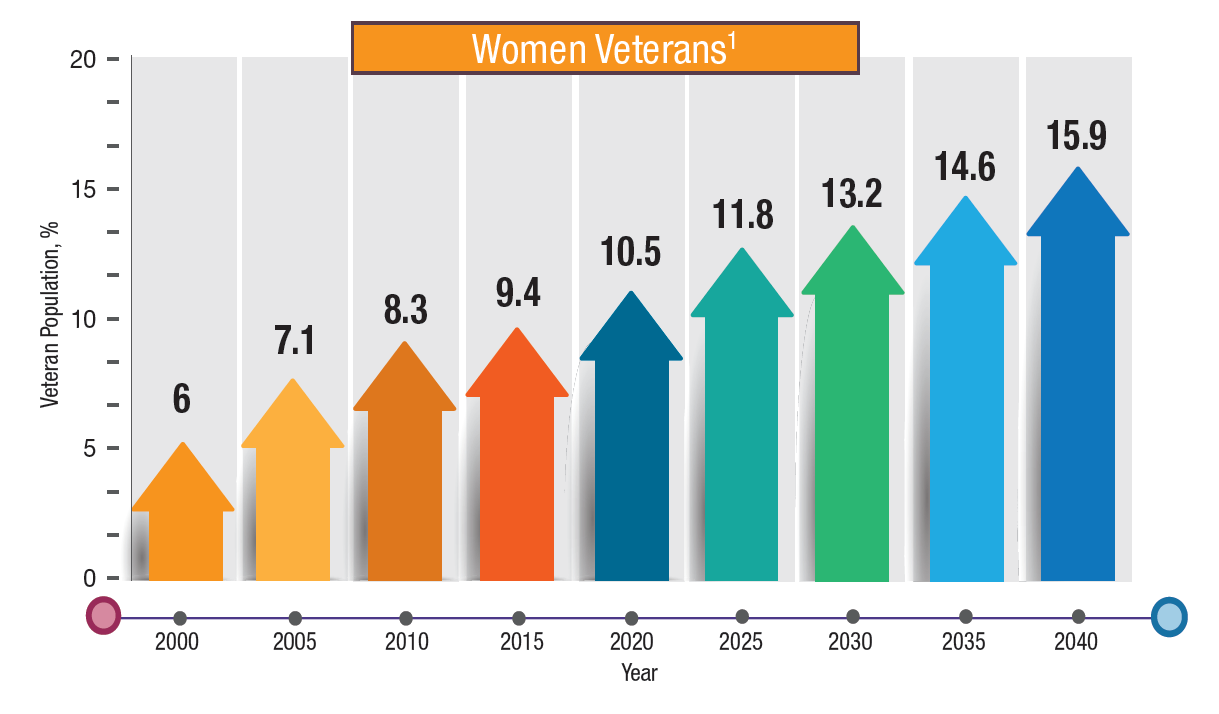
The number and impact of active-duty and veteran women continue to grow, as do their health care needs. For many years, the health care needs of women received little attention in the DoD and VA, but that is finally changing. Women now make up nearly 10% of the veteran population, a rise of more than 80% since 2005. By 2043, the VA projects that women will make up 16.3% of all veterans. The total population of women veterans is expected to continue to increase by about 18,000 women per year over the next 10 years.
The demographics of women veterans differ from that of their male counterparts in important ways. For example, 25% of women veterans served only during peace times, while 56% served during the post-9/11 era. Not surprisingly then, women veterans are much younger than male veterans, with a median age of 49 years. Nineteen percent of women veterans were African American, which is much higher than the percentage for male veterans. However Hispanic and Asian women are underrepresented when compared with men. Women veterans were more likely to have ever married than nonveteran women: 84% were currently married, divorced, widowed, or separated compared with 72% of nonveteran women.
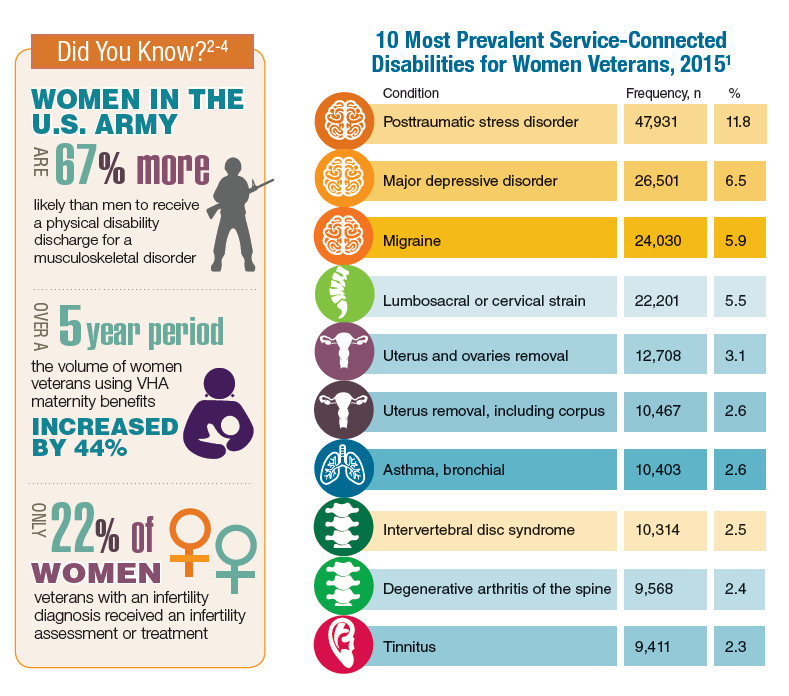
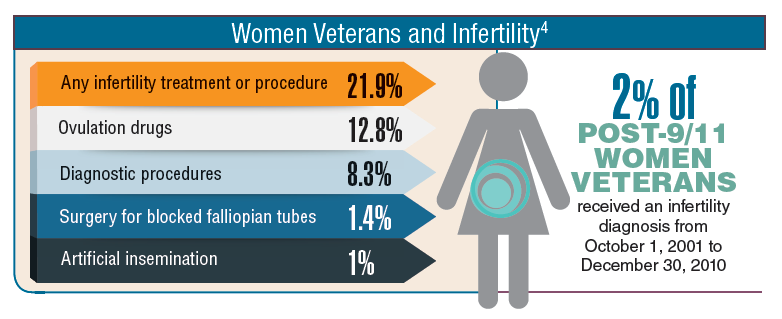
Many of the health care needs of women veterans mirror that of their male counterparts. The most common service-connected disabilities for women are posttraumatic stress disorder, depression, and musculoskeletal pain. However, the VHA and DoD are moving to provide maternity and infertility treatment to active-duty and veteran women.
Click here to read the digital edition.
The number and impact of active-duty and veteran women continue to grow, as do their health care needs. For many years, the health care needs of women received little attention in the DoD and VA, but that is finally changing. Women now make up nearly 10% of the veteran population, a rise of more than 80% since 2005. By 2043, the VA projects that women will make up 16.3% of all veterans. The total population of women veterans is expected to continue to increase by about 18,000 women per year over the next 10 years.
The demographics of women veterans differ from that of their male counterparts in important ways. For example, 25% of women veterans served only during peace times, while 56% served during the post-9/11 era. Not surprisingly then, women veterans are much younger than male veterans, with a median age of 49 years. Nineteen percent of women veterans were African American, which is much higher than the percentage for male veterans. However Hispanic and Asian women are underrepresented when compared with men. Women veterans were more likely to have ever married than nonveteran women: 84% were currently married, divorced, widowed, or separated compared with 72% of nonveteran women.
Many of the health care needs of women veterans mirror that of their male counterparts. The most common service-connected disabilities for women are posttraumatic stress disorder, depression, and musculoskeletal pain. However, the VHA and DoD are moving to provide maternity and infertility treatment to active-duty and veteran women.
Click here to read the digital edition.
The number and impact of active-duty and veteran women continue to grow, as do their health care needs. For many years, the health care needs of women received little attention in the DoD and VA, but that is finally changing. Women now make up nearly 10% of the veteran population, a rise of more than 80% since 2005. By 2043, the VA projects that women will make up 16.3% of all veterans. The total population of women veterans is expected to continue to increase by about 18,000 women per year over the next 10 years.
The demographics of women veterans differ from that of their male counterparts in important ways. For example, 25% of women veterans served only during peace times, while 56% served during the post-9/11 era. Not surprisingly then, women veterans are much younger than male veterans, with a median age of 49 years. Nineteen percent of women veterans were African American, which is much higher than the percentage for male veterans. However Hispanic and Asian women are underrepresented when compared with men. Women veterans were more likely to have ever married than nonveteran women: 84% were currently married, divorced, widowed, or separated compared with 72% of nonveteran women.
Many of the health care needs of women veterans mirror that of their male counterparts. The most common service-connected disabilities for women are posttraumatic stress disorder, depression, and musculoskeletal pain. However, the VHA and DoD are moving to provide maternity and infertility treatment to active-duty and veteran women.