User login
Clinical Endocrinology News is an independent news source that provides endocrinologists with timely and relevant news and commentary about clinical developments and the impact of health care policy on the endocrinologist's practice. Specialty topics include Diabetes, Lipid & Metabolic Disorders Menopause, Obesity, Osteoporosis, Pediatric Endocrinology, Pituitary, Thyroid & Adrenal Disorders, and Reproductive Endocrinology. Featured content includes Commentaries, Implementin Health Reform, Law & Medicine, and In the Loop, the blog of Clinical Endocrinology News. Clinical Endocrinology News is owned by Frontline Medical Communications.
addict
addicted
addicting
addiction
adult sites
alcohol
antibody
ass
attorney
audit
auditor
babies
babpa
baby
ban
banned
banning
best
bisexual
bitch
bleach
blog
blow job
bondage
boobs
booty
buy
cannabis
certificate
certification
certified
cheap
cheapest
class action
cocaine
cock
counterfeit drug
crack
crap
crime
criminal
cunt
curable
cure
dangerous
dangers
dead
deadly
death
defend
defended
depedent
dependence
dependent
detergent
dick
die
dildo
drug abuse
drug recall
dying
fag
fake
fatal
fatalities
fatality
free
fuck
gangs
gingivitis
guns
hardcore
herbal
herbs
heroin
herpes
home remedies
homo
horny
hypersensitivity
hypoglycemia treatment
illegal drug use
illegal use of prescription
incest
infant
infants
job
ketoacidosis
kill
killer
killing
kinky
law suit
lawsuit
lawyer
lesbian
marijuana
medicine for hypoglycemia
murder
naked
natural
newborn
nigger
noise
nude
nudity
orgy
over the counter
overdosage
overdose
overdosed
overdosing
penis
pimp
pistol
porn
porno
pornographic
pornography
prison
profanity
purchase
purchasing
pussy
queer
rape
rapist
recall
recreational drug
rob
robberies
sale
sales
sex
sexual
shit
shoot
slut
slutty
stole
stolen
store
sue
suicidal
suicide
supplements
supply company
theft
thief
thieves
tit
toddler
toddlers
toxic
toxin
tragedy
treating dka
treating hypoglycemia
treatment for hypoglycemia
vagina
violence
whore
withdrawal
without prescription
section[contains(@class, 'nav-hidden')]
footer[@id='footer']
div[contains(@class, 'pane-pub-article-imn')]
div[contains(@class, 'pane-pub-home-imn')]
div[contains(@class, 'pane-pub-topic-imn')]
div[contains(@class, 'panel-panel-inner')]
div[contains(@class, 'pane-node-field-article-topics')]
section[contains(@class, 'footer-nav-section-wrapper')]
How Lp(a) can help improve ASCVD risk assessment
A look back at a pair of large cohort studies suggests a telling relation between two distinct predictors of atherosclerotic cardiovascular disease (ASCVD) risk and may offer guidance on how to interpret them together.
Elevated levels of lipoprotein(a), or Lp(a), and high coronary artery calcium (CAC) scores were both predictive of ASCVD risk over 10 years, but independent of each other and a host of more traditional cardiovascular risk factors, for example, in the analysis of data from the MESA (Multi-Ethnic Study of Atherosclerosis) and DHS (Dallas Heart Study) longitudinal cohorts.
Notably, the risk when both Lp(a) and CAC scores were high far exceeded that associated with either marker alone. But when CAC scores were less than 100 Agatston units, predicted ASCVD risk wasn’t influenced by levels of Lp(a). Indeed, a CAC score of 0 predicted the lowest levels of ASCVD risk, even with elevated Lp(a).
That is, the findings suggest, the addition of Lp(a) makes a difference to the risk assessment only when CAC scores are high, at least 100 units, and elevated Lp(a) doesn’t mean increased ASCVD risk in the absence of coronary calcium.
“Our novel findings indicate that elevated Lp(a) drives ASCVD risk independent of the subclinical coronary atherosclerosis burden captured by CAC score,” concluded a report on the analysis, published in the Journal of the American College of Cardiology, with lead author Anurag Mehta, MD, Emory University, Atlanta.
There are no formal recommendations on how to interpret Lp(a) and CAC scores together, but the current findings “provide impetus for measuring Lp(a) in more individuals as part of the shared decision-making process,” the authors contended.
“Really, the calcium score carries the majority of the information in terms of risk, except in the highest CAC score group. That is, if you have a high Lp(a) and a high burden of calcium, your risk is significantly higher than if you just have the high calcium score and the normal Lp(a),” senior author Parag H. Joshi, MD, MHS, said in an interview.
“We thought we would see that the group with higher Lp(a) would have more events over 10 years, even among those who didn’t have coronary calcium,” said Dr. Joshi, of the University of Texas Southwestern Medical Center, Dallas. “But we really don’t see that, at least in a statistically significant way.”
A CAC score of 0 would at least support a more conservative approach in a patient with elevated Lp(a) “who is hesitant to be on a statin or to be more aggressive managing their risk,” Dr. Joshi said.
“This study should be very reassuring for a patient like that,” Ron Blankstein, MD, director of cardiac computed tomography at Brigham and Women’s Hospital, Boston, said in an interview.
“If you have a high Lp(a) and you’re concerned, I think this study really supports the role of calcium scoring for further risk assessment,” said Dr. Blankstein, who is not associated with the new report. “We often check Lp(a) in individuals who perhaps have a family history or who come to see us in a preventive cardiology clinic. If it is high and there is concern, a calcium score can be very helpful. If it’s zero, that really means a very low risk of events. And if it’s elevated, I think we’re going to be more concerned about that patient.”
The current analysis suggests “that, when a patient without clinical cardiovascular disease is identified with either CAC ≥100 or Lp(a) >50 mg/dL, the next step in the risk evaluation should be to measure either Lp(a) or CAC, respectively – if not already performed – to identify the patients at highest risk,” Sotirios Tsimikas, MD, director of vascular medicine at University of California, San Diego, wrote in an accompanying editorial.
“Both Lp(a) and CAC should be more broadly applied in clinical care settings in patients without prior ASCVD to identify those that most likely will benefit from more aggressive therapy and, in the future, from Lp(a)-lowering therapies,” he wrote.
The analyses were conducted separately on data from 4,512 initially asymptomatic patients in MESA and 2,078 from the DHS cohort, who were followed for ASCVD events an average of 13 years and 11 years, respectively. Such events included coronary heart disease–related death, nonfatal MI, and fatal or nonfatal stroke.
In the MESA cohort – 52% women, 36.8% White, 29.3% Black, 22.2% Hispanic, and 11.7% Chinese – elevated Lp(a) (quintile 5 vs. quintiles 1-4) and CAC scores of 1-99 and above 100 (both compared with 0) were each independently associated with increased risk for ASCVD events. The hazard ratio was 1.29 (P = .02) for elevated Lp(a), 1.68 (P < .01) for a CAC score of 1-99, and 2.66 (P < .01) for a CAC score of at least 100.
The corresponding HRs in the DHS cohort were 1.54 (P = .07) for Lp(a), 3.32 (P < .01) for a CAC score of 1-99, and 5.21 (P < .01) for a CAC score of at least 100.
Of note, the authors wrote, ASCVD risk among MESA participants with a CAC score of 0 was not significantly different in those with normal and elevated Lp(a).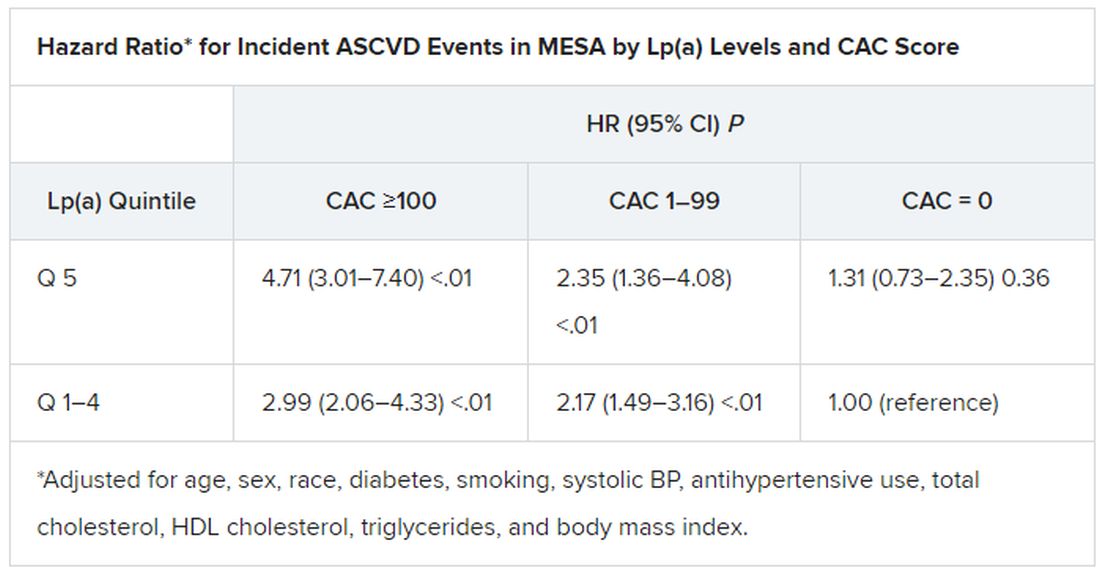
The findings were similar in the corresponding DHS analysis, the authors noted.
When both Lp(a) and CAC scores are considered as dichotomous variables, the highest 10-year ASCVD incidence in MESA was in participants with both elevated Lp(a) (≥50 mg/dL) and a high CAC score (≥100). The lowest risk was seen when Lp(a) was normal (<50 mg/dL) and the CAC score was no more than moderately high (<100).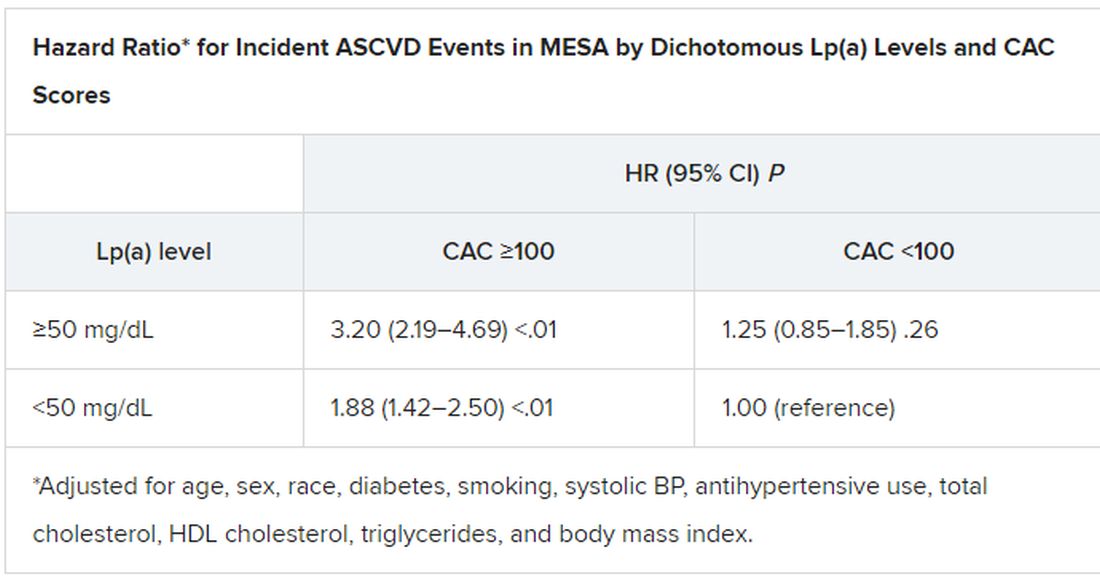
The results in the corresponding DHS analysis, according to the report, again mirrored those from MESA.
“This study has important implications for our patients and also potentially for future clinical trial design,” Dr. Blankstein noted. “A big part of developing a trial in this space is identifying the patients who are at higher risk,” and the current analysis supports CAC scores for identifying the highest-risk patient among those with elevated Lp(a).
Current wisdom is that, for the most part, Lp(a) levels are genetically mediated and are mostly unaffected by interventions such as diet management or exercise. It’s unknown whether reducing elevated Lp(a) levels pharmacologically will cut ASCVD risk, but there are a number of clinical trial programs currently aimed at learning just that. They include the Novartis-sponsored phase 3 HORIZON trial of the antisense agent pelacarsen (TQJ230), with an estimated enrollment of almost 7,700; a randomized, controlled dose-finding study of the small interfering RNA agent olpasiran (AMG890), with 290 patients and funded by Amgen; and an 88-patient phase 1 study of another siRNA agent, SLN360, supported by Silence Therapeutics.
Dr. Mehta reported no relevant relationships. Dr. Joshi has received grant support from Novo Nordisk and consulting income from Bayer and Regeneron; holds equity in G3 Therapeutics; and has served as site investigator for GlaxoSmithKline, Sanofi, AstraZeneca, and Novartis. Dr. Blankstein reported serving as a consultant to Amgen, Novartis, and Silence Therapeutics.
A version of this article first appeared on Medscape.com.
FROM THE JOURNAL OF THE AMERICAN COLLEGE OF CARDIOLOGY
Phthalate exposure via maternal and cord blood affects infant outcomes
Exposure to phthalates through maternal blood and cord blood affected outcomes including head circumference and anogenital index for male and female infants, according to data from 65 mother-infant pairs.
Phthalates are recognized endocrine disruptors that have been associated with adverse birth outcomes, but the specific relationship between maternal phthalate exposure and birth outcomes has not been well studied, wrote Hsiao-Lin Hwa, MD, of National Taiwan University, Taipei, and colleagues.
Previous research suggests that trace exposure to hazardous chemicals during the fetal period “may cause fetal metabolic dysfunction and adversely change the morphology of body systems,” they said. In 2011, “the Taiwan Food and Drug Administration found that di‐2‐ethylhexyl phthalate (DEHP) and DiNP [di‐isononyl phthalate] had been illegally added as emulsifiers to replace palm oil in beverages and food,” they added. The researchers sought to examine the association between infant birth outcomes and phthalate exposure levels in the Taiwanese population after 2011. In a study published in Environmental Toxicology and Chemistry, the researchers recruited 65 pregnant women in Taiwan between 2016 and 2017. Birth length, birth weight, head circumference, anogenital distance (AGD), anoscrotal distance (ASD), and anofourchette distance (AFD) were measured for each newborn at the time of delivery. The average age of the women was 33.6 years, and the rate of low birth weight was 13.7%. The mean measures of birth length, birth weight, head circumference, and chest circumference were 47.6 cm, 3022 g, 32.9 cm, and 30.8 mm, respectively. The mean AFD and ASD were 14.2 mm and 22.3 mm, respectively.
The researchers tested for 12 phthalates in maternal blood and cord blood samples. Of these, the six most frequently detected phthalate metabolites were mono‐ethyl phthalate (MEP), mono‐isobutyl phthalate (MiBP), mono‐n‐butyl phthalate (MnBP), mono‐(2‐ethyl‐5‐oxohexyl)‐phthalate (MEOHP), mono‐(2‐ethyl‐5‐hydroxyhexyl) phthalate (MEHHP), and mono‐n‐octyl phthalate (MOP); these six were present in 80%–100% of the maternal blood samples.
Overall, the mean levels of MEP, MiBP, MnBP, and MEHP were relatively higher in both maternal and infant blood than other phthalates, the researchers noted. The mean concentrations of metabolites in maternal blood and infant cord blood were 0.03-2.27 ng/mL and 0.01-3.74 ng/mL, respectively.
Among male infants, levels of MMP, MiBP, and MEHP in maternal blood were inversely related to anogenital index (AGI), with P values for regression coefficients ranging from .011 to .033. In addition, the total concentration of MEHP, MEOHP, and MEHHP (designated as Σdi‐2‐ethylhexyl phthalate, ΣDEHP) was inversely related to AGI in males.
Among female infants, however, phthalates in cord blood, rather than maternal blood, were positively related to AGI, including MMP, MibP, MnBP, and MOP, with P values for regression coefficients ranging from .001 to .034.
Cord blood levels of MnBP, MEOHP, MEHP, and ΣDEHP were inversely associated with gestational age-adjusted head circumference in all infants, with beta coefficients of –0.15, –0.12, –0.01, and –0.01, respectively (P < .05 for all).
“The detection rates of MEHHP, MEOHP, and MEHP in the cord blood were lower than those in the maternal blood, particularly those of MEHHP and MEOHP, which were approximately 25% lower,” which may be caused by slow placental transfer, the researchers wrote in their discussion section. “The high detection rate of phthalate metabolites indicated that our subjects may continue to be exposed to these phthalates even after the 2011 Taiwan DEHP incident,” they noted.
The study findings were limited by several factors including the possibility for contamination of samples and other environmental confounders, the researchers noted. However, the results support the role of phthalates as endocrine disruptors, and the distinction in effects between males and females “may suggest that phthalate monoesters are potentially estrogenic and antiandrogenic chemicals,” they added.
“Further investigations involving multiple phthalate analyses during pregnancy and measurements throughout childhood are necessary to confirm our findings,” they concluded.
Direct clinical implications remain uncertain
“Phthalates are a group of chemicals that are used to make plastic more durable; they are found in multiple everyday materials, food products, and common household products,” Marissa Platner, MD, of Emory University, Atlanta, said in an interview. “It is known that we are exposed to phthalates on a routine basis but the long-term effects of this exposure are unclear,” she said.

The current study findings “were not entirely surprising given data from prior animal studies because they do imply that there is some placental transfer of the phthalate metabolites that can cause adverse effects on the developing fetus,” said Dr. Platner. “However, they also demonstrate that the placenta acts as a filter for certain larger molecules to protect the fetus,” she said.
“This study was based on a small sample size, therefore the clinical implications are not clear,” Dr. Platner noted. “However it may be worthwhile after further research to encourage our pregnant patients to try to decrease their exposure to phthalates,” she said.
Dr. Platner identified two areas for additional research to explore the role of phthalate exposure.
“The first would be to assess the level of maternal phthalate exposure throughout the pregnancy instead of just at one point in time, and the second would be to assess how the reproductive system differences at birth translate to long-term outcomes in children, such as early puberty in females or decreased fertility in males,” she said.
The study was funded by the Ministry of Science and Technology of Taiwan and the Far Eastern Memorial Hospital‐National Taiwan University Hospital. The researchers and Dr. Platner had no financial conflicts to disclose.
Exposure to phthalates through maternal blood and cord blood affected outcomes including head circumference and anogenital index for male and female infants, according to data from 65 mother-infant pairs.
Phthalates are recognized endocrine disruptors that have been associated with adverse birth outcomes, but the specific relationship between maternal phthalate exposure and birth outcomes has not been well studied, wrote Hsiao-Lin Hwa, MD, of National Taiwan University, Taipei, and colleagues.
Previous research suggests that trace exposure to hazardous chemicals during the fetal period “may cause fetal metabolic dysfunction and adversely change the morphology of body systems,” they said. In 2011, “the Taiwan Food and Drug Administration found that di‐2‐ethylhexyl phthalate (DEHP) and DiNP [di‐isononyl phthalate] had been illegally added as emulsifiers to replace palm oil in beverages and food,” they added. The researchers sought to examine the association between infant birth outcomes and phthalate exposure levels in the Taiwanese population after 2011. In a study published in Environmental Toxicology and Chemistry, the researchers recruited 65 pregnant women in Taiwan between 2016 and 2017. Birth length, birth weight, head circumference, anogenital distance (AGD), anoscrotal distance (ASD), and anofourchette distance (AFD) were measured for each newborn at the time of delivery. The average age of the women was 33.6 years, and the rate of low birth weight was 13.7%. The mean measures of birth length, birth weight, head circumference, and chest circumference were 47.6 cm, 3022 g, 32.9 cm, and 30.8 mm, respectively. The mean AFD and ASD were 14.2 mm and 22.3 mm, respectively.
The researchers tested for 12 phthalates in maternal blood and cord blood samples. Of these, the six most frequently detected phthalate metabolites were mono‐ethyl phthalate (MEP), mono‐isobutyl phthalate (MiBP), mono‐n‐butyl phthalate (MnBP), mono‐(2‐ethyl‐5‐oxohexyl)‐phthalate (MEOHP), mono‐(2‐ethyl‐5‐hydroxyhexyl) phthalate (MEHHP), and mono‐n‐octyl phthalate (MOP); these six were present in 80%–100% of the maternal blood samples.
Overall, the mean levels of MEP, MiBP, MnBP, and MEHP were relatively higher in both maternal and infant blood than other phthalates, the researchers noted. The mean concentrations of metabolites in maternal blood and infant cord blood were 0.03-2.27 ng/mL and 0.01-3.74 ng/mL, respectively.
Among male infants, levels of MMP, MiBP, and MEHP in maternal blood were inversely related to anogenital index (AGI), with P values for regression coefficients ranging from .011 to .033. In addition, the total concentration of MEHP, MEOHP, and MEHHP (designated as Σdi‐2‐ethylhexyl phthalate, ΣDEHP) was inversely related to AGI in males.
Among female infants, however, phthalates in cord blood, rather than maternal blood, were positively related to AGI, including MMP, MibP, MnBP, and MOP, with P values for regression coefficients ranging from .001 to .034.
Cord blood levels of MnBP, MEOHP, MEHP, and ΣDEHP were inversely associated with gestational age-adjusted head circumference in all infants, with beta coefficients of –0.15, –0.12, –0.01, and –0.01, respectively (P < .05 for all).
“The detection rates of MEHHP, MEOHP, and MEHP in the cord blood were lower than those in the maternal blood, particularly those of MEHHP and MEOHP, which were approximately 25% lower,” which may be caused by slow placental transfer, the researchers wrote in their discussion section. “The high detection rate of phthalate metabolites indicated that our subjects may continue to be exposed to these phthalates even after the 2011 Taiwan DEHP incident,” they noted.
The study findings were limited by several factors including the possibility for contamination of samples and other environmental confounders, the researchers noted. However, the results support the role of phthalates as endocrine disruptors, and the distinction in effects between males and females “may suggest that phthalate monoesters are potentially estrogenic and antiandrogenic chemicals,” they added.
“Further investigations involving multiple phthalate analyses during pregnancy and measurements throughout childhood are necessary to confirm our findings,” they concluded.
Direct clinical implications remain uncertain
“Phthalates are a group of chemicals that are used to make plastic more durable; they are found in multiple everyday materials, food products, and common household products,” Marissa Platner, MD, of Emory University, Atlanta, said in an interview. “It is known that we are exposed to phthalates on a routine basis but the long-term effects of this exposure are unclear,” she said.
The current study findings “were not entirely surprising given data from prior animal studies because they do imply that there is some placental transfer of the phthalate metabolites that can cause adverse effects on the developing fetus,” said Dr. Platner. “However, they also demonstrate that the placenta acts as a filter for certain larger molecules to protect the fetus,” she said.
“This study was based on a small sample size, therefore the clinical implications are not clear,” Dr. Platner noted. “However it may be worthwhile after further research to encourage our pregnant patients to try to decrease their exposure to phthalates,” she said.
Dr. Platner identified two areas for additional research to explore the role of phthalate exposure.
“The first would be to assess the level of maternal phthalate exposure throughout the pregnancy instead of just at one point in time, and the second would be to assess how the reproductive system differences at birth translate to long-term outcomes in children, such as early puberty in females or decreased fertility in males,” she said.
The study was funded by the Ministry of Science and Technology of Taiwan and the Far Eastern Memorial Hospital‐National Taiwan University Hospital. The researchers and Dr. Platner had no financial conflicts to disclose.
FROM ENVIRONMENTAL TOXICOLOGY AND CHEMISTRY
What is the healthiest salt for you?
When we refer to “regular table salt,” it is most commonly in the form of sodium chloride, which is also a major constituent of packaged and ultraprocessed foods.
The best approach to finding the “healthiest salt” – which really means the lowest in sodium – is to look for the amount on the label. “Sodium-free” usually indicates less than 5 mg of sodium per serving, and “low-sodium” usually means 140 mg or less per serving. In contrast, regular table salt can contain as much as 560 mg of sodium in one serving.
Other en vogue salts, such as pink Himalayan salt, sea salt, and kosher salt, are high in sodium content – like regular table salt – but because of their larger crystal size, less sodium is delivered per serving.

Most salt substitutes are reduced in sodium, with the addition of potassium chloride instead.
FDA issues guidance on reducing salt
Currently, the U.S. sodium dietary guidelines for persons older than 14 stipulate 2,300 mg/d, which is equivalent to 1 teaspoon a day. However it is estimated that the average person in the United States consumes more than this – around 3,400 mg of sodium daily.
In October 2021, the U.S. Food and Drug Administration published guidance on voluntary sodium limitations in commercially processed, packaged, and prepared food. The FDA’s short-term approach is to slowly reduce exposure to sodium in processed and restaurant food by 2025, on the basis that people will eventually get used to less salt, as has happened in the United Kingdom and other countries.
Such strategies to reduce salt intake are now being used in national programs in several countries. Many of these successful initiatives include active engagement with the food industry to reduce the amount of sodium added to processed food, as well as public awareness campaigns to alert consumers to the dangers of eating too much salt. This includes increasing potassium in manufactured foods, primarily to target hypertension and heart disease, as described by Clare Farrand, MSc, BSc, and colleagues, in the Journal of Clinical Hypertension. The authors also make several recommendations regarding salt reduction policies:
- Food manufacturers should gradually reduce sodium in food to the lowest possible levels and explore the use of potassium-based sodium replacers to reduce sodium levels even further.
- Governments should continue to monitor sodium and potassium levels in processed foods.
- Further consideration may need to be given to how best to label salt substitutes (namely potassium) in processed foods to ensure that people who may be adversely affected are aware.
- Governments should systematically monitor potassium intake at the population level, including for specific susceptible groups.
- Governments should continue to systematically monitor sodium (salt) intake and iodine intake at the population level to adjust salt iodization over time as necessary, depending on observed salt intake in specific targeted groups, to ensure that they have sufficient but not excessive iodine intakes as salt intakes are reduced.
- Governments should consider opportunities for promoting and subsidizing salt substitutes, particularly in countries where salt added during cooking or at the table is the major source of salt in the diet.
The new FDA document includes 163 subcategories of foods in its voluntary salt reduction strategy.
Salt substitutes, high blood pressure, and mortality
Lowering sodium intake is almost certainly beneficial for persons with high blood pressure. In 2020, a review in Hypertension highlighted the benefit of salt substitutes in reducing hypertension, reporting that they lower systolic blood pressure by 5.58 mm Hg and diastolic blood pressure by 2.88 mm Hg.
And changes to dietary sodium intake can potentially reduce or obviate the need for medications for essential hypertension in some individuals. Although there are only a few studies on this topic, a study by Bruce Neal, MB, ChB, PhD, and colleagues, revealed a reduction in stroke, cardiovascular events, and deaths with the use of potassium-based salt substitutes.
Salt substitutes and sodium and potassium handling in the kidneys
Many studies have shown that potassium-rich salt substitutes are safe in individuals with normal kidney function, but are they safe and beneficial for people with chronic kidney disease (CKD)?
For anyone who is on a renal diet, potassium and sodium intake goals are limited according to their absolute level of kidney function.
There have been case reports of life-threatening blood potassium levels (hyperkalemia) due to potassium-rich salt substitutes in people with CKD, but no larger published studies on this topic can be found.
A diet modeling study by Rebecca Morrison and colleagues evaluated varying degrees of potassium-enriched salt substituted bread products and their impact on dietary intake in persons with CKD. They used dietary data from the National Nutrition and Physical Activity Survey 2011-2012 in Australia for 12,152 participants, 154 of whom had CKD. Replacing the sodium in bread with varying amounts of potassium chloride (20%, 30%, and 40%) would result in one-third of people with CKD exceeding the safe limits for dietary potassium consumption (31.8%, 32.6%, and 33%, respectively), they found.
“Potassium chloride substitution in staple foods such as bread and bread products have serious and potentially fatal consequences for people who need to restrict dietary potassium. Improved food labelling is required for consumers to avoid excessive consumption,” Ms. Morrison and colleagues concluded. They added that more studies are needed to further understand the risks of potassium dietary intake and hyperkalemia in CKD from potassium-based salt substitutes.
The American Heart Association recommends no more than 1,500 mg of sodium intake daily for persons with CKD, diabetes, or high blood pressure; those older than 51; and African American persons of any age.
The recommended daily intake of potassium in persons with CKD can range from 2,000 mg to 4,000 mg, depending on the individual and their degree of CKD. The potassium content in some salt substitutes varies from 440 mg to 2,800 mg per teaspoon.
The best recommendation for individuals with CKD and a goal to reduce their sodium intake is to use herbs and lower-sodium seasonings as a substitute, but these should always be reviewed with their physician and renal nutritionist.
Dr. Brookins is a board-certified nephrologist and internist practicing in Georgia. She is the founder and owner of Remote Renal Care, a telehealth kidney practice. She reported no relevant conflicts of interest.
A version of this article first appeared on Medscape.com.
When we refer to “regular table salt,” it is most commonly in the form of sodium chloride, which is also a major constituent of packaged and ultraprocessed foods.
The best approach to finding the “healthiest salt” – which really means the lowest in sodium – is to look for the amount on the label. “Sodium-free” usually indicates less than 5 mg of sodium per serving, and “low-sodium” usually means 140 mg or less per serving. In contrast, regular table salt can contain as much as 560 mg of sodium in one serving.
Other en vogue salts, such as pink Himalayan salt, sea salt, and kosher salt, are high in sodium content – like regular table salt – but because of their larger crystal size, less sodium is delivered per serving.
Most salt substitutes are reduced in sodium, with the addition of potassium chloride instead.
FDA issues guidance on reducing salt
Currently, the U.S. sodium dietary guidelines for persons older than 14 stipulate 2,300 mg/d, which is equivalent to 1 teaspoon a day. However it is estimated that the average person in the United States consumes more than this – around 3,400 mg of sodium daily.
In October 2021, the U.S. Food and Drug Administration published guidance on voluntary sodium limitations in commercially processed, packaged, and prepared food. The FDA’s short-term approach is to slowly reduce exposure to sodium in processed and restaurant food by 2025, on the basis that people will eventually get used to less salt, as has happened in the United Kingdom and other countries.
Such strategies to reduce salt intake are now being used in national programs in several countries. Many of these successful initiatives include active engagement with the food industry to reduce the amount of sodium added to processed food, as well as public awareness campaigns to alert consumers to the dangers of eating too much salt. This includes increasing potassium in manufactured foods, primarily to target hypertension and heart disease, as described by Clare Farrand, MSc, BSc, and colleagues, in the Journal of Clinical Hypertension. The authors also make several recommendations regarding salt reduction policies:
- Food manufacturers should gradually reduce sodium in food to the lowest possible levels and explore the use of potassium-based sodium replacers to reduce sodium levels even further.
- Governments should continue to monitor sodium and potassium levels in processed foods.
- Further consideration may need to be given to how best to label salt substitutes (namely potassium) in processed foods to ensure that people who may be adversely affected are aware.
- Governments should systematically monitor potassium intake at the population level, including for specific susceptible groups.
- Governments should continue to systematically monitor sodium (salt) intake and iodine intake at the population level to adjust salt iodization over time as necessary, depending on observed salt intake in specific targeted groups, to ensure that they have sufficient but not excessive iodine intakes as salt intakes are reduced.
- Governments should consider opportunities for promoting and subsidizing salt substitutes, particularly in countries where salt added during cooking or at the table is the major source of salt in the diet.
The new FDA document includes 163 subcategories of foods in its voluntary salt reduction strategy.
Salt substitutes, high blood pressure, and mortality
Lowering sodium intake is almost certainly beneficial for persons with high blood pressure. In 2020, a review in Hypertension highlighted the benefit of salt substitutes in reducing hypertension, reporting that they lower systolic blood pressure by 5.58 mm Hg and diastolic blood pressure by 2.88 mm Hg.
And changes to dietary sodium intake can potentially reduce or obviate the need for medications for essential hypertension in some individuals. Although there are only a few studies on this topic, a study by Bruce Neal, MB, ChB, PhD, and colleagues, revealed a reduction in stroke, cardiovascular events, and deaths with the use of potassium-based salt substitutes.
Salt substitutes and sodium and potassium handling in the kidneys
Many studies have shown that potassium-rich salt substitutes are safe in individuals with normal kidney function, but are they safe and beneficial for people with chronic kidney disease (CKD)?
For anyone who is on a renal diet, potassium and sodium intake goals are limited according to their absolute level of kidney function.
There have been case reports of life-threatening blood potassium levels (hyperkalemia) due to potassium-rich salt substitutes in people with CKD, but no larger published studies on this topic can be found.
A diet modeling study by Rebecca Morrison and colleagues evaluated varying degrees of potassium-enriched salt substituted bread products and their impact on dietary intake in persons with CKD. They used dietary data from the National Nutrition and Physical Activity Survey 2011-2012 in Australia for 12,152 participants, 154 of whom had CKD. Replacing the sodium in bread with varying amounts of potassium chloride (20%, 30%, and 40%) would result in one-third of people with CKD exceeding the safe limits for dietary potassium consumption (31.8%, 32.6%, and 33%, respectively), they found.
“Potassium chloride substitution in staple foods such as bread and bread products have serious and potentially fatal consequences for people who need to restrict dietary potassium. Improved food labelling is required for consumers to avoid excessive consumption,” Ms. Morrison and colleagues concluded. They added that more studies are needed to further understand the risks of potassium dietary intake and hyperkalemia in CKD from potassium-based salt substitutes.
The American Heart Association recommends no more than 1,500 mg of sodium intake daily for persons with CKD, diabetes, or high blood pressure; those older than 51; and African American persons of any age.
The recommended daily intake of potassium in persons with CKD can range from 2,000 mg to 4,000 mg, depending on the individual and their degree of CKD. The potassium content in some salt substitutes varies from 440 mg to 2,800 mg per teaspoon.
The best recommendation for individuals with CKD and a goal to reduce their sodium intake is to use herbs and lower-sodium seasonings as a substitute, but these should always be reviewed with their physician and renal nutritionist.
Dr. Brookins is a board-certified nephrologist and internist practicing in Georgia. She is the founder and owner of Remote Renal Care, a telehealth kidney practice. She reported no relevant conflicts of interest.
A version of this article first appeared on Medscape.com.
Oil spill cleanup work tied to hypertension risk years later
Workers who had the highest exposure to hydrocarbons during the Deepwater Horizon oil spill disaster had a higher risk of having a hypertension diagnosis in the years following the event, a new study suggests.
Results showed that the highest exposure to total petroleum hydrocarbons during the cleanup operation was associated with a 31% higher risk of new hypertension 1-3 years later.
“What is remarkable is that we still found an increased risk of hypertension a couple of years after the cleanup had been completed. This suggests working in this environment even for a short period could have long-term health consequences,” lead author Richard Kwok, PhD, told this news organization.
The study was published online in JAMA Network Open.
For the study, Dr. Kwok, a scientist at the U.S. National Institute of Environmental Health Sciences, and colleagues estimated the levels of exposure to toxic hydrocarbons in 6,846 adults who had worked on the oil spill cleanup after the Deepwater Horizon disaster in 2010, during which 200 million gallons of oil spilled into the Gulf of Mexico. They then investigated whether there was an association with the development of hypertension 1-3 years later.
“Clean-up efforts started almost immediately and lasted over a year,” Dr. Kwok noted. “In the first few months, oil flowed freely into the Gulf of Mexico which released high levels of volatile organic compounds into the air that the workers could have been exposed to. The exposures change over time because the oil becomes weathered and starts to decompose and harden. This is associated with a lower level of volatile organic compounds but can still cause damage.”
Workers involved in the cleanup may have been there for just a few days or could have spent many months at the site and would have had different exposures depending on what types of jobs they were doing, Dr. Kwok reported.
“The highest levels of exposure to total hydrocarbons would have been to those involved in the early months of the oil spill response and cleanup when the oil was flowing freely, and those who were skimming oil off the water, burning oil, handling dispersants, or involved in the decontamination of the vessels. Others who were involved in the cleanup on land or support functions would have had lower exposures,” he said.
Each worker was interviewed and asked about their activities during the cleanup operation, the location of work, and period of work. Their level of exposure to total petroleum hydrocarbons (THCs) was estimated based on their self-reported activities, and when and where they worked.
Two measures of estimated cumulative THC were calculated: cumulative maximum daily exposure, which summed the maximum daily THC exposure level, and cumulative mean exposure, which summed the mean daily exposure levels. These THC values were categorized into quintiles based on the exposure distribution among workers.
Systolic and diastolic blood pressure measurements were collected for the workers during home exams from 2011 to 2013 using automated oscillometric monitors. Newly detected hypertension was defined as either antihypertensive medication use or elevated blood pressure since the spill.
Results showed a clear dose relationship between the level of THC exposure and the development of hypertension at follow-up.
Similar results were seen for the relationship between cumulative mean THC exposure levels and the development of hypertension.
Despite the limitations of accurately estimating THC exposure, Dr. Kwok believes the results are real. “We looked at many different covariates including smoking, education, gender, race, ethnicity, and body mass index, but even after controlling for all these we still saw an association between the amount of exposure to THC and risk of hypertension.”
But the risk of developing hypertension did appear to be greater in those individuals with other risk factors for hypertension such as high body mass index or smokers. “There seems to be a combined effect,” Dr. Kwok said.
He pointed out that, while previous studies have shown possible health effects related to THC exposure on an acute basis, in this study, the effect on blood pressure was still evident years after the exposure had ended.
Other occupational studies have looked at people in jobs that have had longer exposures to volatile organic compounds such as taxi drivers, but this is one of the first to look at the long-term effect of a more limited period of exposure, he added.
“Our results suggest that the damage caused by THCs is not just an acute effect, but is still there several years later,” Dr. Kwok commented.
He says he hoped this study will raise awareness of the health hazards to workers involved in future oil spills. “Our results suggest that we need better protective equipment and monitoring of workers and the local community with longer-term follow up for health outcomes.”
Another analysis showed no clear differences in hypertension risk between individuals who worked on the oil spill cleanup (workers) and others who had completed required safety training but did not participate in the clean-up operation (nonworkers). Dr. Kwok suggested this may have been a result of the “healthy worker effect,” which is based on the premise that individuals able to work are healthier than those unable to work.
This study was funded by the Intramural Research Program of the National Institutes of Health, National Institute of Environmental Health Sciences. The authors reported no disclosures.
A version of this article first appeared on Medscape.com.
FROM JAMA NETWORK OPEN
Is a blood test for type 1 diabetes in kids worth the cost?
Universal screening for presymptomatic type 1 diabetes among schoolchildren would cost approximately 22 euros (about $25) per child screened, and about 7,000 euros (about $7,900) per child diagnosed, a new analysis of data from a German program finds.
The data come from the Fr1da study, in which a blood test for type 1 diabetes–associated islet autoantibodies is offered to all children aged 21 months to 6 years old in Bavaria.
Families of those who test positive are offered participation in a program of diabetes education, metabolic staging, psychological evaluation for stress, and prospective follow-up.
The researchers explain that, worldwide, 4 in 1,000 people under the age of 20 years have type 1 diabetes. It is the most common metabolic disease in children and adolescents. Only about 1 in 10 of those affected has a close relative with the disease. This means that type 1 diabetes can affect any child.
However, in many cases, the disease does not become known until a severe to life-threatening metabolic derailment known as diabetic ketoacidosis (DKA) occurs. This often leads to intensive medical treatment, a longer hospitalization, and poorer blood glucose control, which can result in an increased risk of secondary diseases and very high costs for the health care system.
“We want to protect as many children as possible from serious metabolic derailments. This is only possible with type 1 diabetes screenings. Therefore, we strongly support to include early detection tests in standard medical care,” Peter Achenbach, DrMed, senior author of the study, said in a statement from his institution, Helmholtz Zentrum München in Neuherberg, Germany.
The new findings were published in Diabetes Care by Florian M. Karl, also of Helmholtz Zentrum München, and colleagues.
In 2020, the Fr1da investigators reported that, of 90,632 children who participated from February 2015 to May 2019, 0.31% (280) were diagnosed with presymptomatic type 1 diabetes through the presence of two or more islet autoantibodies.
This news organization asked Brett McQueen, PhD, who led a similar study examining cost and cost-effectiveness in the Autoimmunity Screening for Kids (ASK) program, in which Denver-area children aged 2-17 years are offered autoantibody screening for both type 1 diabetes and celiac disease, for comment.
“If we have a chance to change a child’s life from when they’re 2 or 3 years old and there’s even a small chance that this thing potentially improves health outcomes for a decent price, what are we waiting for?” said Dr. McQueen, who is assistant professor in the department of clinical pharmacy at the University of Colorado, Aurora.
Is DKA prevention enough to justify universal screening?
Although identifying type 1 diabetes before symptoms arise could help avoid DKA, currently no therapeutic interventions are available to prevent or delay the trajectory from presymptomatic to clinical type 1 diabetes.
A possible future intervention – the anti-CD3 monoclonal antibody teplizumab (Tzield, Provention Bio) – had a setback in July 2021 when the Food and Drug Administration declined to approve it for the delay of type 1 diabetes in at-risk individuals.
However, on Feb. 22 Provention Bio announced that it has resubmitted the Biologics License Application for teplizumab for the delay of clinical type 1 diabetes in at-risk individuals. The FDA now has 30 days to review the resubmission, determine whether it is complete and acceptable for review, and provide a review goal date, according to a company statement.
But even without the ability to forestall the development of type 1 diabetes, screening proponents point to the potential benefit from educating families about early signs of diabetes onset and thereby preventing progression to DKA and both its short-term and possible long-term sequelae.
Prevention of DKA at diagnosis has been linked to improved long-term glycemic control and other potential health benefits.
And the frequency of DKA at the onset of type 1 diabetes has increased in recent years, to more than 20% in Germany and over 45% in the United States.
But, prior data have suggested that universal screening for presymptomatic type 1 diabetes is unlikely to be cost effective if only the health and economic benefits of prevention of DKA at type 1 diabetes onset is considered, unless the screening costs are exceedingly low.
What will it take to implement universal screening?
“What this paper does is contribute really to our understanding of more around resource utilization,” noted Dr. McQueen. “As they correctly identify, it’s really hard to compare country prices. It’s easier to compare utilization.”
In Dr. McQueen’s ASK program, the cost per child screened and per case detected in that program were similar to those found in the German study, even though the cost of the antibody testing itself was considerably lower in Germany than in the United States.
Fr1da included more components of screening and monitoring than did ASK, Dr. McQueen told this news organization.
The conclusions of the ASK study were that “presymptomatic type 1 diabetes screening may be cost effective in areas with a high prevalence of DKA and an infrastructure facilitating screening and monitoring if the benefits of avoiding DKA events and improved [hemoglobin] A1c persist over long-run time horizons.”
Nonetheless, Dr. McQueen thinks it’s unlikely that universal screening will be recommended by professional societies or covered by payers in the United States until a pharmacologic intervention to forestall disease progression is available.“Teplizumab approval could move this along. ... We’re just trying to take one factor, the economics of it, to create the most efficient scenario so that if it were to be adopted we would catch the most cases, prevent the most complications, benefit children the most in terms of their lifetime health outcomes – all at the minimum cost possible.”
‘A benchmark for the expected implementation cost of screening’
Mr. Karl and colleagues simulated the cost of implementation of this screening as standard care in Germany – assuming the same 0.31% prevalence found in Fr1da – the average cost per child was estimated at 21.73 euros, including 9.34 euros for laboratory costs, 12.25 euros for pediatrician costs, and 0.14 euros for local diabetes clinics to perform metabolic staging and education for children diagnosed with presymptomatic type 1 diabetes.
The model included 50% of the costs incurred in Fr1da for obtaining informed consent. Negative autoantibody results from the initial screening were not communicated to families, and all children with presymptomatic type 1 diabetes received staging and education. The estimated average cost per diagnosed child was 7,035 euros.
“Although our analyses are subject to some level of uncertainty, they provide a benchmark for the expected implementation cost of screening,” said coauthor Michael Laxy, MSc, PhD, also at Helmholtz Zentrum München.
“Next, we aim to evaluate the long-term ratio of screening costs, potential cost savings through the prevention of metabolic derailment and its consequences, and potentially increased quality of life with a type 1 diabetes screening compared to the costs and quality of life without a screening.”
Dr. McQueen is working along similar lines in Colorado, attempting to create a model that incorporates all the different possibilities including DKA monitoring, teplizumab availability, screening children at different ages, and the effect of including blood glucose monitoring in children identified with presymptomatic type 1 diabetes.
“There are so many different potential answers and avenues and no one has really put it all together,” he observed.
But he believes that economics shouldn’t be the only factor used in deciding whether to institute widespread screening.
This study was supported by grants from the German Federal Ministry of Education and Research to the German Center for Diabetes Research (DZD). The Fr1da study was supported by grants from the LifeScience-Stiftung, JDRF International, the Bavarian State Ministry of Health and Care, the Leona M. and Harry B. Helmsley Charitable Trust, Deutsche Diabetes-Stiftung, Landesverband Bayern der Betriebskrankenkassen, B. Braun-Stiftung, Deutsche Diabetes Hilfe, and the German Federal Ministry of Education and Research to the DZD. The authors disclosed no relevant financial relationships. The ASK study was funded by JDRF International, the Leona M. and Harry B. Helmsley Charitable Trust, and Janssen Research and Development. Dr. McQueen has received institutional funding for value assessment applications from the Institute for Clinical and Economic Review, the PhRMA Foundation, and PhRMA.
A version of this article first appeared on Medscape.com.
FROM DIABETES CARE
COVID-19 vaccines do not trigger sudden hearing loss: Study
Anecdotal reports have linked the vaccines against COVID-19 to the sudden loss of hearing in some people. But a new study has found no evidence for such a connection with any of the three approved shots.
The analysis of data from the Centers for Disease Control and Prevention’s Vaccine Adverse Event Reporting System (VAERS) found that
“We’re not finding a signal,” said Eric J. Formeister, MD, a neurotology fellow at the Johns Hopkins University, Baltimore, and the first author of the U.S. study, which appeared Feb. 24 in JAMA Otolaryngology – Head and Neck Surgery.
Dr. Formeister and colleagues undertook the study in response to reports of hearing problems, including hearing loss and tinnitus, that occurred soon after COVID-19 vaccination.
They analyzed reports of sudden hearing loss, experienced within 21 days of vaccination, logged in VAERS. Anyone can report a potential event to the database, which does not require medical documentation in support of the adverse event. To minimize potential misdiagnoses, Dr. Formeister and colleagues reviewed only those reports that indicated that a doctor had diagnosed sudden hearing loss, leaving 555 cases (305 in women; mean age 54 years) between December 2020 and July 2021.
Dividing these reports by the total doses of vaccines administered in the United States during that period yielded an incidence rate of 0.6 cases of sudden hearing loss for every 100,000 people, Dr. Formeister and colleagues reported.
When the researchers divided all cases of hearing loss in the VAERS database (2,170) by the number of people who had received two doses of vaccine, the incidence rate increased to 28 per 100,000 people. For comparison, the authors reported, the incidence of sudden hearing loss within the United States population is between 11 and 77 per 100,000 people, depending on age.
“There was not an increase in cases of sudden [sensorineural] hearing loss associated with COVID-19 vaccination compared to previously published reports before the COVID-19 vaccination era,” study coauthor Elliott D. Kozin, MD, assistant professor of otolaryngology–head and neck surgery at Harvard Medical School, Boston, said in an interview.
Another reassuring sign: If hearing loss were linked to the vaccines, the researchers said, they would expect to see an increase in the number of complaints in lockstep with an increase in the number of doses administered. However, the opposite was true. “[T]he rate of reports per 100,000 doses decreased across the vaccination period, despite large concomitant increases in the absolute number of vaccine doses administered per week,” the researchers reported.
They also looked at case reports of 21 men and women who had experienced sudden hearing loss after having received COVID-19 vaccines, to see if they could discern any clinically relevant signs of people most likely to experience the adverse event. However, the group had a range of preexisting conditions and varying times after receiving a vaccine when their hearing loss occurred, leading Dr. Formeister’s team to conclude that they could find no clear markers of risk.
“When we examined patients across several institutions, there was no obvious pattern. The patient demographics and clinical findings were variable,” Dr. Kozin said. A provisional interpretation of this data, he added, is that no link exists between COVID-19 vaccination and predictable hearing deficits, although the analysis covered a small number of patients.
“Association does not necessarily imply a causal relationship,” said Michael Brenner, MD, FACS, associate professor of otolaryngology–head and neck surgery at the University of Michigan, Ann Arbor. Dr. Brenner, who was not involved in the study, said any hearing loss attributed to the COVID-19 vaccines could have had other causes besides the injections.
But a second study, also published in JAMA Otolaryngology – Head and Neck Surgery on Feb. 24, leaves open the possibility of a link. Researchers in Israel looked for increases in steroid prescriptions used to treat sudden hearing loss as vaccination with the Pfizer version of the shot became widespread in that country. Their conclusion: The vaccine might be associated with a slightly increased risk of sudden hearing loss, although if so, that risk is likely “very small” and the benefits of vaccination “outweigh its potential association” with the side effect.
Dr. Brenner agreed. “The evidence supports [the] clear public health benefit of COVID-19 vaccination, and the scale of those benefits dwarfs associations with hearing, which are of uncertain significance,” he said.
A version of this article first appeared on Medscape.com.
FROM JAMA OTOLARYNGOLOGY – HEAD AND NECK SURGERY
Why challenging patients can trigger resentment
I have a secret. It’s one I think many physicians and nurses share. Sometimes, when I’m stretched too thin — overbooked, hungry, tired, fielding yet another appeal to an insurance company in the middle of a clinic day —
As soon as this happens, I feel immediate guilt. These are the worst moments of my day. Why the heck would I resent my patients? They’re the entire reason I’m there. I wouldn’t be a physician without patients to care for. I became a physician, and completed subspecialty training, to help patients. People.
Recently, I started thinking more about this emotion of resentment. What exactly is it, and where does it come from? Is what I’m feeling actually resentment? Or is it something else?
Two books I’ve recently read have helped me explore the complicated emotion of resentment and how it might play a role in burnout for both physicians and nurses.
First, Brené Brown’s most recent book, Atlas of the Heart: Mapping Meaningful Connection and the Language of Human Experience, provides a roadmap for 87 of our human emotions. (That’s right — 87!)
One emotion of the 87 that she shares has been a particular struggle for her has been our good old friend, resentment.
In her book, Dr Brown shares that she initially considered resentment to belong to the anger family of emotion. As I read this, I agreed. When I feel resentful, I associate that with feeling angry.
But she then writes about her discovery that resentment, in fact, belongs to the envy family. She explains how this discovery shook her world. I had to close the book for a moment at this point.
Wait a minute, I thought. If resentment is in the envy family, why do we (physicians) often find ourselves resenting patients who take up our time? What are we envious of?
I took some time to think about how this might be true. Could it be that I’m envious they have the time I don’t have? I want to have all the time in the world to answer their questions, but the reality is I don’t.
Or maybe it’s because sometimes I feel the patient is expecting me to offer them something more than is available. A cure when there might be none.
But is this actually true? Or is this my unrealistic expectation of myself?
Here’s how Brené Brown defines resentment in her book: “Resentment is the feeling of frustration, judgment, anger, ‘better than,’ and/or hidden envy related to perceived unfairness or injustice. It’s an emotion that we often experience when we fail to set boundaries or ask for what we need, or when expectations let us down because they were based on things we can’t control, like what other people think, what they feel, or how they’re going to react.”
Wow, I thought, Healthcare checks all of these boxes.
- Perceived unfairness of work schedules? Check.
- Perceived injustice? Of course — we see that in our dealings with insurance company denials every day.
But those are both extrinsic. What about the intrinsic factors she’s calling us out on here?
- Do we, as physicians, fail to set boundaries?
- Do we fail to ask for what we need?
Hard yes and yes. (Do we even know, as physicians, what our own boundaries are?)
And the last one:
- Do our expectations of how our clinic day will go let us down every day because they’re based on things we can’t control?
My brain had to repeat the critical parts of that: Expectations let us down when they’re based on things we can’t control.
But wait, my brain argued back; I’m the physician, I thought I was supposed to get to control things.
Next, the revelation: Could it be that a key to experiencing less resentment is accepting how much control we don’t have in a typical day?
And a corollary: How much does resentment factor into burnout? (To read more on my personal journey with burnout, see this piece).
It so happens that around this same time, I was reading another excellent book, Changing How We Think About Difficult Patients: A Guide for Physicians and Healthcare Professionals, by Joan Naidorf, DO.
Dr Naidorf is an emergency medicine physician of 30 years who wrote the book to “provid[e] insight and tools to manage our negative thoughts about difficult patients” and help “beleaguered colleagues…return to their benevolent guiding principles and find more enjoyment in their vitally important careers.”
As I read Dr Naidorf’s book, I thus did so with the mindset of wanting to further understand for myself where this specific emotion of resentment toward our “difficult” patients could come from and how to best understand it in order to get past it.
Dr. Naidorf writes, “Challenging patients will never stop appearing… You cannot change them or control them—the only person you can control is you.”
I wondered how much the resentment we might involuntarily feel at being asked to see a “difficult” patient has nothing to do with the patient but everything to do with it making us feel not in control of the situation.
Dr. Naidorf also writes, “Negative thoughts about challenging patients can cause, in otherwise capable clinicians, a sense of inadequacy and incompetence.”
Do we perhaps resent our challenging patients because of the negative thoughts they sometimes trigger in us? If so, how does this relate to envy, as Dr. Brown asserts resentment is tied to? Is it triggering us to feel inadequate?
“[Difficult patients] often make us question ourselves,” Dr. Naidorf writes, “and we need to feel comfortable with the answers.”
Again, the discrepancy between expectations and reality creates the negative emotion.
Or, as Dr. Naidorf writes, “What if you could stop judging others so harshly and accept them exactly as they are?”
Hmmm, I thought, then the cessation of harsh judgment and implementation of acceptance would have to apply to us too. The elusive concept of self-compassion.
Maybe the resentment/envy comes from us not allowing ourselves to behave in this way because to do so would allow too much vulnerability. Something most of us were conditioned to avoid to survive medical training.
Dr. Brown also writes about an “aha” moment she had in her struggle to understand resentment. “I’m not mad because you’re resting. I’m mad because I’m so bone tired and I want to rest. But, unlike you, I’m going to pretend that I don’t need to.”
I felt all too seen in that passage. Could it be my old nemesis, perfectionism, creeping its way back in? Is resentment the ugly stepsister to perfectionism?
Perhaps challenging patients can engender resentment because they make us feel like we’re not living up to our own unrealistic expectations. And in that case, we need to change our unrealistic expectations for ourselves.
Dr Naidorf’s book explores much more on the complex matter of what makes a “difficult” patient, but I chose to focus here only on the resentment piece as a tie-in to Dr. Brown’s book. I highly recommend both books for further reading to help physicians and nurses navigate the complex emotions our jobs can trigger.
Most importantly, recognizing that we have these transient negative emotions does not make us bad people or healthcare professionals. It only makes us human.
Dr. Lycette is medical director, Providence Oncology and Hematology Care Clinic, Seaside, Ore. She has disclosed having no relevant financial relationships.
A version of this article first appeared on Medscape.com.
Ukrainian physicians ‘ready to die for their freedom’
Nasogastric tubes. Foley catheter kits. Hydrogel anti-burn bandages and transfusion bags. Heparin, atropine, tramadol.
These items are just a few of some two dozen critical medical supplies that physicians in Ukraine desperately need, according to Leo Wolansky, MD, a Ukrainian-American radiologist and president of the Ukrainian Medical Association of North America (UMANA).

Dr. Wolansky founded a teaching program with an organization called Friends of Radiology in Ukraine in 1996 and has been running courses for specialists there ever since. He last visited the country in 2019, before the COVID-19 pandemic, but has remained in contact with his medical colleagues by phone and email. Over the weekend of Feb. 26-27, UMANA held a fundraiser for Ukraine, raising more than $17,000.
Question: Where is your family from, and do you have relatives in the country now?
Dr. Wolansky: My family is from two different parts of Ukraine. My mother was from central Ukraine. Her father, Ivan Sharyj, was part of the students’ militia that fought at the famous battle of Kruty in 1918. Four hundred Ukrainian militia fought against 5,000 professional Russian soldiers and were massacred. He later wrote the first eye-witness account. Afterwards, he had the opportunity to flee Ukraine but chose to stay under a pseudonym. Eventually, during Stalin’s purges [1929-1933], the regime found him, arrested him, tortured him, and executed him. My mother was seven when she saw her father arrested, never to return home. My father was from Western Ukraine, which did not have a long history of Russian occupation. His mother’s family was very patriotic; her first cousin, Stepan Vytvytskyi, eventually became the president of Ukraine in exile from 1955-1964.
I have second and more distant cousins in Kyiv. My wife has first cousins in Western Ukraine. They and my doctor colleagues are suffering greatly but are ready to die for their freedom.
Question: The Russian invasion of Ukraine has put tremendous stress on the Ukrainian people, including the country’s medical professionals. How do doctors in these kinds of situations handle casualties they can’t prevent? How do they work around that sense that everything is out of their control?
Dr. Wolansky: A lot of infrastructural things are being disrupted; there are limitations that you wouldn’t normally encounter. Ukraine has been developing a lot of sophisticated medical technology, but it still has room to grow. Under these circumstances, when there are bombs going off and transportation is being disrupted, it creates very new and significant obstacles to surmount. It still has not risen to massive casualties, and we can just pray that it does not, but in times of war, a very different kind of medicine is practiced.
But remember, Ukraine has been at war since 2014, when Russia took Crimea and invaded the Eastern provinces. The doctors there are not unfamiliar with war injuries. At our conferences in Ukraine, I have seen radiological presentations of injuries sustained in war – gunshots, fractures, and amputations – as well as other kinds of traumatic injuries. You’re going for a kind of more emergent treatment: to transfuse, to maintain peoples’ blood pressure, put bandages on, sterilize and sanitize wounds to prevent infections. I imagine there will be many field hospitals set up between now and the next few weeks to deal with the acute injuries.
Question: Ukraine has struggled with high rates of HIV and multidrug-resistant tuberculosis, as well as a lack of resources for treating patients with mental illness. Meanwhile, the country has had more that 5 million cases of COVID-19 and an estimated 112,000 deaths from the disease. Are you concerned about an exacerbation of infection rates, including of COVID, particularly among refugees and those who become homeless?
Dr. Wolansky: Because COVID ran pretty rampant in Ukraine, I think that – at a high cost – there is a level of natural immunity in the population. And the weather is going to be getting warmer soon, and respiratory viruses are cyclic in nature, so I don’t know if that’s going to be a big complicating factor. However, people get sick all the time, and the prognosis for them is going to be much worse than it otherwise might be. If you have a heart attack, your chances were way better when the roads were clear and people weren’t shooting at you.
Right now, it’s very regional where the infrastructure is being destroyed. The West, where I used to go, is in much better shape than the East because it has not been the focus of Russian attacks. But Kyiv could turn into a very big humanitarian crisis very quickly if there’s no electricity, no water. All sorts of medical conditions could be greatly exacerbated, and some new health crises could arise from water contamination, bombs causing buildings to collapse, and other problems. Whatever the illness is, it’s going to be harder to take care of it.
Questions: Doctors Without Borders announced that it was suspending its operations in Ukraine because of the invasion – missions that included HIV care in Severodonetsk, tuberculosis care in Zhytomyr, and improving health care access in Donetsk in eastern Ukraine, according to the aid group. What do doctors in Ukraine need most acutely now, other than peace?
Dr. Wolansky: Obviously, money is valuable, and military protection, which would prevent additional damage to their infrastructure. One thing that bears mentioning. There’s been a fair amount of coverage of this, but I’ve witnessed it first-hand: The Ukrainian people are fiercely patriotic, and there’s really no way their spirit can be conquered. The USSR invaded Afghanistan, and after years of thinking they were in command, they left because they could no longer take the guerilla warfare and the constant sniper attacks. Ukraine’s population is many times larger than Afghanistan’s; there’s no way they can be subdued. And remember, the Ukrainian people have been free for 30 years – generations of young people have known no other way of life. They are not going to give that up.
A version of this article first appeared on Medscape.com.
Nasogastric tubes. Foley catheter kits. Hydrogel anti-burn bandages and transfusion bags. Heparin, atropine, tramadol.
These items are just a few of some two dozen critical medical supplies that physicians in Ukraine desperately need, according to Leo Wolansky, MD, a Ukrainian-American radiologist and president of the Ukrainian Medical Association of North America (UMANA).
Dr. Wolansky founded a teaching program with an organization called Friends of Radiology in Ukraine in 1996 and has been running courses for specialists there ever since. He last visited the country in 2019, before the COVID-19 pandemic, but has remained in contact with his medical colleagues by phone and email. Over the weekend of Feb. 26-27, UMANA held a fundraiser for Ukraine, raising more than $17,000.
Question: Where is your family from, and do you have relatives in the country now?
Dr. Wolansky: My family is from two different parts of Ukraine. My mother was from central Ukraine. Her father, Ivan Sharyj, was part of the students’ militia that fought at the famous battle of Kruty in 1918. Four hundred Ukrainian militia fought against 5,000 professional Russian soldiers and were massacred. He later wrote the first eye-witness account. Afterwards, he had the opportunity to flee Ukraine but chose to stay under a pseudonym. Eventually, during Stalin’s purges [1929-1933], the regime found him, arrested him, tortured him, and executed him. My mother was seven when she saw her father arrested, never to return home. My father was from Western Ukraine, which did not have a long history of Russian occupation. His mother’s family was very patriotic; her first cousin, Stepan Vytvytskyi, eventually became the president of Ukraine in exile from 1955-1964.
I have second and more distant cousins in Kyiv. My wife has first cousins in Western Ukraine. They and my doctor colleagues are suffering greatly but are ready to die for their freedom.
Question: The Russian invasion of Ukraine has put tremendous stress on the Ukrainian people, including the country’s medical professionals. How do doctors in these kinds of situations handle casualties they can’t prevent? How do they work around that sense that everything is out of their control?
Dr. Wolansky: A lot of infrastructural things are being disrupted; there are limitations that you wouldn’t normally encounter. Ukraine has been developing a lot of sophisticated medical technology, but it still has room to grow. Under these circumstances, when there are bombs going off and transportation is being disrupted, it creates very new and significant obstacles to surmount. It still has not risen to massive casualties, and we can just pray that it does not, but in times of war, a very different kind of medicine is practiced.
But remember, Ukraine has been at war since 2014, when Russia took Crimea and invaded the Eastern provinces. The doctors there are not unfamiliar with war injuries. At our conferences in Ukraine, I have seen radiological presentations of injuries sustained in war – gunshots, fractures, and amputations – as well as other kinds of traumatic injuries. You’re going for a kind of more emergent treatment: to transfuse, to maintain peoples’ blood pressure, put bandages on, sterilize and sanitize wounds to prevent infections. I imagine there will be many field hospitals set up between now and the next few weeks to deal with the acute injuries.
Question: Ukraine has struggled with high rates of HIV and multidrug-resistant tuberculosis, as well as a lack of resources for treating patients with mental illness. Meanwhile, the country has had more that 5 million cases of COVID-19 and an estimated 112,000 deaths from the disease. Are you concerned about an exacerbation of infection rates, including of COVID, particularly among refugees and those who become homeless?
Dr. Wolansky: Because COVID ran pretty rampant in Ukraine, I think that – at a high cost – there is a level of natural immunity in the population. And the weather is going to be getting warmer soon, and respiratory viruses are cyclic in nature, so I don’t know if that’s going to be a big complicating factor. However, people get sick all the time, and the prognosis for them is going to be much worse than it otherwise might be. If you have a heart attack, your chances were way better when the roads were clear and people weren’t shooting at you.
Right now, it’s very regional where the infrastructure is being destroyed. The West, where I used to go, is in much better shape than the East because it has not been the focus of Russian attacks. But Kyiv could turn into a very big humanitarian crisis very quickly if there’s no electricity, no water. All sorts of medical conditions could be greatly exacerbated, and some new health crises could arise from water contamination, bombs causing buildings to collapse, and other problems. Whatever the illness is, it’s going to be harder to take care of it.
Questions: Doctors Without Borders announced that it was suspending its operations in Ukraine because of the invasion – missions that included HIV care in Severodonetsk, tuberculosis care in Zhytomyr, and improving health care access in Donetsk in eastern Ukraine, according to the aid group. What do doctors in Ukraine need most acutely now, other than peace?
Dr. Wolansky: Obviously, money is valuable, and military protection, which would prevent additional damage to their infrastructure. One thing that bears mentioning. There’s been a fair amount of coverage of this, but I’ve witnessed it first-hand: The Ukrainian people are fiercely patriotic, and there’s really no way their spirit can be conquered. The USSR invaded Afghanistan, and after years of thinking they were in command, they left because they could no longer take the guerilla warfare and the constant sniper attacks. Ukraine’s population is many times larger than Afghanistan’s; there’s no way they can be subdued. And remember, the Ukrainian people have been free for 30 years – generations of young people have known no other way of life. They are not going to give that up.
A version of this article first appeared on Medscape.com.
Older age for menopause raises risk for lung cancer
This study was published on Medrxiv.org as a preprint and has not yet been peer reviewed.
Key takeaways
- in analyses of more than 100,000 women that used Mendelian randomization (MR) as a tool to reduce residual confounding.
- The MR analyses showed no significant association between ANM and breast cancer, endometrial cancer, ovarian cancer, coronary heart disease, ischemic stroke, and Alzheimer’s disease.
- The clear lack of a causal effect of ANM on the outcomes of coronary heart disease and ischemic stroke in the MR analyses despite a strong inverse association seen in the observational data of this study (without MR) suggests residual confounding plays a substantial role in driving the observed outcomes.
Why this matters
- The authors said that, to their knowledge, this is the first study that has shown a causal association between older ANM and higher risk of postmenopausal lung cancer.
- This finding was directionally opposite to the significant protective effect of increased ANM documented in an observational analysis of roughly the same data as well as prior reports that did not use MR. This “notable inconsistency” suggests very substantial residual confounding without MR that could be driven by factors such as smoking, diet, and exercise.
- If these results are replicated in additional datasets, it would highlight a need for randomized, controlled trials of antiestrogen therapies in postmenopausal women for the prevention or treatment of lung cancer.
Study design
- The study included data from 106,853 postmenopausal women enrolled in the Women’s Health Initiative (WHI) and 95,464 women who were 37-73 years old included in the UK Biobank (UKB). Analyses for each outcome also included data from smaller numbers of women obtained from several additional datasets.
- The MR analysis used up to 55 single-nucleotide polymorphisms previously discovered through a genome-wide association study of about 70,000 women of European ancestry and independent of all datasets analyzed in the current study. The authors included all single-nucleotide polymorphisms with a consistent direction of effect on ANM.
- The MR analysis for lung cancer included 113,371 women from the two primary datasets and an additional 3012 women from six additional datasets.
- The MR analysis for bone fracture involved 113,239 women from the WHI and UKB only. The MR analysis for osteoporosis involved 137,080 women from the WHI, UKB, and one additional external dataset.
Key results
- Results from a meta-analysis of the MR results using data from the WHI, UKB, and the additional datasets showed ANM was causally associated with an increased risk of lung cancer by an odds ratio of 1.35 for each 5-year increase in ANM. In contrast, the adjusted observational analysis of data just from the WHI and UKB showed a significant 11% relative risk reduction in the incidence of lung cancer for each 5-year increase in ANM.
- The MR results also showed causally protective effects for fracture, with a 24% relative risk reduction, and for osteoporosis, with a 19% relative risk reduction for each 5-year increase in ANM.
- The MR analyses showed no significant association between AMN and outcome for breast cancer, endometrial cancer, ovarian cancer, coronary heart disease, ischemic stroke, and Alzheimer’s disease.
Limitations
The main limitation of the MR study was the potential for inadequate power for assessing some outcomes despite the large overall size of the study cohort. Lack of adequate power may be responsible for some of the nonsignificant associations seen in the study, such as for breast and endometrial cancers, where substantial prior evidence has implicated increased risk through the effects of prolonged exposure to endogenous or exogenous estrogens.
The healthy cohort effect in the UKB is a known weakness of this dataset that may have limited the number of cases and generalizability of findings.
Osteoporosis and Alzheimer’s disease were self-reported.
The study only included participants of European ancestry because most subjects in most of the cohorts examined were White women and the applied MR instruments were found by genome-wide association studies run predominantly in White women. The authors said the causal effects of ANM need study in more diverse populations.
Disclosures
- The study received no commercial funding.
- None of the authors had disclosures.
This is a summary of a preprint research study, “Genetic evidence for causal relationships between age at natural menopause and the risk of aging-associated adverse health outcomes,” written by authors primarily based at Stanford University School of Medicine i
A version of this article first appeared on Medscape.com.
Stress and infertility – is it a proven cause and effect?
“Just relax, stop thinking about it and, more than likely, it will happen.” If ever there was a controversial subject in medicine, especially in reproduction, the relationship between stress and infertility would be high on the list. Who among us has not overheard or even personally shared with an infertility patient that they should try and reduce their stress to improve fertility? The theory is certainly not new. Hippocrates, back in the 5th century B.C., was one of the first to associate a woman’s psychological state with her reproductive potential. His contention was that a physical sign of psychological stress in women (which scholars later dubbed “hysteria”) could result in sterility. In medieval times, a German abbess and mystic named Hildegard of Bingen posited women suffering from melancholy – a condition that we today might call depression – were infertile as a result.
The deeper meaning behind the flippant advice to relax is implicit blame; that is, a woman interprets the link of stress and infertility as a declaration that she is sabotaging reproduction. Not only is this assumption flawed, but it does further damage to a woman’s emotional fragility. To provide the presumption of stress affecting reproduction, a recent survey of over 5,000 infertility patients found, remarkably, 98% considered emotional stress as either a cause or a contributor to infertility, and 31% believed stress was a cause of miscarriage, although racial differences existed (J Assist Reprod Genet. 2021 Apr;38[4]:877-87). This relationship was mostly seen in women who used complementary and alternative medicine, Black women, and those who frequented Internet search engines. Whereas women who had a professional degree, had more infertility insurance coverage, and were nonreligious were less likely to attribute stress to infertility. Intriguingly, the more engaged the physicians, the less patients linked stress with infertility, while the contrary also applied.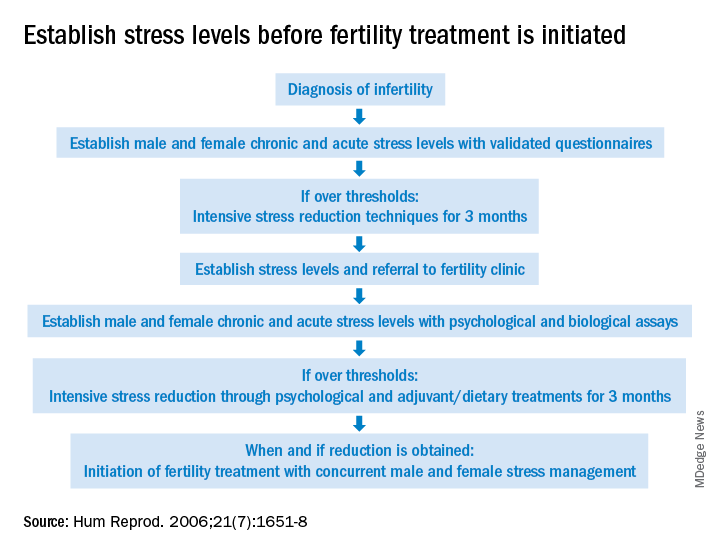
The power of stress can be exemplified by the pathophysiology of amenorrhea. Functional hypothalamic amenorrhea is the most common cause of the female athlete triad of secondary amenorrhea in women of childbearing age. It is a reversible disorder caused by stress related to weight loss, excessive exercise and/or traumatic mental experiences (Endocrines. 2021;2:203-11). Stress of infertility has also been demonstrated to be equivalent to a diagnosis of cancer and other major medical morbidities (J Psychosom Obstet Gynaecol. 1993;14[Suppl]:45-52).
A definitive link between stress and infertility is evasive because of the lack of controlled, prospective longitudinal studies and the challenge of reducing variables in the analysis. The question remains which developed initially – the stress or the infertility? Infertility treatment is a physical, emotional, and financial investment. Stress and the duration of infertility are correlative. The additive factor is that poor insurance coverage for costly fertility treatment can not only heighten stress but, concurrently, subject the patient to the risk of exploitation driven by desperation whereby they accept unproven “add-ons” offered with assisted reproductive technologies (ART).
Both acute and chronic stress affect the number of oocytes retrieved and fertilized with ART as well as live birth delivery and birth weights (Fertil Steril. 2001;76:675-87). Men are also affected by stress, which is manifested by decreased libido and impaired semen, further compromised as the duration of infertility continues. The gut-derived hormone ghrelin appears to play a role with stress and reproduction (Endocr Rev. 2017;38:432-67).
As the relationship between stress and infertility is far from proven, there are conflicting study results. Two meta-analyses failed to show any association between stress and the outcomes of ART cycles (Hum Reprod. 2011;26:2763-76; BMJ. 2011;342:d223). In contrast, a recent study suggested stress during infertility treatment was contributed by the variables of low spousal support, financial constraints, and social coercion in the early years of marriage (J Hum Reprod Sci. 2018;11:172-9). Emotional distress was found to be three times greater in women whose families had unrealistic expectations from treatments.
Fortunately, psychotherapy during the ART cycle has demonstrated a benefit in outcomes. Domar revealed psychological support and cognitive behavior therapy resulted in higher pregnancy rates than in the control group (Fertil Steril. 2000;73:805-12). Another recent study appears to support stress reduction improving reproductive potential (Dialogues Clin Neurosci. 2018;20[1]:41-7).
Given the evidence provided in this article, it behooves infertility clinics to address baseline (chronic) stress and acute stress (because of infertility) prior to initiating treatment (see Figure). While the definitive answer addressing the impact of stress on reproduction remains unknown, we may share with our patients a definition in which they may find enlightenment, “Stress is trying to control an event in which one is incapable.”
Dr. Mark P Trolice is director of Fertility CARE: The IVF Center in Winter Park, Fla., and associate professor of obstetrics and gynecology at the University of Central Florida, Orlando.