User login
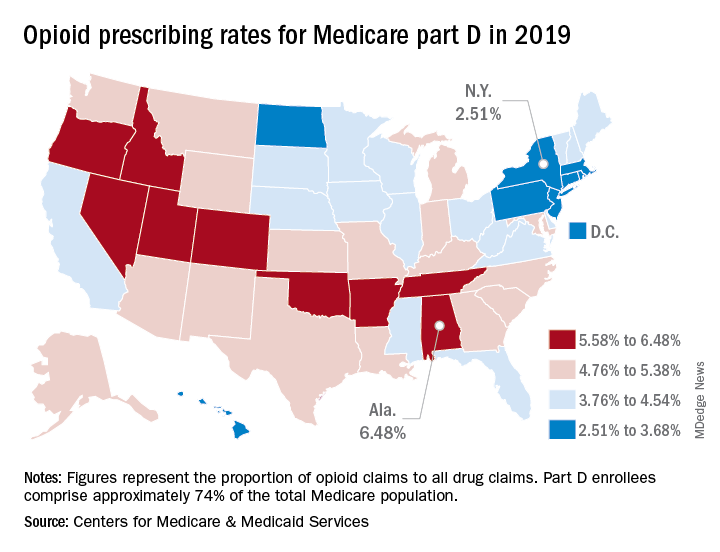
Medicare beneficiaries in Alabama were more likely to get a prescription for an opioid than in any other state in 2019, based on newly released data.

That year, opioids represented 6.48% of all drug claims for part D enrollees in the state, just ahead of Utah at 6.41%. Idaho, at 6.07%, was the only other state with an opioid prescribing rate over 6%, while Oklahoma came in at an even 6.0%, according to the latest update of the Centers for Medicare & Medicaid Services’ dataset.
The lowest rate in 2019 belonged to New York, where 2.51% of drug claims, including original prescriptions and refills, involved an opioid. Rhode Island was next at 2.87%, followed by New Jersey (3.23%), Massachusetts (3.26%), and North Dakota (3.39%),
Altogether, Medicare part D processed 1.5 billion drug claims in 2019, of which 66.1 million, or 4.41%, involved opioids. Both of the opioid numbers were down from 2018, when opioids represented 4.68% (70.2 million) of the 1.5 billion total claims, and from 2014, when opioids were involved in 5.73% (81,026,831) of the 1.41 billion drug claims, the CMS data show. That works out to 5.77% fewer opioids in 2019, compared with 2014, despite the increase in total volume.
from 2014 to 2019, with Hawaii showing the smallest decline as it slipped 0.41 percentage points from 3.9% to 3.49%, according to the CMS.
In 2019, part D beneficiaries in Vermont were the most likely to receive a long-acting opioid, which accounted for 20.14% of all opioid prescriptions in the state, while Kentucky had the lowest share of prescriptions written for long-acting forms at 6.41%. The national average was 11.02%, dropping from 11.79% in 2018 and 12.75% in 2014, the CMS reported.
Medicare beneficiaries in Alabama were more likely to get a prescription for an opioid than in any other state in 2019, based on newly released data.

That year, opioids represented 6.48% of all drug claims for part D enrollees in the state, just ahead of Utah at 6.41%. Idaho, at 6.07%, was the only other state with an opioid prescribing rate over 6%, while Oklahoma came in at an even 6.0%, according to the latest update of the Centers for Medicare & Medicaid Services’ dataset.
The lowest rate in 2019 belonged to New York, where 2.51% of drug claims, including original prescriptions and refills, involved an opioid. Rhode Island was next at 2.87%, followed by New Jersey (3.23%), Massachusetts (3.26%), and North Dakota (3.39%),
Altogether, Medicare part D processed 1.5 billion drug claims in 2019, of which 66.1 million, or 4.41%, involved opioids. Both of the opioid numbers were down from 2018, when opioids represented 4.68% (70.2 million) of the 1.5 billion total claims, and from 2014, when opioids were involved in 5.73% (81,026,831) of the 1.41 billion drug claims, the CMS data show. That works out to 5.77% fewer opioids in 2019, compared with 2014, despite the increase in total volume.
from 2014 to 2019, with Hawaii showing the smallest decline as it slipped 0.41 percentage points from 3.9% to 3.49%, according to the CMS.
In 2019, part D beneficiaries in Vermont were the most likely to receive a long-acting opioid, which accounted for 20.14% of all opioid prescriptions in the state, while Kentucky had the lowest share of prescriptions written for long-acting forms at 6.41%. The national average was 11.02%, dropping from 11.79% in 2018 and 12.75% in 2014, the CMS reported.
Medicare beneficiaries in Alabama were more likely to get a prescription for an opioid than in any other state in 2019, based on newly released data.

That year, opioids represented 6.48% of all drug claims for part D enrollees in the state, just ahead of Utah at 6.41%. Idaho, at 6.07%, was the only other state with an opioid prescribing rate over 6%, while Oklahoma came in at an even 6.0%, according to the latest update of the Centers for Medicare & Medicaid Services’ dataset.
The lowest rate in 2019 belonged to New York, where 2.51% of drug claims, including original prescriptions and refills, involved an opioid. Rhode Island was next at 2.87%, followed by New Jersey (3.23%), Massachusetts (3.26%), and North Dakota (3.39%),
Altogether, Medicare part D processed 1.5 billion drug claims in 2019, of which 66.1 million, or 4.41%, involved opioids. Both of the opioid numbers were down from 2018, when opioids represented 4.68% (70.2 million) of the 1.5 billion total claims, and from 2014, when opioids were involved in 5.73% (81,026,831) of the 1.41 billion drug claims, the CMS data show. That works out to 5.77% fewer opioids in 2019, compared with 2014, despite the increase in total volume.
from 2014 to 2019, with Hawaii showing the smallest decline as it slipped 0.41 percentage points from 3.9% to 3.49%, according to the CMS.
In 2019, part D beneficiaries in Vermont were the most likely to receive a long-acting opioid, which accounted for 20.14% of all opioid prescriptions in the state, while Kentucky had the lowest share of prescriptions written for long-acting forms at 6.41%. The national average was 11.02%, dropping from 11.79% in 2018 and 12.75% in 2014, the CMS reported.